The Diversity Distribution Pattern of Ruderal Community under the Rapid Urbanization in Hangzhou, East China

Abstract
:1. Introduction
2. Methods
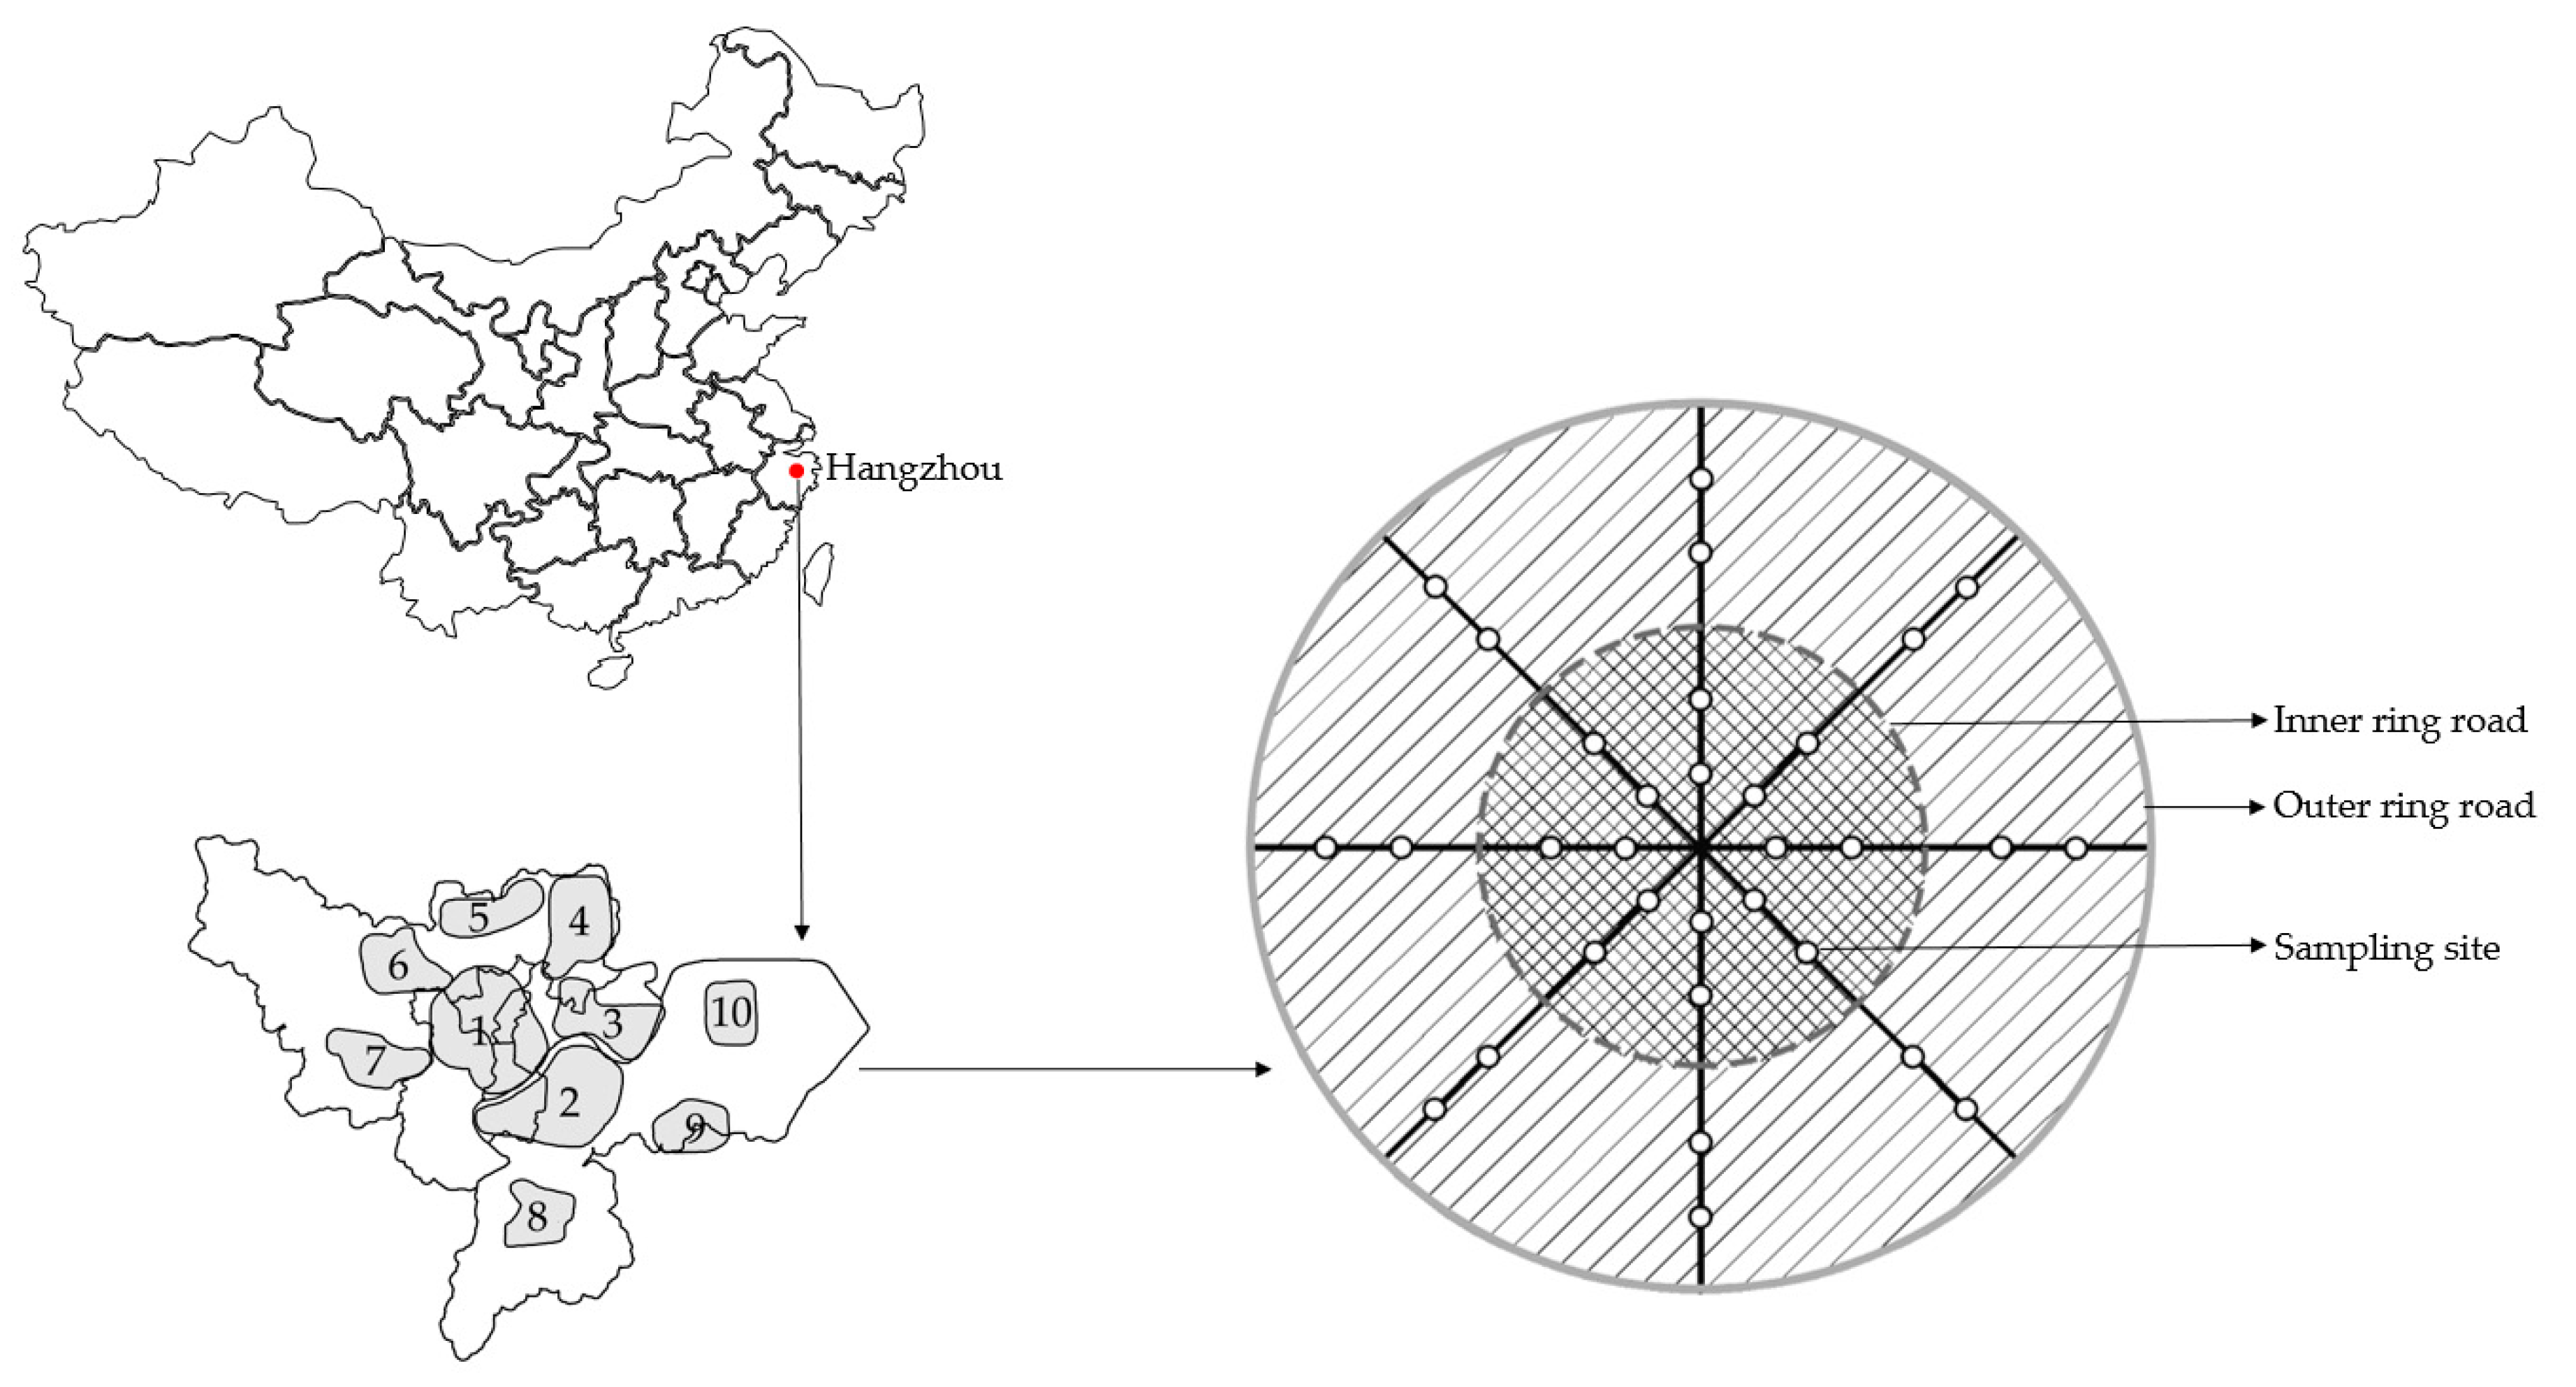
2.1. Study Area
2.2. Sampling Methods
2.3. Data Processing and Analysis
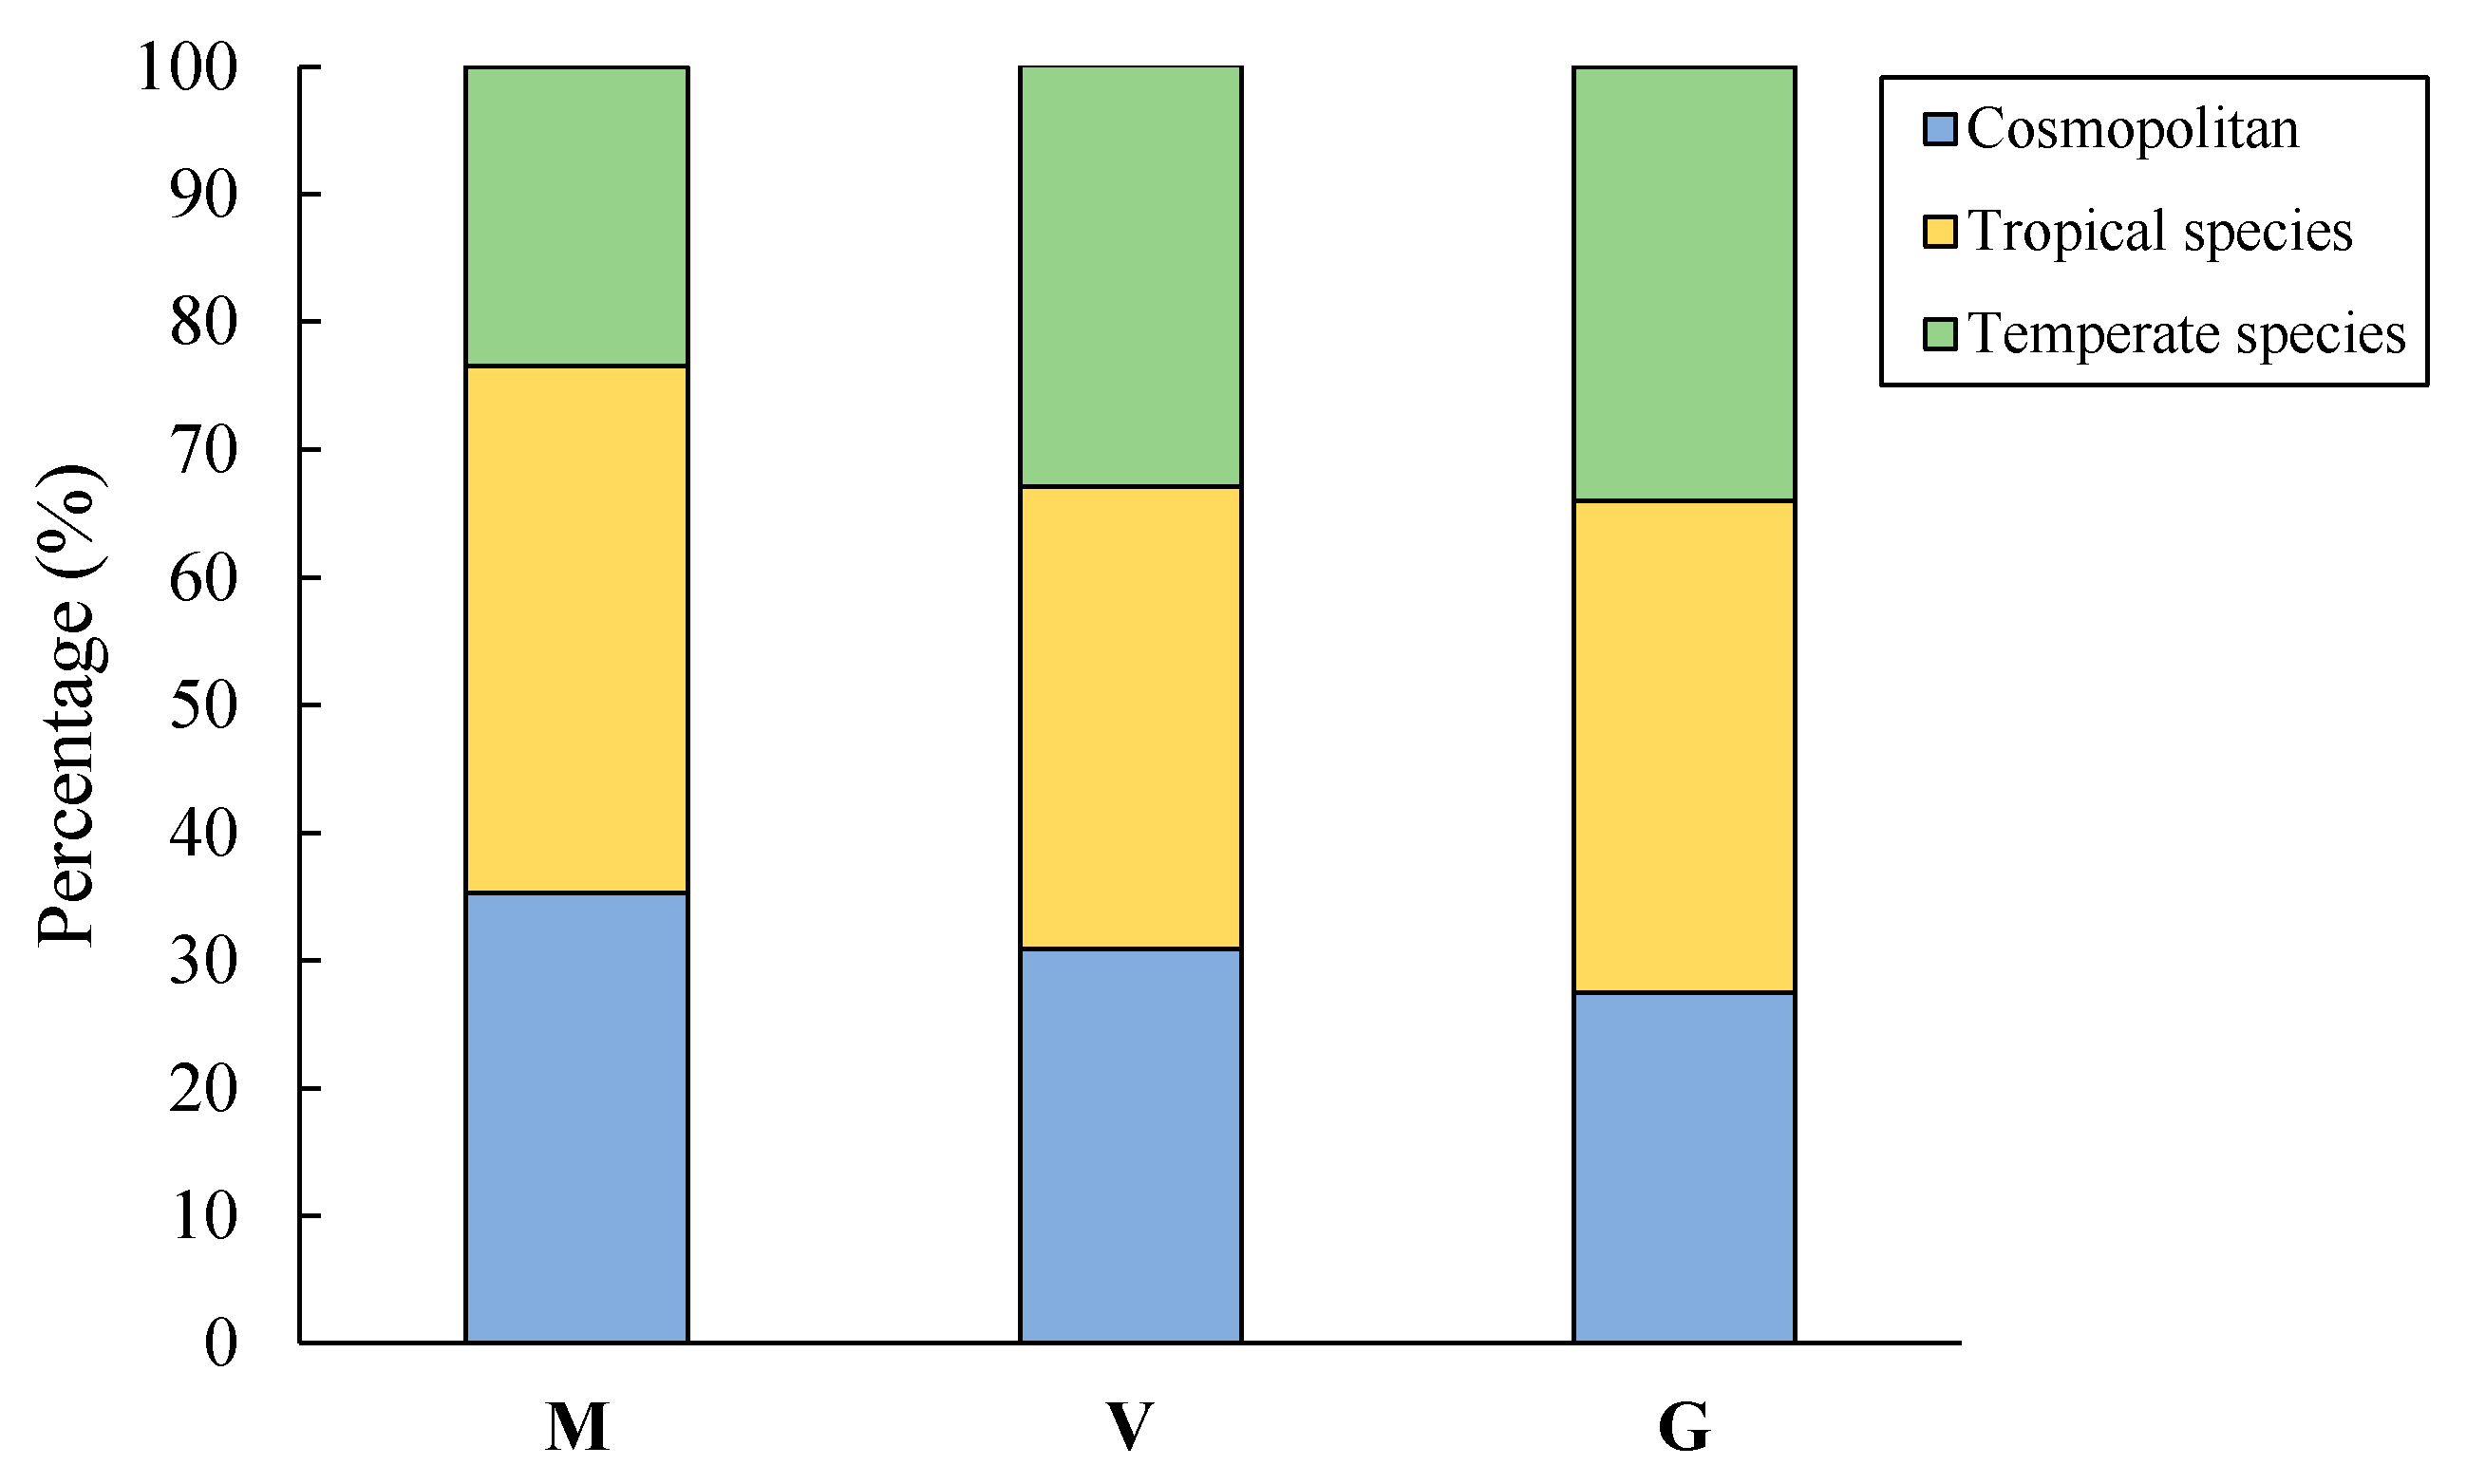
2.3.1. Species’ Origin
2.3.2. Areal Type
2.3.3. Life Form and Growth
2.3.4. Community Characteristics
2.3.5. Species Diversity
2.4. Analysis of the Impact of Urbanization
3. Results
3.1. Change in Land Use/Cover from 2000 to 2010
3.2. Ruderal Species Diversity Characteristics
3.2.1. Ruderal Species Composition
3.2.2. Areal Type of Families and Genera of Ruderals
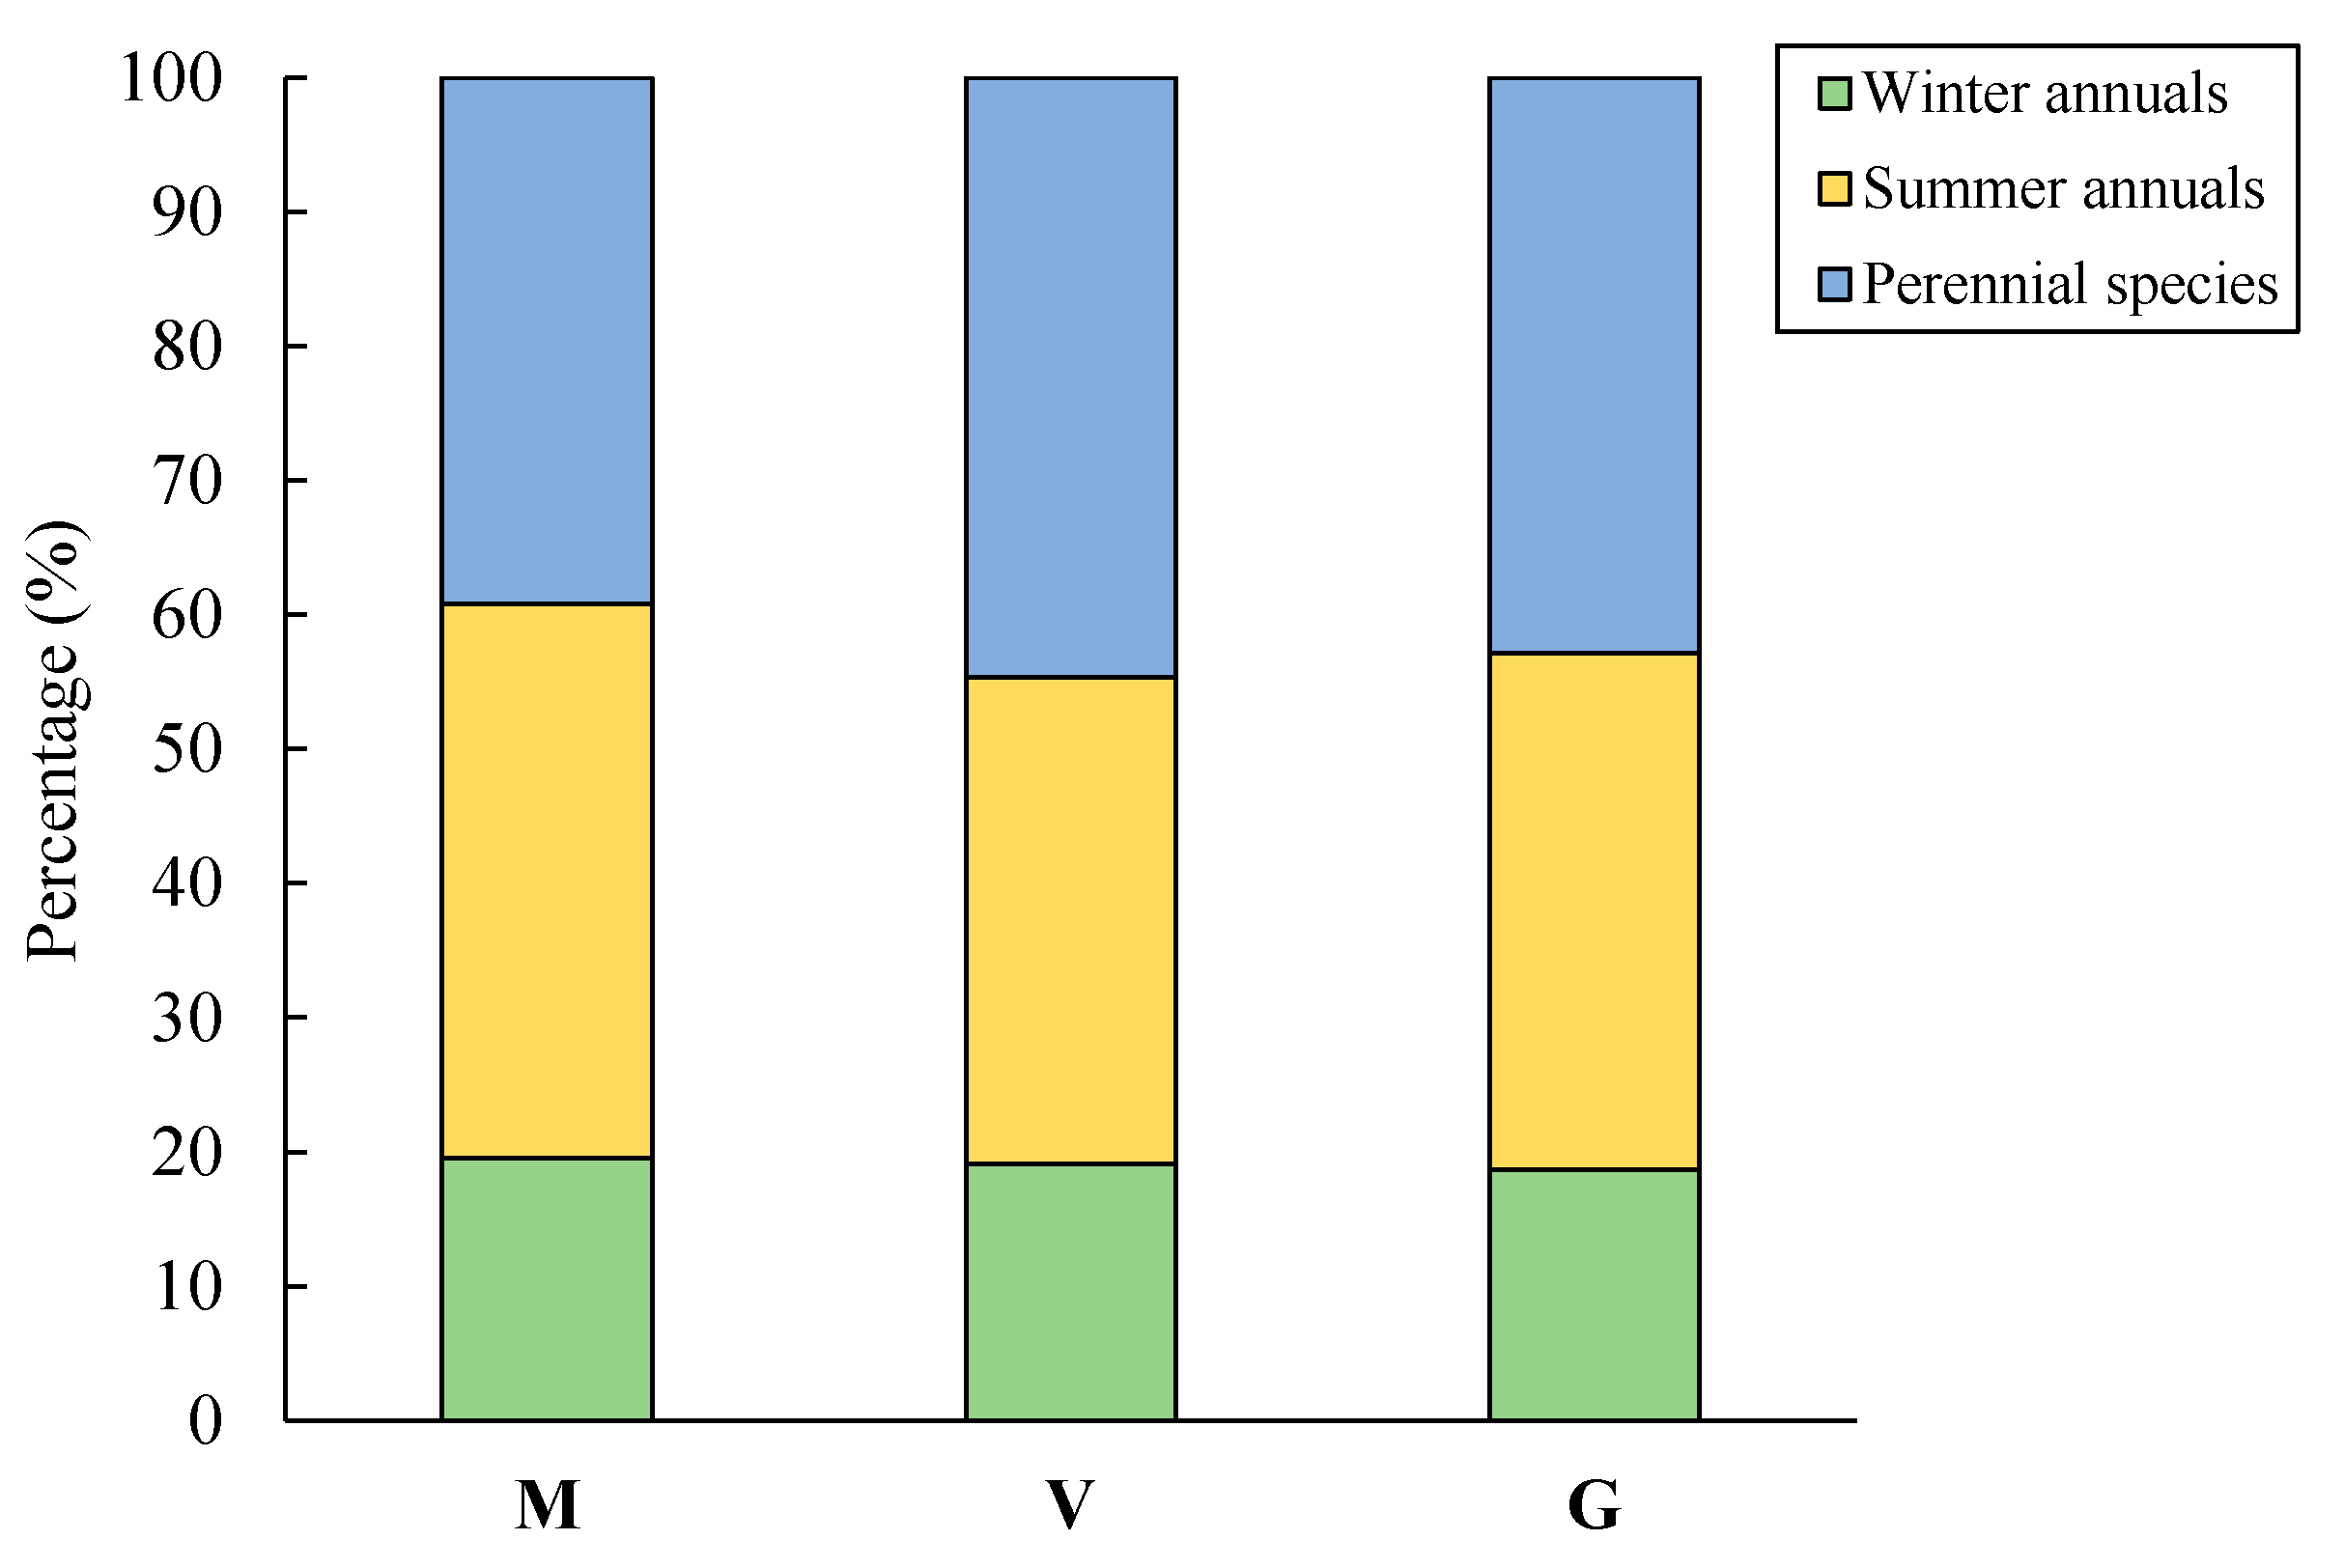
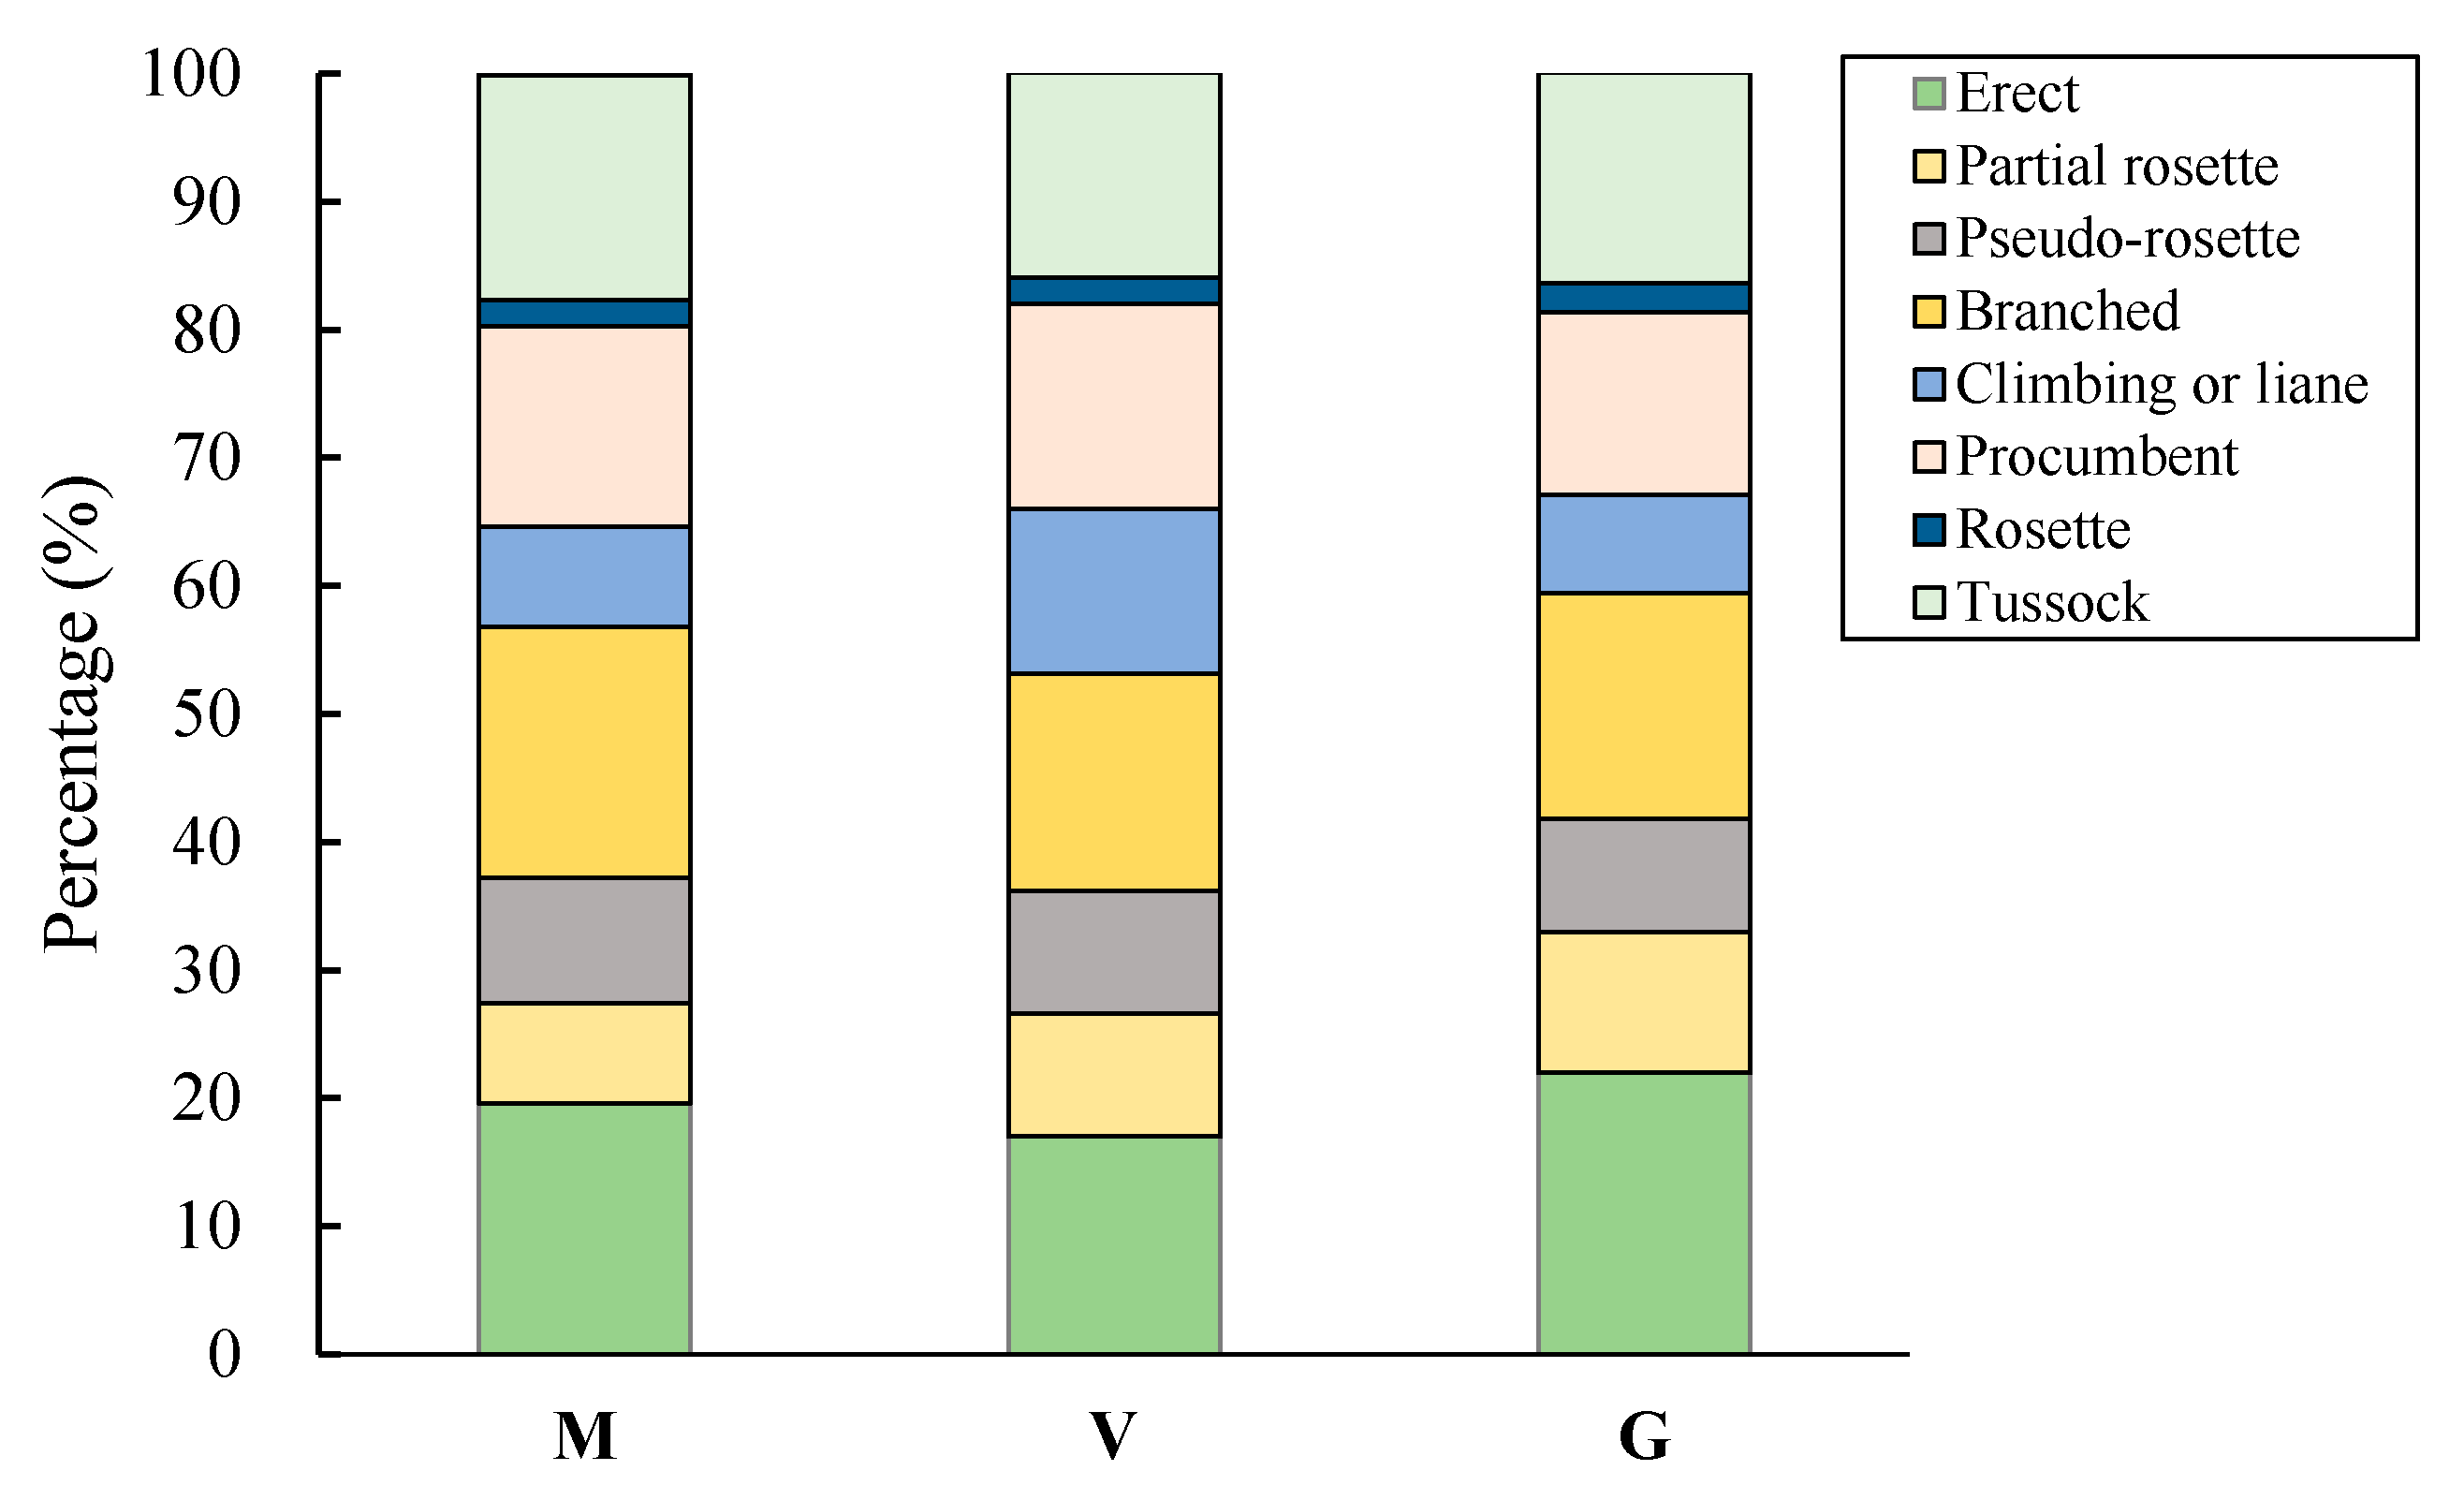
3.2.3. Life Form and Growth Form
3.3. Distribution Pattern of Ruderal Community on Urbanization Gradient
3.3.1. Ruderal Community Type
3.3.2. Dominant Species Characteristics
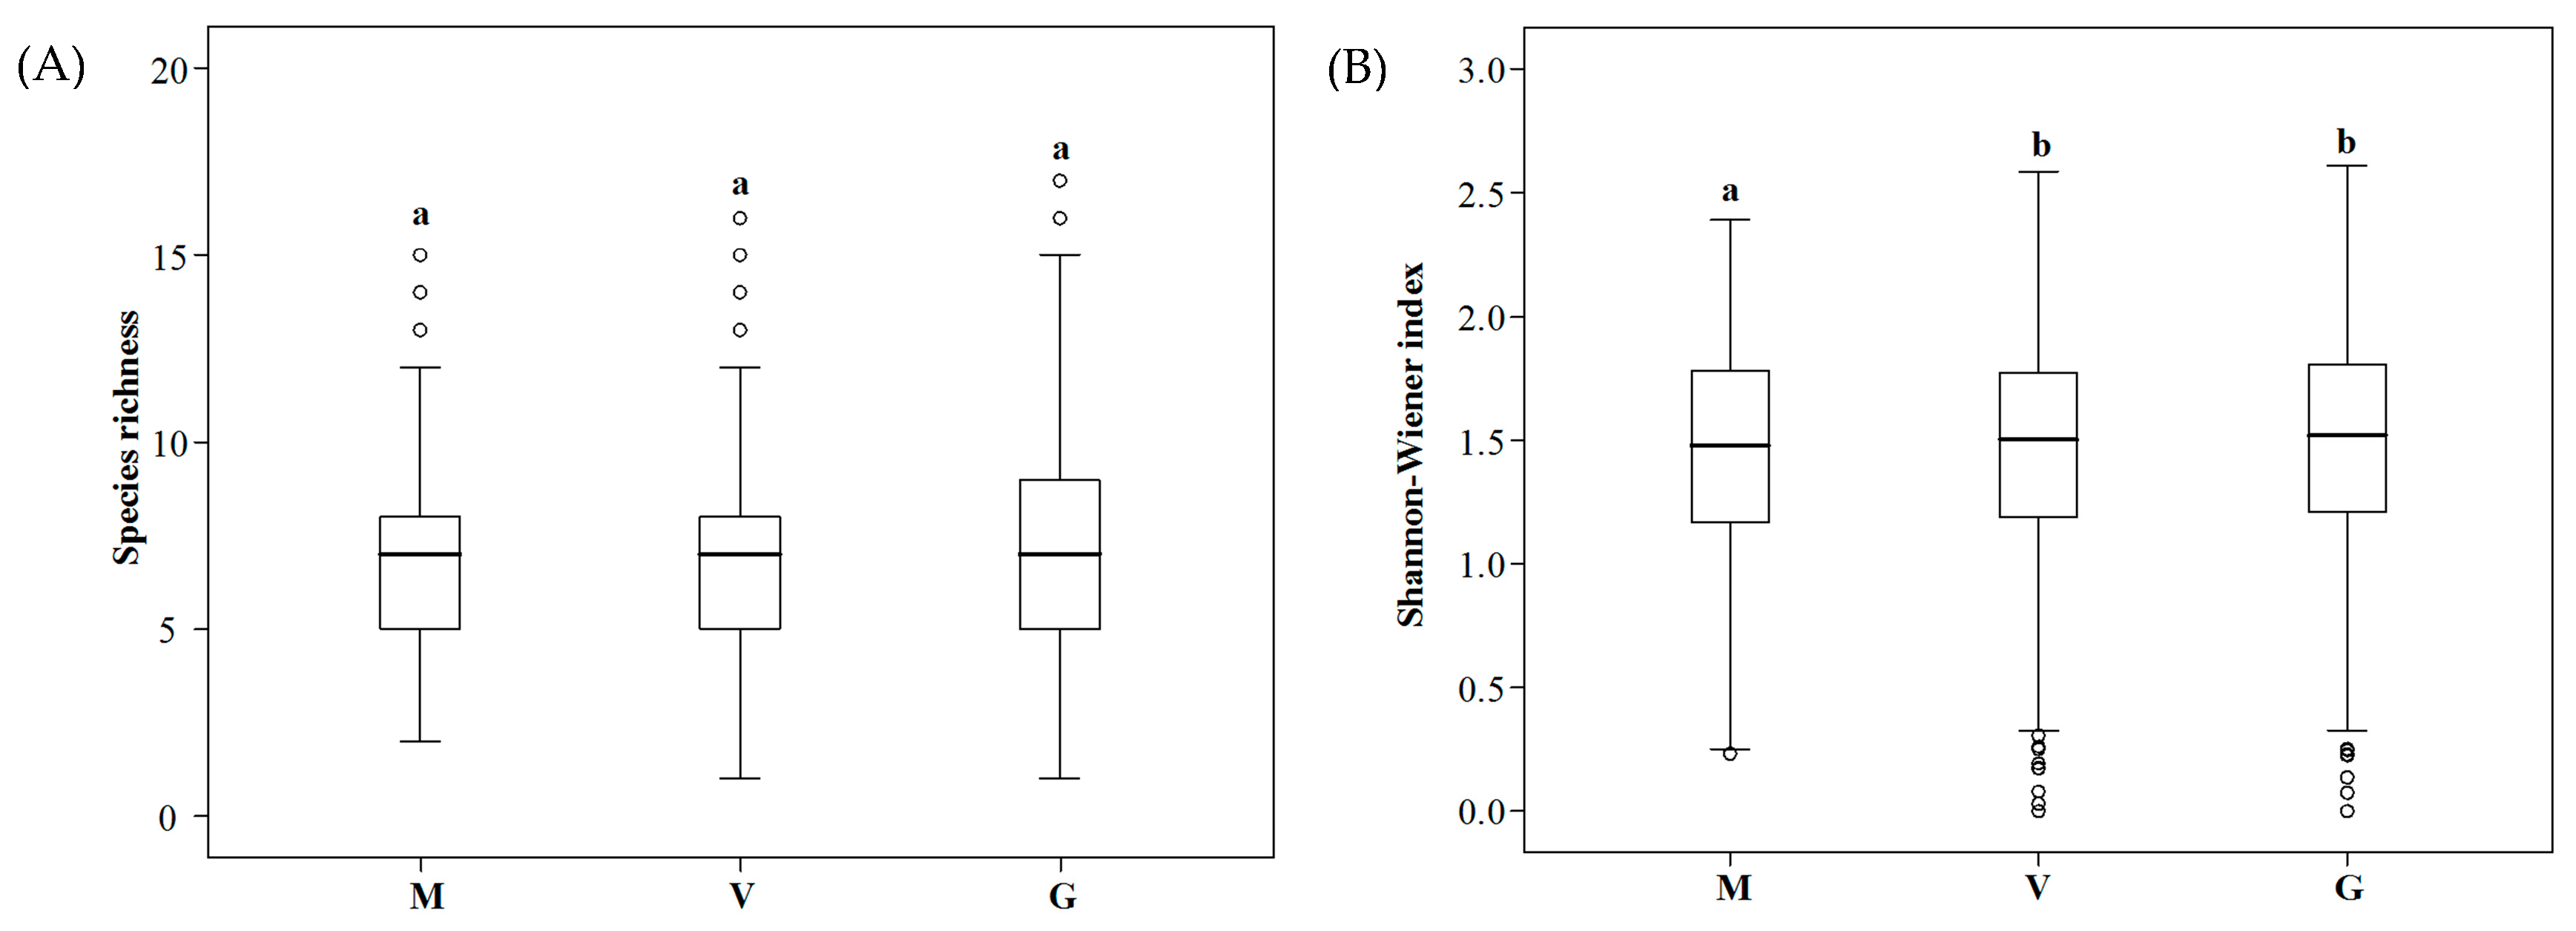
3.3.3. Ruderal Community Diversity
4. Discussion
4.1. Impact of Urbanization Process on Ruderal Species Diversity
4.2. Causes of Ruderal Community Diversity
5. Conclusions
Author Contributions
Funding
Acknowledgments
Conflicts of Interest
Appendix A
Appendix A.1

Appendix A.2

| Number | Community Name | Number | Community Name |
|---|---|---|---|
| 1 | Acalypha australis comm. | 64 | Lithospermum zollingeri comm. |
| 2 | Achyranthes bidentate comm. | 65 | Lolium perenne comm. |
| 3 | Alopecurus aequalis comm. | 66 | Lygodium japonicum comm. |
| 4 | Alternanthera philoxeroides comm. | 67 | Lysimachia candida comm. |
| 5 | Amaranthus retroflexus comm. | 68 | Lysimachia fortune comm. |
| 6 | Amaranthus tricolor comm. | 69 | Lysimachia pentapetala comm. |
| 7 | Ammannia baccifera comm. | 70 | Mazus japonicus comm. |
| 8 | Artemisia argyi comm. | 71 | Mentha haplocalyx comm. |
| 9 | Arthraxon hispidus comm. | 72 | Mosla scabra comm. |
| 10 | Aster subulatus comm. | 73 | Myosoton aquaticum comm. |
| 11 | Bidens frondosa comm. | 74 | Oenanthe javanica comm. |
| 12 | Callitriche stagnalis comm. | 75 | Omphalotrigonotis cupulifera comm. |
| 13 | Calystegia hederacea comm. | 76 | Ophioglossum vulgatum comm. |
| 14 | Capsella bursa-pastoris comm. | 77 | Ophiopogon japonicas comm. |
| 15 | Cardamine hirsuia comm. | 78 | Oplismenus undulatifolius comm. |
| 16 | Carpesium abrotanoides comm. | 79 | Oxalis corniculata comm. |
| 17 | Cayratia japonica comm. | 80 | Paederia scandens comm. |
| 18 | Centipeda minima comm. | 81 | Pennisetum alopecuroides comm. |
| 18 | Cerastium arvense comm. | 82 | Phytolacca acinosa comm. |
| 20 | Cerastium glomeratum comm. | 83 | Pinellia ternate comm. |
| 21 | Chenopodium glaucum comm. | 84 | Plantago asiatica comm. |
| 22 | Commelina communis comm. | 85 | Poa annua comm. |
| 23 | Conyza Canadensis comm. | 86 | Polygonum aviculare comm. |
| 24 | Coreopsis drummondii comm. | 87 | Polygonum hydropiper comm. |
| 25 | Cynodon dactylon comm. | 88 | Polygonum lapathifolium comm. |
| 26 | Cyperus brevifolia comm. | 89 | Polygonum perfoliatum comm. |
| 27 | Cyperus compressus comm. | 90 | Polygonum persicaria comm. |
| 28 | Daucus carota comm. | 91 | Polypogon fugax comm. |
| 29 | Dichondra repens comm. | 92 | Porana racemose comm. |
| 30 | Digitaria sanguinalis comm. | 93 | Portulaca oleracea comm. |
| 31 | Dryopteris chinensis comm. | 94 | Pouzolzia zeylanica comm. |
| 32 | Duchesnea indica comm. | 95 | Pterocypsela indica comm. |
| 33 | Echinochloa crusgalli comm. | 96 | Ranunculus sceleratus comm. |
| 34 | Eclipta prostrata comm. | 97 | Reineckia carnea comm. |
| 35 | Eleusine indica comm. | 98 | Roegneria kamoji comm. |
| 36 | Equisetum hyemale comm. | 99 | Rorippa indica comm. |
| 37 | Eragrostis ferruginea comm. | 100 | Rostellularia procumbens comm. |
| 38 | Erigeron annuus comm. | 101 | Rumex dentatus comm. |
| 39 | Erigeron philadelphicus comm. | 102 | Rumex japonicas comm. |
| 40 | Eriochloa villosa comm. | 103 | Sagina japonica comm. |
| 41 | Eryngium foetidum comm. | 104 | Sambucus chinensis comm. |
| 42 | Euphorbia hirta comm. | 105 | Saxifraga stolonifera comm. |
| 43 | Calystegia hederacea comm. | 106 | Sedum emarginatum comm. |
| 44 | Euphorbia maculate comm. | 107 | Sedum quaternatum comm. |
| 45 | Festuca elata comm. | 108 | Setaria viridis comm. |
| 46 | Foeniculum vulgare comm. | 109 | Siegesbeckia glabrescens comm. |
| 47 | Fragaria vesca comm. | 110 | Solanum nigrum comm. |
| 48 | Galium aparine comm. | 111 | Solidago canadensis comm. |
| 49 | Galium bungei comm. | 112 | Sonchus oleraceus comm. |
| 50 | Geranium carolinianum comm. | 113 | Stellaria media comm. |
| 51 | Glechoma longituba comm. | 114 | Talinum paniculatum comm. |
| 52 | Glycine soja comm. | 115 | Taraxacum mongolicum comm. |
| 53 | Gnaphalium affine comm. | 116 | Trachelospermum jasminoides comm. |
| 54 | Hedera nepalensis var. Sinensis comm. | 117 | Trifolium repens comm. |
| 55 | Hemistepta lyrata comm. | 118 | Trigonotis peduncularis comm. |
| 56 | Humulus scandens comm. | 119 | Veronica didyma comm. |
| 57 | Hydrocotyle sibthorpioides comm. | 120 | Vicia sepium comm. |
| 58 | Hydrocotyle sibthorpioides var. batrachium comm. | 121 | Vinca major comm. |
| 59 | Ixeris sonchifolia comm. | 122 | Viola betonicifolia comm. |
| 60 | Kalimeris indica comm. | 123 | Viola diffusa comm. |
| 61 | Leptochloa chinensis comm. | 124 | Youngia japonica comm. |
| 62 | Lindernia nummularifolia comm. | 125 | Zephyranthes candida comm. |
| 63 | Liriope platyphylla comm. |
References
- Burghardt, W. Soil sealing and soil properties related to sealing. Geol. Soc. Lond. Spec. Publ. 2006, 266, 117–124. [Google Scholar] [CrossRef]
- Zhao, H.X.; Jiang, Y.; Liu, Q.R. Study of impact of urban land use on feature of urban vegetation in Beijing area. Adv. Earth Sci. 2002, 17, 247–253. (In Chinese) [Google Scholar]
- Huang, L.Y.; Liu, S.H.; Li, J. Spatial and temporal dynamics of urban ecological land use and its related driving forces: A case study of Wuhan city. Resour. Environ. Yangtze Basin 2019, 28, 1059–1069. (In Chinese) [Google Scholar]
- Sukopp, H. Human-caused impact on preserved vegetation. Landsc. Urban Plan. 2004, 68, 347–355. [Google Scholar] [CrossRef]
- Zhao, S.Q.; Da, L.J.; Tang, Z.Y.; Fang, H.J.; Song, K.; Fang, J.Y. Ecological consequences of rapid urban expansion: Shanghai, China. Front. Ecol. Environ. 2006, 4, 341–346. [Google Scholar] [CrossRef]
- Li, Y.Y. Study on Ruderal Community Diversity and Distribution under Different Land Use Type in Suburban of Shanghai. Master’s Thesis, East China Normal University, Shanghai, China, 2009. (In Chinese). [Google Scholar]
- Kowarik, I. The role of alien species in urban flora and vegetation. In Plant Invasions General Aspects and Special Problems; Pyšek, P., Ed.; SPB Academic: Amsterdam, The Netherlands, 1995; pp. 321–338. [Google Scholar]
- Lu, Y.C. Theory and Practice of Close-to-Nature Forest Management; Science Press: Beijing, China, 2006. (In Chinese) [Google Scholar]
- Wu, Y.X.; Zhu, X.; Liu, X.G.; Li, M.M.; Lu, M. Urban ecological network restoration based on landscape pattern analysis. Shanghai Urban Plan. Rev. 2019, 11, 40–44. (In Chinese) [Google Scholar]
- Wang, B.S. Phytocoenostics; Higher Education Press: Beijing, China, 1987. (In Chinese) [Google Scholar]
- Burton, M.L.; Samuelson, L.J.; Mackenzie, M.D. Riparian woody plant traits across an urban-rural land use gradient and implications for watershed function with urbanization. Landsc. Urban Plan. 2009, 90, 42–55. [Google Scholar] [CrossRef]
- Zhang, L.J.; Cai, H.; Wang, X.W.; Guan, L.J.; Chen, G. Analysis the change of urban ecological environment in huaxi district of Guiyang. Geomat. Spat. Inf. Technol. 2019, 42, 50–57. (In Chinese) [Google Scholar]
- Panitsa, M.; Iliadou, E.; Kokkoris, I.; Kallimanis, A.; Patelodimou1, C.; Strid, A.; Raus, T.; Bergmeier, E.; Dimopoulos, P. Distribution patterns of ruderal plant diversity in Greece. Biodivers. Conserv. 2019, 29, 869–891. [Google Scholar] [CrossRef]
- Franceschi, E.A. The ruderal vegetation of Rosario City, Argentina. Landsc. Urban Plan. 1996, 34, 11–18. [Google Scholar] [CrossRef]
- Anning, A.K.; Yeboah-Gyan, K. Diversity and distribution of invasive weeds in Ashanti Region, Ghana. Afr. J. Ecol. 2007, 45, 355–360. [Google Scholar] [CrossRef]
- Rendeková, A.; Mičieta, K.; Hrabovský, M.; Eliašová, M.; Miškovic, J. Effects of invasive plant species on species diversity: Implications on ruderal vegetation in Bratislava City, Slovakia, Central Europe. History 2019, 88, 3621. [Google Scholar] [CrossRef] [Green Version]
- Hitchmough, J.; Woudstra, J. The ecology of exotic herbaceous perennials grown in managed, native grassy vegetation in urban landscapes. Landsc. Urban Plan. 1999, 45, 107–121. [Google Scholar] [CrossRef]
- Benvenuti, S. Weed dynamics in the Mediterranean urban ecosystem: Ecology, biodiversity and management. Weed Res. 2004, 44, 341–354. [Google Scholar] [CrossRef]
- Rendeková, A.; Mičieta, K. Changes in the representation of alien taxa in ruderal vegetation of an urban ecosystem over 50 years. A case study from Malacky city, Slovakia, Central Europe. Urban Ecosyst. 2017, 20, 867–875. [Google Scholar] [CrossRef]
- Whitney, G.G. A quantitative analysis of the flora and plant communities of a representative Midwestern UStown. Urban Ecol. 1985, 9, 143–160. [Google Scholar] [CrossRef]
- Guo, P.P.; Yu, F.; Ren, Y.; Liu, D.; Li, J.; Ouyang, Z.Y.; Wang, X.K. Response of ruderal species diversity to an urban environment: Implications for conservation and management. Int. J. Environ. Res. Public Health 2018, 15, 2832. [Google Scholar] [CrossRef] [Green Version]
- Sharpe, D.M.; Stearns, F.; Leitner, L.A.; Dorney, J.R. Fate of natural vegetation during urban development of rural landscapesin southeastern Wisconsin. Urban Ecol. 1986, 9, 267–287. [Google Scholar] [CrossRef]
- Cilliers, S.S.; Bredenkamp, G. Vegetation of roadside verges on an urbanization gradient in Potchefstroom, South Africa. Landsc. Urban Plan. 2000, 46, 217–239. [Google Scholar] [CrossRef]
- Cao, Y.; Natuhara, Y. Effect of urbanization on vegetation in riparian area: Plant communities in artificial and semi-natural habitats. Sustainability 2020, 12, 204. [Google Scholar] [CrossRef] [Green Version]
- Ou, X.K.; Yu, M. Urban vegetation and urban flora of Kunming China. Yunnan Univ. (Nat. Sci.) 1994, 16, 266–270. (In Chinese) [Google Scholar]
- Yong, S.P.; Liu, S.R.; Na, R.S.; Ou, X.K. A Preliminary analysis and study on the urban flora and urban vegetation in Hohhot the city located in the grassland area of North China. Acta Sci. Nat. Univ. Neimongol 1999, 30, 206–213. (In Chinese) [Google Scholar]
- Luo, W.; He, P.R.; Zhou, P.; Zhao, P.; Chen, J.W. Species composition and origin range of farmland weeds frequently observed in Kunming, Yunnan. Weed Sci. 2016, 34, 36–42. (In Chinese) [Google Scholar]
- Wang, Z.R.; Duan, H.F.; Yang, J.D.; Guo, J.; Wang, S.H.; Li, J.; Gao, J.Y. Composition of weeds and its control measures in lemon orchard of hot and humid area in Yunnan. South China Agric. 2018, 12, 4–7. (In Chinese) [Google Scholar]
- Zhang, B.; Chen, G.Q.; Yu, J.Y. Diversity of weeds in kiwifruit orchards in Guizhou. Southwest China J. Agric. Sci. 2019, 32, 360. (In Chinese) [Google Scholar]
- Chen, X.S.; Wang, W.B.; Liang, H.; Liu, X.L.; Da, L. Dynamics of ruderal species diversity under the rapid urbanization over the past half century in Harbin, Northeast China. Urban Ecosyst. 2014, 17, 455–472. [Google Scholar] [CrossRef]
- Ye, Y.D.; Liu, F.D.; Hu, G. Spatial pattern of forest vegetation in West Lake Scenic Area, Hangzhou. J. Zhejiang Sci.-Tech. Univ. 2019, 41, 407–412. (In Chinese) [Google Scholar]
- Editorial Committee of Flora Repubicae Popularis Siniae in China Academy of Science. Flora of China; Science Press: Beijing, China, 2004; Volume 1. (In Chinese) [Google Scholar]
- Editorial Committee of Flora of Zhejiang. Flora of Zhejiang, 1992–1993 ed.; Zhejiang Science and Teconology Publishing: Zhejiang, China, 1993; Volumes 1–7. (In Chinese) [Google Scholar]
- Wang, L.; Liao, W.; Chen, C.; Fan, Q. The seed plant flora of the mount Jinggangshan Region, Southeastern China. PLoS ONE 2013, 88, e75834. [Google Scholar] [CrossRef] [Green Version]
- Wu, Z.Y.; Zhou, Z.K.; Sun, H.; Li, D.Z.; Peng, H. The Areal-Types of Seed Plants and Their Origin and Differentiation; Yunnan Science and Technology Press: Kunming, China, 2006. (In Chinese) [Google Scholar]
- Wu, Z.Y. China Vegetation; Science Press: Beijing, China, 1980. (In Chinese) [Google Scholar]
- Zhang, Z.P.; Hirota, S. Chinese Colored Weed Illustrated Book; National Rural Education Association: Tokyo, Japan, 2000. [Google Scholar]
- Song, Y.C. Vegetation Ecology; East China Normal University Press: Shanghai, China, 2001. (In Chinese) [Google Scholar]
- Numata, M.; Yoshizawa, N. Weed Flora of Japan Illustrated by Color; Zenkoku Noson Kyoiku Kyokai: Tokyo, Japan, 1988. [Google Scholar]
- Tetsuya, K.; Ohsawa, M. Patterns of species diversity in rural herbaceous communities under different management regimes, Chiba, central Japan. Biol. Conserv. 2002, 104, 239–249. [Google Scholar]
- Tian, Z.H.; Song, K.; Da, L. Distribution patterns and traits of weed communities along an urban-rural gradient under rapid urbanization in Shanghai, China. Weed Biol. Manag. 2015, 15, 27–41. [Google Scholar] [CrossRef]
- Ohtsuka, T. Early stages of secondary succession on abandoned cropland in north-east Borneo Island. Ecol. Res. 1999, 14, 281–290. [Google Scholar] [CrossRef]
- Zhang, J.T. Quantitative Ecology; Science Press: Beijing, China, 2004. (In Chinese) [Google Scholar]
- Chen, X.S. Distribution Pattern of Ruderal Community and Its Responses to Habitat Heterogeneity in Urban Area of Harbin. Ph.D. Thesis, East China Normal University, Shanghai, China, 2014. (In Chinese). [Google Scholar]
- Magurran, A.E. Ecological Diversity and Its Measurement; Princeton University Press: Princeton, NJ, USA, 1988. [Google Scholar]
- Wang, X.P.; Fang, J.Y.; Zhu, B. Forest biomass and root-shoot allocation in northeast China. For. Ecol. Manag. 2008, 255, 4007–4020. [Google Scholar] [CrossRef]
- Zhang, K.X.; Wang, R.; Shen, C.C.; Da, L. Temporal and spatial characteristics of the urban heat island during rapid urbanization in Shanghai, China. Environ. Monit. Assess. 2010, 169, 101–112. [Google Scholar] [CrossRef] [PubMed]
- McKinney, M.L. Urbanization as a major cause of biotic homogenization. Biol. Conserv. 2006, 127, 247–260. [Google Scholar] [CrossRef]
- He, R.X.; Yang, F.; Yan, P.B.; Wei, J.Y. Comparison in plant diversity in Haikou, Sanya and Wenchang cities of Hainan Province, southern China. J. Beijing For. Univ. 2019, 41, 107–115. (In Chinese) [Google Scholar]
- Kang, M.Y. Urban Ecology and Urban Environment; China Metrology Publishing House: Beijing, China, 1997. (In Chinese) [Google Scholar]
- Yang, S.H. Urban Ecology and Environment; Science Press: Beijing, China, 2003. (In Chinese) [Google Scholar]
- Qiu, G.Y.; Zhang, X.N. China’s urbanization and its ecological environment challenges in the 21st century. Adv. Earth Sci. 2019, 34, 640–649. (In Chinese) [Google Scholar]
- Da, L.J.; Ohsawa, M. Abandoned pine-plantation succession and the influence of pine mass-dieback in the urban landscape of Chiba, central Japan. Jpn. J. Ecol. 1992, 42, 81–93. [Google Scholar]
- Zdeňka, L.; Ingolfkýü, M.C. Patterns of plant traits in annual vegetation of man-made habitats in central Europe. Perspect. Plant Ecol. Evol. Syst. 2006, 8, 69–81. [Google Scholar]
- Peng, Y.; Liu, X.H. Research progress in effects of urbanization on plant biodiversity. Biodivers. Sci. 2007, 15, 558–562. (In Chinese) [Google Scholar]
- Zhang, N.; Dong, L.; Wang, D.; Wang, K. Survey and analysis of the composition and distribution pattern of herbaceous plants in Beijing urban ecological corridors. Chin. Landsc. Archit. 2018, 34, 94–99. (In Chinese) [Google Scholar]
- Jiang, Y.; Liu, S. Flora features under urban land use. J. Nat. Resour. 1999, 14, 359–362. (In Chinese) [Google Scholar]
- Prach, K. Spontaneous succession in Central-European man-made habitats: What information can be used in restoration practice? Appl. Veg. Sci. 2003, 6, 125–129. [Google Scholar] [CrossRef]
- Meng, X.S.; Ouyang, Z.Y.; Cui, G.F.; Li, W.F.; Zheng, H. Composition of plant species and their distribution patterns in Beijing urban ecosystem. Acta Ecol. Sin. 2004, 24, 2200–2206. (In Chinese) [Google Scholar]
- Li, J.Y.; Wang, H.Y.; Chen, H.X. On species composition and distribution of wild herbs in central districts of Chongqing. J. Southwest China Norm. Univ. (Nat. Sci. Ed.) 2018, 43, 103–109. (In Chinese) [Google Scholar]
- Wang, X.Y. The Study on Plant Diversity and Distribution Pattern in Sheshan District. Master’s Thesis, East China Normal University, Shanghai, China, 2006. (In Chinese). [Google Scholar]
- Song, Y.C.; You, W.H.; Wang, X.R. Urban Ecology; East China Normal University Press: Shanghai, China, 2000. (In Chinese) [Google Scholar]
- Li, J.S.; Gao, J.X.; Zhang, X.L.; Zheng, X.M. Effects of urbanization on biodiversity. Chin. Ecol. 2005, 24, 953–957. (In Chinese) [Google Scholar]
- Wu, C.P.; Vellend, M.; Yuan, W.G.; Jiang, B.; Yu, M. Patterns and determinants of plant biodiversity in non-commercial forests of eastern china. PLoS ONE. 2017, 12, e0188409. [Google Scholar] [CrossRef] [Green Version]
- Kowarik, I. Kritische Anmerkungen zum theoretischen Konzept der potentiellen natürlichen vegetation mit anregungen zu einer zeitgemäßen modifikation. Tuexenia 1987, 7, 53–67. [Google Scholar]
- Mckinney, M.L. Urbanization, biodiversity, and conservation. Bioscience 2002, 52, 883–890. [Google Scholar] [CrossRef]
- Grimm, N.B.; Pickett, S.T.A.; Hale, R.L.; Cadenasso, M.L. Does the ecological concept of disturbance have utility in urban Social—Ecological—Technological systems? Ecosyst. Health Sustain. 2017, 3, e01255. [Google Scholar] [CrossRef]
- Liu, Z.M.; Zhao, X.Y.; Liu, X.M. Relationship between disturbance and vegetation. Acta Prataculturae Sin. 2002, 11, 1–9. (In Chinese) [Google Scholar]
- Štefanić, E.; Kovačević, V.; Antunović, S.; Japundžić-Palenkić, B.; Zima, D.; Turalija, A.; Nestorović, N. Floristic biodiversity of weed communities in arable lands of Istria Peninsula (From 2005 to 2017). Ekológia (Bratislava) 2019, 38, 166–177. [Google Scholar] [CrossRef] [Green Version]
- Da, L.J.; Tian, Z.H.; Wang, C.X.; Wang, J. Biological invasion from the perspective of ecology. Chin. J. Nat. 2007, 29, 152–158. (In Chinese) [Google Scholar]


| Land Use Form | Area (km2)/Proportion (%) | Conversion Rate (%) |
|---|---|---|
| Urban land | 2418.5/14.6 | 94.6 |
| Arable land | 2357.4/14.2 | 37.8 |
| Forestry land | 366.0/2.2 | 7.4 |
| Water body | 40.0/0.2 | 1.7 |
| Grassland | 387.2/2.3 | 70.1 |
| Total | 5569.1/33.6 | 211.6 |
| Region | Area (km2)/Proportion (%) | ||||
|---|---|---|---|---|---|
| Urban Land | Arable Land | Forest Land | Water Body | Grassland | |
| M | 151.4/21.5 | 113.2/67.1 | 2.4/4.9 | 3.8/7.7 | 20.0/91.5 |
| V | 419.8/55.9 | 378.6/52.7 | 1.0/1.4 | 12.3/15.9 | 51.8/86.8 |
| G | 274.5/110.7 | 333.0/42.5 | 9.4/5.7 | 33.8/26.2 | 62.3/76.2 |
| Total | 845.7/49.7 | 824.8/49.4 | 8.0/2.8 | 49.9/19.5 | 134.1/82.1 |
| Category | Number | Family | Number/Proportion (%) | |
|---|---|---|---|---|
| Genera | Species | |||
| Plurimotypic | 1 | Gramineae | 23/14.6 | 28/13.1 |
| 2 | Compositae | 23/14.6 | 28/13.1 | |
| Mesotypic | 3 | Scrophulariaceae | 3/1.9 | 10/4.7 |
| 4 | Labiatae | 7/4.5 | 8/3.8 | |
| 5 | Umbelliferae | 6/3.8 | 7/3.3 | |
| 6 | Caryophyllaceae | 5/3.2 | 7/3.3 | |
| 7 | Rubiaceae | 3/1.9 | 7/3.3 | |
| 8 | Polygonaceae | 2/1.3 | 7/3.3 | |
| 9 | Rosaceae | 5/3.2 | 6/2.8 | |
| 10 | Convolvulaceae | 5/3.2 | 6/2.8 | |
| 11 | Amaranthaceae | 3/1.9 | 6/2.8 | |
| 12 | Primulaceae | 2/1.3 | 6/2.8 | |
| 13 | Violaceae | 1/0.6 | 6/2.8 | |
| 14 | Leguminosae | 5/3.2 | 5/2.3 | |
| 15 | Boraginaceae | 5/3.2 | 5/2.3 | |
| 16 | Cyperaceae | 3/1.9 | 5/2.3 | |
| 17 | Euphorbiaceae | 2/1.3 | 5/2.3 | |
| Oligotypic | 18 | Liliaceae | 4/2.5 | 4/1.9 |
| 19 | Cruciferae | 4/2.5 | 4/1.9 | |
| 20 | Ranunculaceae | 2/1.3 | 4/1.9 | |
| 21 | Araceae | 3/1.9 | 3/1.4 | |
| 22 | Apocynaceae | 2/1.3 | 3/1.4 | |
| 23 | Chenopodiaceae | 2/1.3 | 3/1.4 | |
| 24 | Oxalidaceae | 1/0.6 | 3/1.4 | |
| 25 | Acanthaceae | 2/1.3 | 2/0.9 | |
| 26 | Cueurbitaceae | 2/1.3 | 2/0.9 | |
| 27 | Portulacaceae | 2/1.3 | 2/0.9 | |
| 28 | Crassulaceae | 2/1.3 | 2/0.9 | |
| 29 | Vitaceae | 2/1.3 | 2/0.9 | |
| 30 | Lythraceae | 2/1.3 | 2/0.9 | |
| 31 | Solanaceae | 2/1.3 | 2/0.9 | |
| 32 | Urticaceae | 2/1.3 | 2/0.9 | |
| 33 | Callitrichaceae | 1/0.6 | 2/0.9 | |
| Monotypic | 34 | Plantaginaceae | 1/0.6 | 1/0.5 |
| 35 | Dryopteridaceae | 1/0.6 | 1/0.5 | |
| 36 | Lygodiaceae | 1/0.6 | 1/0.5 | |
| 37 | Orchidaceae | 1/0.6 | 1/0.5 | |
| 38 | Menispermaceae | 1/0.6 | 1/0.5 | |
| 39 | Geraniaceae | 1/0.6 | 1/0.5 | |
| 40 | Pteridaceae | 1/0.6 | 1/0.5 | |
| 41 | Equisetaceae | 1/0.6 | 1/0.5 | |
| 42 | Saxifragaceae | 1/0.6 | 1/0.5 | |
| 43 | Aizoaceae | 1/0.6 | 1/0.5 | |
| 44 | Ophioglossaceae | 1/0.6 | 1/0.5 | |
| 45 | Caprifoliaceae | 1/0.6 | 1/0.5 | |
| 46 | Dioscoreaceae | 1/0.6 | 1/0.5 | |
| 47 | Saururaceae | 1/0.6 | 1/0.5 | |
| 48 | Moraceae | 1/0.6 | 1/0.5 | |
| 49 | Commelinaceae | 1/0.6 | 1/0.5 | |
| 50 | Phytolaccaceae | 1/0.6 | 1/0.5 | |
| 51 | Amaryllidaceae | 1/0.6 | 1/0.5 | |
| 52 | Araliaceae | 1/0.6 | 1/0.5 | |
| Type | Areal Type | N/% |
|---|---|---|
| Cosmopolitan | 1 Cosmopolitan | 33/- |
| Tropical ruderal | 2 Pantropic | 41/33.1 |
| 3 Tropical Asia and Tropical America Disjuncted | 3/2.4 | |
| 4 Old World Tropics | 5/4.0 | |
| 5 Tropical Asia to Tropical Australiasia | 2/1.6 | |
| 6 Tropical Asia to Tropical Africa | 2/1.6 | |
| 7 Tropical Asia (Indo-Malesia) | 6/4.9 | |
| Temperate ruderal | 8 North temperate | 31/25.0 |
| 9 East Asia & North America Disjuncted | 2/1.6 | |
| 10 Old World Temperate | 12/9.7 | |
| 11 Temperate Asia | 2/1.6 | |
| 12 Mediterranea, West Asia to Central Asia | 2/1.6 | |
| 14 East Asia | 14/11.3 | |
| 15 Endemic to China | 2/1.6 | |
| Total | 157/100.0 |
| Species Type | Number/Proportion(%) | ||
|---|---|---|---|
| Life form | Annual species | Summer annual | 81/38.0 |
| Winter annual | 29/13.6 | ||
| Perennial species | Geophyte | 23/10.8 | |
| Hemicryptophyte | 59/27.7 | ||
| Chamaephyte | 21/9.9 | ||
| Growth form | Small growth form | Branched | 35/16.4 |
| Climbing or liane | 25/11.7 | ||
| Procumbent | 32/15.0 | ||
| Rosette | 9/4.2 | ||
| Tussock | 32/15.0 | ||
| Large growth form | Erect | 45/21.1 | |
| Partial rosette | 17/8.0 | ||
| Pseudo-rosette | 18/8.5 | ||
© 2020 by the authors. Licensee MDPI, Basel, Switzerland. This article is an open access article distributed under the terms and conditions of the Creative Commons Attribution (CC BY) license (http://creativecommons.org/licenses/by/4.0/).
Share and Cite
Zhang, M.; Song, K.; Da, L. The Diversity Distribution Pattern of Ruderal Community under the Rapid Urbanization in Hangzhou, East China. Diversity 2020, 12, 116. https://doi.org/10.3390/d12030116
Zhang M, Song K, Da L. The Diversity Distribution Pattern of Ruderal Community under the Rapid Urbanization in Hangzhou, East China. Diversity. 2020; 12(3):116. https://doi.org/10.3390/d12030116
Chicago/Turabian StyleZhang, Mingli, Kun Song, and Liangjun Da. 2020. "The Diversity Distribution Pattern of Ruderal Community under the Rapid Urbanization in Hangzhou, East China" Diversity 12, no. 3: 116. https://doi.org/10.3390/d12030116