Article

Testing Bathymetric and Regional Patterns in the Southwest Atlantic Deep Sea Using Infaunal Diversity, Structure, and Function

by
Giovanni A. P. dos Santos
1,*,†,
Alexsandra C. Silva
1,†,
André M. Esteves
1,
Venina P. Ribeiro-Ferreira
2,
Patricia. F. Neres
1,
Yirina Valdes
3,* and
Jeroen Ingels
4
1
Zoology Department, Federal University of Pernambuco, Recife 50670-901, Brazil
2
Cepemar Environmental Solutions/Brazilian Petroleum S.A., Rio de Janeiro 20011-000, Brazil
3
Department of Biosciences, Federal University of Paraíba, Areia 58397-000, Brazil
4
Coastal and Marine Laboratory, Florida State University, St Teresa, FL 32358, USA
*
Authors to whom correspondence should be addressed.
These authors contributed equally to this study.
Diversity 2020, 12(12), 485; https://doi.org/10.3390/d12120485
Submission received: 12 November 2020 / Revised: 10 December 2020 / Accepted: 14 December 2020 / Published: 18 December 2020
(This article belongs to the Special Issue Effects of Environmental Change on Meiofauna)

Abstract

:
A better understanding of deep-sea biology requires knowledge of the structure and function of their communities, the spatial, temporal, and environmental patterns, and the changes and dynamics that govern them. Some of the most studied patterns in deep-sea biology are those related to bathymetrical gradients. For meiofauna and nematodes, such studies have highlighted the importance of recognizing regional differences in using ecological mechanisms to explain those patterns. Despite holding significant fisheries and oil and gas resources, the eastern Brazilian Continental Margin is poorly understood with respect to its seafloor biology and ecology. To answer ecological questions of deep-sea infaunal structural and functional diversity in relation to bathymetrical patterns, we used nematode data from five bathymetric transects (400, 1000, 1900, 2500, and 3000 m water depth) sampled in 2011 and 2013 on the Espírito Santo slope off the coast of southeast (SE) Brazil. Deep nematode community analysis based on 6763 nematode identifications showed very high levels of diversity (201 genera; 43 families) compared to other ocean basins and deep-sea regions. Our analyses showed that there is a distinct bathymetric break in standing stocks and community structure between 1000 and 1900 m. Nematode standing stocks were much higher at 400 and 1000 m compared to those for similar depths worldwide, likely linked to the intense and frequent upwelling and specific hydrographic and topographic identity of the region. The bathymetric break was not present for structural and functional nematode diversity. Instead, bathymetric regressions showed that they increased gradually toward 3000 m water depth. The deep Espírito Santo basin is characterized by rich and equitable nematode communities that are both mature and trophically diverse. General deep-sea ecological theories apply to our findings, but there are also substantial regional effects related to the local margin topography, upwelling, and oceanographic and hydrodynamic processes that make the Espírito Santo Basin a unique and diverse deep-sea ecosystem.

1. Introduction

The deep sea below 200 m water depth is the largest habitable space on Earth and is the source of high habitat heterogeneity that supports biodiversity and ecosystem functions essential for the global ecosystem [1]. Deep-sea biodiversity patterns and habitat heterogeneity also lie at the basis of continuing scientific debate, with regular new discoveries that challenge deep-sea ecological paradigms [2,3]. Deep-sea bathymetric patterns have long been considered a source of gradients in available food sources, abundance, biomass, diversity, and function [3,4,5,6,7]. A prominent component of the deep-sea realm is represented by the continental margins, identified as the areas that deepen out from the shelf-edge floor at about 200 m depth down to the upper limit of the continental rise, roughly at about 4000 m water depth. Continental margins are dynamic and heterogeneous, supporting high biodiversity and about 90% of the ocean’s carbon burial [8,9]. A number of environmental gradients are recognized along continental margins, such as food availability, oxygen concentrations, sediment structure, and obviously water depth in concordance with pressure and temperature, while being under the influence of variable oceanographic conditions that drive surface production and water mass movements [8]. The continental margin is not uniform; this interface along the continental shelf, the shelf break, and upper and lower slope extending to the abyssal plain is interrupted by numerous geomorphological structures such as submarine canyon systems, seamounts, and guyots, among others [10,11,12].
A significant component of deep-sea benthos is the meiofauna, with its most abundant and diverse metazoan representative, the free-living nematodes [13]. Meiofauna and nematodes are regularly used to assess deep-sea benthic patterns in biodiversity and ecosystem functioning (e.g., [4,14,15,16,17]), because (1) limited sampling effort yields large amounts of organisms that allow sound statistical analysis, (2) they are sensitive to environmental change and habitat heterogeneity [18,19,20], and (3) they are an integral part of energy transfer, food webs, and biogeochemical processes in deep-sea sediments [21,22,23].
Deep-water meiobenthic studies have mainly focused on the northern hemisphere, particularly in the North Atlantic, with the exceptions being the region off southwest (SW) Africa and the Antarctic [16,24]. In the deep western South Atlantic, investigation of deep-sea meiobenthos started only just over a decade ago (e.g., Netto et al. [25]), showing that deep-sea nematodes and other meiofauna respond to the sedimentary environment in terms of grain size, heterogeneity, and depth. More detailed meiobenthic investigations are lacking there. Considering the economic importance of this area within the Brazilian Exclusive Economic Zone, relatively little information is available on benthic biodiversity and function from the Brazilian continental margin. Recently, however, increased effort in the framework of the Espírito Santo Basin Assessment Project has resulted in detailed assessments of macrofauna of the region (e.g., Bernardino et al. [26]), in combination with habitat characterization studies (e.g., Almada and Bernardino et al. [27]). The study presented here is the first to discuss the dominant meiofaunal component, nematodes, in the region.
The numerical dominance, diversity, and biomass of deep-sea nematodes vary with water depth and are influenced directly and indirectly by many environmental gradients [16,24,28,29]. Food influx from surface waters and advective sources are a key factor in determining deep-sea nematode standing stocks [4,6,15,30,31]. Organic matter produced in surface waters is grazed upon, and remnants together with fecal material sink as particles or aggregates, while degrading and being remineralized by bacterial activity. This unconsumed or reworked material ultimately arrives as phytodetritus or “marine snow” on the deep-sea floor. It, therefore, follows that, with increasing water depth and, hence, increasing sinking distance, or with increasing horizontal distance from coastal or open water production, the quantity and quality of the particulate food source for deep-sea benthos diminish. With increasing water depth, temperature decreases, hydrostatic pressure increases, average current speeds decrease, and oxygen concentrations can decline as well [32]. All these factors shape meiofauna and nematode communities.
Overall, nematode abundance and biomass (standing stocks) decrease with increasing depth but they become more dominant in benthic communities in a relative sense [4,16,22,24]. Nematode diversity, on the other hand, can be consistently high across bathymetric gradients [14,33,34,35]. Other studies have shown that nematode biodiversity can decrease significantly with increasing depth, potentially related to food conditions (e.g., in the Mediterranean Sea, [36]). According to aggregated deep-sea data, nematode diversity can exhibit a peak at upper bathyal depths, after which further decline to abyssal and hadal zones occurs [22]. In the southwest Atlantic, this question remains unexplored, although some information from two deep-sea stations suggests higher deep-sea nematode diversity compared to the slope off the coast of Brazil in the southwest Atlantic [25].
Despite increasing understanding of biodiversity, abundance, and community structure patterns for deep-sea nematodes, little is known about nematode functional diversity patterns. Limited data on nematode trophic diversity and life history characteristics show either a bathymetric decrease or patterns inconsistent with uniform bathymetrical gradients [15,37]. Structure, diversity, and function may behave differently across depths, and such differences may provide insights into the processes that influence deep-sea infaunal communities and ecosystem function in general. In addition, investigating these relationships allows us to assess whether functional diversity (and related functional performance) is retained with increasing water depth [38], and whether measures of diversity can be representative for function in the deep sea. From what we know so far, it seems that nematode structural and functional diversity are coupled, related to the availability of food sources and other environmental variables such as hydrodynamic disturbance [14,39]. In addition, life-history characteristics such as survival and reproduction of deep-sea nematodes give insight into the disturbance response and maturity of an ecological assemblage [15,34,36,40].
This provided the premise for us to investigate bathymetric gradients in nematode abundance, biomass, and structural and functional biodiversity at the southeast (SE) Brazilian Continental Margin (Espírito Santo slope off the coast of SE Brazil, and the very northern part of the Campos basin), for five bathymetric transects ranging from 400 to 3000 m water depth. These transects were sampled in 2011 and 2013 during different times of the year to provide insight into seasonal variation. We investigated the following questions:
(1)
Do deep-sea nematode structure and function at the SE Brazilian Margin follow the same bathymetric patterns as in other deep-sea areas?
(2)
Is there a marked difference between structural and functional nematode characteristics along bathymetric gradients, and what does that mean for our understanding of deep-sea infaunal communities?
(3)
What are the local or regional drivers of observed bathymetric patterns in deep-sea nematode structural biodiversity and function in this region of the SW Atlantic? Does the region stand out in the ways in which it maintains deep-sea biodiversity?

2. Materials and Methods

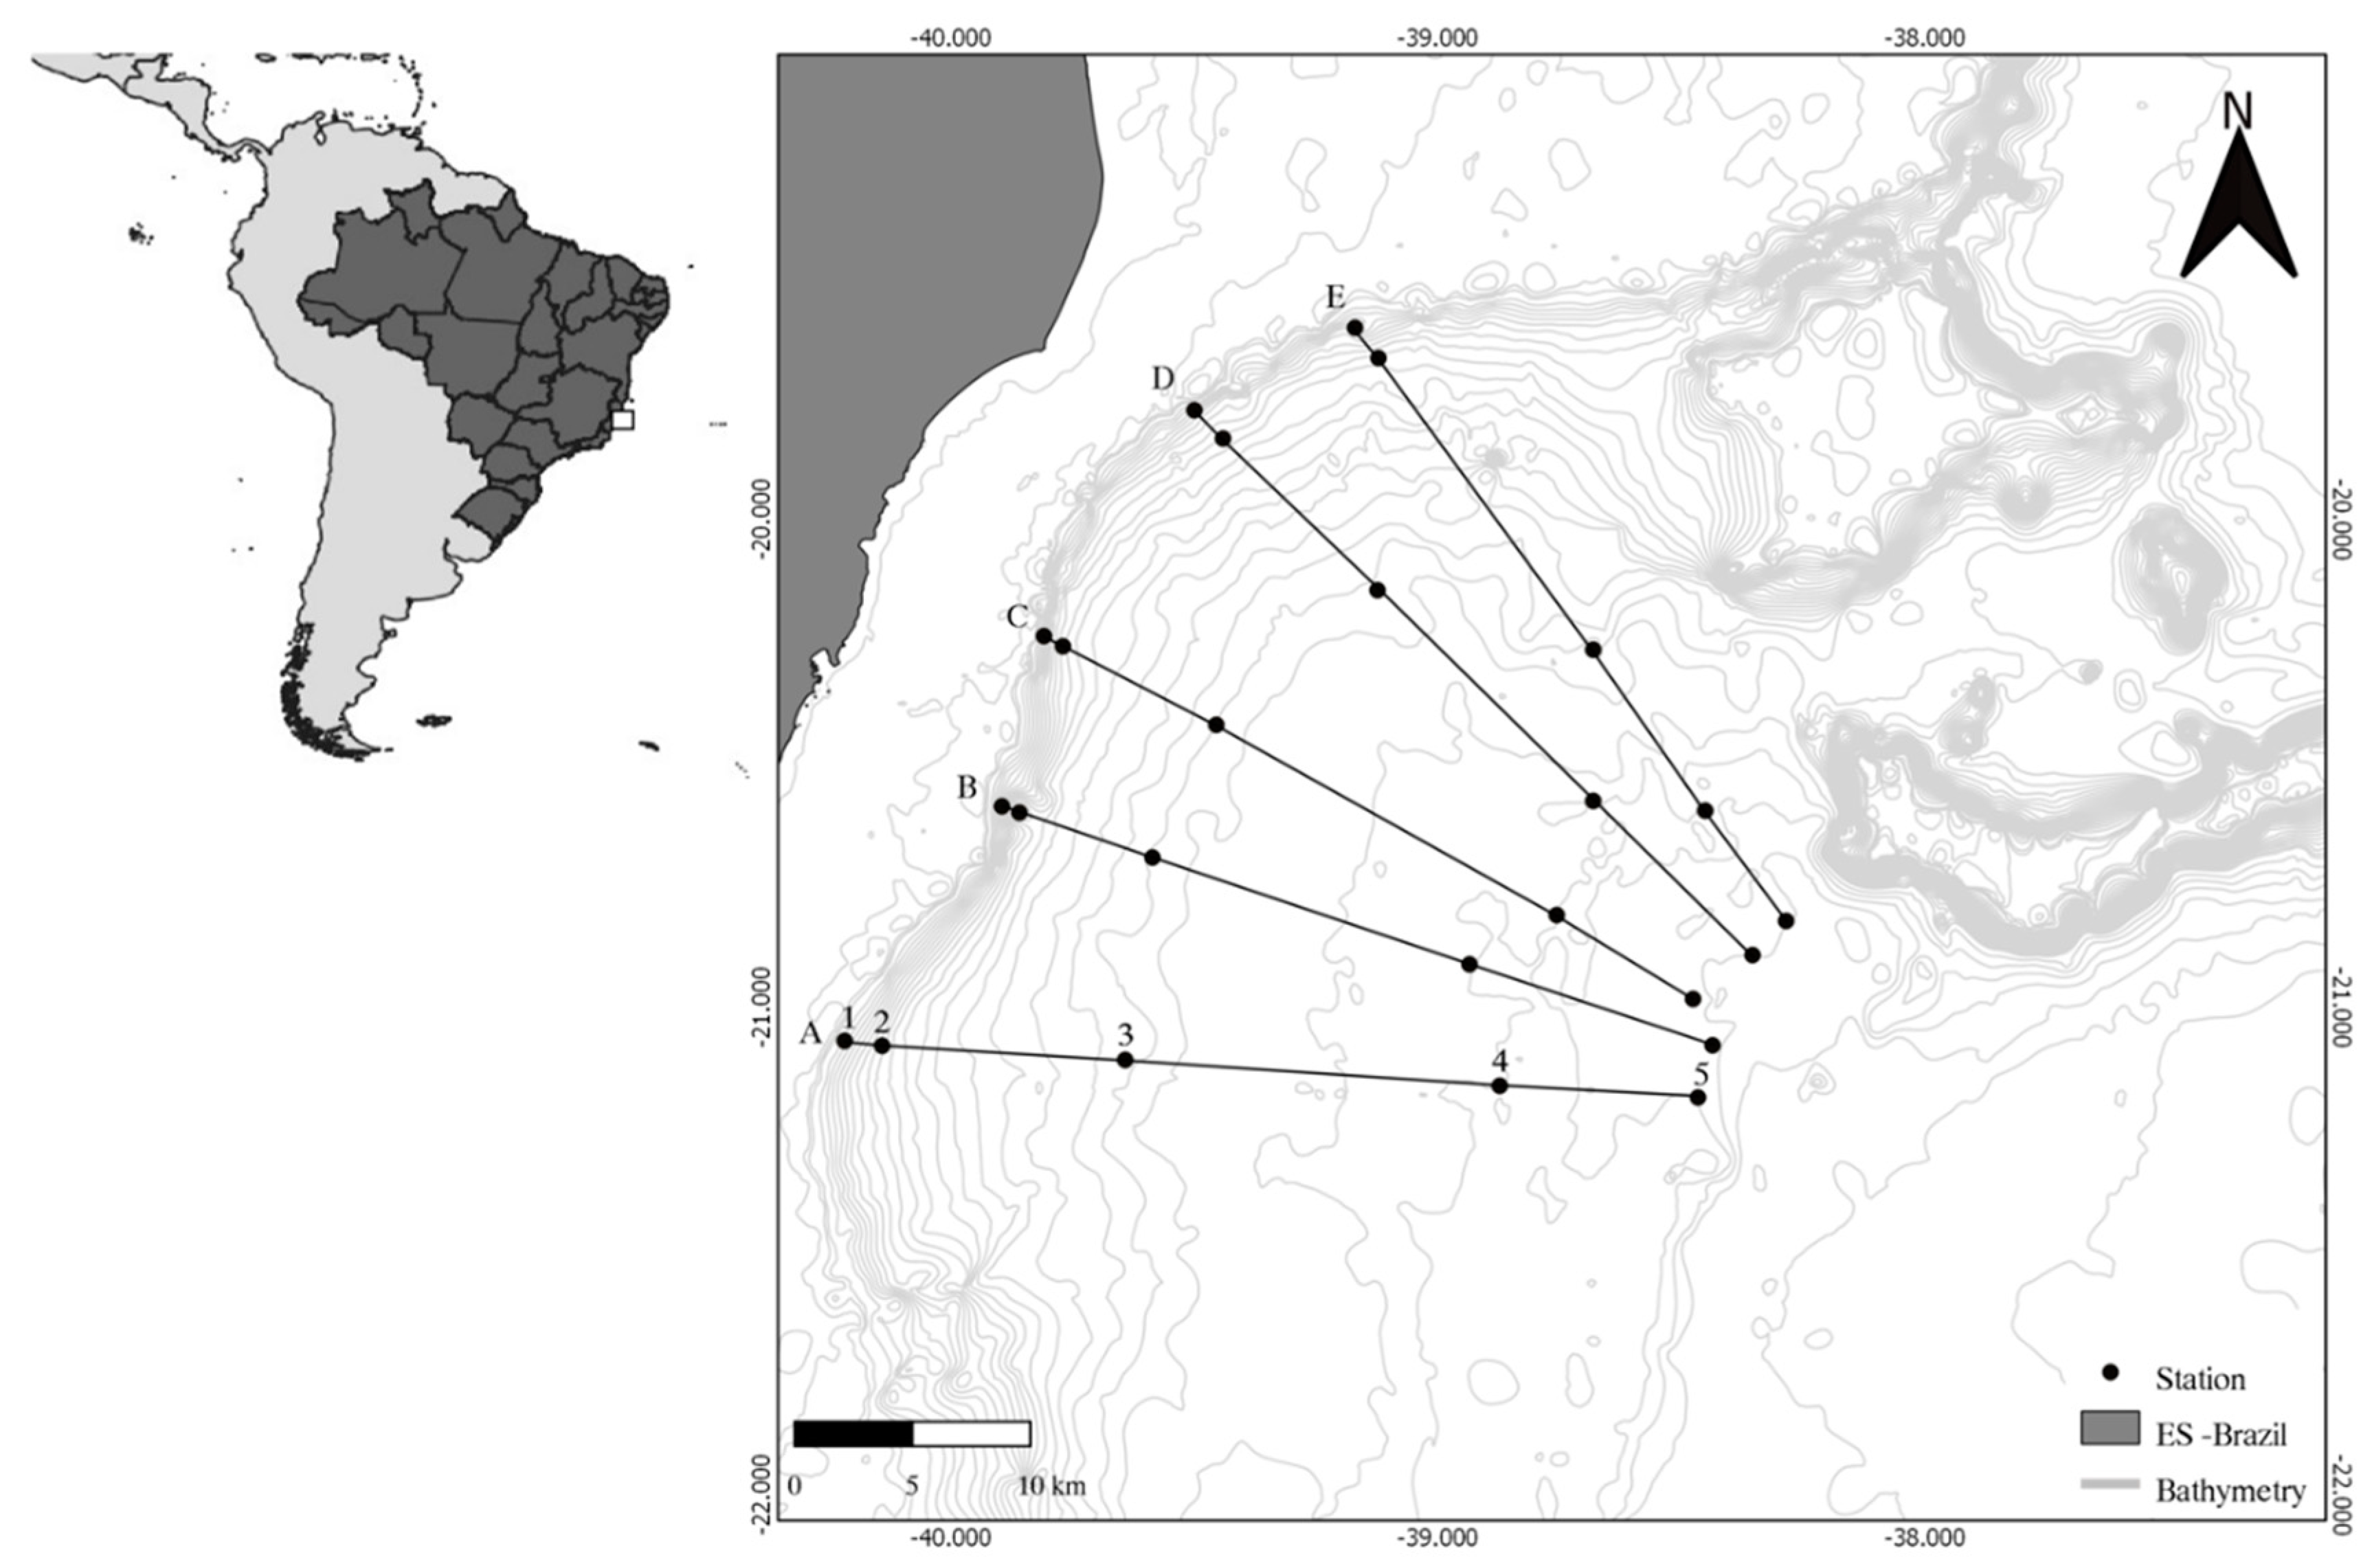
2.1. Study Area and Sampling

Espírito Santo basin is located between the south of Bahia (18°02′22″ S; 39°37′19″ W) and the central south of Espírito Santo (20°27′57″ S; 40°19′40″ W) (Figure 1) in the northern region of the eastern Brazilian margin. The basin occupies an area of approximately 115,200 km2, of which 101,880 km2 is marine, bordering several Brazilian states and descending down to 3000 m water depth [41]. The Espírito Santo Basin is limited to the north by the Abrolhos Coral Reef banks and to the south by the Campos Basin. The northern and central oceanic regions of Espírito Santo Basin are oligotrophic. The slope in the study region is influenced by a set of four water masses with different flow directions and a clear pattern according to bathymetric gradients (e. g., Bernardino et al. [26] and references therein).
The Espírito Santo Basin Assessment Project (AMBES, CENPES/Petrobras) was conducted on the continental slope of Espírito Santo and northern Campos Basin during two oceanographic cruises. In December 2011/January 2012 and June/July 2013 (dry and rainy seasons, respectively), five evenly distributed transects (A–E along a S–N gradient) perpendicular to the coast of the state of Espírito Santo were sampled. Each transect comprised five stations along the bathymetric gradient from slope to basin area (400, 1000, 1900, 2500, 3000 m; Figure 1). The distances between adjacent transects at the shallow 400 m stations ranged from ~39.3–63.1 km, while, at the deep 3000 m stations, distances between adjacent transects ranged from ~10.7–16.4 km. Benthic assemblages and sediments were sampled on board of the R/V Gyre or the R/V Seward Johnson with a “USNEL” box corer type (0.25 m2 surface area, [42]). The quality of the box corer deployment was assessed visually in terms of structural integrity of the sediment surface, surface sediment layer disturbance, and retainment of the overlying water. After inspection, the overlying water was gently siphoned off, and sub cores of 10 × 10 cm (100 cm2, first 10 cm of the surface sediment) were inserted into the sediments. For nematodes and environmental analyses, each time, three samples from independent deployments were obtained, and stored in polyethylene pots with 10% formalin, buffered with borax [43].

2.2. Nematode Sample Processing and Identification

We followed Somerfield and Warwick [43] and used the Ludox (40% colloidal silica from NALCO®) density flotation technique to separate the fauna from the sediment. Density separations were repeated five times, and the specific gravity of Ludox was adjusted to 1.18 cm−3 [44] and filtered with a 0.032 mm sieve after repeated uses. The supernatant fraction containing the floating organisms after each extraction round was poured over two stacked sieves (0.5 and 0.038 mm) to separate the meiobenthos from macrobenthos. The meiofauna was sorted using a stereoscopic microscope, and the first 150 nematodes from each sample were removed for mounting and further identification. They were transferred to embryo dishes and diaphanized following De Grisse [45] before mounting on Cobb slides [46].
Nematodes were identified to genus level using standard pictorial keys [47,48,49] and the Nemys database [50]. Nematodes were classified in feeding types following Wieser’s [51] modified classification, assigning each individual as follows: 1A—selective deposit feeder, 1B—nonselective deposit feeder, 2A—epigrowth feeder, or 2B—predator/omnivore, depending on their buccal morphology.
Nematodes were also classified following the c–p (colonizer–persister) scheme developed by Bongers [52] and Bongers et al. [53] which is based on life-history characteristics and related to the principles of r/K selection strategies [52,53,54]. Classification categories comprised the following: CP1—short lifetime, high reproduction rate, these nematode families normally presents dauer larvae; CP2—short lifetime, high reproduction rate; CP3—short lifetime and sensitivity to disturbance; CP4—longer lifetime, high sensitivity to disturbances; CP5—low reproductive rate, longer development cycle, and pollutant sensitivity.

2.3. Environmental Variables

A multiparameter profiler (CTD) was used in situ to determine the depth, temperature, and salinity. To determine total carbonate, 1 g dry sediment aliquots were digested with 20 mL of 1.0 M HCl overnight and weighed using a microbalance. A laser diffraction particle analyzer (Shimadzu Model SALD-3101) was used to determine grain size distributions following the Wentworth scale [55]. A CHN analyzer was used to determine total organic matter after removing carbonates with HCl vapor [56].

2.4. Data Analysis

2.4.1. Structural and Functional Nematode Community Characteristics

Relative nematode genera counts based on the identification were multiplied by total abundance in each respective sample to obtain total genera abundance, which was then recalculated to density as ind./10 cm2. Diversity indices were calculated on the basis of a multivariate nematode genera density (ind./10 cm2) matrix, using the DIVERSE function in PRIMER v7 [57]. Diversity measures used were genus richness (GR), Shannon–Wiener diversity (H’ (log e)), expected number of genera (EG(51)), and Hill’s diversity numbers (N1, N2, Ninf). These indices cover a range of diversity measures between the simple number of observed taxa (nematode genus richness, GR) and Hill’s dominance index (Ninf, which computes the reciprocal density value of the most dominant taxon and represents a pure evenness measure). For more information on these indices and their calculations and statistical behavior, the reader can refer to Heip et al. [58].
As functional parameters of the nematode community, we included density (ind./10 cm2), biomass (µg wet weight/10 cm2), the trophic diversity index (TDI) [58], and the maturity index [52,53,59]. The latter metric is based on scores on a colonizer–persister scale equivalent to classification using r/K selection theory in ecology and evolutionary biology. It is often used in marine studies to give insight into disturbance responses of communities. Length and width were measured for each nematode (μm) and used to calculate nematode biomass using Andrassy’s formula [60], leading to wet weight values in μg/10 cm2. TDI is calculated as 1/∑θ2, where θ is the density contribution of each trophic group to the total density of nematodes. This value ranges from 1 (lowest diversity with complete dominance of one particular feeding type) to 4 (four feeding types each represented by 0.25% of the total community). MI was calculated as i = 1 n v ( i ) · f ( i ) , where v(i) is the c–p taxon value of the ith taxon, and f(i) is the frequency of this taxon. The MI obtains values between 1 and 5, whereby 1 is the MI value obtained for a community comprised solely of c–p 1 nematodes (opportunists/colonizers; high disturbance, low community maturity), and 5 represents a community entirely made up of c–p 5 nematodes (persisters; very low or no disturbance, highly mature community).

2.4.2. Statistical Analyses

Linear regressions were analyzed for univariate functional and structural descriptors relative to bathymetry (incl. normality and constant variance testing); the data were averaged over replicates for the regression analyses.
PERMANOVA (Permutational multivariate analysis of variance) analyses were conducted on environmental data, community structure (multivariate data), and univariate diversity and functional descriptors, using a three-way model with factors season (fixed; dry and rainy), transect (fixed; A–E), and water depth (fixed; 400, 1000, 1900, 2500, and 3000 m) using 9999 permutations. Community structure data (density, ind./10 cm2) were square-root transformed and Bray–Curtis similarity was used as resemblance measure. For the univariate data, Euclidean distance was used as resemblance measure prior to analysis. Pairwise tests were conducted to investigate differences between levels of each factor within significant factors or interactions. PERMDISP (Permutational analysis of multivariate dispersions) analyses were used to assess the contribution of heterogeneity in dispersions for each significant main factor (which in itself may serve as an indication of disturbance and variability in the community). Significant PERMDISP results may indicate that the variability between values within groups can differ substantially, such that it can mask or add to true factor level differences. An nMDS (non-metric multidimensional scaling) plot was created to capture the community structure differences.
The relationship between biological and environmental parameters was assessed with DISTLM and dbRDA(Distance-based redundancy analysis), and a RELATE analysis was used to establish whether there was a significant nonparametric rank relation between the environmental parameters and the nematode community structure. All analyses were conducted in PRIMER v7, the PERMANOVA+ add-on, and Sigmaplot v13/14.

3. Results

3.1. Environmental Variables

An overview of the environmental variables is presented in Table 1. The slope is predominantly composed of very fine sediment, mainly silt across all water depths, but particularly dominant at 400, 1000, and 1900 m depth (>50%, Table 1). There are also substantial contributions of clay and (very) fine sand to sediment-grain-size structure. We did not observe transect or season differences for grain-size data (PERMANOVA, p = 0.003 only for water depth). Temperature in the region decreased gradually (11 to 2.3 °C) with increasing water depth. Only temperatures at the 400 m stations were significantly different from those at other stations (p < 0.05). No transect or season differences were present for temperature (p > 0.05). Salinity differed significantly with water depth gradient, but no specific pairwise comparisons stood out (p > 0.05), and salinity did not exhibit transect or season differences. Salinity readings were accurate and highly reproducible; the average values all ranged between 34.384 and 34.980. We suspect that temperature and salinity are influenced by water mass signatures. The sedimentary carbonate concentrations changed with water depth, and there was slight variation between transects. Organic matter decreased from ~1.39% to ~0.9% over the depth gradient, with a sharp decline below 1900 m.

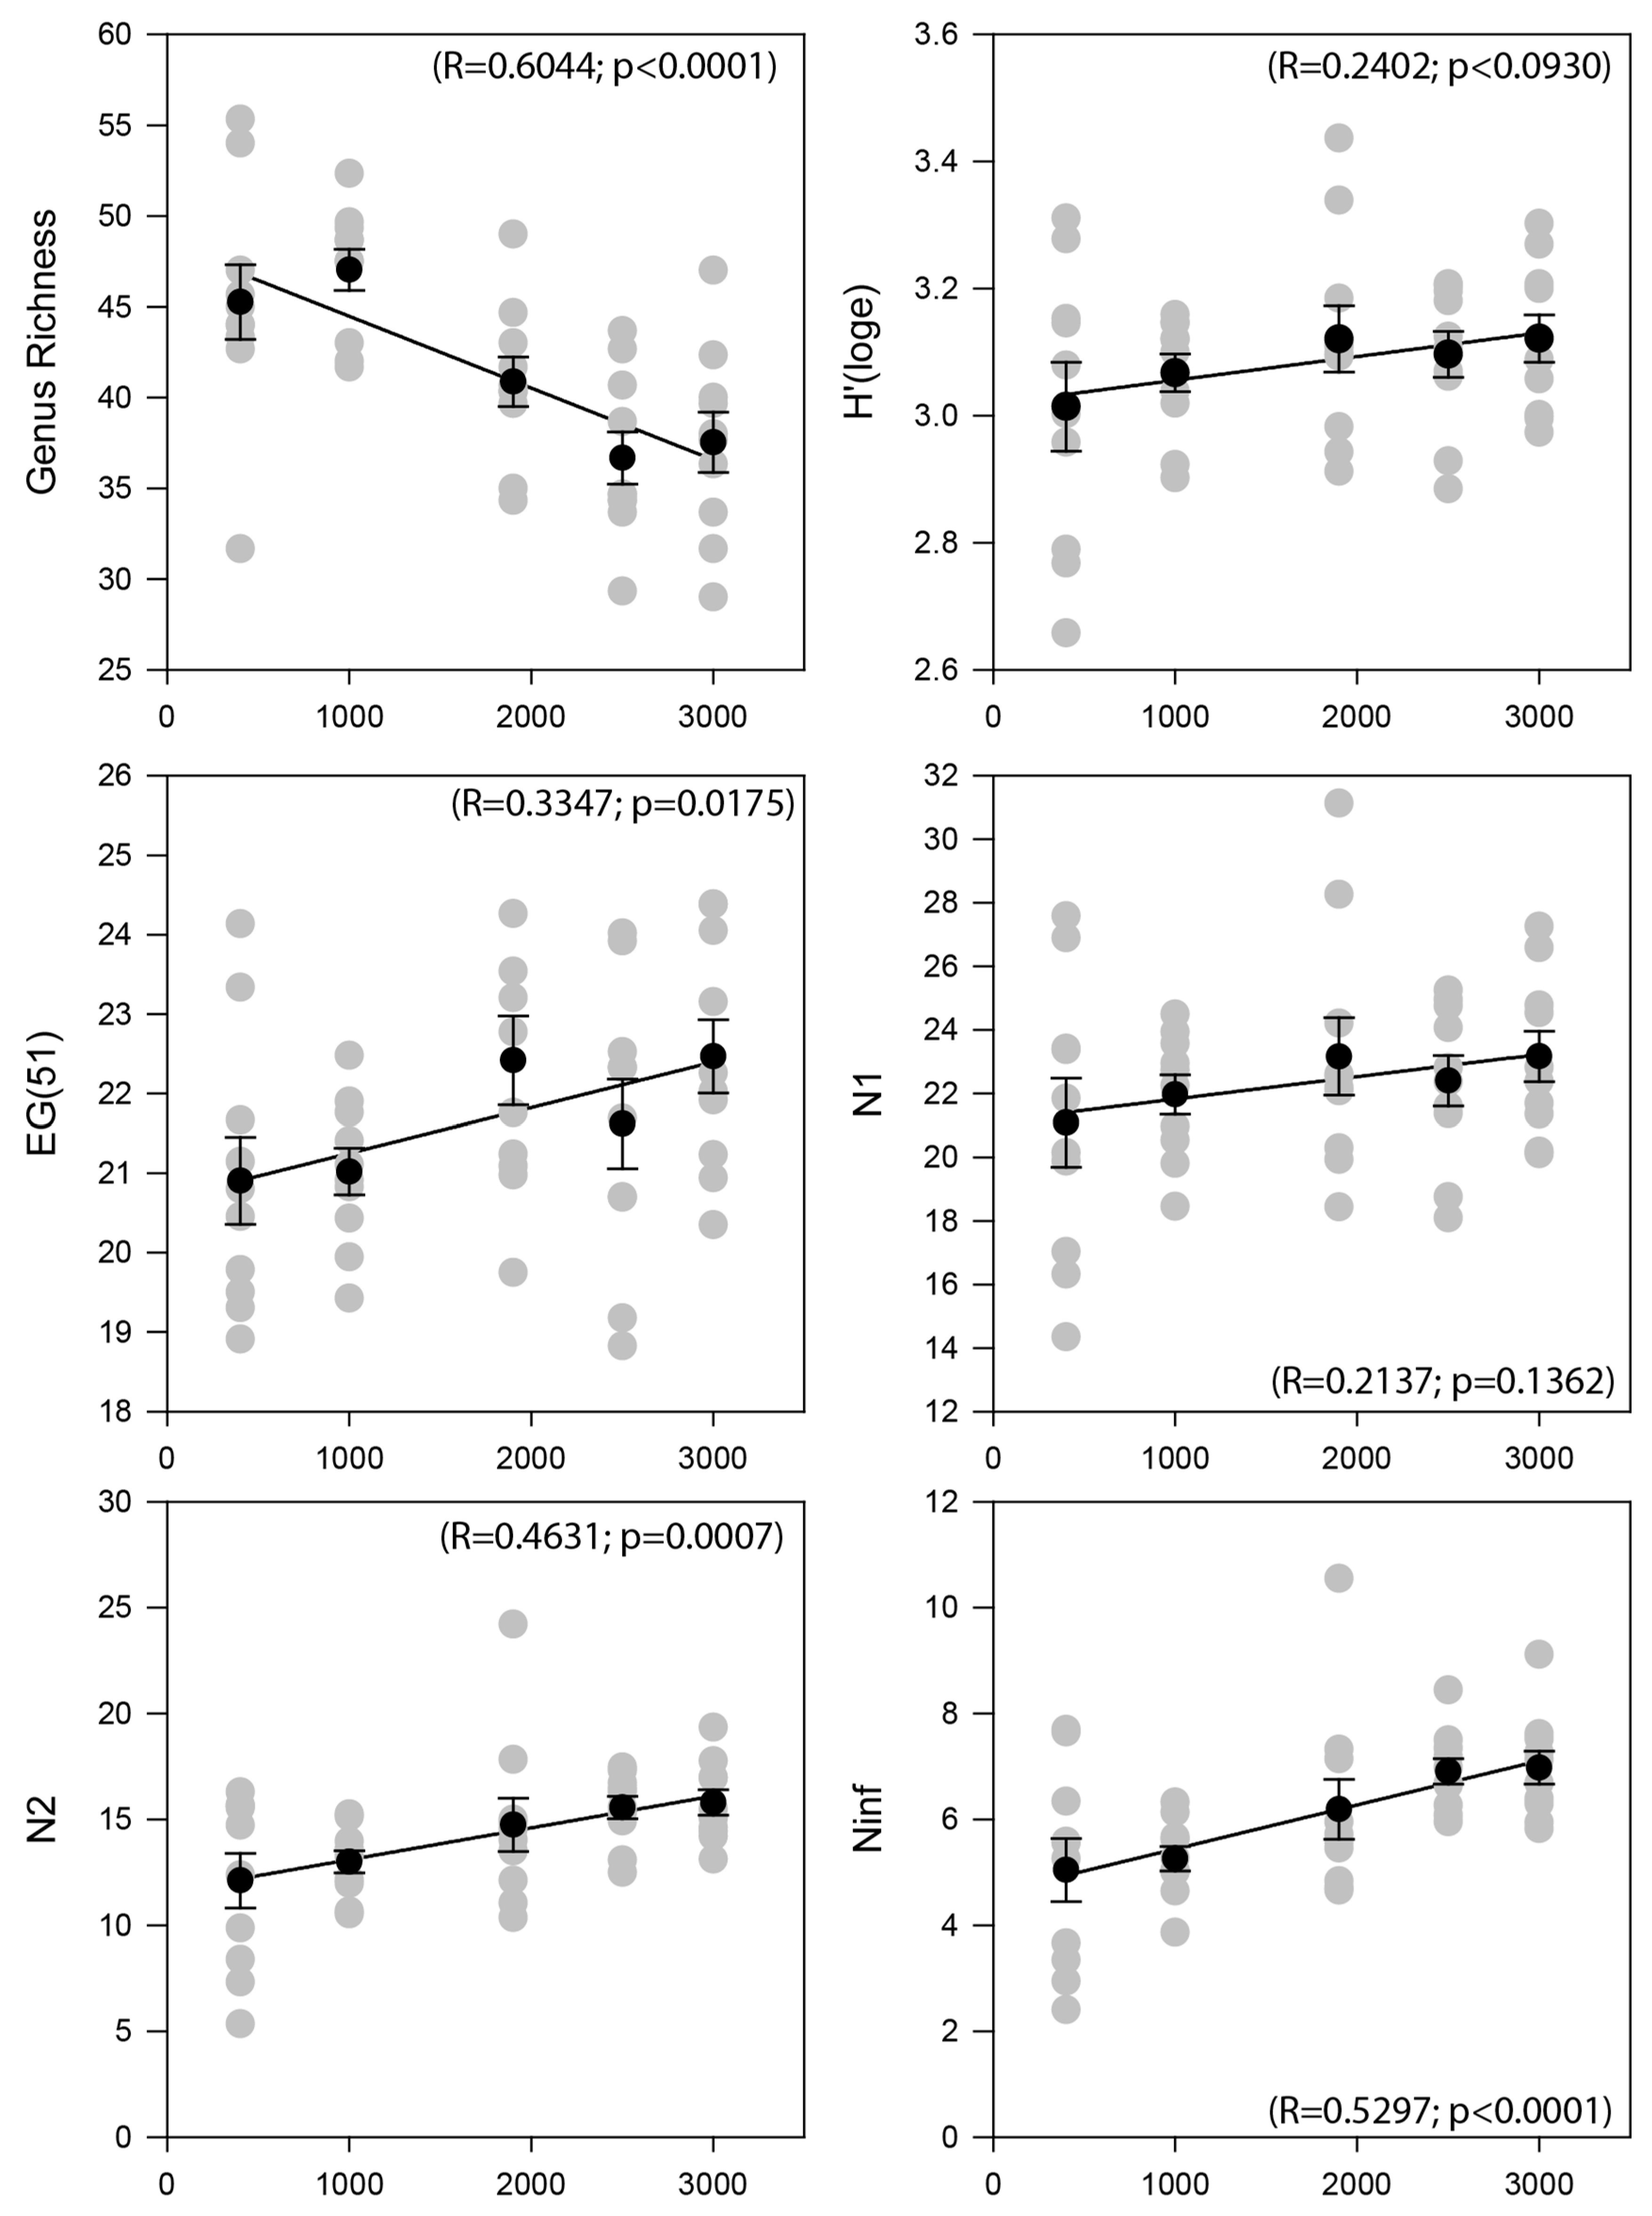
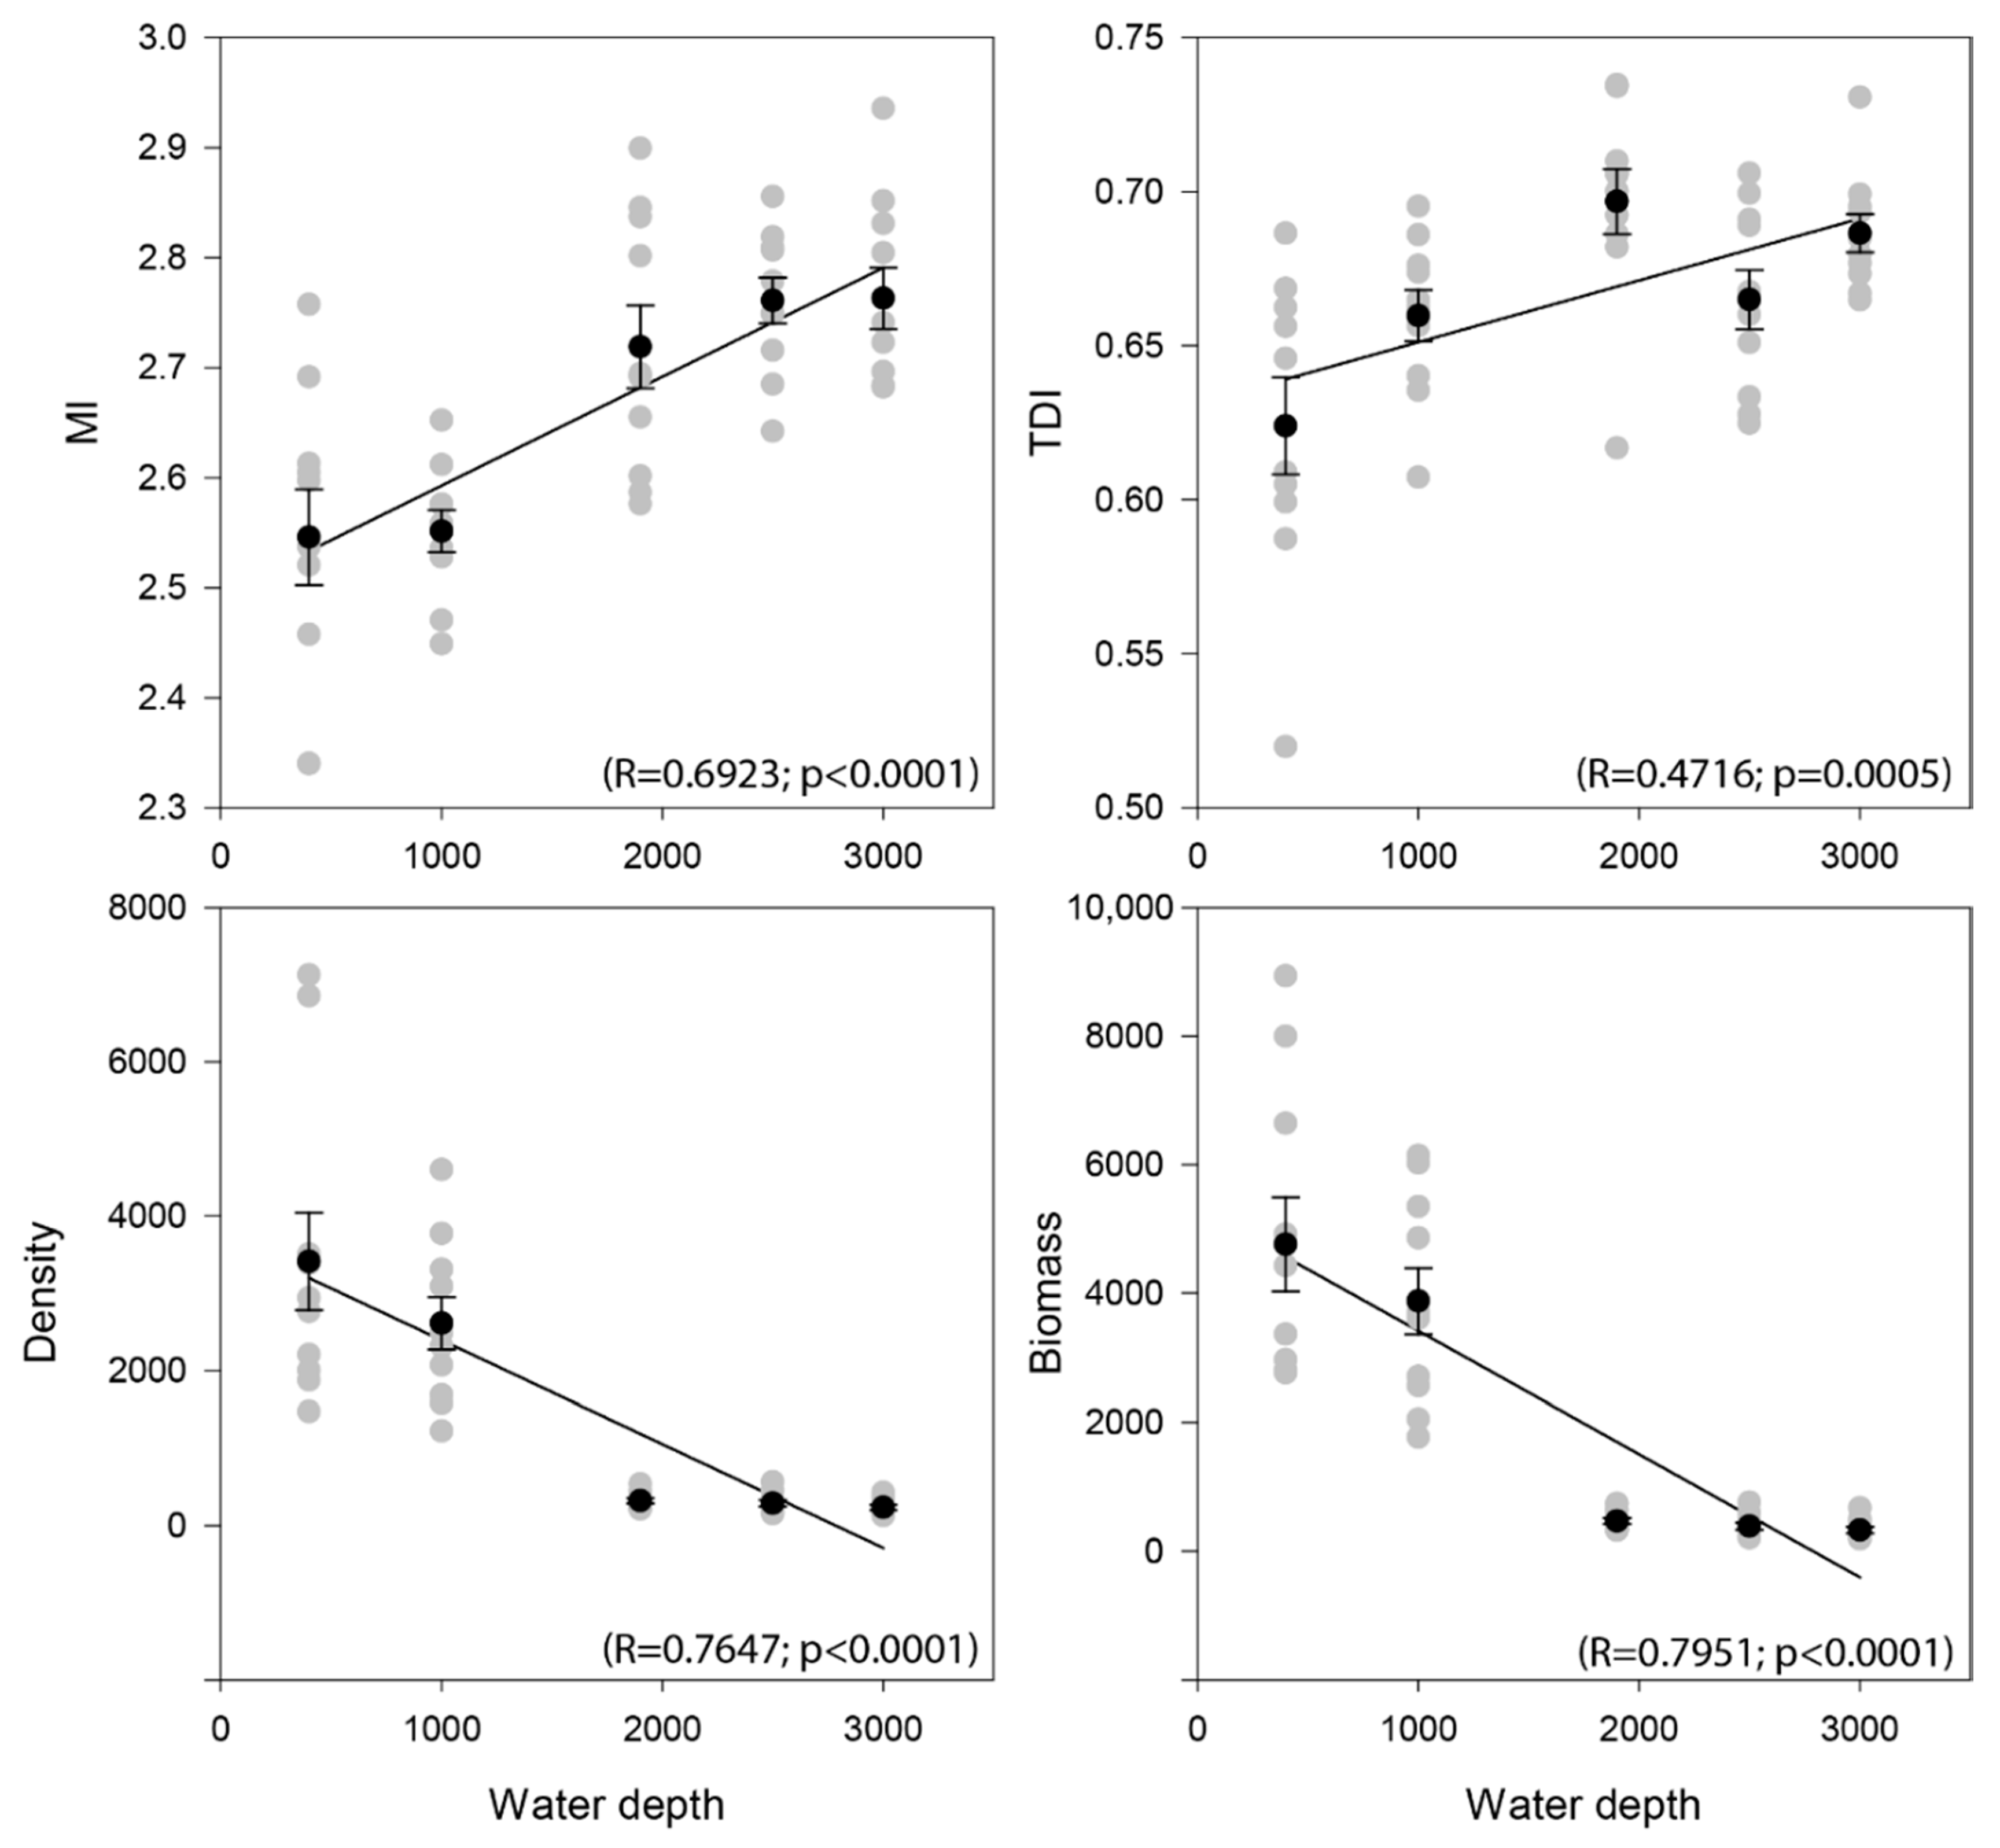
3.2. Nematode Community Characteristics and Bathymetrical Gradients

Nematode density (Table 2) ranged between 37 and 11,790 ind./10 cm2, averaging 1349 ind./10 cm2 (SD = 1837 ind./10 cm2), indicating large variability along the bathymetric gradient. There was a stark contrast between nematode densities at the shallower sites (400 and 1000 m depth; 3405–2542 ind./10 cm2, respectively) and deeper sites (1900, 2500 and 3000 m; 236–318 ind./10 cm2).
The same patterns were observed for nematode biomass (Table 2, µg wet weight/10 cm2), which were an order of magnitude higher at the 400 and 1000 m stations, compared to those at the deeper sites. We recorded a minimum of 42.72 and a maximum of 14,594 µg wet weight/10 cm2, averaging 1933 µg wet weight/10 cm2.
All average structural diversity measures (H’ (log e), EG(51), N1, N2, Ninf) increased with water depth, except for GR which decreased with water depth (Table 2, Figure 2 and Figure 3). Regression R-values were relatively low owing to high variability between sample means (Figure 2) but significant, except for N1 (p = 0.1362), and H’ (p = 0.0930). Further investigations using PERMANOVA (Table 3) confirmed the regression results; for all structural diversity measures, except H’ and N1, significant water depth differences were observed. PERMDISP analysis indicated that multivariate dispersion heterogeneity differences did not affect the true factor differences (p > 0.05), i.e., the magnitude of variability in diversity values from different water depths, transects, or seasons did not affect true structural diversity differences. The estimated component of variation relative to the total variation (ECV%) indicated that water depth is the main source of variability, much more than transect and season differences, but this was not the case for the nonsignificant H’ and N1 values (Table 3). Pairwise comparisons (for the main factors and interactions that showed significant differences; see Table S1, Supplementary Materials) indicated that water depth differences were not always uniform; they sometimes depended on which water depths and transects were being considered. In general, however, structural diversity measures at the 400 and 1000 m stations were similar, but very distinct from those at the deeper stations. At the deeper stations, diversity differences were small or absent. The results imply that a clear break in diversity is present between the shallow stations (400 and 1000 m) and the deeper stations (1900, 2500, 3000 m), although the break may occur also between the 1900 and 2500 m bathycline depending on the transect. Overall, water depth drove diversity differences, but there were also some regional differences, which were expressed between transects, mainly at the shallower stations.
For functional nematode community parameters (density, biomass, TDI, and MI), we observed a strong decline in density and biomass with increasing water depth, while MI and TDI increased significantly along the same depth transect (Table 2, Figure 3). All linear regressions were highly significant (p < 0.0005), with R-values ranging from 0.471–0.795. Standing stock and MI were significantly different among water depths, transects, and seasons (PERMANOVA, Table 3). For TDI, differences were significant for water depth and season, but not for transects (Table 3). ECV% values indicate that nematode function was mainly driven by water depth differences (20–56.7%), which supports our approach of using the means of the triplicates to obtain a more powerful regression analysis. Transect and season differences only played a minor role (0.0–7.8%; Table 3). We again saw a large difference in the functional parameters between the shallow stations (400, 1000 m) and the deeper stations (1900, 2500, 3000 m). This was confirmed by the PERMDISP tests, which were highly significant for water depth, most likely a result of differences in variability of parameter values between the factor groups (Table 3). This can be observed in the regression analysis as well; variability of functional values at the 400 and 1000 m stations appeared greater compared to that at deeper depths, suggesting higher functional turnover across the 400 and 1000 m sampling depths compared to deeper depths toward the basin. This may be the result of greater habitat heterogeneity at 400–1000 m compared to the lower slope and basin. The pairwise testing on functional parameters (Table S1, Supplementary Materials) provided another perspective, that of marked differences between transect A and the other transects. However, this pattern was only exhibited for the functional parameters and not for structural diversity or community structure.
Nematode community structure differences were mainly observed between water depths with 35.8% of the variation, and only 1.7% and 2.5% of variation was explained by season and transect differences, respectively (PERMANOVA, Table 3). Therefore, in subsequent analysis, the role of depth was considered most important. PERMDISP results show some significant heterogeneity in dispersions (Table 3), which can also be observed in the nMDS for water depth groups. The 400 and 1000 m samples occupy more Bray–Curtis space compared to the deeper samples (Figure 4). This is explained by differences in assemblage variability and suggests greater turnover at shallower depths in the study area (400–1000 m) compared to deeper depths. The pairwise tests confirm this (Table S1, Supplementary Materials; see higher t-values between 400/1000 m and the deeper stations) and similarity values resulting from the pairwise comparisons (similarity between 400/1000 m and the deeper stations was <33.0, while the deeper stations showed similarity of >42.4 among each other). These results correspond with what we found for functional parameters, i.e., greater variability at the shallow stations compared to the deeper basin.
PERMDISP results also indicated that the magnitude of community differences changes between transects (Table S1, Supplementary Materials), but these were not clear in the nMDS. Pairwise tests showed that transect A was more differentiated from the other transects (Table S1, Supplementary Materials; see t-values and significance levels). In addition, similarity values (taken from the pairwise test results) show Transect A to have a similarity between 31.7 and 32.9 to the other transects, while similarity among the other transects ranged from 36.2–40.2.
Pairwise water-depth comparisons were all significant within each season, but season differences were variable and nonsignificant at 400 m. Season differences varied depending on the transect and were not significant at transect A. Overall, community structure was very sensitive to water depth and exhibited a shift between 1000 and 1900 m as can be seen on the nMDS in Figure 4. The shallow 400 m station harbored greatest community variability. While there were several transect differences, these were most pronounced at transect A, particularly for the shallow 400 m station.
The nMDS in Figure 4 shows the clear distinction between the 400–1000 m samples and the deeper samples, indicating a clear bathymetric shift between 1000 and 1900 m, which distinguishes the upper slope communities from the deeper slope communities. In addition, there is greater dissimilarity between the 400 and 1000 m communities than the dissimilarity among the deeper communities (1900, 2500, 3000).

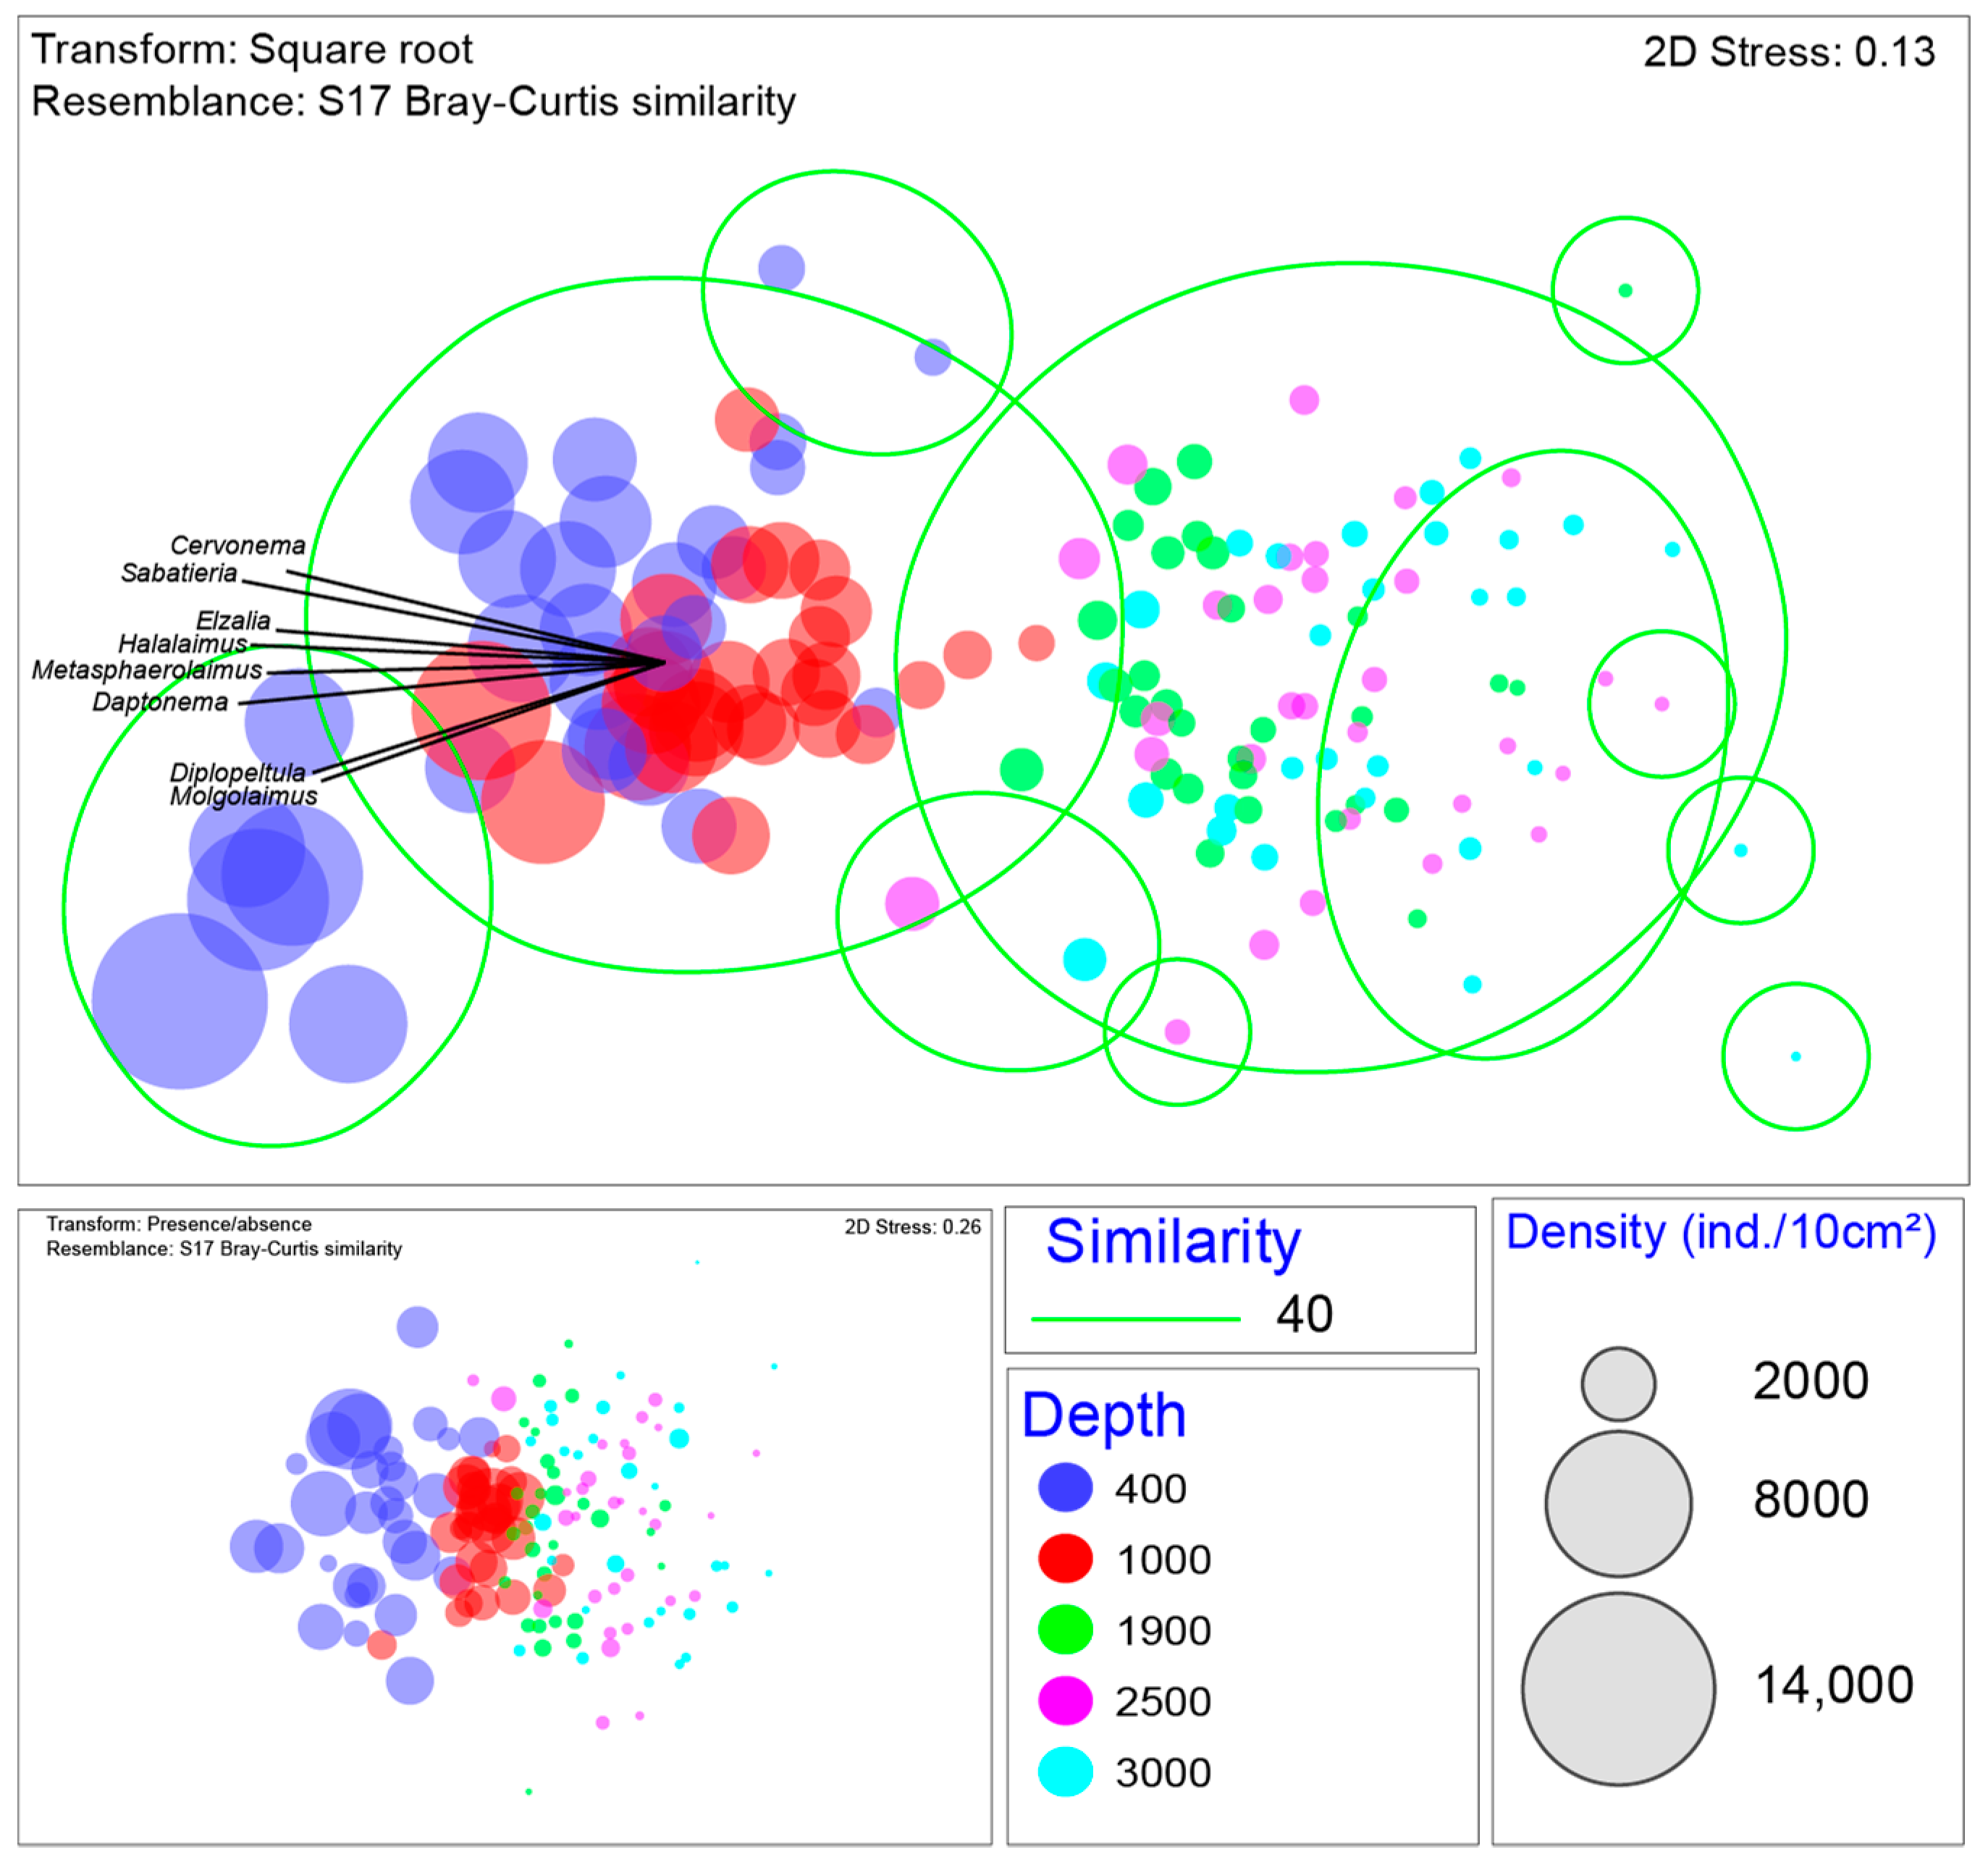
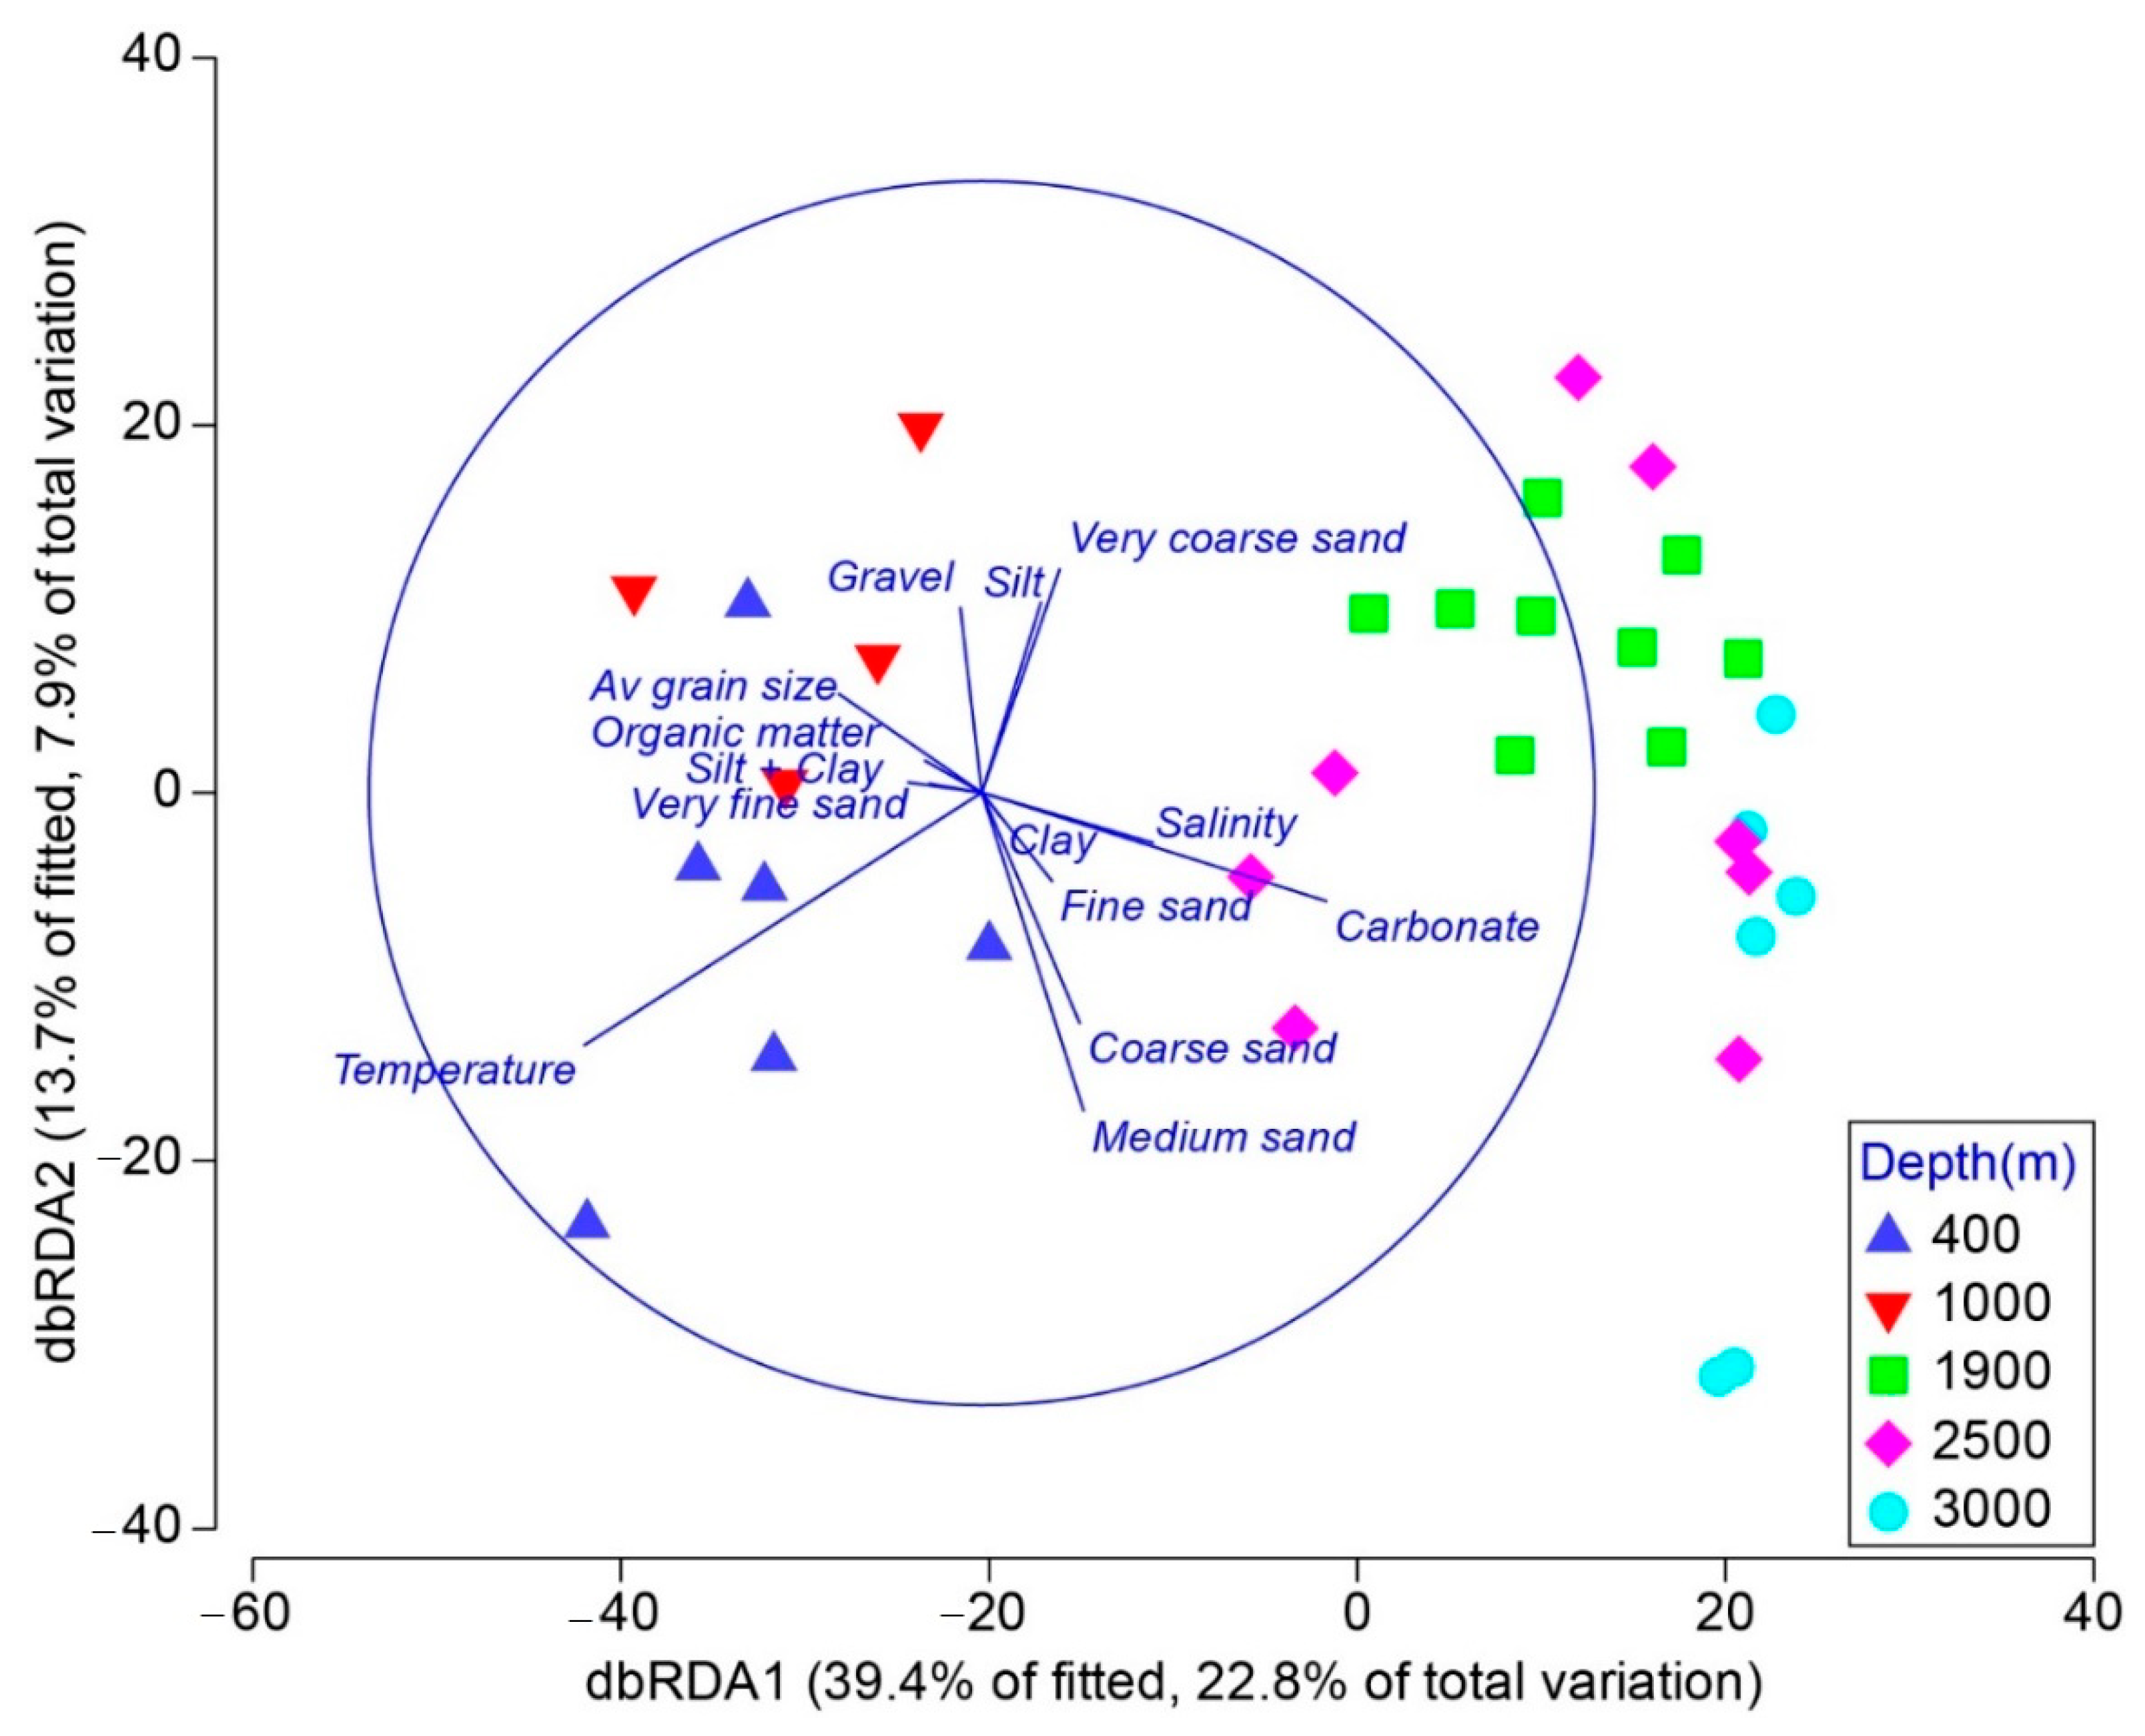
3.3. Relation of Environmental Variables with Nematode Community

The environmental variables demonstrated a significant relationship with community structure (RELATE: Rho = 0.664, p = 0.001). The DISTLM (selection procedure Best) routine indicated that the maximum cumulative variability of the environmental variables explained 58% of the total nematode community variability. All environmental variables were included in the most explanatory model fit, but it was clear that some of the finer sediment fractions had less influence on nematode community differences. Notably, temperature (14.60%), carbonate (14.93%), and the medium sand fraction (10.22%) each contributed more than 10% to total community variability explained. The dbRDA (Figure 5) shows the relationship between the environmental parameters and the nematode community structure, with a clear break between 1000 and 1900 m water depth, as well as the important role of temperature, sand, and carbonate in distinguishing between assemblages.

4. Discussion

Standing stock is one of the most important indicators of ecological conditions in marine ecosystems, and it relates to the opportunities of communities to exploit resources. Our results clearly show distinct bathymetric declines for deep-sea nematode density and biomass along the SE Brazilian Margin, with a very sharp decline of about an order of magnitude below 1000 m toward the deeper stations (1900, 2500, and 3000 m). Decreasing standing stock is a consistent bathymetric trend in many oceans worldwide and is usually directly related to decreasing food availability with depth and distance from productive coastal waters [4,16,24]. However, the tenfold decline below 1000 m appears uncommon compared to global-scale patterns and may be characteristic of specific regional, oceanographic conditions at the SSE Brazilian margin, where upwelling is particularly strong in summer and can result in higher productivity in the upper slope region [61]. In addition, short upwelling pulses may occur throughout the year [62], regularly supporting high standing stocks in the region. Effects of this upwelling have been studied in macro- and megafaunal communities [63,64,65], but this is the first time it has been found for meiofaunal organisms. The Espírito Santo Basin is typically an oligotrophic region, but with unique oceanographic and water mass conditions that may cause significant upper slope deposition of organic matter and sediments [66,67]. The area is also under the influence of a system of currents that pass through the complex topography of the coral reef complex in Abrolhos, which already has high levels of turbidity from continental or resuspended sediments. The Brazil Current splits off from the Atlantic South Equatorial Current Ocean southward, bringing warm waters down to 700 m depth and moving through the complex shelf and upper slope topography north of our sampling region. These currents may have a distinct influence on the continental shelf and slope, “redepositing” sediments. Food-enriched conditions are likely typical for upper slope and shelf-break depths, as suggested by higher organic matter concentrations in the sediment at 1900 m water depth and shallower, compared to deeper depths. When comparing nematode standing stocks for the Espírito Santo transects to global data sets, we can conclude that the upper Espírito Santo Slope supports unique high nematode densities and biomass. Mokievsky et al. [24], in their global-scale deep-sea meiobenthos/nematode study, reported 1116 ± 857 ind./10 cm2 for the 20–400 m depth interval and 832 ± 975 ind./10 cm2 for the 401–600 m depth interval, which are well below the values reported here for 400 m (3405 ind./10 cm2) and even for 1000 m depth (2542 ind./10 cm2). Our upper slope densities (400 and 1000 m water depth) are even high for the upper range of nematode densities in shelf environments [68]. The same is true for nematode biomass; biomass at 400 m and 1000 m depth in the present study (589.6 and 471.4 µg C/10 cm2, respectively, using 12.4% wwt/C conversion factor [69] is more than twice the average reported in Mokievsky et al. [24] for similar depth ranges (288.9 and 87.4 µg C/10 cm2 for 0–400 and 401–600 m water depth; and 40.8 µg C/10 cm2 for 601–3000 m water depth). In addition, the much higher standing stock observed here is likely conservatively low, given that our samples were taken with a box corer, which is known not to capture meiofauna densities as accurately as multicorer devices [24,70]. At the same time, biomass values at deeper stations are very similar to global averages as reported in Mokievsky et al. [24]. This supports the notion of very high productivity on the upper slope of the SSE Brazilian Margin relative to other margins worldwide and highlights the importance of local to regional environmental conditions, as well as oceanographic and hydrographic drivers of benthic communities.
In terms of nematode community structure, we observed a similar discrepancy between the upper (400 and 1000 m) and lower slope stations (1900, 2500, 3000 m) as we did for standing stock. This pattern is so obvious in the nMDS of Figure 4 that it scarcely needs statistical validation. There is a clear separation that seemingly correlates strongly with nematode density (size of bubble sample points). However, when performing the same analysis using presence–absence transformation, the pattern remains, implying the contrast in community structure between upper and lower slope stations is not dominated by the effect of the density of nematode genera, but their taxonomic identity (Figure 4). This suggests the presence of distinct genera assemblages between upper and lower slope stations, with a break between 1000 and 1900 m water depth, where the incline of the slope reduces toward the deeper basin. Important to note in this context is the potential influence of distinct water masses in the region, coinciding with the depths at which we sampled. At 400 m and 1000 m water depth, the previously mentioned Brazil Current region is under the influence of the South Atlantic Central Water (SACW, 300–550 m) and Antarctic Intermediate Water (AIW, 550–1200 m). Both these water masses flow northward and have distinct properties [71,72]. Between 1200 and 3500 m water depth on the other hand, the area is under the influence of the North Atlantic Deep Water, flowing southward, influencing faunal communities in the 1900–3000 m depth range at all our transects. These distinct oceanographic patterns likely influence the nematode communities and the observed contrast among the 400 m, 1000 m, and deeper stations. Searching through the literature, we found another instance where a clear bathymetric break resulted in distinguishable meiofauna and nematode communities. Tietjen [73], off the coast of North Carolina, found very distinct shallow-water (50–500 m) and deep-water (800–2500 m) communities, while showing high community affinity within each depth range. Much like the present study, sediment grain size, temperature, and nutrition sources, related to current activities, were the suggested drivers of the differences in communities. Continental margins appear to be centers of population differentiation and speciation, and this may leave a historical signal in diversity–depth trends [8], possibly explaining the distinct depth-based assemblage grouping in our results (Figure 4 and Figure 5).
Our results on structural diversity measures and functional diversity characteristics (MI and TDI) of nematode assemblages show very different patterns compared to standing stocks and community structure. A clear distinction between upper and lower slope stations was not evident. Instead, relatively uniform gradients were observed. While our analyses suggested that, in some cases, there was indeed an influence of transect or season on these gradients, they were subordinate to the factor water depth. Various studies have shown that deep-sea nematode diversity exhibits unimodal patterns with water depth [4,74]. Other studies have shown that there are no discernable bathymetric patterns in nematode deep-sea diversity. This is the case, for instance, in the Norwegian Sea (970–3294 m) [75], Bay of Biscay (2087–4725 m) [76], and a number of samples in the North Atlantic and Caribbean Sea [77]. In some cases, a regular decline of diversity with increasing depth was observed [78]. In almost all these cases, an important link between diversity and productivity or food availability was present. Of particular importance in the productivity–diversity context is the finding by Leduc et al. [74] that the relationship between diversity and productivity is dynamic in that, on either end of the productivity scale, diversity is suppressed. On the other hand, at intermediate productivity levels, other factors such as disturbance or habitat heterogeneity support higher diversity levels. We considered whether this may be the case at the SSE Brazil Margin, i.e., that the 1900–3000 m depth range is characterized by productivity that can be considered intermediate sensu Leduc et al. [74] when placed on a global deep-sea productivity scale. Nematode biomass values are indeed very low, and total organic matter levels at the lower slope in the present study are also reminiscent of a very oligotrophic system, suggesting that diversity in the deep parts of our study area may be depressed. However, we find the contrary, whereby diversity increases toward greater water depths, despite the oligotrophic conditions of the Espírito Santo basin. This was also demonstrated by Netto et al. [25] who reported significantly higher nematode diversity at a site at about 890 m compared to a slope site at 215 m off the SE coast of Brazil, but their study was limited to two stations shallower than 1000 m only.
Total organic matter levels and nematode diversity between 1900 and 3000 m in the study region are similar to those found in the oligotrophic eastern Mediterranean deep sea [79], which lie at the extreme low-productivity end of the unimodal model presented by Leduc et al. [74]. We propose that the unimodal diversity–productivity (or diversity–depth) model still holds, but that our sampling scale in the Espírito Santo basin presents a cut-off view of the full-scale picture. While the basin is indeed oligotrophic, we did not sample further ESE toward abyssal depths, where productivity is likely even lower, and where diversity may be more depressed as a result of extreme oligotrophy. Expanding sampling further east to deeper depths may reveal a decline in diversity rather than a continued increase, i.e., adding a descending arm to the unimodal curve, which is currently only represented by the ascending arm and the peak in the study system. Another distinct possibility is that the intense and frequent upwelling of nutrient-rich waters to the upper slope and shelf area removes resources from the deeper waters in the region, exacerbating the oligotrophy there. In addition, seafloor heterogeneity and topography may have had a positive effect on the diversity levels observed, but we have no information on detailed seafloor patchiness and heterogeneity to assert that possibility. Moreover, it would be very interesting to study the potential effect of the E–W-orientated seamount chain that lies immediately north to the study area. Seamounts are known to enhance local seafloor diversity [80,81,82].
The ecological theory that supports the presence of high biodiversity levels in the deep sea [4,7] can be used to explain our observations. The stability–time hypothesis proposes that the environmental calm of the deep sea can lead to specialized biological interactions and competitive niche diversification [83]. In addition, the patch mosaic model suggests that small-scale disturbances may cause successional sequences of assemblages that are out of phase, as well as spatial heterogeneity, thereby increasing overall diversity [84]. We also propose that the same principles may apply to the functional nematode diversity in the system. The increasing maturity index and trophic diversity index with increasing depth within the Espírito Santo basin suggests an infauna that is well adapted to the food-poor conditions. Specialized taxa that are able to persist in such conditions (high MI) and exploit the limited food supply through niche diversification (high TDI) may explain sustained high functional diversity, as well as high taxonomic diversity. This stands in contrast to the upper slope observations where high productivity has likely led to an opportunistic, abundant infaunal community dominated by fewer taxa, possibly influenced by presence of low-oxygen conditions through organic enrichment and increased consumption and respiration. The correlations (>0.7) between nematode genera and the sample distances in the nMDS (Figure 4) illustrate this, with for instance Sabatieria (a colonizer with c–p value 2, generally known to indicate disturbed and organically enriched sediments) being dominant (>20% of the nematode community) at 400 and 1000 m water depth, compared to <4% in the 1900–3000 m depth range. In addition, the lower MI values in the upper slope areas may be indicative of disturbance caused by the intense blooms at times of upwelling and the subsequent organic matter deposition to the seabed. Opportunistic and more resilient taxa generally show a positive response to such conditions. Soetaert and Heip [85] explained dominance by Sabatieria (9.3–21.6%) in shelf break, slope, and canyon sediments (compared to deeper slope, abyss and hadal areas with only 1.0% Sabatieria) by greater amounts of organic matter entering suboxic and anoxic regions of the sediment. Sabatieria is notorious for thriving in hypoxic and near-anoxic conditions.
We must also note that all diversity measures showed significant positive relationships with increasing water depth, except for genus richness. It is likely that this is in part a consequence of the typically sparser distribution of taxa in the deep sea compared to shallower waters. While all samples were of equal surface area and volume, the nematode densities in the samples were significantly different between the upper and lower slope, possibly affecting the number of taxa observed in each sample aliquot (150 nematodes picked from each sample) owing to differences in taxon distributions between the shallower and deeper stations. This is recognized as a potential sample size or rarity effect on diversity and is often mitigated by using rarefaction methods or equivalent (for instance, EG(51) [58]), a problem that was recognized for the deep sea decades ago [86]. While sample genus richness was, therefore, lower at the lower slope and into the abyssal depth range, the other diversity measures suggest that diversity and evenness (as opposed to a pure richness measure based on 150 nematodes) are higher at the deeper stations.
Our data suggest that the overall diversity and equitability of the nematode assemblages increase with water depth in the study area. This aligns with our observation of increased functional diversity, and indeed the maturity of the nematode assemblages. In addition, all the functional parameters showed significant differences in dispersion of values for water-depth groups (see PERMDISP, Table 3), suggesting that these values are very variable depending on the water depth. This can be seen in Figure 3, where the shallow station values exhibit more variability. This likely relates to increased habitat heterogeneity over the scale of sampling or more likely increased patchiness in the immediate sampling area. This is particularly noticeable for density and biomass, and for TDI to an extent.
What is clear is that relationships among abundance, biomass, diversity, and productivity can be found, and these are additionally driven by patterns in heterogeneity and patch dynamics, sediment structure, and variables such as oxygen and temperature (which themselves also relate to productivity and the magnitude and speed of degradation of sinking organic matter since it governs bacterial activity). Illustrating the close relationship between nematode diversity and productivity or resource availability in the deep sea are the elevated densities and diversity found along the ice margin in the Norwegian Sea [87], and in the equatorial Pacific, where a region of high productivity translates into high nematode density and diversity at abyssal depths [88]. In the Mediterranean, the same patterns can be observed: decreasing density and diversity from west to east, as well as with increasing depth, which are associated with decreasing gradients of productivity and, hence, availability of food resources [89,90]. Further diversity suppressants can be increased hydrodynamic disturbance (areas with frequent benthic storms, active canyon areas), enhanced organic matter and nutrient load (see Mississippi delta outflow, and some canyon regions and trenches), and reduced oxygen availability such as found in oxygen minimum zones. In that context, the greater functional heterogeneity found in the upper slope region, as shown by the PERMDISP results, particularly at 400 m, may illustrate increased patchiness and enhanced disturbance regimes (likely owing to upwelling blooms and subsequent organic matter load, and potentially current and water mass dynamics). These lead to distinct variability in density, biomass, and trophic diversity at the shallow 400 and 1000 m stations, possibly affecting structural diversity/evenness negatively.
Our results clearly show distinct bathymetric patterns for structural and functional nematode characteristics along the deep-sea transects in the study area, and combined environmental-community analysis (Figure 5) suggests substantial environmental influences unique to the region of the Espírito Santos basin, its upwelling regime, hydrodynamics, and topographic identity. Previous studies within the same research program have shown distinct regional patterns with a north–south contrast according to macrofauna [26]. We did not find evidence for this specific pattern using nematodes (no convincing N–S transect differences, although community structure in the most southern transect (A) was somewhat different compared to all other transects), but our upper–lower slope contrast (E–W orientation) does relate to important environmental factors such as temperature, grain size, carbonate levels, and others. Overall, a significant relationship was found between the environmental parameters and the nematode communities and this is expressed along the bathymetric gradient, with a distinct upper–lower slope contrast most likely fueled by intense and frequent upwelling. Temperature differences are an obvious driver and related to the different water masses and hydrographic patterns that are present in the study area [62,71,72].

5. Conclusions

We demonstrated for the first time that the upwelling pulses that occur throughout the year in the Espírito Santo Bay support a high standing stock of meiofauna, beyond what was previously known for macro- and megafauna. When compared to deep-sea datasets from around the world, nematode density and biomass along the Espírito Santo upper slope are exceptionally high. Deeper stations along the slope, by contrast, harbor nematode standing stocks that are within the range of values reported from other deep-sea locations worldwide. These findings underscore the idea that the upper slope of the SSE Brazilian margin comprises a highly productive area and, together with information on water mass characteristics and movements, emphasizes the importance of regional environmental drivers of benthic communities. Upper and lower slope nematode communities were distinguished by very different abundance and biomass values, declining an order of magnitude between 1000 and 1900 m water depth. This distinction was also noted in nematode community structure, with a clear break between 1000 and 1900 m. In contrast, taxonomic and functional diversity (including evenness as a component of structural and functional diversity) gradually increased with water depth. The higher values of these indices at deeper stations indicate that the infauna of this oligotrophic habitat is well adapted to low food availability, likely related to niche diversification and low colonization potential and/or resilience to “disturbance” in the broadest sense. Ecological principles such as the stability–time hypothesis and the patch mosaic model support our observations of diversity and functional increase with water depth in this deep-sea environment. The upper slope communities, by contrast, were dominated by opportunistic “colonizer” taxa, suggesting greater disturbance levels and possible greater habitat heterogeneity as a result. In conclusion, the Espírito Santo Bay slope is characterized by clear relationships between productivity and infaunal communities, whereby standing stock and diversity are driven by local- to regional-scale heterogeneity while adhering to ecological principles that explain high deep-sea diversity and function.

Supplementary Materials

The following are available online at https://www.mdpi.com/1424-2818/12/12/485/s1, Table S1: PERMANOVA pairwise comparisons for community structure, and structural and functional parameters of the nematode community.

Author Contributions

Conceptualization, G.A.P.d.S., A.C.S., J.I.; Data curation, G.A.P.d.S., A.C.S., P.F.N., Y.V., J.I.; Formal analysis, G.A.P.d.S., J.I.; Funding acquisition, G.A.P.d.S., A.M.E., V.P.R.-F.; Investigation, G.A.P.d.S., A.C.S., P.F.N., Y.V., J.I.; Methodology, G.A.P.d.S., A.C.S., V.P.R.-F., J.I.; Project administration, G.A.P.d.S., A.M.E., V.P.R.-F.; Resources, G.A.P.d.S., A.M.E., V.P.R.-F.; Software, G.A.P.d.S., J.I.; Supervision, G.A.P.d.S., A.M.E.; Validation, G.A.P.d.S., J.I.; Visualization, G.A.P.d.S., J.I.; Writing—original draft, G.A.P.d.S., A.C.S., J.I.; Writing—review & editing, G.A.P.d.S., A.C.S., A.M.E., Y.V., J.I. All authors have read and agreed to the published version of the manuscript.

Funding

This research was funded, designed and executed by CEMPES/Petrobras, under the AMBES (Espírito Santo Basin Assessment) project. This study was financed in part by the National Council for Scientific and Technological Development (CNPq-Brazil) with a master grant to A.C.S. and a research fellowship (CNPq 310249/2019-8) to A.M.E.

Acknowledgments

The authors would gratefully aknowledge the CENPES/Petrobras (Centro de Pesquisas, Desenvolvimento e Inovação Leopoldo Américo Miguez de Mello) and the LACIMME (Laboratório de Cultivo de Invertebrados Marinhos e Ecotoxicologia) crew for their support during the AMBES project. We would also like to thank the three anonymous reviewers and the special issue editors for thorough and constructive feedback on the manuscript.

Conflicts of Interest

The authors declare no conflict of interest.

References

  1. Thurber, A.R.; Sweetman, A.K.; Narayanaswamy, B.E.; Jones, D.O.B.; Ingels, J.; Hansman, R.L. Ecosystem function and services provided by the deep sea. Biogeosciences 2014, 11, 3941–3963. [Google Scholar] [CrossRef] [Green Version]
  2. Danovaro, R.; Snelgrove, P.V.; Tyler, P. Challenging the paradigms of deep-sea ecology. Trends Ecol. Evol. 2014, 29, 465–475. [Google Scholar] [CrossRef]
  3. Snelgrove, P.V.; Thrush, S.F.; Wall, D.H.; Norkko, A. Real world biodiversity–ecosystem functioning: A seafloor perspective. Trends Ecol. Evol. 2014, 29, 398–405. [Google Scholar] [CrossRef]
  4. Rex, M.A.; Etter, R.J. Deep-Sea Biodiversity: Pattern and Scale; Harvard University Press: Cambridge, MA, USA, 2010; 354p. [Google Scholar]
  5. Rex, M.A.; Etter, R.J.; Morris, J.S.; Crouse, J.; McClain, C.R.; Johnson, N.A.; Stuart, C.T.; Deming, J.W.; Thies, R.; Avery, R. Global bathymetric patterns of standing stock and body size in the deep-sea benthos. Mar. Ecol. Prog. Ser. 2006, 317, 1–8. [Google Scholar] [CrossRef] [Green Version]
  6. Rosli, N.; Leduc, D.; Rowden, A.A.; Probert, P.K. Review of recent trends in ecological studies of deep-sea meiofauna, with focus on patterns and processes at small to regional spatial scales. Mar. Biodivers. 2018, 48, 13–34. [Google Scholar] [CrossRef]
  7. Snelgrove, P.V.R.; Smith, C.R. A riot of species in an environmental calm: The paradox of the species-rich deep-sea floor. In Oceanography and Marine Biology; Gibson, R.N., Barnes, M., Atkinson, R.J.A., Eds.; Taylor & Francis Ltd.: London, UK, 2002; Volume 40, pp. 311–342. [Google Scholar]
  8. Levin, L.A.; Dayton, P.K. Ecological theory and continental margins: Where shallow meets deep. Trends Ecol. Evol. 2009, 24, 606–617. [Google Scholar] [CrossRef]
  9. Sarmiento, J.L.; Gruber, N. Sinks for anthropogenic carbon. Phys. Today 2002, 55, 30–36. [Google Scholar] [CrossRef]
  10. Harris, P.T.; Whiteway, T. Global distribution of large submarine canyons: Geomorphic differences between active and passive continental margins. Mar. Geol. 2011, 285, 69–86. [Google Scholar] [CrossRef]
  11. McClain, C.R.; Barry, J.P. Habitat heterogeneity, disturbance, and productivity work in concert to regulate biodiversity in deep submarine canyons. Ecology 2010, 91, 964–976. [Google Scholar] [CrossRef]
  12. Shank, T.M. Seamounts Deep-Ocean Laboratories of Faunal Connectivity, Evolution, and Endemism. Oceanography 2010, 23, 108–122. [Google Scholar] [CrossRef] [Green Version]
  13. Giere, O. Meiobenthology: The Microscopic Motile Fauna of Aquatic Sediments, 2nd ed.; Springer: Berlin, Germany, 2009. [Google Scholar]
  14. Ingels, J.; Tchesunov, A.V.; Vanreusel, A. Meiofauna in the Gollum Channels and the Whittard Canyon, Celtic Margin--how local environmental conditions shape nematode structure and function. PLoS ONE 2011, 6, e20094. [Google Scholar] [CrossRef] [Green Version]
  15. Ingels, J.; Vanreusel, A. The importance of different spatial scales in determining structural and functional characteristics of deep-sea infauna communities. Biogeosciences 2013, 10, 4547–4563. [Google Scholar] [CrossRef] [Green Version]
  16. Soltwedel, T. Metazoan meiobenthos along continental margins: A review. Prog. Oceanogr. 2000, 46, 59–84. [Google Scholar] [CrossRef]
  17. Soltwedel, T.; Grzelak, K.; Hasemann, C. Spatial and Temporal Variation in Deep-Sea Meiofauna at the LTER Observatory HAUSGARTEN in the Fram Strait (Arctic Ocean). Diversity 2020, 12, 279. [Google Scholar] [CrossRef]
  18. Ingels, J.; Vanreusel, A.; Brandt, A.; Catarino, A.I.; David, B.; De Ridder, C.; Dubois, P.; Gooday, A.J.; Martin, P.; Pasotti, F.; et al. Possible effects of global environmental changes on Antarctic benthos: A synthesis across five major taxa. Ecol. Evol. 2012, 2, 453–485. [Google Scholar] [CrossRef]
  19. Zeppilli, D.; Sarrazin, J.; Leduc, D.; Arbizu, P.M.; Fontaneto, D.; Fontanier, C.; Gooday, A.J.; Kristensen, R.M.; Ivanenko, V.N.; Sørensen, M.V.; et al. Is the meiofauna a good indicator for climate change and anthropogenic impacts? Mar. Biodivers. 2015, 45, 505–535. [Google Scholar] [CrossRef] [Green Version]
  20. Zeppilli, D.; Leduc, D.; Fontanier, C.; Fontaneto, D.; Fuchs, S.; Gooday, A.J.; Goineau, A.; Ingels, J.; Ivanenko, V.N.; Kristensen, R.M.; et al. Characteristics of meiofauna in extreme marine ecosystems: A review. Mar. Biodivers. 2018, 48, 35–71. [Google Scholar] [CrossRef] [Green Version]
  21. Danovaro, R.; Gambi, C.; Dell’Anno, A.; Corinaidesi, C.; Fraschetti, S.; Vanreusel, A.; Vincx, M.; Gooday, A.J. Exponential decline of deep-sea ecosystem functioning linked to benthic biodiversity loss. Curr. Biol. 2008, 18, 1–8. [Google Scholar] [CrossRef]
  22. Moens, T.; Braeckman, U.; Derycke, S.; Fonseca, G.; Gallucci, F.; Gingold, R.; Guilini, K.; Ingels, J.; Leduc, D.; Vanaverbeke, J.; et al. Ecology of free-living nematodes. In Handbook of Zoology; Schmidt-Rhaesa, A., Ed.; De Gruyter: Berlin, Germany, 2013; Volume 2, pp. 109–152. [Google Scholar]
  23. Schratzberger, M.; Ingels, J. Meiofauna matters: The roles of meiofauna in benthic ecosystems. J. Exp. Mar. Biol. Ecol. 2018, 502, 12–25. [Google Scholar] [CrossRef]
  24. Mokievsky, V.O.; Udalov, A.A.; Azovskii, A.I. Quantitative distribution of meiobenthos in deep-water zones of the World Ocean. Oceanology 2007, 47, 797–813. [Google Scholar] [CrossRef]
  25. Netto, S.A.; Gallucci, F.; Fonseca, G.F.C. Meiofauna communities of continental slope and deep-sea sites off SE Brazil. Deep Sea Res. Part I Oceanogr. Res. Pap. 2005, 52, 845–859. [Google Scholar] [CrossRef]
  26. Bernardino, A.F.; Berenguer, V.; Ribeiro-Ferreira, V.P. Bathymetric and regional changes in benthic macrofaunal assemblages on the deep Eastern Brazilian margin, SW Atlantic. Deep Sea Res. Part I Oceanogr. Res. Pap. 2016, 111, 110–120. [Google Scholar] [CrossRef]
  27. Almada, G.V.D.B.; Bernardino, A.F. Conservation of deep-sea ecosystems within offshore oil fields on the Brazilian margin, SW Atlantic. Biol. Conserv. 2017, 206, 92–101. [Google Scholar] [CrossRef]
  28. Mokievsky, V.; Azovsky, A. Re-evaluation of species diversity patterns of free-living marine nematodes. Mar. Ecol. Prog. Ser. 2002, 238, 101–108. [Google Scholar] [CrossRef] [Green Version]
  29. Vanreusel, A.; Fonseca, G.; Danovaro, R.; da Silva, M.C.; Esteves, A.M.; Ferrero, T.; Gad, G.; Galtsova, V.; Gambi, C.; Genevois, V.D.; et al. The contribution of deep-sea macrohabitat heterogeneity to global nematode diversity. Mar. Ecol. Evol. Perspect. 2010, 31, 6–20. [Google Scholar] [CrossRef] [Green Version]
  30. Ingels, J.; Billett, D.S.M.; Kiriakoulakis, K.; Wolff, G.A.; Vanreusel, A. Structural and functional diversity of Nematoda in relation with environmental variables in the Setúbal and Cascais canyons, Western Iberian Margin. Deep Sea Res. Part II Top. Stud. Oceanogr. 2011, 58, 2354–2368. [Google Scholar] [CrossRef]
  31. Vanaverbeke, J.; Steyaert, M.; Vanreusel, A.; Vincx, M. Nematode biomass spectra as descriptors of functional changes due to human and natural impact. Mar. Ecol. Prog. Ser. 2003, 249, 157–170. [Google Scholar] [CrossRef]
  32. Levin, L.A. Oxygen minimum zone benthos: Adaptation and community response to hypoxia. Oceanogr. Mar. Biol. 2003, 41, 1–45. [Google Scholar]
  33. Danovaro, R.; Carugati, L.; Corinaldesi, C.; Gambi, C.; Guilini, K.; Pusceddu, A.; Vanreusel, A. Multiple spatial scale analyses provide new clues on patterns and drivers of deep-sea nematode diversity. Deep Sea Res. Part II Top. Stud. Oceanogr. 2013, 92, 97–106. [Google Scholar] [CrossRef]
  34. Gambi, C.; Vanreusel, A.; Danovaro, R. Biodiversity of nematode assemblages from deep-sea sediments of the Atacama Slope and Trench (South Pacific Ocean). Deep Sea Res. Part I Oceanogr. Res. Pap. 2003, 50, 103–117. [Google Scholar] [CrossRef]
  35. Román, S.; Vanreusel, A.; Ingels, J.; Martin, D. Nematode community zonation in response to environmental drivers in Blanes Canyon (NW Mediterranean). J. Exp. Mar. Biol. Ecol. 2018, 502, 111–128. [Google Scholar] [CrossRef]
  36. Danovaro, R.; Gambi, C.; Lampadariou, N.; Tselepides, A. Deep-sea nematode biodiversity in the Mediterranean basin: Testing for longitudinal, bathymetric and energetic gradients. Ecography 2008, 31, 231–244. [Google Scholar] [CrossRef]
  37. Román, S.; Lins, L.; Ingels, J.; Romano, C.; Martin, D.; Vanreusel, A. Role of spatial scales and environmental drivers in shaping nematode communities in the Blanes Canyon and its adjacent slope. Deep Sea Res. Part I Oceanogr. Res. Pap. 2019, 146, 62–78. [Google Scholar] [CrossRef]
  38. Leduc, D.; Rowden, A.A.; Pilditch, C.A.; Maas, E.W.; Probert, P.K. Is there a link between deep-sea biodiversity and ecosystem function? Mar. Ecol. 2013, 34, 334–344. [Google Scholar] [CrossRef]
  39. Bianchelli, S.; Gambi, C.; Pusceddu, A.; Danovaro, R. Trophic conditions and meiofaunal assemblages in the Bari Canyon and the adjacent open slope (Adriatic Sea). Chem. Ecol. 2008, 24, 101–109. [Google Scholar] [CrossRef]
  40. Gambi, C.; Danovaro, R. Biodiversity and life strategies of deep-sea meiofauna and nematode assemblages in the Whittard Canyon (Celtic margin, NE Atlantic Ocean). Deep Sea Res. Part I Oceanogr. Res. Pap. 2016, 108, 13–22. [Google Scholar] [CrossRef]
  41. França, R.L.; Del Rey, A.C.; Tagliari, C.V.; Brandão, J.R.; Fontanelli, P.R. Bacia do Espírito Santo. Bol. Geociências Petrobras 2007, 15, 501–509. [Google Scholar]
  42. Boland, G.S.; Rowe, G.T. Deep-sea benthic sampling with the GOMEX box corer. Limnol. Oceanogr. 1991, 36, 1015–1020. [Google Scholar] [CrossRef]
  43. Somerfield, P.J.; Warwick, R.M. Meiofauna Techniques, Methods for the Study of Marine Benthos; John Wiley & Sons, Ltd.: Hoboken, NJ, USA, 2013; pp. 253–284. [Google Scholar]
  44. Somerfield, P.J.; Warwick, R.M.; Moens, T. Meiofauna techniques. In Methods for the Study of Marine Benthos; Eleftheriou, E., McIntyre, A., Eds.; Blackwell Science Ltd.: Oxford, UK, 2005; pp. 229–272. [Google Scholar]
  45. De Grisse, A.T. Redescription ou modification de quelques techniques utilisées dans l’étude des nématodes phytoparasitaires. Meded. Rijks Fak. Landbowwetenschappen Gent 1969, 34, 351–369. [Google Scholar]
  46. Cobb, N.A. Notes on Nemas. Contrib. A Sci. Nematol. 1917, 5, 117–128. [Google Scholar]
  47. Platt, H.M.; Warwick, R.M. Free-Living Marine Nematodes. Part I. British Enoplids: Pictorial Key to World Genera and Notes for the Identification of British Species; Cambridge University Press: Cambridge, UK, 1983. [Google Scholar]
  48. Platt, H.M.; Warwick, R.M. Free-Living Marine Nematodes. Part II. British Chromadorids: Pictorial Key to World Genera and Notes for the Identification of British Species; Brill, E.J., Ed.; W. Backhuys: Leiden, The Netherlands, 1988. [Google Scholar]
  49. Warwick, R.M.; Platt, H.M.; Somerfield, P.J. Free-Living Marine Nematodes Part III. Monohysterids. Synopses of the British Fauna (New Series); Field Studies Council: Shrewsbury, MA, USA, 1998; Volume 53, p. 296. [Google Scholar]
  50. Guilini, K.; Bezerra, T.; Eisendle-Flöckner, U.; Deprez, T.; Fonseca, G.; Holovachov, O.; Leduc, D.; Miljutin, D.; Moens, T.; Sharma, J. NeMys: World Database of Free-Living Marine Nematodes. 2016. Available online: http://nemys.ugent.be (accessed on 24 June 2016).
  51. Wieser, W. Beziehungen zwischen Mundhöhlengestalt, Ernährungsweise und Vorkommen bei freilebenden marinen Nematoden. Ark. Zool. 1953, 2, 439–484. [Google Scholar]
  52. Bongers, T. The maturity index: An ecological measure of environmental disturbance based on nematode species composition. Oecologia 1990, 83, 14–19. [Google Scholar] [CrossRef]
  53. Bongers, T.; Alkemade, R.; Yeates, G.W. Interpretation of disturbance-induced maturity decrease in marine nematode assemblages by means of the maturity index. Mar. Ecol. Prog. Ser. 1991, 76, 135–142. [Google Scholar] [CrossRef]
  54. Bongers, T.; Ferris, H. Nematode community structure as a bioindicator in environmental monitoring. Trends Ecol. Evol. 1999, 14, 224–228. [Google Scholar] [CrossRef]
  55. Suguio, K. Introdução a Sedimentologia; Edgard Blucher/EDUSP: Sao Paulo, Brazil, 1973; p. 317. [Google Scholar]
  56. Hedges, J.L.; Stern, J.H. Carbon and nitrogen determination of carbonate-containing solids. Limnol. Oceanogr. 1984, 29, 657–663. [Google Scholar] [CrossRef]
  57. Clarke, K.R.; Gorley, R.N. PRIMER v7: User Manual/Tutorial; PRIMER-E: Plymouth, UK, 2015. [Google Scholar]
  58. Heip, C.; Herman, P.; Soetaert, K. Indices of Diversity and Evenness. Oceanis 1998, 24, 61–87. [Google Scholar]
  59. Bongers, T. The Maturity Index, the evolution of nematode life history traits, adaptive radiation and cp-scaling. Plant Soil 1999, 212, 13–22. [Google Scholar] [CrossRef]
  60. Andrassy, I. The determination of volume and weight of nematodes. Acta Zool. Acad. Sci. Hung. 1956, 2, 1–15. [Google Scholar]
  61. Valentin, J. The Cabo Frio Upwelling System, Brazil, Coastal Marine Ecosystems of Latin America; Springer: Berlin, Germany, 2001; pp. 97–105. [Google Scholar]
  62. Schmid, C.; Schäfer, H.; Zenk, W.; Podestá, G. The Vitória eddy and its relation to the Brazil Current. J. Phys. Oceanogr. 1995, 25, 2532–2546. [Google Scholar] [CrossRef] [Green Version]
  63. De Léo, F.C.; Pires-Vanin, A.M.S. Benthic megafauna communities under the influence of the South Atlantic Central Water intrusion onto the Brazilian SE shelf: A comparison between an upwelling and a non-upwelling ecosystem. J. Mar. Syst. 2006, 60, 268–284. [Google Scholar] [CrossRef]
  64. Sumida, P.Y.G.; Yoshimaga, M.Y.; Ciotti, A.M.; Gaeta, S.A. Benthic response to upwelling events off the SE Brazilian coast. Mar. Ecol. Prog. Ser. 2005, 291, 35–42. [Google Scholar] [CrossRef]
  65. Quintana, C.O.; Bernardino, A.F.; de Moraes, P.C.; Valdemarsen, T.; Sumida, P.Y.G. Effects of coastal upwelling on the structure of macrofaunal communities in SE Brazil. J. Mar. Syst. 2015, 143, 120–129. [Google Scholar] [CrossRef]
  66. Carreira, R.S.; Araújo, M.P.; Costa, T.L.F.; Ansari, N.R.; Pires, L.C.M. Lipid biomarkers in deep sea sediments from the Campos Basin, SE Brazilian continental margin. Org. Geochem. 2010, 41, 879–884. [Google Scholar] [CrossRef]
  67. Yoshinaga, M.Y.; Sumida, P.Y.G.; Wakeham, S.G. Lipid biomarkers in surface sediments from an unusual coastal upwelling area from the SW Atlantic Ocean. Org. Geochem. 2008, 39, 1385–1399. [Google Scholar] [CrossRef]
  68. Mokievsky, V.O.; Udalov, A.A.; Azovsky, A.I. On the quantitative distribution of meiobenthos on the shelf of the world ocean. Oceanology 2004, 44, 99–109. [Google Scholar]
  69. Jensen, P. Measuring carbon content in nematodes. Helgol. Meeresunters. 1984, 38, 83–86. [Google Scholar]
  70. Bett, B.J.; Vanreusel, A.; Vincx, M.; Soltwedel, T.; Pfannkuche, O.; Lambshead, P.J.D.; Gooday, A.J.; Ferrero, T.; Dinet, A. Sampler Bias in the Quantitative Study of Deep-Sea Meiobenthos. Mar. Ecol. Prog. Ser. 1994, 104, 197–203. [Google Scholar] [CrossRef]
  71. Durrieu De Madron, X.; Weatherly, G. Circulation, transport and bottom boundary layers of the deep currents in the Brazil Basin. J. Mar. Res. 1994, 52, 583–638. [Google Scholar] [CrossRef]
  72. Stramma, L.; England, M. On the water masses and mean circulation of the South Atlantic Ocean. J. Geophys. Res. Oceans 1999, 104, 20863–20883. [Google Scholar] [CrossRef]
  73. Tietjen, J.H. Ecology and distribution of deep-sea meiobenthos off North-Carolina. Deep Sea Res. 1971, 18, 941–957. [Google Scholar] [CrossRef]
  74. Leduc, D.; Rowden, A.A.; Bowden, D.A.; Probert, P.K.; Pilditch, C.A.; Nodder, S.D. Unimodal relationship between biomass and species richness of deep-sea nematodes: Implications for the link between productivity and diversity. Mar. Ecol. Prog. Ser. 2012, 454, 53–64. [Google Scholar] [CrossRef] [Green Version]
  75. Jensen, P. Nematode Assemblages in the Deep-Sea Benthos of the Norwegian Sea. Deep Sea Res. 1988, 35, 1173–1184. [Google Scholar] [CrossRef]
  76. Dinet, A.; Vivier, M.H. Le meiobenthos abyssal du Golfe de Gascogne II. Les peuplements de nématodes et leur diversité spécifique. Cah. Biol. Mar. 1979, 18, 109–123. [Google Scholar]
  77. Lambshead, P.J.D.; Tietjen, J.; Ferrero, T.; Jensen, P. Latitudinal diversity gradients in the deep sea with special reference to North Atlantic nematodes. Mar. Ecol. Prog. Ser. 2000, 194, 159–167. [Google Scholar] [CrossRef] [Green Version]
  78. Grzelak, K.; Kotwicki, L.; Hasemann, C.; Soltwedel, T. Bathymetric patterns in standing stock and diversity of deep-sea nematodes at the long-term ecological research observatory HAUSGARTEN (Fram Strait). J. Mar. Syst. 2017, 172, 160–177. [Google Scholar] [CrossRef]
  79. Danovaro, R.; Fabiano, M.; Dellacroce, N. Labile organic matter and microbial biomass in deep-sea sediments (Eastern Mediterranean Sea). Deep Sea Res. Part I Oceanogr. Res. Pap. 1993, 40, 953–965. [Google Scholar] [CrossRef]
  80. Clark, M.R.; Bowden, D.A. Seamount biodiversity: High variability both within and between seamounts in the Ross Sea region of Antarctica. Hydrobiologia 2015, 761, 161–180. [Google Scholar] [CrossRef] [Green Version]
  81. Zeppilli, D.; Bongiorni, L.; Cattaneo, A.; Danovaro, R.; Santos, R.S. Meiofauna assemblages of the Condor Seamount (North-East Atlantic Ocean) and adjacent deep-sea sediments. Deep Sea Res. Part II Top. Stud. Oceanogr. 2013, 98, 87–100. [Google Scholar] [CrossRef] [Green Version]
  82. Zeppilli, D.; Bongiorni, L.; Serrão Santos, R.; Vanreusel, A. Changes in Nematode Communities in Different Physiographic Sites of the Condor Seamount (North-East Atlantic Ocean) and Adjacent Sediments. PLoS ONE 2014, 9, e115601. [Google Scholar] [CrossRef] [Green Version]
  83. Sanders, H.L. Benthic marine diversity and stability-time hypothesis. Brookhaven Symp. Biol. 1969, 22, 71–80. [Google Scholar]
  84. Grassle, J.F.; Sanders, H.L. Life histories and role of disturbance. Deep Sea Res. 1973, 20, 643–659. [Google Scholar]
  85. Soetaert, K.; Heip, C. Nematode assemblages of deep-sea and shelf break sites in the North-Atlantic and Mediterranean-Sea. Mar. Ecol. Prog. Ser. 1995, 125, 171–183. [Google Scholar] [CrossRef]
  86. Sanders, H.L. Marine benthic diversity: A comparative study. Am. Nat. 1968, 102, 243–282. [Google Scholar] [CrossRef]
  87. Fonseca, G.; Soltwedel, T. Deep-sea meiobenthic communities underneath the marginal ice zone off Eastern Greenland. Polar Biol. 2007, 30, 607–618. [Google Scholar] [CrossRef]
  88. Lambshead, P.J.D.; Brown, C.J.; Ferrero, T.J.; Mitchell, N.J.; Smith, C.R.; Hawkins, L.E.; Tietjen, J. Latitudinal diversity patterns of deep-sea marine nematodes and organic fluxes—A test from the central equatorial Pacific. Mar. Ecol. Prog. Ser. 2002, 236, 129–135. [Google Scholar] [CrossRef]
  89. Danovaro, R.; Croce, N.D.; Eleftheriou, A.; Fabiano, M.; Papadopoulou, N.; Smith, C.; Tselepides, A. Meiofauna of the deep Eastern Mediterranean Sea: Distribution and abundance in relation to bacterial biomass, organic matter composition and other environmental factors. Prog. Oceanogr. 1995, 36, 329–341. [Google Scholar] [CrossRef]
  90. Danovaro, R.; Dinet, A.; Duineveld, G.; Tselepides, A. Benthic response to particulate fluxes in different trophic environments: A comparison between the Gulf of Lions-Catalan Sea (western-Mediterranean) and the Cretan Sea (eastern-Mediterranean). Prog. Oceanogr. 1999, 44, 287–312. [Google Scholar] [CrossRef]
Figure 1. Bathymetric map of the sampling area in the Espírito Santo (ES) Basin, with the five bathymetric transects (A–E), each with stations at five different depths: 400 m (1); 1000 m (2); 1900 m (3); 2500 m (4) 3000 m (5) (Qgis Software 3.4.4.).
Diversity 12 00485 g001
Figure 2. Linear regressions for structural diversity parameters along the bathymetric gradient, with R-value and significance level. Error bars on mean values denote standard errors.
Diversity 12 00485 g002
Figure 3. Linear regressions for functional nematode parameters along the bathymetric gradient. MI: maturity Index; TDI: trophic diversity index. Density is expressed in ind./10 cm2; biomass is expressed in µg wet weight/10 cm2. Error bars denote standard errors.
Diversity 12 00485 g003
Figure 4. nMDS (non-metric multidimensional scaling) based on nematode community structure indicating clear separation between the upper slope (400, 1000 m) and lower slope (1900, 2500, 3000 m) stations. Bubble sizes suggest distinct communities according to density of the nematode genera, but presence–absence transformation (removal of density influence) supports the same upper–lower slope contrast in community structure (lower left insert) based on distinct nematode genera assemblage differences.
Diversity 12 00485 g004
Figure 5. dbRDA (Distance-based redundancy analysis) showing community structure patterns related to the environmental parameters measured. Community patterns are based on square-root transformation of data and Bray–Curtis similarity measures.
Diversity 12 00485 g005
Table 1. Mean (   X ¯ ) and standard deviation (SD) values of environmental variables (types of sand: very coarse, coarse, medium, fine, very fine (%), average grain size (Phi), silt (%), gravel (%), clay (%), temperature (°C), carbonate (%), and organic matter (%) found at depths of 400, 1000, 1900, 2500, and 3000 m).
CampaignWater Depth
4001000190025003000
X ¯ SD X ¯ SD X ¯ SD X ¯ SD X ¯ SD
Average grain size15.640.826.050.385.780.744.660.714.590.46
26.020.736.620.845.740.594.960.695.070.50
Gravel1 0.0000.0010.0010.0010.0000.0000.0000.0000.0000.000
2 0.0010.0010.0000.0000.0020.0010.0020.0010.0000.000
Very coarse sand1 0.0020.0020.0010.0000.0020.0000.0020.0010.0020.001
2 0.0030.0030.0020.0010.0030.0010.0050.0020.0020.001
Coarse sand1 0.0050.0070.0030.0010.0090.0020.0200.0070.0190.009
2 0.0090.0090.0060.0020.0100.0020.0280.0170.0270.015
Medium sand1 0.0220.0340.0110.0040.0300.0030.1020.0450.0860.042
2 0.0300.0360.0220.0070.0330.0090.1260.0940.1300.080
Fine sand1 0.0870.0970.0180.0090.0420.0050.1340.0430.1150.037
2 0.0820.0870.0350.0160.0450.0180.1410.0730.1470.091
Very fine sand1 0.1100.0800.0340.0220.0380.0080.1070.0410.1080.020
2 0.1030.0620.0480.0250.0400.0150.1080.0630.1010.044
Total sand 1 0.2260.1940.0670.0330.1220.0160.3660.1090.3310.103
2 0.2260.1780.1130.0460.1310.0410.4090.2180.4060.228
Silt1 0.5030.2440.6230.1040.6920.0520.4220.1750.4870.110
2 0.5200.1800.6240.0470.6280.1370.4170.2030.4430.287
Clay1 0.2700.0550.3100.1280.1860.0560.2130.0900.1820.019
2 0.2530.1130.2630.0500.2400.1740.1730.0470.1500.071
Total organic matter1 1.3230.3251.3030.4481.140.4740.6790.2720.8950.257
2 1.4480.4081.6080.4651.3460.1740.2710.2711.0220.216
Carbonate1 35.10522.59919.09810.73952.8183.01153.41016.03047.97541.548
2 37.71110.94431.8078.15466.41719.60756.4995.59073.22719.217
Salinity134.9780.06434.3840.02234.9390.00534.7920.23734.8810.0143
234.9800.06034.3890.01834.9370.00634.9120.00634.8920.004
Temperature1 11.3620.4503.8850.1193.7630.1072.7130.1172.4330.058
2 11.2920.5333.8100.1713.7880.0312.9570.2882.3000.122
Table 2. Average structural and functional nematode community parameters. GR: genus richness; EG(51): expected number of genera based on 51 individuals; H’: Shannon–Wiener diversity (log e); N1, N2, Ninf: Hill’s diversity numbers; TDI: trophic diversity index; MI: maturity index; density (ind./10 cm2); biomass (µg wet weight/10 cm2).
Water Depth (m)GREG(51)H’N1N2NinfTDIMIDensityBiomass
40045.2720.903.0121.0812.115.040.622.5534064755.12
100047.0021.003.0621.8712.845.190.662.5525423801.94
190040.8722.423.1223.1614.746.190.702.72318467.37
250036.6721.623.1022.4015.566.900.662.76286385.42
300037.5222.443.1223.1215.756.970.692.77236330.63
Table 3. PERMANOVA (Permutational multivariate analysis of variance) results for structural diversity indices, functional measures, and community structure using the three-way fixed model (water depth—WD, transect—TR, season—SE). Df: degrees of freedom; SS: sums of squares; MS: means of squares; P(perm): p-value based on permutational analysis; Perms: number of permutations; ECV: estimated component of variation (ECV% represents the ECV value relative to the total variation); PERMDISP: P(perm) results for homogeneity of multivariate dispersions.
Genus RichnessdfSSMSPseudo-FP(perm)Perms√ECVECVECV%PERMDISP
WD42.42 × 1036.05 × 10215.5550.000199534.407919.4323.70.891
TR41.30 × 1023.25 × 1010.835020.50419948 -0.655
SE13.98 × 1023.98 × 10210.2270.001898412.22094.93256.00.759
WD × TR161.22 × 1037.63 × 1011.95980.023099172.52796.39057.8
WD × SE41.04 × 1022.59 × 1010.665030.61849942 -
TR × SE42.61 × 1026.53 × 1011.67680.162899471.34431.8072.2
WD × TR × SE161.11 × 1036.93 × 1011.78140.044799183.225710.40512.7
Residual973.78 × 1033.89 × 101 6.238938.92447.5
Total1469.50 × 103
EG(51)
WD46.41 × 1011.60 × 1013.90890.004699510.640.416.40.083
TR45.54 × 1011.38 × 1013.37610.011899450.580.335.20.456
SE12.73 × 1012.73 × 1016.64960.011998380.560.325.00.458
WD × TR161.09 × 1026.841.66830.063999100.680.477.3
WD × SE42.23 × 1015.57 1.35880.252799350.320.101.6
TR × SE41.26 × 1013.16 0.771260.54339955
WD × TR × SE169.72 × 1016.08 1.48240.123499260.820.6810.6
Residual973.98 × 1024.10 2.024.1064.0
Total1467.92 × 102
H’
WD42.40 × 10−15.99 × 10−21.48220.212899440.030.001.10.239
TR43.84 × 10−19.60 × 10−22.37630.055799530.040.003.30.751
SE12.20 × 10−12.20 × 10−15.43770.023598290.050.004.20.879
WD × TR161.076.71 × 10−21.660.067099130.070.007.8
WD × SE41.50 × 10−13.74 × 10−20.926550.45239954
TR × SE41.12 × 10−12.80 × 10−20.69270.59489938
WD × TR × SE161.036.41 × 10−21.5870.091399240.090.0114.0
Residual973.924.04 × 10−2 0.200.0469.5
Total1467.17
N1dfSSMSPseudo-FP(perm)Perms√ECVECVECV%PERMDISP
WD49.14 × 1012.28 × 1011.3480.259599530.449670.200.80.314
TR41.84 × 1024.59 × 1012.71050.035599480.996930.993.90.727
SE11.21 × 1021.21 × 1027.14710.008498481.1961.435.60.495
WD × TR164.33 × 1022.70 × 1011.59580.087599101.3141.736.7
WD × SE48.36 × 1012.09 × 1011.2340.303599470.521450.271.1
TR × SE45.95 × 1011.49 × 1010.877420.48459955
WD × TR × SE164.66 × 1022.92 × 1011.72080.053399082.04394.1816.2
Residual971.64 × 1031.69 × 101 4.116216.94365.8
Total1463.10 × 103
N2
WD43.07 × 1027.67 × 1015.94620.000299521.47912.199.90.089
TR41.76 × 1024.39 × 1013.40230.011799541.03081.064.80.518
SE15.80 × 1015.80 × 1014.4940.038998400.786690.622.80.367
WD × TR164.41 × 1022.76 × 1012.13850.011499091.58482.5111.4
WD × SE46.23 × 1011.56 × 1011.20840.312899530.429340.180.8
TR × SE43.07 × 1017.68 0.595740.66959957
WD × TR × SE163.27 × 1022.05 × 1011.5860.086899261.6082.5911.7
Residual971.25 × 1031.29 × 101 3.591412.9058.5
Total1462.67 × 103
Ninf
WD49.45 × 1012.36 × 1018.09340.000199600.842530.7113.80.103
TR42.88 × 1017.202.46670.050699310.383110.152.80.099
SE13.083.081.05450.304598260.0467410.00220.00.536
WD × TR161.01 × 1026.322.1660.011298960.762850.5811.3
WD × SE41.98 × 1014.951.69520.157999480.373010.142.7
TR × SE45.021.260.430390.78539952
WD × TR × SE167.734.831.65520.073399250.80870.6512.7
Residual972.83 × 1022.92 1.70822.9256.6
Total1466.17 × 102
CommunitydfSSMSPseudo-FP(perm)Perms√ECVECVECV%PERMDISP
WD41.10 × 1052.75 × 10423.0080.0001989030.06903.5835.80.001
TR41.22 × 1043.04 × 1032.5380.000197457.946163.142.50.001
SE14.24 × 1034.24 × 1033.5440.000198776.467541.8291.70.758
WD × TR163.79 × 1042.37 × 1031.9780.0001960714.151200.257.9
WD × SE47.73 × 1031.93 × 1031.6140.000197707.101350.4292.0
TR × SE46.55 × 1031.64 × 1031.3680.004497685.494330.1871.2
WD × TR × SE162.09 × 1041.31 × 1031.0910.086495766.101637.231.5
Residual971.16 × 1051.20 × 103 34.61197.247.4
Total1463.16 × 105
Density
WD42.72 × 1086.79 × 10774.3990.000199521515.702297500.0053.50.001
TR42.14 × 1075.36 × 1065.87360.00029935390.58152550.003.60.003
SE13.68 × 1063.68 × 1064.03370.04399849195.0038025.000.90.296
WD × TR168.54 × 1075.34 × 1065.84850.00019928870.01756910.0017.6
WD × SE48.76 × 1062.19 × 1062.39930.04629956295.9787598.002.0
TR × SE46.38 × 1061.60 × 1061.74850.14299953216.4646856.001.1
WD × TR × SE161.09 × 1076.81 × 1050.746030.75929921
Residual978.85 × 1079.13 × 105 955.35912690.0021.3
Total1464.93 × 108
Biomass
WD45.52 × 1081.38 × 10869.1930.000199572158.74.66 × 10656.70.001
TR43.82 × 1079.55 × 1064.79350.00129956509.152.59 × 1053.20.0055
SE11.62 × 1071.62 × 1078.1120.00469835441.161.95 × 1052.40.049
WD × TR161.07 × 1086.70 × 1063.36140.00039893897.128.05 × 1059.8
WD × SE42.55 × 1076.38 × 1063.20140.01559953548.523.01 × 1053.7
TR × SE45.37 × 1061.34 × 1060.674010.61939936
WD × TR × SE162.18 × 1071.36 × 1060.682450.80839918
Residual971.93 × 1081.99 × 106 1411.61.99 × 10624.3
Total1469.55 × 108
TDIdfSSMSPseudo-FP(perm)Perms√ECVECVECV%PERMDISP
WD40.0944380.02360911.5820.000199500.0271997.40 × 10−420.00.0082
TR40.00817140.00204291.00210.410499490.000385591.49 × 10−70.00.245
SE10.0128130.0128136.28530.013298510.0121641.48 × 10−44.00.3828
WD × TR160.0689360.00430852.11350.013299160.0197043.88 × 10−410.5
WD × SE40.00135950.000339870.166720.95579952
TR × SE40.00556430.00139110.68240.60119953
WD × TR × SE160.0507790.00317371.55690.100299260.0197063.88 × 10−410.5
Residual970.197740.0020385 0.045152.04 × 10−355.0
Total1460.44222
MI
WD41.41230.3530824.5760.000199630.107781.16 × 10−234.40.0026
TR40.183010.0457523.18460.016699600.0328081.08 × 10−33.20.0501
SE10.204780.2047814.2540.000798390.0511372.62 × 10−37.80.0163
WD × TR160.608170.038012.64570.002599210.0635944.04 × 10−312.0
WD × SE40.0383320.00958310.667040.61199949
TR × SE40.0509840.0127460.887190.47339948
WD × TR × SE160.199220.0124510.866680.60999938
Residual971.39360.014367 0.119861.44 × 10−242.6
Total1464.1575
Publisher’s Note: MDPI stays neutral with regard to jurisdictional claims in published maps and institutional affiliations.

