Article

Genetic Diversity and Population Structure of Bermudagrass [Cynodon dactylon (L.) Pers.] along Latitudinal Gradients and the Relationship with Polyploidy Level

1
College of Animal and Veterinary Science, Henan Agricultural University, Zhengzhou 450002, China
2
College of Animal Science and Technology, Yangzhou University, Yangzhou 225000, China
*
Authors to whom correspondence should be addressed.
Diversity 2019, 11(8), 135; https://doi.org/10.3390/d11080135
Submission received: 5 July 2019 / Revised: 2 August 2019 / Accepted: 12 August 2019 / Published: 14 August 2019
(This article belongs to the Section Plant Diversity)

Abstract

:
Understanding the population genetic pattern and process of gene flow requires a detailed knowledge of how landscape characteristics structure populations. Although Cynodon dactylon (L.) Pers. (common bermudagrass) is widely distributed in the world, information on its genetic pattern and population structure along latitudinal gradients is limited. We tried to estimate the genetic diversity and genetic structure of C. dactylon along a latitudinal gradient across China. Genetic diversity among different ploidy levels was also compared in the study. The material used consisted of 296 C. dactylon individuals sampled from 16 geographic sites from 22°35′ N to 36°18′ N. Genetic diversity was estimated using 153 expressed sequence tag-derived simple sequence repeat (EST-SSR) loci. Higher within-population genetic diversity appeared at low-latitude, as well as having positive correlation with temperature and precipitation. The genetic diversity increased with the ploidy level of C. dactylon, suggesting polyploidy creates higher genetic diversity. No isolation by distance and notable admixture structure existed among populations along latitudes. Both seed dispersal (or vegetative organs) and extrinsic pollen played important roles for gene flow in shaping the spatial admixture population structure of C. dactylon along latitudes. In addition, populations were separated into three clusters according to ploidy levels. C. dactylon has many such biological characters of perennial growth, wind-pollination, polyploidy, low genetic differentiation among populations, sexual and asexual reproduction leading to higher genetic diversity, which gives it strong adaptability with its genetic patterns being very complex across all the sampled latitudes. The findings of this study are related to landscape population evolution, polyploidy speciation, preservation, and use of bermudagrass breeding.

1. Introduction

Understanding genetic variation distribution over latitudinal gradients has been a central interest of population genetics in evolutionary biology, molecular ecology, and other related disciplines. Genetic variation of individuals and genetic differentiation among populations have been caused in history by adaptation to the environment and population processes. The processes include genetic drift, migration, dispersal, and gene flow [1], which are traditionally assayed using neutral genetic tools such as microsatellite markers [2,3]. Genetic diversity has been applied in genetic studies in a lot of plant species, which will be beneficial for genetic improvement. Higher temporal resolution can be provided using population genetic sampling and measures for detecting genetic relationships within continuously distributed populations in a landscape gradient [4,5]. Different levels of genetic diversity may occur in response to local different population size and habitat [6].
Bermudagrass (Cynodon dactylon (L.) Pers.), a polyploid, highly clonal reproductive, outcrossing and perennial herbaceous plant, is a warm-season grass with a cosmopolitan distribution used as turf, forage, soil conservation, and remediation of contaminated soils [7,8,9]. Study of the genetic diversity for C. dactylon is essential for evaluation, selection, and breeding of grass germplasm. Wu et al. (2004) observed the obvious geographical distribution of genetic variation of C. dactylon accessions among 11 different countries in Asia, Africa, Australia, and Oceania [10]. In addition, some ecological and distribution patterns were correlated with the ploidy levels of C. dactylon [11,12]. Expressed sequence tag-simple sequence repeats (EST-SSR) have been used to analyze the genetic diversity of 690 Cynodon accessions [13,14]. The study of DNA profiling to discriminate between genetically different Cynodon plants, the variety, and hybrid is well documented [10,12,15,16,17,18,19,20,21]. Often, such analyses are based on sampling by artificial accessions for germplasm evaluation rather than wild individuals for landscape population genetics and are intended to inform germplasm conservation of accessions and variety development. This well-known lag between germplasm management, such as conservation and breeding, and population spatial genetic study often makes it challenging to interpret how to discover and utilize the resource. Only by depending on many factors to illustrate genetic pattern and structure along environmental gradients, may global genetic information of such wild germplasm resources be more strongly represented.
C. dactylon is geographically distributed along latitudes of 45° N and 45° S, penetrating to approximately 53° N in Europe [7] and distributing to the south of the Yellow River Valley in China [22], thus being very suitable for studying its widespread landscape genetics along latitudinal gradients. Most studies have focused on assessing the degree of genetic relatedness of Cynodon accessions, however, little research has been conducted to assess genetic variations within natural C. dactylon along different latitudes. From the standpoint of wild germplasm resource, successful utilization of germplasm of widespread species needs a good understanding of the distribution of genetic variation for populations of the species, which will be also helpful to illustrate the landscape genetic adaptable mechanism of widespread plant species. So here, the objective of our study was to assess (1) the within-population genetic diversity of Cynodon and the existing effect by latitude; (2) the relationship between ploidy levels and genetic diversity; (3) the spatial genetic structure and gene flow along latitude. Identification of the genetic diversity within these collections of Cynodon via EST-SSR is fundamental for use in molecular characterization, the ecological evolution of plant genetic resources, and marker-assisted selection.

2. Materials and Methods

2.1. Plant Materials and EST-SSR Amplification

Plant material in this study consisted of 16 populations with 296 Cynodon dactylon individuals, sampled at 16 locations between 22°35′ N and 36°18′ N in China. The geographic origin for all genotypes used in this study is available in Figure 1. Total annual precipitation, mean annual temperature, and annual maximum and minimum temperature were provided by the China Meteorological Administration for the collection locations of the plants. A total of 40 primer pairs were screened across a subset of 16 populations of Cynodon germplasm collection. PCR products were stably amplified by 20 primer pairs in the 16 populations (Table 1). The EST-SSR primer pairs were prepared for this study from the publications of Harrisshultz (2010), Jewell et al. (2012) [23,24]. Genomic DNA was extracted using a Zymo Research Plant DNA Extraction Kit (Xinmaijie, Zhengzhou, China) and DNA concentration was determined using a NanoDropTM 2000 (Thermo Fisher Scientific, Victoria, Australia). The DNA quality was checked by 1% agarose gel.
PCR reactions were conducted in a 96-well PCR plate in a Verity 96-well DNA Engine Thermal Cycler (ABI, Vernon, CA, USA). The SSR PCR chemical mixtures (25 μL in total) consisted of 17.8 μL of nuclease-free water, 2.5 μL of 10 × reaction buffer, 2 μL of 25 mM MgCl2, 0.5 μL of 10 mM deoxynucleoside triphosphate (dNTP), 0.5 μL of forward primer, 0.5 μL of reverse primer, 0.2 μL of Taq DNA polymerase and 1 μL of template DNA. Two multiplex PCR reactions were performed based on the program: as for multiplex PCR reaction 1, 1 cycle of 3 min at 95 °C, then 10 cycles of 30 s at 95 °C, 60 °C and 72 °C respectively, finally terminating with 1 cycle of 6 min at 72 °C; for multiplex PCR reaction 2, 1 cycle of 3 min at 95 °C, then 20 cycles of 30 s at 95 °C, 55 °C, and 72 °C respectively, finally terminating with 1 cycle of 6 min at 72 °C. After that, reaction products were run on a 3730XL Genetic Analyzer (ABI, USA) and relative results were analyzed by using GeneMapper Software Version 4.0 (Applied Biosystems, Foster City, CA, USA) for capillary electrophoresis analysis.
Ploidy levels of all individuals were determined using a flow cytometer (Cube8, Partec, Germany) at the Henan Academy of Agricultural Sciences. Ploidy level was detected by using the method for propidium iodide (PI) and the pea (Pisum sativum L.) (2C = 9.76 pg) [25] leaves were used as an internal reference standard for the relative ploidy level measurements.

2.2. Genetic Diversity of C. dactylon along a Latitude Gradient

Genetic variation was calculated for both populations and groups based on the EST-SSR loci against the following parameters: the proportion of polymorphic loci (P), Nei’s gene diversity index (He), and the Shannon diversity index (I). All these genetic diversity parameters were generated by the POPGENE V. 1.32 Software [26]. All the individuals from 16 populations were separated into four groups by latitude from south to north. In order to compare the genetic diversity among different ploidy levels, we determined the ploidy levels of the sampled individuals and all individuals belonging to the same ploidy level were treated as one population to calculate the genetic diversity parameters as described above. The significant differences in genetic diversity parameters among the four groups with four populations within one group and different ploidy levels were evaluated under a one-way analysis of variance with EST-SSR loci (1 and 0 data) as replicates by Duncan’s test [27] using SAS 9.3 software (Institute Inc., Cary, NC, USA). Significant differences in the study were accepted at the 0.05 level of probability.

2.3. Correlation Analyses between Genetic Indexes and other Environmental Parameters

Correlation analysis between genetic distances and geographical origins of different latitude populations was investigated by the Mantel test [28] using NTSYSpc version 2.0. Both the Pearson and Spearman correlation coefficients between the intra-population genetic diversity and environmental parameters (temperature and rainfall) were calculated based on the bivariate test in SPSS 11.5 (SPSS, Chicago, IL, USA) for Windows. The probabilities for the significance of these correlation coefficients were determined using Bonferroni inequality adjustment.

2.4. Separation and Cluster Analysis among all Populations of C. dactylon

Analyses of molecular variance (AMOVA) and principal coordinates (PCoA) for genetic variation at different latitudinal and ploidy levels were both performed in GenAlEx Version 6.1 [29]. The significance for the variance components of the analysis was based on 999 permutations. The samples from 16 populations were grouped according to their similarity using NTSYS V.2.1(Applied Biostatistics Inc., NY, USA) (Numerical Taxonomy and Multivariate Analysis System) [30], and then the pairwise genetic distances between four groups, separated by four latitudinal gradients, were calculated using the unweighted pair-group method using arithmetic averages (UPGMA).

2.5. Structure Model and Inferred Ancestry Population of Individuals

Bayesian clustering and population modeling were both performed by using a STRUCTURE V.2.3 as described by (Hubisz et al. 2009) [31,32]. Two approaches were used to determine the best K value. One was use of L (K): When K approaches a true value, L (K) plateaus (or continues increasing slightly) and has high variance between runs [33]. Second was use of an ad hoc quantity (ΔK): Calculated based on the second order rate of change of the likelihood (ΔK) [34]. The ΔK shows a clear peak at the true value of K. ΔK = m([LK])/s[L(K)]. The best-fitting K was identified using a nonparametric test (Wilcoxon rank test) according to the differences of ΔL(K) between two subsequent K as described in Evanno et al. (2010) [34]. Two main models (admixture and prior population information) were used to infer ancestry of individuals and details of the method were described by Yan et al. (2010) [35]. The origin of individuals was identified by comparing their pre-defined population identity, and the relationship was then mapped in the structured populations [36]. In addition, we used the prior population information model to study whether each individual in the study had its immigrant ancestor in the last G generations (G = 0: an immigrant with a single parent by pollen dispersal; G = 1: an immigrant by seed dispersal).

3. Results

3.1. Intra-Population Genetic Diversity along Latitude

A total of 153 informative EST-SSR loci were generated across 296 indicviduals from 16 populations using twenty primers, with an average of 7.7 alleles for each pair of primers. The parameters of genetic diversity showed that PPB of C. dactylon populations ranged from 33.33% to 59.48%, the Nei’s diversity index from 0.1086 to 0.1858, and the Shannon diversity index from 0.1663 to 0.2833. In general, no obvious linear trend was observed between genetic diversity and latitude (Table 2). However, an upward trend of higher within-population genetic diversity can be found at low latitude (Figure 2). After four groups were separated by latitude, we observed that the highest genetic diversity appeared within the group at low latitude and in contrast three other groups accordingly had lower values (Table 3). As for the relationship between genetic diversity and climate, positive correlation coefficients were observed between He and annual average temperature, annual maximum temperature, annual minimum temperature and annual average precipitation with values of 0.5999, 0.6395, 0.5751, and 0.5099, respectively.
In order to explore the effect of ploidy level, we compared the genetic diversity among five ploidy levels and found that genetic diversity (He and I) of C. dactylon increased along with ploidy level. C. dactylon individuals with higher ploidy level showed significantly higher diversity values (Table 4). Diploid showed the lowest, triploid and tetraploid were identically higher, and pentaploid and hexaploid had identically the highest genetic diversity.

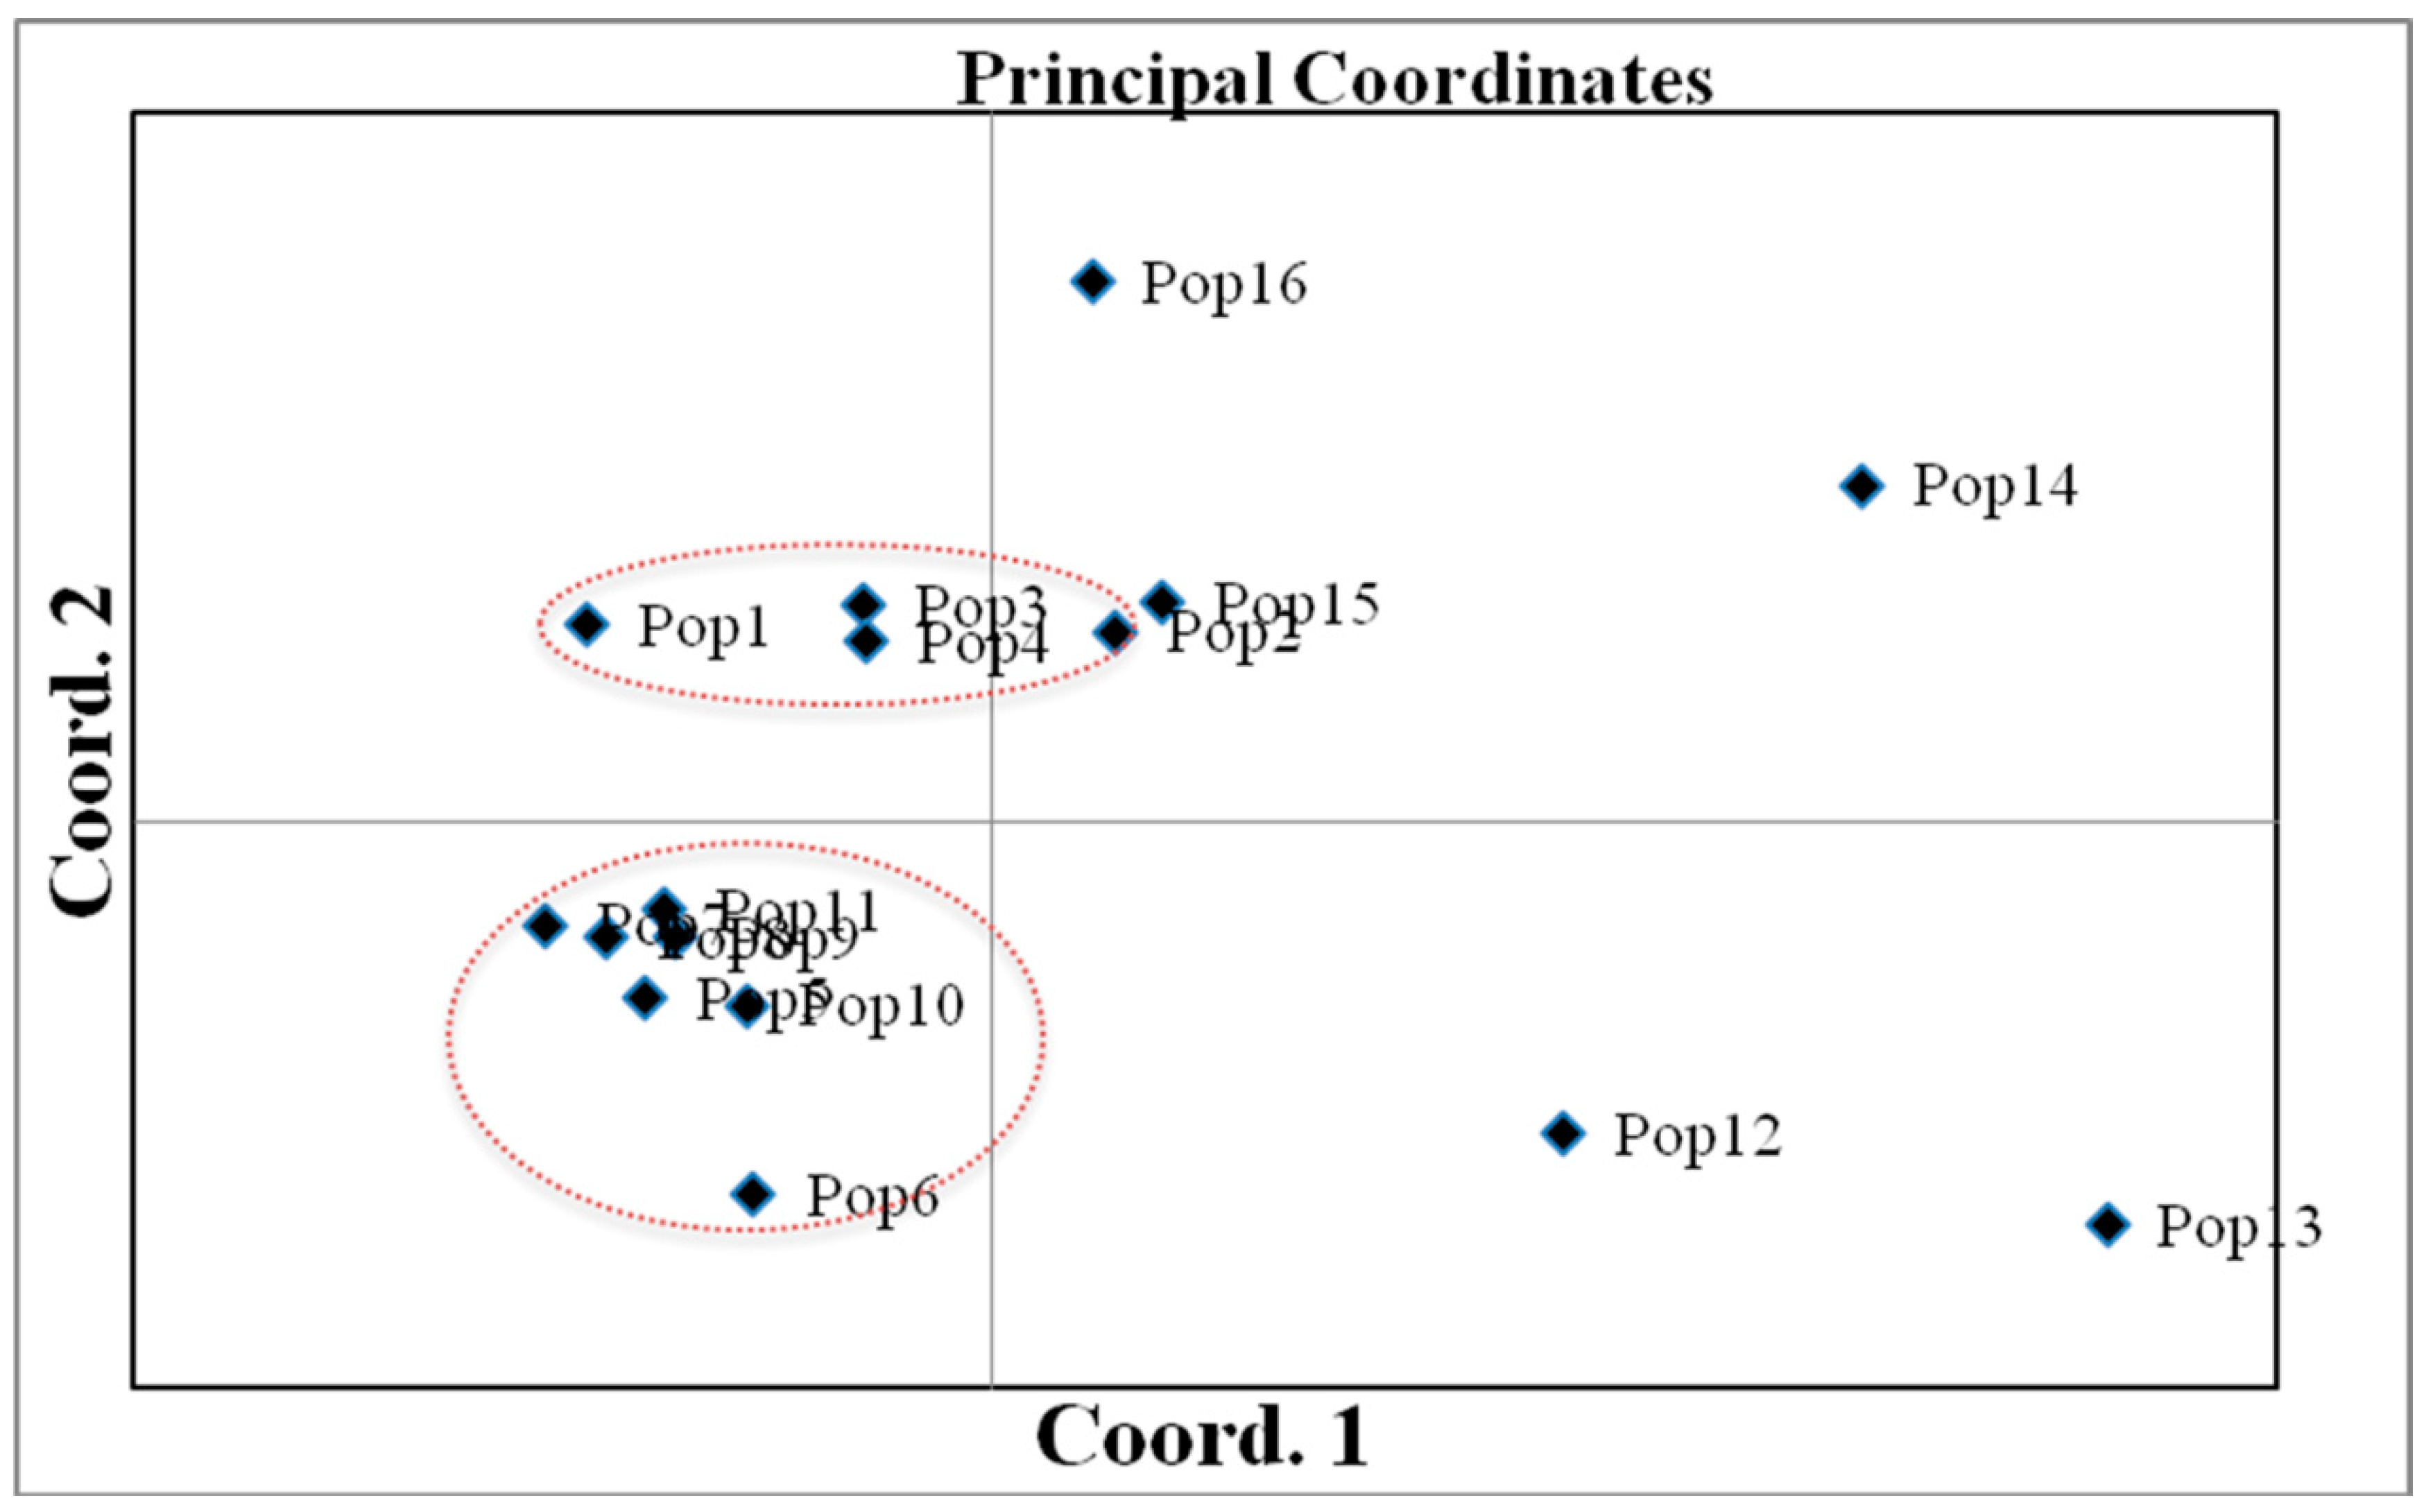
3.2. Genetic Differentiation and Clustering among Populations

The estimated variance values were 3.125 (~20%) among populations and 12.541 (~80%) within populations (total value: 15.667) based on the analysis of molecular variance (AMOVA), and no significant differentiation among populations (p > 0.001) was observed, in accordance with the wind-pollination outcrossing system (Table 5). Based on the Mantel tests, genetic distance matrices were not positively correlated with geographical distance matrix (r = 0.4005, p = 0.9998), which suggested no significant isolation by distance among different latitudinal populations. Principal coordinate analysis (PCoA) revealed that there could be low genetic differentiation among populations (Figure 3). The first axis explained 6.7% of the variation, and the second axis 6.4% of the variation in the PCoA analysis.
The groups of different ploidy levels were clustered into three major clusters of C. dactylon based on the results of unweighted pair-group method of arithmetic averages (UPGMA) dendrogram analysis. The first cluster contained the group of pentaploid and hexaploid, while the second cluster contained the groups of triploid and tetraploid while diploid individuals formed one cluster (Figure 4). From the clustering and intra-population genetic diversity among different ploidy levels, this genetic pattern suggested that every chromosome duplication process leading to higher ploidy level of C. dactylon could increase the genetic diversity.

3.3. Genetic Structure and Gene Flow among Populations

The coefficient of gene differentiation Gst for all the populations in the study was 0.2370. Higher gene flow occurred among populations with the value of 1.6097 based on the formula of Nm = 0.5(1 − Gst)/Gst. In order to select an appropriate K value for all the populations, we used the admixture model of STRUCTURE program to conduct these separate calculations from K = 1 to K = 26 (Table 6). The estimated logarithm of probability of the data [lnPr(X|K)] was maximum for K values and the posterior probability of having only one population was K. When K approaches a true value, L (K) (log(p)) plateaus (or continues increasing slightly) and has high variance between runs [33]. Therefore, structure was performed on the whole data set, estimates of ln P(D) and Delta K suggesting that K = 3 was in alignment with requirements of the correct maximum population for C. dactylon. The result and admixture of 16 populations from K = 2–11 (Figure 5) strongly indicated admixture genetic structure in populations of C. dactylon and stronger admixture can be observed along with the latitude except within the two populations No. 5 and 11.
As an admixture structure existed in C. dactylon, the STRUCTURE program tested whether each individual in the study had an immigrant ancestor in the last G generations with the K = 16 running parameter (Figure 6). However, from the dynamics in structuring C. dactylon populations (K = 2 to 11), individuals at high latitude (populations of 12 to 16) showed relatively stable clustering and stronger admixture was observed among populations at low and medium latitudes. We made a comparison of admixture at K = 2 and K = 3 and observed that population No. 12 was differentiated from southern populations. An immigrant ration map was constructed according to the probability and inferred ancestry population (p >threshold) for each individual of C. dactylon (Figure 7). Low-latitude populations were highly admixed for both generation back = 0 and 1, however, individuals from the extremely medium- and high-latitude populations were comparatively homologous (Figure 6 and Figure 7). In general, both seed dispersal (or vegetative organs for bermudagrass) and extrinsic pollen played some important roles for gene flow in shaping the spatial population structure of C. dactylon along latitudes.

4. Discusstion

4.1. Genetic Diversity along Latitudinal Gradients and Relationship with Polyploidy

According to our result of higher diversity at low latitude, as well as its positive correlation with temperature and precipitation, it indicated that higher temperature and precipitation at low latitude will be important factors for shaping the genetic diversity pattern along the latitude and beneficial for higher genetic diversity of C. dactylon. The reproductive strategy, selection, and demography of species have an impact on genome-wide diversity [37]. C. dactylon can grow perennially with very wide distribution and reproduce viably by sexual wind-pollination and asexual stolon. A sexual reproduction could lead to increased heterozygosity because new mutations remain without chromosome segregation with a heterozygous state—the so-called Meselson effect [38,39]. A recent genome-wide analysis also revealed that genetic diversity of asexual species significantly increased because of a reduced efficacy in purifying selection [40], which was in agreement with the theoretical rule. The finding in this study suggests that more sexual reproduction of C. dactylon may occur at low latitude, which is valuable as a confirmation in the next research. The mating system has been postulated to be one important sexual reproduction factor that shapes the genetic diversity in plant species [41]. Outcrossing and self-incompatibility play important roles in the maintenance of a high amount of genetic variability of species [42]. The long-lived herbaceous habit can provide more opportunity to accumulate mutation and may contribute to a high amount of diversity [43]. From the fact that widespread species may be related with a higher level of genetic variability [44], C. dactylon has such many biological characters leading to higher genetic diversity, which gives it strong adaptability and its genetic patterns are very complex across all the sampled latitudes. Nevo (1998) also emphasized the function of ecological factors in shaping the distribution of genetic diversity [45]. Therefore, wind-pollination C. dactylon may grow perennially and produce a great many seeds with a higher outcrossing rate to maintain higher genetic diversity because of the high precipitation and the temperature at low latitude. From the adaptation to the environment, increased genetic variation at low latitude provides the genetic basis for the adaptability of C. dactylon to a high temperature and humidity habitat. The habitats and the exploitation of the wild resources of C. dactylon with high levels of genetic variation at lower latitude should be paid more attention to.
In addition, the genetic diversity increased with the ploidy level of C. dactylon according to our study as polyploidization is expected to increase genetic variability. Polyploidy can create higher diversity among Cynodon accessions by increasing band frequency of molecular markers (r = 0.62, p < 0.001) [46]. Gulsen et al. (2005) and Budak et al. (2005) found richer genetic variation at higher ploidy levels among buffalo grasses [Buchloedactyloides (Nutt.) Engelm.] [47,48]. In addition, higher adaptability in hexaploid buffalo grasses could be also explained by gene diversification of polyploidy [49]. However in cases where the origin of sterile polyploids (e.g., 3×, 5× cytotypes) in the native range, higher level of ploidy may also cause the population genetic diversity of the Bermuda buttercup (Oxalis pes-caprae) decrease. Much reduced levels of genetic diversity in the populations of polyploidy Bermuda buttercup are most probably caused by bottlenecks and near exclusive clonal propagation [50]. Higher genetic diversity of bermudagrass individuals with higher ploidy levels in this study could give polyploidy plant species significant advantages for adaptation, competence and even invasiveness to variable environments. From these facts above, polyploidization as well as increased genetic diversity may be the genetic mechanisms for the wide-spreading ability while genetic diversity contributes to the ability to respond to different environments. C. dactylon individuals with higher ploidy level showed larger morphological size suitable for forage production, in contrast, those with lower ploidy level had smaller size for turfgrass utilization [51]. Therefore, from the result, polyploidy could be a very efficient tool in forage and turf grass breeding of C. dactylon.

4.2. Genetic Differentiation and Structure among Populations

It is important to know the distribution of diversity within and among populations of a species, because it is useful for the preservation of genetic diversity [52]. In this study, no significant differentiation (~20%)among populations and isolation by distance were observed by the AMOVA and Mantel analyses, respectively (p > 0.001), in accordance with the wind-pollination outcrossing system and not showing a high genetic differentiation caused by different latitudes, indicating that the latitude interval cannot be an obstacle to genetic exchange. High levels of genetic variation within populations are common situations, because out-crossing and vegetative propagated perennial species are generally highly heterozygous [53,54]. Cross-pollination resulting in gene flow among natural populations may prevent formation of differentiated genetic groups. In addition, the differentiation coefficient in this study was also similar to 0.175% [55] and 29.93% [56] in other related studies. Coexisting of many generations in a population of bermudagrass, caused by clonal and sexual propagation, is insusceptible to genetic drift and is helpful in maintaining genetic diversity and low genetic differentiation [57]. After a STRUCTURE analysis, evidence of admixture indicates that some hybridization and introgression must have occurred in the past. Both seed dispersal (or vegetative organs for bermudagrass) and extrinsic pollen played some important roles for gene flow showing a significant influence on shaping the spatial population structure of C. dactylon along latitudes. Therefore, the lack of strong association between geographic origin and genetic variation may be attributed to the outcross mating system by pollen and vegetative materials through human activities. Introduction of the crop plant to different latitudes allows selection of new mutations to adapt to different environments that soon establish geographic races [58]. Long-term isolated populations may gradually diverge [59], so anciently introduced populations are more likely to show higher genetic divergence from their ancestors. Apart from these facts, low genetic differentiation among populations and admixed genetic structuring in our study imply that the contemporary C. dactylon along different latitudes can consist of native individuals, ancient introductions, and recent introductions [60]. C. dactylon is perennial, widespread, and competitive with both sexual wind-pollination and asexual stolon reproduction under wild environment. Genetic admixture of divergent intraspecific lineages is increasingly suspected to be helpful for the success of colonizing populations [61]. From the facts, low genetic differentiation and admixture population genetic structure may be other genetic mechanisms of adaptation to such an adverse and complex environment.
The results of this study indicated that the distinct genetic divergence of Cynodon presented between the lower ploidy level and the higher ploidy level. A different chromosome number could cause reproductive isolation from the parental taxa, so polyploidy more likely provides an obvious route to the rapid emergence of new species [62]. In addition, introgression from their diploid progenitors may expand the genetic variability of polyploidy plants. The Cynodon genus comprises only nine species with a base chromosome number of x = 9 (4). Ploidy level variation and evolution of polyploid have resulted in hybridizations, natural meiotic chromosome duplications, and pairing of unreduced gametes. [9]. If in order to investigate the origin, interspecies hybridization, and phylogenetic history of Cynodon species further, plastid genome sequence variation will be used extensively to address questions regarding speciation [63]. From these facts above, flexibility in the ploidy level of the Cynodon species is one evolution mechanism for widespread adaptability to various environments rather than a possible reproduction obstacle to speciation. As well as this the diverse breeding strategy of C. dactylon could increase the evolution and reduce the possibility of speciation caused by polyploidization and geographical isolation along latitude.

5. Conclusions

This was the first comprehensive report on the landscape genetics of wild C. dactylon individuals collected from China. Latitude represents a significant effect on the genetic diversity of bermudagrass and higher within-population genetic diversity appeared at low latitude. Higher temperature and precipitation will be beneficial to higher genetic diversity of C. dactylon. The habitats and the exploitation of the wild resources of C. dactylon with high levels of genetic variation at lower latitude should be paid more attention to. The genetic diversity increased with the ploidy level and polyploidy could be a very efficient tool in the forage and turf grass breeding of C. dactylon. Low genetic differentiation, lack of isolation by distance, and notable admixture structure existed among populations along latitudes indicating that notable gene flow occurred among populations by seed dispersal (or vegetative organs) and extrinsic pollen in shaping the spatial population structure of C. dactylon along latitudes. C. dactylon has many biological characters of perennial growth, wind-pollination, polyploidy, low genetic differentiation among populations, sexual and asexual reproduction leading to high genetic diversity, which gives it strong adaptability while its genetic patterns are very complex across all the sampled latitudes.

Author Contributions

Conceptualization, J.Z. and X.Y.; methodology, J.Z. and X.Y.; software, J.Z.; validation, J.Z., X.Y., and Y.G.; investigation, J.Z., M.W., Z.G., Y.G., J.L., X.Y., and Y.G.; data curation, J.Z., X.Y., and Y.G.; writing—original draft preparation, J.Z.; writing—review and editing, J.Z., X.Y., and Y.G.

Funding

This research received no external funding.

Conflicts of Interest

The authors declare no conflicts of interest.

References

  1. Frankham, R.; Ballou, J.D.; Briscoe, D.A.; Mcinnes, K.H. Introduction to conservation genetics: Glossary. Zool. Afr. 2002, 38, 192. [Google Scholar]
  2. Holderegger, R.; Kamm, U.; Gugerli, F. Adaptive versus neutral genetic diversity: Implications for landscape genetics. Landsc. Ecol. 2006, 21, 797–807. [Google Scholar] [CrossRef]
  3. Bolliger, J.; Lander, T.; Balkenhol, N. Landscape genetics since 2003: Status, challenges and future directions. Landsc. Ecol. 2014, 29, 361–366. [Google Scholar] [CrossRef]
  4. Landguth, E.L.; Cushman, S.A.; Schwartz, M.K.; Mckelvey, K.S.; Murphy, M.; Luikart, G. Quantifying the lag time to detect barriers in landscape genetics. Mol. Ecol. 2010, 19, 4179–4191. [Google Scholar] [CrossRef] [PubMed]
  5. Blair, C.; Weigel, D.E.; Balazil, M.; Keeley, A.T.H.; Walker, F.M.; Landguth, E.; Cushman, S.; Murphy, M.; Waits, L.; Balkenhol, N. A simulation-based evaluation of methods for inferring linear barriers to gene flow. Mol. Ecol. Res. 2012, 12, 822–833. [Google Scholar] [CrossRef] [PubMed]
  6. Angeloni, F.; Ouborg, N.J.; Leimu, R. Meta-analysis on the association of population size and life history with inbreeding depression in plants. Biol. Conserv. 2011, 144, 35–43. [Google Scholar] [CrossRef]
  7. Harlan, J.R.; De Wet, J.M.J. Sources of variation in Cynodon dactylon (L.). Pers. 1. Crop Sci. 1969, 9, 774–778. [Google Scholar] [CrossRef]
  8. Taliaferro, C.M. Diversity and Vulnerability of Bermuda Turfgrass Species. Crop Sci. 1995, 35, 327–332. [Google Scholar] [CrossRef]
  9. Taliaferro, C.M. Bermudagrass (Cynodon (L.) Rich). In Turfgrass Biology, Genetics and Breeding; Casler, M.D., Duncan, R.R., Eds.; John Wiley and Sons Inc.: Hoboken, NJ, USA, 2003; pp. 235–257. [Google Scholar]
  10. Wu, Y.Q.; Taliaferro, C.M.; Bai, G.H.; Anderson, M.P. AFLP analysis of Cynodon dactylon (L.) Pers. var. dactylon genetic variation. Genome 2004, 47, 689–696. [Google Scholar] [CrossRef]
  11. de Silva, P.H.A.U.; Snaydon, R.W. Chromosome number in Cynodon dactylon in relation to ecological conditions. Ann. Bot. 1995, 76, 535–537. [Google Scholar] [CrossRef]
  12. Wu, Y.Q.; Taliaferro, C.M.; Martin, D.L.; Goad, C.L.; Anderson, J.A. Genetic variability and relationships for seed yield and its components in Chinese Cynodon accessions. Field Crop Res. 2006, 98, 245–252. [Google Scholar] [CrossRef]
  13. Vlachou, D.; Konsolaki, M.; Tolias, P.P.; Kafatos, F.C.; Komitopoulou, K. The austosomal chorion locus of the medfly Ceratitis capitata. 1. Conserved synteny, amplification and tissue specificity but sequence divergence and altered temporal regulation. Genetics 1997, 147, 1829–1842. [Google Scholar]
  14. Jewell, M.C.; Frere, C.H.; Prentis, P.J.; Lambrides, C.J.; Godwin, I.D. Characterisation and multiplexing of EST-SSR primers in Cynodon (Poaceae) species. Am. J. Bot. 2010, 97, e99–e101. [Google Scholar] [CrossRef]
  15. Ho, C.Y.; Mcmaugh, S.J.; Wilton, A.N.; Mcfarlane, I.J.; Mackinlay, A.G. DNA amplification variation within cultivars of turf-type Couch grasses (Cynodon spp.). Plant Cell Rep. 1997, 16, 797–801. [Google Scholar] [CrossRef]
  16. Caetano-Anollés, G. DNA Analysis of Turfgrass Genetic Diversity. Crop Sci. 1998, 38, 1415–1424. [Google Scholar] [CrossRef]
  17. Zhang, L.; Ozias-Akins, P.; Kochert, G.; Kresovich, S.; Dean, R.; Hanna, W. Differentiation of bermudagrass (Cynodon spp.) genotypes by AFLP analyses. Theor. Appl. Genet. 1999, 98, 895–902. [Google Scholar] [CrossRef]
  18. Anderson, M.P.; Taliaferro, C.M.; Martin, D.L.; Anderson, C.S. Comparative DNA Profiling of U-3 Turf Bermudagrass Strains. Crop Sci. 2001, 41, 1184–1189. [Google Scholar] [CrossRef]
  19. Karaca, M. Genetic diversity among forage bermudagrass (Cynodon spp.): Evidence from chloroplast and nuclear DNA fingerprinting. Crop Sci. 2002, 42, 2118–2127. [Google Scholar] [CrossRef]
  20. Roodt, R.; Spies, J.J.; Burger, T.H. Preliminary DNA fingerprinting of the turf grass Cynodon dactylon (Poaceae: Chloridoideae). Bothalia 2002, 32, 117–122. [Google Scholar] [CrossRef]
  21. Etemadi, N.; Sayed-Tabatabaei, B.E.; Zamanni, Z.; Razmjoo, K.; Khalighi, A.; Lessani, H. Evaluation of diversity among Cynodon dactylon (L.) Pers. using RAPD markers. Int. J. Agric. Biol. 2005, 8, 198–202. [Google Scholar]
  22. Tan, J.Q. Chinese Ground Covers of Lawn; Science and Technology Literature Press: Beijing, China, 1993. [Google Scholar]
  23. Harrisshultz, K.R.; Schwartz, B.M.; Hanna, W.W.; Brady, J.A. Development, linkage mapping, and use of microsatellites in bermudagrass. J. Am. Soc. Hortic. Sci. 2010, 135, 511–520. [Google Scholar] [CrossRef]
  24. Jewell, M.C.; Yi, Z.; Loch, D.S.; Godwin, I.D.; Lambrides, C.J. Maximizing Genetic, Morphological, and Geographic Diversity in a Core Collection of Australian Bermudagrass. Crop Sci. 2012, 52, 879–889. [Google Scholar] [CrossRef]
  25. Bennett, M.D.; Smith, J.B. Nuclear DNA amounts in angiosperms. Philos. Trans. R. Soc. B 1976, 274, 227–274. [Google Scholar] [CrossRef]
  26. Yeh, F.C.; Yang, R.C.; Boyle, T.; Ye, Z.H.; Mao, J.X. POPGENE, the User Friendly Shareware for Population Genetic Analysis; Molecular Biology and Biotechnology Center, University of Alberta: Edmonton, AB, Canada, 1997. [Google Scholar]
  27. Duncan, D.B. Multiple Range and Multiple F Tests. Biometrics 1955, 11, 1–42. [Google Scholar] [CrossRef]
  28. Khan, A.; Nawaz, M.; Khan, S.; Steele, R. Detection and characterization of erythromycin-resistant methylase genes in Gram-positive bacteria isolated from poultry litter. Appl. Microbiol. Biot. 2002, 59, 377–381. [Google Scholar]
  29. Peakall, R.; Smouse, P. GENALEX 6: Genetic analysis in Excel. Population genetic software for teaching and research. Mol. Ecol. Notes 2006, 6, 288–295. [Google Scholar] [CrossRef]
  30. Rohlf, F.J. NTSYS-pc numerical taxonomy and multivariate analysis system version 2.1 manual. N. Y. Appl. Biostat. 2000. Available online: https://www.scienceopen.com/document?vid=8071739f-efd0-4990-9970-47e831f11f8b (accessed on 14 August 2019).
  31. STRUCTURE V.2.3. Available online: http://web.stanford.edu/group/pritchardlab/structure.html (accessed on 4 July 2019).
  32. Hubisz, M.J.; Falush, D.; Stephens, M.; Pritchard, J.K. Inferring weak population structure with the assistance of sample group information. Mol. Ecol. Res. 2009, 9, 1322–1332. [Google Scholar] [CrossRef] [Green Version]
  33. Rosenberg, N.A.; Burke, T.; Elo, K.; Feldman, M.W.; Freidlin, P.J.; Groenen, M.A.; Hillel, J.; Mäki-Tanila, A.; Tixier-Boichard, M.; Vignal, A.; et al. Empirical evaluation of genetic clustering methods using multilocus genotypes from 20 chicken breeds. Genetics 2001, 159, 699. [Google Scholar]
  34. Evanno, G.; Regnaut, S.; Goudet, J. Detecting the number of clusters of individuals using the software structure: A simulation study. Mol. Ecol. 2005, 14, 2611–2620. [Google Scholar] [CrossRef]
  35. Yan, X.B.; Guo, Y.X.; Liu, F.Y.; Zhao, C.; Liu, Q.L.; Lu, B.R. Population structure affected by excess gene flow in self-pollinating Elymus nutansand E. Popul. Ecol. 2010, 52, 233–241. [Google Scholar] [CrossRef]
  36. Pritchard, J.K.; Stephens, M.; Rosenberg, N.A.; Donnelly, P. Association mapping in structured populations. Am. J. Hum. Genet. 2000, 67, 170. [Google Scholar] [CrossRef]
  37. Ellegren, H.; Galtier, N. Determinants of genetic diversity. Nat. Rev. Genet. 2016, 17, 422. [Google Scholar] [CrossRef]
  38. Welch, D.B.M.; Meselson, M. Evidence for the evolution of bdelloid rotifers without sexual reproduction or genetic exchange. Science 2000, 288, 1211–1215. [Google Scholar] [CrossRef]
  39. François, B.; Laurent, L.; de Thierry, M. The population genetics of clonal and partially clonal diploids. Genetics 2003, 164, 1635–1644. [Google Scholar]
  40. Hollister, J.D.; Greiner, S.; Wang, W.; Wang, J.; Zhang, Y.; Wong, G.K.S.; Wright, S.I.; Johnson, M.T.J. Recurrent loss of sex is associated with accumulation of deleterious mutations in oenothera. Mol. Biol. Evol. 2014, 32, 896–905. [Google Scholar] [CrossRef]
  41. Hamrick, J.L.; Godt, M.J.W. Allozyme diversity in plant species. In Plant Population Genetics, Breeding and Genetic Resources; Brown, A.H.D., Clegg, M.T., Kahler, A.L., Weir, B.S., Eds.; Sinauer Associates Inc.: Sunderland, MA, USA, 1989. [Google Scholar]
  42. Borba, E.L.; Semir, J.; Shepherd, G.J. Self-incompatibility, Inbreeding Depression and Crossing Potential in Five Brazilian Pleurothallis (Orchidaceae) Species. Ann. Bot. 2001, 88, 89–99. [Google Scholar] [CrossRef]
  43. Nybom, H. Comparison of different nuclear DNA markers for estimating intraspecific genetic diversity in plants. Mol. Ecol. 2010, 13, 1143–1155. [Google Scholar] [CrossRef]
  44. Hamrick, J.L.; Godt, M.J.W. Effects of Life History Traits on Genetic Diversity in Plant Species. Philos. Trans. Biol. Sci. 1996, 351, 1291–1298. [Google Scholar]
  45. Nevo, E. Genetic diversity in wild cereals: Regional and local studies and their bearing on conservation ex situ and in situ. Genet. Res. Crop Evol. 1998, 45, 355–370. [Google Scholar] [CrossRef]
  46. Gulsen, O.; Sever-Mutlu, S.; Mutlu, N.; Tuna, M.; Karaguzel, O.; Shearman, R.C.; Riordan, T.P.; Heng-Moss, T.M. Polyploidy creates higher diversity among Cynodon accessions as assessed by molecular markers. Theor. Appl. Genet. 2009, 118, 1309–1319. [Google Scholar] [CrossRef]
  47. Gulsen, O.; Shearman, R.C.; Vogel, K.P.; Lee, D.J.; Baenziger, P.S.; Heng-Moss, T.M.; Budak, H. Nuclear genome diversity and relationships among naturally occurring buffalograss genotypes determined by sequence-related amplified polymorphism. HortScience 2005, 40, 537–541. [Google Scholar] [CrossRef]
  48. Budak, H.; Shearman, R.C.; Gulsen, O.; Dweikat, I. Understanding ploidy complex and geographic origin of the Buchloe dactyloides genome using cytoplasmic and nuclear marker systems. Theor. Appl. Genet. 2005, 111, 1545–1552. [Google Scholar] [CrossRef]
  49. Johnson, P.G.; Kenworthy, K.E.; Auld, D.L.; Riordan, T.P. Distribution of buffalograss polyploid variation in the southern great plains. Cropence 2001, 41, 909–913. [Google Scholar] [CrossRef]
  50. Ferrero, V.; Barrett, S.C.; Castro, S.; Caldeirinha, P.; Navarro, L.; Loureiro, J.; Rodríguez-Echeverría, S. Invasion genetics of the Bermuda buttercup (Oxalis pes-caprae): Complex intercontinental patterns of genetic diversity, polyploidy and heterostyly characterize both native and introduced populations. Mol. Ecol. 2015, 24, 2143–2155. [Google Scholar] [CrossRef]
  51. Zhang, J.X.; Wang, M.L.; Guo, Z.P.; Guan, Y.Z.; Guo, Y.X.; Yan, X.B. Variation in ploidy level and genome size of Cynodon dactylon (L.) Pers. along a latitudinal gradient. Folia Geobot. under review.
  52. Francisco-Ortega, J.; Santos-Guerra, A.; Kim, S.C.; Crawford, D.J. Plant genetic diversity in the Canary Islands: A conservation perspective. Am. J. Bot. 2000, 87, 909–919. [Google Scholar] [CrossRef]
  53. Bolibok-Brągoszewska, H.; Targońska, M.; Bolibok, L.; Kilian, A.; Rakoczy-Trojanowska, M. Genome-wide characterization of genetic diversity and population structure in Secale. Bmc Plant Biol. 2014, 14, 1–15. [Google Scholar] [CrossRef]
  54. Zhang, C.; Huang, J.; Xiao, Y.; Lian, C.; Li, X. Genetic diversity and population structure of sour jujube, Ziziphus acidojujuba. Tree Genet. Genomes 2015, 11, 809. [Google Scholar] [CrossRef]
  55. Zheng, Y.; Xu, S.; Liu, J.; Zhao, Y.; Liu, J. Genetic diversity and population structure of Chinese natural bermudagrass [Cynodon dactylon (L.) Pers.] germplasm based on SRAP markers. PLoS ONE 2017, 12, e0177508. [Google Scholar] [CrossRef]
  56. Ling, Y.; Zhang, X.Q.; Ma, X.; Chen, S.Y.; Chen, T.T.; Liu, W. Analysis of genetic diversity among wild bermudagrass germplasm from southwest China using SSR markers. Genet. Mol. Res. 2012, 11, 4598. [Google Scholar] [CrossRef]
  57. Zong, J.W.; Zhao, T.T.; Ma, Q.H.; Liang, L.S.; Wang, G.X. Assessment of Genetic Diversity and Population Genetic Structure of Corylus mandshurica in China Using SSR Markers. PLoS ONE 2015, 10, e0137528. [Google Scholar] [CrossRef]
  58. Ladizinsky, G. Founder effect in crop-plant evolution. Econ. Bot. 1985, 39, 191–199. [Google Scholar] [CrossRef]
  59. Rosenblum, E.B. Convergent evolution and divergent selection: Lizards at the White Sands ecotone. Am. Nat. 2006, 167, 1–15. [Google Scholar] [CrossRef]
  60. Nelson, E.C. Phytogeography of southern Australia. In Ecological Biogeography of Australia; Keast, A., Ed.; Junk: The Hague, The Netherlands, 1981; pp. 735–759. [Google Scholar]
  61. Rius, M.; Darling, J.A. How important is intraspecific genetic admixture to the success of colonising populations? Trends Ecol. Evol. 2014, 29, 233–242. [Google Scholar] [CrossRef]
  62. Tate, J.A.; Soltis, D.E.; Soltis, P.S. CHAPTER 7–Polyploidy in Plants. Evol. Genome 2005, 2005, 371–426. [Google Scholar]
  63. Durka, W.; Bossdorf, O.; Prati, D.; Auge, H. Molecular evidence for multiple introductions of garlic mustard (Alliaria petiolata, Brassicaceae) to North America. Mol. Ecol. 2005, 14, 1697–1706. [Google Scholar] [CrossRef]
Figure 1. Distribution of the C. dactylon (L.) Pers. accessions collected along a latitudinal gradient from 22°35′ N to 36°18′ N of China. The latitude and longitude of the 16 populations are indicated on the figure which was generated by Sigmaplot 10.0.1 (Systat Software Inc., San Jose, CA, USA).
Diversity 11 00135 g001
Figure 2. Within-population genetic diversity of 16 C. dactylon populations along latitudinal gradients (1–16 is from south to north). He: Nei’s gene diversity index; I: Shannon diversity index. These genetic diversity parameters were generated by the POPGENE V. 1.32 Software.
Diversity 11 00135 g002
Figure 3. Scatter plot obtained from principal coordinate analysis based on the genetic distance derived from expressed sequence tag-simple sequence repeats (EST-SSR) markers in 16 populations. The first axis for 6.7% and the second axis for 6.4%.
Diversity 11 00135 g003
Figure 4. Unweighted pair-group method of arithmetic averages (UPGMA) dendrogram generated from EST-SSR data showing relationships of bermudagrass groups with different ploidy level. Numbers (2–6) correspond to ploidy levels.
Diversity 11 00135 g004
Figure 5. Population structure of 296 C. dactylon plants sampled from 16 populations based on expressed sequence tags-derived simple sequence repeat (EST-SSR) markers (K = 2 to K = 11). Each color shows one Bayesian ancestry group (K). The length of the colored segment represents the estimated membership proportions in different Bayesian ancestry groups (K). Population numbers from left to right are from south to north of China along the latitudinal gradients. Bayesian clustering and population modeling was performed using a STRUCTURE V.2.2.
Diversity 11 00135 g005
Figure 6. Admixture (G: Generation back; G = 0 and 1, single parent and itself) at K = 16 for each population of C. dactylon in the last two generations.
Diversity 11 00135 g006
Figure 7. Immigrant (G: Generation back; G = 0 and 1, single parent and itself) ratio for each population of C. dactylon in the last two generations.
Diversity 11 00135 g007
Table 1. Expressed sequence tag-simple sequence repeat (EST-SSR) primers are shown for each primer pair including forward and reverse sequence, repeat type, expected size (bp), GenBank accession number and annealing temperature.
Accession No.Primer Sequence (5′ – 3′) RepeatSize (bp)Ta (°C)
ES293996F: GAGCGAACCTCAGAGTAGCC(CT)119950
R: CAGAAGCAATCGCGGAAAC
ES297444F: GCCTACTCCATGGAAGAGTCAG(CAG)7 9350
R: CGACCACTGCTTCATCACC
ES295368F: TCGGTTACCTGCTTCACACC(CT)1410760
R: GGGAAGACGAAGACCTCCAG
ES295577 F: TGATTGTCCGAGGTCAGCA(GGC)711850
R: GGTGTGAACCATCAGCAGTT
ES297517 F: GCGCAGCTGATAGAGGTTGT(AGA)415950
R: ACAGGCGGCTTTCATCTTCT
ES302010F: CTACAACAGCTTCCCCAGCA(AAC)712850
R: TGACGTCGTTGGTGTAGAGC
ES297043F: TTGGCCAGTCATGTATTTTCC(TTC)416350
R: AACATGGAGTCTGGTGCTCA
ES305182 F: AAGGTTGTGGACAAGGATGG(TGC)414450
R: GGGGTCCAACAACTCAAAAG
ES303634 F: GCGTTCCAGAAGTTGCAGTT(CCT)6, (GCG)616650
R: AGATCTTCTCTCCGGCCTTG
ES296960F: ACATGTCTCCGTCCCATCACCG16762
R: ATGAGTCGGTCCTTCTTGG
ES300915F: GGCAGCTCCTCTCTCCTTAAA(CGG)8 16662
R: ACCATGACCTTGTCCTCGTC
ES295668F: ATCCAATGAGTGGGACTCCA(CAA)10 16758
R: CCAGCTTGCTTGGGATTAAA
ES294037 F: TTGTGCCAGCTATCTTGGTG 15958
R: TGCGAAGCAAGAAGAGTACG
ES294662F: CAAGGACCACATCACCATCA (CGAT)6 20458
R: CGGCCATTGATTATCTGTGA
ES300599F: AGGGGAAGAAGGGTAAGCAGCAG 18962
R: CACCAAATCCACCAAAGGAG
ES296415F: GGACTCAAAAATGCTCAGAAA(CAAA)620258
R: TTTGCAGAGCCCGTAACTCT
ES300198F: TGACGTCGTTGGTGTAGAGC(TTG)1023962
R: CGACTCCATCTGGTCCAACT
ES306918F: AGATCGGGGTGGGGAAGA(CGA)619958
R: GTACATCTCCAGCAGCGACA
ES303889F: TCCGTTGCCTATACGGTTGCGG 22562
R: GGAACCGATAATCACTCCA
ES295349 F: CCAAGAGCTAGGCCATCAAC(CT)1015050
R: CACAAATCTTGGAACCATGTG
Table 2. Genetic diversity of 16 C. dactylon populations along latitudinal gradients.
Population IDOriginSample NumberPIHe
1Zhongshan1851.630.1730.2605
2Guangzhou2058.820.18580.2833
3Yingde1959.480.17550.2719
4Renhua1958.170.16990.2625
5Guidong2056.860.15760.2473
6Youxian1945.750.11830.1883
7Liuyang2050.980.15550.2373
8Linxiang2045.750.14750.2239
9Xiantao2055.560.1460.2314
10Xiaochang1845.750.1280.2016
11Xinyang2046.410.14750.2251
12Zhumadian1752.290.16820.2551
13Xuchang2049.670.14070.218
14Zhengzhou1849.670.15610.2387
15Huixian1854.250.16490.2534
16Cixian1033.330.10860.1663
Total 2961000.20030.3197
Note: P, percentage of polymorphic bands; He, Nei’s (1973) gene diversity; I, Shannon’s information index (Lewontin, 1972).
Table 3. Genetic diversity of bermudagrass of different latitudinal groups.
GroupPHeI
157.025 A0.17605 A0.26955 A
249.835 B0.144725 B0.2242 B
350.0025 B0.147425 B0.2283 B
446.73 C0.142575 B0.2191 B
Different capital letters between genetic diversity indexes denote the significance among different populations at 0.05 level. P, percentage of polymorphic bands; He, Nei’s gene diversity; I, Shannon’s information index.
Table 4. Genetic diversity of bermudagrass of different ploidy levels.
Ploidy LevelNPHeI
21658.17 C0.1702 C0.2647 C
33767.32 B0.1846 B0.2876 B
410085.62 A0.1804 B0.2909 B
52369.93 B0.2053 A0.3157 A
63571.24 B0.2086 A0.3204 A
Overall2111000.19950.3166
Different capital letters between genetic diversity indexes denote the significance among various populations at 0.05 level.
Table 5. Analysis of molecular variance (AMOVA) of bermudagrass of different population.
SourcedfSSMSEstimate of Variation%
Among Pops151054.47070.2983.12520%
Within Pops2803511.60112.54112.54180%
Total2954566.071 15.667100%
Note: df-Degree of freedom, SS-Sum of squares, MS-Mean of squares.
Table 6. The model values of the K versus DeltaK distribution.
KL(K)StDevL’(K)L″(K)[″(K)]Delta K
1−14,576.273.6
2−13,211235.91365.2\\\
3−12,602.8459.4608.2−7577571.6478
4−12,079486.8523.8−84.484.40.1734
5−11,794.9648.4284.1−239.7239.70.3697
6−11,575.2669.8219.7−64.464.40.0961
7−11,394.3765.7180.9−38.838.80.0507
8−11,187.9790.1206.425.525.50.0323
9−10,980.5938.9207.4110.0011
10−10,802.8945.6177.7−29.729.70.0314
11−10,840.4863.9−37.6−215.3215.30.2492
12−10,770.61027.469.8107.4107.40.1045
13−10,609.7986.1160.991.191.10.0924
14−10,460.11236.1149.6−11.311.30.0091
15−10,353.51187.2106.6−43430.0362
16−10,228.71370.8124.818.218.20.0133
17−10,285.81611.3−57.1−181.9181.90.1129
18−10,2151466.370.8127.9127.90.0872
19−10,0571572.115887.287.20.0555
20−9928.51504.1128.5−29.529.50.0196
21−9542.81492.3385.7257.2257.20.1724
22−9632.71606.2−89.9−475.6475.60.2961
23−92851608.9347.7437.6437.60.2720
24−9754.22023.1−469.2−816.9816.90.4038
25−10,053.51880.9−299.3169.9169.90.0903
26−9408.11704.9645.4944.7944.70.5541

