The Vertebrate TLR Supergene Family Evolved Dynamically by Gene Gain/Loss and Positive Selection Revealing a Host–Pathogen Arms Race in Birds

 ,
,  , ,
, ,
Abstract
:1. Introduction
2. Materials and Methods
2.1. Genome Scan and Synteny Analysis of TLR Supergene Family
2.2. Phylogenetic Analysis
2.3. Gene Conversion and Recombination
2.4. Positive Selection in Avian TLRs
2.5. Comparison of Domain Architecture, Homology Modeling, and Structure Analysis across Vertebrate TLRs
3. Results
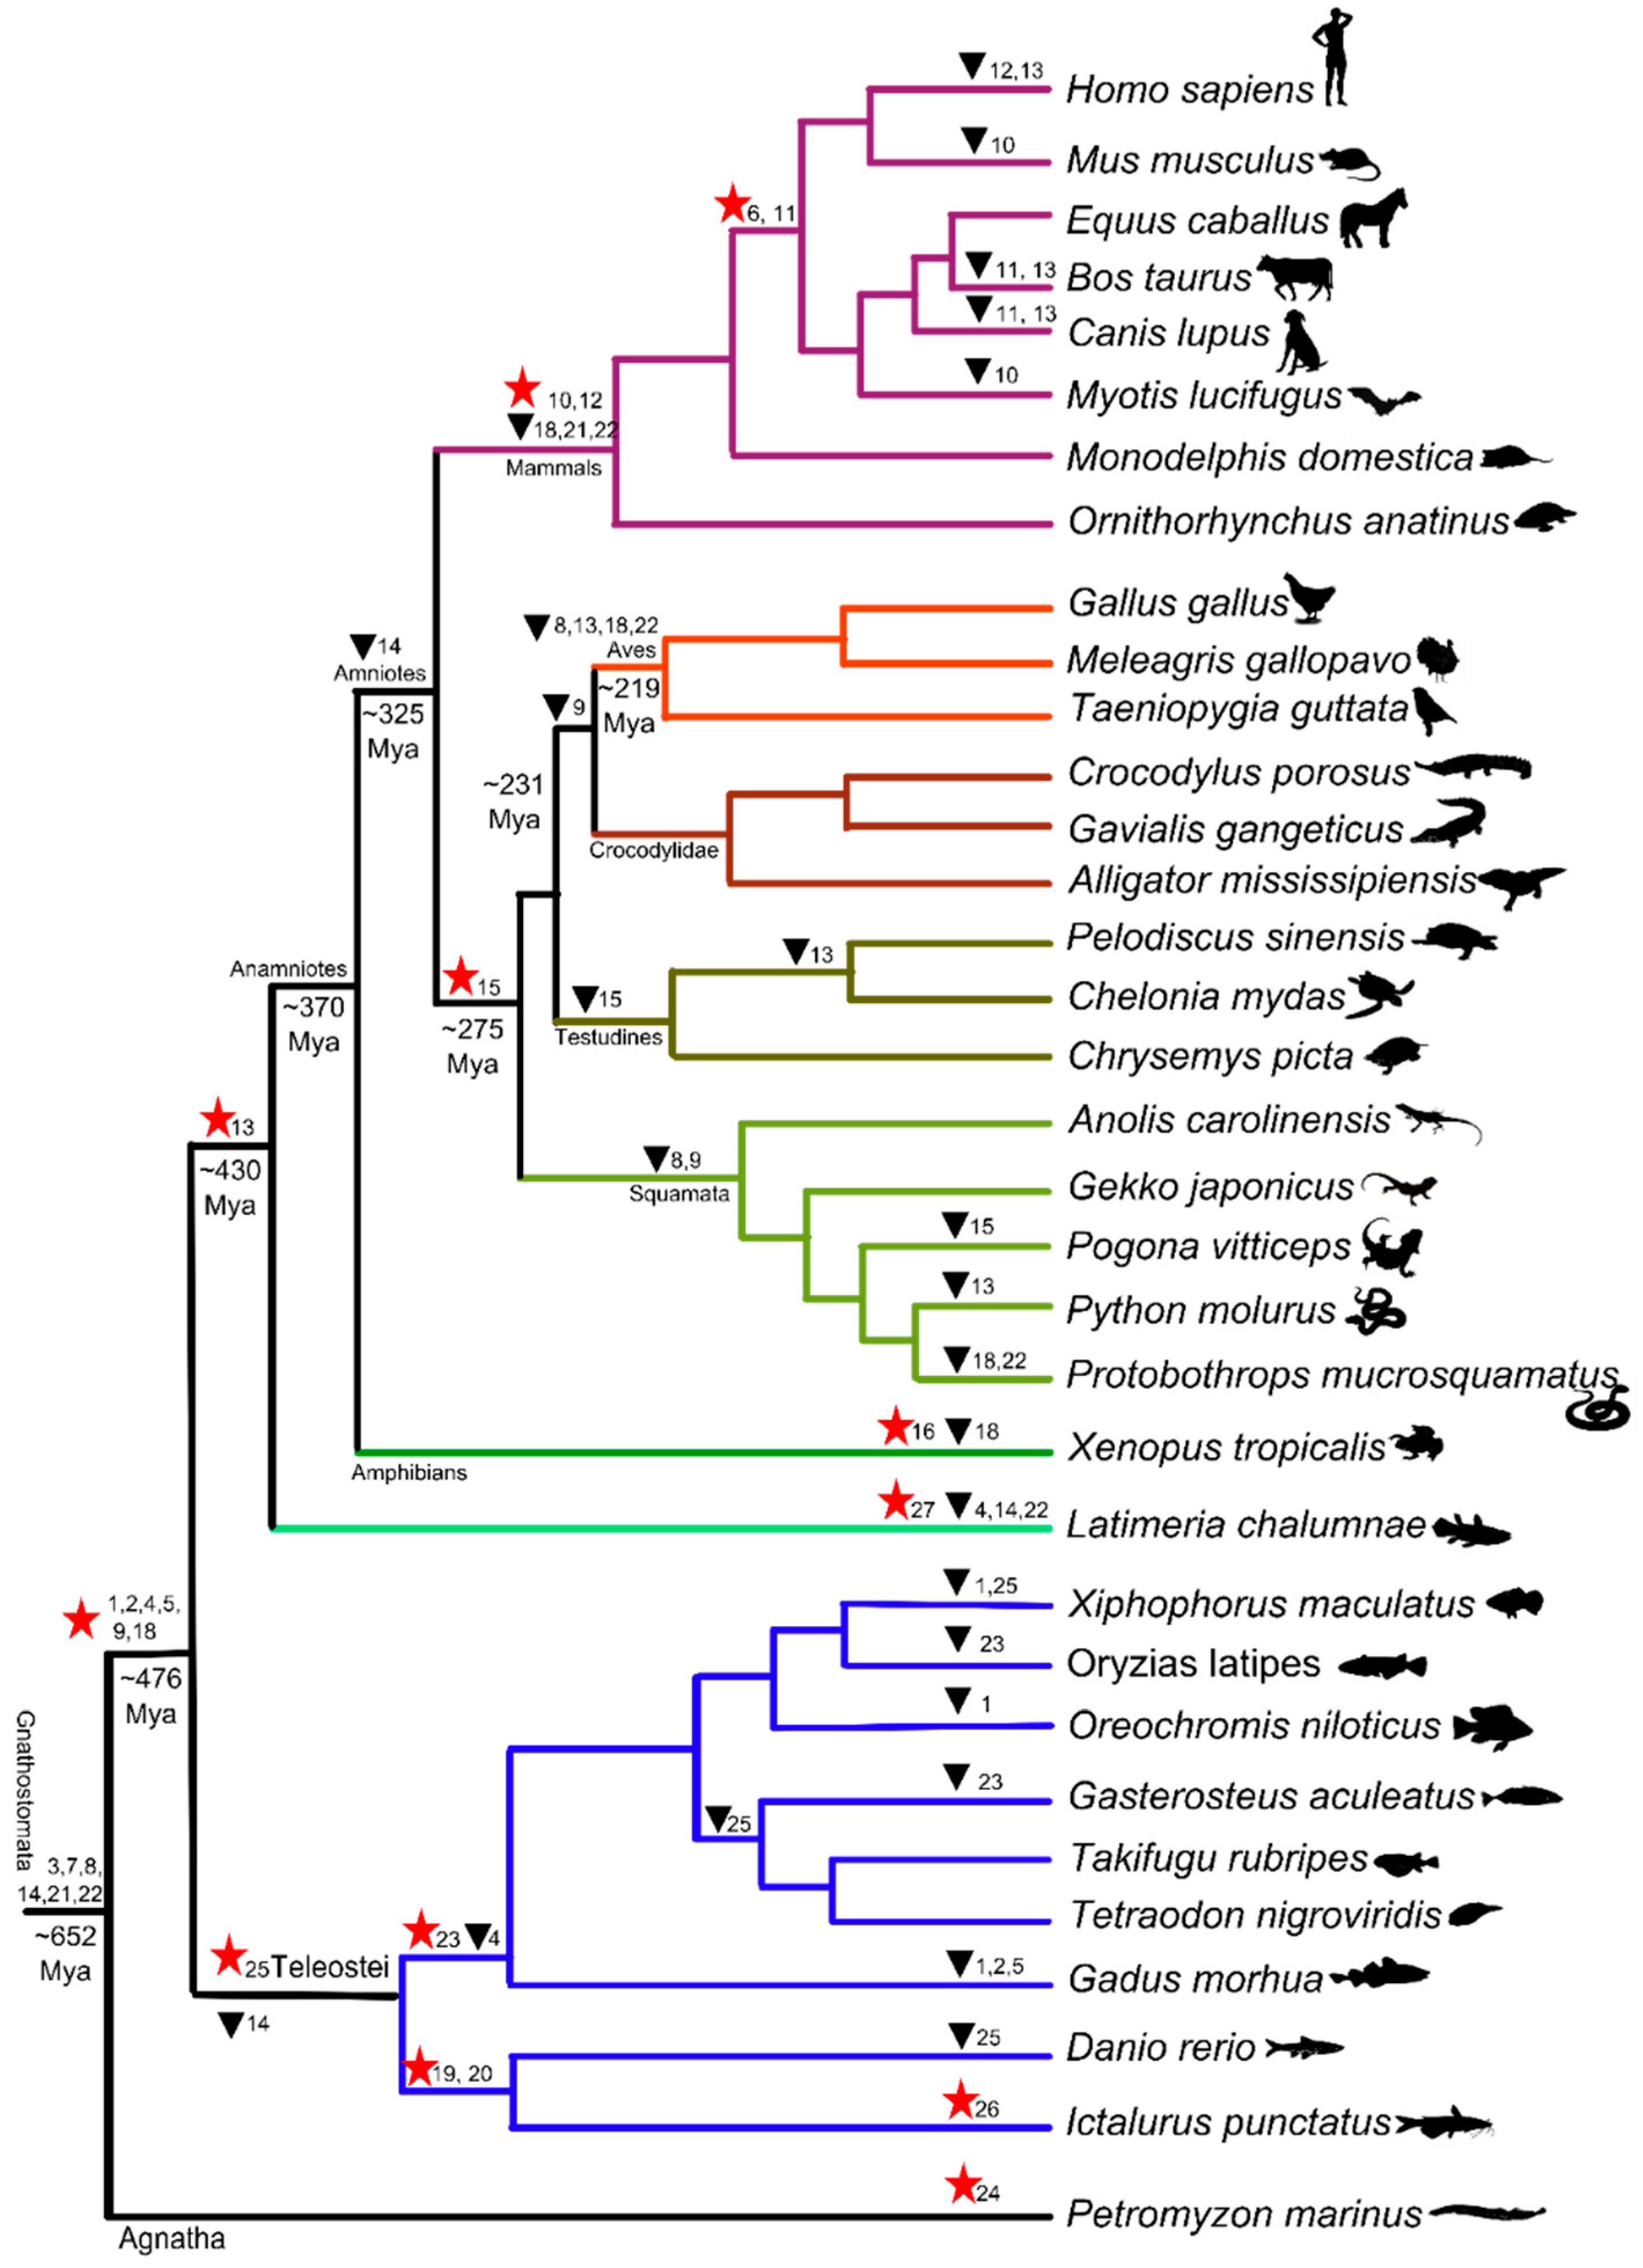
3.1. Dynamic Gene Gain and Loss Shapes Vertebrate TLR Supergene Family Repertoire
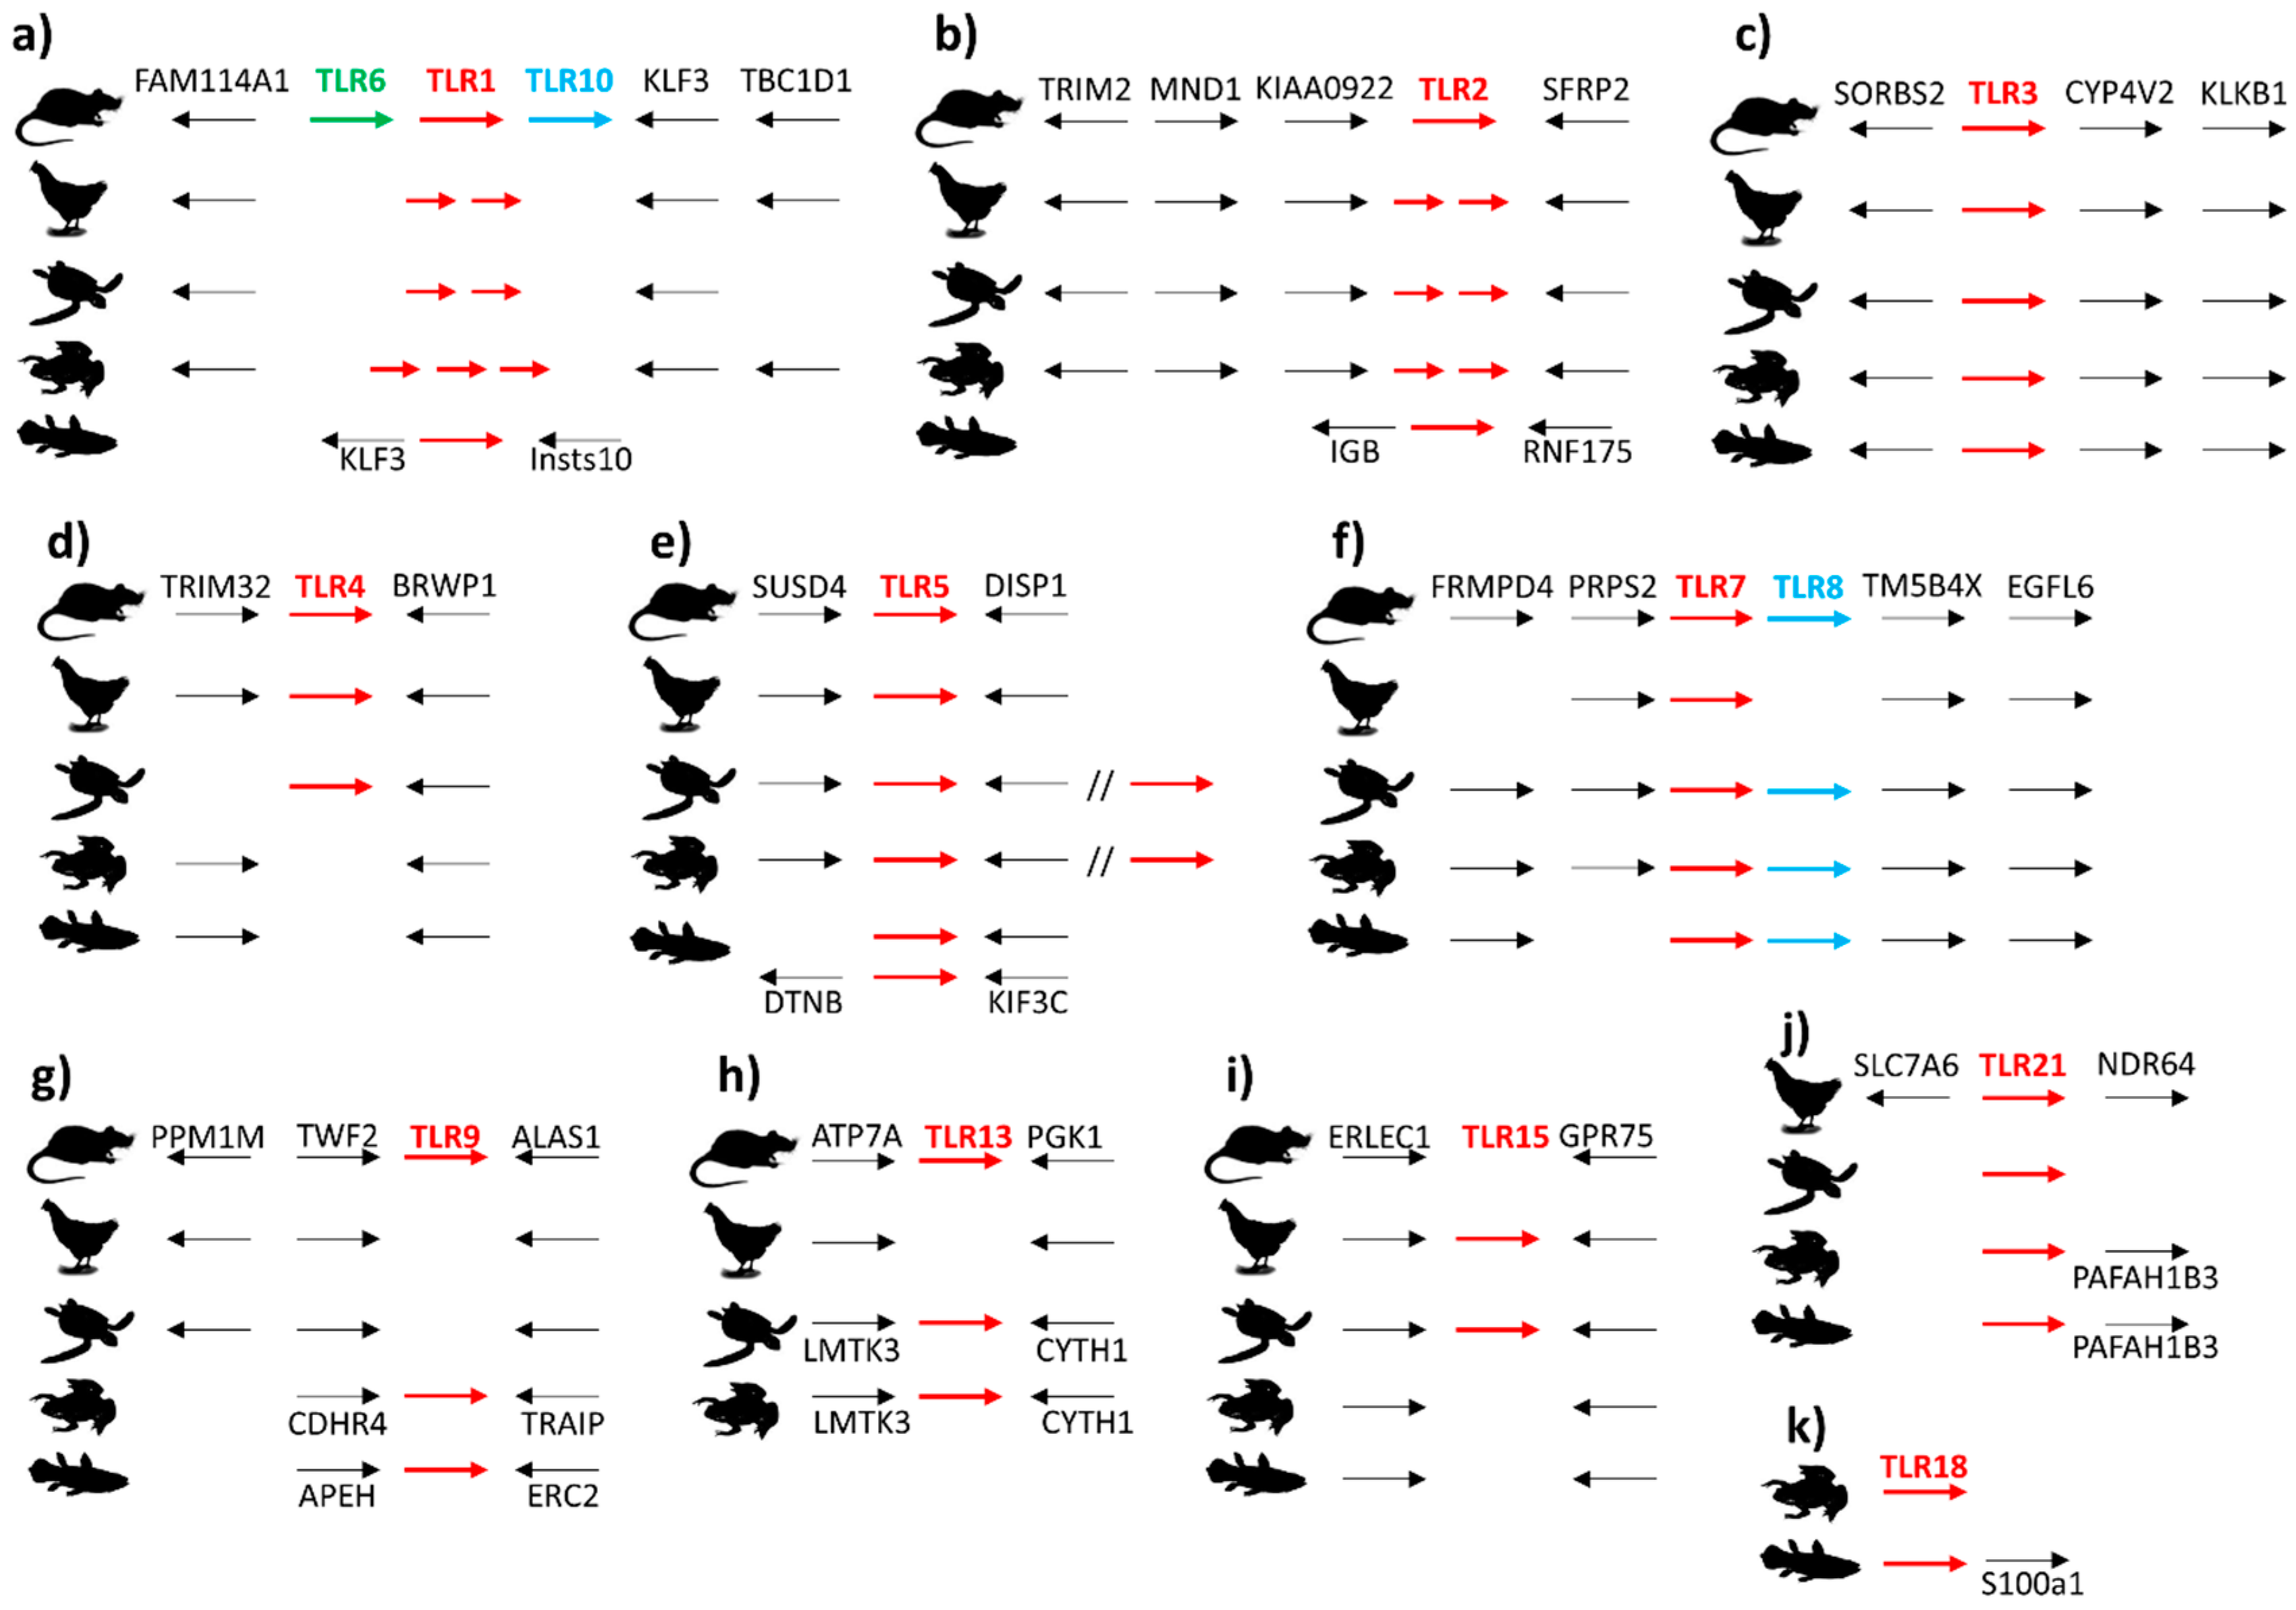
3.2. Synteny of TLR Supergene Family in Vertebrates
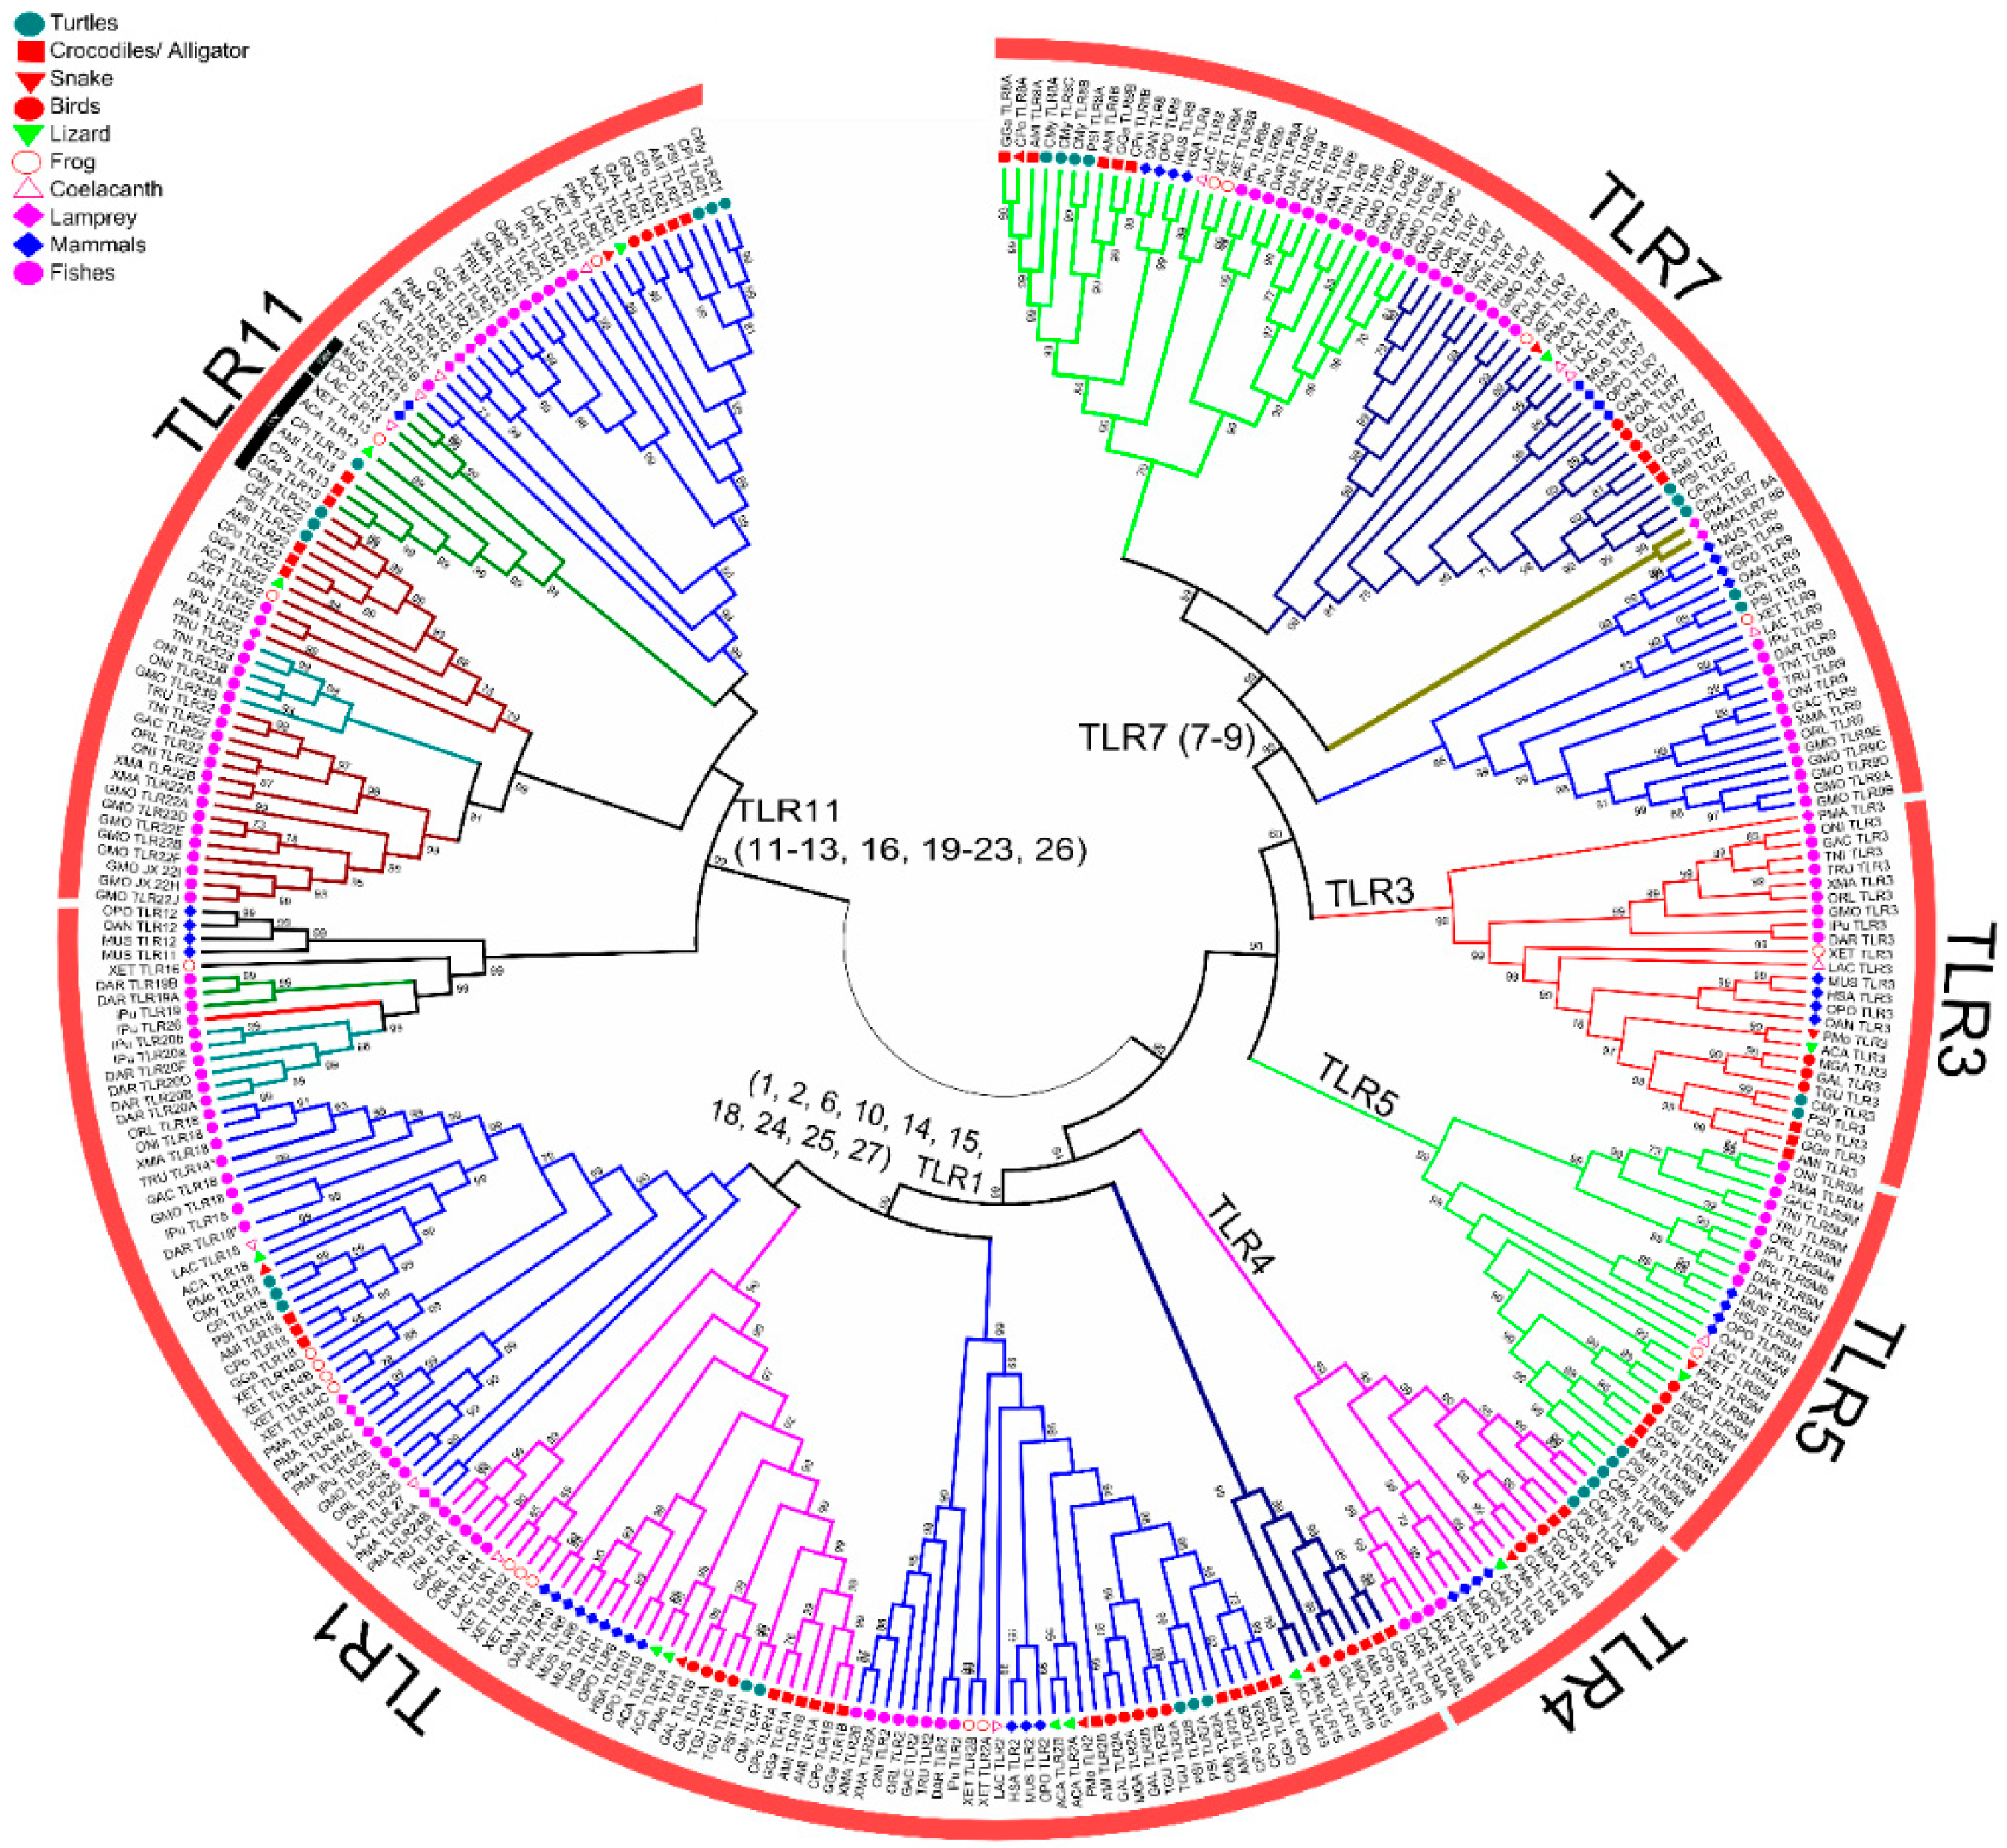
3.3. Phylogenetic Analysis of Vertebrate TLR Supergene Family
Gene Conversion and Recombination
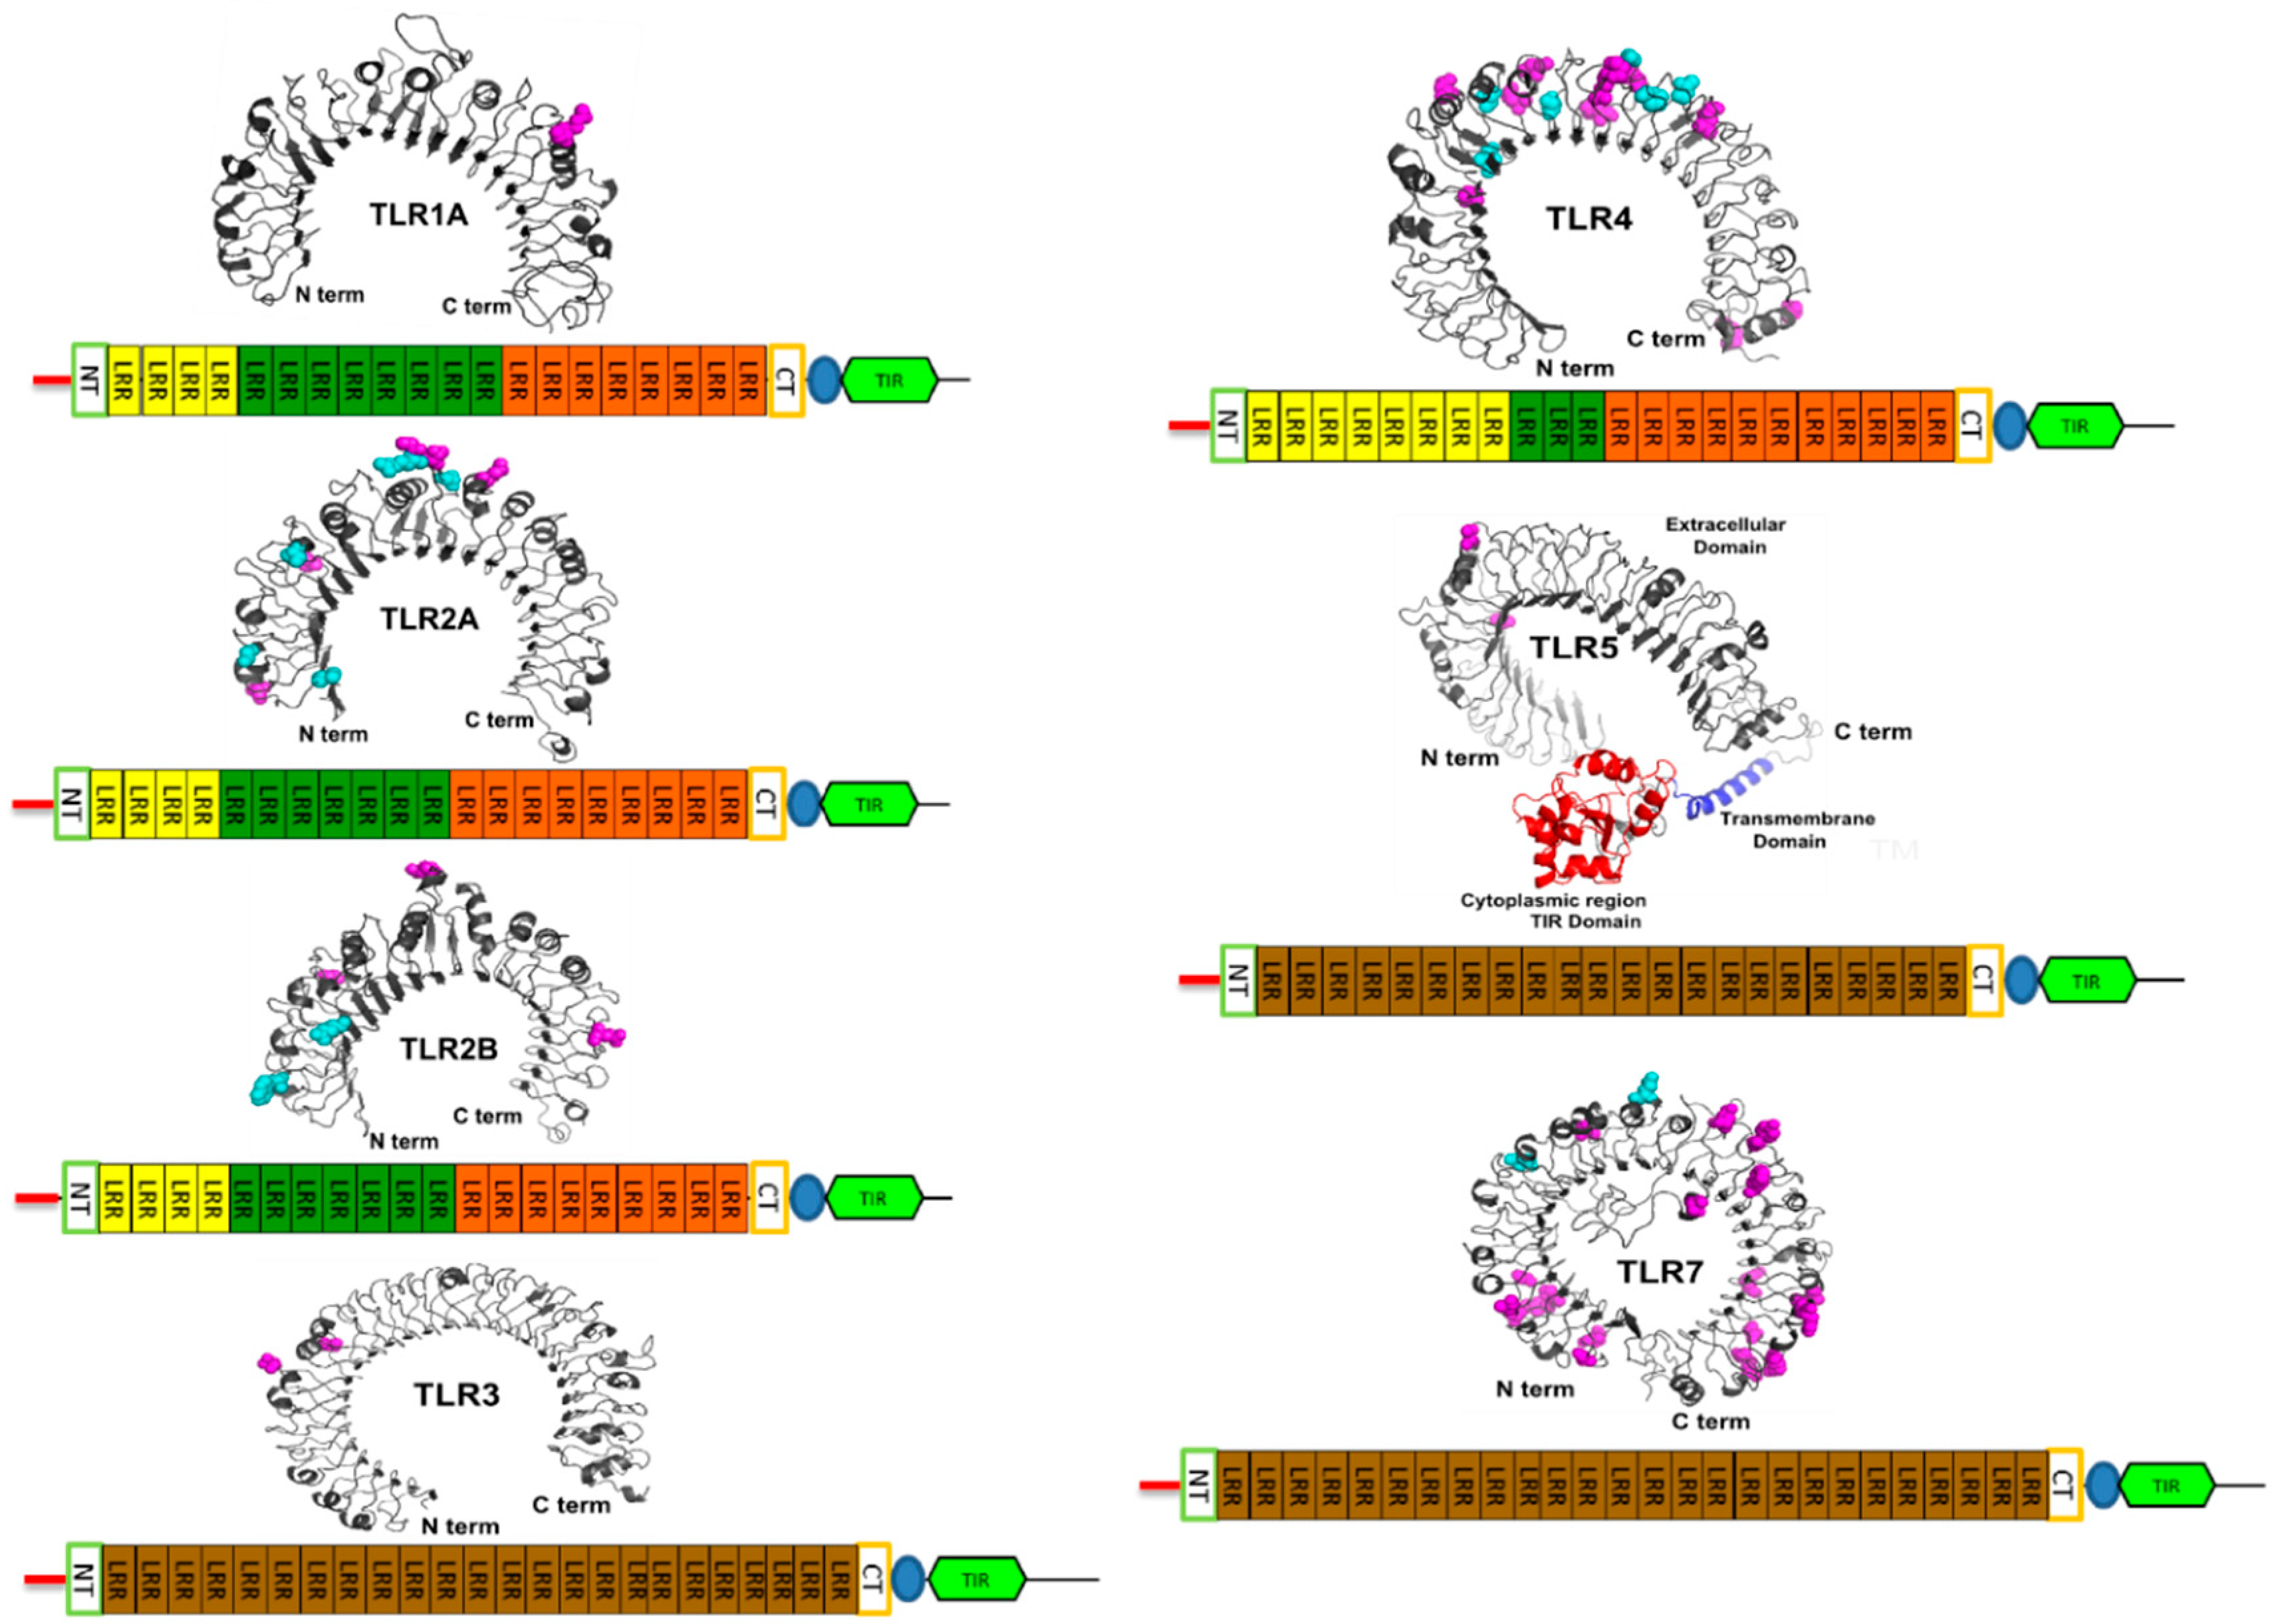
3.4. Vertebrate TLRs Domain Architecture
3.5. Rapid Adaptive Evolution of Avian TLRs
4. Discussion
5. Conclusions
Supplementary Materials
Author Contributions
Funding
Conflicts of Interest
References
- Akira, S.; Uematsu, S.; Takeuchi, O. Pathogen Recognition and Innate Immunity. Cell 2006, 124, 783–801. [Google Scholar] [CrossRef] [PubMed] [Green Version]
- Kawai, T.; Akira, S. The role of pattern-recognition receptors in innate immunity: Update on Toll-like receptors. Nat. Immunol. 2010, 11, 373–384. [Google Scholar] [CrossRef] [PubMed]
- Medzhitov, R. Toll-like receptors and innate immunity. Nat. Rev. Immunol. 2001, 1, 135–145. [Google Scholar] [CrossRef] [PubMed]
- Schnare, M.; Barton, G.M.; Holt, A.C.; Takeda, K.; Akira, S.; Medzhitov, R. Toll-like receptors control activation of adaptive immune responses. Nat. Immunol. 2001, 2, 947–950. [Google Scholar] [CrossRef]
- Iwasaki, A.; Medzhitov, R. Regulation of adaptive immunity by the innate immune system. Science 2010, 327, 291–295. [Google Scholar] [CrossRef] [PubMed]
- Imler, J.L.; Hoffmann, J.A. Toll Receptors in Drosophila: A Family of Molecules Regulating Development and Immunity. Curr. Top. Microbiol. Immunol. 2002, 270, 63–79. [Google Scholar]
- O’Neill, L.A.J.; Golenbock, D.; Bowie, A.G. The history of Toll-like receptors—Redefining innate immunity. Nat. Rev. Immunol. 2013, 13, 453–460. [Google Scholar] [CrossRef]
- Janeway, C.A.J.; Medzhitov, R. Innate immune recognition. Annu. Rev. Immunol. 2002, 20, 197–216. [Google Scholar] [CrossRef]
- Takeuchi, O.; Sato, S.; Horiuchi, T.; Hoshino, K.; Takeda, K.; Dong, Z.; Modlin, R.L.; Akira, S. Cutting edge: Role of Toll-like receptor 1 in mediating immune response to microbial lipoproteins. J. Immunol. 2002, 169, 10–14. [Google Scholar] [CrossRef]
- Gantner, B.N.; Simmons, R.M.; Canavera, S.J.; Akira, S.; Underhill, D.M. Collaborative induction of inflammatory responses by dectin-1 and Toll-like receptor 2. J. Exp. Med. 2003, 197, 1107–1117. [Google Scholar] [CrossRef]
- Kawai, T.; Akira, S. TLR signaling. Cell Death Differ. 2006, 13, 816–825. [Google Scholar] [CrossRef] [PubMed] [Green Version]
- Brodsky, I.; Medzhitov, R. Two Modes of Ligand Recognition by TLRs. Cell 2007, 130, 979–981. [Google Scholar] [CrossRef] [PubMed] [Green Version]
- Lee, J.; Jin, M.; Kim, S.; Heo, J. Crystal structure of the TLR1-TLR2 heterodimer induced by binding of a tri-acylated lipopeptide. Cell 2007, 130, 1071–1082. [Google Scholar]
- Jin, M.S.; Lee, J.O. Structures of TLR-ligand complexes. Curr. Opin. Immunol. 2008, 20, 414–419. [Google Scholar] [CrossRef] [PubMed]
- Botos, I.; Segal, D.M.; Davies, D.R. The Structural Biology of Toll-Like Receptors. Structure 2011, 19, 447–459. [Google Scholar] [CrossRef] [PubMed]
- O’Neill, L.A.J.; Bowie, A.G. The family of five: TIR-domain-containing adaptors in Toll-like receptor signalling. Nat. Rev. Immunol. 2007, 7, 353–364. [Google Scholar] [CrossRef] [PubMed]
- Doyle, S.L.; O’Neill, L.A.J. Toll-like receptors: From the discovery of NFkappaB to new insights into transcriptional regulations in innate immunity. Biochem. Pharmacol. 2006, 72, 1102–1113. [Google Scholar] [CrossRef] [PubMed]
- Takeda, K.; Akira, S. Microbial recognition by Toll-like receptors. J. Dermatol. Sci. 2004, 34, 73–82. [Google Scholar] [CrossRef] [PubMed]
- Medzhitov, R. Recognition of microorganisms and activation of the immune response. Nature 2007, 449, 819–826. [Google Scholar] [CrossRef] [PubMed]
- Kumar, H.; Kawai, T.; Akira, S. Toll-like receptors and innate immunity. Biochem. Biophys. Res. Commun. 2009, 388, 621–625. [Google Scholar] [CrossRef] [PubMed]
- Medzhitov, R.; Preston-Hurlburt, P.; Janeway, C.A. A human homologue of the Drosophila Toll protein signals activation of adaptive immunity. Nature 1997, 388, 394–397. [Google Scholar] [CrossRef] [PubMed]
- Matsushima, N.; Tanaka, T.; Enkhbayar, P.; Mikami, T.; Taga, M.; Yamada, K.; Kuroki, Y. Comparative sequence analysis of leucine-rich repeats (LRRs) within vertebrate toll-like receptors. BMC Genom. 2007, 8, 124. [Google Scholar] [CrossRef] [PubMed]
- Roach, J.C.; Glusman, G.; Rowen, L.; Kaur, A.; Purcell, M.K.; Smith, K.D.; Hood, L.E.; Aderem, A. The evolution of vertebrate Toll-like receptors. Proc. Natl. Acad. Sci. USA 2005, 102, 9577–9582. [Google Scholar] [CrossRef] [PubMed] [Green Version]
- Star, B.; Nederbragt, A.J.; Jentoft, S.; Grimholt, U.; Malmstrøm, M.; Gregers, T.F.; Rounge, T.B.; Paulsen, J.; Solbakken, M.H.; Sharma, A.; et al. The genome sequence of Atlantic cod reveals a unique immune system. Nature 2011, 477, 207–210. [Google Scholar] [CrossRef] [PubMed] [Green Version]
- Flajnik, M.F.; Kasahara, M. Origin and evolution of the adaptive immune system: Genetic events and selective pressures. Nat. Rev. Genet. 2010, 11, 47–59. [Google Scholar] [CrossRef] [PubMed]
- Litman, G.W.; Rast, J.P.; Fugmann, S.D. The origins of vertebrate adaptive immunity. Nat. Rev. Immunol. 2010, 10, 543–553. [Google Scholar] [CrossRef] [PubMed] [Green Version]
- Boudinot, P.; Zou, J.; Ota, T.; Buonocore, F.; Scapigliati, G.; Canapa, A.; Cannon, J.; Litman, G.; Hansen, J.D. A tetrapod-like repertoire of innate immune receptors and effectors for coelacanths. J. Exp. Zool. Part B Mol. Dev. Evol. 2014, 322, 415–437. [Google Scholar] [CrossRef] [PubMed]
- Amemiya, C.T.; Alföldi, J.; Lee, A.P.; Fan, S.; Philippe, H.; MacCallum, I.; Braasch, I.; Manousaki, T.; Schneider, I.; Rohner, N.; et al. The African coelacanth genome provides insights into tetrapod evolution. Nature 2013, 496, 311–316. [Google Scholar] [CrossRef] [Green Version]
- Altschul, S.F.; Gish, W.; Miller, W.; Myers, E.W.; Lipman, D.J. Basic local alignment search tool. J. Mol. Biol. 1990, 215, 403–410. [Google Scholar] [CrossRef]
- Jarvis, E.D.; Mirarab, S.; Aberer, A.J.; Li, B.; Houde, P.; Li, C.; Ho, S.Y.W.; Faircloth, B.C.; Nabholz, B.; Howard, J.T.; et al. Whole Genome Analyses Resolve Early Branches in the Tree of Life of Modern Birds. Science 2014, 346, 1320–1331. [Google Scholar] [CrossRef]
- Zhang, G.; Li, C.; Li, Q.; Li, B.; Larkin, D.M.; Lee, C.; Storz, J.F.; Antunes, A.; Greenwold, M.J.; Meredith, R.W.; et al. Comparative Genomics Reveals Insights into Avian Genome Evolution and Adaptation. Science 2014, 346, 1311–1320. [Google Scholar] [CrossRef] [PubMed]
- Muffato, M.; Louis, A.; Poisnel, C.E.; Crollius, H.R. Genomicus: A database and a browser to study gene synteny in modern and ancestral genomes. Bioinformatics 2010, 26, 1119–1121. [Google Scholar] [CrossRef]
- Louis, A.; Muffato, M.; Roest Crollius, H. Genomicus: Five genome browsers for comparative genomics in eukaryota. Nucleic Acids Res. 2012, 41, D700–D705. [Google Scholar] [CrossRef] [PubMed]
- Pereira, S.; Vasconcelos, V.M.; Antunes, A. The phosphoprotein phosphatase family of Ser/Thr phosphatases as principal targets of naturally occurring toxins. Crit. Rev. Toxicol. 2011, 41, 83–110. [Google Scholar] [CrossRef] [PubMed]
- Tamura, K.; Peterson, D.; Peterson, N.; Stecher, G.; Nei, M.; Kumar, S. MEGA5: Molecular Evolutionary Genetics Analysis Using Maximum Likelihood, Evolutionary Distance, and Maximum Parsimony Methods. Mol. Biol. Evol. 2011, 28, 2731–2739. [Google Scholar] [CrossRef] [PubMed] [Green Version]
- Edgar, R.C. MUSCLE: A multiple sequence alignment method with reduced time and space complexity. BMC Bioinform. 2004, 5, 113. [Google Scholar] [CrossRef] [PubMed]
- Gouy, M.; Guindon, S.; Gascuel, O. SeaView version 4: A multiplatform graphical user interface for sequence alignment and phylogenetic tree building. Mol. Biol. Evol. 2010, 27, 221–224. [Google Scholar] [CrossRef]
- Darriba, D.; Taboada, G.L.; Doallo, R.; Posada, D. jModelTest 2: More models, new heuristics and parallel computing. Nat. Methods 2012, 9, 772. [Google Scholar] [CrossRef]
- Guindon, S.; Gascuel, O. A Simple, Fast, and Accurate Algorithm to Estimate Large Phylogenies by Maximum Likelihood. Syst. Biol. 2003, 52, 696–704. [Google Scholar] [CrossRef] [Green Version]
- Felsenstein, J. Confidence Limits on Phylogenies: An Approach Using the Bootstrap. Evolution 1985, 39, 783–791. [Google Scholar] [CrossRef]
- Xia, X. DAMBE5: A Comprehensive Software Package for Data Analysis in Molecular Biology and Evolution. Mol. Biol. Evol. 2013, 30, 1720–1728. [Google Scholar] [CrossRef] [PubMed] [Green Version]
- Huelsenbeck, J.P.; Rannala, B. Phylogenetic Methods Come of Age: Testing Hypotheses in an Evolutionary Context. Science 1997, 276, 227–232. [Google Scholar] [CrossRef] [PubMed] [Green Version]
- Xia, X.; Xie, Z.; Salemi, M.; Chen, L.; Wang, Y. An index of substitution saturation and its application. Mol. Phylogenet. Evol. 2003, 26, 1–7. [Google Scholar] [CrossRef]
- Pond, S.L.K.; Posada, D.; Gravenor, M.B.; Woelk, C.H.; Frost, S.D.W. GARD: A genetic algorithm for recombination detection. Bioinformatics 2006, 22, 3096–3098. [Google Scholar] [CrossRef] [PubMed]
- Sawyer, S. Statistical tests for detecting gene conversion. Mol. Biol. Evol. 1989, 6, 526–538. [Google Scholar]
- Alcaide, M.; Edwards, S.V. Molecular Evolution of the Toll-Like Receptor Multigene Family in Birds. Mol. Biol. Evol. 2011, 28, 1703–1715. [Google Scholar] [CrossRef] [PubMed] [Green Version]
- Pereira, S.R.; Vasconcelos, V.; Antunes, A. Computational Study of the Covalent Bonding of Microcystins to Cysteine Residues—A Reaction Involved in the Inhibition of the PPP Family of Protein Phosphatases. FEBS J. 2013, 280, 674–680. [Google Scholar] [CrossRef] [PubMed]
- Cormican, P.; Lloyd, A.T.; Downing, T.; Connell, S.J.; Bradley, D.; O’Farrelly, C. The avian Toll-Like receptor pathway—Subtle differences amidst general conformity. Dev. Comp. Immunol. 2009, 33, 967–973. [Google Scholar] [CrossRef]
- Grueber, C.E.; Wallis, G.P.; King, T.M.; Jamieson, I.G. Variation at Innate Immunity Toll-Like Receptor Genes in a Bottlenecked Population of a New Zealand Robin. PLoS ONE 2012, 7, e45011. [Google Scholar] [CrossRef]
- Velová, H.; Gutowska-Ding, M.W.; Burt, D.W.; Vinkler, M. Toll-like receptor evolution in birds: Gene duplication, pseudogenisation and diversifying selection. Mol. Biol. Evol. 2018, 35, 2170–2184. [Google Scholar] [CrossRef]
- Yang, Z. PAML: A program package for phylogenetic analysis by maximum likelihood. Bioinformatics 1997, 13, 555–556. [Google Scholar] [CrossRef]
- Yang, Z. PAML 4: Phylogenetic Analysis by Maximum Likelihood. Mol. Biol. Evol. 2007, 24, 1586–1591. [Google Scholar] [CrossRef] [PubMed] [Green Version]
- Maldonado, E.; Almeida, D.; Escalona, T.; Khan, I.; Vasconcelos, V.; Antunes, A. LMAP: Lightweight Multigene Analyses in PAML. BMC Bioinform. 2016, 17, 354. [Google Scholar] [CrossRef] [PubMed]
- Pond, S.L.K.; Frost, S.D.W.; Pond, S.L.K. Datamonkey: Rapid detection of selective pressure on individual sites of codon alignments. Bioinformatics 2005, 21, 2531–2533. [Google Scholar] [CrossRef] [PubMed]
- Woolley, S.; Johnson, J.; Smith, M.J.; Crandall, K.A.; McClellan, D.A. TreeSAAP: Selection on Amino Acid Properties using phylogenetic trees. Bioinformatics 2003, 19, 671–672. [Google Scholar] [CrossRef] [PubMed] [Green Version]
- Pond, S.L.K.; Muse, S.V. HyPhy: Hypothesis testing using phylogenies. Bioinformatics 2005, 21, 676–679. [Google Scholar] [CrossRef] [PubMed]
- Delport, W.; Poon, A.F.Y.; Frost, S.D.W.; Kosakovsky Pond, S.L. Datamonkey 2010: A suite of phylogenetic analysis tools for evolutionary biology. Bioinformatics 2010, 26, 2455–2457. [Google Scholar] [CrossRef] [PubMed]
- Pond, S.L.K.; Frost, S.D.W. Not So Different After All: A Comparison of Methods for Detecting Amino Acid Sites Under Selection. Mol. Biol. Evol. 2005, 22, 1208–1222. [Google Scholar] [CrossRef] [PubMed] [Green Version]
- Murrell, B.; Wertheim, J.O.; Moola, S.; Weighill, T.; Scheffler, K.; Pond, S.L.K. Detecting Individual Sites Subject to Episodic Diversifying Selection. PLoS Genet. 2012, 8, e1002764. [Google Scholar] [CrossRef]
- Murrell, B.; Moola, S.; Mabona, A.; Weighill, T.; Sheward, D.; Pond, S.L.K.; Scheffler, K. FUBAR: A Fast, Unconstrained Bayesian AppRoximation for Inferring Selection. Mol. Biol. Evol. 2013, 30, 1196–1205. [Google Scholar] [CrossRef] [Green Version]
- Fry, B.G.; Undheim, E.A.B.; Ali, S.A.; Debono, J.; Scheib, H.; Ruder, T.; Jackson, T.N.W.; Morgenstern, D.; Cadwallader, L.; Whitehead, D.; et al. Squeezers and leaf-cutters: Differential diversification and degeneration of the venom system in toxicoferan reptiles. Mol. Cell. Proteom. 2013, 12, 1881–1899. [Google Scholar] [CrossRef]
- Undheim, E.A.B.; Sunagar, K.; Herzig, V.; Kely, L.; Low, D.H.W.; Jackson, T.N.W.; Jones, A.; Kurniawan, N.; King, G.F.; Ali, S.A.; et al. A Proteomics and Transcriptomics Investigation of the Venom from the Barychelid Spider Trittame loki (Brush-Foot Trapdoor). Toxins 2013, 5, 2488–2503. [Google Scholar] [CrossRef] [PubMed] [Green Version]
- Sunagar, K.; Fry, B.; Jackson, T.N.W.; Casewell, N.R.; Undheim, E.A.B.; Vidal, N.; Ali, S.A.; King, G.F.; Vasudevan, K.; Vasconcelos, V.; et al. Molecular evolution of vertebrate neurotrophins: Co-option of the highly conserved nerve growth factor gene into the advanced snake venom arsenal. PLoS ONE 2013, 8, e81827. [Google Scholar] [CrossRef]
- Temperley, N.D.; Berlin, S.; Paton, I.R.; Griffin, D.K.; Burt, D.W. Evolution of the chicken Toll-like receptor gene family: A story of gene gain and gene loss. BMC Genom. 2008, 9, 62. [Google Scholar] [CrossRef] [PubMed]
- Sundaram, A.Y.; Kiron, V.; Dopazo, J.; Fernandes, J.M. Diversification of the expanded teleost-specific toll-like receptor family in Atlantic cod, Gadus morhua. BMC Evol. Biol. 2012, 12, 256. [Google Scholar] [CrossRef] [PubMed]
- Blomme, T.; Vandepoele, K.; De Bodt, S.; Simillion, C.; Maere, S.; Van De Peer, Y. The gain and loss of genes during 600 million years of vertebrate evolution. Genome Biol. 2006, 7, R43. [Google Scholar] [CrossRef] [PubMed]
- DeMuth, J.P.; De Bie, T.; Stajich, J.E.; Cristianini, N.; Hahn, M.W. The Evolution of Mammalian Gene Families. PLoS ONE 2006, 1, e85. [Google Scholar] [CrossRef] [PubMed]
- Almeida, D.; Maldonado, E.; Khan, I.; Silva, L.; Gilbert, M.T.P.; Zhang, G.; Jarvis, E.D.; O’Brien, S.J.; Johnson, W.E.; Antunes, A. Whole-Genome Identification, Phylogeny, and Evolution of the Cytochrome P450 Family 2 (CYP2) Subfamilies in Birds. Genome Biol. Evol. 2016, 8, 1115–1131. [Google Scholar] [CrossRef] [PubMed]
- da Fonseca, R.; Antunes, A.; Melo, A.; Ramos, M.J. Structural divergence and adaptive evolution in mammalian cytochromes P450 2C. Gene 2007, 387, 58–66. [Google Scholar] [CrossRef]
- Machado, J.P.; Johnson, E.W.; O’Brien, S.J.; Vasconcelos, V.; Antunes, A. Adaptive evolution of the matrix extracellular phosphoglycoprotein in mammals. BMC Evol. Biol. 2011, 11, 342. [Google Scholar] [CrossRef]
- Khan, I.; Maldonado, E.; Vasconcelos, V.; O’Brien, S.J.; Johnson, W.E.; Antunes, A. Mammalian keratin associated proteins (KRTAPs) subgenomes: Disentangling hair diversity and adaptation to terrestrial and aquatic environments. BMC Genom. 2014, 15, 779. [Google Scholar] [CrossRef]
- Khan, I.; Yang, Z.; Maldonado, E.; Li, C.; Zhang, G.; Gilbert, M.T.P.; Jarvis, E.D.; O’Brien, S.J.; Johnson, W.E.; Antunes, A. Olfactory Receptor Subgenomes Linked with Broad Ecological Adaptations in Sauropsida. Mol. Biol. Evol. 2015, 32, 2832–2843. [Google Scholar] [CrossRef] [Green Version]
- Silva, L.; Antunes, A. Vomeronasal Receptors in Vertebrates and the Evolution of Pheromone Detection. Annu. Rev. Anim. Biosci. 2017, 5, 353–370. [Google Scholar] [CrossRef] [Green Version]
- Luo, S.J.; Johnson, W.E.; Martenson, J.; Antunes, A.; Martelli, P.; Uphyrkina, O.; Traylor-Holzer, K.; Smith, J.L.; O’Brien, S.J. Subspecies Genetic Assignments of Worldwide Captive Tigers Increase Conservation Value of Captive Populations. Curr. Biol. 2008, 18, 592–596. [Google Scholar] [CrossRef] [Green Version]
- Kasamatsu, J.; Oshiumi, H.; Matsumoto, M.; Kasahara, M.; Seya, T. Phylogenetic and expression analysis of lamprey toll-like receptors. Dev. Comp. Immunol. 2010, 34, 855–865. [Google Scholar] [CrossRef] [Green Version]
- Zhang, J.; Liu, S.; Rajendran, K.; Sun, L.; Zhang, Y.; Sun, F.; Kucuktas, H.; Liu, H.; Liu, Z. Pathogen recognition receptors in channel catfish: III Phylogeny and expression analysis of Toll-like receptors. Dev. Comp. Immunol. 2013, 40, 185–194. [Google Scholar] [CrossRef]
- Huang, Y.; Temperley, N.D.; Ren, L.; Smith, J.; Li, N.; Burt, D.W. Molecular evolution of the vertebrate TLR1 gene family—A complex history of gene duplication, gene conversion, positive selection and co-evolution. BMC Evol. Biol. 2011, 11, 149. [Google Scholar] [CrossRef]
- Kang, J.Y.; Lee, J.O. Structural Biology of the Toll-Like Receptor Family. Annu. Rev. Biochem. 2011, 80, 917–941. [Google Scholar] [CrossRef]
- Kang, J.Y.; Nan, X.; Jin, M.S.; Youn, S.J.; Ryu, Y.H.; Mah, S.; Han, S.H.; Lee, H.; Paik, S.G.; Lee, J.O. Recognition of Lipopeptide Patterns by Toll-like Receptor 2-Toll-like Receptor 6 Heterodimer. Immunity 2009, 31, 873–884. [Google Scholar] [CrossRef] [Green Version]
- Guan, Y.; Ranoa, D.R.E.; Jiang, S.; Mutha, S.K.; Li, X.; Baudry, J.; Tapping, R.I. Human TLRs 10 and 1 share common mechanisms of innate immune sensing but not signaling. J. Immunol. 2010, 184, 5094–5103. [Google Scholar] [CrossRef]
- Wlasiuk, G.; Nachman, M.W. Adaptation and Constraint at Toll-Like Receptors in Primates. Mol. Biol. Evol. 2010, 27, 2172–2186. [Google Scholar] [CrossRef] [Green Version]
- Liu, L.; Botos, I.; Wang, Y.; Leonard, J.N.; Shiloach, J.; Segal, D.M.; Davies, D.R. Structural basis of Toll-Like Receptor 3 Signaling with double-stranded RNA. Science 2008, 320, 379–381. [Google Scholar] [CrossRef]
- Kim, H.M.; Park, B.S.; Kim, J.I.; Kim, S.E.; Lee, J.; Oh, S.C.; Enkhbayar, P.; Matsushima, N.; Lee, H.; Yoo, O.J.; et al. Crystal Structure of the TLR4-MD-2 Complex with Bound Endotoxin Antagonist Eritoran. Cell 2007, 130, 906–917. [Google Scholar] [CrossRef] [Green Version]
- Park, B.S.; Song, D.H.; Kim, H.M.; Choi, B.S.; Lee, H.; Lee, J.O. The structural basis of lipopolysaccharide recognition by the TLR4–MD-2 complex. Nature 2009, 458, 1191–1195. [Google Scholar] [CrossRef]
- Kumar, H.; Kawai, T.; Akira, S. Pathogen recognition in the innate immune response. Biochem. J. 2009, 420, 1–16. [Google Scholar] [CrossRef] [Green Version]
- Hajjar, A.M.; Ernst, R.K.; Tsai, J.H.; Wilson, C.B.; Miller, S.I. Human Toll-like receptor 4 recognizes host-specific LPS modifications. Nat. Immunol. 2002, 3, 354–359. [Google Scholar] [CrossRef]
- Hayashi, F.; Smith, K.D.; Ozinsky, A.; Hawn, T.R.; Yi, E.C.; Goodlett, D.R.; Eng, J.K.; Akira, S.; Underhill, D.M.; Aderem, A. The innate immune response to bacterial flagellin is mediated by Toll-like receptor. Nature 2001, 410, 1099–1103. [Google Scholar] [CrossRef]
- Andersen-Nissen, E.; Smith, K.D.; Bonneau, R.; Strong, R.K.; Aderem, A. A conserved surface on Toll-like receptor 5 recognizes bacterial flagellin. J. Exp. Med. 2007, 204, 393–403. [Google Scholar] [CrossRef] [Green Version]
- Andersen-Nissen, E.; Smith, K.D.; Strobe, K.L.; Barrett, S.L.R.; Cookson, B.T.; Logan, S.M.; Aderem, A. Evasion of Toll-like receptor 5 by flagellated bacteria. Proc. Natl. Acad. Sci. USA 2005, 102, 9247–9252. [Google Scholar] [CrossRef] [Green Version]
- Gantier, M.P.; Tong, S.; Behlke, M.A.; Xu, D.; Phipps, S.; Foster, P.S.; Williams, B.R.G. TLR7 is involved in sequence-specific sensing of single-stranded RNAs in human macrophages. J. Immunol. 2008, 180, 2117–2124. [Google Scholar] [CrossRef]
- Wang, L.F.; Walker, P.J.; Poon, L.L. Mass extinctions, biodiversity and mitochondrial function: Are bats ‘special’ as reservoirs for emerging viruses? Curr. Opin. Virol. 2011, 1, 649–657. [Google Scholar] [CrossRef]
- Zhang, G.; Cowled, C.; Shi, Z.; Huang, Z.; Bishop-Lilly, K.A.; Fang, X.; Wynne, J.W.; Xiong, Z.; Baker, M.L.; Zhao, W.; et al. Comparative Analysis of Bat Genomes Provides Insight into the Evolution of Flight and Immunity. Science 2013, 339, 456–460. [Google Scholar] [CrossRef] [Green Version]
- Lund, J.M.; Alexopoulou, L.; Sato, A.; Karow, M.; Adams, N.C.; Gale, N.W.; Iwasaki, A.; Flavell, R.A. Recognition of single-stranded RNA viruses by Toll-like receptor. Proc. Natl. Acad. Sci. USA 2004, 101, 5598–5603. [Google Scholar] [CrossRef]
- Boyd, A.C.; Peroval, M.Y.; Hammond, J.A.; Prickett, M.D.; Young, J.R.; Smith, A.L. TLR15 Is Unique to Avian and Reptilian Lineages and Recognizes a Yeast-Derived Agonist. J. Immunol. 2012, 189, 4930–4938. [Google Scholar] [CrossRef] [Green Version]
- Areal, H.; Abrantes, J.; Esteves, P.J. Signatures of positive selection in Toll-like receptor (TLR) genes in mammals. BMC Evol. Biol. 2011, 11, 368. [Google Scholar] [CrossRef]
- Slack, J.L. Identification of Two Major Sites in the Type I Interleukin-1 Receptor Cytoplasmic Region Responsible for Coupling to Pro-inflammatory Signaling Pathways. J. Biol. Chem. 2000, 275, 4670–4678. [Google Scholar] [CrossRef] [Green Version]
- Lahn, B.T.; Vallender, E.J. Positive selection on the human genome. Hum. Mol. Genet. 2004, 13 (Suppl. S2), R245–R254. [Google Scholar] [Green Version]
- Sackton, T.B.; Lazzaro, B.P.; A Schlenke, T.; Evans, J.D.; Hultmark, D.; Clark, A.G. Dynamic evolution of the innate immune system in Drosophila. Nat. Genet. 2007, 39, 1461–1468. [Google Scholar] [CrossRef]
- Kosiol, C.; Vinar, T.; Da Fonseca, R.R.; Hubisz, M.J.; Bustamante, C.D.; Nielsen, R.; Siepel, A. Patterns of Positive Selection in Six Mammalian Genomes. PLoS Genet. 2008, 4, e1000144. [Google Scholar] [CrossRef]
- Reed, K.D.; Meece, J.K.; Henkel, J.S.; Shukla, S.K. Birds, Migration and Emerging Zoonoses: West Nile Virus, Lyme Disease, Influenza A and Enteropathogens. Clin. Med. Res. 2003, 1, 5–12. [Google Scholar] [CrossRef] [Green Version]
- Nielsen, R.; Bustamante, C.; Clark, A.G.; Glanowski, S.; Sackton, T.B.; Hubisz, M.J.; Fledel-Alon, A.; Tanenbaum, D.M.; Civello, D.; White, T.J.; et al. A Scan for Positively Selected Genes in the Genomes of Humans and Chimpanzees. PLoS Biol. 2005, 3, e170. [Google Scholar] [CrossRef]


| Class | Species Number | Species Scientific Name | TLR1 | TLR3 | TLR4 | TLR5 | TLR7 | TLR11 | Total F/P (Copies F/P) | ||||||||||||||||||||
|---|---|---|---|---|---|---|---|---|---|---|---|---|---|---|---|---|---|---|---|---|---|---|---|---|---|---|---|---|---|
| 1 | 6 | 10 | 2 | 14 | 15 | 18 | 24 | 25 | 27 | 3 | 4 | 5 | 7 | 8 | 9 | 11 | 12 | 13 | 16 | 19 | 20 | 21 | 22 | 23 | 26 | ||||
| Mammalia | 1 | Homo sapiens | 1 | 1 | 1 | 1 | 0 | 0 | 0 | 0 | 0 | 0 | 1 | 1 | 1 | 1 | 1 | 1 | 0 | 0(1) | 0 | 0 | 0 | 0 | 0 | 0 | 0 | 0 | 10/1(10/1) |
| 2 | Mus musculus | 1 | 1 | 0 (1) | 1 | 0 | 0 | 0 | 0 | 0 | 0 | 1 | 1 | 1 | 1 | 1 | 1 | 1 | 1 | 1 | 0 | 0 | 0 | 0 | 0 | 0 | 0 | 12/1(12/1) | |
| 3 | Monodelphis domestica | 1 | 0 | 1 | 1 | 0 | 0 | 0 | 0 | 0 | 0 | 1 | 1 | 1 | 1 | 1 | 1 | 0 | 1 | 1 | 0 | 0 | 0 | 0 | 0 | 0 | 0 | 11/0(11/0) | |
| 4 | Ornithorhynchus anatinus | 1 | 0 | 1 | 1 | 0 | 0 | 0 | 0 | 0 | 0 | 1 | 1 | 1 | 1 | 1 | 1 | 0 | 1 | 1 | 0 | 0 | 0 | 0 | 0 | 0 | 0 | 11/0(11/0) | |
| 5 | Myotis lucifugus | 1 | 1 | 0 | 1 | 0 | 0 | 0 | 0 | 0 | 0 | 1 | 1 | 1 | 1 | 1 | 1 | 1 | 1 | 1 | 0 | 0 | 0 | 0 | 0 | 0 | 0 | 12/0(12/0) | |
| 6 | Equus caballus | 1 | 1 | 1 | 1 | 0 | 0 | 0 | 0 | 0 | 0 | 1 | 2 | 1 | 1 | 1 | 1 | 1 | 1 | 1 | 0 | 0 | 0 | 0 | 0 | 0 | 0 | 13/0(14/0) | |
| 7 | Canis familiaris | 1 | 1 | 1 | 1 | 0 | 0 | 0 | 0 | 0 | 0 | 1 | 1 | 1 | 1 | 1 | 1 | 0 | 0 | 0 | 0 | 0 | 0 | 0 | 0 | 0 | 0 | 10/0(10/0) | |
| 8 | Bos taurus | 1 | 1 | 1 | 1 | 0 | 0 | 0 | 0 | 0 | 0 | 1 | 1 | 1 | 1 | 0(1) | 1 | 0 | 0 | 0 | 0 | 0 | 0 | 0 | 0 | 0 | 0 | 10/1(10/1) | |
| Aves | 9 | Gallus gallus | 2 | 0 | 0 | 2 | 0 | 1 | 0 | 0 | 0 | 0 | 1 | 1 | 1 | 1 | 0 | 0 | 0 | 0 | 0 | 0 | 0 | 0 | 1 | 0 | 0 | 0 | 8/0(10/0) |
| 10 | Meleagris gallopavo | 2 | 0 | 0 | 2 | 0 | 1 | 0 | 0 | 0 | 0 | 1 | 1 | 1 | 1 | 0 | 0 | 0 | 0 | 0 | 0 | 0 | 0 | 1 | 0 | 0 | 0 | 8/0(10/0) | |
| 11 | Taeniopygia guttata | 2 | 0 | 0 | 2 | 0 | 1 | 0 | 0 | 0 | 0 | 1 | 1 | 1 | 2 | 0 | 0 | 0 | 0 | 0 | 0 | 0 | 0 | 1 | 0 | 0 | 0 | 8/0(11/0) | |
| Reptilia | 12 | Crocodylus porosus | 2 | 0 | 0 | 2 | 0 | 1 | 1 | 0 | 0 | 0 | 1 | 1 | 1 | 1 | 2 | 0 | 0 | 0 | 1 | 0 | 0 | 0 | 1 | 1 | 0 | 0 | 12/0(15/0) |
| 13 | Gavialis gangeticus | 2 | 0 | 0 | 2 | 0 | 1 | 1 | 0 | 0 | 0 | 1 | 1 | 1 | 1 | 2 | 0 | 0 | 0 | 1 | 0 | 0 | 0 | 1 | 1 | 0 | 0 | 12/0(15/0) | |
| 14 | Alligator mississippiensis | 2 | 0 | 0 | 2 | 0 | 1 | 1 | 0 | 0 | 0 | 1 | 1 | 2 | 1 | 2 | 0 | 0 | 0 | 2 | 0 | 0 | 0 | 1 | 1 | 0 | 0 | 12/0(17/0) | |
| 15 | Pelodiscus sinensis | 2 | 0 | 0 | 2(1) | 0 | 0 | 1 | 0 | 0 | 0 | 1 | 1 | 2 | 1 | 3 | 1 | 0 | 0 | 0 | 0 | 0 | 0 | 1 | 2 | 0 | 0 | 11/0(18/1) | |
| 16 | Chelonia mydas | 1 | 0 | 0 | 2(2) | 0 | 0 | 1 | 0 | 0 | 0 | 1 | 1 | 2 | 1 | 2(1) | 1 | 0 | 0 | 0 | 0 | 0 | 0 | 1 | 1 | 0 | 0 | 11/0(17/2) | |
| 17 | Chrysemys picta | 2 | 0 | 0 | 2(1) | 0 | 0 | 1 | 0 | 0 | 0 | 1 | 1 | 2 | 1 | 3 | 1 | 0 | 0 | 1 | 0 | 0 | 0 | 1 | 1 | 0 | 0 | 12/0(18/1) | |
| 18 | Anolis carolinensis | 2 | 0 | 0 | 2 | 0 | 1 | 1 | 0 | 0 | 0 | 1 | 1 | 2 | 1 | 0 | 0 | 0 | 0 | 1 | 0 | 0 | 0 | 1 | 1 | 0 | 0 | 11/0(14/0) | |
| 19 | Python molurus | 1 | 0 | 0 | 2 | 0 | 1 | 1 | 0 | 0 | 0 | 1 | 1 | 2 | 1 | 0 | 0 | 0 | 0 | 0 | 0 | 0 | 0 | 1 | 1 | 0 | 0 | 10/0(12/0) | |
| 20 | Protobothrops mucrosquamatus | 1 | 0 | 0 | 3 | 0 | 1 | 0 | 0 | 0 | 0 | 1 | 1 | 2 | 1 | 0 | 0 | 0 | 0 | 1 | 0 | 0 | 0 | 1 | 0 | 0 | 0 | 9/0(12/0) | |
| 21 | Pogona vitticeps | 2 | 0 | 0 | 2 | 0 | 0 | 1 | 0 | 0 | 0 | 1 | 1 | 4 | 1 | 0 | 0 | 0 | 0 | 1 | 0 | 0 | 0 | 1 | 1 | 0 | 0 | 10/0(15/0) | |
| 22 | Gekko japonicus | 2 | 0 | 0 | 1 | 0 | 1 | 1 | 0 | 0 | 0 | 1 | 1 | 2 | 1 | 0 | 0 | 0 | 0 | 1 | 0 | 0 | 0 | 1 | 1 | 0 | 0 | 11/0(13/0) | |
| Amphibia | 23 | Xenopus tropicalis | 2 | 0 | 0 | 2 | 4 | 0 | 0 | 0 | 0 | 0 | 1 | 0 | 2 | 1 | 2 | 1 | 0 | 0 | 1 | 1 | 0 | 0 | 1 | 1 | 0 | 0 | 12/0(20/0) |
| Sarcopterygii (lobe-finned fishes) | 24 | Latimeria chalumnae | 1 | 0 | 0 | 2 | 0 | 0 | 1 | 0 | 0 | 1 | 1 | 0 | 1(1) | 2 | 1 | 1 | 0 | 0 | 1 | 0 | 0 | 0 | 3 | 0 | 0 | 0 | 11/0(16/1) |
| Actinopterygii (ray-finned fishes) | 25 | Xiphophorus maculatus | 1 | 0 | 0 | 2 | 0 | 0 | 1 | 0 | 0 | 0 | 1 | 0 | 2 | 1 | 1 | 1 | 0 | 0 | 0 | 0 | 0 | 0 | 1 | 3 | 6 | 0 | 11/0(20/0) |
| 26 | Oryzias latipes | 1 | 0 | 0 | 1 | 0 | 0 | 1 | 0 | 1 | 0 | 1 | 0 | 2 | 1 | 1 | 1 | 0 | 0 | 0 | 0 | 0 | 0 | 1 | 1 | 0 | 0 | 11/0(12/0) | |
| 27 | Oreochromis niloticus | 1 | 0 | 0 | 5 | 0 | 0 | 1 | 0 | 1 | 0 | 1 | 0 | 2 | 1 | 2 | 1 | 0 | 0 | 0 | 0 | 0 | 0 | 3 | 3 | 3 | 0 | 12/0(24/0) | |
| 28 | Gasterosteus aculeatus | 1 | 0 | 0 | 1 | 0 | 0 | 1 | 0 | 0 | 0 | 1 | 0 | 3 | 1 | 1 | 1 | 0 | 0 | 0 | 0 | 0 | 0 | 2 | 1 | 0 | 0 | 10/0(13/0) | |
| 29 | Takifugu rubripes | 1 | 0 | 0 | 1 | 0 | 0 | 1 | 0 | 0 | 0 | 1 | 0 | 2 | 1 | 1 | 1 | 0 | 0 | 0 | 0 | 0 | 0 | 1 | 1 | 1 | 0 | 11/0(12/0) | |
| 30 | Tetraodon nigroviridis | 1 | 0 | 0 | 1 | 0 | 0 | 1 | 0 | 0 | 0 | 1 | 0 | 2 | 1 | 1 | 1 | 0 | 0 | 0 | 0 | 0 | 0 | 1 | 1 | 1 | 0 | 11/0(12/0) | |
| 31 | Gadus morhua | 0 | 0 | 0 | 0 | 0 | 0 | 1 | 0 | 7 | 0 | 1 | 0 | 0 | 1 | 12 | 5 | 0 | 0 | 0 | 0 | 0 | 0 | 1 | 12 | 1 | 0 | 9/0(41/0) | |
| 32 | Danio rerio | 1 | 0 | 0 | 1 | 0 | 0 | 1 | 0 | 0 | 0 | 1 | 3 | 2 | 1(2) | 3 | 1 | 0 | 0 | 0 | 0 | 2 | 6 | 1 | 1 | 0 | 0 | 13/0(26/2) | |
| 33 | Ictalurus punctatus | 1 | 0 | 0 | 1 | 0 | 0 | 1 | 0 | 1 | 0 | 1 | 2 | 3 | 1 | 2 | 1 | 0 | 0 | 0 | 0 | 1 | 2 | 1 | 1 | 0 | 1 | 15/0(20/0) | |
| Cephalaspidomorphi (lampreys) | 34 | Petromyzon marinus | 0 | 0 | 0 | 0 | 4 | 0 | 0 | 2 | 0 | 0 | 1 | 0 | 0 | 7/8 | 7/8 | 0 | 0 | 0 | 0 | 0 | 0 | 0 | 3 | 1 | 0 | 0 | 6/0(13/0) |
| Gene | Model | Likelihood (lnL) | Parameters | 2ΔlnL (LRT) | Significance (P-Value) | No. of PS Sites |
|---|---|---|---|---|---|---|
| TLR1A | M1A | −8578.3621 | p:0.65788 0.34212 | |||
| w:0.07820 1.00000 | ||||||
| M2A | −8568.3574 | p:0.65059 0.30720 0.04221 | 20.0096 | 4.52 × 10⁻⁵ | 9, 1 *, 0 ** | |
| w:0.08172 1.00000 2.43025 | ||||||
| M7 | −8574.9757 | p = 0.24899 q = 0.48700 | ||||
| M8 | −8557.0925 | p0 = 0.93283 p = 0.32098 q = 0.81643 | 35.7664 | 1.71 × 10⁻⁸ | 9, 5 *, 1 ** | |
| (p1 = 0.06717) w = 1.97137 | ||||||
| TLR1B | M1A | −15,198.7487 | p:0.64884 0.35116 | |||
| w:0.09042 1.00000 | ||||||
| M2A | −15,173.1918 | p:0.63406 0.31995 0.04599 | 51.1138 | 7.96 × 10⁻¹² | 12, 7 *, 2 ** | |
| w:0.09272 1.00000 2.46912 | ||||||
| M7 | −15,185.5024 | p = 0.25368 q = 0.45987 | ||||
| M8 | −15,147.3293 | p0 = 0.91288 p = 0.34184 q = 0.83943 | 76.3463 | 2.64 × 10⁻¹⁷ | 20, 14 *, 4 ** | |
| (p1 = 0.08712) w = 1.88577 | ||||||
| TLR2A | M1A | −14,595.1078 | p:0.58122 0.41878 | |||
| w:0.14194 1.00000 | ||||||
| M2A | −14,510.3897 | p:0.53089 0.40739 0.06172 | 169.4363 | 1.61 × 10−37 | 18, 13 *, 11 ** | |
| w:0.13788 1.00000 3.10556 | ||||||
| M7 | −14,590.6910 | p = 0.34904 q = 0.40071 | ||||
| M8 | −14,500.5430 | p0 = 0.91485 p = 0.40926 q = 0.52204 | 180.2960 | 7.07 × 10−40 | 20, 16 *, 11 ** | |
| (p1 = 0.08515) w = 2.56498 | ||||||
| TLR2B | M1A | −17,453.3413 | p:0.70636 0.29364 | |||
| w:0.08820 1.00000 | ||||||
| M2A | −17,429.5429 | p:0.69833 0.27518 0.02650 | 47.5967 | 4.62 × 10⁻¹¹ | 10, 6 *, 0 ** | |
| w:0.09079 1.00000 2.72661 | ||||||
| M7 | −17,439.5787 | p = 0.24244 q = 0.52859 | ||||
| M8 | −17,403.8206 | p0 = 0.94556 p = 0.29832 q = 0.80619 | 71.5161 | 2.95 × 10⁻¹⁶ | 12, 10 *, 5 ** | |
| (p1 = 0.05444) w = 1.98273 | ||||||
| TLR3 | M1A | −17,682.7154 | p:0.70932 0.29068 | |||
| w:0.10081 1.00000 | ||||||
| M2A | −17,667.5931 | p:0.70389 0.28584 0.01027 | 30.2446 | 2.71 × 10⁻⁷ | 2, 2 *, 2 ** | |
| w:0.10207 1.00000 3.25211 | ||||||
| M7 | −17,680.6455 | p = 0.29425 q = 0.62674 | ||||
| M8 | −17,654.9577 | p0 = 0.94774 p = 0.38756 q = 1.03153 | 51.3755 | 6.98 × 10⁻¹² | 5, 2 *, 2 ** | |
| (p1 = 0.05226) w = 1.87953 | ||||||
| TLR4 | M1A | −27,142.6224 | p:0.65430 0.34570 | |||
| w:0.08873 1.00000 | ||||||
| M2A | −26,989.6674 | p:0.63053 0.32499 0.04449 | 305.9101 | 3.74 × 10−67 | 24, 19 *, 16 ** | |
| w:0.08946 1.00000 3.12384 | ||||||
| M7 | −27,104.3280 | p = 0.24737 q = 0.45214 | ||||
| M8 | −26,948.5913 | p0 = 0.94429 p = 0.28421 q = 0.58752 | 311.4734 | 2.31 × 10−68 | 29, 27 *, 20 ** | |
| (p1 = 0.05571) w = 2.60768 | ||||||
| TLR5 | M1A | −10,761.5148 | p:0.64778 0.35222 | |||
| w:0.07521 1.00000 | ||||||
| M2A | −10,754.4425 | p:0.65397 0.29395 0.05208 | 14.1446 | 8.48 × 10⁻⁴ | 0, 0 *, 0 ** | |
| w:0.08616 1.00000 2.27090 | ||||||
| M7 | −10,767.1968 | p = 0.16412 q = 0.25713 | ||||
| M8 | −10,751.9386 | p0 = 0.88630 p = 0.31653 q = 0.82154 | 30.5162 | 2.36 × 10⁻⁷ | 11, 2 *, 0 ** | |
| (p1 = 0.11370) w = 1.85950 | ||||||
| TLR7 | M1A | −31,101.4634 | p:0.72733 0.27267 | |||
| w:0.06793 1.00000 | ||||||
| M2A | −30,961.2534 | p:0.71077 0.25222 0.03700 | 280.4200 | 1.28 × 10−61 | 25, 24 *, 19 ** | |
| w:0.06917 1.00000 3.03247 | ||||||
| M7 | −31,044.1197 | p = 0.18953 q = 0.48287 | ||||
| M8 | −30,894.4389 | p0 = 0.95423 p = 0.22385 q = 0.67658 | 299.3616 | 9.87 × 10−66 | 30, 25 *, 23 ** | |
| (p1 = 0.04577) w = 2.52048 | ||||||
| TLR15 | M1A | −38,867.7085 | p:0.66864 0.33136 | |||
| w:0.09826 1.00000 | ||||||
| M2A | −38,835.1856 | p:0.65901 0.31957 0.02142 | 65.0457 | 7.51 × 10⁻¹⁵ | 8, 8 *, 5 ** | |
| w:0.09812 1.00000 2.29015 | ||||||
| M7 | −38,651.1989 | p = 0.32880 q = 0.73980 | ||||
| M8 | −38,608.5273 | p0 = 0.94189 p = 0.39709 q = 1.16306 | 85.3434 | 2.94 × 10⁻¹⁹ | 9, 8 *, 3 ** | |
| (p1 = 0.05811) w = 1.50749 |
| Gene | M8 a | SLAC | FEL | REL | MEME | FUBAR | Integrated b | Total Common Sites c (X/Y) |
|---|---|---|---|---|---|---|---|---|
| TLR1A | 258, 400, 408, 423, 450, 460, 483, 502, 591 | 388, 429, 566 | 294, 342, 384, 388, 429, 460, 535, 566, 611 | 297, 301, 384, 388, 400, 429, 438, 460, 463, 470, 550, 566, 611 | 266, 284, 294, 346, 384, 388, 400, 411, 429, 460, 461, 463, 518, 535, 550, 559, 566, 571, 599, 608, 611 | 388, 429, 460, 566 | 266, 284, 294, 297, 301, 342, 346, 384, 388, 400, 408, 411, 429, 438, 460, 461, 463, 470, 518, 535, 550, 559, 566, 571, 599, 608, 611 | 11/12 |
| TLR1B | 41, 59, 88, 122, 148, 149, 168, 175, 248, 256, 277, 286, 298, 308, 318, 350, 357, 439, 486, 488 | 38, 41, 119, 120, 122, 123, 148, 168, 175, 216, 232, 277, 398, 414 | 11, 38, 41, 49, 62, 67, 119, 120, 122, 123, 128, 148, 156, 167, 168, 175, 216, 232, 266, 277, 308, 371, 398, 408, 414, 627 | 38, 41, 59, 119, 120, 122, 123, 148, 150, 168, 175, 181, 207, 216, 232, 248, 277, 286, 308, 311, 398, 414, 485 | 26, 38, 41, 43, 44, 62, 92, 119, 120, 122, 123, 127, 144, 146, 148, 156, 167, 168, 175, 194, 206, 214, 216, 232, 266, 277, 308, 309, 311, 353, 366, 371, 398, 407, 408, 414, 432, 447, 639 | 38, 41, 119, 120, 122, 123, 148, 168, 175, 216, 232, 277, 308, 398, 414 | 11, 26, 38, 41, 43, 44, 49, 59, 62, 67, 92, 119, 120, 122, 123, 127, 128, 144, 146, 148, 150, 156, 167, 168, 175, 181, 194, 206, 207, 214, 216, 232, 248, 266, 277, 286, 298, 308, 309, 311, 353, 366, 371, 398, 407, 408, 414, 432, 447, 485, 627, 639 | 25/26 |
| TLR2A | 7, 16, 59, 67, 108, 129, 171, 206, 220, 270, 304, 307, 308, 311, 312, 338, 363, 372, 393, 413 | 16, 63, 108, 292, 304, 308, 311, 315, 335, 393, 418, 419 | 16, 28, 44, 45, 63, 74, 77, 108, 171, 209, 217, 235, 257, 292, 304, 308, 309, 311, 315, 335, 344, 356, 372, 393, 418, 419 | 7, 16, 67, 108, 129, 171, 217, 235, 276, 280, 292, 306, 308, 311, 312, 335, 356, 372, 387, 392, 393, 413, 416, 418, 419 | 16, 19, 28, 44, 63, 67, 77, 96, 108, 122, 125, 138, 171, 174, 187, 195, 209, 247, 250, 257, 264, 277, 280, 292, 294, 304, 308, 309, 311, 315, 322, 335, 344, 347, 349, 367, 372, 393, 418, 419, 425 | 16, 108, 171, 292, 308, 311, 372, 392, 413, 418 | 7, 16, 19, 28, 44, 45, 59, 63, 67, 74, 77, 96, 108, 122, 125, 129, 138, 171, 174, 187, 195, 206, 209, 217, 235, 247, 250, 257, 264, 276, 277, 280, 292, 294, 304, 306, 308, 309, 311, 312, 315, 322, 335, 338, 344, 347, 349, 356, 367, 372, 387, 392, 393, 413, 416, 418, 419, 425 | 31/34 |
| TLR2B | 50, 58, 99, 162, 175, 211, 260, 295, 297, 298, 329, 456 | 89, 99, 137, 162, 176, 297, 328, 329, 390 | 42, 48, 89, 99, 137, 149, 162, 176, 199, 200, 219, 257, 274, 295, 297, 298, 299, 300, 302, 317, 329, 343, 390, 401, 412, 415,553, 600, 614, 625, 734 | 89, 99, 162, 208, 295, 297, 298, 328, 329, 331, 343, 625 | 25, 58, 68, 75, 89, 99, 137, 149, 162, 176, 189, 211, 226, 234, 239, 260, 274, 295, 297, 299, 302, 317, 329, 335, 343, 383, 390, 401, 415, 467, 496, 499, 500, 542, 550, 597, 625, 679 | 89, 99, 162, 295, 297, 298, 328, 343, 625 | 25, 42, 48, 58, 68, 75, 89, 99, 137, 149, 162, 175, 176, 189, 199, 200, 208, 211, 219, 226, 234, 239, 257, 260, 274, 295, 297, 298, 299, 300, 302, 317, 328, 329, 331, 335, 343, 383, 390, 401, 412, 415, 456, 467, 496, 499, 500, 542, 550, 553, 597, 600, 603, 614, 625, 679, 734 | 23/25 |
| TLR3 | 52, 166, 214, 237, 703 | 25, 237, 307, 334, 703, 746 | 9, 11, 19, 25, 30, 66, 68, 74, 214, 237, 263, 307, 334, 346, 370, 447, 468, 557, 698, 703, 744, 746, 815 | 25, 30, 52, 74, 113, 137, 158, 166, 179, 180, 214, 237, 288, 307, 312, 326, 334, 343, 346, 447, 461, 463, 497, 556, 557, 619, 703, 746, 815 | 9, 25, 30, 38, 48, 68, 74, 93, 108, 192, 214, 234, 237, 263, 307, 334, 346, 349, 382, 393, 439, 447, 451, 461, 473, 547, 557, 577, 605, 664, 677, 698, 703, 707, 715, 744, 746, 815 | 25, 52, 158, 214, 237, 334, 346, 703, 746, 815 | 9, 11, 19, 25, 30, 38, 48, 52, 66, 68, 74, 93, 108, 113, 137, 158, 166, 179, 180, 192, 214, 234, 237, 263,288, 307, 312, 326, 334, 343, 346, 349, 370, 382, 393, 439, 447, 451, 461, 463, 468, 473, 497, 547, 556, 557, 577, 605, 619, 664, 677, 698, 703, 707, 715, 744, 746, 815 | 22/22 |
| TLR4 | 187, 245, 270, 271, 274, 299, 302, 323, 352, 370, 375, 379, 380, 387, 398, 403, 405, 406, 423, 465, 522, 595, 624, 627, 640, 645, 650, 655, 834 | 106, 124, 146, 187, 245, 271, 301, 302, 352, 379, 380, 423, 467, 640, 654 | 86, 95, 106, 119, 124, 127, 141, 146, 187, 204, 245, 270, 271, 277, 301, 302, 329, 352, 363, 379, 380, 403, 423, 467, 509, 596, 603, 606, 624, 639, 640, 654, 663, 732 | 62, 86, 106, 124, 146, 187, 245, 270, 271, 301, 302, 303, 323, 345, 352, 363, 370, 379, 380, 387, 403, 423, 430, 438, 444, 467, 522, 596, 603, 624, 627, 640, 654, 703 | 61, 63, 64, 85, 86, 95, 106, 115, 119, 124, 141, 146, 155, 180, 187, 223, 245, 270, 271, 273, 282, 297, 301, 302, 333, 345, 352, 363, 370, 379, 380, 397, 398, 403, 423, 435, 445, 467, 469, 474, 477, 493, 533, 548, 549, 562, 569, 570, 596, 597, 603, 606, 614, 624, 640, 654, 732, 780, 784, 827 | 187, 271, 301, 302, 352, 379, 380, 403, 423, 467, 522, 596, 603, 624 | 61, 62, 63, 64, 85, 86, 95, 106, 119, 124, 127, 141, 146, 155, 180, 187, 204, 223, 245, 270, 271, 273, 274, 277, 282, 297, 299, 301, 302, 303, 323, 329, 333, 345, 352, 363, 370, 375, 379, 380, 387, 397, 398, 403, 405, 406, 423, 430, 435, 438, 444, 445, 465, 467, 469, 474, 477, 493, 509, 522, 533, 548, 549, 562, 569, 570, 595, 596, 597, 603, 606, 614, 624, 627, 639, 640, 645, 650, 654, 655, 663, 703, 732, 780, 784, 827, 834 | 34/45 |
| TLR5 | 20, 106, 130, 132, 147, 209, 237, 281, 468, 607, 848 | 848 | 22, 24, 35, 53, 101, 108, 118, 130, 147, 173, 201, 226, 231, 258, 261, 264, 422, 466, 468, 656, 659, 833, 848 | 20, 22, 33, 35, 106, 130, 132, 147, 237, 258, 261, 299, 468, 632, 646, 848 | 13, 22, 24, 87, 130, 173, 181, 183, 196, 199, 201, 205, 217, 226, 231, 258, 261, 264, 265, 288, 378, 422, 424, 466, 501, 525, 625, 626, 632, 648, 650, 656, 659, 679, 833, 848, 859 | 22, 35, 130, 261, 468, 848, | 13, 20, 22, 24, 33, 35, 53, 87, 101, 106, 108, 118, 130, 132, 147, 173, 181, 183, 196, 199, 201, 205, 209, 217, 226, 231, 237, 258, 261, 264, 265, 281, 288, 299, 378, 422, 424, 466, 468, 501, 525, 625, 626, 632, 646, 648, 650, 656, 659, 679, 833, 848, 859 | 24/26 |
| TLR7 | 65, 73, 118, 121, 122, 123, 148, 152, 156, 284, 334, 360, 395, 422, 426, 503, 524, 528, 549, 577, 677, 696, 704, 706, 722, 726, 746, 747, 758, 920 | 38, 56, 73, 121, 123, 156, 176, 395, 503, 521, 549, 577, 664, 681, 704, 722, 726, 751, 919, 920, 1049 | 56, 73, 121, 123, 156, 169, 176, 229, 253, 279, 310, 395, 503, 521, 524, 528, 549, 577, 642, 664, 681, 701, 704, 706, 722, 726, 737, 751, 851, 857, 860, 919, 920, 951, 1049 | 38, 73, 89, 95, 97, 121, 122, 123, 148, 152, 156, 176, 205, 279, 284, 334, 360, 366, 395, 398, 402, 422, 426, 494, 503, 524, 528, 549, 550, 573, 577, 678, 701, 704, 706, 712, 722, 726, 746, 920 | 38, 56, 73, 86, 95, 111, 121, 123, 156, 167, 169, 174, 199, 229, 246, 279, 310, 313, 321, 361, 377, 395, 463, 465, 495, 503, 512, 521, 524, 528, 549, 577, 622, 624, 664, 681, 686, 698, 701, 704, 706, 708, 712, 722, 726, 737, 747, 751, 768, 792, 857, 895, 919, 920, 951, 1038, 1049 | 73, 121, 123, 156, 205, 395, 503, 524, 528, 549, 577, 704, 706, 722, 726, 919, 920 | 38, 56, 65, 73, 86, 89, 95, 97, 111, 118, 121, 122, 123, 148, 152, 156, 167, 169, 174, 176, 199, 205, 229, 246, 253, 279, 284, 310, 313, 321, 334, 360, 361, 366, 377, 395, 398, 402, 422, 426, 463, 465, 494, 495, 503, 512, 521, 524, 528, 549, 550, 573, 577, 622, 624, 642, 664, 677, 678, 681, 686, 696, 698, 701, 704, 706, 708, 712, 722, 726, 737, 746, 747, 751, 758, 768, 792, 851, 857, 860, 895, 919, 920, 951, 1038, 1049 | 44/49 |
| TLR15 | 79, 119, 185, 253, 262, 326, 333, 353, 360 | 19, 26, 33, 65, 79, 89, 114, 136, 151, 169, 191, 203, 205, 268, 289, 292, 293, 339, 343, 359, 366, 413, 436, 458, 621, 623, 627 | 26, 33, 38, 65, 89, 102, 114, 136, 145, 151, 169, 191, 203, 259, 268, 289, 292, 293, 339, 343, 359, 366, 413, 436, 458, 621, 623, 627, 649, 656, 661, 725 | 11, 13, 16, 17, 19, 26, 31, 33, 38, 48, 65, 79, 89, 102, 114, 120, 127, 128, 132, 136, 145, 149, 151, 158, 160, 164, 169, 170, 181, 191, 193, 194, 196, 200, 203, 205, 226, 249, 259, 267, 268, 289, 292, 293, 296, 315, 339, 343, 359, 363, 366, 382, 392, 413, 416, 436, 439, 450, 458, 463, 494, 495, 521, 523, 528, 550, 621, 623, 627, 649, 656, 661, 671, 676, 705, 712, 725, 813 | 12, 26, 36, 54, 65, 89, 102, 105, 107, 114, 136, 143, 151, 159, 162, 169, 175, 186, 187, 191, 203, 225, 226, 229, 230, 232, 235, 259, 263, 268, 282, 285, 289, 292, 293, 329, 335, 339, 343, 359, 363, 366, 367, 383, 400, 413, 436, 458, 485, 530, 543, 550, 621, 623, 627, 634, 651, 661, 679, 815, 839, 862, 865, 872, 873 | 26, 89, 114, 136, 169, 191, 203, 259, 268, 289, 292, 293, 339, 343, 359, 366, 413, 436, 458, 621, 623, 661 | 11, 12, 13, 16, 17, 19, 26, 31, 33, 36, 38, 48, 54, 65, 79, 89, 102, 105, 107, 114, 120, 127, 128, 132, 136, 143, 145, 149, 151, 158, 159, 160, 162, 164, 169, 170, 175, 181, 185, 186, 187, 191, 193, 194, 196, 200, 203, 205, 225, 226, 229, 230, 232, 235, 249, 259, 263, 267, 268, 282, 285, 289, 292, 293, 296, 315, 326, 329, 335, 339, 343, 359, 360, 363, 366, 367, 382, 383, 392, 400, 413, 416, 436, 439, 450, 458, 463, 485, 494, 495, 521, 523, 528, 530, 543, 550, 621, 623, 627, 634, 649, 651, 656, 661, 671, 676, 679, 705, 712, 725, 813, 815, 839, 862, 865, 872, 873 | 38/41 |
| Gene | Codon | Amino Acid | M2a | M8 | Total | Chemical | Structural | Other | |||
|---|---|---|---|---|---|---|---|---|---|---|---|
| TLR1A | 408 | R | 2.467 +- 0.293 * | 2.200 +- 0.468 ** | 1 | 1 | RF | 0 | 0 | ||
| TLR1B | 148 | V | 2.495 +- 0.123 ** | 1.691 +- 0.398 ** | 1 | 0 | 1 | K0 | 0 | ||
| 175 | S | 2.484 +- 0.176 * | 1.688 +- 0.401 ** | 4 | 3 | RF, Ra, Hp | 1 | Bl | 0 | ||
| 298 | A | 2.476 +- 0.207 * | 1.688 +- 0.400 ** | ||||||||
| 308 | N | 2.491 +- 0.141 ** | 1.691 +- 0.398 ** | 2 | 1 | H | 1 | K0 | 0 | ||
| TLR2A | 16 | Q | 3.393 +- 0.312 ** | 2.819 +- 0.468 ** | 2 | 2 | pHi, H | 0 | 0 | ||
| 59 | P | 3.374 +- 0.374 ** | 2.808 +- 0.488 ** | 2 | 2 | Ra, Hp | 0 | 0 | |||
| 67 | V | 3.393 +- 0.313 ** | 2.819 +- 0.468 ** | 8 | 3 | pHi, μ, Ra | 4 | MV, V0, Bl, Hc | 1 | MW | |
| 108 | G | 3.393 +- 0.311 ** | 2.819 +- 0.467 ** | 7 | 5 | H, RF, Hnc, Ht, Ra | 2 | Bl | 0 | ||
| 171 | Q | 3.394 +- 0.309 ** | 2.820 +- 0.466 ** | 2 | 2 | Ht, pHi | 0 | 0 | |||
| 206 | S | 3.388 +- 0.330 ** | 2.815 +- 0.475 ** | 9 | 4 | RF, μ, Ra, Ht | 4 | MV, V0, Bl, Hc | 1 | MW | |
| 304 | A | 3.394 +- 0.309 ** | 2.820 +- 0.466 ** | 9 | 7 | RF, H, Ra, Hp, pHi, Pr, p | 2 | K0, Bl | 0 | ||
| 308 | T | 3.391 +- 0.317 ** | 2.818 +- 0.469 ** | 5 | 5 | RF, H, Ra, Hp, pHi, Pr | 0 | 0 | |||
| 311 | A | 3.394 +- 0.309 ** | 2.820 +- 0.466 ** | 1 | 1 | Pr | 0 | 0 | |||
| 312 | R | 3.391 +- 0.317 ** | 2.818 +- 0.469 ** | 6 | 4 | pHi, H, Hnc, Ra | 2 | V0, HC | 0 | ||
| 338 | E | 3.371 +- 0.385 ** | 2.807 +- 0.487 ** | 2 | 2 | pHi, RF | 0 | 0 | |||
| TLR2B | 99 | W | 2.510 +- 0.292 * | 2.407 +- 0.298 ** | 6 | 5 | H, Hnc, Ra, RF, Ht | 1 | Bl, | 0 | |
| 162 | Q | 2.524 +- 0.254 * | 2.411 +- 0.289 ** | 5 | 5 | pHi, p, RF, Hnc, Ra | 0 | 0 | |||
| 175 | E | 2.503 +- 0.309 * | 2.405 +- 0.303 ** | 6 | 5 | RF, H, Ra, Hp, Pr | 1 | K0 | 0 | ||
| 295 | Q | 2.506 +- 0.302 * | 2.406 +- 0.301 ** | 2 | 2 | pHi, H | 0 | 0 | |||
| 456 | Q | 2.514 +- 0.281 * | 2.409 +- 0.295 ** | 5 | 3 | Ra, Hp, pHi | 2 | K0, HC | 0 | ||
| TLR3 | 214 | T | 2.503 +- 0.087 ** | 1.741 +- 0.430 ** | 5 | 5 | Ra, Hp, Pr, p, pHi | 0 | 0 | ||
| 237 | R | 2.500 +- 0.109 ** | 1.736 +- 0.435 ** | 3 | 3 | RF, H, Hnc | 0 | 0 | |||
| TLR4 | 187 | S | 3.497 +- 0.062 ** | 2.500 +- 0.019 ** | 3 | 2 | pHi, p | 1 | K0 | 0 | |
| 245 | N | 3.497 +- 0.059 ** | 2.500 +- 0.017 ** | 1 | 1 | Pr | 0 | 0 | |||
| 270 | I | 3.498 +- 0.044 ** | 2.500 +- 0.001 ** | 7 | 4 | RF, Ra, Hp, pHi | 3 | V0, Bl, HC | 0 | ||
| 274 | T | 3.495 +- 0.102 ** | 2.499 +- 0.041 ** | 10 | 5 | pHi, μ, Ra, Pr, p | 4 | MV, V0, Bl, HC | 1 | MW | |
| 299 | E | 3.498 +- 0.044 ** | 2.500 +- 0.001 ** | 3 | 2 | pHi, Pr | 1 | K0 | 0 | ||
| 302 | N | 3.429 +- 0.411 * | 2.492 +- 0.111 ** | 1 | 1 | pHi | 0 | 0 | |||
| 323 | N | 3.498 +- 0.044 ** | 2.500 +- 0.004 ** | 9 | 5 | pHi, μ, RF, H, Hnc | 3 | MV, V0, HC | 1 | MW | |
| 352 | E | 3.486 +- 0.181 ** | 2.498 +- 0.053 ** | 2 | 2 | Pr, p | 0 | 0 | |||
| 370 | D | 3.496 +- 0.087 ** | 2.500 +- 0.028 ** | 3 | 1 | pHi | 2 | V0, HC | 0 | ||
| 375 | E | 3.498 +- 0.056 ** | 2.500 +- 0.021 ** | 4 | 4 | RF, Hnc, Ra, H | 0 | 0 | |||
| 379 | G | 3.498 +- 0.046 ** | 2.500 +- 0.007 ** | 6 | 5 | RF, H, Ra, Hp, pHi | 1 | K0 | 0 | ||
| 380 | S | 3.464 +- 0.291 * | 2.496 +- 0.080 ** | 4 | 2 | pHi, Pr | 2 | V0, HC | 0 | ||
| 398 | T | 3.498 +- 0.044 ** | 2.500 +- 0.001 ** | 8 | 3 | pHi, μ, RF | 4 | MV, Bl, V0, HC | 1 | MW |
© 2019 by the authors. Licensee MDPI, Basel, Switzerland. This article is an open access article distributed under the terms and conditions of the Creative Commons Attribution (CC BY) license (http://creativecommons.org/licenses/by/4.0/).
Share and Cite
Khan, I.; Maldonado, E.; Silva, L.; Almeida, D.; Johnson, W.E.; O’Brien, S.J.; Zhang, G.; Jarvis, E.D.; Gilbert, M.T.P.; Antunes, A. The Vertebrate TLR Supergene Family Evolved Dynamically by Gene Gain/Loss and Positive Selection Revealing a Host–Pathogen Arms Race in Birds. Diversity 2019, 11, 131. https://doi.org/10.3390/d11080131
Khan I, Maldonado E, Silva L, Almeida D, Johnson WE, O’Brien SJ, Zhang G, Jarvis ED, Gilbert MTP, Antunes A. The Vertebrate TLR Supergene Family Evolved Dynamically by Gene Gain/Loss and Positive Selection Revealing a Host–Pathogen Arms Race in Birds. Diversity. 2019; 11(8):131. https://doi.org/10.3390/d11080131
Chicago/Turabian StyleKhan, Imran, Emanuel Maldonado, Liliana Silva, Daniela Almeida, Warren E. Johnson, Stephen J. O’Brien, Guojie Zhang, Erich D. Jarvis, M. Thomas P. Gilbert, and Agostinho Antunes. 2019. "The Vertebrate TLR Supergene Family Evolved Dynamically by Gene Gain/Loss and Positive Selection Revealing a Host–Pathogen Arms Race in Birds" Diversity 11, no. 8: 131. https://doi.org/10.3390/d11080131