Review

Comparative Phylogenomics, a Stepping Stone for Bird Biodiversity Studies

by
Josefin Stiller
1,* and
Guojie Zhang
1,2,3,4,*
1
Section for Ecology and Evolution, Department of Biology, University of Copenhagen, DK-2100 Copenhagen, Denmark
2
China National GeneBank, BGI–Shenzhen, Shenzhen 518083, China
3
Center for Excellence in Animal Evolution and Genetics, Chinese Academy of Sciences, Kunming 650223, China
4
State Key Laboratory of Genetic Resources and Evolution, Kunming Institute of Zoology, Chinese Academy of Sciences, Kunming 650223, China
*
Authors to whom correspondence should be addressed.
Diversity 2019, 11(7), 115; https://doi.org/10.3390/d11070115
Submission received: 8 June 2019 / Revised: 7 July 2019 / Accepted: 15 July 2019 / Published: 18 July 2019
(This article belongs to the Special Issue Genomic Analyses of Avian Evolution)

Abstract

:
Birds are a group with immense availability of genomic resources, and hundreds of forthcoming genomes at the doorstep. We review recent developments in whole genome sequencing, phylogenomics, and comparative genomics of birds. Short read based genome assemblies are common, largely due to efforts of the Bird 10K genome project (B10K). Chromosome-level assemblies are expected to increase due to improved long-read sequencing. The available genomic data has enabled the reconstruction of the bird tree of life with increasing confidence and resolution, but challenges remain in the early splits of Neoaves due to their explosive diversification after the Cretaceous-Paleogene (K-Pg) event. Continued genomic sampling of the bird tree of life will not just better reflect their evolutionary history but also shine new light onto the organization of phylogenetic signal and conflict across the genome. The comparatively simple architecture of avian genomes makes them a powerful system to study the molecular foundation of bird specific traits. Birds are on the verge of becoming an extremely resourceful system to study biodiversity from the nucleotide up.

1. Introduction

Birds are a species-rich vertebrate group and are unparalleled in their adaptations to a wide range of habitats. Modern birds have achieved their current diversity during a long evolutionary ‘journey’, beginning with their divergence from the theropod dinosaurs when they evolved the ability to fly, followed by several bursts of diversification over ca. 100 million years of evolutionary history [1]. Birds exhibit an extraordinary range of ecological, morphological, and behavioral traits that have inspired researchers for centuries to study the basic principles of nature. Birds are often key species in ecosystems as herbivores, predators, scavengers, seed dispersers and pollinators [2], so their biodiversity and population density are used as indicators to evaluate the root causes of biodiversity changes in ecosystems around the world [3,4]. Many bird species are also under threat and 24% of all species are listed on the IUCN RedList under a category of concern. Our understanding of bird biodiversity relies on our knowledge of their genomes, because genomes are both logs of evolutionary history and blueprints for future adaptive potential.
Genome sequences are being generated at an ever-increasing pace and at greater evolutionary breadth for thousands of species across the tree of life. Sequencing technology has reached most fields of biology and has expanded our knowledge of the principles of biology. After the milestones of genome sequencing of chicken [5], turkey [6], and zebra finch [7], the Avian Phylogenomics Project added 45 newly sequenced genomes across the tree of life of birds [8,9,10]. Building on this success, the Bird Genome 10K (B10K) Consortium has been announced in 2015 with the aim to sequence all ~10,500 extant bird species [11]. Until now, over 300 bird genomes have been sequenced and are being analyzed by the B10K, and the number is growing every week. These genomes are already providing insights on the mechanisms of evolution and the speciation process, physiology, morphology and development, genome composition, and how we can use genomic information for bird conservation.
The B10K project aims to more finely resolve the phylogenetic relationships among birds. Phylogeny is central to biology not only because it reflects evolutionary history, but also because it distinguishes similarities due to shared history from similarities due to shared function, and thus provides the foundation for understanding genomic organization and function. The increased availability of avian reference genomes shows that phylogenetic signal, or lack thereof, is not evenly distributed across bird genomes, but differs among genomic compartments such as protein-coding regions and introns [10,12]. Phylogenomics, inherently a comparative discipline comparing homologies between different taxa, is becoming even more comparative when we can design phylogenomic analyses to interrogate different genomic compartments for phylogenetic information content.
With increasing numbers of bird genomes due for sequencing, it is timely to review the current status of the bird genomic sequencing efforts and what we have learnt from comparative genomics about avian evolutionary history. In this review, we will summarize the state-of-the-art strategies specifically for bird genome sequencing, the phylogenomic efforts and challenges, and the latest progress on comparative genomics and conservation genomics of birds. Given the rapid pace at which we are moving towards denser and denser sampling of the bird tree of life, we will give an outlook for ornithological research empowered by wide access to genomes.

2. Current Status of Bird Genome Sequencing

2.1. Comparison of Currently Available Sequencing Strategies

In the past decade, we have witnessed a rapid change of DNA sequencing technologies with a new strategy for reference genome sequencing and assembly being proposed every two years. Here, we compare the most commonly used strategies for four factors that need to be considered by the investigator before embarking on bird genome sequencing (Table 1). These four factors pertain to the required DNA input, assembly quality with respect to contiguity and completeness, and the sequencing cost.
Since short read sequencing became commercially available in 2006, it has been quickly applied for de novo reference assembly for large eukaryotic genomes [13]. Short read sequencing is producing millions of pairs of reads (presently 100 to a few hundred bp) that must get stitched together into contigs and scaffolds. The first approach, proposed in 2008, involved the sophisticated design of sequencing matepair libraries with a series of insert sizes ranging from 200 bp to 40 kb and produced highly continuous scaffolds (scaffold N50 size >1 Mb) for animal genomes. About 100× coverage of short sequencing reads were produced from these libraries and assembled with the de Bruijn graph algorithm [14,15]. This was the first demonstration of the feasibility of using short reads for reference genome assembly and has reduced the cost for producing a reference of human genome size from $3 billion to $3 million at the time. It became the dominant approach for producing de novo assemblies for plant and animal genomes between 2008 and 2012, including the first batch of 101 vertebrate genomes at BGI for the Genome 10K consortium, which also included some birds [16,17]. A drawback of this approach is that is requires much input DNA, prohibiting its use for many biodiversity studies, where fresh samples are often not accessible.
A simplified approach was developed specifically for sequencing of bird genomes for the Avian Phylogenomic Project [18]. It only uses two sequencing libraries because most bird species have relatively simple genomic features with small genome size and low repeat content. This approach allows the use of appropriately preserved museum specimens in lieu of fresh tissues. Owing to the relatively narrow span of the insert size of the sequencing library, the assemblies produced with this second method are normally highly fragmented due to the difficulty in sequencing regions with deviating nucleotide composition and repetitive elements. A “whole genome” for a bird may be missing 20% of the average genome from the assemblies [19]. Despite advances in read length capabilities that improve resolution in GC-rich regions and repetitive regions, even the longest reads (currently ~2 Mb with Oxford Nanopore) still do not span avian microchromosomes (>3 Mb) nor macrochromosomes (30–250 Mb, [20]).
The following two approaches can produce extraordinary assemblies with long continuous contig and scaffold size, given that high molecular weight DNA is available as input. The 10X genomic sequencing approach provided the first demonstration to produce a highly continuous genome assembly for the human genome and was soon adopted for other species. This technology relies on high molecular weight DNA to produce long range information for short reads but with input DNA as low as 300 ng. The most recently developed approach, single-tube long fragment sequencing (stLFR), can also generate long fragment reads by sequencing short reads for sub-fragments of one long DNA molecule with DNA-barcoding [21]. These two strategies provide a good balance between input DNA, cost and assembly quality. Nevertheless, the assembly quality of both methods heavily depends on the quality of the input DNA, and therefore hinders their broad application to species for which fresh tissues with molecular weight DNA are hard to collect.
Without further genetic linkage or physical mapping data, the assemblies from these four methods are still highly fragmented and cannot be assigned into chromosomes. Of the 147 bird genomes on NCBI (as of May 2019), only 13 have been assembled into chromosomes. Several methods have been developed to scale up the scaffolding to chromosome level (Bionano, optical mapping, Hi-C) [22,23,24,25]. The DNA Zoo consortium (dnazoo.org) has proposed a two-fold strategy for reference genome assembly by first generating short reads with 100× coverage from one short insert size library for contig assembly, and secondly another 100× coverage short reads data from one Hi-C library for scaffolding [26]. The first release of 100 mammalian genomes using this strategy produced remarkable assemblies of which many are at the chromosome level, while the contig sizes are of a similar range to those produced by other short read assemblies. This strategy thus represents the most economical way to produce a chromosome-level assembly. Nevertheless, a standard Hi-C library construction protocol is still not available yet [27] and the data produced from different protocols behave differently during assembly and require time-consuming manual correction [28,29]. Therefore, the accuracy of the assembly produced with this strategy still needs the validation from other datasets.
The recently initiated Vertebrate Genome Project (VGP) has set a high standard for reference genome assembly with the goal of almost gapless chromosome-level assemblies by integrating various sequencing technologies including PacBio long read sequencing, Bionano, 10X, and Hi-C data (https://vertebrategenomesproject.org). To facilitate processing of these heterogenous data sources, the VGP is also working on a standard computation pipeline. Though the VGP approach is expensive regarding costs and input DNA, an increasing number of genomes have now been done with this approach, including several birds (https://vgp.github.io/genomeark/). The VGP consortium and B10K are now also taking the joint effort to produce chromosome-level genome assemblies for at least one species representing each avian order using the VGP approach.

2.2. Towards Complete Genomic Representation of Birds

To date, birds are the vertebrate group with the most genomes available for different species. As of May 2019, a total of 456 bird genomes have been sequenced and assembled, of which 147 are available on NCBI. The B10K Consortium is a major contributor of these genomic resources. The B10K sequencing plan is organized into four phases with the ultimate goal to decode the genomes for all bird species [11]. Each phase is sampling the bird tree of life at increasing resolution, moving from deep nodes to increasingly shallower divergences (Figure 1). The first phase of the B10K, the Avian Phylogenomics Project, concluded in 2014 with the release of 45 bird genomes of at least one species from each neoavian order [9,10], hence sampling all of the deepest branches of the phylogeny. The second phase has started in 2017 to sequence at least one representative per family. Sequencing was successful for 218 families (following the taxonomy of Howard & Moore 4th edition [30]) while 18 families could not be represented due to the lack of appropriate samples. Altogether, phase 2 analyzes 363 genomes. Of these, 90 are published, 273 were newly sequenced including 32 still unpublished genomes that were contributed by the community to bolster B10K sampling. The analyses for phase 2 of the B10K are underway to provide a densely sampled phylogeny, new comparative genomics insights and a flood of new data for the community, including a novel whole genome alignment.
The third phase has been initiated concurrently in 2019 aiming to cover one representative from the 2341 extant genera, which will involve sequencing genomes for at least 2250 species in addition to the publicly available genomes. The fourth phase of the B10K will make a big leap to sequence all 10,135 species [30]. It will require tremendous effort from the entire consortium to provide resources, laboratory support and funding. At the same time, the sequencing of individual species with specific biological research interests has also been initiated in individual labs all over the world. As of May 2019, 109 birds have been sequenced outside of the B10K and released to NCBI. Moving forward with ever denser sampling, the probability of duplicated efforts of sequencing the same species increases and resources can be saved by interrogating the B10K progress database (https://b10k.genomics.cn/species.html). With sequencing technologies becoming affordably available for researchers and an ever-growing base of available genomes that can be used as frameworks for new genomes, the generation of more reference genomes can be expected to grow rapidly.

3. Insight into Phylogeny from Whole Genome Data

3.1. Centrality of the Phylogeny for Comparative Studies

‘Tree thinking’ has been a fundamental concept for every branch of biology since Darwin’s Origin. Phylogeny is essential to understand biodiversity because not only does the species tree record the evolutionary history, the divergence events and their pace, but it is also the framework for comparative genomics. Explicitly tree-based analyses of associations between phenotypic and genomic traits are necessary to evaluate the statistical (in)dependence of data points [32]. We can only understand the origin and later modifications of phenotypes when they can be mapped onto correctly reconstructed phylogenetic trees. Faulty trees produce incorrect inferences of evolutionary history and could misguide inferences of future resilience of species to environmental change. Therefore, producing an accurate species tree is a fundamental first step of any biodiversity study.
Despite decades of efforts on reconstructing the tree of life for birds, the avian phylogeny is still under debate. Agreement exists widely on the split of Palaeognathae (ostriches and tinamous) and Neognathae, and of Galloanseres (waterfowl and landfowl) and Neoaves. The deep branches of the Neoaves, which contain 95% of all extant species, have been subject of numerous phylogenetic hypothesis (summarized by [31,33]). The reason for the complexity of resolving these branches is thought to be grounded in the evolutionary history of the group. Neoaves appear to have diversified rapidly [34,35,36]. Such a scenario of explosive diversification of Neoaves was confirmed by the genome-scale dated phylogeny, showing that all major groups of birds formed within just 15 million years after the Cretaceous-Paleogene (K-Pg) boundary, ca. 66 million years ago (Figure 2a, [10]). New fossil evidence of an Early Paleocene mousebird suggests that morphological differentiation may have occurred even faster after the K-Pg extinction event [37]. Multiple divergences within an evolutionary blink of the eye can leave their signature in phylogenies as a tight succession of nodes [38]. It can be expected that one must scan a large proportion of the genome to find sufficient signal that captured this branching sequence. The avian phylogenetic community has readily embraced the evolving technologies to sequence ever-increasing parts of the genome and species, from whole mitochondrial genomes [39], nuclear loci from Sanger sequencing [12,40] or targeted capture of hundreds to thousands of loci [41,42], to whole genome data [10].
The tidal flood of whole genome data used for phylogenetic analysis of 48 birds held up to the promise of providing the most robust tree for birds to date (Figure 2a, [10]). The main hypothesis was based on over 40 million base pairs from protein-coding and non-coding data, which were exposed to great phylogenetic scrutiny. Another 322 million base pairs aligned across lineages, a dataset too large to experiment much in terms of subsetting and filtering, was largely in agreement with the main hypothesis. Neoaves were found to be composed of two main clades, Columbea and Passerea, each of which contained both land and water birds. But even with genome-scale data, there was difficulty in resolving the early branches of Passerea, which was attributed to artifacts introduced by molecular convergence of protein-coding genes and incomplete lineage sorting (see next section). This was not the end of alternative hypotheses, when in the following year a study with less sequence data (0.39 million base pairs) but denser sampling of 198 species proposed quite different evolutionary relationships among Neoaves (Figure 2b, [42]). While statistical support for some of the nodes was often low, a number of conflicting hypotheses were put forward. These included the position of the enigmatic hoatzin as sister to the core landbirds (Inopinaves of Prum et al. [42], equivalent to Telluraves of Jarvis et al. [10]), while it was supported as the sister to cranes and waders in the Jarvis et al. [10] tree. The placement of Caprimulgiformes (swifts, nightjars, hummingbirds) as the sister group to all other Neoaves [42] differs dramatically from the placement as the sister to cuckoos, tauracos and bustards within Passerea [10]. Birds with an aquatic lifestyle were found to occur both in Columbea and Passerea (Figure 2a), which argued for a convergent evolution of the water bird phenotype. This differs from Prum et al. [42], where water birds (except for Gruiformes) evolve from a common ancestor (Aequorlitornithes, Figure 2b). This example illustrates that these rearrangements of the deep nodes are not simply phylogenetic details, but they alter our interpretations about ancestors and the evolution of specific traits and lifestyles.
While these different phylogenetic hypotheses may be disheartening if one simply needs the ‘right tree’ for comparative or functional analyses, incongruences can point to some fascinating evolutionary processes that left their mark on the genomes [43,44]. On the other hand, the complexity of confidently resolving the bird phylogeny has made this data set important for phylogenetic method development (e.g., [45,46,47]) and for the exploration of incongruence [12,31].

3.2. Challenges to Phylogenetic Resolution

Phylogenetic incongruence is conflict in the branching order between two or more phylogenetic trees that cannot be reconciled [48]. Disagreement can occur between data sets, analysis methods, and between different regions of the genome. Causes are diverse including (1) sampling issues, (2) inadequacies of model assumptions, (3) differing evolutionary histories of genomic compartments, and (4) biological processes. The first two stem from errors introduced by how we generate the data and how we infer evolutionary relationships from them. The latter two are manifestations of the evolutionary process on the genome. Incongruence can be an important pointer to sort genuine phylogenetic signal, i.e., information that reflects the true evolutionary history, from technical error or biological factors that misleads phylogenetic estimation.

3.2.1. Incongruence as a Sign of Data Problems

Failure to confidently resolve certain nodes may simply be due to the lack of power either by insufficient sequence information or by insufficient sampling of branches. The neoavian backbone tree has the ‘undesirable’ feature of tightly packed nodes that reflect the short amount of time for lineages to sort and new mutations to occur [10,36]. On the other hand, at least 50 million years have passed since these divergences during which the little phylogenetic signal may have been eroded or altered in a misleading way. One solution could lie in screening even larger parts of the genomes for informative sites than the 322 Mb analyzed by Jarvis et al. [10]. About 68% of the average bird genome was left unexplored for potential phylogenetic signal. Improved whole genome aligners that identify greater proportions of orthologous regions than previously possible could make more of the bird genome accessible for phylogenomics [49,50,51].
With genomes from as few taxa as currently available, branches have to extend deep into the phylogeny to connect with their relatives, which can lead to the problems with long branch attraction [52,53,54]. The problem may be ameliorated by adding branches to the tree to span greater parts of the evolutionary history and changes the distribution of node ages from deep to younger divergences [55,56,57,58,59]. In some cases, the positive effect of adding taxa can outweigh the improvement from adding sequence data [60,61]. Such a scenario was also proposed to explain the alternative branching order for Neoaves put forward by Prum et al. [42]. A reanalysis of the data did not confirm the hypothesis that increased sampling explains the different topology, but rather found a strong impact of the data type used for phylogenetic reconstruction [12]. The last word may not be spoken on this matter and the hundreds of forthcoming bird genomes will provide a powerful dataset to test the effects of increased sampling on difficult nodes.
Modeling the evolutionary processes that influence sites is a complex problem and inappropriate model choices can produce faulty topologies and branch lengths [62,63]. Model violations are a sneaky problem that cannot be fixed by adding more data (as opposed to the stochastic errors from uneven sampling discussed before), but it can even be exacerbated by adding more loci, leading to faulty inferences with strong statistical support [64,65]. The assumptions that commonly used substitution models make about the evolutionary process at each site are frequently violated across the genome [66,67]. In birds, this is likely also the case because GC content varies considerably between avian lineages [10,68]. Complex partitioning schemes and more realistic models that account for heterogeneous processes on each alignment site (e.g., CAT, [69]) can alleviate problems [70], but are often computationally prohibitive on genome-scale datasets.

3.2.2. Phylogenetic Incongruence as a Pointer to Evolutionary Processes

Rather than viewing conflicting patterns of sequence data as a nuisance to the goal of deciphering the tree of life, some incompatibilities can be the footprint of evolution acting on the genome [71,72,73]. Introgression and hybridization can be detected from incongruent gene trees [74,75], with the hybrid being grouped with either parent species when analyzing different genomic sections [76]. Hybridization appears to be common in birds, with 16% of bird species known to interbreed across species [77] and is gaining increasing appreciation with whole genome data [78]. Incomplete lineage sorting (ILS, deep coalescence) is a process during which ancestral genetic variation is retained throughout the speciation process [79,80]. From population genetics theory, it is understood that ILS arises (1) when population size is large, which increases the probability that an ancestral polymorphism traverses through the split, and (2) when few generations pass between successive splitting events, which decreases the probability of fixation [81]. Albeit a population process, ILS is not limited to recent splits but can affect deep divergences [82]. Therefore, the strong ILS affecting the entire neoavian backbone implies that ancient populations had large effective population sizes and diverged rapidly [10,83]. A similar scenario can be drawn for the strong ILS within Palaeognathae, which confounds the estimation of their species tree [84]. At the extreme, speciation events may have occurred too quickly for populations fixing their own set of alleles, so it may simply be impossible to distinguish the order of events with a bifurcating tree. The existence of a hard polytomy across most of the neoavian backbone has been repeatedly suggested [33,36,85] but also refuted [12,40]. Formal gene-tree-based tests based on genome-wide loci reject a polytomy at least for the first three neoavian nodes [86].
Different genomic compartments, such as coding regions, intergenic regions, mitochondrial genomes, but also structural variations, can be expected to be under different evolutionary constraints and hence have different phylogenetic signal in birds [10,41,87,88,89]. Effects of the data type have been put forward to explain some of the alternative hypotheses of the Neoavian backbone [10,12,61]. If a locus is under selective constraint, phylogenetic signal may be overwritten by homoplasious substitutions in unrelated lineages, multiple substitutions on the same site, and heterogenous base composition [90]. Site saturation and heterogenous base composition can be incorporated into substitution models, but molecular homoplasy can only be identified when another data type, ideally not affected by homoplasy, is available for comparison. This is where we return to the water birds. In the Prum et al. [42] tree, which is based on mostly protein-coding sequences, most water birds get grouped together (Figure 2b). The same was found by Jarvis et al. [10] but only when analyzing protein-coding genes [12]. The majority of the genome, which is non-coding, supports independent origins, which implies that the similarities of the protein-coding sequences of ‘water birds’ arose by molecular homoplasy [10]. Another example are the Caprimulgiformes (swifts, nighjars and hummingbirds), which are the sister group to turacos, cuckoos and bustards when whole genome sequences are analyzed (Figure 2a), but shift to be the sister group to all other Neoaves when only protein-coding genes are analyzed (Figure 2b) [10,12,42].

3.3. Outlook

Bird phylogenomics is looking at a resourceful future with new genomes coming for hundreds of branches of their tree of life. The data will provide new angles to address long standing questions regarding the evolutionary history of birds, to study the distribution of phylogenetic signal throughout the genome and will further the development of new computational tools. A more densely sampled phylogeny will also be informative beyond the backbone of Neoaves. For instance, Passeriformes comprise about 60% of all bird species but only a handful of species have whole genomes available. Phase 2 of the B10K will release new genomic resources for over 200 passerines, which will provide a new scaffold to test macroevolutionary questions, such as the impact of historical factors on their extraordinary diversification [91,92,93].
With data production largely outpacing the development of appropriate inference methods, continued improvements of the scalability, accuracy and integration of the phylogenomic workflow are needed [94,95,96,97,98]. Another focus is on genome-scale reconstruction of phylogenetic networks, allowing the species tree to have circularizations pointing to hybridization [99]. The abundance of phylogenomic data also opens a new chapter for locus selection, where genomic loci can be chosen based on their characteristics, rather than being predefined with PCR or targeted capture [43]. The ability to design genomic experiments to test phylogenetic signal, or lack thereof, in different genomic compartments, across the same set of taxa, adds strength to whole genome datasets over studies with just a single data type. Selections of loci can be designed to answer specific questions (e.g., resolve the position of a specific taxon, [100]), or to have particular properties (e.g., low base-composition heterogeneity).

4. Genomic Evolution

4.1. Genomic Architecture of Birds

Avian genomes make connecting genomic differences to phenotypes simpler than other vertebrates due to their small genome size and conserved genomic structure. Birds have about the same number of genes as other amniotes [101], while their genome are much smaller than those of other amniotes and most vertebrates [102] (Figure 3a, left). Compact genomes have been commonly related to flight as genomes are small in birds and bats [103], smaller in flying than in flightless birds [104], and smaller in metabolically active birds [105,106]. The ancestral bird genomes have experienced massive large segmental deletions of >10,000 base pairs and purging of transposable elements (TEs) [9,103]. Bird genomes contain less repetitive DNA than other vertebrates, whose genomes can consist of up to 60% TEs [107]. The exception is the downy woodpecker with about 22% TEs [9] (Figure 3a, center). Autosomes of the collared flycatcher have a similar low TE content (5.9%) as other birds, but the species has a much higher density of TEs (48.5%) on the non-recombining region of the W chromosome [108].
Protein-coding genes of birds are on average 50% shorter than mammalian genes, which is due to the shortening of introns and intergenic regions while the exon length is about the same [9] (Figure 3a, right). Synteny is high even between distantly related birds, as are rates of gene and chromosomal duplications [109,110,111]. Therefore, there is generally a high stability of karyotypes with some exceptions with chromosome numbers ranging from 40 to 142 [112]. The ZW sex chromosome system of birds has heterogametic females (ZW) and homogametic males (ZZ). The Z chromosome formed from an autosome through an inversion, which placed the putative sex determining gene DMRT1 on the Z chromosome, while it degenerated on the W chromosome [113,114,115]. A karyotype modification has occurred in Sylvioidea, where a new sex chromosome appears to have formed by the fusion of autosomes and conventional sex chromosomes [116].

4.2. Understanding Adaptation by Integrating Genomic Data with Phenotypes

Centuries of natural history study on birds have recorded the stunning diversity of their morphology and life histories. Genomics now makes it possible to unveil the mechanisms underlying this variety, of which we illustrate some examples in Figure 3b. Conducting searches for candidate genes in a phylogenetic framework helps searching for the candidate ‘needle’ in the genomic ‘haystack’ of countless genetic differences that exist even between closely related species. Integration with the phylogeny also permits the reconstruction of ancestral states such as the loss of teeth in the ancestor of birds that inactivated all genes involved in the formation of dentin and enamel [117]. The bird beak functionally replaced the teeth [118] and diversified into a tremendously effective tool in different bird lineages. The classical system to study beak shape diversity are Darwin’s finches, in which cross-species genomic comparisons identified two genomic regions that are strongly associated with beak shape and size, respectively [119,120]. Beaks, as feathers, scales and claws are mainly composed of keratins [121]. Birds have much diversified their beta-keratin gene repertoire compared to other vertebrates, with a subfamily of feather beta-keratins that is unique to birds, while claw and scale beta-keratins are also found in turtles and crocodiles [9,122]. Visual opsin genes are diverse in birds, supporting tetrachromatic vision in the ancestor [9], and they coevolve with plumage coloration genes [123]. Penguins have only three functional opsins [9,124] and the nocturnal kiwi has inactivated of several opsin genes [125].
Availability of genomes for a greater number of species permits to target the genomic foundation of special traits of certain lineages. The large variety of rock pigeon breeds were one of Charles Darwin’s inspirations and comparative genomics showed that the characteristic head crests of many breeds are associated with just a single genetic change [126]. Bird song evolved in hummingbirds, and again either once in the ancestor of parrots and passerines (with subsequent loss in suboscines), or independently within oscine passerines and parrots [10,88]. This phenotypic convergence is also met by underlying molecular parallelism, because the vocal learning birds show convergent accelerated evolutionary rate in several hundred genes and regulatory regions [9]. The convergence goes even farther with gene expression in the brain of song-learning humans and songbirds showing surprisingly similar patterns [127].
Comparisons between closely related sister taxa with different phenotypes is a powerful approach for understanding the genomic basis of adaptation, which was used to identify candidate genes for flightlessness between the flightless Galapagos cormorant and its flying relatives [128]. Flight may have been lost 3 to 6 times in palaeognaths and the convergence is also found on the molecular level affecting the regulatory regions of genes involved in forelimb development [129]. The blue and yellow feather pigmentation of budgerigars is maintained by a single nucleotide difference in a polyketide synthase [130]. Adaptation of birds to low oxygen levels at high altitudes involves increased affinity of hemoglobin. In high-altitude hummingbirds, the same molecular substitutions confer parallel adaptation of hemoglobin [131]. To answer if this molecular predictability holds across a wider range of birds, hemoglobin sequences were compared between 28 species pairs of low- and high-altitude birds to find that higher oxygen affinity can be achieved through multiple routes of amino acid changes [132].

4.3. Outlook

Birds will remain an important source of comparative genomic insights because of their simple genomic structure and the availability of genomic and phenotypic resources. Phenotypic data are ideally are compiled and curated by experts and are accessible informatically in databases for integration with genomes. More genomes will give us an understanding on lineage-specific genomic innovations and the change of function of genes in different lineages. Accessibility of a growing number of genomes through NCBI and genome browsers but also the continued development of bird-specific portals (e.g., Avianbase, [133]) will be important for investigations of specific gene families or genomic regions.

5. Conclusions

We are in an age of unparalleled access to the evolutionary chronicles of birds. Every year a growing number of whole genomes, RNAseq, targeted capture, and RADseq data becomes available for birds. The choice among several sequencing technologies allows investigators to tailor the genome quality to their needs. Genomes based on short reads are relatively cheap and easily done, long-read sequencing technologies can be employed if continuity is required. While data generation has never been easier, the bottleneck in sequence analysis is largely set by the efficiency of algorithms and by computational skills and resources. Each new dataset is a small step towards a complete coverage of the bird tree of life, towards linking genomic variability to phenotypes and towards predicting species responses to environmental change. Comparisons with other vertebrates and other animals will shed further light into what makes a bird a bird and into their fascinating evolutionary history.

Author Contributions

Conceptualization, J.S. and G.Z.; Writing—Original Draft Preparation, J.S. and G.Z.; Writing—Review & Editing, J.S. and G.Z.; Visualization, J.S. and G.Z.

Funding

J.S. was funded by Carlsbergfondet, G.Z. was supported by the Lundbeckfonden (grant No. R190-2014-2827), Carlsbergfondet (grant No. CF CF16-0663), the Villum Foundation (grant No. 25900), and by the Strategic Priority Research Program of the Chinese Academy of Science (grant No. XDB13000000, XDB31020000).

Acknowledgments

We would like to thank the guest editor Peter Houde for the invitation to contribute this review. We are grateful for the helpful suggestions of three anonymous reviewers. We thank the members of the Bird 10,000 Genome Project (B10K) for their genomic and intellectual contributions to the consortium.

Conflicts of Interest

The authors declare no conflict of interest. The founding sponsors had no role in the design of the study; in the collection, analyses, or interpretation of data; in the writing of the manuscript, and in the decision to publish the results.

Abbreviations

The following abbreviations are used in this manuscript:
B10KBird 10,000 Genome Project
VGPVertebrate Genome Project
ILSIncomplete Lineage Sorting
bpbase pairs
kbkilo base pairs
Mbmega base pairs
Gbgiga base pairs

References

  1. Brusatte, S.L.; O’Connor, J.K.; Jarvis, E.D. The Origin and Diversification of Birds. Curr. Biol. 2015, 25, R888–R898. [Google Scholar] [CrossRef] [PubMed] [Green Version]
  2. Whelan, C.J.; Wenny, D.G.; Marquis, R.J. Ecosystem Services Provided by Birds. Ann. N. Y. Acad. Sci. 2008, 1134, 25–60. [Google Scholar] [CrossRef] [PubMed]
  3. Pereira, H.; Cooper, H.D. Towards the global monitoring of biodiversity change. Trends Ecol. Evol. 2006, 21, 123–129. [Google Scholar] [CrossRef] [PubMed]
  4. Butchart, S.; Walpole, M.; Collen, B.; Van Strien, A.; Scharlemann, J.; Almond, R.; Baillie, J.; Bomhard, B.; Brown, C.; Bruno, J.; et al. Global biodiversity: Indicators of recent declines. Science 2010, 328, 1164–1168. [Google Scholar] [CrossRef] [PubMed]
  5. International Chicken Genome Consortium. Sequence and comparative analysis of the chicken genome provide unique perspectives on vertebrate evolution. Nature 2004, 432, 695–716. [Google Scholar] [CrossRef] [PubMed]
  6. Dalloul, R.A.; Long, J.A.; Zimin, A.V.; Aslam, L.; Beal, K.; Blomberg, L.A.; Bouffard, P.; Burt, D.W.; Crasta, O.; Crooijmans, R.P.M.A.; et al. Multi-platform next-generation sequencing of the domestic turkey (Meleagris gallopavo): Genome assembly and analysis. PLoS Biol. 2010, 8, e1000475. [Google Scholar] [CrossRef] [PubMed]
  7. Warren, W.; Clayton, D.; Ellegren, H.; Arnold, A.; Hillier, L.; Künstner, A.; Searle, S.; White, S.; Vilella, A.; Fairley, S.; et al. The genome of a songbird. Nature 2010, 464, 757–762. [Google Scholar] [CrossRef] [PubMed]
  8. Zhang, G.; Jarvis, E.D.; Gilbert, M.T.P. A flock of genomes. Science 2014, 346, 1308–1309. [Google Scholar] [CrossRef] [PubMed] [Green Version]
  9. Zhang, G.; Li, C.; Li, Q.; Li, B.; Larkin, D.M.; Lee, C.; Storz, J.F.; Antunes, A.; Greenwold, M.J.; Meredith, R.W.; et al. Comparative genomics reveals insights into avian genome evolution and adaptation. Science 2014, 346, 1311–1320. [Google Scholar] [CrossRef] [PubMed] [Green Version]
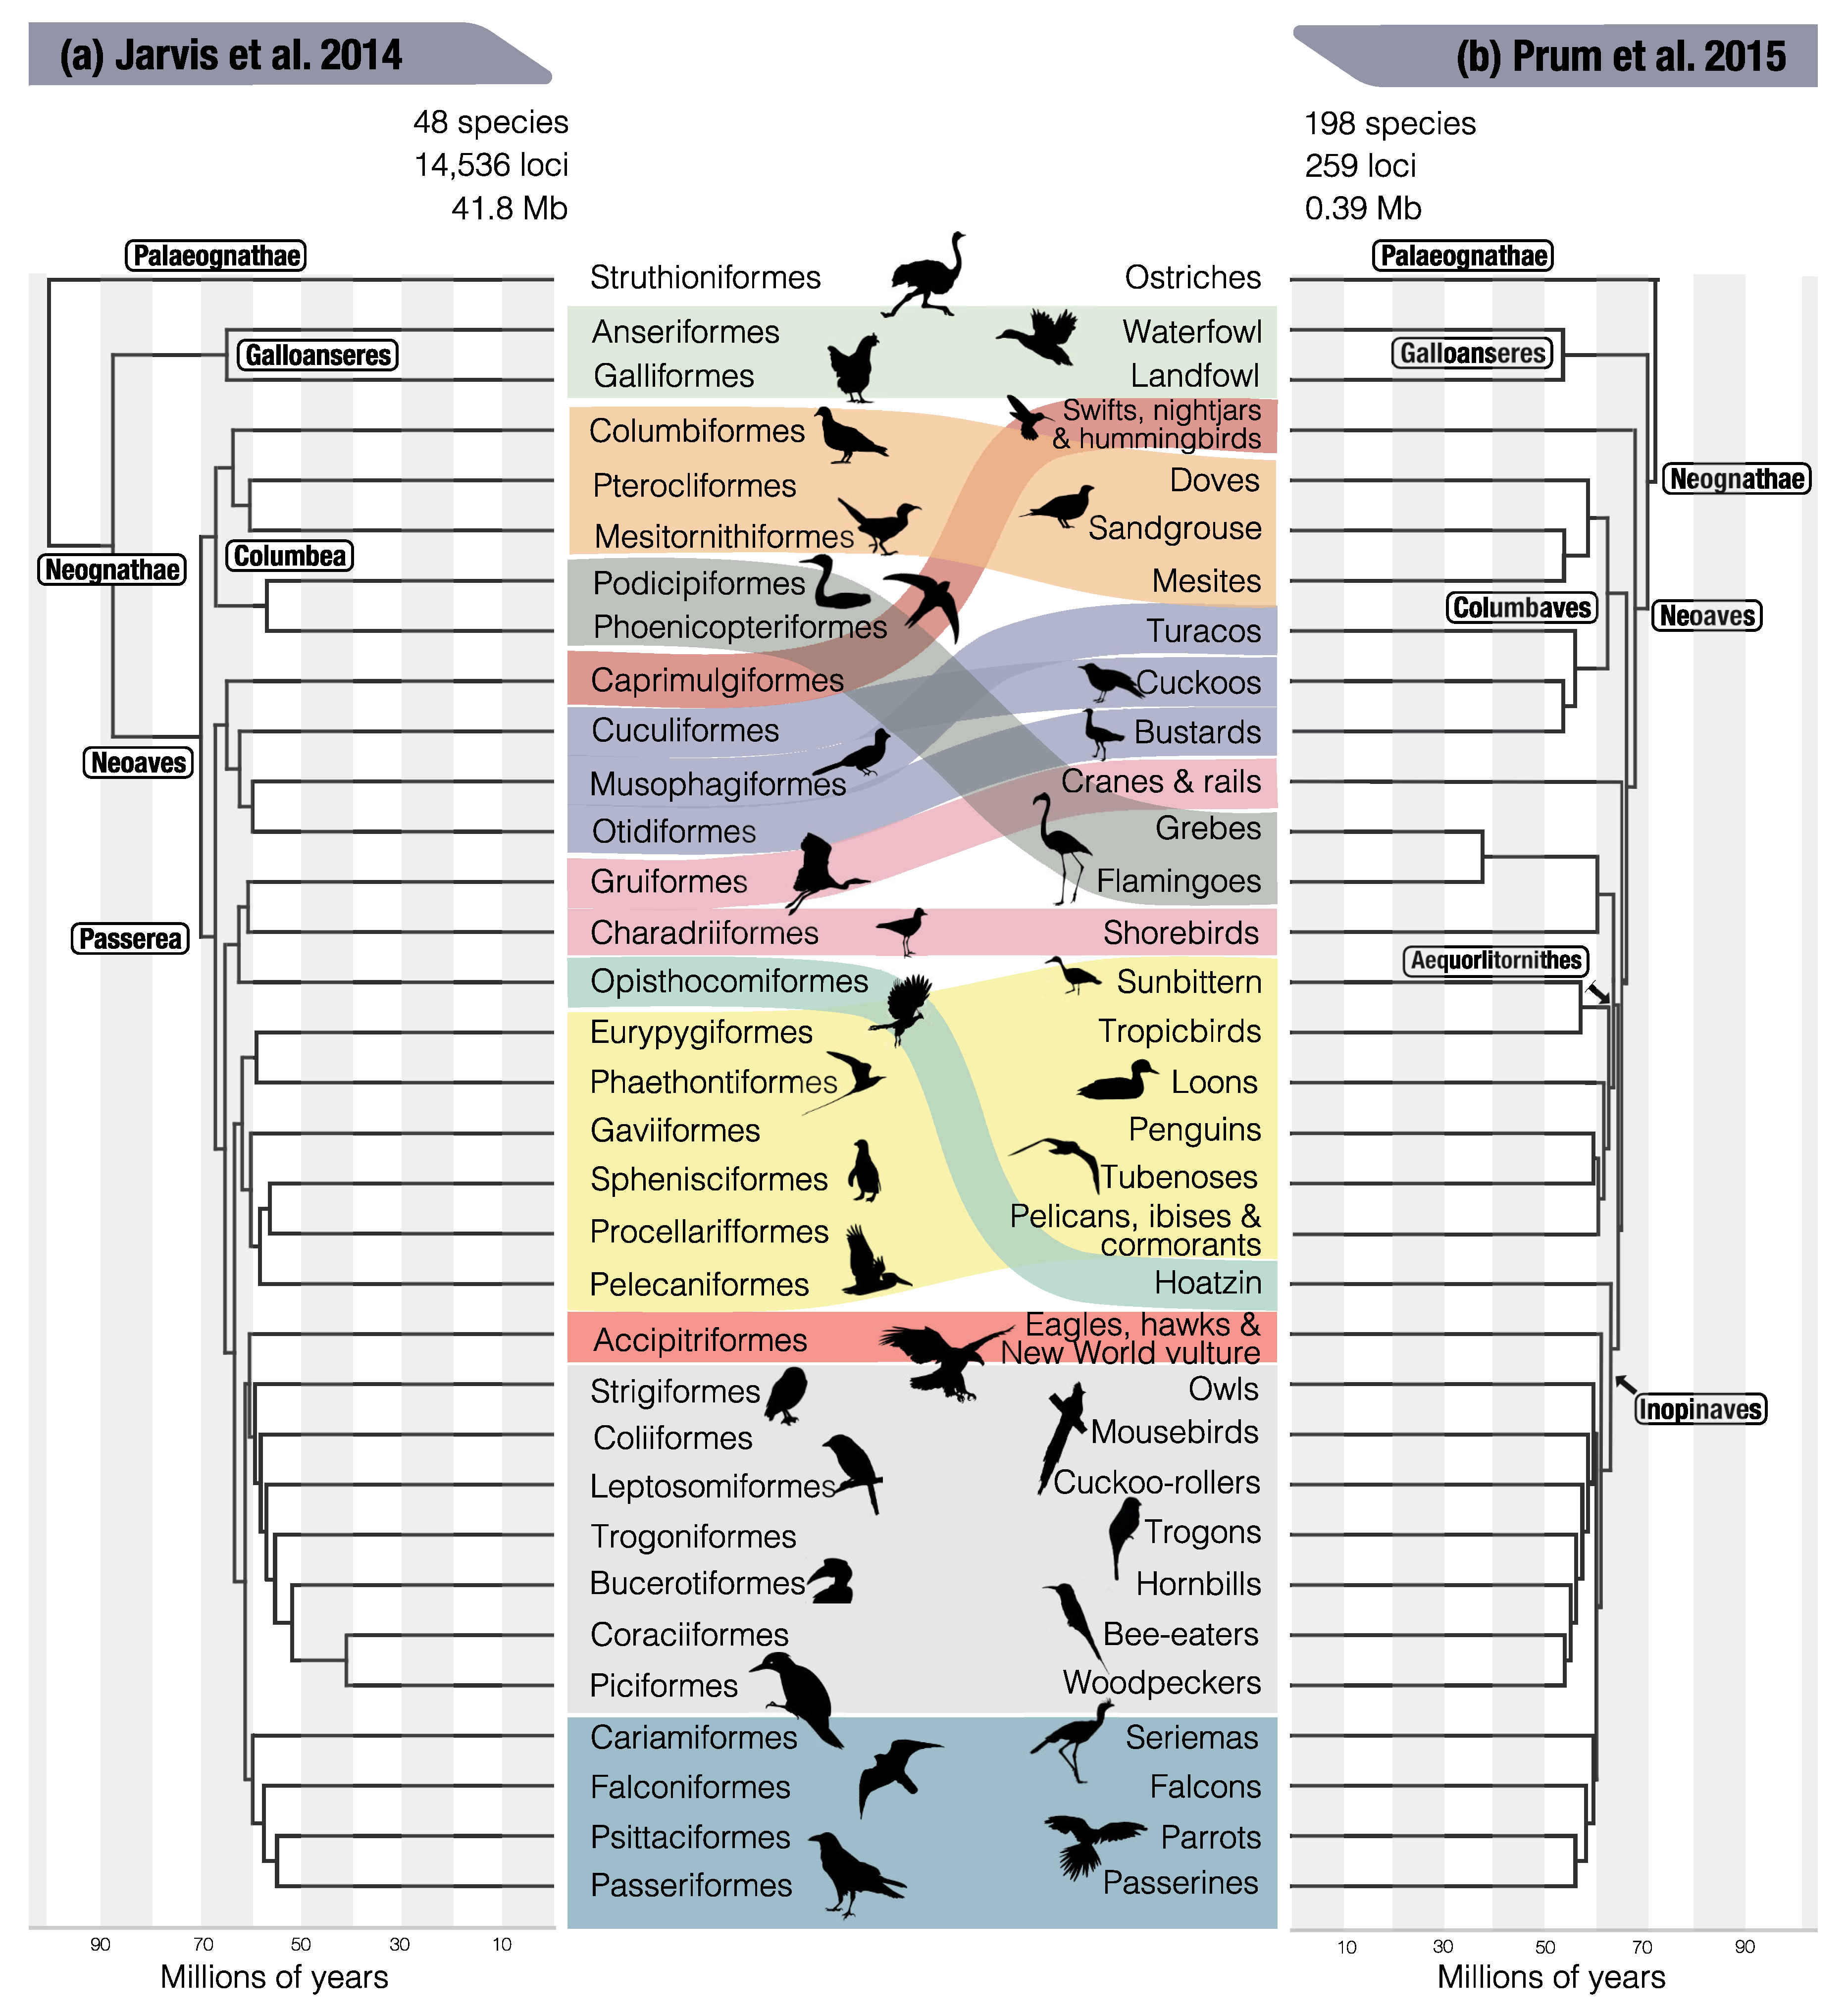
  10. Jarvis, E.D.; Mirarab, S.; Aberer, A.J.; Li, B.; Houde, P.; Li, C.; Ho, S.Y.W.; Faircloth, B.C.; Nabholz, B.; Howard, J.T.; et al. Whole-genome analyses resolve early branches in the tree of life of modern birds. Science 2014, 346, 1320–1331. [Google Scholar] [CrossRef] [PubMed] [Green Version]
  11. Zhang, G. Bird sequencing project takes off. Nature 2015, 522, 34. [Google Scholar] [CrossRef] [PubMed]
  12. Reddy, S.; Kimball, R.T.; Pandey, A.; Hosner, P.A.; Braun, M.J.; Hackett, S.J.; Han, K.L.; Harshman, J.; Huddleston, C.J.; Kingston, S.; et al. Why Do Phylogenomic Data Sets Yield Conflicting Trees? Data Type Influences the Avian Tree of Life more than Taxon Sampling. Syst. Biol. 2017, 66, 857–879. [Google Scholar] [CrossRef] [PubMed]
  13. Li, R.; Fan, W.; Tian, G.; Zhu, H.; He, L.; Cai, J.; Huang, Q.; Cai, Q.; Li, B.; Bai, Y.; et al. The sequence and de novo assembly of the giant panda genome. Nature 2009, 463, 311–317. [Google Scholar] [CrossRef] [PubMed] [Green Version]
  14. Li, R.; Li, Y.; Kristiansen, K.; Wang, J. SOAP: Short oligonucleotide alignment program. Bioinformatics 2008, 24, 713–714. [Google Scholar] [CrossRef] [PubMed]
  15. Li, R.; Zhu, H.; Ruan, J.; Qian, W.; Fang, X.; Shi, Z.; Li, Y.; Li, S.; Shan, G.; Kristiansen, K.; et al. De novo assembly of human genomes with massively parallel short read sequencing. Genome Res. 2009, 20, 265–272. [Google Scholar] [CrossRef] [PubMed] [Green Version]
  16. Genome 10K Community of Scientists. Genome 10K: A Proposal to Obtain Whole-Genome Sequence for 10,000 Vertebrate Species. J. Hered. 2009, 100, 659–674. [Google Scholar] [CrossRef] [PubMed]
  17. Koepfli, K.P.; Paten, B.; O’Brien, S.J. The Genome 10K Project: A Way Forward. Annu. Rev. Anim. Biosci. 2015, 3, 57–111. [Google Scholar] [CrossRef] [Green Version]
  18. Zhang, G.; Li, B.; Li, C.; Gilbert, M.T.P.; Jarvis, E.D.; Wang, J. Comparative genomic data of the Avian Phylogenomics Project. GigaScience 2014, 3. [Google Scholar] [CrossRef]
  19. Peona, V.; Weissensteiner, M.H.; Suh, A. How complete are “complete” genome assemblies?—An avian perspective. Mol. Ecol. Resour. 2018. [Google Scholar] [CrossRef]
  20. Burt, D.W. Origin and evolution of avian microchromosomes. Cytogenet. Genome Res. 2002, 96, 97–112. [Google Scholar] [CrossRef]
  21. Wang, O.; Chin, R.; Cheng, X.; Wu, M.K.Y.; Mao, Q.; Tang, J.; Sun, Y.; Anderson, E.; Lam, H.K.; Chen, D.; et al. Efficient and unique cobarcoding of second-generation sequencing reads from long DNA molecules enabling cost-effective and accurate sequencing haplotyping, and de novo assembly. Genome Res. 2019, 29, 798–808. [Google Scholar] [CrossRef] [PubMed]
  22. van Berkum, N.L.; Lieberman-Aiden, E.; Williams, L.; Imakaev, M.; Gnirke, A.; Mirny, L.A.; Dekker, J.; Lander, E.S. Hi-C: A Method to Study the Three-dimensional Architecture of Genomes. J. Vis. Exp. 2010, 39. [Google Scholar] [CrossRef]
  23. Belton, J.M.; McCord, R.P.; Gibcus, J.H.; Naumova, N.; Zhan, Y.; Dekker, J. Hi–C: A comprehensive technique to capture the conformation of genomes. Methods 2012, 58, 268–276. [Google Scholar] [CrossRef] [PubMed]
  24. Zhang, J.; Li, C.; Zhou, Q.; Zhang, G. Improving the ostrich genome assembly using optical mapping data. GigaScience 2015, 4. [Google Scholar] [CrossRef] [PubMed] [Green Version]
  25. Sedlazeck, F.J.; Lee, H.; Darby, C.A.; Schatz, M.C. Piercing the dark matter: Bioinformatics of long-range sequencing and mapping. Nat. Rev. Genet. 2018, 19, 329–346. [Google Scholar] [CrossRef] [PubMed]
  26. Dudchenko, O.; Batra, S.; Omer, A.; Nyquist, S.; Hoeger, M.; Durand, N.; Shamim, M.; Machol, I.; Lander, E.; Aiden, A.; et al. De novo assembly of the Aedes Aegypti Genome Using Hi-C Yields Chromosome-Length Scaffolds. Science 2017, 356, 92–95. [Google Scholar] [CrossRef] [PubMed]
  27. Golloshi, R.; Sanders, J.T.; McCord, R.P. Iteratively improving Hi-C experiments one step at a time. Methods 2018, 142, 47–58. [Google Scholar] [CrossRef]
  28. Ghurye, J.; Pop, M.; Koren, S.; Bickhart, D.; Chin, C.S. Scaffolding of long read assemblies using long range contact information. BMC Genom. 2017, 18. [Google Scholar] [CrossRef]
  29. Durand, N.C.; Robinson, J.T.; Shamim, M.S.; Machol, I.; Mesirov, J.P.; Lander, E.S.; Aiden, E.L. Juicebox Provides a Visualization System for Hi-C Contact Maps with Unlimited Zoom. Cell Syst. 2016, 3, 99–101. [Google Scholar] [CrossRef] [Green Version]
  30. Dickinson, E.C.; Bahr, N.; Dowsett, R.; Pearson, D.; Remsen, V.; Roselaar, C.; Schodde, D. The Howard and Moore complete checklist of birds of the world. In The Howard and Moore Complete Checklist of Birds of the World; A & C Black: London, UK, 2014. [Google Scholar]
  31. Brown, J.W.; Wang, N.; Smith, S.A. The development of scientific consensus: Analyzing conflict and concordance among avian phylogenies. Mol. Phylogenet. Evol. 2017, 116, 69–77. [Google Scholar] [CrossRef]
  32. Dunn, C.W.; Zapata, F.; Munro, C.; Siebert, S.; Hejnol, A. Pairwise comparisons across species are problematic when analyzing functional genomic data. Proc. Natl. Acad. Sci. USA 2018, 115, E409–E417. [Google Scholar] [CrossRef] [PubMed] [Green Version]
  33. Suh, A. The phylogenomic forest of bird trees contains a hard polytomy at the root of Neoaves. Zool. Scr. 2016, 45, 50–62. [Google Scholar] [CrossRef]
  34. Feduccia, A. Explosive evolution in Tertiary birds and animals. Science 1995, 267, 637–639. [Google Scholar] [CrossRef] [PubMed]
  35. Feduccia, A. ‘Big bang’ for tertiary birds? Trends Ecol. Evol. 2003, 18, 172–176. [Google Scholar] [CrossRef]
  36. Poe, S.; Chubb, A.L. Birds in a bush: Five genes indicate explosive evolution of avian orders. Evolution 2004, 58, 404–415. [Google Scholar] [CrossRef] [PubMed]
  37. Ksepka, D.T.; Stidham, T.A.; Williamson, T.E. Early Paleocene landbird supports rapid phylogenetic and morphological diversification of crown birds after the K–Pg mass extinction. Proc. Natl. Acad. Sci. USA 2017, 114, 8047–8052. [Google Scholar] [CrossRef] [PubMed]
  38. Whitfield, J.B.; Lockhart, P.J. Deciphering ancient rapid radiations. Trends Ecol. Evol. 2007, 22, 258–265. [Google Scholar] [CrossRef] [PubMed]
  39. Pacheco, M.; Battistuzzi, F.; Lentino, M.; Aguilar, R.; Kumar, S.; Escalante, A. Evolution of modern birds revealed by mitogenomics: Timing the radiation and origin of major orders. Mol. Biol. Evol. 2011, 28, 1927–1942. [Google Scholar] [CrossRef] [PubMed]
  40. Hackett, S.J.; Kimball, R.T.; Reddy, S.; Bowie, R.C.K.; Braun, E.L.; Braun, M.J.; Chojnowski, J.L.; Cox, W.A.; Han, K.L.; Harshman, J.; et al. A Phylogenomic Study of Birds Reveals Their Evolutionary History. Science 2008, 320, 1763–1768. [Google Scholar] [CrossRef]
  41. McCormack, J.E.; Harvey, M.G.; Faircloth, B.C.; Crawford, N.G.; Glenn, T.C.; Brumfield, R.T. A Phylogeny of Birds Based on Over 1,500 Loci Collected by Target Enrichment and High-Throughput Sequencing. PLoS ONE 2013, 8, e54848. [Google Scholar] [CrossRef]
  42. Prum, R.; Berv, J.; Dornburg, A.; Field, D.; Townsend, J.; Lemmon, E.; Lemmon, A. A comprehensive phylogeny of birds (Aves) using targeted next-generation DNA sequencing. Nature 2015, 526, 569–573. [Google Scholar] [CrossRef] [PubMed]
  43. Bravo, G.; Antonelli, A.; Bacon, C.; Bartoszek, K.; Blom, M.; Huynh, S.; Jones, G.; Knowles, L.; Lamichhaney, S.; Marcussen, T.; et al. Embracing heterogeneity: Coalescing the Tree of Life and the future of phylogenomics. PeerJ 2019, 7, e6399. [Google Scholar] [CrossRef] [PubMed]
  44. King, N.; Rokas, A. Embracing Uncertainty in Reconstructing Early Animal Evolution. Curr. Biol. 2017, 27, R1081–R1088. [Google Scholar] [CrossRef] [PubMed]
  45. Mirarab, S.; Bayzid, M.S.; Boussau, B.; Warnow, T. Statistical binning enables an accurate coalescent-based estimation of the avian tree. Science 2014, 346, 1250463. [Google Scholar] [CrossRef] [PubMed] [Green Version]
  46. Bayzid, M.S.; Mirarab, S.; Boussau, B.; Warnow, T. Weighted Statistical Binning: Enabling Statistically Consistent Genome-Scale Phylogenetic Analyses. PLoS ONE 2015, 10, e0129183. [Google Scholar] [CrossRef] [PubMed]
  47. Kozlov, A.M.; Aberer, A.J.; Stamatakis, A. ExaML version 3: A tool for phylogenomic analyses on supercomputers. Bioinformatics 2015, 31, 2577–2579. [Google Scholar] [CrossRef]
  48. Jeffroy, O.; Brinkmann, H.; Delsuc, F.; Philippe, H. Phylogenomics: The beginning of incongruence? Trends Genet. 2006, 22, 225–231. [Google Scholar] [CrossRef]
  49. Paten, B.; Earl, D.; Nguyen, N.; Diekhans, M.; Zerbino, D.; Haussler, D. Cactus: Algorithms for genome multiple sequence alignment. Genome Res. 2011, 21, 1512–1528. [Google Scholar] [CrossRef] [Green Version]
  50. Green, R.; Braun, E.; Armstrong, J.; Earl, D.; Nguyen, N.; Hickey, G.; Vandewege, M.; St, J.J.; Capella-Gutiérrez, S.; Castoe, T.; et al. Three crocodilian genomes reveal ancestral patterns of evolution among archosaurs. Science 2014, 346, 1254449. [Google Scholar] [CrossRef]
  51. Kronenberg, Z.N.; Fiddes, I.T.; Gordon, D.; Murali, S.; Cantsilieris, S.; Meyerson, O.S.; Underwood, J.G.; Nelson, B.J.; Chaisson, M.J.P.; Dougherty, M.L.; et al. High-resolution comparative analysis of great ape genomes. Science 2018, 360, eaar6343. [Google Scholar] [CrossRef]
  52. Bergsten, J. A review of long-branch attraction. Cladistics 2005, 21, 163–193. [Google Scholar] [CrossRef]
  53. Brinkmann, H.; van der Giezen, M.; Zhou, Y.; de Raucourt, G.P.; Philippe, H. An Empirical Assessment of Long-Branch Attraction Artefacts in Deep Eukaryotic Phylogenomics. Syst. Biol. 2005, 54, 743–757. [Google Scholar] [CrossRef] [PubMed] [Green Version]
  54. Roch, S.; Nute, M.; Warnow, T. Long-Branch Attraction in Species Tree Estimation: Inconsistency of Partitioned Likelihood and Topology-Based Summary Methods. Syst. Biol. 2018, 68, 281–297. [Google Scholar] [CrossRef] [PubMed] [Green Version]
  55. Pollock, D.D.; Zwickl, D.J.; McGuire, J.A.; Hillis, D.M. Increased Taxon Sampling Is Advantageous for Phylogenetic Inference. Syst. Biol. 2002, 51, 664–671. [Google Scholar] [CrossRef] [PubMed] [Green Version]
  56. Zwickl, D.J.; Hillis, D.M. Increased Taxon Sampling Greatly Reduces Phylogenetic Error. Syst. Biol. 2002, 51, 588–598. [Google Scholar] [CrossRef] [PubMed]
  57. Hillis, D.M.; Pollock, D.D.; McGuire, J.A.; Zwickl, D.J. Is Sparse Taxon Sampling a Problem for Phylogenetic Inference? Syst. Biol. 2003, 52, 124–126. [Google Scholar] [CrossRef] [PubMed]
  58. Heath, T.A.; Zwickl, D.J.; Kim, J.; Hillis, D.M. Taxon Sampling Affects Inferences of Macroevolutionary Processes from Phylogenetic Trees. Syst. Biol. 2008, 57, 160–166. [Google Scholar] [CrossRef] [PubMed] [Green Version]
  59. Nabhan, A.R.; Sarkar, I.N. The impact of taxon sampling on phylogenetic inference: A review of two decades of controversy. Brief. Bioinform. 2011, 13, 122–134. [Google Scholar] [CrossRef]
  60. Betancur-R, R.; Arcila, D.; Vari, R.P.; Hughes, L.C.; Oliveira, C.; Sabaj, M.H.; Ortí, G. Phylogenomic incongruence, hypothesis testing, and taxonomic sampling: The monophyly of characiform fishes. Evolution 2019, 73, 329–345. [Google Scholar] [CrossRef]
  61. Tamashiro, R.A.; White, N.D.; Braun, M.J.; Faircloth, B.C.; Braun, E.L.; Kimball, R.T. What are the roles of taxon sampling and model fit in tests of cyto-nuclear discordance using avian mitogenomic data? Mol. Phylogenet. Evol. 2019, 130, 132–142. [Google Scholar] [CrossRef]
  62. Kelchner, S.A.; Thomas, M.A. Model use in phylogenetics: Nine key questions. Trends Ecol. Evol. 2007, 22, 87–94. [Google Scholar] [CrossRef] [PubMed]
  63. Tarver, J.E.; dos Reis, M.; Mirarab, S.; Moran, R.J.; Parker, S.; O’Reilly, J.E.; King, B.L.; O’Connell, M.J.; Asher, R.J.; Warnow, T.; et al. The Interrelationships of Placental Mammals and the Limits of Phylogenetic Inference. Genome Biol. Evol. 2016, 8, 330–344. [Google Scholar] [CrossRef] [PubMed]
  64. Philippe, H.; Delsuc, F.; Brinkmann, H.; Lartillot, N. Phylogenomics. Annu. Rev. Ecol. Evol. Syst. 2005, 36, 541–562. [Google Scholar] [CrossRef]
  65. Rodríguez-Ezpeleta, N.; Brinkmann, H.; Roure, B.; Lartillot, N.; Lang, B.F.; Philippe, H. Detecting and Overcoming Systematic Errors in Genome-Scale Phylogenies. Syst. Biol. 2007, 56, 389–399. [Google Scholar] [CrossRef] [PubMed] [Green Version]
  66. Arbiza, L.; Patricio, M.; Dopazo, H.; Posada, D. Genome-Wide Heterogeneity of Nucleotide Substitution Model Fit. Genome Biol. Evol. 2011, 3, 896–908. [Google Scholar] [CrossRef] [PubMed] [Green Version]
  67. Naser-Khdour, S.; Minh, B.Q.; Zhang, W.; Stone, E.; Lanfear, R. The Prevalence and Impact of Model Violations in Phylogenetics Analysis. bioRxiv 2018. [Google Scholar] [CrossRef]
  68. Weber, C.C.; Boussau, B.; Romiguier, J.; Jarvis, E.D.; Ellegren, H. Evidence for GC-biased gene conversion as a driver of between-lineage differences in avian base composition. Genome Biol. 2014, 15. [Google Scholar] [CrossRef] [PubMed]
  69. Lartillot, N.; Philippe, H. A Bayesian Mixture Model for Across-Site Heterogeneities in the Amino-Acid Replacement Process. Mol. Biol. Evol. 2004, 21, 1095–1109. [Google Scholar] [CrossRef]
  70. Lartillot, N.; Brinkmann, H.; Philippe, H. Suppression of long-branch attraction artefacts in the animal phylogeny using a site-heterogeneous model. BMC Evol. Biol. 2007, 7, S4. [Google Scholar] [CrossRef]
  71. Maddison, W.P. Gene Trees in Species Trees. Syst. Biol. 1997, 46, 523–536. [Google Scholar] [CrossRef]
  72. Degnan, J.H.; DeGiorgio, M.; Bryant, D.; Rosenberg, N.A. Properties of Consensus Methods for Inferring Species Trees from Gene Trees. Syst. Biol. 2009, 58, 35–54. [Google Scholar] [CrossRef] [PubMed] [Green Version]
  73. Nakhleh, L. Computational approaches to species phylogeny inference and gene tree reconciliation. Trends Ecol. Evol. 2013, 28, 719–728. [Google Scholar] [CrossRef] [PubMed] [Green Version]
  74. Meng, C.; Kubatko, L.S. Detecting hybrid speciation in the presence of incomplete lineage sorting using gene tree incongruence: A model. Theor. Popul. Biol. 2009, 75, 35–45. [Google Scholar] [CrossRef] [PubMed]
  75. Yu, Y.; Degnan, J.H.; Nakhleh, L. The Probability of a Gene Tree Topology within a Phylogenetic Network with Applications to Hybridization Detection. PLoS Genet. 2012, 8, e1002660. [Google Scholar] [CrossRef] [PubMed]
  76. Lamichhaney, S.; Han, F.; Webster, M.T.; Andersson, L.; Grant, B.R.; Grant, P.R. Rapid hybrid speciation in Darwin’s finches. Science 2017, 359, 224–228. [Google Scholar] [CrossRef] [PubMed]
  77. Ottenburghs, J.; Ydenberg, R.C.; Hooft, P.V.; Wieren, S.E.V.; Prins, H.H. The Avian Hybrids Project: Gathering the scientific literature on avian hybridization. Ibis 2015, 157, 892–894. [Google Scholar] [CrossRef]
  78. Ottenburghs, J.; Kraus, R.H.S.; van Hooft, P.; van Wieren, S.E.; Ydenberg, R.C.; Prins, H.H.T. Avian introgression in the genomic era. Avian Res. 2017, 8. [Google Scholar] [CrossRef]
  79. Degnan, J.H.; Rosenberg, N.A. Discordance of Species Trees with Their Most Likely Gene Trees. PLoS Genet. 2006, 2, e68. [Google Scholar] [CrossRef] [PubMed]
  80. Maddison, W.P.; Knowles, L.L. Inferring Phylogeny Despite Incomplete Lineage Sorting. Syst. Biol. 2006, 55, 21–30. [Google Scholar] [CrossRef] [PubMed]
  81. Mailund, T.; Munch, K.; Schierup, M.H. Lineage Sorting in Apes. Annu. Rev. Genet. 2014, 48, 519–535. [Google Scholar] [CrossRef] [PubMed]
  82. Oliver, J.C. Microevolutionary processes generate phylogenomic discordance at ancient divergences. Evolution 2013, 67, 1823–1830. [Google Scholar] [CrossRef] [PubMed]
  83. Suh, A.; Smeds, L.; Ellegren, H. The Dynamics of Incomplete Lineage Sorting across the Ancient Adaptive Radiation of Neoavian Birds. PLoS Biol. 2015, 13, e1002224. [Google Scholar] [CrossRef] [PubMed]
  84. Cloutier, A.; Sackton, T.B.; Grayson, P.; Clamp, M.; Baker, A.J.; Edwards, S.V. Whole-Genome Analyses Resolve the Phylogeny of Flightless Birds (Palaeognathae) in the Presence of an Empirical Anomaly Zone. Syst. Biol. 2019. [Google Scholar] [CrossRef]
  85. Rokas, A.; Carroll, S.B. Bushes in the Tree of Life. PLoS Biol. 2006, 4, e352. [Google Scholar] [CrossRef] [PubMed]
  86. Sayyari, E.; Mirarab, S. Testing for Polytomies in Phylogenetic Species Trees Using Quartet Frequencies. Genes 2018, 9, 132. [Google Scholar] [CrossRef]
  87. Chojnowski, J.L.; Kimball, R.T.; Braun, E.L. Introns outperform exons in analyses of basal avian phylogeny using clathrin heavy chain genes. Gene 2008, 410, 89–96. [Google Scholar] [CrossRef] [PubMed]
  88. Suh, A.; Paus, M.; Kiefmann, M.; Churakov, G.; Franke, F.A.; Brosius, J.; Kriegs, J.O.; Schmitz, J. Mesozoic retroposons reveal parrots as the closest living relatives of passerine birds. Nat. Commun. 2011, 2. [Google Scholar] [CrossRef]
  89. Edwards, S.V.; Cloutier, A.; Baker, A.J. Conserved Nonexonic Elements: A Novel Class of Marker for Phylogenomics. Syst. Biol. 2017, 66, 1028–1044. [Google Scholar] [CrossRef]
  90. Edwards, S.V. Natural selection and phylogenetic analysis. Proc. Natl. Acad. Sci. USA 2009, 106, 8799–8800. [Google Scholar] [CrossRef] [Green Version]
  91. Claramunt, S.; Cracraft, J. A new time tree reveals Earth history’s imprint on the evolution of modern birds. Sci. Adv. 2015, 1, e1501005. [Google Scholar] [CrossRef]
  92. Moyle, R.G.; Oliveros, C.H.; Andersen, M.J.; Hosner, P.A.; Benz, B.W.; Manthey, J.D.; Travers, S.L.; Brown, R.M.; Faircloth, B.C. Tectonic collision and uplift of Wallacea triggered the global songbird radiation. Nat. Commun. 2016, 7, 12709. [Google Scholar] [CrossRef] [PubMed]
  93. Oliveros, C.H.; Field, D.J.; Ksepka, D.T.; Barker, F.K.; Aleixo, A.; Andersen, M.J.; Alström, P.; Benz, B.W.; Braun, E.L.; Braun, M.J.; et al. Earth history and the passerine superradiation. Proc. Natl. Acad. Sci. USA 2019, 116, 7916–7925. [Google Scholar] [CrossRef] [PubMed] [Green Version]
  94. Nguyen, L.T.; Schmidt, H.A.; von Haeseler, A.; Minh, B.Q. IQ-TREE: A Fast and Effective Stochastic Algorithm for Estimating Maximum-Likelihood Phylogenies. Mol. Biol. Evol. 2014, 32, 268–274. [Google Scholar] [CrossRef] [PubMed]
  95. Guang, A.; Zapata, F.; Howison, M.; Lawrence, C.E.; Dunn, C.W. An Integrated Perspective on Phylogenetic Workflows. Trends Ecol. Evol. 2016, 31, 116–126. [Google Scholar] [CrossRef] [PubMed] [Green Version]
  96. Kalyaanamoorthy, S.; Minh, B.Q.; Wong, T.K.F.; von Haeseler, A.; Jermiin, L.S. ModelFinder: Fast model selection for accurate phylogenetic estimates. Nat. Methods 2017, 14, 587–589. [Google Scholar] [CrossRef] [PubMed]
  97. Morel, B.; Kozlov, A.M.; Stamatakis, A. ParGenes: A tool for massively parallel model selection and phylogenetic tree inference on thousands of genes. Bioinformatics 2018, 35, 1771–1773. [Google Scholar] [CrossRef] [PubMed]
  98. Kozlov, A.M.; Darriba, D.; Flouri, T.; Morel, B.; Stamatakis, A. RAxML-NG: A fast scalable and user-friendly tool for maximum likelihood phylogenetic inference. Bioinformatics 2019. [Google Scholar] [CrossRef]
  99. Elworth, R.A.L.; Ogilvie, H.A.; Zhu, J.; Nakhleh, L. Advances in Computational Methods for Phylogenetic Networks in the Presence of Hybridization. In Bioinformatics and Phylogenetics; Springer Nature Switzerland: Cham, Switzerland, 2019; pp. 317–360. [Google Scholar] [CrossRef] [Green Version]
  100. Chen, M.Y.; Liang, D.; Zhang, P. Selecting Question-Specific Genes to Reduce Incongruence in Phylogenomics: A Case Study of Jawed Vertebrate Backbone Phylogeny. Syst. Biol. 2015, 64, 1104–1120. [Google Scholar] [CrossRef] [Green Version]
  101. Botero-Castro, F.; Figuet, E.; Tilak, M.K.; Nabholz, B.; Galtier, N. Avian Genomes Revisited: Hidden Genes Uncovered and the Rates versus Traits Paradox in Birds. Mol. Biol. Evol. 2017, 34, 3123–3131. [Google Scholar] [CrossRef]
  102. Gregory, T.; Nicol, J.; Tamm, H.; Kullman, B.; Kullman, K.; Leitch, I.; Murray, B.; Kapraun, D.; Greilhuber, J.; Bennett, M. Eukaryotic genome size databases. Nucleic Acids Res. 2007, 35, D332–D338. [Google Scholar] [CrossRef]
  103. Kapusta, A.; Suh, A.; Feschotte, C. Dynamics of genome size evolution in birds and mammals. Proc. Natl. Acad. Sci. USA 2017, 114, E1460–E1469. [Google Scholar] [CrossRef] [PubMed] [Green Version]
  104. Kapusta, A.; Suh, A. Evolution of bird genomes-a transposon’s-eye view. Ann. N. Y. Acad. Sci. 2016, 1389, 164–185. [Google Scholar] [CrossRef] [PubMed]
  105. Gregory, T.R. A birds’s-eye view of the C-value enigma: Genome size, cell size, and metabolic rate in the class Aves. Evolution 2002, 56, 121–130. [Google Scholar] [CrossRef] [PubMed]
  106. Gregory, T.R.; Andrews, C.B.; McGuire, J.A.; Witt, C.C. The smallest avian genomes are found in hummingbirds. Proc. R. Soc. B Biol. Sci. 2009, 276, 3753–3757. [Google Scholar] [CrossRef] [PubMed] [Green Version]
  107. Sotero-Caio, C.G.; Platt, R.N.; Suh, A.; Ray, D.A. Evolution and Diversity of Transposable Elements in Vertebrate Genomes. Genome Biol. Evol. 2017, 9, 161–177. [Google Scholar] [CrossRef] [PubMed] [Green Version]
  108. Smeds, L.; Warmuth, V.; Bolivar, P.; Uebbing, S.; Burri, R.; Suh, A.; Nater, A.; Bureš, S.; Garamszegi, L.Z.; Hogner, S.; et al. Evolutionary analysis of the female-specific avian W chromosome. Nat. Commun. 2015, 6, 7330. [Google Scholar] [CrossRef] [Green Version]
  109. Ellegren, H. Evolutionary stasis: The stable chromosomes of birds. Trends Ecol. Evol. 2010, 25, 283–291. [Google Scholar] [CrossRef]
  110. O’Connor, R.E.; Kiazim, L.; Skinner, B.; Fonseka, G.; Joseph, S.; Jennings, R.; Larkin, D.M.; Griffin, D.K. Patterns of microchromosome organization remain highly conserved throughout avian evolution. Chromosoma 2018, 128, 21–29. [Google Scholar] [CrossRef] [Green Version]
  111. Zhang, G. The bird’s-eye view on chromosome evolution. Genome Biol. 2018, 19. [Google Scholar] [CrossRef]
  112. Kretschmer, R.; Ferguson-Smith, M.; de Oliveira, E. Karyotype Evolution in Birds: From Conventional Staining to Chromosome Painting. Genes 2018, 9, 181. [Google Scholar] [CrossRef]
  113. Wang, Z.; Zhang, J.; Yang, W.; An, N.; Zhang, P.; Zhang, G.; Zhou, Q. Temporal genomic evolution of bird sex chromosomes. BMC Evol. Biol. 2014, 14, 250. [Google Scholar] [CrossRef] [PubMed]
  114. Zhou, Q.; Zhang, J.; Bachtrog, D.; An, N.; Huang, Q.; Jarvis, E.D.; Gilbert, M.T.P.; Zhang, G. Complex evolutionary trajectories of sex chromosomes across bird taxa. Science 2014, 346, 1246338. [Google Scholar] [CrossRef] [PubMed]
  115. Xu, L.; Auer, G.; Peona, V.; Suh, A.; Deng, Y.; Feng, S.; Zhang, G.; Blom, M.P.; Christidis, L.; Prost, S.; et al. Dynamic evolutionary history and gene content of sex chromosomes across diverse songbirds. Nat. Ecol. Evol. 2019, 3, 834. [Google Scholar] [CrossRef] [PubMed]
  116. Pala, I.; Naurin, S.; Stervander, M.; Hasselquist, D.; Bensch, S.; Hansson, B. Evidence of a neo-sex chromosome in birds. Heredity 2011, 108, 264–272. [Google Scholar] [CrossRef] [PubMed] [Green Version]
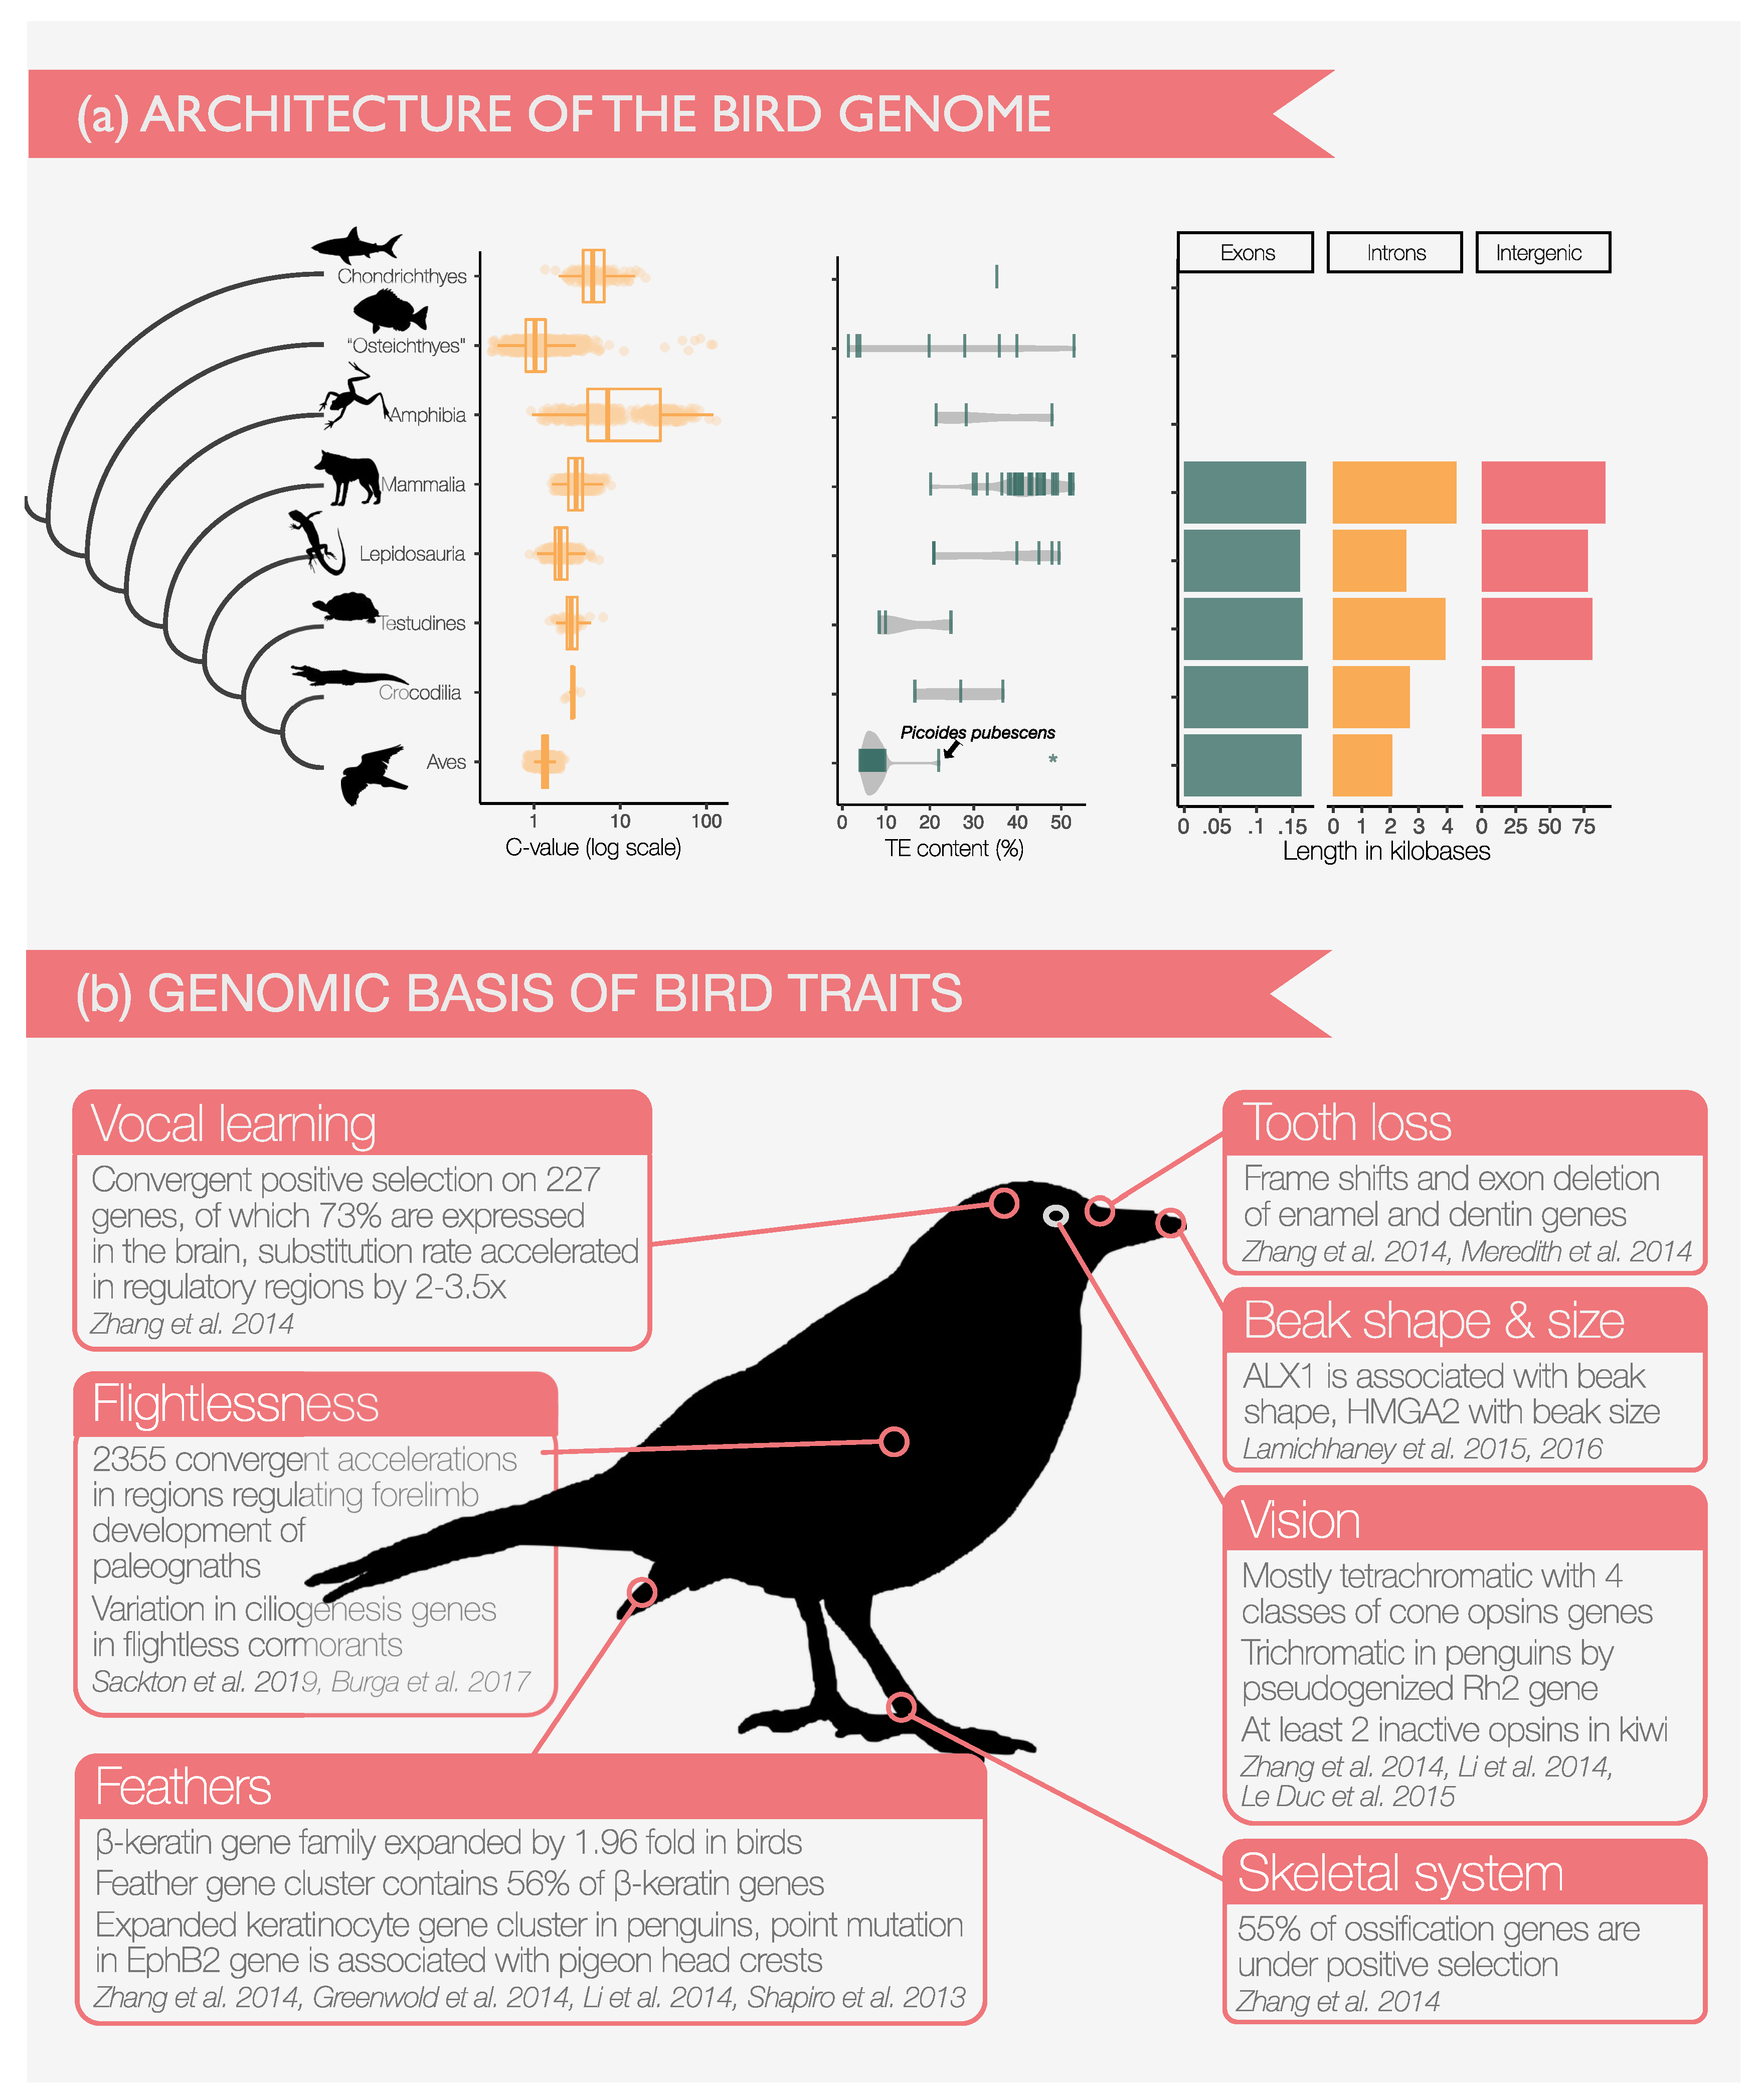
  117. Meredith, R.W.; Zhang, G.; Gilbert, M.T.P.; Jarvis, E.D.; Springer, M.S. Evidence for a single loss of mineralized teeth in the common avian ancestor. Science 2014, 346, 1254390. [Google Scholar] [CrossRef] [PubMed] [Green Version]
  118. Louchart, A.; Viriot, L. From snout to beak: The loss of teeth in birds. Trends Ecol. Evol. 2011, 26, 663–673. [Google Scholar] [CrossRef] [PubMed]
  119. Lamichhaney, S.; Berglund, J.; Almén, M.S.; Maqbool, K.; Grabherr, M.; Martinez-Barrio, A.; Promerová, M.; Rubin, C.J.; Wang, C.; Zamani, N.; et al. Evolution of Darwin’s finches and their beaks revealed by genome sequencing. Nature 2015, 518, 371. [Google Scholar] [CrossRef] [PubMed]
  120. Lamichhaney, S.; Han, F.; Berglund, J.; Wang, C.; Almén, M.; Webster, M.; Grant, B.; Grant, P.; Andersson, L. A beak size locus in Darwin’s finches facilitated character displacement during a drought. Science 2016, 352, 470–474. [Google Scholar] [CrossRef]
  121. Ng, C.S.; Li, W.H. Genetic and Molecular Basis of Feather Diversity in Birds. Genome Biol. Evol. 2018, 10, 2572–2586. [Google Scholar] [CrossRef]
  122. Greenwold, M.J.; Bao, W.; Jarvis, E.D.; Hu, H.; Li, C.; Gilbert, M.T.P.; Zhang, G.; Sawyer, R.H. Dynamic evolution of the alpha and beta keratins has accompanied integument diversification and the adaptation of birds into novel lifestyles. BMC Evol. Biol. 2014, 14. [Google Scholar] [CrossRef]
  123. Borges, R.; Khan, I.; Johnson, W.; Gilbert, M.; Zhang, G.; Jarvis, E.; O’Brien, S.; Antunes, A. Gene loss, adaptive evolution and the co-evolution of plumage coloration genes with opsins in birds. BMC Genom. 2015, 16, 751. [Google Scholar] [CrossRef] [PubMed]
  124. Li, C.; Zhang, Y.; Li, J.; Kong, L.; Hu, H.; Pan, H.; Xu, L.; Deng, Y.; Li, Q.; Jin, L.; et al. Two Antarctic penguin genomes reveal insights into their evolutionary history and molecular changes related to the Antarctic environment. GigaScience 2014, 3. [Google Scholar] [CrossRef] [PubMed]
  125. Le Duc, D.; Renaud, G.; Krishnan, A.; Almén, M.S.; Huynen, L.; Prohaska, S.J.; Ongyerth, M.; Bitarello, B.D.; Schiöth, H.B.; Hofreiter, M.; et al. Kiwi genome provides insights into evolution of a nocturnal lifestyle. Genome Biol. 2015, 16, 147. [Google Scholar] [CrossRef] [Green Version]
  126. Shapiro, M.D.; Kronenberg, Z.; Li, C.; Domyan, E.T.; Pan, H.; Campbell, M.; Tan, H.; Huff, C.D.; Hu, H.; Vickrey, A.I.; et al. Genomic Diversity and Evolution of the Head Crest in the Rock Pigeon. Science 2013, 339, 1063–1067. [Google Scholar] [CrossRef] [PubMed] [Green Version]
  127. Pfenning, A.; Hara, E.; Whitney, O.; Rivas, M.; Wang, R.; Roulhac, P.; Howard, J.; Wirthlin, M.; Lovell, P.; Ganapathy, G.; et al. Convergent transcriptional specializations in the brains of humans and song-learning birds. Science 2014, 346, 1256846. [Google Scholar] [CrossRef] [PubMed]
  128. Burga, A.; Wang, W.; Ben-David, E.; Wolf, P.C.; Ramey, A.M.; Verdugo, C.; Lyons, K.; Parker, P.G.; Kruglyak, L. A genetic signature of the evolution of loss of flight in the Galapagos cormorant. Science 2017, 356, eaal3345. [Google Scholar] [CrossRef] [PubMed] [Green Version]
  129. Sackton, T.B.; Grayson, P.; Cloutier, A.; Hu, Z.; Liu, J.S.; Wheeler, N.E.; Gardner, P.P.; Clarke, J.A.; Baker, A.J.; Clamp, M.; et al. Convergent regulatory evolution and loss of flight in paleognathous birds. Science 2019, 364, 74–78. [Google Scholar] [CrossRef] [PubMed] [Green Version]
  130. Cooke, T.F.; Fischer, C.R.; Wu, P.; Jiang, T.X.; Xie, K.T.; Kuo, J.; Doctorov, E.; Zehnder, A.; Khosla, C.; Chuong, C.M.; et al. Genetic Mapping and Biochemical Basis of Yellow Feather Pigmentation in Budgerigars. Cell 2017, 171, 427–439.e21. [Google Scholar] [CrossRef] [Green Version]
  131. Projecto-Garcia, J.; Natarajan, C.; Moriyama, H.; Weber, R.E.; Fago, A.; Cheviron, Z.A.; Dudley, R.; McGuire, J.A.; Witt, C.C.; Storz, J.F. Repeated elevational transitions in hemoglobin function during the evolution of Andean hummingbirds. Proc. Natl. Acad. Sci. USA 2013, 110, 20669–20674. [Google Scholar] [CrossRef] [Green Version]
  132. Natarajan, C.; Hoffmann, F.G.; Weber, R.E.; Fago, A.; Witt, C.C.; Storz, J.F. Predictable convergence in hemoglobin function has unpredictable molecular underpinnings. Science 2016, 354, 336–339. [Google Scholar] [CrossRef] [Green Version]
  133. Eöry, L.; Gilbert, M.T.P.; Li, C.; Li, B.; Archibald, A.; Aken, B.L.; Zhang, G.; Jarvis, E.; Flicek, P.; Burt, D.W. Avianbase: A community resource for bird genomics. Genome Biol. 2015, 16, 21. [Google Scholar] [CrossRef] [PubMed]
Figure 1. Overview of genomes available and in preparation for all 10,135 species of birds. We use the organization of the B10K into four successive phases to show the increasing density of genome-enabled species across the phylogeny of birds. Each phase aims to cover more fine scale relationships among bird taxa: Phase 1 sequenced 48 species from most orders (branches highlighted in blue), phase 2 includes 363 birds from most families (red), phase 3 is planning to sequence 2250 birds from all genera (yellow), and eventually all species will have genomes upon completion of phase 4 (grey). About 60% of bird species are Passeriformes and hence sampling will proportionally increase in this group starting from phase 2. The shown tree is a ‘synthetic’ phylogeny of birds that is estimated from taxonomic information and previous phylogenetic studies [31] because a complete, sequence-based bird phylogeny is not available. Subspecies were removed from the tree and species names were matched to the taxonomy of Howard & Moore 4th edition [30].
Diversity 11 00115 g001
Figure 2. Overview of the main competing hypotheses based on two studies with different strengths in their data acquisition: (a) Sequence-focused analysis of Jarvis et al. [10] based on whole genome sequence data for 48 birds analyzing 8251 protein-coding loci, 2516 introns, and 3679 ultraconserved elements; (b) Taxon-sampling-focused analysis by Prum et al. [42] with 198 species but only 0.4 Mb of conserved coding sequence data. The two hypotheses are difficult to reconcile because of differences in the extent of genomic and taxonomic sampling, the type of loci, and the method of analysis. Clades that are discussed in the text are annotated, for the complete systematic classification the reader is referred to the original studies.
Diversity 11 00115 g002
Figure 3. Insights from comparative genomics. (a) Characteristics of the bird genome. Left: The genomes of birds are small for vertebrates and smaller than all amniote genomes as shown in boxplots of C-values (the haploid nuclear DNA content picograms) for each clade and species-specific points. If multiple values for one species were available, we show the average. Data from http://www.genomesize.com/. Center: Birds have lower abundance of transposable elements (TEs) than other vertebrates. If multiple values for one species were available, we show the average. The asterisk marks the high TE density on a non-recombining region of the collared flycatcher, while the autosomes are within the range of other birds [108]. All other data were compiled from [9,107]. Right: Bird genes are shorter than those of other amniotes because of the reduction of intergenic and intron length. Data for amniotes from [9], unavailable for other vertebrates. (b) Selection of insights into phenotype-genotype interactions from bird genomes.
Diversity 11 00115 g003
Table 1. Sequencing strategies for bird genomes. Abbreviations: WGS, whole genome sequencing; stLFR, single-tube long fragment sequencing: chr-level, chromosome level assembly.
Short Read SequencingMixed Sequencing
Assembly strategy1 WGS+1 MatePair libraryGradient insert size libraries (200 bp–20 kb)10X GenomicsstLFR1 WGS+Hi-C librariesVGP strategy (PacBio+10X+Bionano+Hi-C)
Input DNAQuantity≥10 μ g≥125 μ g≥300 ng≥300 ng≥2 μ g DNA + 0.2 g tissue≥10 μ g DNA + 0.2 g tissue
Quality>2 kb>20 kb>40 kb>40 kb>2 kb>250 kb
Sequencing coverage30–60×100×60–100×60–100×200×400×
Assembly qualityContig N5010–40 kb20–80 kb100 kb100 kb10–40 kb10 Mb
Scaffold N5030–800 kb0.2–10 Mb10 Mb10 Mb100 Mb (chr-level)100 Mb (chr-level)
Complete-ness (e.g., BUSCO)90–95%93–98%93–98%93–98%90–95%95–99%
Sequencing cost$2200$7000$2000$1000$3000$20,000

