Article

Population Structure and Genetic Diversity of Shanlan Landrace Rice for GWAS of Cooking and Eating Quality Traits

1
Key Laboratory of Nuclear Agricultural Sciences of Ministry of Agriculture and Zhejiang Province, Institute of Nuclear Agricultural Sciences, College of Agriculture and Biotechnology, Zijingang Campus, Zhejiang University, Hangzhou 310058, China
2
Hainan Institute, Zhejiang University, Yazhou Bay Science and Technology City, Yazhou District, Sanya 572025, China
*
Author to whom correspondence should be addressed.
These authors contributed equally to this work.
Int. J. Mol. Sci. 2024, 25(6), 3469; https://doi.org/10.3390/ijms25063469
Submission received: 24 February 2024 / Revised: 11 March 2024 / Accepted: 13 March 2024 / Published: 19 March 2024
(This article belongs to the Special Issue Molecular Research for Cereal Grain Quality 2.0)

Abstract

:
The Shanlan landrace rice in Hainan Province, China, is a unique upland rice germplasm that holds significant value as a genetic resource for rice breeding. However, its genetic diversity and its usefulness in rice breeding have not been fully explored. In this study, a total of eighty-four Shanlan rice, three typical japonica rice cultivars, and three typical indica rice cultivars were subjected to resequencing of their genomes. As a result, 11.2 million high-quality single nucleotide polymorphisms (SNPs) and 1.6 million insertion/deletions (InDels) were detected. Population structure analysis showed all the rice accessions could be divided into three main groups, i.e., Geng/japonica 1 (GJ1), GJ2, and Xian/indica (XI). However, the GJ1 group only had seven accessions including three typical japonica cultivars, indicating that most Shanlan landrace rice are different from the modern japonica rice. Principal component analysis (PCA) showed that the first three principal components explained 60.7% of the genetic variation. Wide genetic diversity in starch physicochemical parameters, such as apparent amylose content (AAC), pasting viscosity, texture properties, thermal properties, and retrogradation representing the cooking and eating quality was also revealed among all accessions. The genome-wide association study (GWAS) for these traits was conducted and identified 32 marker trait associations in the entire population. Notably, the well-known gene Waxy (Wx) was identified for AAC, breakdown viscosity, and gumminess of the gel texture, and SSIIa was identified for percentage of retrogradation and peak gelatinization temperature. Upon further analysis of nucleotide diversity in Wx, six different alleles, wx, Wxa, Wxb, Wxin, Wxla/mw, and Wxlv in Shanlan landrace rice were identified, indicating rich gene resources in Shanlan rice for quality rice breeding. These findings are expected to contribute to the development of new rice with premium quality.

1. Introduction

Rice (Oryza sativa L.) remains the paramount food crop worldwide, sustaining over half of the global population. As the population continues to grow, the requirement for rice production escalates correspondingly. On the other hand, there is an ascending demand for high-yield and superior-quality rice and a more affluent lifestyle. As a material cultural heritage in Hainan, Shanlan landrace rice represents the rich farming and living history of the Li ethnic people in Hainan Province, China, who have developed rice cultivars with distinctive agronomic characteristics and strong drought resistance through traditional slash-and-burn cultivation in the mountains for more than a thousand years [1]. Previous studies have found that most Shanlan landrace rice belong to the Geng/japonica subspecies [2,3]. Yang et al. [4] conducted a study on the genetic diversity using simple sequence repeat (SSR) markers in 57 Shanlan rice accessions and found that the subspecies indica and japonica were mixed in most clades. Li et al. [5] utilized SSR markers to analyze the genetic diversity of 214 upland rice accessions from five provinces (regions) in Southeast Asia and South China and suggested that the Shanlan rice in Hainan may have originated from Guangdong Province. Previous studies on Shanlan rice have primarily concentrated on drought resistance, while less attention has been paid to the grain quality traits.
Enhancing rice grain quality has become a top priority in rice breeding programs. To achieve this, a comprehensive understanding of the genetic control of rice cooking and eating qualities (CEQs) are imperative for improving rice grain quality [6]. The starch physicochemical properties, i.e., amylose content (AC), gel consistency (GC), gelatinization temperature (GT), and pasting viscosity, are important indices for evaluating rice CEQs. Knowledge of genetic factors underling the quality traits is required for the development of rice varieties with excellent CEQs and a genome-wide association study (GWAS) is one of the promising approaches for discovering such associated genetic factors. Previous studies have identified major genes responsible for the formation of CEQs, which are considered the most complex quantitative traits in rice. AC is the most important factor that affects the CEQs of milled rice [6]. Amylose is synthesized by the action of GBSSI in the rice endosperm, encoded by the Waxy gene (Wx). Various natural allelic variations in Wx including wx, Wxa, Wxin, Wxb, Wxmw/la, Wxmp, Wxmq, Wxop, Wx/hp, and Wxlv have been discovered, which correspond to the diverse apparent amylose content (AAC) among rice germplasm [7,8,9,10,11,12,13,14,15,16,17]. The Wx gene is also responsible for the genetic basis of starch properties, such as gel consistency, pasting viscosity, and retrogradation properties [17,18,19,20,21,22,23,24]. Soluble starch synthase IIa (SSIIa) is currently the only major gene known to be associated with GT [6]. Tian et al. [24] found that AAC negatively correlated with GC and GT, and GC positively correlated with GT. In addition, other genes, especially the starch-synthesis-related genes also have minor effects on rice CEQs [25,26].
With the development of high-throughput sequencing and other biotechnological tools, the GWAS has been verified to be a useful approach for identifying genes, alleles, or haplotypes related to any traits of interest under complex environments. The GWAS has played a pivotal role in identifying many important genes which govern various complex agronomic traits such as flowering time, plant height, and panicle length in rice [27,28,29,30,31,32], and particularly starch-related parameters [20,33,34]. However, GWAS analysis for the CEQs traits has not been conducted in the Shanlan landrace rice.
The objectives of this study are as follows: (1) to dissect the population structure of Shanlan landrace rice by a next-generation resequencing approach; (2) to evaluate the genetic diversity in the physical and chemical properties of Shanlan rice and conduct a GWAS for the quality traits; (3) to identify novel alleles for the quality traits. The results obtained will provide valuable insights for quality breeding of Shanlan landrace rice.

2. Results

2.1. Identification of SNPs and InDels in Shanlan Landrace Rice by Next-Generation Sequencing

The diverse collection of ninety rice accessions is comprised of eighty-four Shanlan landrace rice (84), three typical japonica rice cultivars, i.e., Nipponbare (Nip), Zhonghua 11 (ZH11), and Tainung 67 (TN67), and three typical indica rice cultivars, i.e., 9311, Guangluai4 (GLA4), and IR36 (Table S1 in the Supporting Information). The Illumina HiSeq X10 platform was applied to acquire the pair-ends of 150 bp reads. Short reads were mapped to the Nipponbare reference genome (MSU version 7.0). After SNP calling, we identified a total of 11.2 million SNPs in which 2,619,968, 1,725,345, 224,337, and 2,399,456 SNPs were located within exons, introns, UTRs, and intergenic regions, respectively. These SNPs were further classified as 1,412,309 non-synonymous, 12,979 splice site, 77,011 stop-gain, and 4254 stop-loss in coding regions. Meanwhile, we identified a total of 1.6 million high-quality insertion/deletions (InDels). We found 1,635,574, 158,603, 379,545, and 93,626 InDels located within exons, introns, UTRs, and intergenic regions, respectively, including 1971 splicing InDels, 6580 stop-gain, and 343 stop-loss InDels in coding regions. After filtering for missing data less than 0.2 and minor allele frequency greater than 0.05, we selected 3,425,822 SNPs for use in subsequent analyses (Table 1).

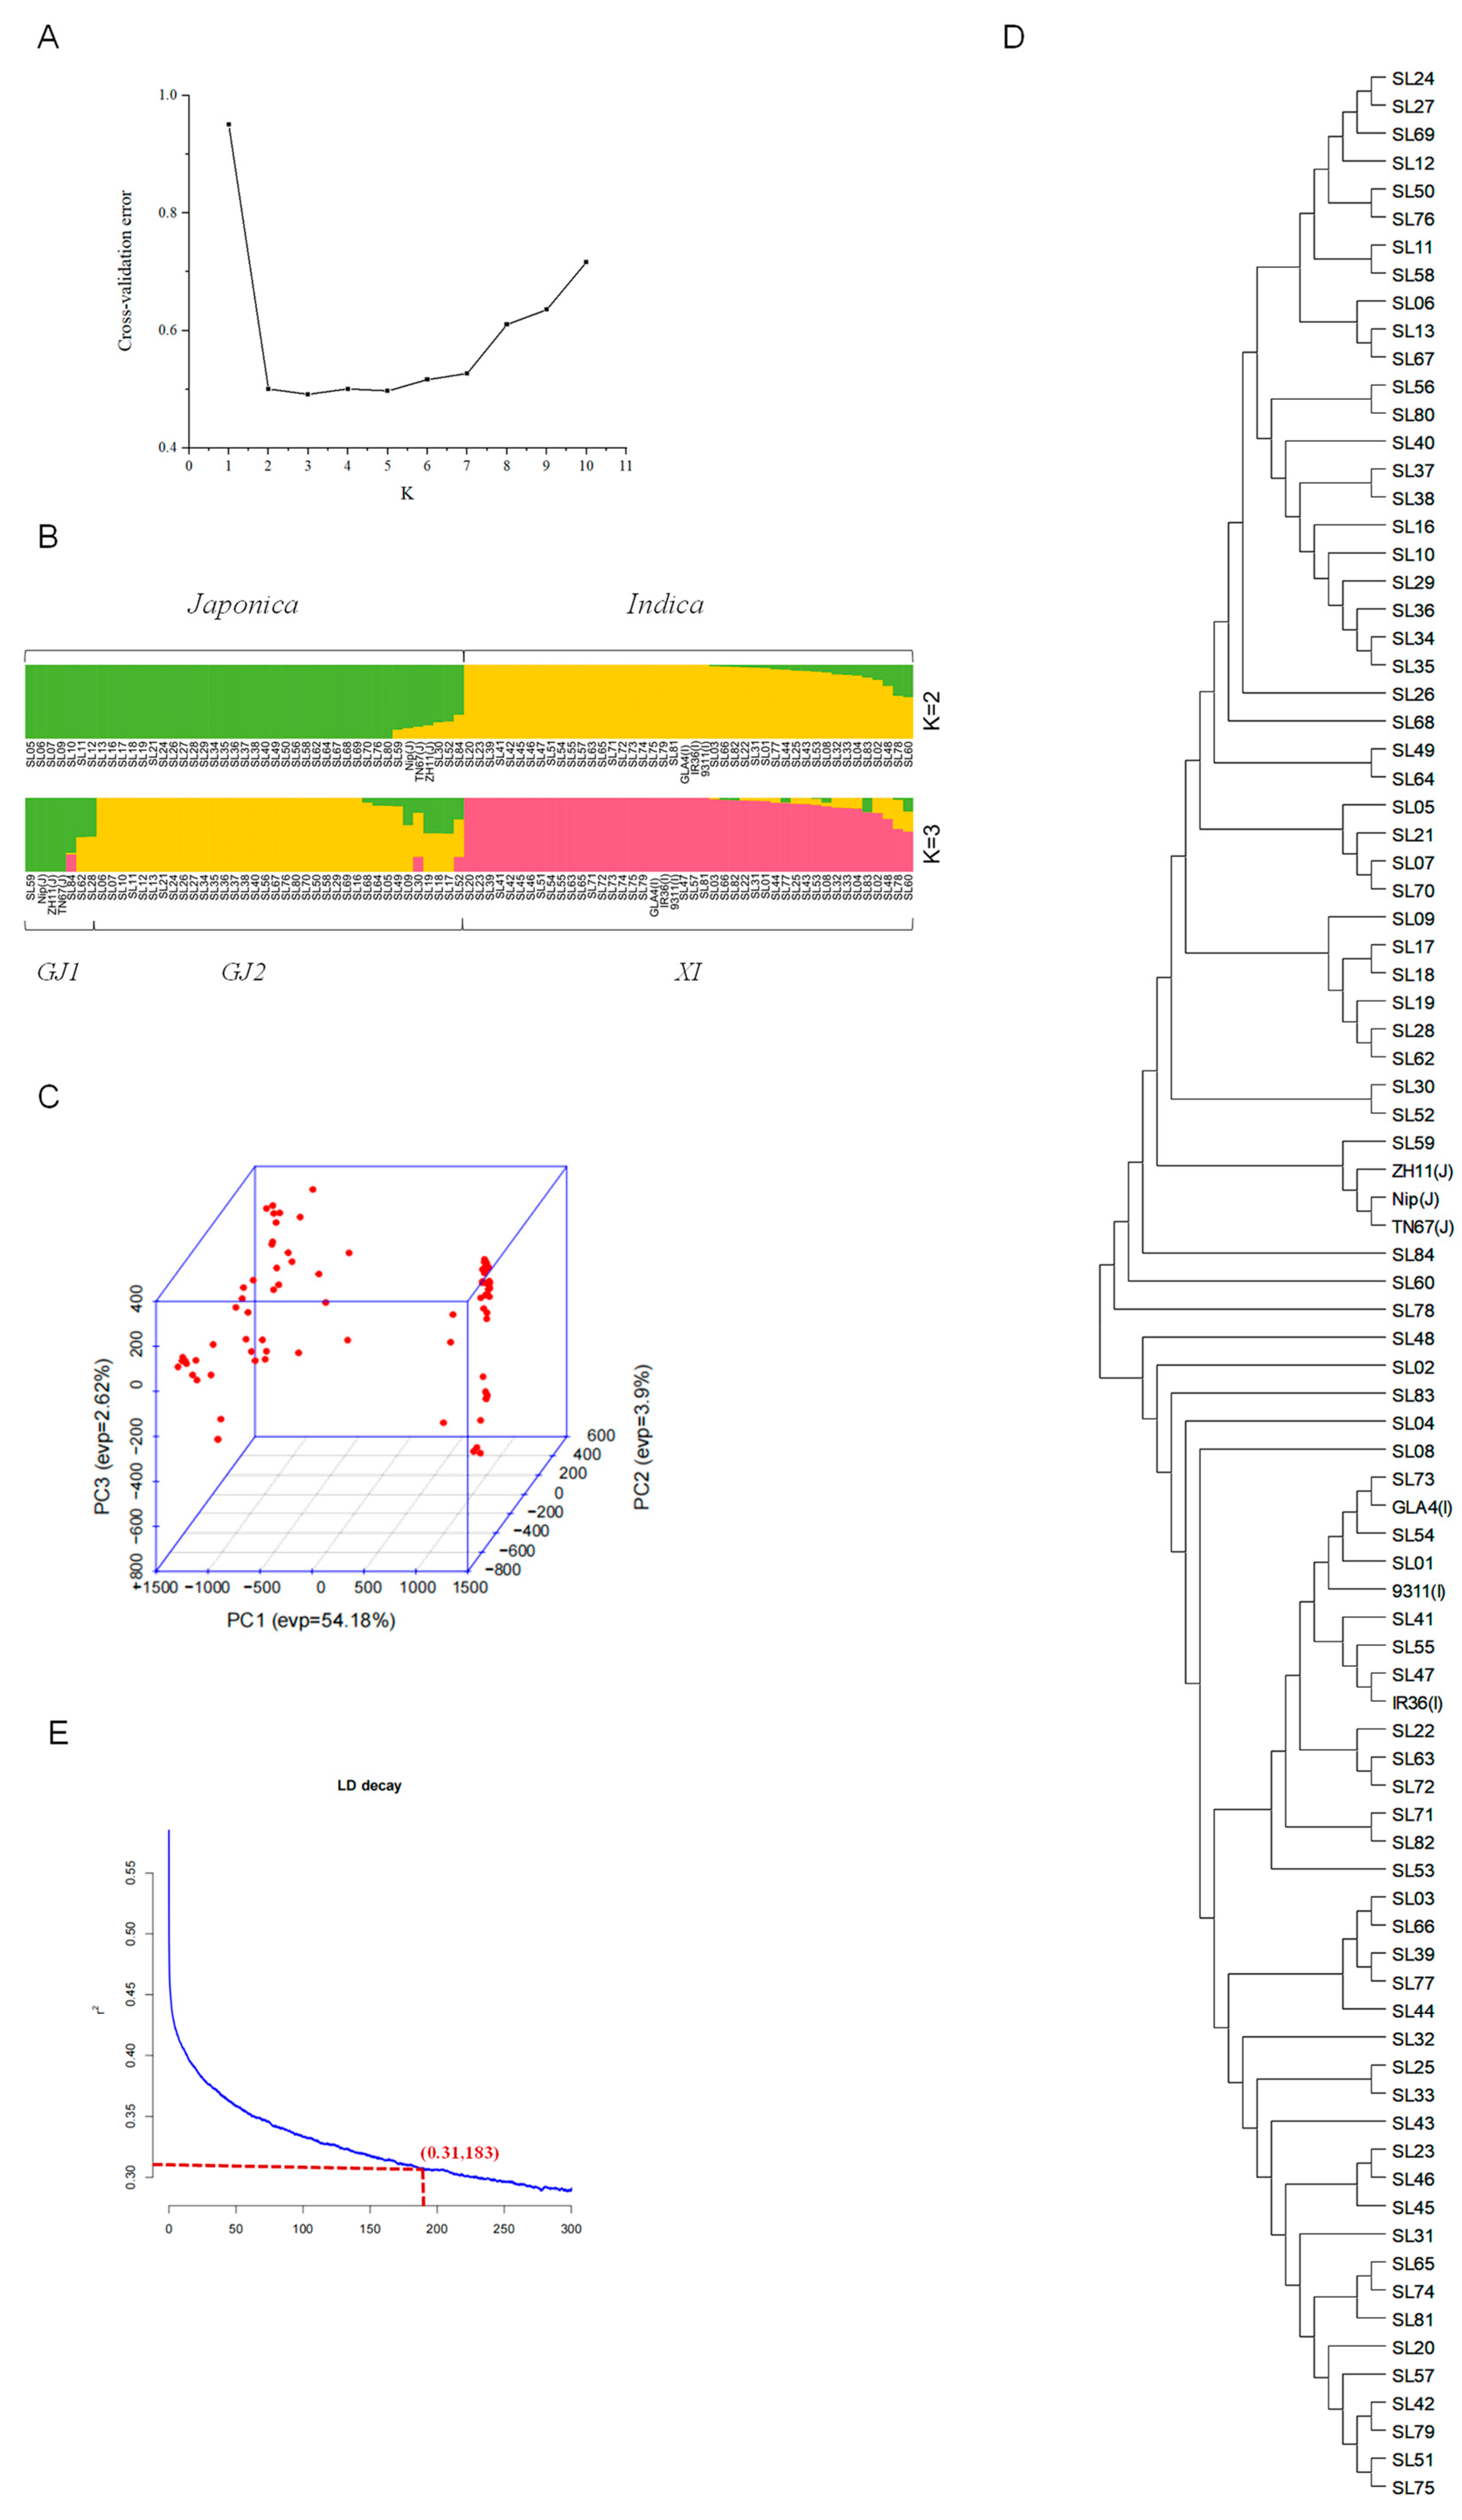
2.2. Genetic Population Structure

The rice accessions are mainly divided into two distinct populations, Geng/japonica (GJ) and Xian/indica (XI). Population structure analysis showed the ideal K value with the least cross-validation error detected by the population structure analysis was determined as 3 (Figure 1A), so that the whole panel could be clustered into three main groups, named GJ1, GJ2, and XI, respectively (Figure 1B). When K = 2, as expected, all rice accessions could be divided into the japonica and indica subspecies. However, the GJ1 group only had seven accessions, including SL28, SL59, SL62, SL84, and three typical japonica rice cultivars. All the indica accessions remained as the XI group either selecting K = 2 or K = 3. Principal component analysis (PCA) showed that the first three principal components explained 60.7% of the genetic variation, and the germplasms in the GJ2 subpopulation were clustered significantly closer together than those in the GJ1 subpopulation (Figure 1C). The phylogenetic tree showed that the GJ1 and GJ2 subpopulations had significant genetic differentiation, consistent with the results of the population structure and PCA (Figure 1D). Linkage disequilibrium (LD) analysis showed that the LD attenuation distances of all the germplasms were 183 kb (Figure 1E). The Fst value between the GJ1 and GJ2 populations was 0.1881, indicating that there was a large genetic differentiation between the two populations.

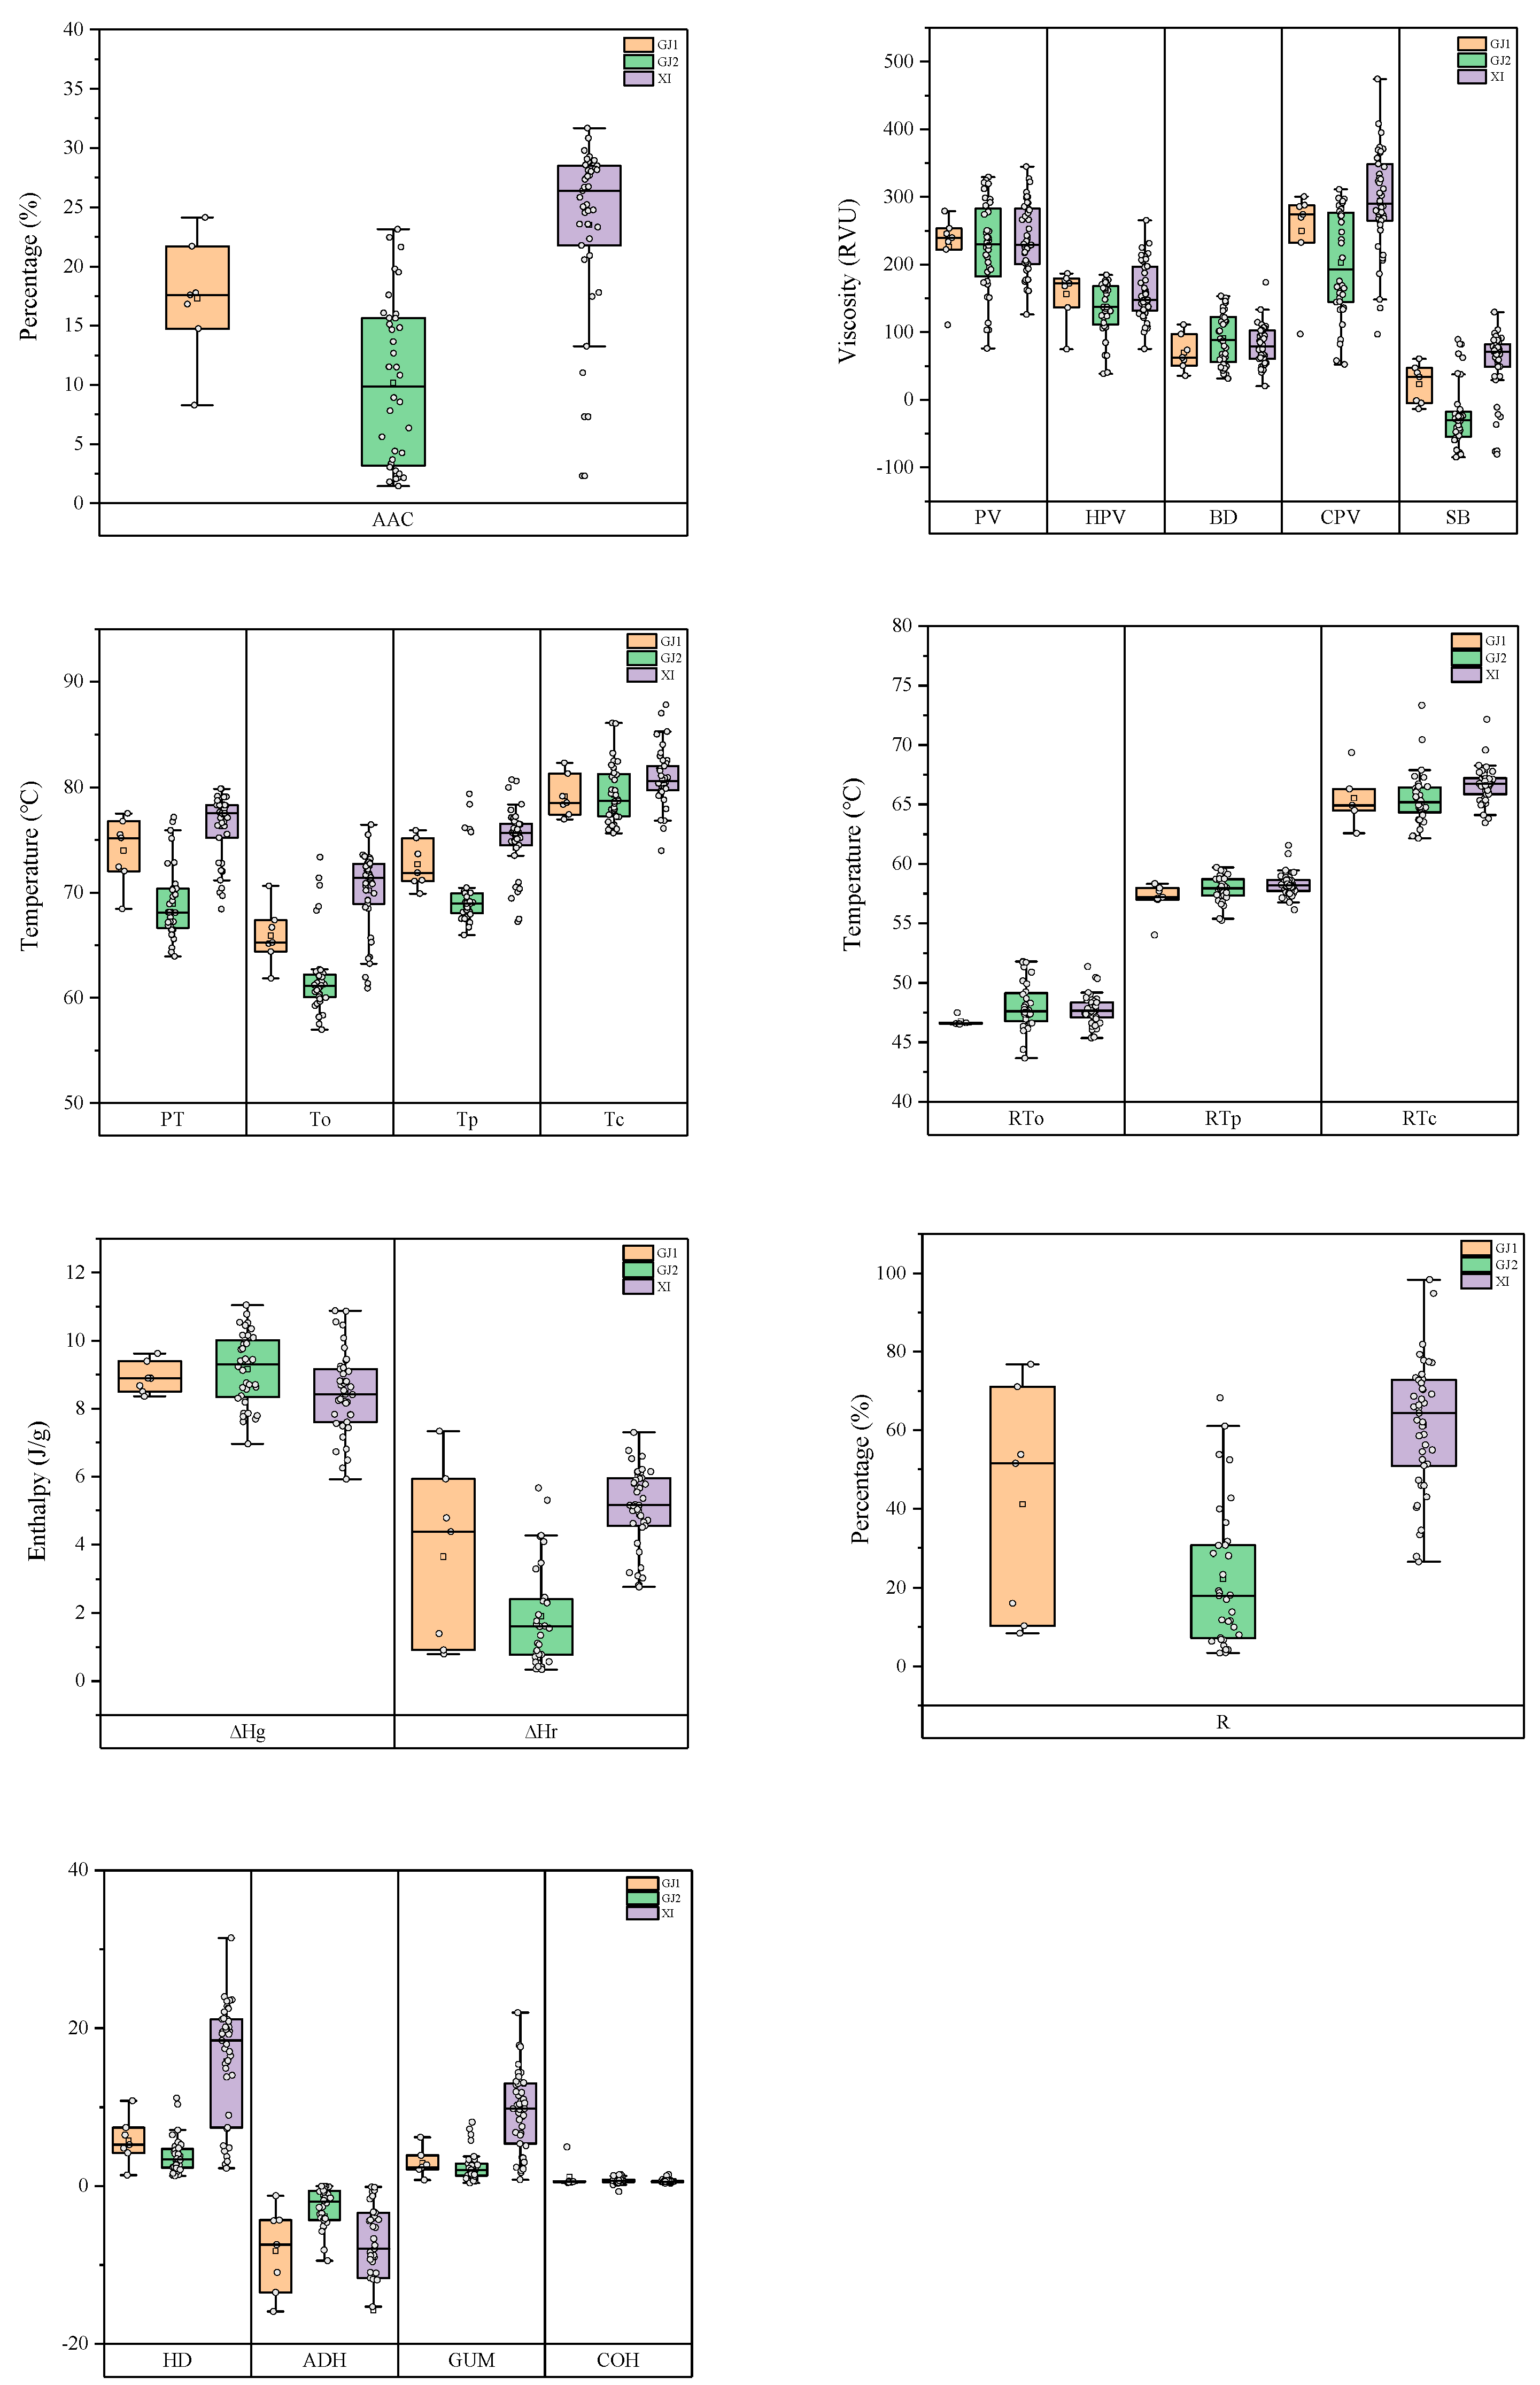
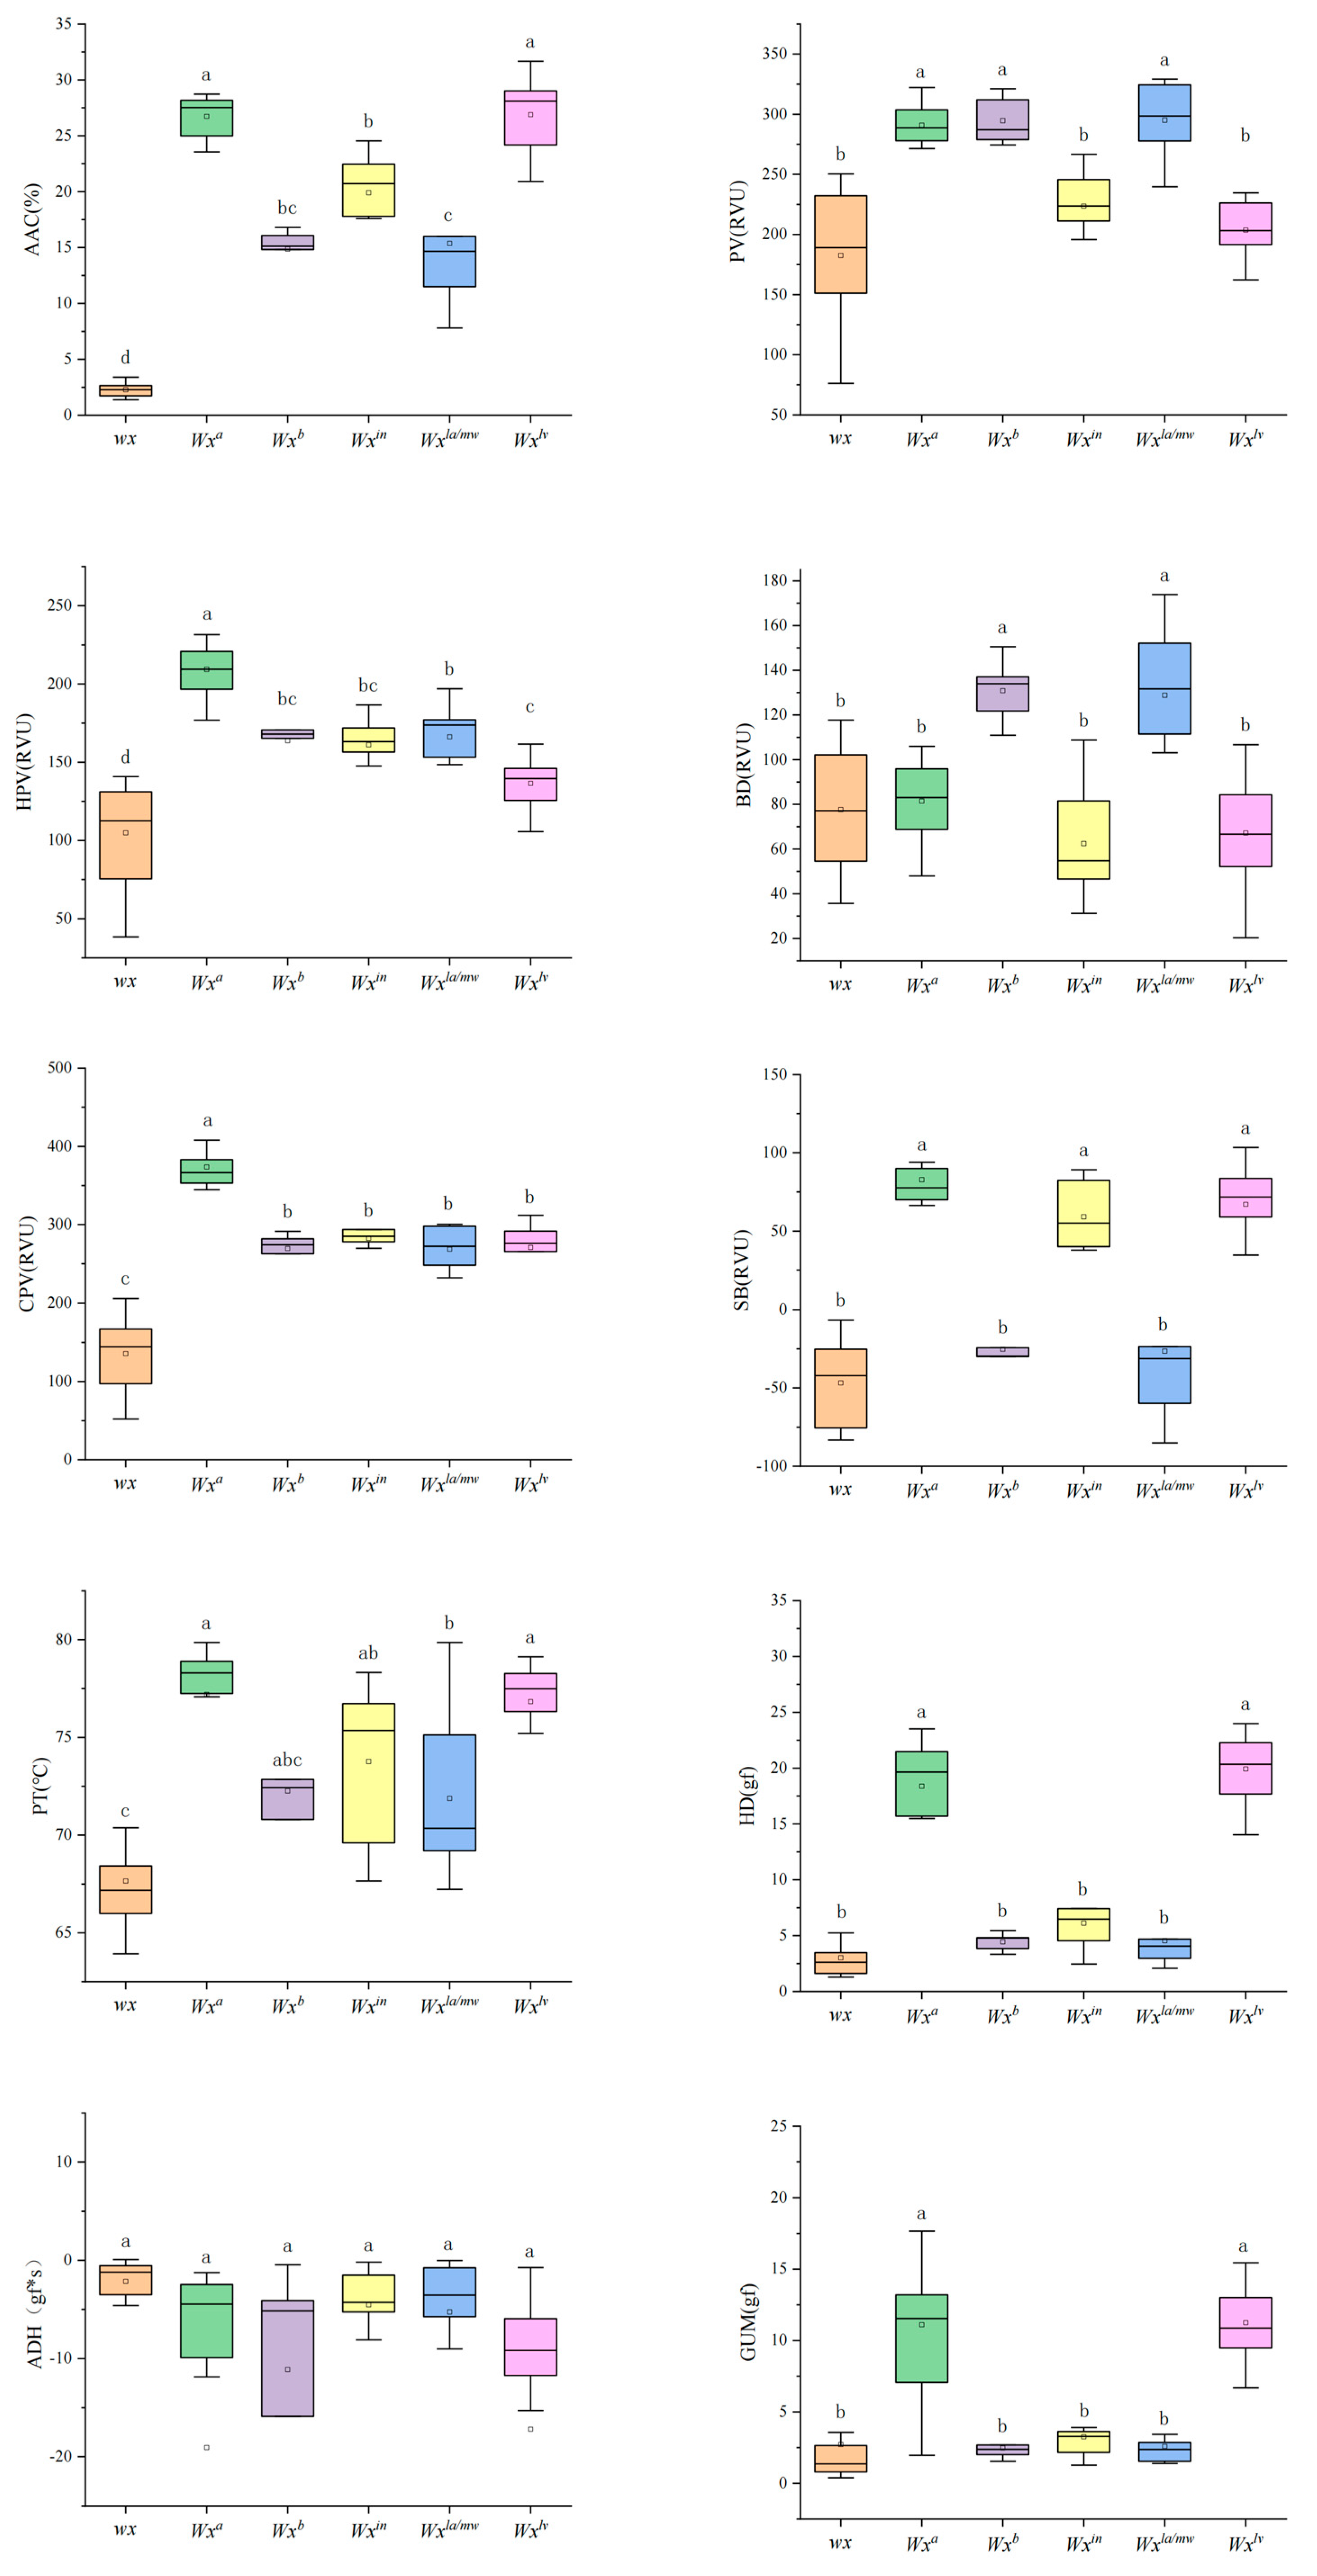
2.3. Phenotypic Variation in the Study Population

The starch physicochemical properties including the parameters of AAC and pasting viscosity, texture parameters, thermal properties, and retrogradation properties were evaluated in rice accessions (Figure 2). The mean values of AAC were 16.4%, 8.9%, and 23.5% in three panels, respectively. The differences for AAC were significant between panels. XI exhibited a broader range in AAC, hot paste viscosity (HPV), cold paste viscosity (CPV), breakdown (BD), and setback (SB) compared to the other groups. Remarkably, its mid-range values were significantly higher for AAC, CPV, and SB. GJ2 had the lowest average AAC, SB, and pasting temperature (PT). However, there was no significant difference in PV, HPV, or BD among the groups. Furthermore, the retrogradation peak temperature (RTp) values of GJ2 were significantly higher than those of GJ1. For the textural parameters, the differences of most of parameters in the three panels were significant between subpopulations, except for the hardness (HD), gumminess (GUM), and cohesiveness (COH). There are obvious differences in the thermal properties of the materials, but the differences in degradation properties are relatively insignificant. These results suggest that these rice accessions are representative in terms of rice starch physicochemical properties and are qualified for further genetic analysis.
A cluster analysis was conducted based on the quality traits of the entire rice population, and a dendrogram was established as depicted in Figure S1. At a distance of 10, all the rice accessions tested could be categorized into three major groups. Glutinous rice accessions were classified into the first group. The second group, which contained the largest number of rice accessions, comprised accessions with diverse AAC values. Notably, SL04 was categorized into a separate group. This accession exhibited high viscosity and a low gelatinization temperature, which was different from the others, suggesting distinct starch properties suitable for food processing applications requiring high viscosity and rapid gelatinization, such as instant foods and convenience foods.

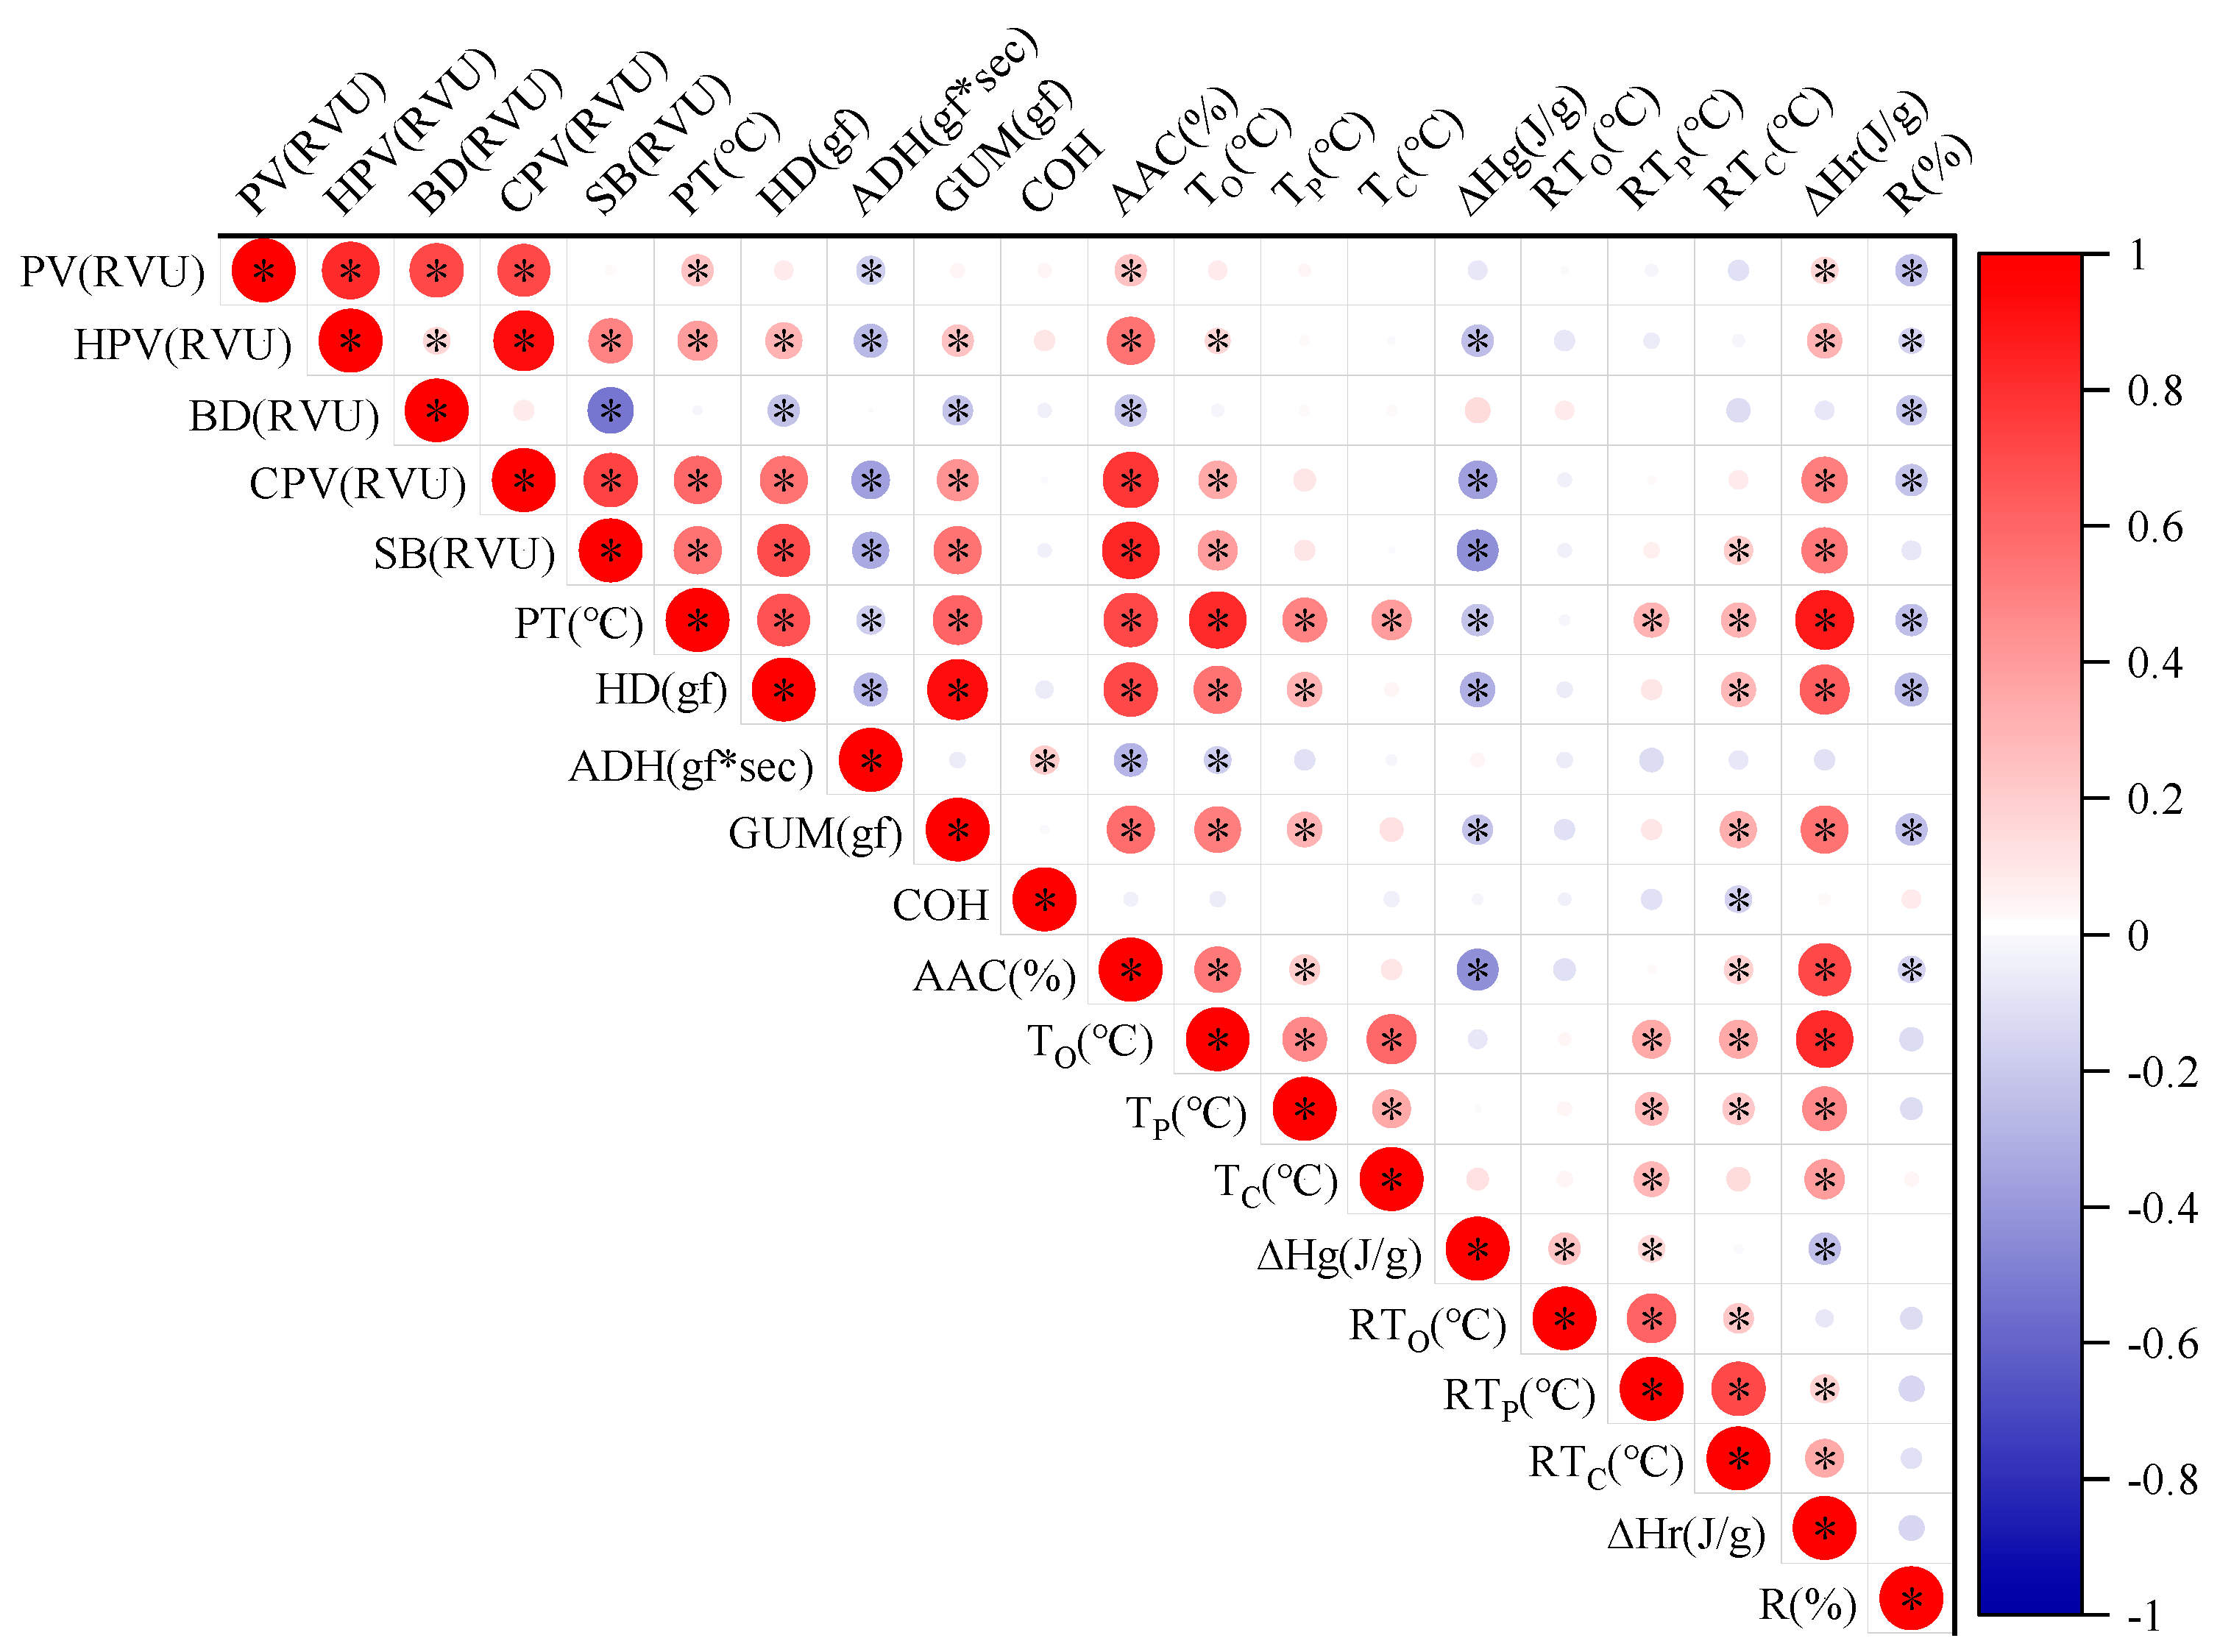
2.4. Correlation Analysis
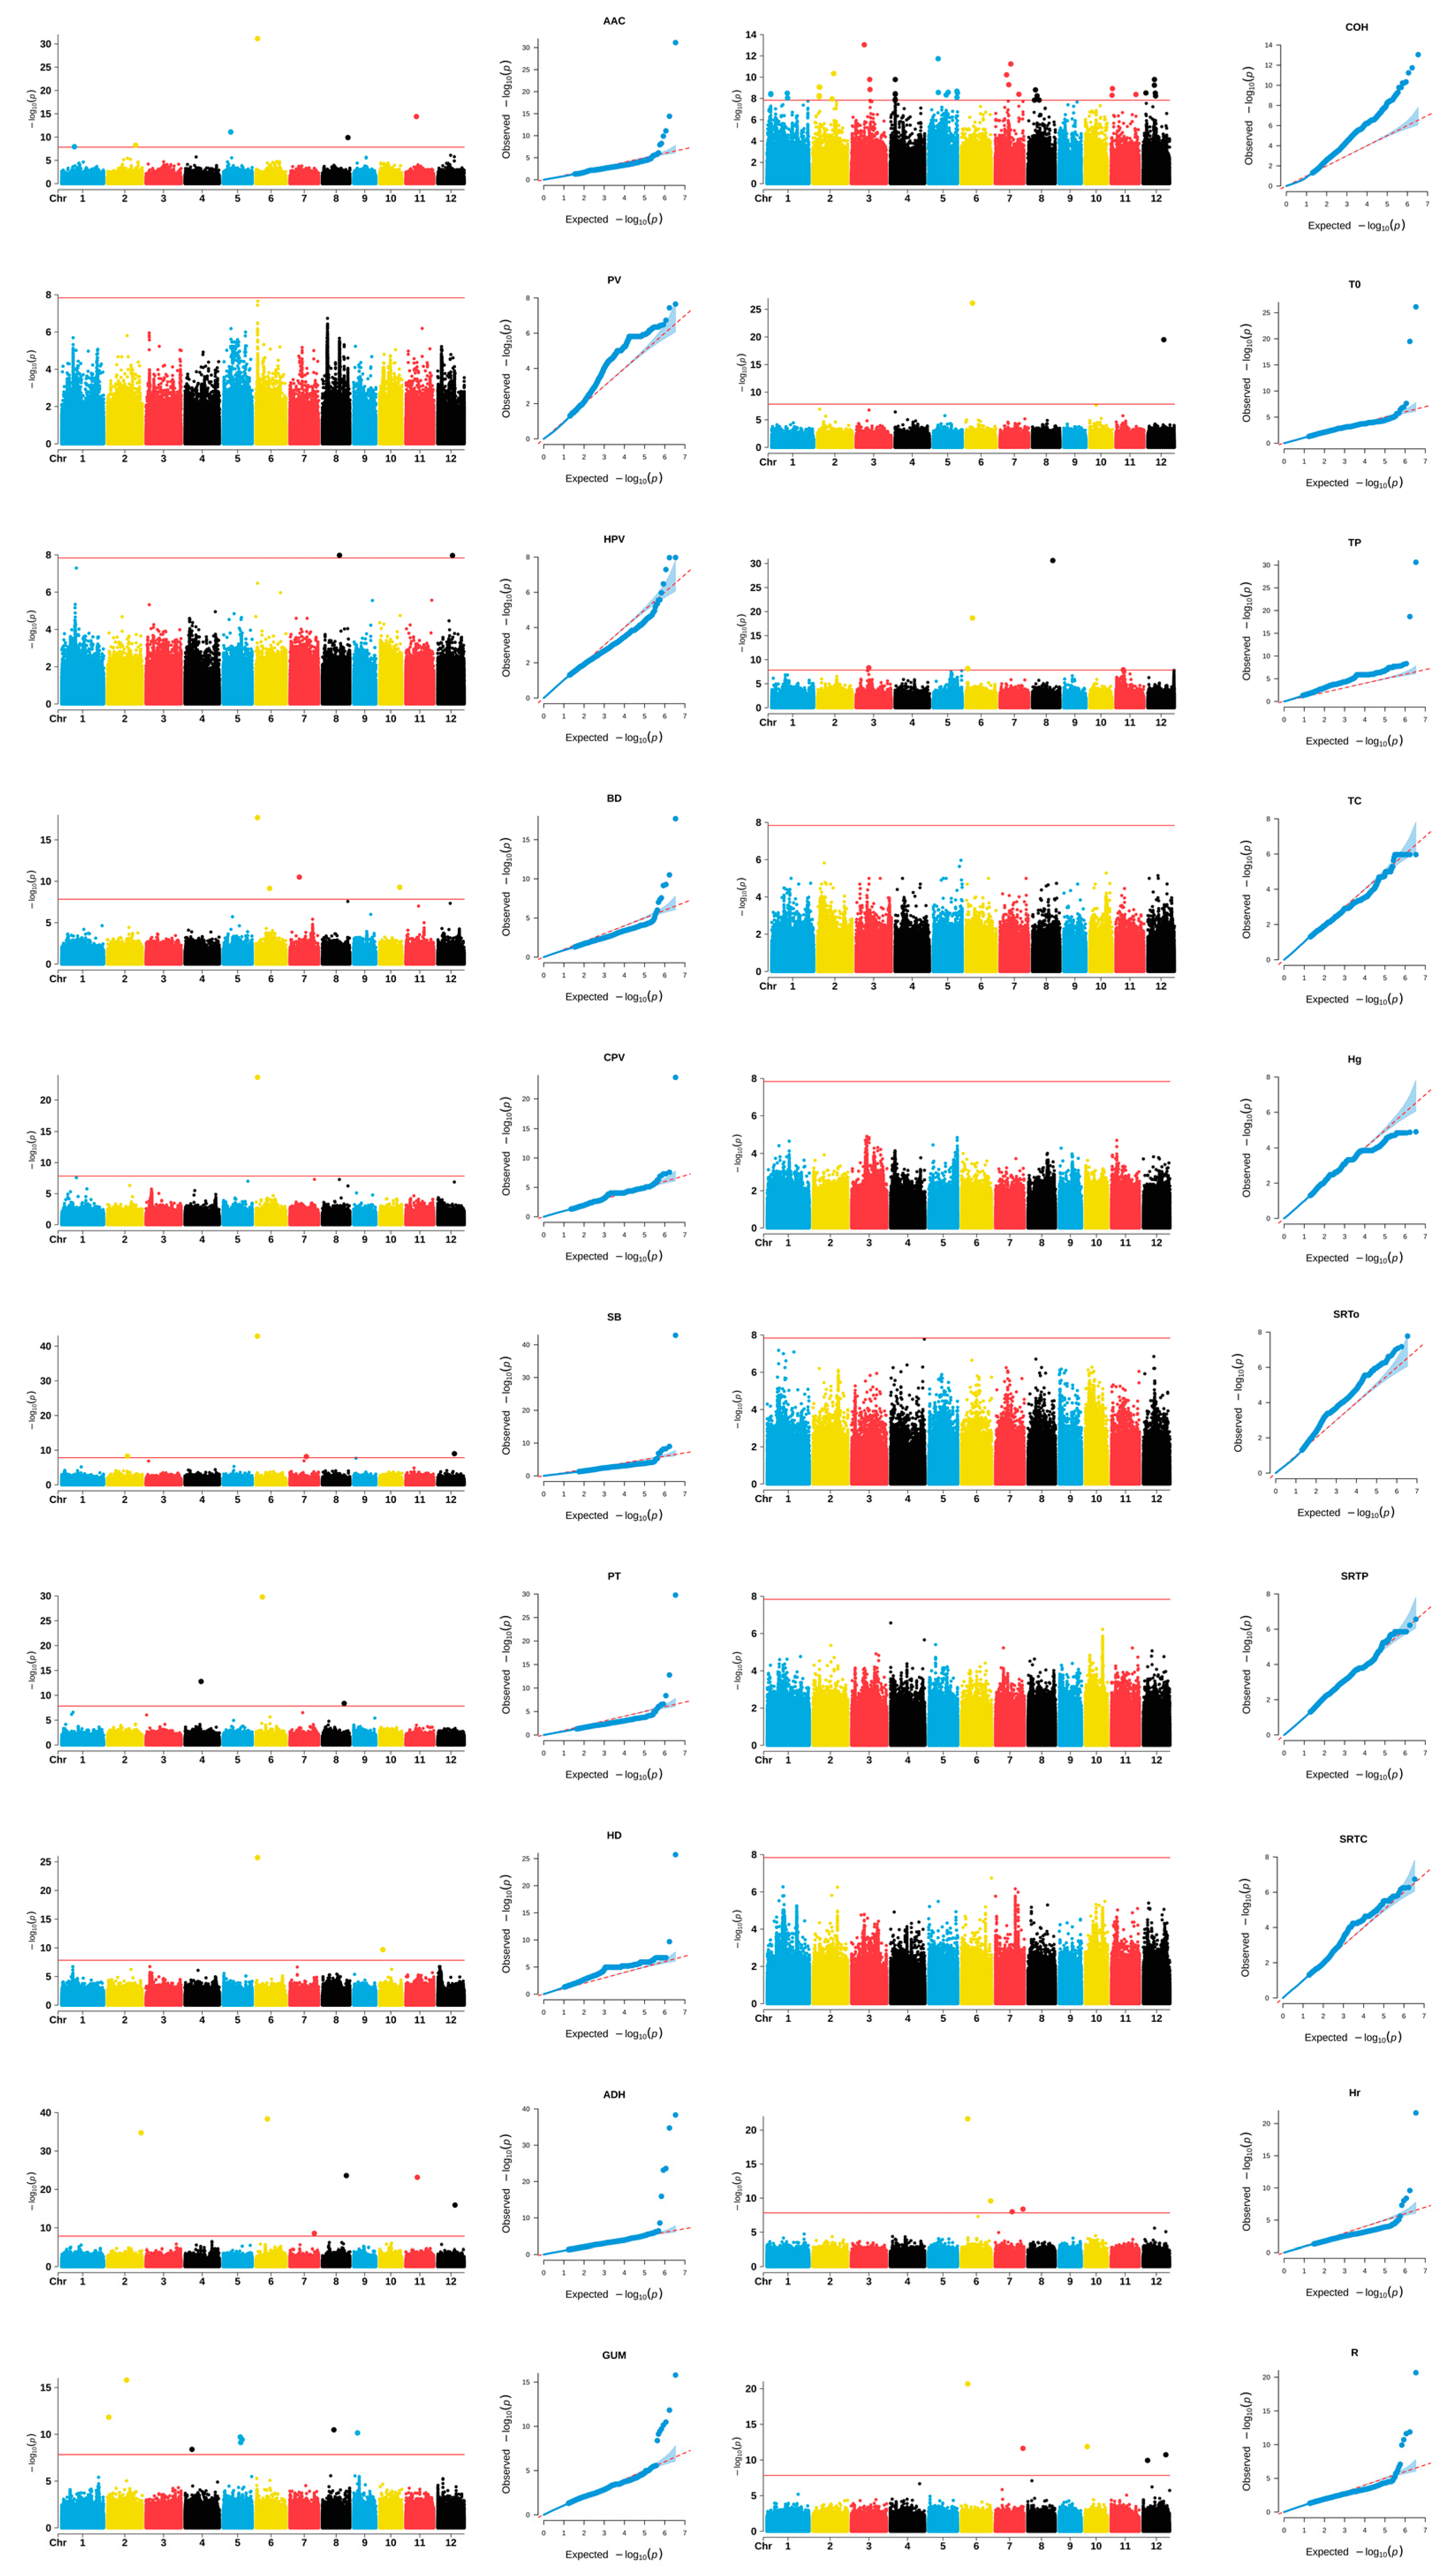
The pair-wise correlation coefficients for each pair of the 20 traits are presented in Figure 3. Notably, AAC demonstrated significant correlations with all traits except COH, RTo (retrogradation onset temperature), and RTp (retrogradation peak temperature). Specifically, AAC exhibited negative correlations with BD, ADH, and ∆Hg, while positive correlations were found between AAC and HPV, CPV, SB, HD, GUM, ∆Hr, and R%. Among the pasting viscosity parameters, the majority of pairs displayed correlations, with only three pairs lacking statistical significance. Additionally, PT had a significant correlation with most thermal parameters and retrogradation properties.

2.5. GWAS Results

The fixed and random model circulating probability unification (FarmCPU) approaches were applied to conduct a GWAS for 20 CEQ traits. The marker trait association (MTA) regions were strictly defined by LD blocks of 183 kb left and right genomic regions of significant SNPs (SNP ± LD) for the whole panel, as previously calculated. Furthermore, the SNP with the lowest p-value was regarded as the lead SNP. In the Manhattan plot, a pronounced locus structure on the chromosome was observed for every trait. A total of 32 MTAs were identified in the whole panel (Table 2, Figure 4).
The Wx gene was identified significantly for AAC, BD, and GUM. In addition, we detected a locus (chr.6: 1620142) close to the Wx gene for SB. This SNP is in the gene encoding region (LOC_Os06g03990), where a substandard starch grain 6 (SSG6) gene encoding a protein homologous to aminotransferase is located. This protein plays a crucial role in regulating both the size and morphology of starch granules within endosperm cells [35]. The SSIIa gene was identified significantly for Tp and R. One locus (chr.7:28619594) was detected for both HPV and R, and the other locus (chr.7: 25202120) for AAC was very close to it.

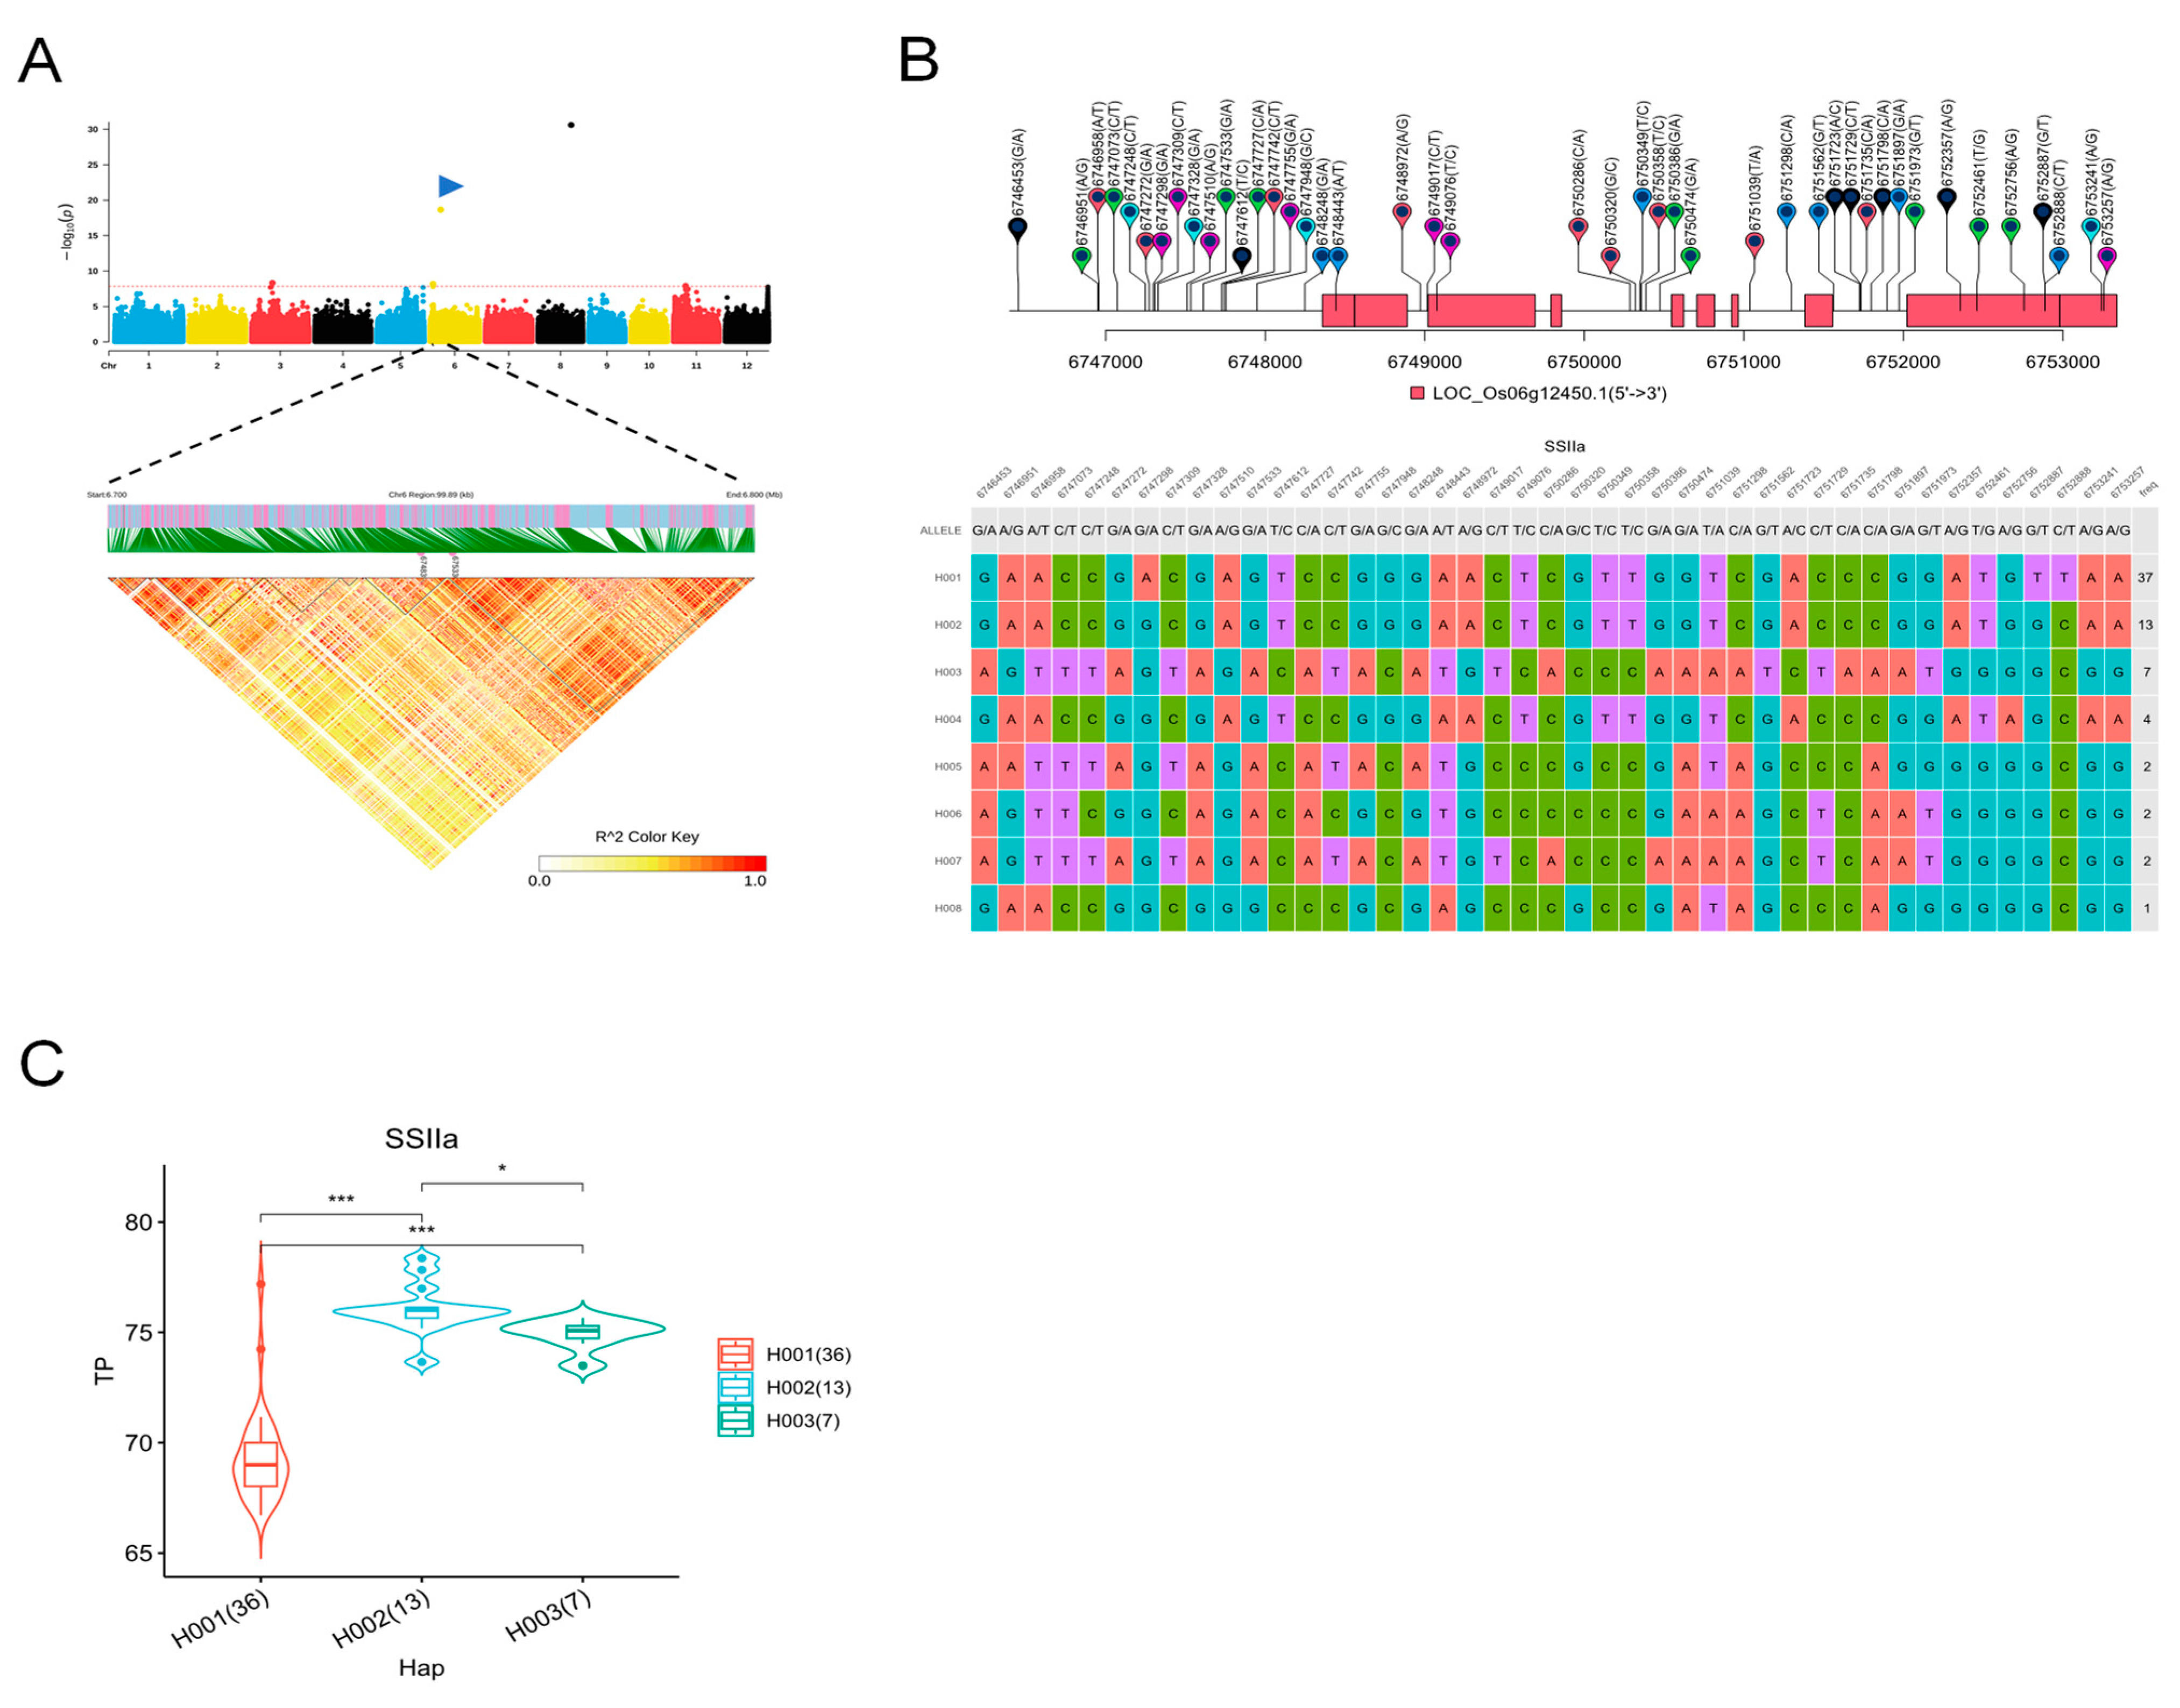
2.6. Identification of Favorable Alleles in the Wx and SSIIa Genes

The distribution and nucleotide diversity of various Wx alleles across all rice materials were analyzed. Analysis of nucleotide polymorphism in Wx revealed that the predominant Wx alleles were wx, Wxa, Wxb, Wxin, Wxla/mw, and Wxlv among all rice accessions [6,13,17]. These findings suggest that Shanlan rice is a valuable germplasm resource for high-quality rice breeding. The physicochemical properties of these materials were compared among different Wx alleles (Figure 5; Table S2). Notably, the average AAC of the six panels exhibited significant differences, with Wxlv having the highest AAC and wx the lowest (Figure 5). This finding aligns with previous studies [12]. Additionally, the pasting viscosity also differed significantly among allelic populations (Figure 5). Differences were also observed in textural properties such as HD and GUM. When it comes to thermal properties, however, there were only minor differences between panels (Figure 5).
SSIIa was a significant MTA detected for multiple traits and was selected for high-density association and gene-based haplotype analysis. A total of 9439 SNPs were used for high-density association analysis of Tp in the 6.7 to 6.8 Mb region of chromosome 6 (Figure 6A). Eight haplotypes were detected in all germplasms, based on seventeen SNPs in the SSIIa promoter, six SNPs in the exon, three SNPs in the UTR, and seventeen SNPs in the intron (Figure 6B). Haplotype analysis showed that Tp in H001 was significantly lower than that in the other two haplotypes (Figure 6C).

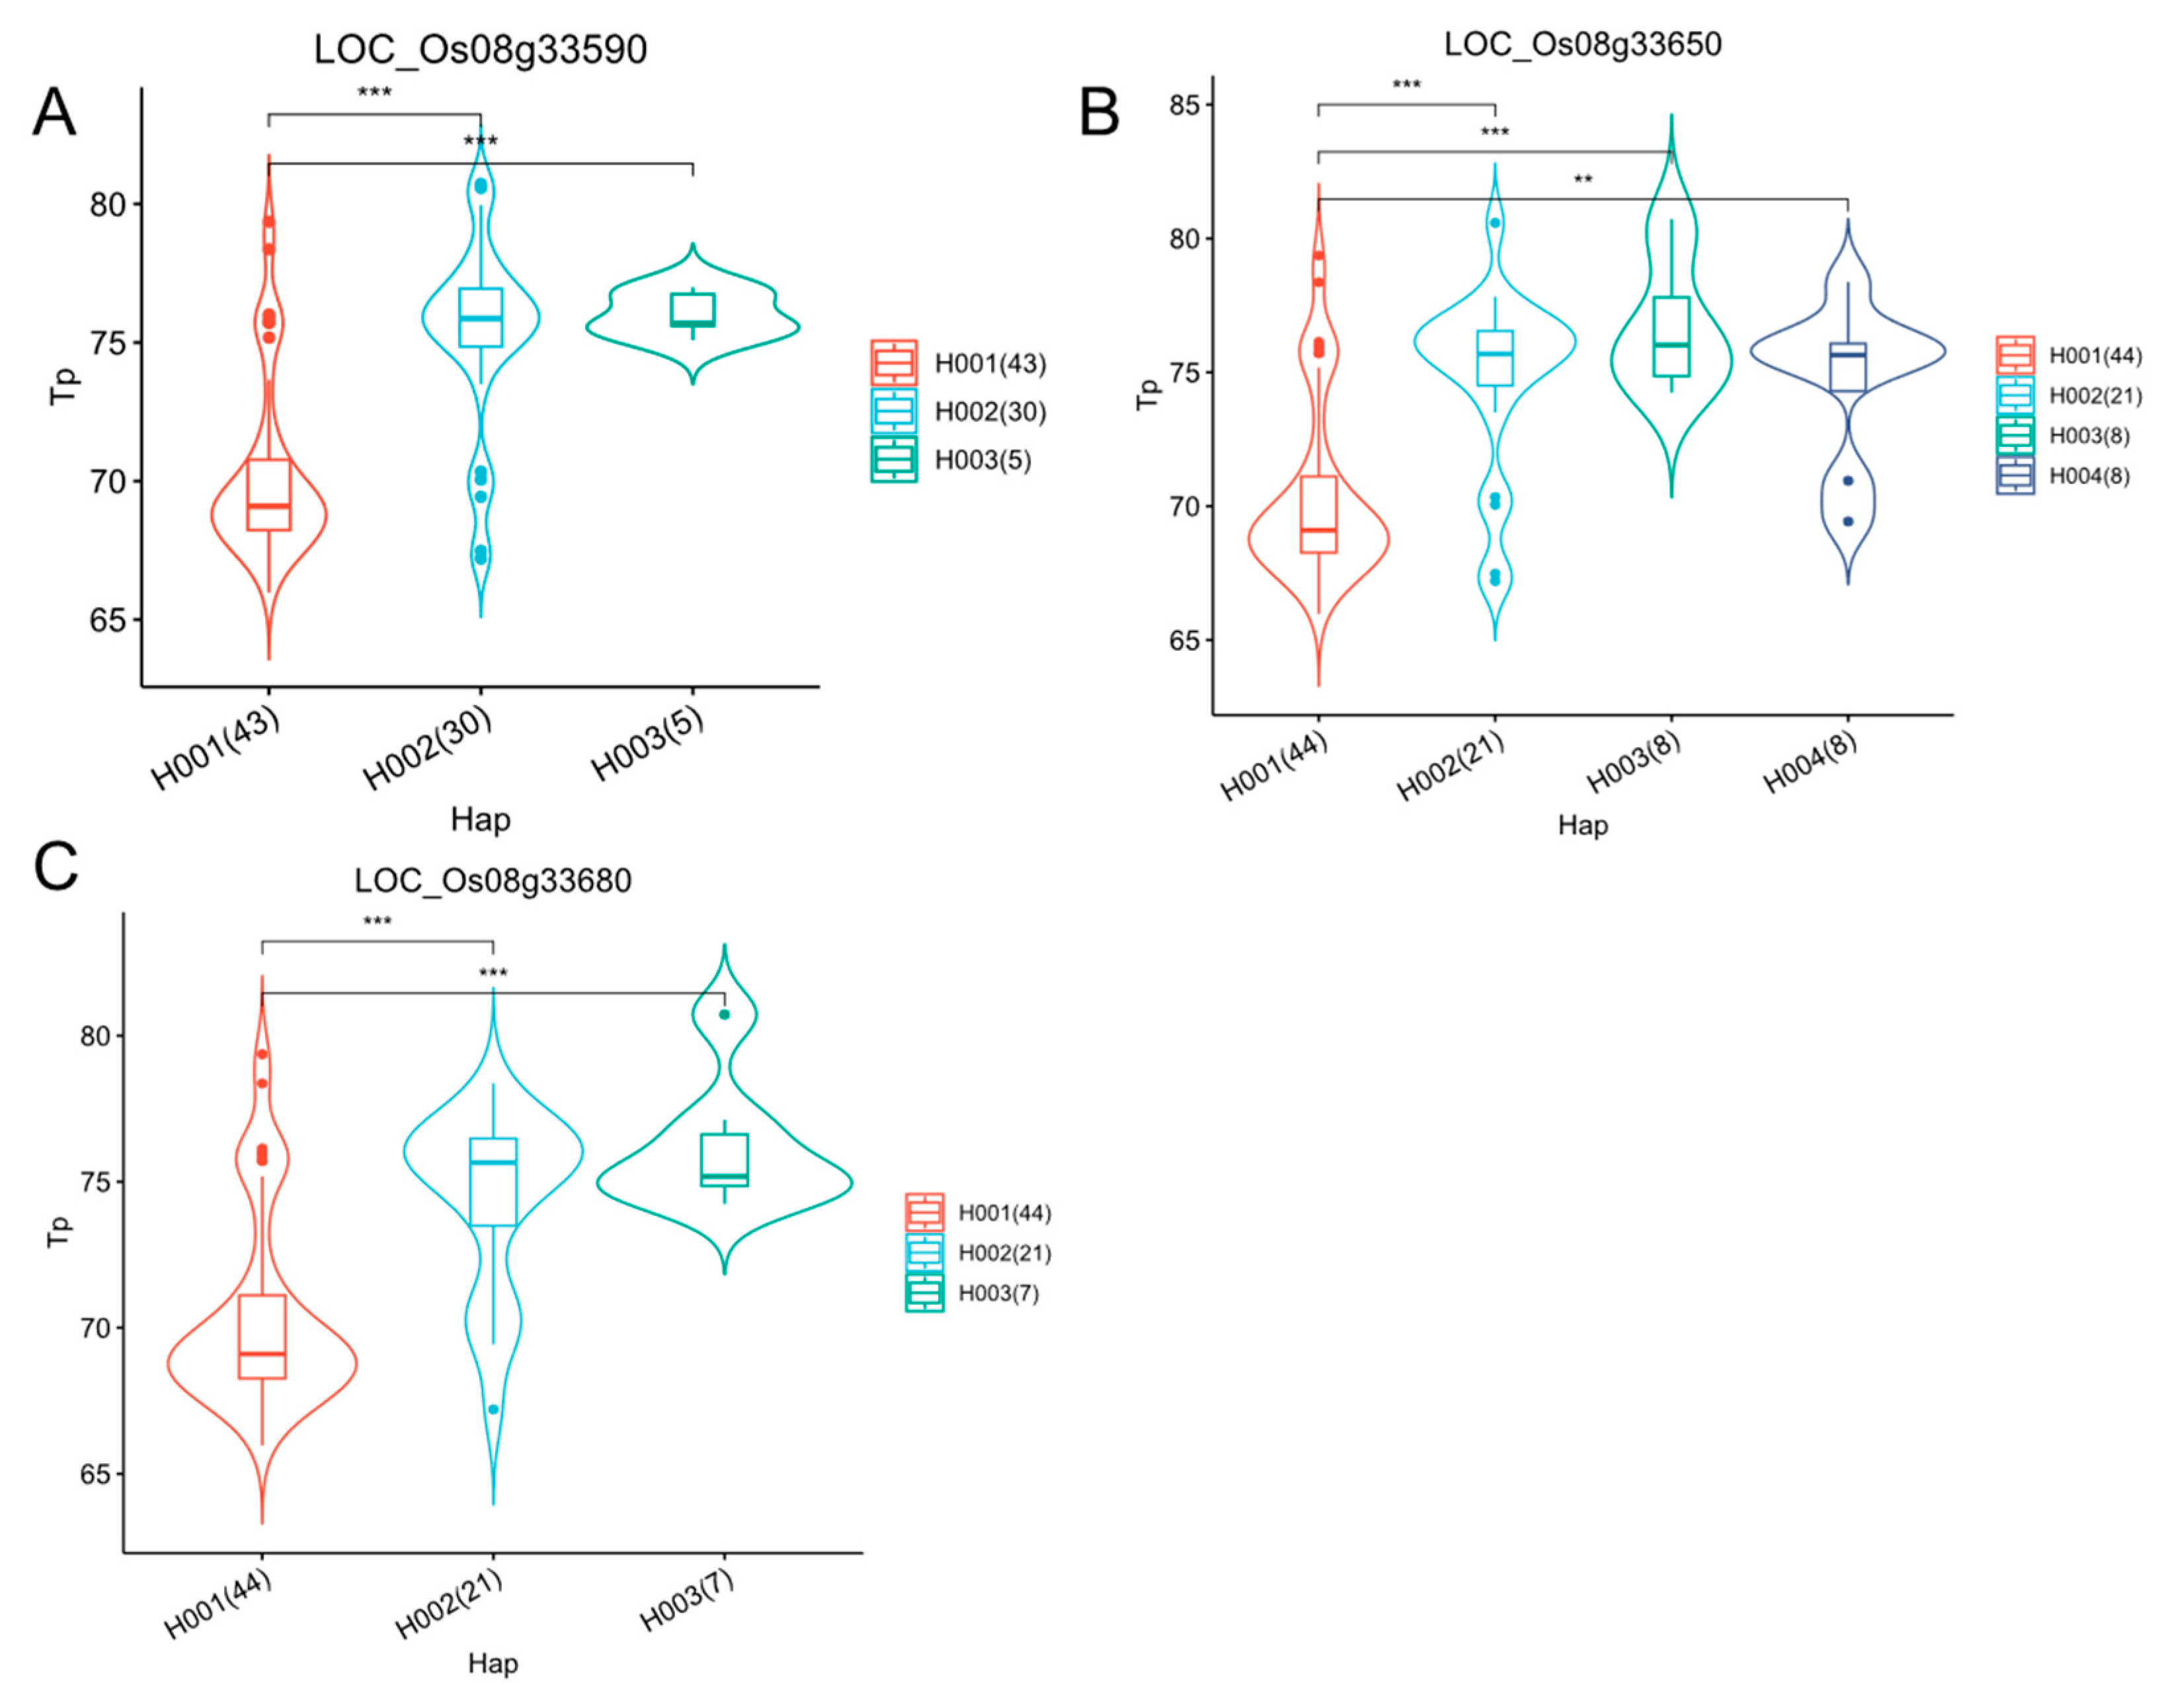
2.7. Identification of Candidate Genes

To identify other candidate genes related to the CEQ traits in the remaining loci, we extracted all SNPs in the 50 kb left and right genomic regions of important MTAs (accounting for over 20% of the phenotypic variance explained). Four important MTAs were selected and used for gene-based association study with the mixed linear model (MLM) in Tassel 5.0. For the MTA S2_19767079 and MTA S5_17739626 for the GUM trait (Table 2), we detected two significant SNPs (p < 0.001) in the 19.71–19.81 Mb candidate region, and two significant SNPs (p < 0.001) in the 17.68–17.78 Mb candidate region. According to SNP information, they were all upstream and downstream SNPs (Tables S3 and S4). For MTA S12_16601981 for To, we detected two significant SNPs (p < 0.001) in the 16.55–16.65 Mb candidate region and they were both intergenic SNPs (Table S5). For MTA S8_20995138 for Tp, we detected 113 significant SNPs (p < 0.00006) in the 20.94–21.04 Mb candidate region and selected ten nonsynonymous SNPs and SNPs located on UTR (Table S6). These SNPs located within five genes (LOC_Os08g33590, LOC_Os08g33600, LOC_Os08g33610, LOC_Os08g33650, LOC_Os08g33680). Based on the gene annotations from the Rice Genome Annotation Project (RGAP), LOC_Os08g33600 and LOC_Os08g33610 were annotated as retrotransposon. Then we conducted haplotype analysis for the remaining three genes. Interestingly, for these genes, there were highly significant differences between Hap 1 and Hap 2/ Hap 3 at p < 0.001, and there were no significant differences between Hap 2 and Hap3 (Figure 7). Based on the LD analysis, we found that there was a substantial LD block region from 20973028 bp to 21116123 bp (Figure S2), which may be responsible for the similar haplotypes among these genes. Fine-mapping and identifying the candidate gene by transgenic experiment for this region may provide direct evidence to their association with Tp.

3. Discussion

3.1. Population Structure Analysis Indicates Shanlan Landrace Rice Is a Specific Rice Germplasm

Population structure analysis in this study showed that the 90 rice germplasms could be divided into japonica and indica subspecies when K = 2 was selected. This is true since the indica and japonica subspecies of Oryza sativa have a long-standing divergence that is both ancient and well-established [36]. Chen et al. [37] developed a set of SNPs and identified the similar subspecific differentiation and distinct geographic patterns within the indica and japonica germplasms. However, when K = 3 was selected, the indica group remained the same, while the japonica group was further divided into two subpopulations, namely GJ1 and GJ2. The GJ1 group only had seven accessions including three typical japonica cultivars, suggesting that the japonica Shanlan landraces had different characteristics from the modern japonica cultivars, while the indica Shanlan landraces are similar to modern indica cultivars. These results may raise interesting questions such as what is the origin of Shanlan rice and how did it evolve to the modern cultivars? Although Li et al. [5] suggested that the Shanlan rice in Hainan may have originated from Guangdong Province using SSR markers, these results may be challenged if using genome re-sequencing data, because they only used a few SSR markers in the analysis. However, together with the previous studies [2,3], we can conclude that both the indica and japonica subspecies were found in Shanlan landrace. The LD decay distance we calculated in our study for all germplasms was 183 kb, which was longer than that of a set of 809 indica rice accessions [38] and the 3 k rice population [39]. The difference in LD decay distance between our investigation and the previous ones may imply that Shanlan landrace rice has a lower genetic diversity, because these rice groups were produced through traditional slash-and-burn cultivation in the mountains [4].

3.2. Shanlan Landrace Rice Displayed Wide Diversity in Starch Physicochemical Properties

As rice yields increase, the cultivation of high-quality rice has become a prime objective for breeders. In general, CEQs are elusive traits that are much harder to select than other more obvious traits. Limited information on the diversity of cooking quality traits in the upland landrace rice has been available. Toosang et al. [40] examined grain quality traits of Thai highland glutinous rice landraces and found diversity in the cooking quality parameters. In this study, we comprehensively assessed the physicochemical properties of starch in Hainan Shanlan rice accessions, covering various aspects such as AAC and paste viscosity parameters, texture parameters, thermal properties, and retrogradation properties. These properties exhibited significant differences among different populations. In particular, the AAC values of the entire japonica rice population exhibited a notably higher coefficient of variation (CV, 76.30%). Correspondingly, their viscosity characteristics also displayed great diversity, which can be attributed to the existence of diverse wx alleles within this population. Conversely, the indica rice population demonstrated a lower coefficient of variation and exhibited more consistent characteristics. Feng et al. [41] conducted a comparative analysis of the quality traits of 635 rice samples from China, revealing significant disparities between the japonica and indica rice varieties. These findings align closely with the results of our study.
Previous research has reported significant correlations between AAC and various pasting viscosity parameters [42]. Our findings align with these results, as we observed a correlation between AAC and most pasting viscosity parameters. Additionally, previous studies have shown positive correlations between AAC and HD, CHEW, GUM, and COH, as well as a negative correlation with ADH [43,44], which is consistent with our findings. Hori et al. [45] found significant positive correlations between HD and PV, HPV, CPV, SB, and PT, as well as significant negative correlations between ADH and CPV, SB, and PT. Our results also demonstrate similar significant correlations. Although some correlations vary across different studies, likely due to the diversity of rice germplasms or various environmental conditions, our findings generally align with previous research. The consistent correlations between AAC, paste properties, and textural attributes may be attributed to their physicochemical and even genetic relationships. These relationships can be exploited by rice breeders in advanced breeding generations for trait selection.

3.3. Shanlan Landrace Rice Contains Many Favorable Wx Alleles

In this study, GWAS was used to analyze the CEQ traits, leading to the identification of 32 significant loci. Of these, 26 were novel loci (Table 1). Notably, the Wx locus emerged as a major MTA. These findings align with correlation analysis and previous reports [46]. Zhao et al. [47] performed association mapping on 83 indica and 170 japonica rice accessions using 210 SSR markers and identified 14 loci where the Wx gene exhibited significant associations with AAC, GC, and pasting viscosities. Yang et al. [26] conducted association mapping with 143 markers in nonwaxy rice and found that Wx was a major main-effect QTL for gel texture (including HD, ADH, and COH). Misra et al. [48] detected major effect genetic loci on the Wx gene for AAC and ADH using both single-locus GWAS and multi-locus GWAS in 236 indica accessions. Collectively, these findings suggest that the Wx gene plays a pivotal role in determining AAC, texture, and pasting viscosity.
This study focused on the comprehensive analysis of Wx alleles found in all the accessions, particularly the GJ group, which consists of accessions bearing the wx, Wxb, Wxin, and Wxla/mw haplotypes. Furthermore, group XI encompasses accessions with distinct Wx alleles, including wx, Wxa, Wxlv, Wxin, and Wxla/mw, each of which exhibits distinguishable characteristics. Notably, all accessions containing the Wxlv allele are categorized under group XI. Zhang et al. [12] mapped a specific allele of Wx, Wxlv, from a local indica rice variety. In this study, it was found that the rice with Wxlv showed high amylose content and low starch viscosity characteristics (Figure 3), which is in agreement with Zhang et al. [12]. It was proved that the Wxlv and Wx genes in wild rice have basically the same sequence and function, and belong to an ancestor gene in evolution. Interestingly, a small number of modern indica rice varieties were found to contain the Wxlv allele, while the majority of Shanlan landrace rice accessions contained the Wxlv allele. This fact may suggest that this allele in Shanlan rice received poor artificial selection. Another interesting finding is that Wxla/mw was reported as a rare allele in rice population [13,17]; however, this is not case in Shanlan landrace, since 13 accessions were found to contain this allele. The diverse Wx alleles found in Shanlan landrace rice provide rich gene resources for breeding new rice cultivars with improved CEQs.

3.4. New Loci Have Been Identified in Tp

The SSIIa gene is responsible for the elongation of short chains with degree of polymerization (DP) ≤ 12 (A chains) to B1 chains (13 ≤ DP ≤ 24) within the amylopectin cluster and has been found to be the main gene controlling GT [6]. SSIIa is the main gene controlling GT which is consistent with previous studies [49]. Furthermore, we examined all the genes in the genomic region of about 50 kb located in important MTAs (accounting for more than 20% of the phenotypic variation of the trait) from the Rice Genome Annotation Project (RGAP). Three genes related to Tp were screened out (LOC_Os08g33590, LOC_Os08g33650, LOC_Os08g33680). OsbHLH38 (LOC_Os08g33590) is an alkaline helix-loop-helix transcription factor gene that is most important for ABA sensitivity. In addition, OsbHLH38 influences abiotic stress tolerance in rice by mediating the expression of a large number of plant hormone transporter genes, transcription factor genes, and many downstream genes with different functions, including photosynthesis, redox homeostasis, and abiotic stress reactivity [50]. Further transgenic experiments are needed to reveal the association between these genes and Tp.
Molecular breeding by rational design is a cutting-edge strategy for rapid and precise crop improvement, leveraging known beneficial gene alleles and quantitative trait loci (QTLs) [51]. For instance, high-yield and high-quality elite cultivars have been developed by stacking multiple favorable alleles [52,53]. In summary, our results indicate that the Shanlan landrace rice contain wide genetic diversity in starch physicochemical properties derived from rich alleles of Wx. These alleles constitute a valuable resource for future genetic studies and rice improvement of rice grain quality.

4. Materials and Methods

4.1. Materials

A total of 84 Shanlan rice accessions were selected from the Hainan Province. In addition, three typical japonica rice cultivars, i.e., Nipponbare (Nip), Zhonghua 11 (ZH11), and Tainung 67 (TN67), and three typical indica rice cultivars, i.e., 9311, Guangluai4 (GLA4), and IR36 were used as references. All the rice accessions were planted and then harvested at the experimental farm of Sanya, China in 2022. After being air-dried, all the samples were stored at room temperature for a period of two and a half months. The rice grains were dehulled (Type THU, Satake Co., Tokyo, Japan), polished (Type TM05C, Satake Manufacturing, Suzhou, China), and then ground to flour (Cyclone Sample Mill, UDY Corporation, Fort Collins, CO, USA) to pass through a 100-mesh sieve.

4.2. DNA Extraction, Genotyping, and Linkage Disequilibrium

For each accession, two leaves were collected from a single plant at the tillering stage (one month after seedling transplantation), and genomic DNA was extracted from leaf samples using Plant DNA Mini Kits (Aidlab Biotech, Beijing, China). Sequencing libraries were generated using a Truseq Nano DNA HT Sample Preparation Kit (Illumina, San Diego, CA, USA) following the manufacturer’s recommendations. Separate index codes were added to each sample. The insert size of each library was approximately 350 bp. The Illumina HiSeq X10 platform was used to obtain the pair-ends of 150 bp reads, and the original sequence was further processed to remove adaptor-containing and low-quality reads. Library construction, sequencing, and sequence cleaning were all performed by Novogene Bioinformatics Technology Co., Ltd. (Beijing, China).
The reference genome was Nipponbare. GATK was used to call SNPs [54]. The mapping results were converted to the VCF format using SAMtools (version 0.1.18) [55]. SNPs with MAF ≥ 5% and missing rate ≤ 10% were retained, and 3,425,822 high-quality SNPs were finally obtained. The linkage disequilibrium (LD; R2) between pairs of markers was calculated using the software PopLDdecay version 3.42 [56]. When R2 declined to half of its maximum value, the distance across the chromosome was determined as the distance of LD decay [36].

4.3. Population Structure, Phylogenetic Tree Construction, and Kinship Analysis

The Tassel5.0 [57] was used to calculate the kinship (K) and principal component analysis (PCA). All SNPs were used in the calculation. A total of 93,302 independent SNPs across the whole genome determined by PLINK version 1.90 (window size 50, step size 10, R2 ≥ 0.1) [58] were used for population structure analysis by the Admixture version 1.3.0 [59].

4.4. Analysis of Starch Physicochemical Properties

AAC was measured using the iodine staining method described in Zhao et al. [60]. Each sample was replicated four times for reproducibility.
The pasting viscosities of rice flour were measured by Rapid Visco Analyser (Model 4500, Perten Instrument, Hägersten, Sweden) using its corresponding software program TCW3 (Thermocline for Windows 3). The viscosity parameters and pasting temperature (PT) were recorded or calculated from the same software. The unit of the viscosity was RVU (rapid viscosity unit). Each sample was replicated twice for reproducibility.
The aluminum cans with rice flour gels were sealed by Parafilm after the RVA analysis and stored at 4 °C for 24 h. Texture characteristics were measured by a texture analyzer (TA.XTC-18, Shanghai Bosin Industrial Development Co., Shanghai, China) using a standard two-cycle TPA program. A 5 mm diameter probe was used to compress the gel for 10 mm at 1 mm/s test speed. The hardness (HD, g), adhesiveness (ADH, g·s), gumminess (GUM, gf), and cohesiveness (COH) were derived from the software of the instrument.
The gelatinization and degradation characteristics were thoroughly analyzed using a Q20 differential scanning calorimeter (TA Instruments, New Castle, DE, USA). The method was according to Zhao et al. [60] with slight modifications. Initially, rice flour (2 mg with a moisture content of 12%) and water were weighed in a 1:3 weight ratio and subsequently sealed in an aluminum crucible. The mixture was then equilibrated at 4 °C for 24 h and at room temperature for an additional hour. After that, the crucible was placed in a DSC furnace and maintained at 30 °C for 1 min. Subsequently, the crucible was heated from 30 °C to 110 °C at a rate of 10 °C/min, with an empty crucible serving as a reference. The gelatinization parameters were derived from the software. After the initial measurements, the gelatinized samples from the DSC were kept at 4 °C for one week (placed in sample pans). Subsequently, the measurements were repeated to obtain the retrogradation parameters.

4.5. Genome-Wide Association Study

The total of 3,425,822 SNPs were selected for the GWAS analysis using fixed and random model circulating probability unification (FarmCPU) by the Genomic Association and Prediction Integrated Tool (GAPIT3) [61]. The first three principal components were used as covariates to capture the variance caused by population structure. The genome-wide significant thresholds of the GWAS (p-value = 2.92 × 10⁻⁷) were determined by 0.05/n (n is the number of markers). The Manhattan, QQ, and SNP-density plots for the GWAS were visualized using the R package CMplot version 3.1.3). The leading SNPs of each significant SNP cluster (in 200 kb) were selected to display the location of the MTAs.

4.6. Candidate Gene Analysis

To identify other candidate genes related to the CEQ traits in the remaining loci, we extracted all SNPs in the 50 kb left and right genomic regions of important MTAs (those accounting for over 20% of the phenotypic variance explained). Gene-based association analysis was conducted with the mixed linear model (MLM) in Tassel 5.0. The SNP types and gene annotations in the candidate region were analyzed. Finally, the candidate genes were determined based on the significant p-value, SNP information, and gene annotation.

4.7. Statistical Analysis

The calculations of means, standard deviation, and range of phenotypic data were performed using Excel. The results were presented as mean ± standard deviation (SD), in which all the measurements were accomplished at least in duplicate. Duncan’s multiple range test of ANOVA and correlation analysis were conducted using the SPSS 25.0 software (SPSS, Inc., Chicago, IL, USA).

5. Conclusions

The population structure and genetic diversity of Shanlan landrace rice were investigated with SNPs derived from the genome resequencing. Three subpopulations were derived from an analysis of population structure, GJ1, GJ2, and XI. Most japonica Shanlan rice belonged to GJ2 which was different from modern japonica cultivars, but most indica Shanlan rice were similar to the modern indica rice. There were considerable genetic variations for 20 CEQ traits in the population. We identified 32 MTAs in the whole panel, in which the Wx, SSG6, and SSIIa genes were the major candidate genes. These findings enhance our understanding of the genetic structure of Shanlan rice and richness of gene resources for the improvement of high-quality rice in current breeding programs.

Supplementary Materials

The supporting information can be downloaded at: https://www.mdpi.com/article/10.3390/ijms25063469/s1.

Author Contributions

L.Z.: Formal analysis, investigation, writing—original draft; B.D.: formal analysis, investigation, writing—original draft; Y.P.: investigation; Y.G.: investigation; Y.H.: investigation; J.B.: conceptualization, investigation, resources, formal analysis, writing—original draft. All authors have read and agreed to the published version of the manuscript.

Funding

This research was funded by the Hainan Provincial Natural Science Foundation (323MS066) and the Ministry of Agriculture and Rural Affairs (AgroST Project, NK2022050102).

Institutional Review Board Statement

Not applicable.

Informed Consent Statement

Not applicable.

Data Availability Statement

Data are contained within the article and Supplementary Materials.

Conflicts of Interest

The authors declare no conflicts of interest.

References

  1. Yang, Z.X.; Lin, X.; Wang, L.; Li, C.F.; Liu, S.X. Effects of ultrasonic treatment on the cooking and fermentation properties of Shanlan rice. J. Cereal Sci. 2020, 95, 103003. [Google Scholar] [CrossRef]
  2. Zheng, C.M.; Huang, D.Y.; Chen, H. Affinity and hybridization of Shanlan upland rice with common rice. Chinese J. Trop. Crops 1998, 2, 74–81, (In Chinese with English Abstract). [Google Scholar]
  3. Yuan, N.N.; Wei, X.; Xue, D.Y.; Yang, Q.Y. The Origin and Evolution of Upland Rice in Li Ethnic Communities in Hainan Province. J. Plant Genet. Resour. 2013, 14, 202–207, (In Chinese with English Abstract). [Google Scholar]
  4. Yang, G.; Yang, Y.; Guan, Y.; Xu, Z.; Wang, J.; Yun, Y.; Yan, X.; Tang, Q. Genetic diversity of Shanlan upland rice (Oryza sativa L.) and association analysis of SSR markers linked to agronomic traits. Biomed Res. Int. 2021, 2021, 7588652. [Google Scholar] [CrossRef] [PubMed]
  5. Li, R.; Huang, Y.; Yang, X.; Su, M.; Xiong, H.; Dai, Y.; Wu, W.; Pei, X.; Yuan, Q. Genetic diversity and relationship of Shanlan upland rice were revealed based on 214 upland rice SSR markers. Plants 2023, 12, 2876. [Google Scholar] [CrossRef]
  6. Bao, J.S.; Deng, B.W.; Zhang, L. Molecular and genetic bases of rice cooking and eating quality: An updated review. Cereal Chem. 2023, 100, 1220–1233. [Google Scholar] [CrossRef]
  7. Cai, X.L.; Wang, Z.Y.; Xing, Y.; Zhang, J.L.; Hong, M.M. Aberrant splicing of intron 1 leads to the heterogeneous 5′ UTR and decreased expression of waxy gene in rice cultivars of intermediate amylose content: Aberrant splicing of rice waxy gene. Plant J. 1998, 14, 459–465. [Google Scholar] [CrossRef] [PubMed]
  8. Hoai, T.T.; Matsusaka, H.; Toyosawa, Y.; Suu, T.D.; Satoh, H.; Kumamaru, T. Influence of single-nucleotide polymorphisms in the gene encoding granule-bound starch synthase I on amylose content in Vietnamese rice cultivars. Breed. Sci. 2014, 64, 142–148. [Google Scholar] [CrossRef]
  9. Liu, L.; Ma, X.; Liu, S.; Zhu, C.; Jiang, L.; Wang, Y.; Shen, Y.; Ren, Y.; Dong, H.; Chen, L.; et al. Identification and characterization of a novel Waxy allele from a Yunnan rice landrace. Plant Mol. Biol. 2009, 71, 609–626. [Google Scholar] [CrossRef] [PubMed]
  10. Mikami, I.; Aikawa, M.; Hirano, H.Y.; Sano, Y. Altered tissue-specific expression at the Wx gene of the opaque mutants in rice. Euphytica 1999, 105, 91–97. [Google Scholar] [CrossRef]
  11. Sato, H.; Suzuki, Y.; Sakai, M.; Imbe, T. Molecular characterization of Wx-mq, a novel mutant gene for low amylose content in endosperm of rice (Oryza sativa L.). Breed. Sci. 2002, 52, 131–135. [Google Scholar] [CrossRef]
  12. Zhang, C.; Zhu, J.; Chen, S.; Fan, X.; Li, Q.; Lu, Y.; Wang, M.; Yu, H.; Yi, C.; Tang, S.; et al. Wxlv, the ancestral allele of rice waxy gene. Mol. Plant 2019, 12, 1157–1166. [Google Scholar] [CrossRef] [PubMed]
  13. Zhang, C.; Yang, Y.; Chen, S.; Liu, X.; Zhu, J.; Zhou, L.; Lu, Y.; Li, Q.; Fan, X.; Tang, S.; et al. A rare Waxy allele coordinately improves rice eating and cooking quality and grain transparency. J. Integr. Plant Biol. 2021, 63, 889–901. [Google Scholar] [CrossRef] [PubMed]
  14. Yang, J.; Wang, J.; Fan, F.; Zhu, J.; Chen, T.; Wang, C.; Zheng, T.; Zhang, J.; Zhong, W.; Xu, J. Development of AS-PCR marker based on a key mutation confirmed by resequencing of Wx-mp in Milky Princess and its application in japonica soft rice (Oryza sativa L.) breeding. Plant Breed. 2013, 132, 595–603. [Google Scholar] [CrossRef]
  15. Biselli, C.; Cavalluzzo, D.; Perrini, R.; Gianinetti, A.; Bagnaresi, P.; Urso, S.; Orasen, G.; Desiderio, F.; Lupotto, E.; Cattivelli, L.; et al. Improvement of marker-based predictability of Apparent Amylose Content in japonica rice through GBSSI allele mining. Rice 2014, 7, 1. [Google Scholar] [CrossRef] [PubMed]
  16. Huang, X.; Su, F.; Huang, S.; Mei, F.; Niu, X.; Ma, C.; Zhang, H.; Zhu, X.; Zhu, J.K.; Zhang, J. Novel Wx alleles generated by base editing for improvement of rice grain quality. J. Integr. Plant Biol. 2021, 63, 1632–1638. [Google Scholar] [CrossRef]
  17. Zhou, H.; Xia, D.; Zhao, D.; Li, Y.; Li, P.; Wu, B.; Gao, G.; Zhang, Q.; Wang, G.; Xiao, J.; et al. The origin of Wxla provides new insights into the improvement of grain quality in rice. J. Integr. Plant Biol. 2021, 63, 878–888. [Google Scholar] [CrossRef]
  18. Hsu, Y.C.; Tseng, M.C.; Wu, Y.P.; Lin, M.Y.; Wei, F.J.; Hwu, K.K.; Hsing, Y.I.; Lin, Y.R. Genetic factors responsible for eating and cooking qualities of rice grains in a recombinant inbred population of an inter-subspecific cross. Mol. Breed. 2014, 34, 655–673. [Google Scholar] [CrossRef]
  19. Wang, L.Q.; Liu, W.J.; Xu, Y.; He, Y.Q.; Luo, L.J.; Xing, Y.Z.; Xu, C.G.; Zhang, Q. Genetic basis of 17 traits and viscosity parameters characterizing the eating and cooking quality of rice grain. Theor. Appl. Genet. 2007, 115, 463–476. [Google Scholar] [CrossRef]
  20. Wang, X.; Pang, Y.; Zhang, J.; Wu, Z.; Chen, K.; Ali, J.; Ye, G.; Xu, J.; Li, Z. Genome-wide and gene-based association mapping for rice eating and cooking characteristics and protein content. Sci. Rep. 2017, 7, 17203. [Google Scholar] [CrossRef]
  21. Fan, C.; Yu, X.; Xing, Y.; Xu, C.; Luo, L.; Zhang, Q. The main effects; epistatic effects and environmental interactions of QTLs on the cooking and eating quality of rice in a doubled-haploid line population. Theor. Appl. Genet. 2005, 110, 1445–1452. [Google Scholar] [CrossRef] [PubMed]
  22. Teng, B.; Zhang, Y.; Du, S.; Wu, J.; Li, Z.; Luo, Z.; Yang, J. Crystalline, thermal and swelling properties of starches from single-segment substitution lines with different Wx alleles in rice (Oryza sativa L.). J. Sci. Food Agric. 2017, 97, 108–114. [Google Scholar] [CrossRef] [PubMed]
  23. Fu, Y.; Hua, Y.; Luo, T.; Liu, C.; Zhang, B.; Zhang, X.; Liu, Y.; Zhu, Z.; Tao, Y.; Zhu, Z.; et al. Generating waxy rice starch with target type of amylopectin fine structure and gelatinization temperature by waxy gene editing. Carbohydr Polym. 2023, 306, 120595. [Google Scholar] [CrossRef] [PubMed]
  24. Tian, Z.X.; Qian, Q.; Liu, Q.Q.; Yan, M.X.; Liu, X.F.; Yan, C.J.; Liu, G.F.; Gao, Z.Y.; Tang, S.Z.; Zeng, D.L. Allelic diversities in rice starch biosynthesis lead to a diverse array of rice eating and cooking qualities. Proc. Natl. Acad. Sci. USA 2009, 106, 21760–21765. [Google Scholar] [CrossRef] [PubMed]
  25. He, Y.; Han, Y.P.; Jiang, L.; Xu, C.W.; Lu, J.F.; Xu, M.L. Functional analysis of starch-synthesis genes in determining rice eating and cooking qualities. Mol. Breed. 2006, 18, 277–290. [Google Scholar] [CrossRef]
  26. Yang, F.; Chen, Y.; Tong, C.; Huang, Y.; Xu, F.; Li, K.; Corke, H.; Sun, M.; Bao, J. Association mapping of starch physicochemical properties with starch synthesis-related gene markers in nonwaxy rice (Oryza sativa L.). Mol. Breed. 2014, 34, 1747–1763. [Google Scholar] [CrossRef]
  27. Begum, H.; Spindel, J.E.; Lalusin, A.; Borromeo, T.; Gregorio, G.; Hernandez, J. Genome-wide association mapping for yield and other agronomic traits in an elite breeding population of tropical rice (Oryza sativa L.). PLoS ONE 2015, 10, 0119873. [Google Scholar] [CrossRef]
  28. Yano, K.; Yamamoto, E.; Aya, K.; Takeuchi, H.; Lo, P.C.; Hu, L. Genome-wide association study using whole-genome sequencing rapidly identifies new genes influencing agronomic traits in rice. Nat. Genet. 2016, 48, 927–934. [Google Scholar] [CrossRef]
  29. Reig-Valiente, J.L.; Marqués, L.; Talón, M.; Domingo, C. Genome-wide association study of agronomic traits in rice cultivated in temperate regions. BMC Genom. 2018, 19, 706. [Google Scholar] [CrossRef]
  30. Zhang, P.; Zhong, K.; Zhong, Z.; Tong, H. Genome-wide association study of important agronomic traits within a core collection of rice (Oryza sativa L.). BMC Plant Biol. 2019, 19, 1–12. [Google Scholar] [CrossRef]
  31. Zhou, X.; and Huang, X. Genome-wide association studies in rice: How to solve the low power problems? Mol. Plant 2019, 12, 10–12. [Google Scholar] [CrossRef] [PubMed]
  32. Verma, R.K.; Chetia, S.K.; Dey, P.C.; Rahman, A.; Saikia, S.; Sharma, V.; Sharma, H.; Sen, P.; Modi, M.K. Genome-wide association studies for agronomical traits in winter rice accessions of Assam. Genomics 2021, 113, 1037–1047. [Google Scholar] [CrossRef] [PubMed]
  33. Biselli, C.; Volante, A.; Desiderio, F.; Tondelli, A.; Gianinetti, A.; Finocchiaro, F.; Taddei, F.; Gazza, L.; Sgrulletta, D.; Cattivelli, L.; et al. GWAS for starch-related parameters in japonica rice (Oryza sativa L.). Plants 2019, 8, 292. [Google Scholar] [CrossRef] [PubMed]
  34. Jiang, C.; Rashid, M.A.R.; Zhang, Y.; Zhao, Y.; Pan, Y. Genome wide association study on development and evolution of glutinous rice. BMC Genom. Data 2022, 23, 33. [Google Scholar] [CrossRef]
  35. Matsushima, R.; Maekawa, M.; Kusano, M.; Tomita, K.; Kondo, H.; Nishimura, H.; Crofts, N.; Fujita, N.; Sakamoto, W. Amyloplast membrane protein substandard starch grain6 controls starch grain size in rice endosperm. Plant Physiol. 2016, 170, 1445–1459. [Google Scholar] [CrossRef] [PubMed]
  36. Huang, X.; Wei, X.; Sang, T.; Zhao, Q.; Feng, Q.; Zhao, Y.; Li, C.; Zhu, C.; Lu, T.; Zhang, Z.; et al. Genome-wide association studies of 14 agronomic traits in rice landraces. Nat. Genet. 2010, 42, 961–967. [Google Scholar] [CrossRef] [PubMed]
  37. Chen, H.; He, H.; Zou, Y.; Chen, W.; Yu, R.; Liu, X. Development and application of a set of breeder-friendly SNP markers for genetic analyses and molecular breeding of rice (Oryza sativa L.). Theor. Appl. Genet. 2011, 123, 869–879. [Google Scholar] [CrossRef]
  38. Xie, W.; Wang, G.; Yuan, M.; Yao, W.; Lyu, K.; Zhao, H.; Yang, M.; Li, P.; Zhang, X.; Yuan, J.; et al. Breeding signatures of rice improvement revealed by a genomic variation map from a large germplasm collection. Proc. Natl. Acad. Sci. USA 2015, 112, 5411–5419. [Google Scholar] [CrossRef]
  39. Wang, W.; Mauleon, R.; Hu, Z.; Chebotarov, D.; Tai, S.; Wu, Z.; Li, M.; Zheng, T.; Fuentes, R.R.; Zhang, F.; et al. Genomic variation in 3010 diverse accessions of Asian cultivated rice. Nature 2018, 557, 43–49. [Google Scholar] [CrossRef]
  40. Toosang, S.; Jamjod, S.; Pusadee, T. Characterization of grain quality traits of Thai highland glutinous rice landraces. Chiang Mai J. Sci. 2024, 51, e2024007. [Google Scholar] [CrossRef]
  41. Feng, F.; Li, Y.; Qin, X.; Liao, Y.; Siddique, K.H.M. Changes in rice grain quality of indica and japonica type varieties released in China from 2000 to 2014. Front. Plant Sci. 2017, 8, 1863. [Google Scholar] [CrossRef]
  42. Shi, S.; Wang, E.; Li, C.; Cai, M.; Cheng, B.; Cao, C.; Jiang, Y. Use of protein content, amylose content; and RVA parameters to evaluate the taste quality of rice. Front. Nutr. 2022, 8, 758547. [Google Scholar] [CrossRef]
  43. Li, H.; Prakash, S.; Nicholson, T.M.; Fitzgerald, M.A.; Gilbert, R.G. Instrumental measurement of cooked rice texture by dynamic rheological testing and its relation to the fine structure of rice starch. Carbohydr. Polym. 2016, 146, 253–263. [Google Scholar] [CrossRef] [PubMed]
  44. Cuevas, R.P.O.; Domingo, C.J.; Sreenivasulu, N. Multivariate-based classification of predicting cooking quality ideotypes in rice (Oryza sativa L.) indica germplasm. Rice 2018, 11, 56. [Google Scholar] [CrossRef] [PubMed]
  45. Hori, K.; Suzuki, K.; Iijima, K.; Ebana, K. Variation in cooking and eating quality traits in japanese rice germplasm accessions. Breed. Sci. 2016, 66, 309–318. [Google Scholar] [CrossRef] [PubMed]
  46. Li, K.; Bao, J.; Corke, H.; Sun, M. Association analysis of markers derived from starch biosynthesis related genes with starch physicochemical properties in the USDA rice mini-core collection. Front. Plant Sci. 2017, 8, 424. [Google Scholar] [CrossRef]
  47. Zhao, C.; Zhao, L.; Zhao, Q.; Chen, T.; Yao, S.; Zhu, Z.; Zhou, L.; Nadaf, A.B.; Liang, W.; Lu, K.; et al. Genetic dissection of eating and cooking qualities in different subpopulations of cultivated rice (Oryza sativa L.) through association mapping. BMC Genet. 2020, 21, 119. [Google Scholar] [CrossRef]
  48. Misra, G.; Badoni, S.; Domingo, C.J.; Cuevas, R.P.O.; Llorente, C.; Mbanjo, E.G.N.; Sreenivasulu, N. Deciphering the genetic architecture of cooked rice texture. Front. Plant Sci. 2018, 9, 1405. [Google Scholar] [CrossRef] [PubMed]
  49. Jiang, J.; Song, S.; Hu, C.; Jing, C.; Xu, Q.; Li, X.; Zhang, M.; Hai, M.; Shen, J.; Zhang, Y.; et al. QTL detection and candidate gene identification for eating and cooking quality traits in rice (Oryza sativa L.) via a Genome-Wide Association Study. Int. J. Mol. Sci. 2024, 25, 630. [Google Scholar] [CrossRef] [PubMed]
  50. Du, F.; Wang, Y.; Wang, J.; Li, Y.; Zhang, Y.; Zhao, X.; Xu, J.; Li, Z.; Zhao, T.; Wang, W.; et al. The basic helix-loop-helix transcription factor gene, OsbHLH38, plays a key role in controlling rice salt tolerance. J. Integr. Plant Biol. 2023, 65, 1859–1873. [Google Scholar] [CrossRef]
  51. Guo, T.; Yu, H.; Qiu, J.; Li, J.; Han, B.; Lin, H. Advances in rice genetics and breeding by molecular design in China (in Chinese). Sci. Vitae 2019, 49, 1185–1212. [Google Scholar]
  52. Zeng, D.; Tian, Z.; Rao, Y.; Dong, G.; Yang, Y.; Huang, L.; Leng, Y.; Xu, J.; Sun, C.; Zhang, G.; et al. Rational design of high-yield and superior-quality rice. Nat. Plants 2017, 3, 17031. [Google Scholar] [CrossRef]
  53. Jin, L.; Lu, Y.; Shao, Y.; Zhang, G.; Xiao, P.; Shen, S.; Corke, H.; Bao, J. Molecular marker assisted selection for improvement of the eating, cooking and sensory quality of rice (Oryza sativa L.). J. Cereal Sci. 2010, 51, 159–164. [Google Scholar] [CrossRef]
  54. DePristo, M.A.; Banks, E.; Poplin, R.; Garimella, K.V.; Maguire, J.R.; Hartl, C.; Philippakis, A.A.; del Angel, G.; Rivas, M.A.; Hanna, M.; et al. A framework for variation discovery and genotyping using next-generation DNA sequencing data. Nat. Genet. 2011, 43, 491–498. [Google Scholar] [CrossRef] [PubMed]
  55. Li, H.; Handsaker, B.; Wysoker, A.; Fennell, T.; Ruan, J.; Homer, N.; Marth, G.; Abecasis, G.; Durbin, R. The Sequence Alignment/Map format and SAM tools. Bioinformatics 2009, 25, 2078–2079. [Google Scholar] [CrossRef] [PubMed]
  56. Zhang, C.; Dong, S.S.; Xu, J.Y.; He, W.M.; Yang, T.L. PopLDdecay: A fast and effective tool for linkage disequilibrium decay analysis based on variant call format files. Bioinformatics 2019, 35, 1786–1788. [Google Scholar] [CrossRef]
  57. Bradbury, P.J.; Zhang, Z.; Kroon, D.E.; Casstevens, T.M.; Ramdoss, Y.; Buckler, E.S. TASSEL: Software for association mapping of complex traits in diverse samples. Bioinformatics 2007, 23, 2633–2635. [Google Scholar] [CrossRef] [PubMed]
  58. Purcell, S.; Neale, B.; Todd-Brown, K.; Thomas, L.; Ferreira, M.A.R.; Bender, D.; Maller, J.; Sklar, P.; de Bakker, P.I.W.; Daly, M.J.; et al. Plink: A tool set for whole-genome association and population-based linkage analyses. Am. J. Hum. Genet. 2007, 81, 559–575. [Google Scholar] [CrossRef]
  59. Martínez-Cortés, G.; Salazar-Flores, J.; Fernández-Rodríguez, L.G.; Rubi-Castellanos, R.; Rodríguez-Loya, C.; Velarde-Félix, J.S.; Muñoz-Valle, J.F.; Parra-Rojas, I.; Rangel-Villalobos, H. Admixture and population structure in Mexican-Mestizos based on paternal lineages. J. Hum. Genet. 2012, 57, 568–574. [Google Scholar] [CrossRef]
  60. Zhao, J.; Zhang, Y.; Zhang, Y.; Hu, Y.; Ying, Y.; Xu, F.; Bao, J. Variation in starch physicochemical properties of rice with different genic allele combinations in two environments. J. Cereal Sci. 2022, 108, 103575. [Google Scholar] [CrossRef]
  61. Wang, J.; Zhang, Z. GAPIT Version 3: Boosting power and accuracy for genomic association and prediction. Genom. Proteom. Bioinform. 2021, 19, 629–640. [Google Scholar] [CrossRef] [PubMed]
Figure 1. Population structure and genetic diversity in 90 rice germplasms. (A) Cross-validation error for K= 2–10 from ADMIXTURE analysis showing that the panel had 3 groups. (B) Population structure plot (K = 2, 3). (C) PCA plot of the first three principal components. (D) Phylogenetic tree based on genetic distance. (E) Genome-wide average LD map of all accessions.
Ijms 25 03469 g001
Figure 2. The distributions of quality traits in three panels, the GJ1, GJ2, and XI panels. PV: peak viscosity; HPV: hot paste viscosity; CPV: cold paste viscosity; BD: breakdown; SB: setback; PT: pasting temperature; AAC: apparent amylose content; HD: hardness; ADH: adhesiveness; GUM: gumminess; COH: cohesiveness; To: onset temperature; Tp: peak temperature; Tc: end temperature; ΔHg: enthalpy change; RTo: retrogradation onset temperature; RTp: retrogradation peak temperature; RTc: retrogradation end temperature; ΔHr: retrogradation enthalpy change; R: percentage of retrogradation.
Ijms 25 03469 g002
Figure 3. Correlation coefficients between rice CEQ traits. * indicate correlations are significant at p < 0.05.
Ijms 25 03469 g003
Figure 4. Manhattan (left) and quantile–quantile plots (right) of the genome-wide association study for quality traits of rice accessions. The points in the Manhattan plots indicate the −log10(p) values. The horizontal red line indicates the significant thresholds.
Ijms 25 03469 g004
Figure 5. The distributions of quality traits in six panels, wx panel, Wxa panel, Wxb panel, Wxin panel, Wxla/mw panel, and Wxlv panel. Different letters indicate significant differences among means (p < 0.05).
Ijms 25 03469 g005aIjms 25 03469 g005b
Figure 6. Identification of candidate genes for Tp in the whole panel. (A) High-density gene-based association analysis and LD heat map of local Manhattan map, around the peak on chromosome 6 highlighted with a blue triangle. (B) Based on 43 SNPs in all evaluated rice accessions, 8 haplotypes of SSIIa (LOC_Os06g12450) were identified. In the gene structure diagram of LOC_Os06g12450, the exon and UTR are indicated by the red frame; and the intron and intergenic regions are marked by black lines. (C) Comparison of Tp among accessions carrying different haplotypes of SSIIa, and haplotypes with fewer than 5 accessions are not shown. * and *** indicate correlations are significant at p < 0.05 and p < 0.001, respectively.
Ijms 25 03469 g006
Figure 7. Haplotype analysis was conducted on three genes (LOC_Os08g33590 (A), LOC_Os08g33650 (B), LOC_Os08g33680 (C)) that harbored nonsynonymous SNPs and UTR SNPs significantly associated with Tp. ** and *** indicate correlations are significant at p < 0.01 and p < 0.001, respectively.
Ijms 25 03469 g007
Table 1. Summary of genomic variants in rice populations.
SNPsNumberInDelsNumber
Total SNPs11,266,589Total Indels1,635,574
SNPs in exon2,619,968Indels in exon158,603
SNPs in intron1,725,345Indels in intron379,545
SNPs in UTR584,864Indels in UTR542,070
SNPs in UTR3139,473Indels in UTR351,556
SNPs in intergenic region2,399,456Indels in intergenic region527,164
Upstream2,182,885Upstream486,752
Downstream1,735,090Downstream390,218
Non-synonymous SNPs1,412,309Splicing Indels1971
Splicing SNPs12,979Stop-gain Indels6580
Stop-gain SNPs77,011Stop-loss Indels343
Stop-loss SNPs4254Frameshift Indels95,147
Non frameshift Indels49,081
Table 2. Loci identified for quality traits of rice accessions by GWAS.
SNP Position 1p-ValuemafEffectPVE (%) 2Candidate Gene
AACS1_131647011.17 × 10−80.480.040.32
S2_291563685.70 × 10−90.05−0.043.87
S2_347217691.80 × 10−350.0724.40.26
S5_78901548.14 × 10−120.10.041.38
S6_17791267.35 × 10−320.280.0545.93Wx
S7_252021202.73 × 10−90.16−6.760.08
S8_247462392.52 × 10−240.216.730.59
S11_109949723.95 × 10−150.090.055.4
S12_179496651.22 × 10−160.26.671.21
BDS6_17215692.09 × 10−180.12−19.6634.23Wx
S10_208333725.27 × 10−100.4512.726.09
GUMS2_14912761.48 × 10−120.24−1.6710.54
S2_197670791.62 × 10−160.053.9727.19
S4_72830694.07 × 10−90.091.4518.39
S5_177396261.97 × 10−100.171.2629.53
S5_181900397.49 × 10−100.26−115.46
S6_17849851.87 × 10−260.377.2518.47Wx
S8_119364143.32 × 10−110.241.434.22
HPVS7_286195944.13 × 10−90.110.970
S12_153815171.08 × 10−80.1217.4419.16
RS6_67456432.12 × 10−210.490.1545.43SSIIa
S7_286195942.33 × 10−120.110.125.56
S10_23895571.33 × 10−120.270.19.45
S12_47816281.14 × 10−100.080.1211.5
SBS6_16201421.31 × 10−430.5−53.2262.6SSG6
S7_169918126.79 × 10−90.1521.036.77
S12_173414081.03 × 10−90.1119.383.9
ToS12_166019813.15 × 10−200.073.3422.08
TpS3_132079124.79 × 10−90.473.774.63
S6_67456432.15 × 10−190.52.8945.91SSIIa
S8_209951382.43 × 10−310.49−12.0133.73
S11_76960661.25 × 10−80.47−3.631.36
1 The letter S indicates a SNP, the first number after S indicates the chromosome, and the second number indicates its physical position. 2 PVE: Phenotypic variance explained.
Disclaimer/Publisher’s Note: The statements, opinions and data contained in all publications are solely those of the individual author(s) and contributor(s) and not of MDPI and/or the editor(s). MDPI and/or the editor(s) disclaim responsibility for any injury to people or property resulting from any ideas, methods, instructions or products referred to in the content.

