
Tetraspanin CD82 Correlates with and May Regulate S100A7 Expression in Oral Cancer
 , , , , , , and
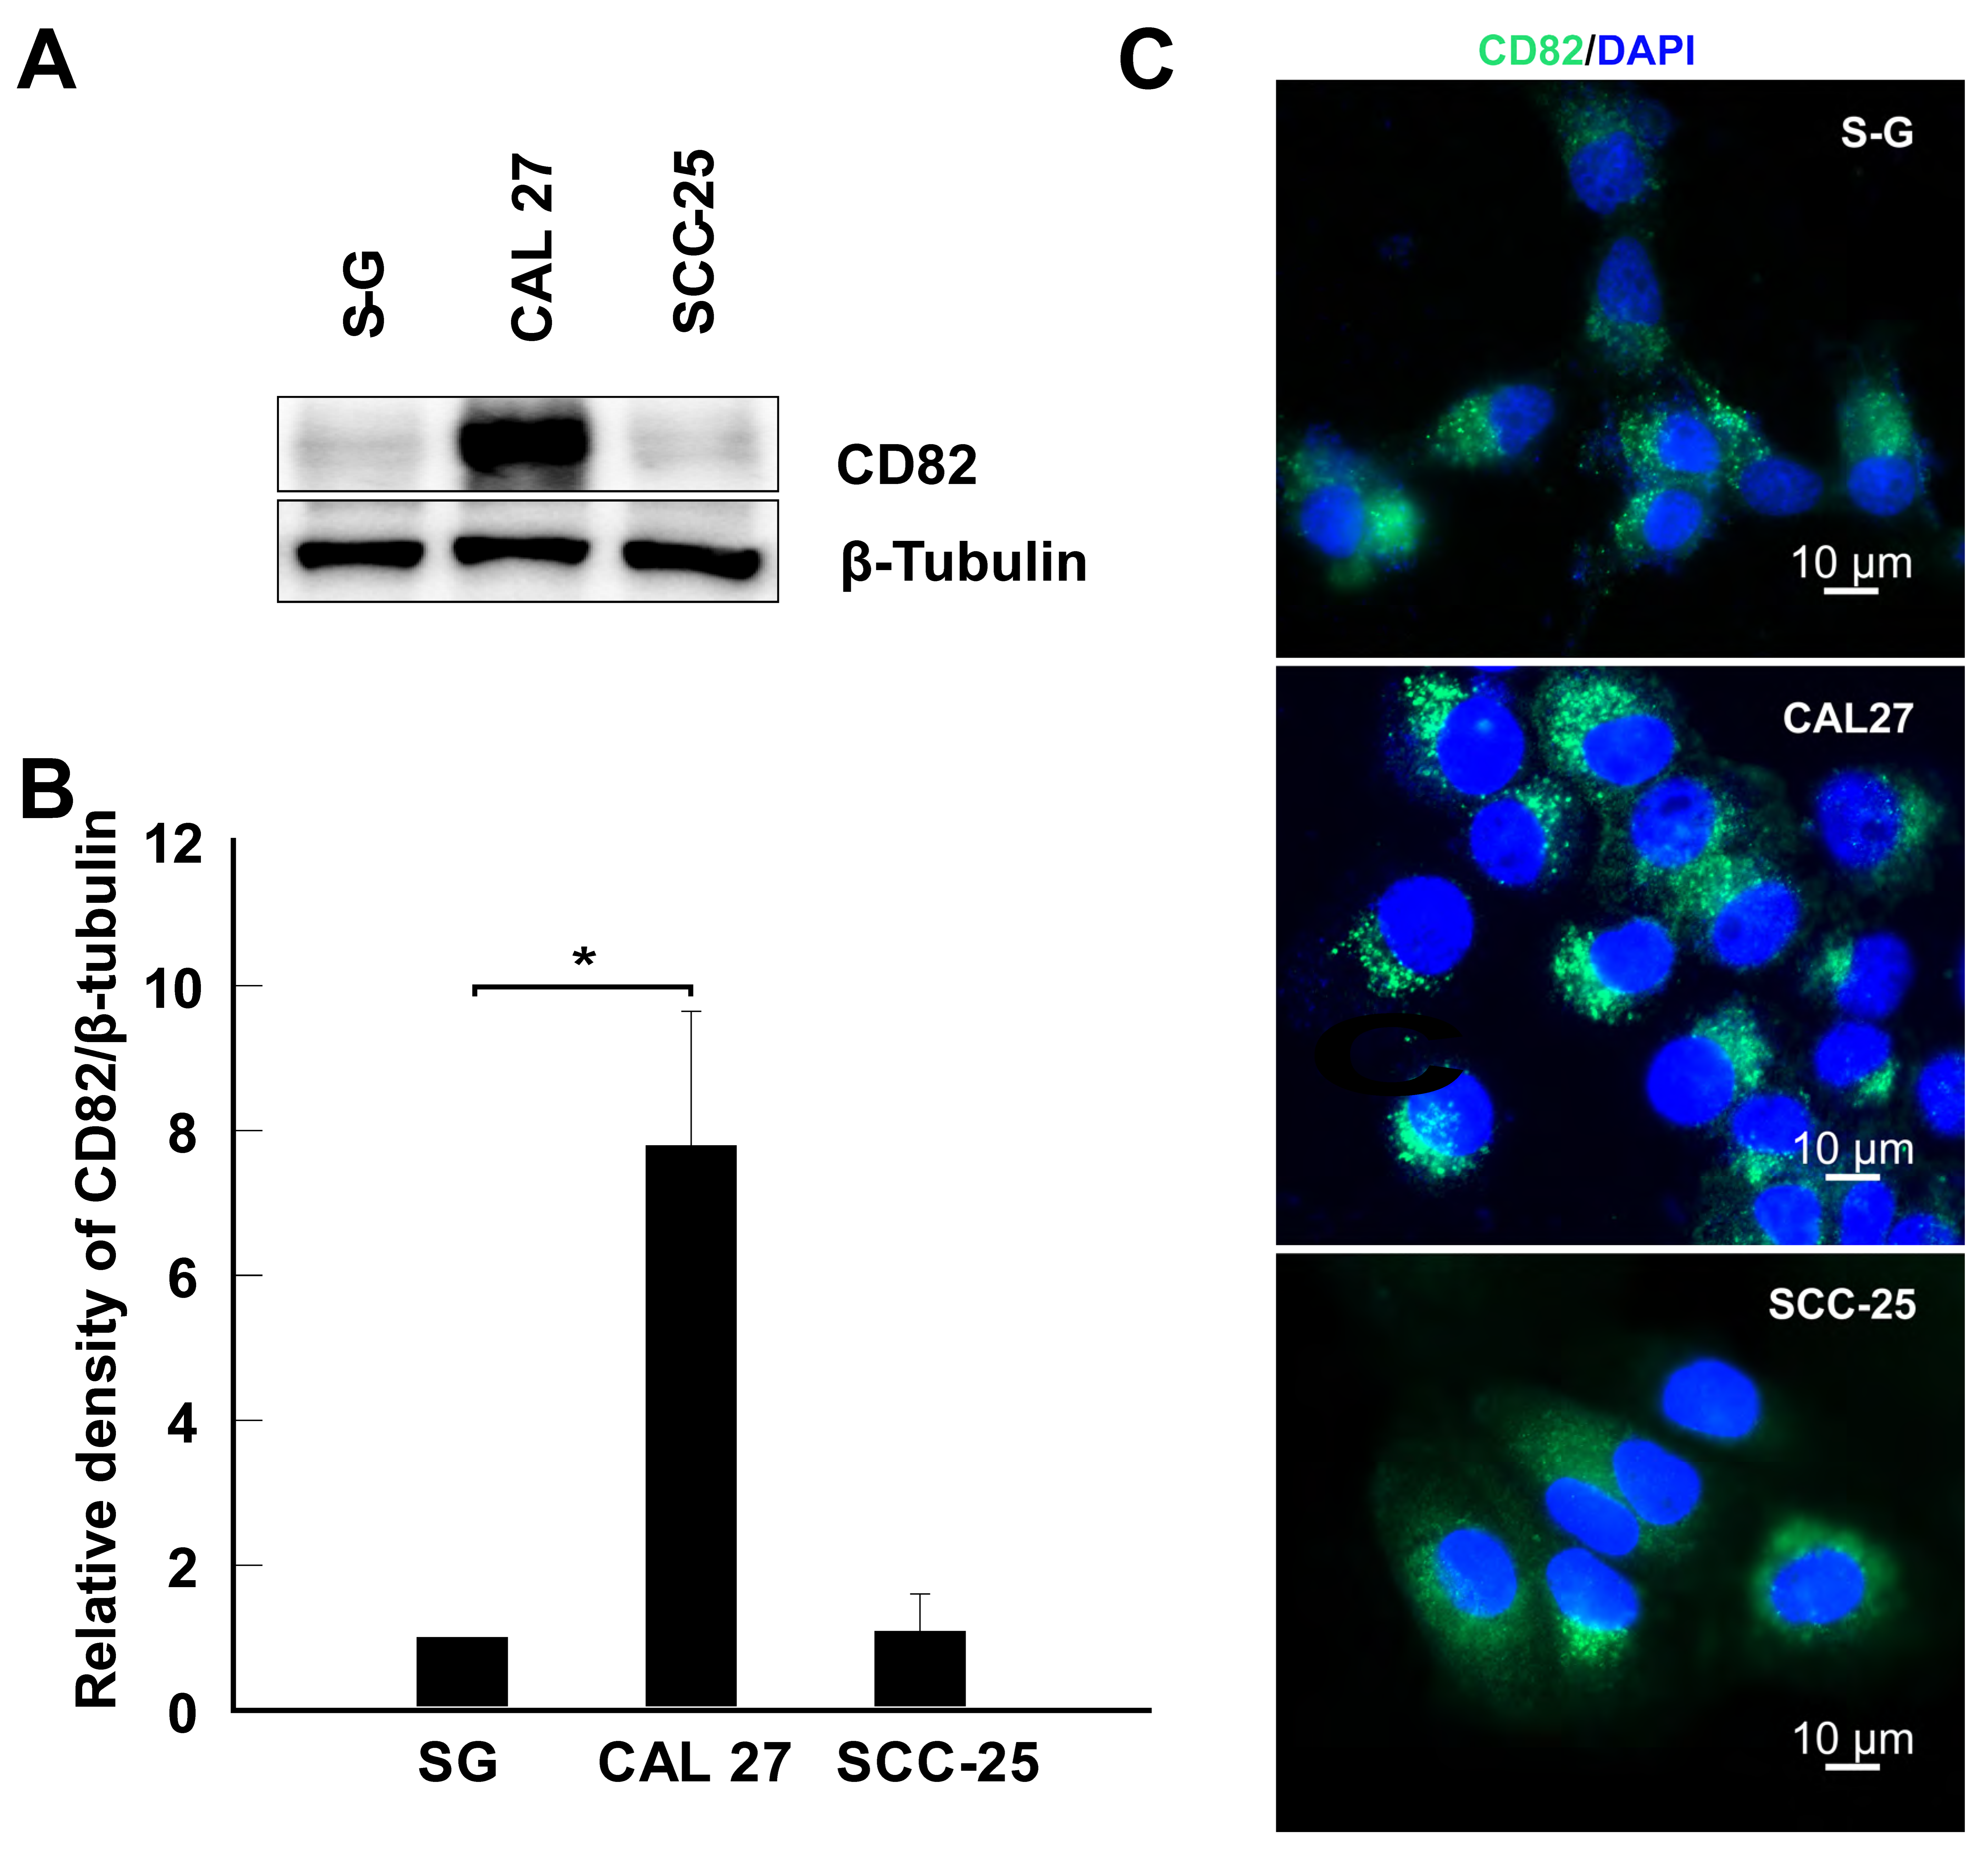
Abstract
:1. Introduction
2. Results
2.1. CD82 Is Upregulated in CAL 27 Cells
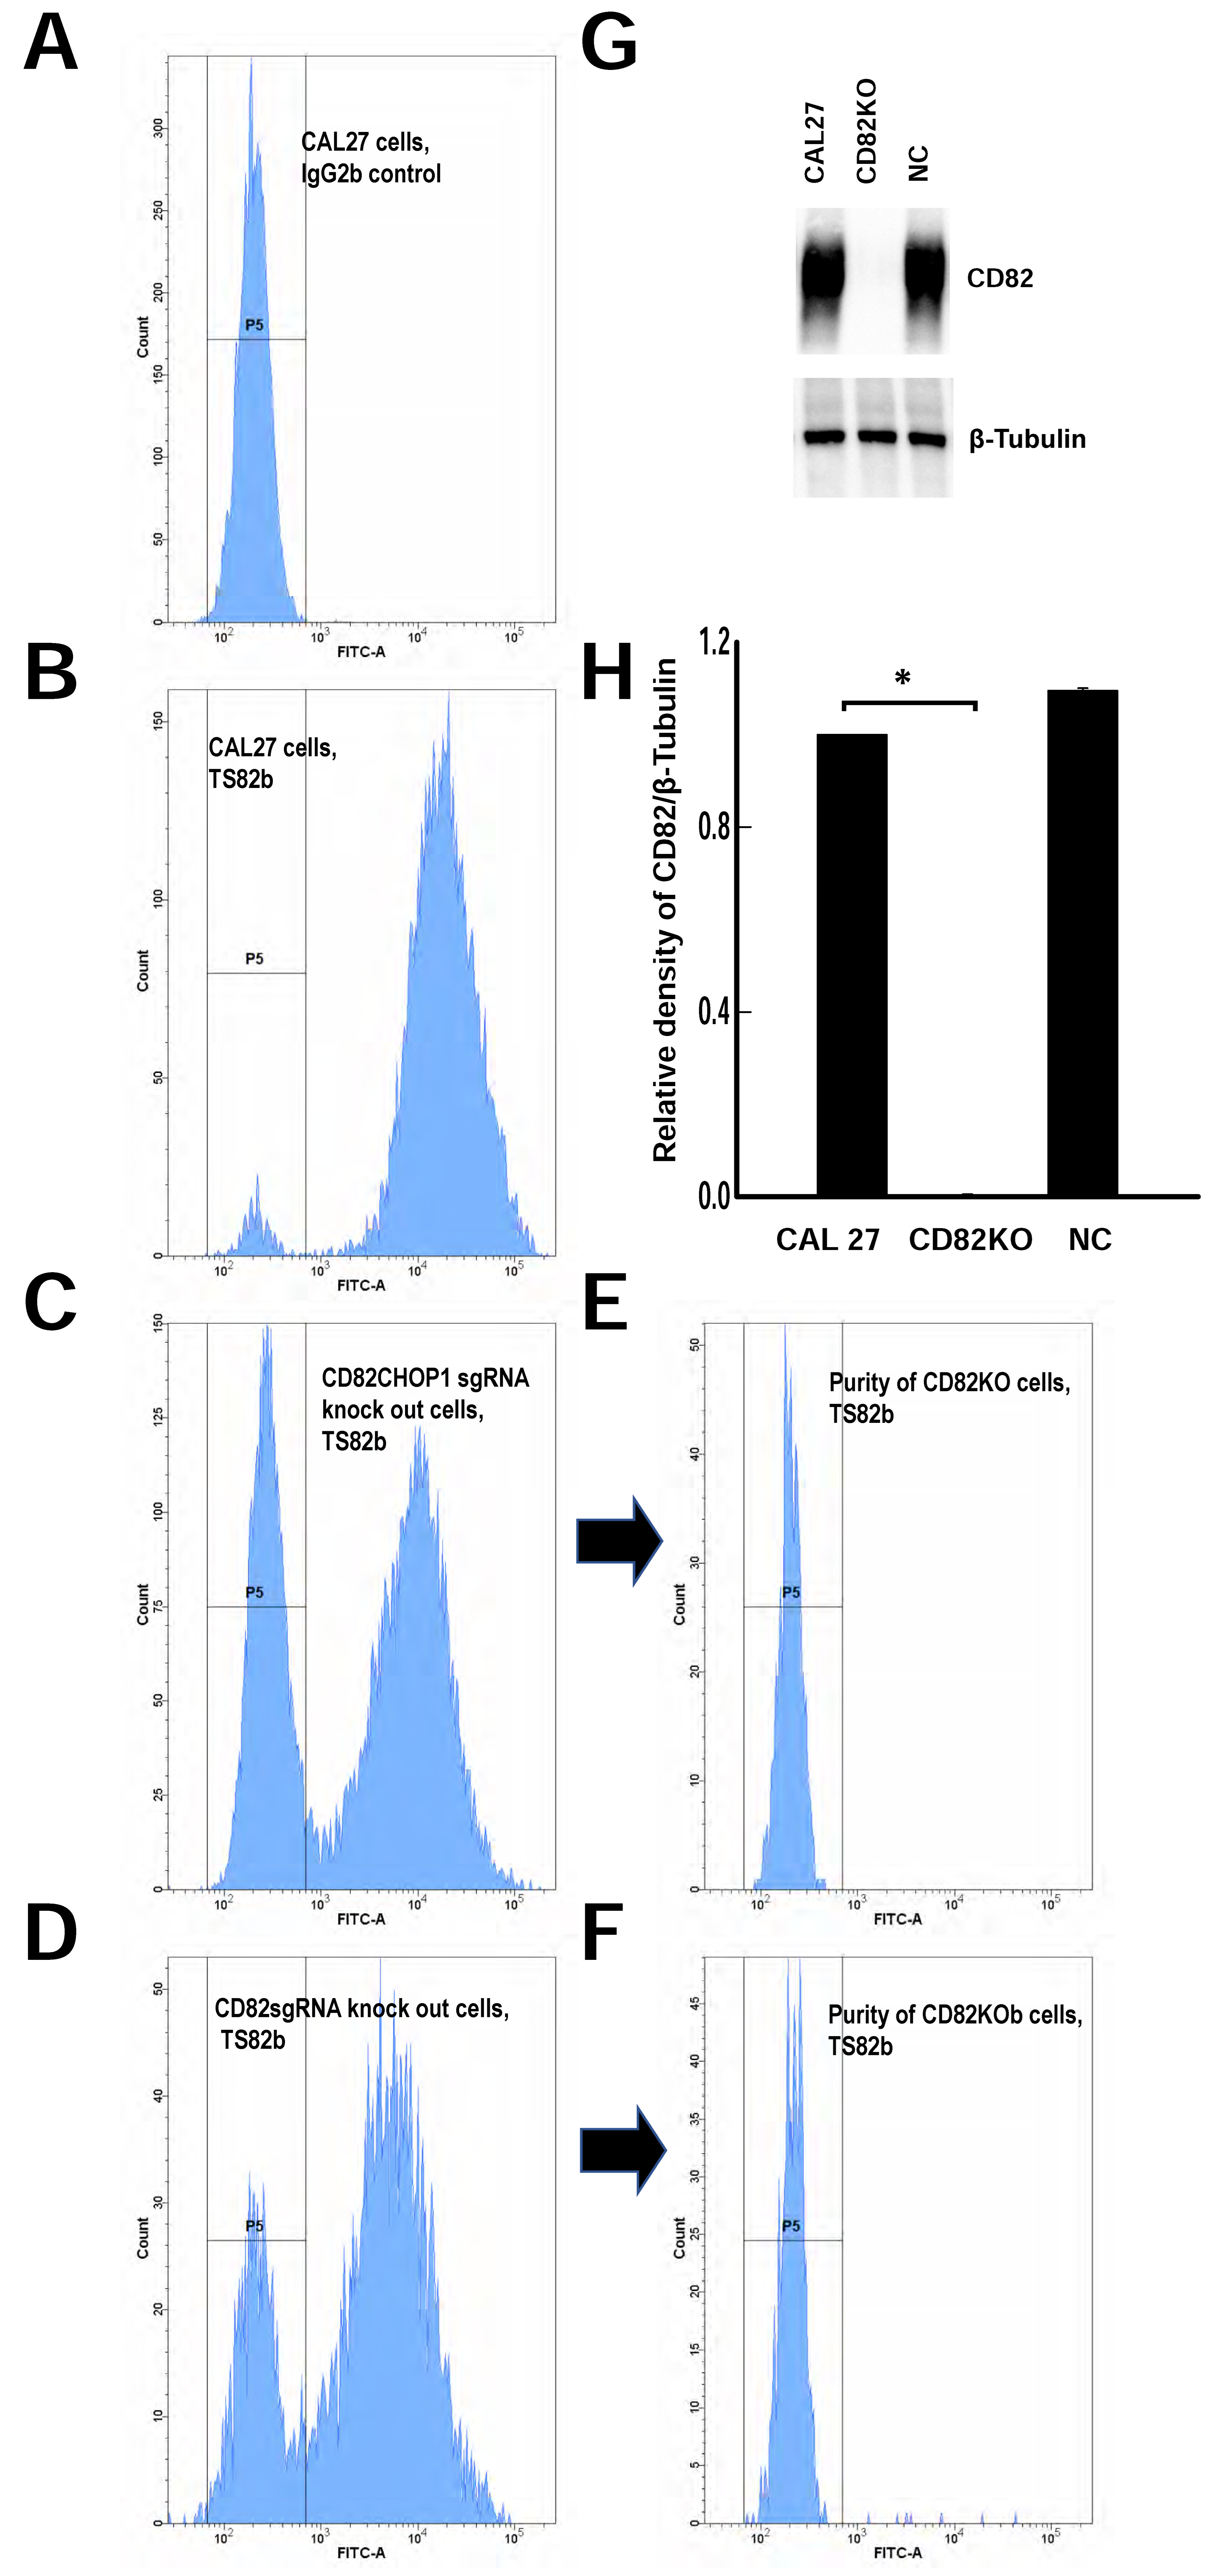
2.2. Generating CD82 Knockout CAL 27 Cells Using CRISPR-Cas9
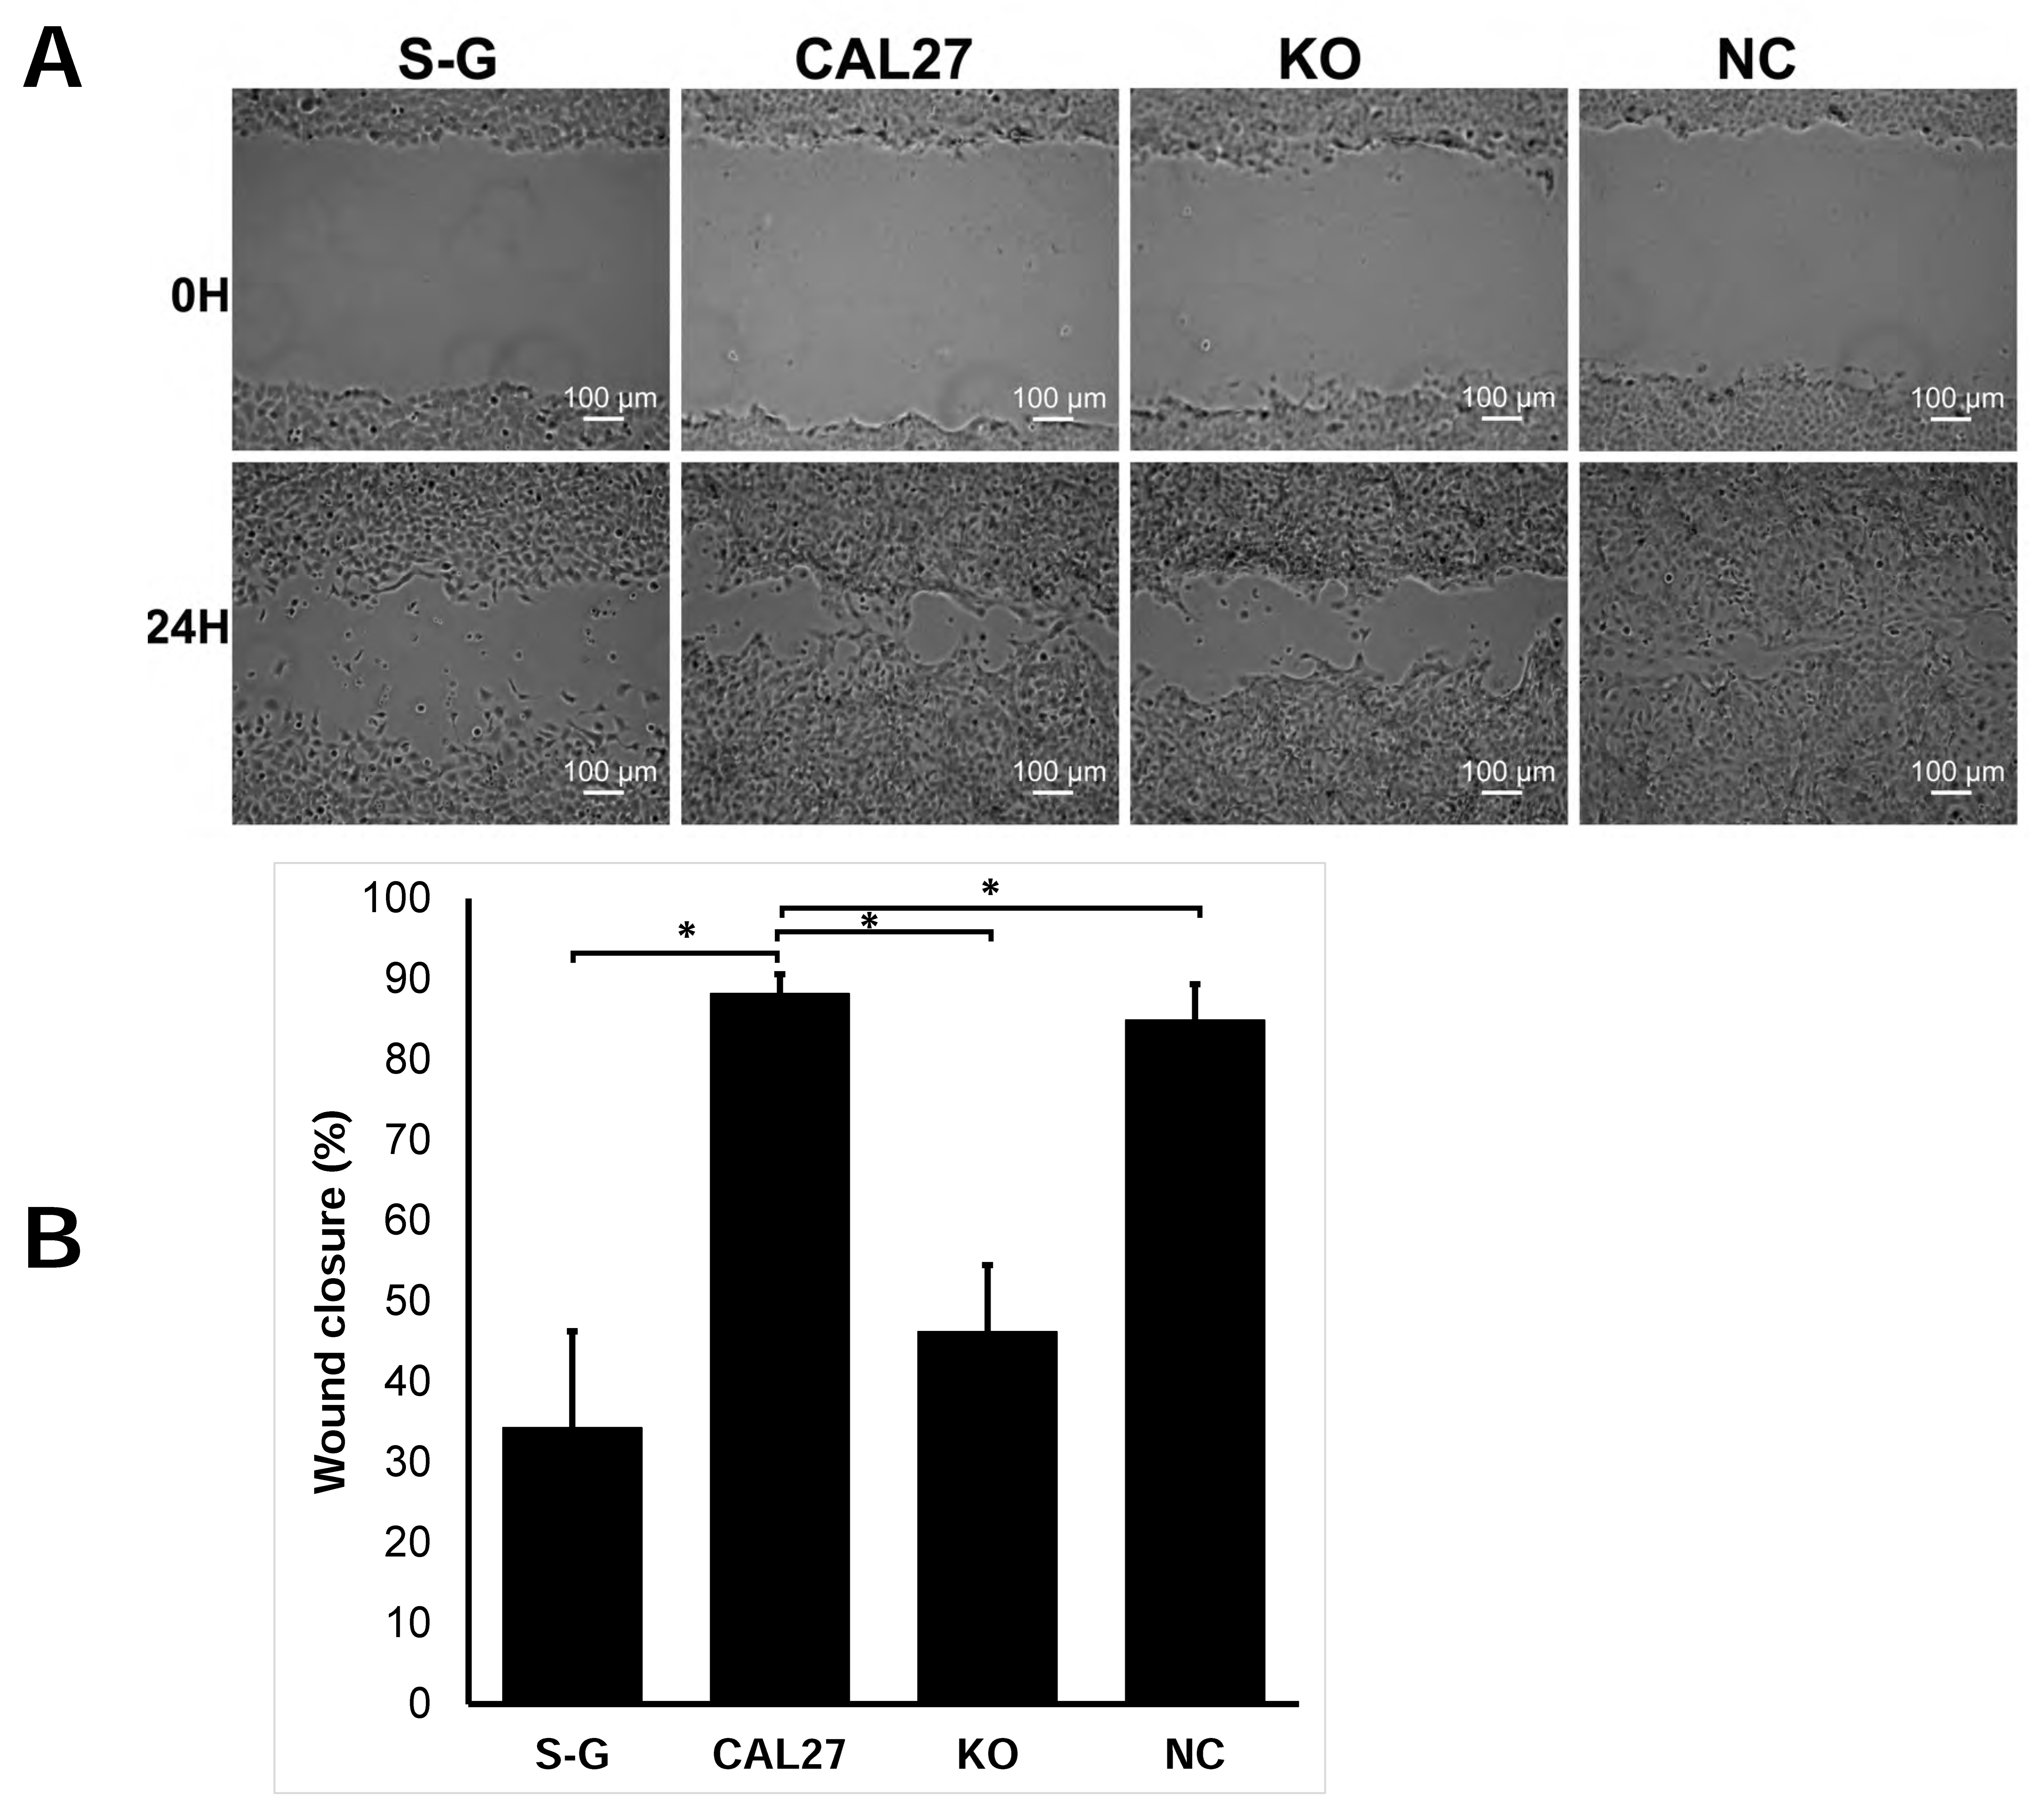
2.3. CD82 Knockout Inhibits Cell Migration
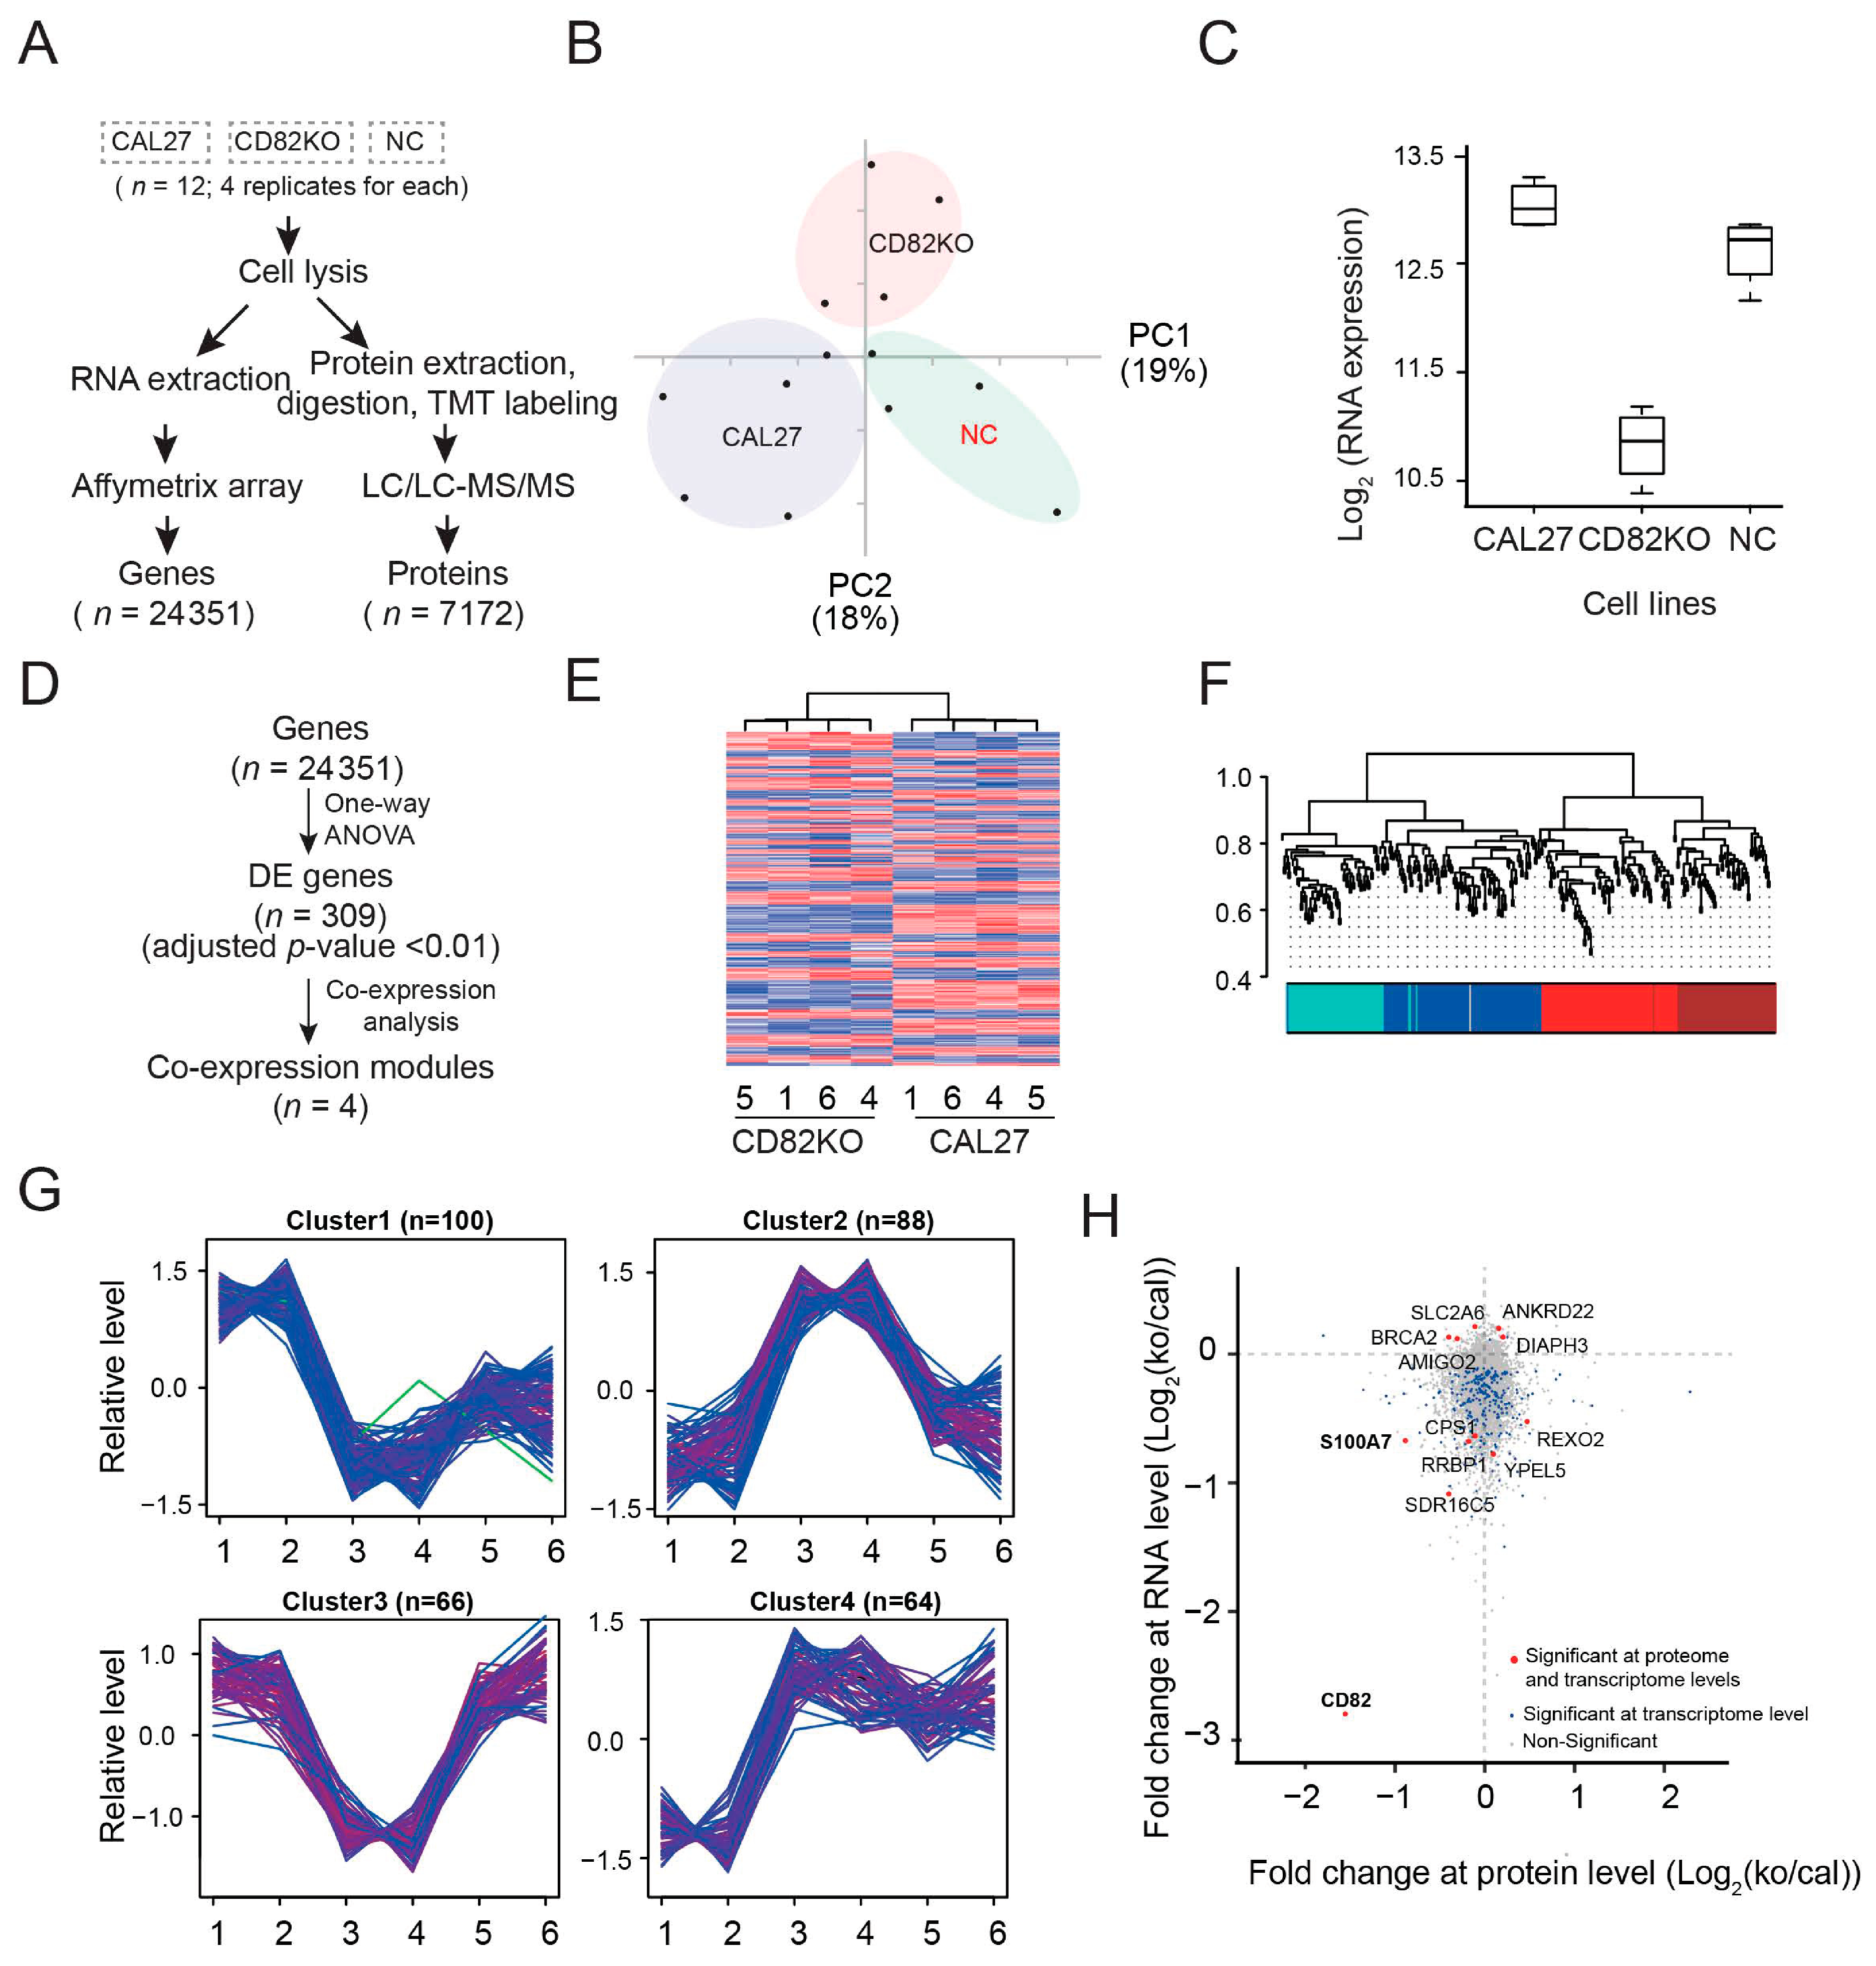
2.4. Transcriptomics and Proteomics Data Showed That CD82 Correlates with and May Regulate the Expression of S100 Family Members
2.5. Experiments Validated the Omics Results Show That CD82 Correlates with and May Regulate the Expression of S100 Family Members
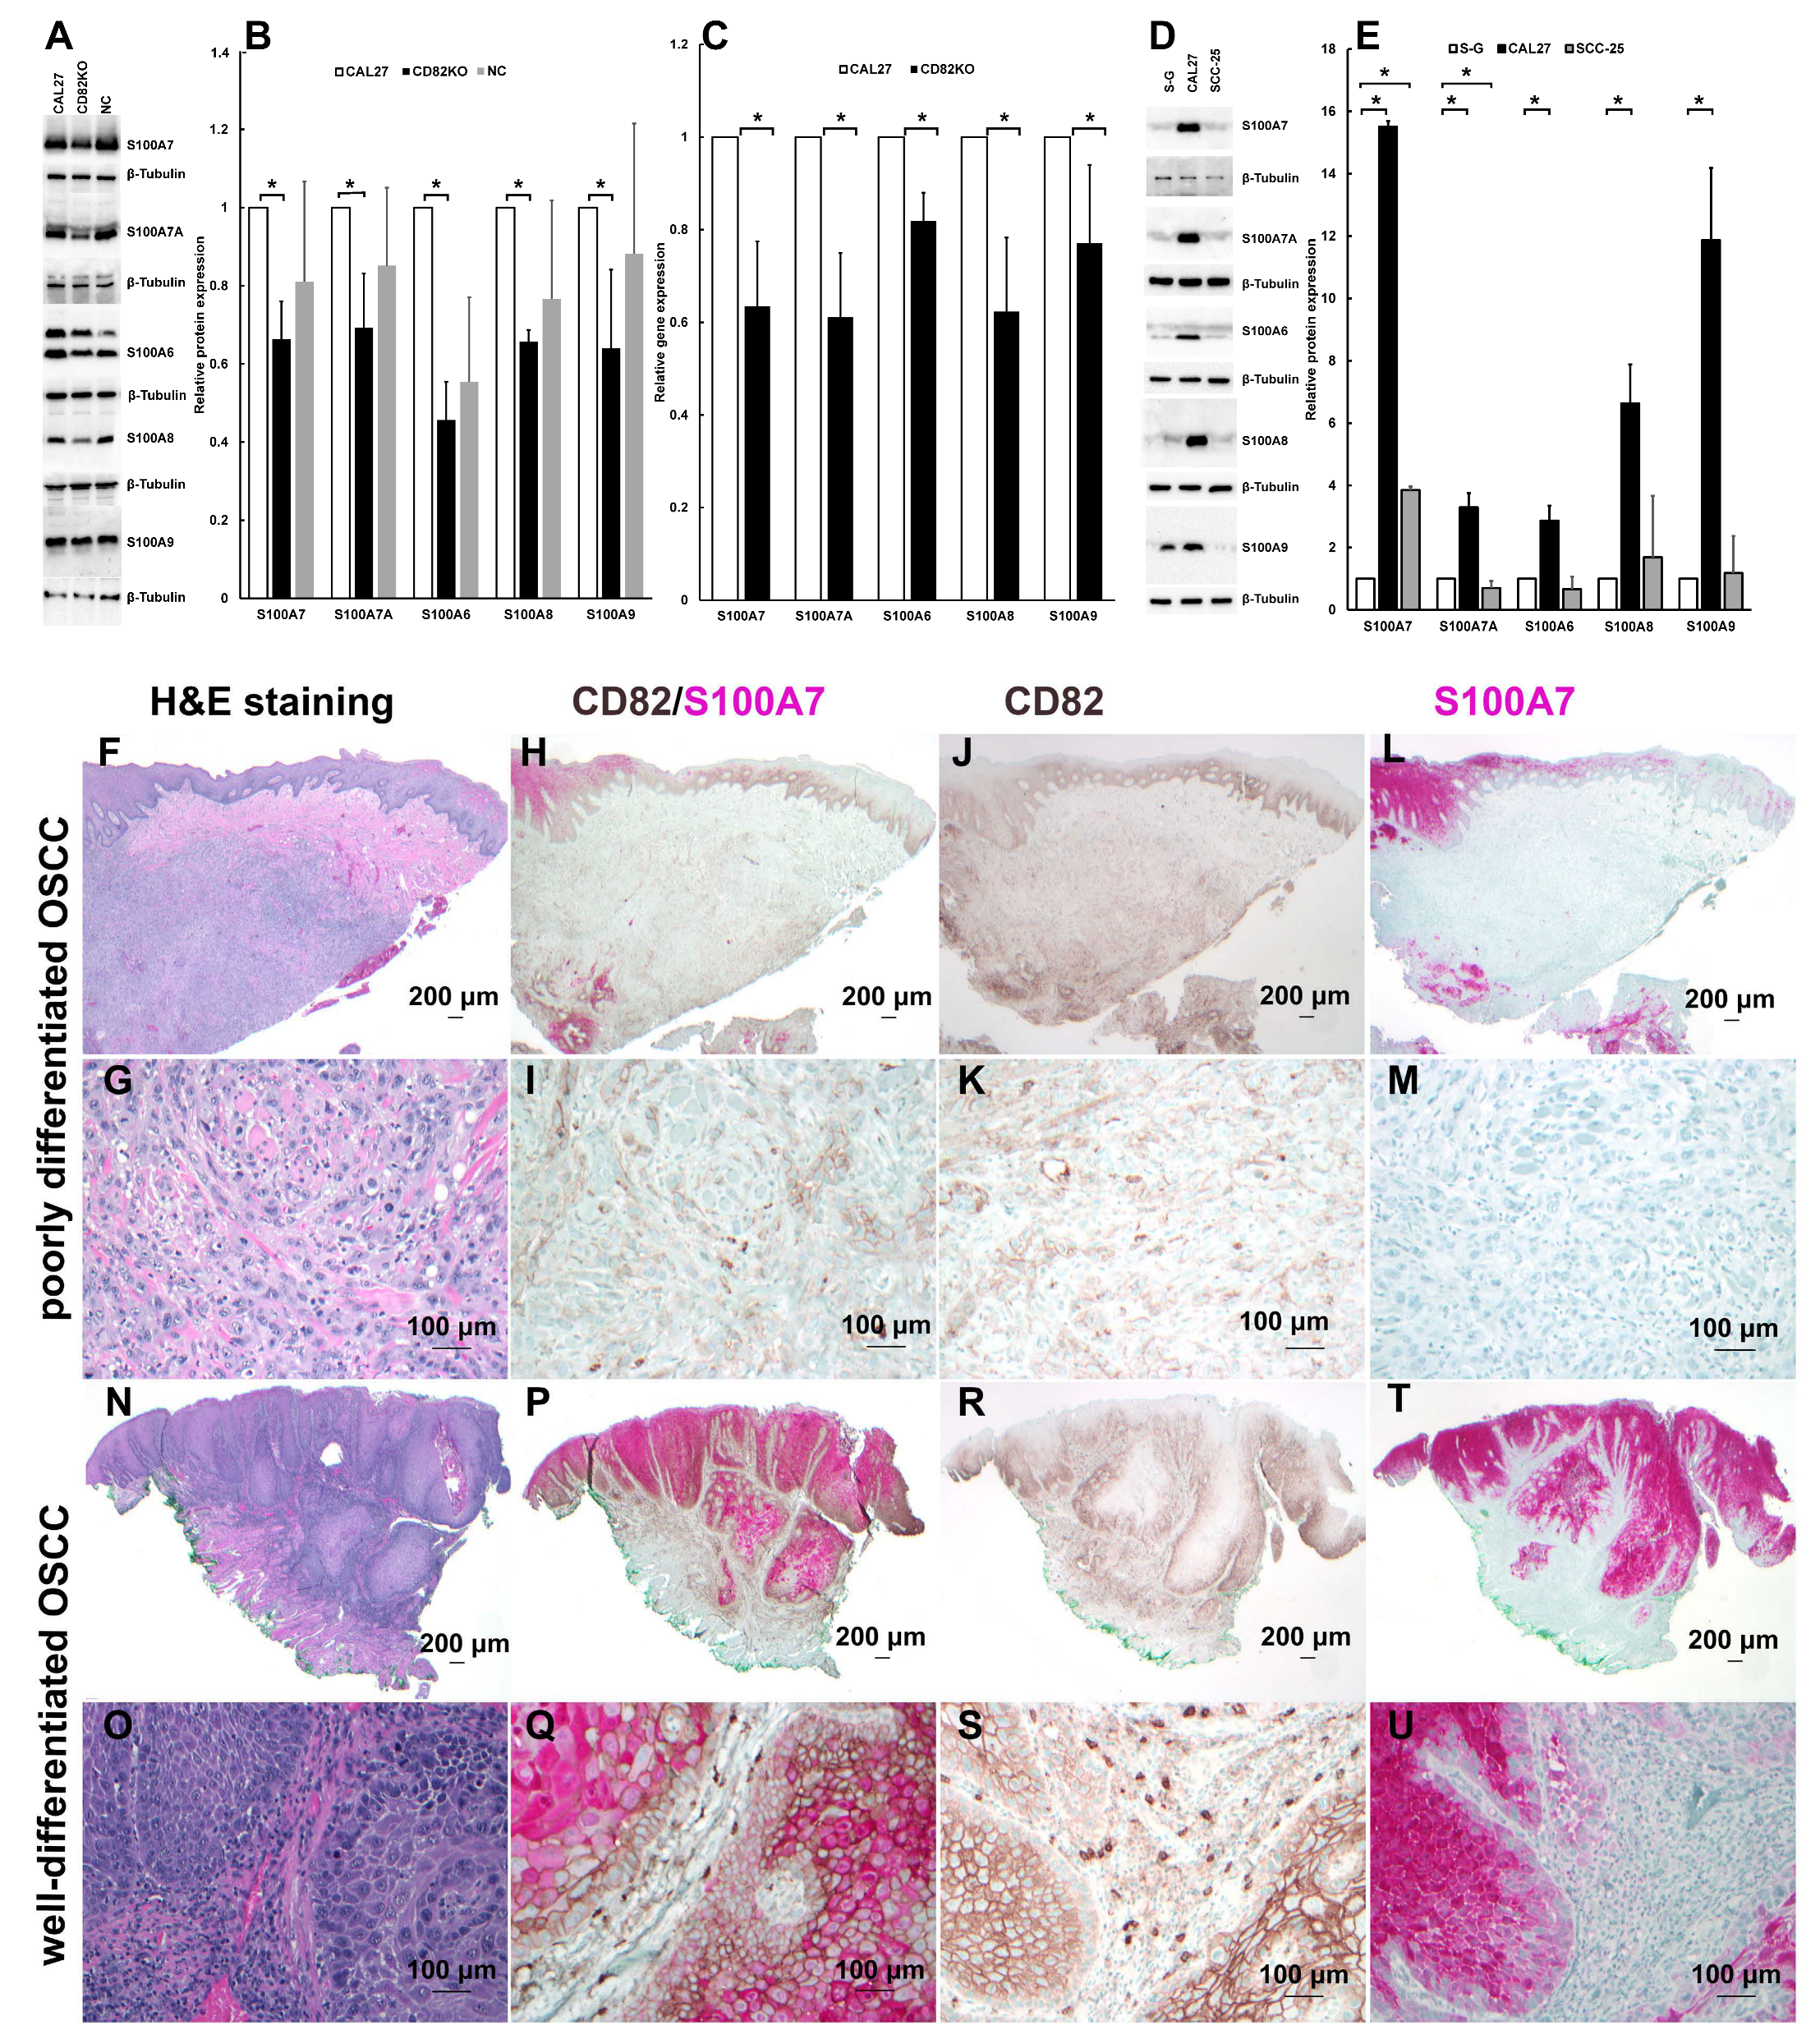
2.5.1. Real-Time PCR and Western Blotting Confirmed That CD82 Expression Correlates with and May Regulate S100 Proteins in CAL 27 and CD82KO Cells
2.5.2. The Expression Levels of S100 Proteins Correlate to CD82 in CAL 27, SCC-25, and S-G Cells
2.5.3. CD82 Correlates with and May Regulate S100A7 Expression in OSCC Tissue
2.6. Molecular Mechanisms of the Upregulation and Function of CD82 in CAL 27
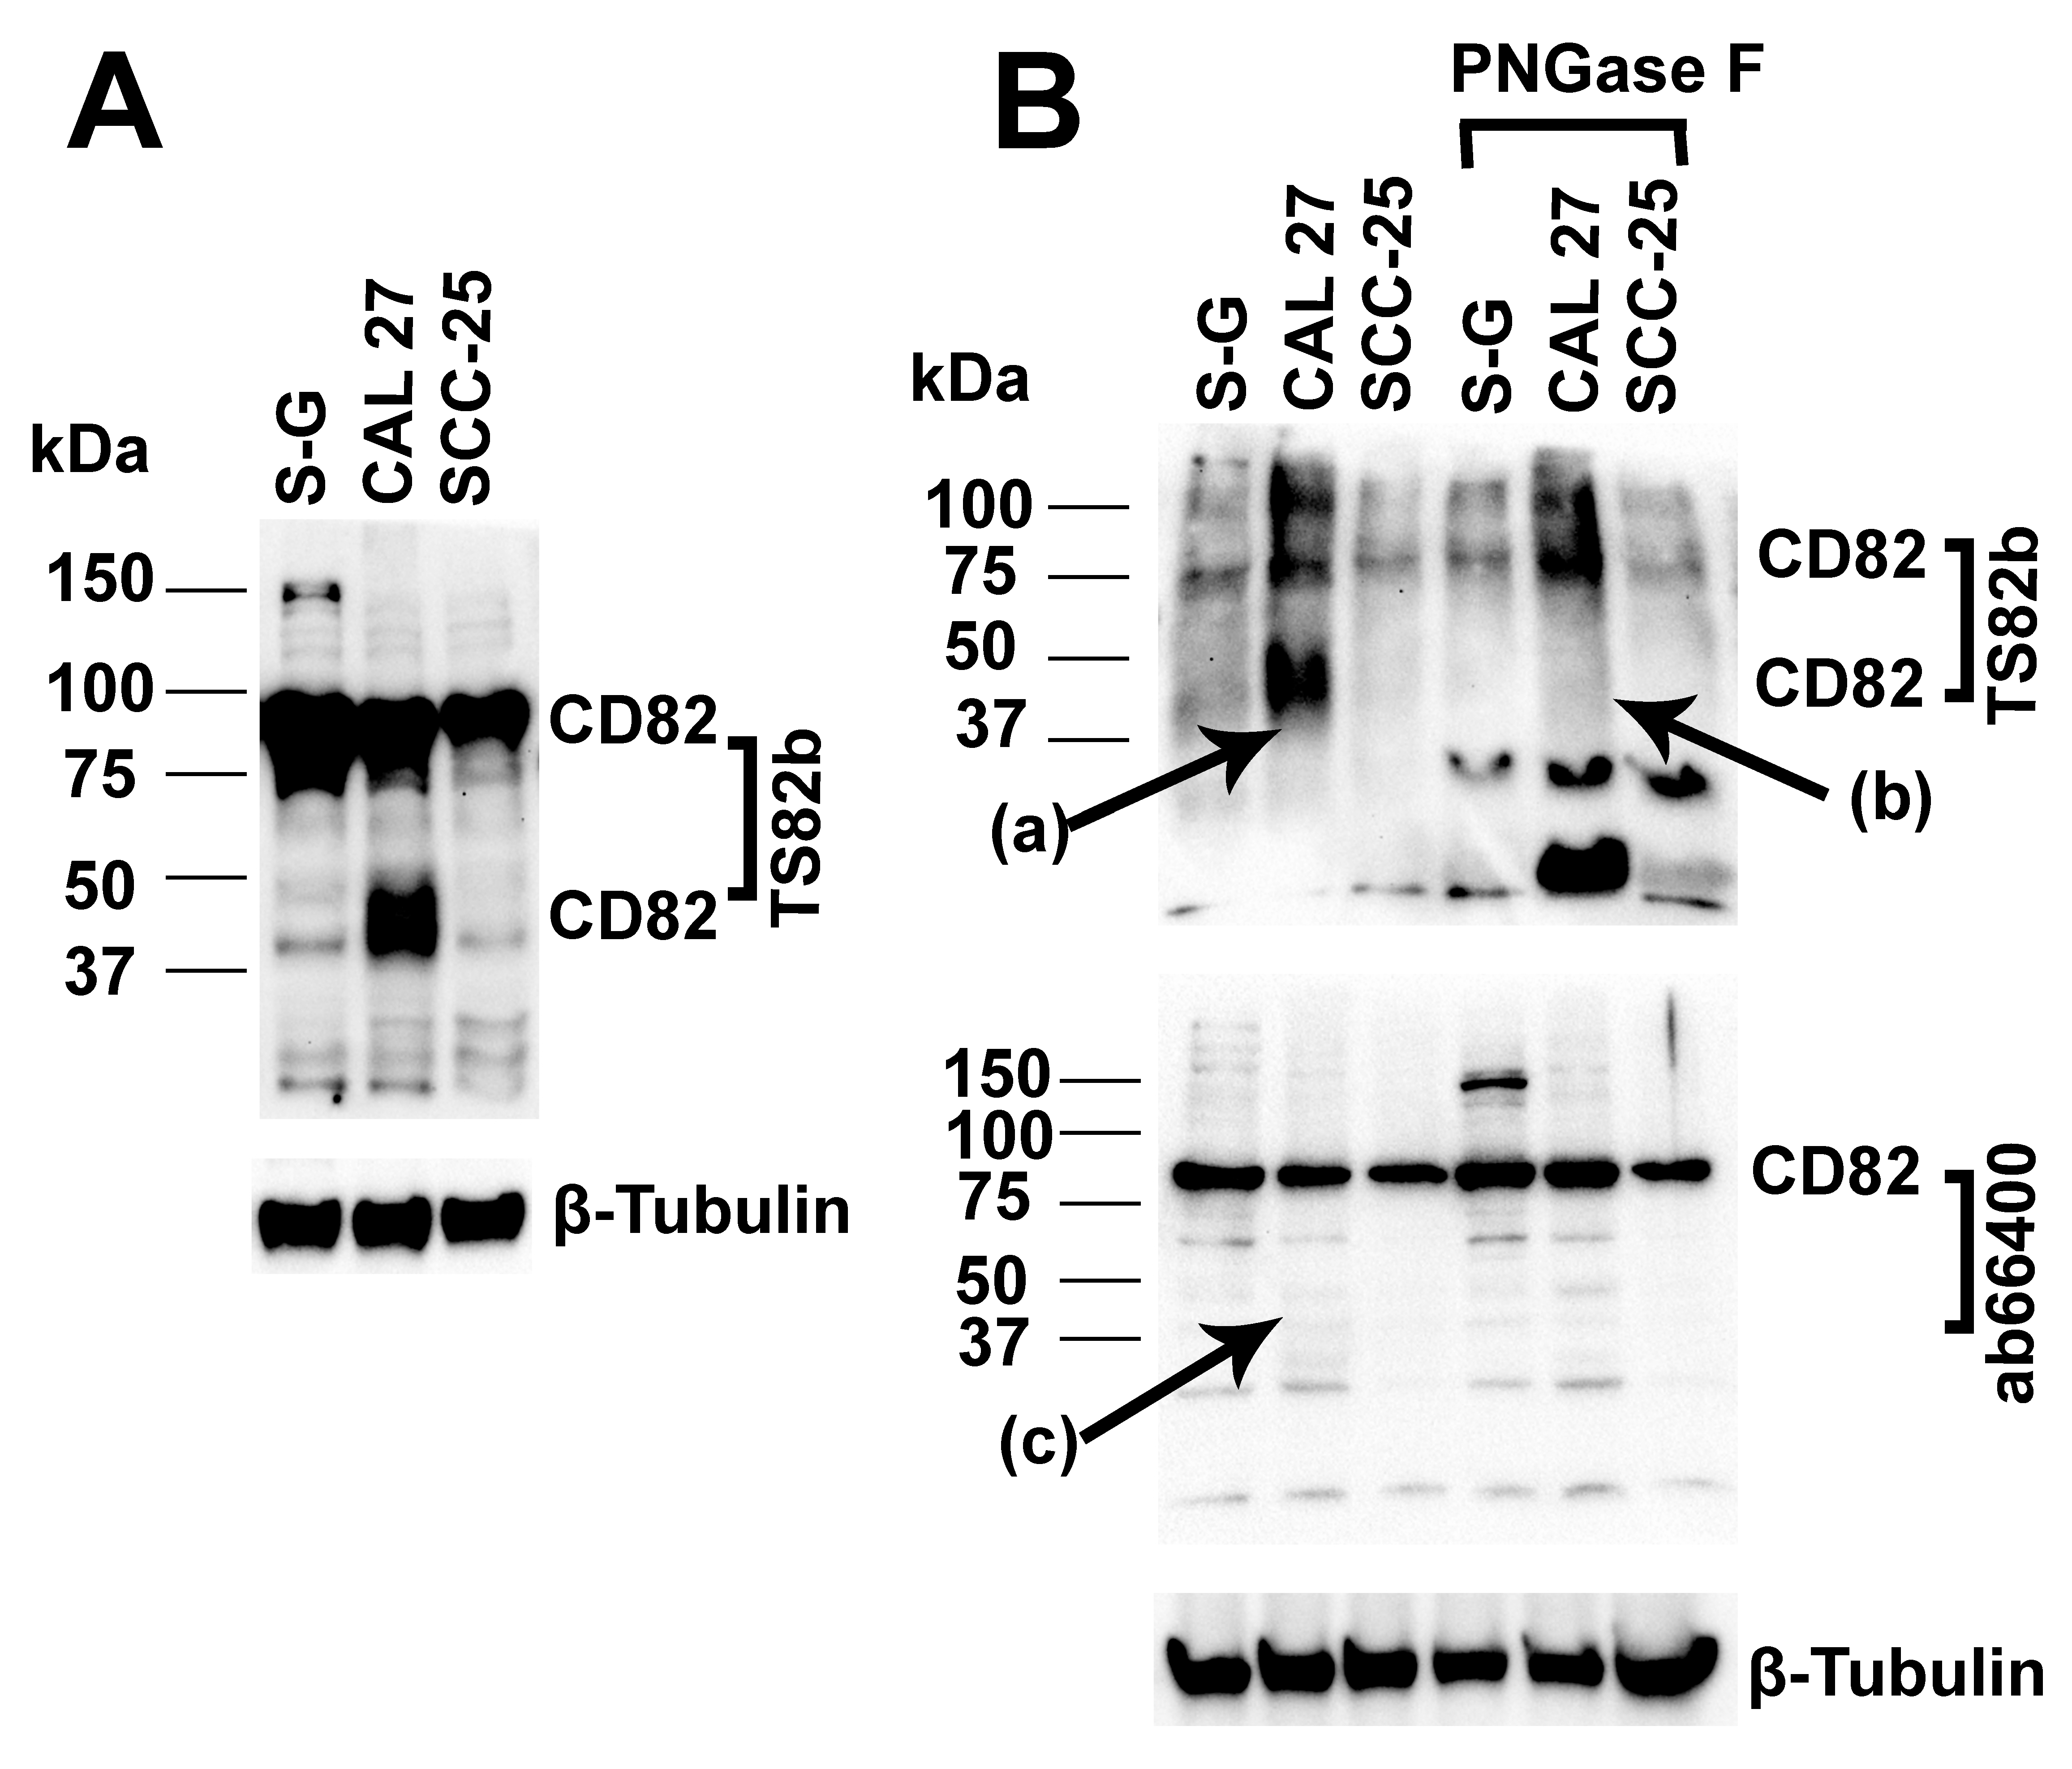
2.6.1. The 37–50 kDa CD82 Protein in CAL 27 Cells Is the Major CD82 Protein Molecule Upregulated in CAL 27 Compared to S-G Cells
2.6.2. The 37–50 kDa CD82 Protein in CAL 27 Cells Is Glycosylated
2.6.3. The 37–50 kDa CD82 Protein in CAL 27 Cells Is Truncated and Lacks an Intact C-Terminus
3. Discussion
4. Materials and Methods
4.1. Cell Lines
4.2. Immunoblotting
4.3. Immunofluorescence Microscopy
4.4. Generate CD82 Knockout CAL 27 Cells Using CRISPR-Cas9
4.5. CD82 Immunofluorescence Staining and Flow-Activated Cell Sorter (FACS)
4.6. Wound Healing Assay
4.7. Microarray Transcriptomics in CAL 27 and CD82KO Cells
Data Analysis
4.8. Proteomics and Proteins Profiling
4.8.1. Sample Processing
4.8.2. LC-MS/MS
4.8.3. Post-Acquisition Analysis of Raw MS Data
4.9. Primers and Probes
4.10. CD82 and S100A7 Single and Dual Staining IHC in FFPE Human OSCC Tissue
4.11. Glycoprotein Deglycosylation and Truncated CD82 Detection
4.12. Statistical Analysis
5. Conclusions
Supplementary Materials
Author Contributions
Funding
Institutional Review Board Statement
Informed Consent Statement
Data Availability Statement
Acknowledgments
Conflicts of Interest
References
- Lee, J.H.; Seo, Y.-W.; Park, S.R.; Kim, Y.J.; Kim, K.K. Expression of a splice variant of KAI1, a tumor metastasis suppressor gene, influences tumor invasion and progression. Cancer Res. 2003, 63, 7247–7255. [Google Scholar]
- Upheber, S.; Karle, A.; Miller, J.; Schlaugk, S.; Gross, E.; Reuning, U. Alternative splicing of KAI1 abrogates its tumor-suppressive effects on integrin alphavbeta3-mediated ovarian cancer biology. Cell Signal 2015, 27, 652–662. [Google Scholar] [CrossRef]
- Tonoli, H.; Barrett, J.C. CD82 metastasis suppressor gene: A potential target for new therapeutics? Trends Mol. Med. 2005, 11, 563–570. [Google Scholar] [CrossRef] [PubMed]
- Liu, W.M.; Zhang, X.A. KAI1/CD82, a tumor metastasis suppressor. Cancer Lett. 2006, 240, 183–194. [Google Scholar] [CrossRef] [PubMed]
- Miranti, C.K. Controlling cell surface dynamics and signaling: How CD82/KAI1 suppresses metastasis. Cell Signal 2009, 21, 196–211. [Google Scholar] [CrossRef] [PubMed]
- Surveillance Epidemiology and End Results (SEER) Program. SEER*Stat Database: Cancer Stat Facts. Available online: www.seer.cancer.gov (accessed on 6 June 2022).
- Geradts, J.; Maynard, R.; Birrer, M.J.; Hendricks, D.; Abbondanzo, S.L.; Fong, K.M.; Barrett, J.C.; Lombardi, D.P. Frequent loss of KAI1 expression in squamous and lymphoid neoplasms. An immunohistochemical study of archival tissues. Am. J. Pathol. 1999, 154, 1665–1671. [Google Scholar] [CrossRef] [PubMed]
- Imai, Y.; Sasaki, T.; Shinagawa, Y.; Akimoto, K.; Fujibayashi, T. Expression of metastasis suppressor gene (KAI1/CD82) in oral squamous cell carcinoma and its clinico-pathological significance. Oral. Oncol. 2002, 38, 557–561. [Google Scholar] [CrossRef] [PubMed]
- Uzawa, K.; Ono, K.; Suzuki, H.; Tanaka, C.; Yakushiji, T.; Yamamoto, N.; Yokoe, H.; Tanzawa, H. High prevalence of decreased expression of KAI1 metastasis suppressor in human oral carcinogenesis. Clin. Cancer Res. 2002, 8, 828–835. [Google Scholar] [PubMed]
- Buim, M.E.; Lourenco, S.V.; Carvalho, K.C.; Cardim, R.; Pereira, C.; Carvalho, A.L.; Fregnani, J.H.; Soares, F.A. Downregulation of CD9 protein expression is associated with aggressive behavior of oral squamous cell carcinoma. Oral. Oncol. 2010, 46, 166–171. [Google Scholar] [CrossRef] [PubMed]
- Farhadieh, R.D.; Smee, R.; Ow, K.; Yang, J.L.; Russell, P.J.; Crouch, R.; Jackson, P.; Jacobson, I.V. Down-regulation of KAI1/CD82 protein expression in oral cancer correlates with reduced disease free survival and overall patient survival. Cancer Lett. 2004, 213, 91–98. [Google Scholar] [CrossRef]
- Kawasaki, G.; Yoshitomi, I.; Yanamoto, S.; Yamada, S.; Mizuno, A.; Umeda, M. Expression of thymidylate synthase and dihydropyrimidine dehydrogenase in primary oral squamous cell carcinoma and corresponding metastases in cervical lymph nodes: Association with the metastasis suppressor CD82. Anticancer. Res. 2011, 31, 3521–3526. [Google Scholar] [PubMed]
- Chai, J.; Du, L.; Ju, J.; Ma, C.; Shen, Z.; Yang, X.; Liang, L.; Ni, Q.; Sun, M. Overexpression of KAI1/CD82 suppresses in vitro cell growth, migration, invasion and xenograft growth in oral cancer. Mol. Med. Rep. 2017, 15, 1527–1532. [Google Scholar] [CrossRef]
- Nichols, A.C.; Yoo, J.; Palma, D.A.; Fung, K.; Franklin, J.H.; Koropatnick, J.; Mymryk, J.S.; Batada, N.N.; Barrett, J.W. Frequent mutations in TP53 and CDKN2A found by next-generation sequencing of head and neck cancer cell lines. Arch. Otolaryngol. Head Neck Surg. 2012, 138, 732–739. [Google Scholar] [CrossRef] [PubMed]
- Tate, J.G.; Bamford, S.; Jubb, H.C.; Sondka, Z.; Beare, D.M.; Bindal, N.; Boutselakis, H.; Cole, C.G.; Creatore, C.; Dawson, E.; et al. COSMIC: The Catalogue of Somatic Mutations in Cancer. Nucleic Acids Res. 2018, 47, D941–D947. [Google Scholar] [CrossRef] [PubMed]
- Bamford, S.; Dawson, E.; Forbes, S.; Clements, J.; Pettett, R.; Dogan, A.; Flanagan, A.; Teague, J.; Futreal, P.A.; Stratton, M.R.; et al. The COSMIC (Catalogue of Somatic Mutations in Cancer) database and website. Br. J. Cancer 2004, 91, 355–358. [Google Scholar] [CrossRef] [PubMed]
- Rheinwald, J.G.; Beckett, M.A. Tumorigenic keratinocyte lines requiring anchorage and fibroblast support cultured from human squamous cell carcinomas. Cancer Res. 1981, 41, 1657–1663. [Google Scholar]
- Ang, K.K.; Harris, J.; Wheeler, R.; Weber, R.; Rosenthal, D.I.; Nguyen-Tân, P.F.; Westra, W.H.; Chung, C.H.; Jordan, R.C.; Lu, C.; et al. Human Papillomavirus and Survival of Patients with Oropharyngeal Cancer. N. Engl. J. Med. 2010, 363, 24–35. [Google Scholar] [CrossRef]
- White, A.; Lamb, P.W.; Barrett, J.C. Frequent downregulation of the KAI1(CD82) metastasis suppressor protein in human cancer cell lines. Oncogene 1998, 16, 3143–3149. [Google Scholar] [CrossRef]
- Ono, M.; Handa, K.; Withers, D.A.; Hakomori, S. Glycosylation effect on membrane domain (GEM) involved in cell adhesion and motility: A preliminary note on functional alpha3, alpha5-CD82 glycosylation complex in ldlD 14 cells. Biochem. Biophys. Res. Commun. 2000, 279, 744–750. [Google Scholar] [CrossRef]
- Kussaibi, H.; Alkharsah, K.R.; Altamimi, D.; Alsayyah, A.; Hadi, M.A.; Alsulami, E.M.A. Alternative splicing is an important mechanism behind KAI1 loss of function in breast cancer patients from Saudi Arabia. Breast Cancer Res. Treat. 2019, 173, 87–91. [Google Scholar] [CrossRef]
- Winston, J.; Wolf, R. Psoriasin (S100A7) promotes migration of a squamous carcinoma cell line. J. Dermatol. Sci. 2012, 67, 205–207. [Google Scholar] [CrossRef]
- Wolf, R.; Voscopoulos, C.; Winston, J.; Dharamsi, A.; Goldsmith, P.; Gunsior, M.; Vonderhaar, B.K.; Olson, M.; Watson, P.H.; Yuspa, S.H. Highly homologous hS100A15 and hS100A7 proteins are distinctly expressed in normal breast tissue and breast cancer. Cancer Lett. 2009, 277, 101–107. [Google Scholar] [CrossRef] [PubMed]
- Moubayed, N.; Weichenthal, M.; Harder, J.; Wandel, E.; Sticherling, M.; Gläser, R. Psoriasin (S100A7) is significantly up-regulated in human epithelial skin tumours. J. Cancer Res. Clin. Oncol. 2007, 133, 253–261. [Google Scholar] [CrossRef] [PubMed]
- Celis, J.E.; Rasmussen, H.H.; Vorum, H.; Madsen, P.; Honoré, B.; Wolf, H.; Orntoft, T.F. Bladder squamous cell carcinomas express psoriasin and externalize it to the urine. J. Urol. 1996, 155, 2105–2112. [Google Scholar] [CrossRef] [PubMed]
- Leygue, E.; Snell, L.; Hiller, T.; Dotzlaw, H.; Hole, K.; Murphy, L.C.; Watson, P.H. Differential expression of psoriasin messenger RNA between in situ and invasive human breast carcinoma. Cancer Res. 1996, 56, 4606–4609. [Google Scholar]
- Tripathi, S.C.; Matta, A.; Kaur, J.; Grigull, J.; Chauhan, S.S.; Thakar, A.; Shukla, N.K.; Duggal, R.; DattaGupta, S.; Ralhan, R. Nuclear S100A7 is associated with poor prognosis in head and neck cancer. PLoS ONE 2010, 5, e11939. [Google Scholar] [CrossRef] [PubMed]
- Nasser, M.W.; Qamri, Z.; Deol, Y.S.; Ravi, J.; Powell, C.A.; Trikha, P.; Schwendener, R.A.; Bai, X.F.; Shilo, K.; Zou, X.; et al. S100A7 enhances mammary tumorigenesis through upregulation of inflammatory pathways. Cancer Res. 2012, 72, 604–615. [Google Scholar] [CrossRef]
- Hu, M.; Ye, L.; Ruge, F.; Zhi, X.; Zhang, L.; Jiang, W.G. The clinical significance of Psoriasin for non-small cell lung cancer patients and its biological impact on lung cancer cell functions. BMC Cancer 2012, 12, 588. [Google Scholar] [CrossRef]
- Tyszkiewicz, T.; Jarzab, M.; Szymczyk, C.; Kowal, M.; Krajewska, J.; Jaworska, M.; Fraczek, M.; Krajewska, A.; Hadas, E.; Swierniak, M.; et al. Epidermal differentiation complex (locus 1q21) gene expression in head and neck cancer and normal mucosa. Folia Histochem. Cytobiol. 2014, 52, 79–89. [Google Scholar] [CrossRef]
- Kesting, M.R.; Stoeckelhuber, M.; Kuppek, A.; Hasler, R.; Rohleder, N.; Wolff, K.-D.; Nieberler, M. Human β-defensins and psoriasin/S100A7 expression in salivary glands. BioDrugs 2012, 26, 33–42. [Google Scholar] [CrossRef]
- Qi, Z.; Li, T.; Kong, F.; Li, Y.; Wang, R.; Wang, J.; Xiao, Q.; Zhang, W.; Sun, S.; He, D. The characteristics and function of S100A7 induction in squamous cell carcinoma: Heterogeneity, promotion of cell proliferation and suppression of differentiation. PLoS ONE 2015, 10, e0128887. [Google Scholar] [CrossRef]
- Zhou, G.; Xie, T.; Zhao, M.; Jasser, S.; Younes, M.; Sano, D.; Lin, J.; Kupferman, M.; Santillan, A.; Patel, V. Reciprocal negative regulation between S100A7/psoriasin and β-catenin signaling plays an important role in tumor progression of squamous cell carcinoma of oral cavity. Oncogene 2008, 27, 3527–3538. [Google Scholar] [CrossRef]
- Banerjee, A.G.; Bhattacharyya, I.; Vishwanatha, J.K. Identification of genes and molecular pathways involved in the progression of premalignant oral epithelia. Mol. Cancer Ther. 2005, 4, 865–875. [Google Scholar] [CrossRef]
- Ralhan, R.; DeSouza, L.V.; Matta, A.; Tripathi, S.C.; Ghanny, S.; Datta Gupta, S.; Bahadur, S.; Siu, K.W.M. Discovery and verification of head-and-neck cancer biomarkers by differential protein expression analysis using iTRAQ labeling, multidimensional liquid chromatography, and tandem mass spectrometry. Mol. Cell. Proteom. 2008, 7, 1162–1173. [Google Scholar] [CrossRef] [PubMed]
- Kesting, M.R.; Sudhoff, H.; Hasler, R.J.; Nieberler, M.; Pautke, C.; Wolff, K.D.; Wagenpfeil, S.; Al-Benna, S.; Jacobsen, F.; Steinstraesser, L. Psoriasin (S100A7) up-regulation in oral squamous cell carcinoma and its relation to clinicopathologic features. Oral. Oncol. 2009, 45, 731–736. [Google Scholar] [CrossRef] [PubMed]
- Kaur, J.; Matta, A.; Kak, I.; Srivastava, G.; Assi, J.; Leong, I.; Witterick, I.; Colgan, T.J.; Macmillan, C.; Siu, K.W.; et al. S100A7 overexpression is a predictive marker for high risk of malignant transformation in oral dysplasia. Int. J. Cancer 2014, 134, 1379–1388. [Google Scholar] [CrossRef] [PubMed]
- Jou, Y.J.; Hua, C.H.; Lin, C.D.; Lai, C.H.; Huang, S.H.; Tsai, M.H.; Kao, J.Y.; Lin, C.W. S100A8 as potential salivary biomarker of oral squamous cell carcinoma using nanoLC-MS/MS. Clin. Chim. Acta 2014, 436, 121–129. [Google Scholar] [CrossRef] [PubMed]
- Kengkarn, S.; Petmitr, S.; Boonyuen, U.; Reamtong, O.; Poomsawat, S.; Sanguansin, S. Identification of Novel Candidate Biomarkers for Oral Squamous Cell Carcinoma Based on Whole Gene Expression Profiling. Pathol. Oncol. Res. 2020, 26, 2315–2325. [Google Scholar] [CrossRef] [PubMed]
- McLean, L.; Jackson, M.L.; Armstrong, J.; Poon, A.; Darling, M. Evaluating utility of protein s100a7 in predicting progression of oral epithelial dysplasia. Oral. Surg. Oral. Med. Oral. Pathol. Oral. Radiol. 2019, 128, e75. [Google Scholar] [CrossRef]
- Probstmeier, R.; Kraus, D.; Wenghoefer, M.; Winter, J. S100 proteins as biomarkers in risk estimations for malignant transformation in oral lesions. Methods Mol. Biol. 2019, 1929, 763–771. [Google Scholar]
- Dey, K.K.; Mandal, M. Quantitative proteomic approaches to identify biomarkers for oral cancer & targeting S100A7 by RNA-mediated interference through NF kappa beta-mediated pathway. Cancer Res. 2014, 74, 38. [Google Scholar]
- Dey, K.K.; Pal, I.; Bharti, R.; Dey, G.; Kumar, B.N.P.; Rajput, S.; Parekh, A.; Parida, S.; Halder, P.; Kulavi, I.; et al. Identification of RAB2A and PRDX1 as the potential biomarkers for oral squamous cell carcinoma using mass spectrometry-based comparative proteomic approach. Tumor Biol. 2015, 36, 9829–9837. [Google Scholar] [CrossRef]
- Chauhan, S.S.; Kaur, J.; Kumar, M.; Matta, A.; Srivastava, G.; Alyass, A.; Assi, J.; Leong, I.; MacMillan, C.; Witterick, I.; et al. Prediction of recurrence-free survival using a protein expression-based risk classifier for head and neck cancer. Oncogenesis 2015, 4, e147. [Google Scholar] [CrossRef] [PubMed]
- Hwang, J.T.; Gu, Y.R.; Shen, M.; Ralhan, R.; Walfish, P.G.; Pritzker, K.P.; Mock, D. Individualized five-year risk assessment for oral premalignant lesion progression to cancer. Oral. Surg. Oral. Med. Oral. Pathol. Oral. Radiol. 2017, 123, 374–381. [Google Scholar] [CrossRef] [PubMed]
- Gao, W.; Li, J.Z.; Chen, S.Q.; Chu, C.Y.; Chan, J.Y.; Wong, T.S. Decreased brain-expressed X-linked 4 (BEX4) expression promotes growth of oral squamous cell carcinoma. J. Exp. Clin. Cancer Res. 2016, 35, 92. [Google Scholar] [CrossRef] [PubMed]
- Tian, T.; Li, X.; Hua, Z.; Ma, J.; Wu, X.; Liu, Z.; Chen, H.; Cui, Z. S100A7 promotes the migration, invasion and metastasis of human cervical cancer cells through epithelial-mesenchymal transition. Oncotarget 2017, 8, 24964–24977. [Google Scholar] [CrossRef] [PubMed]
- Dey, K.K.; Bharti, R.; Dey, G.; Pal, I.; Rajesh, Y.; Chavan, S.; Das, S.; Das, C.K.; Jena, B.C.; Halder, P.; et al. S100A7 has an oncogenic role in oral squamous cell carcinoma by activating p38/MAPK and RAB2A signaling pathway. Cancer Gene Ther. 2016, 23, 382–391. [Google Scholar] [CrossRef] [PubMed]
- Kataoka, K.; Ono, T.; Murata, H.; Morishita, M.; Yamamoto, K.I.; Sakaguchi, M.; Huh, N.H. S100A7 promotes the migration and invasion of osteosarcoma cells via the receptor for advanced glycation end products. Oncol. Lett. 2012, 3, 1149–1153. [Google Scholar] [CrossRef]
- Gioanni, J.; Fischel, J.L.; Lambert, J.C.; Demard, F.; Mazeau, C.; Zanghellini, E.; Ettore, F.; Formento, P.; Chauvel, P.; Lalanne, C.M.; et al. Two new human tumor cell lines derived from squamous cell carcinomas of the tongue: Establishment, characterization and response to cytotoxic treatment. Eur. J. Cancer Clin. Oncol. 1988, 24, 1445–1455. [Google Scholar] [CrossRef]
- Tam, J.M.; Reedy, J.L.; Lukason, D.P.; Kuna, S.G.; Acharya, M.; Khan, N.S.; Negoro, P.E.; Xu, S.; Ward, R.A.; Feldman, M.B.; et al. Tetraspanin CD82 Organizes Dectin-1 into Signaling Domains to Mediate Cellular Responses to Candida albicans. J. Immunol. 2019, 202, 3256–3266. [Google Scholar] [CrossRef]
- Feng, J.; Huang, C.; Wren, J.D.; Wang, D.W.; Yan, J.; Zhang, J.; Sun, Y.; Han, X.; Zhang, X.A. Tetraspanin CD82: A suppressor of solid tumors and a modulator of membrane heterogeneity. Cancer Metastasis Rev. 2015, 34, 619–633. [Google Scholar] [CrossRef]
- Kim, Y.I.; Shin, M.K.; Lee, J.W.; Chung, J.H.; Lee, M.H. Decreased expression of KAI1/CD82 metastasis suppressor gene is associated with loss of heterozygosity in melanoma cell lines. Oncol. Rep. 2009, 21, 159–164. [Google Scholar]
- Tsai, Y.C.; Weissman, A.M. Dissecting the diverse functions of the metastasis suppressor CD82/KAI1. FEBS Lett. 2011, 585, 3166–3173. [Google Scholar] [CrossRef]
- Jackson, P.; Rowe, A.; Grimm, M.O. An alternatively spliced KAI1 mRNA is expressed at low levels in human bladder cancers and bladder cancer cell lines and is not associated with invasive behaviour. Oncol. Rep. 2007, 18, 1357–1363. [Google Scholar] [CrossRef]
- Smulow, J.B.; Glickman, I. An epithelial-like cell line in continuous culture from normal adult human gingiva. Proc. Soc. Exp. Biol. Med. 1966, 121, 1294–1296. [Google Scholar] [CrossRef] [PubMed]
- Kasten, F.H.; Soileau, K.; Meffert, R.M. Quantitative evaluation of human gingival epithelial cell attachment to implant surfaces in vitro. Int. J. Periodontics Restor. Dent. 1990, 10, 68–79. [Google Scholar]
- He, B.; Zhang, Y.H.; Richardson, M.M.; Zhang, J.S.; Rubinstein, E.; Zhang, X.A. Differential functions of phospholipid binding and palmitoylation of tumour suppressor EWI2/PGRL. Biochem. J. 2011, 437, 399–411. [Google Scholar] [CrossRef] [PubMed]
- Montague, T.G.; Cruz, J.M.; Gagnon, J.A.; Church, G.M.; Valen, E. CHOPCHOP: A CRISPR/Cas9 and TALEN web tool for genome editing. Nucleic Acids Res. 2014, 42, W401–W407. [Google Scholar] [CrossRef] [PubMed]
- Labun, K.; Montague, T.G.; Gagnon, J.A.; Thyme, S.B.; Valen, E. CHOPCHOP v2: A web tool for the next generation of CRISPR genome engineering. Nucleic Acids Res. 2016, 44, W272–W276. [Google Scholar] [CrossRef] [PubMed]
- Langfelder, P.; Horvath, S. WGCNA: An R package for weighted correlation network analysis. BMC Bioinform. 2008, 9, 559. [Google Scholar] [CrossRef] [PubMed]
- Bisen, S.; Kakhniashvili, D.; Johnson, D.L.; Bukiya, A.N. Proteomic Analysis of Baboon Cerebral Artery Reveals Potential Pathways of Damage by Prenatal Alcohol Exposure. Mol. Cell Proteom. 2019, 18, 294–307. [Google Scholar] [CrossRef] [PubMed]
- Mingming, N.; Ji-Hoon, C.; Kiran, K.; Vishwajeeth, P.; Hong, W.; Zhiping, W.; Yuxin, L.; Wenjian, B.; Hui, Z.; Xusheng, W. Extensive Peptide Fractionation and y1 Ion-Based Interference Detection Method for Enabling Accurate Quantification by Isobaric Labeling and Mass Spectrometry. Anal. Chem. 2017, 89, 2956–2963. [Google Scholar]
- Shen, J.; Pagala, V.R.; Breuer, A.M.; Peng, J.; Ma, B.; Wang, X. Spectral library search improves assignment of TMT labeled MS/MS spectra. J. Proteome Res. 2018, 17, 3325–3331. [Google Scholar] [CrossRef] [PubMed]
- Wang, X.; Li, Y.; Wu, Z.; Wang, H.; Tan, H.; Peng, J. JUMP: A tag-based database search tool for peptide identification with high sensitivity and accuracy. Mol. Cell Proteom. 2014, 13, 3663–3673. [Google Scholar] [CrossRef] [PubMed]
- Elias, J.E.; Gygi, S.P. Target-decoy search strategy for increased confidence in large-scale protein identifications by mass spectrometry. Nat. Methods 2007, 4, 207–214. [Google Scholar] [CrossRef]
- Peng, J.; Schwartz, D.; Elias, J.E.; Thoreen, C.C.; Cheng, D.; Marsischky, G.; Roelofs, J.; Finley, D.; Gygi, S.P. A proteomics approach to understanding protein ubiquitination. Nat. Biotechnol. 2003, 21, 921–926. [Google Scholar] [CrossRef]
- Livak, K.J.; Schmittgen, T.D. Analysis of relative gene expression data using real-time quantitative PCR and the 2(-Delta Delta C(T)) Method. Methods 2001, 25, 402–408. [Google Scholar] [CrossRef]


Disclaimer/Publisher’s Note: The statements, opinions and data contained in all publications are solely those of the individual author(s) and contributor(s) and not of MDPI and/or the editor(s). MDPI and/or the editor(s) disclaim responsibility for any injury to people or property resulting from any ideas, methods, instructions or products referred to in the content. |
© 2024 by the authors. Licensee MDPI, Basel, Switzerland. This article is an open access article distributed under the terms and conditions of the Creative Commons Attribution (CC BY) license (https://creativecommons.org/licenses/by/4.0/).
Share and Cite
Reddi, K.K.; Zhang, W.; Shahrabi-Farahani, S.; Anderson, K.M.; Liu, M.; Kakhniashvili, D.; Wang, X.; Zhang, Y.H. Tetraspanin CD82 Correlates with and May Regulate S100A7 Expression in Oral Cancer. Int. J. Mol. Sci. 2024, 25, 2659. https://doi.org/10.3390/ijms25052659
Reddi KK, Zhang W, Shahrabi-Farahani S, Anderson KM, Liu M, Kakhniashvili D, Wang X, Zhang YH. Tetraspanin CD82 Correlates with and May Regulate S100A7 Expression in Oral Cancer. International Journal of Molecular Sciences. 2024; 25(5):2659. https://doi.org/10.3390/ijms25052659
Chicago/Turabian StyleReddi, Kiran Kumar, Weiqiang Zhang, Shokoufeh Shahrabi-Farahani, Kenneth Mark Anderson, Mingyue Liu, David Kakhniashvili, Xusheng Wang, and Yanhui H. Zhang. 2024. "Tetraspanin CD82 Correlates with and May Regulate S100A7 Expression in Oral Cancer" International Journal of Molecular Sciences 25, no. 5: 2659. https://doi.org/10.3390/ijms25052659