Article

N-Acetylaspartate and Choline Metabolites in Cortical and Subcortical Regions in Clinical High Risk Relative to Healthy Control Subjects: An Exploratory 7T MRSI Study

1
Department of Psychiatry, University of Pittsburgh, Pittsburgh, PA 15213, USA
2
Department of Radiology, University of Pittsburgh, Pittsburgh, PA 15213, USA
*
Author to whom correspondence should be addressed.
Int. J. Mol. Sci. 2023, 24(9), 7682; https://doi.org/10.3390/ijms24097682
Submission received: 7 March 2023 / Revised: 19 April 2023 / Accepted: 20 April 2023 / Published: 22 April 2023
(This article belongs to the Special Issue Molecular Mechanisms of Schizophrenia and Novel Targets 2.0)

Abstract

:
N-acetylaspartate (NAA) and choline (Cho) are two brain metabolites implicated in several key neuronal functions. Abnormalities in these metabolites have been reported in both early course and chronic patients with schizophrenia (SCZ). It is, however, unclear whether NAA and Cho’s alterations occur even before the onset of the disorder. Clinical high risk (CHR) individuals are a population uniquely enriched for psychosis and SCZ. In this exploratory study, we utilized 7-Tesla magnetic resonance spectroscopic imaging (MRSI) to examine differences in total NAA (tNAA; NAA + N-acetylaspartylglutamate [NAAG]) and major choline-containing compounds, including glycerophosphorylcholine and phosphorylcholine [tCho], over the creatine (Cre) levels between 26 CHR and 32 healthy control (HC) subjects in the subcortical and cortical regions. While no tCho/Cre differences were found between groups in any of the regions of interest (ROIs), we found that CHR had significantly reduced tNAA/Cre in the right dorsal lateral prefrontal cortex (DLPFC) compared to HC, and that the right DLPFC tNAA/Cre reduction in CHR was negatively associated with their positive symptoms scores. No tNAA/Cre differences were found between CHR and HC in other ROIs. In conclusion, reduced tNAA/Cre in CHR vs. HC may represent a putative molecular biomarker for risk of psychosis and SCZ that is associated with symptom severity.

1. Introduction

Schizophrenia (SCZ) is a psychiatric disorder that affects approximately 1% of the population, and is a major cause of disability worldwide [1]. Identifying neurobiological and clinical risk factors for SCZ is, therefore, a high priority for research and public health [2]. Clinical high risk for psychosis (CHR) is a population uniquely enriched for risk of psychosis and SCZ. The CHR state includes individuals who are experiencing social dysfunction, cognitive impairments, and subsyndromal psychotic symptoms [3]. These individuals have a high risk of developing a psychiatric disorder, given that approximately 15–30% will transition to SCZ [4]. Thus, investigating CHR can lead to the discovery of early pathophysiological and risk/susceptibility biomarkers of SCZ. These findings can, in turn, contribute to establishing possible preventative measures and developing treatment options to help alleviate distressing symptoms.
Currently, identifying individuals at CHR, as well as diagnosis of SCZ, is entirely based on the subjective interpretation of clinical symptoms, as objective biological tests are not available [5]. As such, the interest in examining brain metabolites to help discover biomarkers of CHR and SCZ has grown in recent years [5]. One of the metabolites that has been increasingly investigated is choline (Cho). Cho plays a crucial role in generating membrane phospholipids that are essential in the human brain [6]; an elevated Cho signal is thought to point to an increase in membrane synthesis and turnover [7]. In SCZ, significantly higher levels of Cho have been observed in the dorsolateral prefrontal cortex (DLPFC) of chronic SCZ and first-episode psychosis (FEP) patients compared to healthy control (HC) subjects [8,9]. SCZ patients have also been found to have elevated Cho levels in the left caudate nucleus [10] and insular cortex [11] relative to controls. Concerning high risk populations, some studies have reported no differences in Cho levels between CHR and HC individuals in the thalamus [12,13], medial temporal region [14], the anterior cingulate cortex (ACC) [15,16,17], and the dorsolateral prefrontal cortex (DLPFC) [12,13,18]. However, a limitation of these studies was that some brain regions known to be implicated in SCZ have been less examined (e.g., insula, caudate); further, none of these studies employed ultrahigh field (≥7 Tesla, 7T) spectroscopy.
In addition to Cho, the amino acid derivative N-acetylaspartic acid (NAA) is another prominent metabolite in the brain [19]. NAA is known to be involved in the energy metabolism of neurons within the brain [20], and in glutamate receptor activity [21]. A decrease in NAA levels has been reported in SCZ [22]. Specifically, in chronic SCZ, NAA levels were significantly lower than controls in the frontal lobe, the temporal lobe, the thalamus, and the parietal lobe, while in FEP, NAA was lower than controls in the frontal lobe, the anterior cingulate cortex, the thalamus, and the DLPFC [22,23,24]. Few MRS studies have investigated NAA abnormalities in individuals at risk for psychosis; they found mostly negative results in the hippocampus and the anterior cingulate [14], and some significant or trend-level NAA reductions in the thalamus [12,25,26]. Findings in the prefrontal cortex have been mixed [13,26,27,28], although none of these studies employed 7T spectroscopy.
The use of magnetic resonance spectroscopic imaging (MRSI) allows the acquisition of data from multiple voxels simultaneously [29,30,31]. Compared to single-voxel MRS, which is limited to acquiring data from a single brain region at a time, spectral data from MRSI can be from a single slice, multiple slices, or multiple volumes simultaneously [31]. Thus, MRSI is more efficient than single-voxel MRS [32], and provides greater spatial information regarding metabolites of interest [33]. Additionally, MRSI allows for the direct comparison of neurotransmitter or metabolite levels because the time of acquisition is the same for the selected brain regions [32]. Relatedly, using ultrahigh field (≥7T) spectroscopy can offer a more precise quantification of the assessed metabolites [34]. Recent studies compared the measurement of total N-acetylaspartate (tNAA) using 7T and 3T MRS, and found a lower Cramer–Rao lower bound (CRLB)—a useful metric to evaluate the quality of the metabolite assessment, with lower values reflecting better measurements—for tNAA at 7T compared to 3T [35,36]. In this exploratory study, we employed 7T MRSI to measure tNAA and tCho in both cortical and subcortical brain regions in CHR and HC groups. Our overarching goal was to characterize abnormalities in these parameters in individuals at risk for SCZ, and to examine the association between those neurometabolite abnormalities and clinical symptoms in CHR vs. HC subjects.

2. Results

2.1. Clinical and Demographic Measures

Demographic variables and clinical measurements for HC and CHR groups are provided in Table 1. Twenty-six CHR individuals (fifteen females, age: 19.93 ± 3.16) and thirty-two HC subjects (eighteen females, age: 21.48 ± 4.98) were included in the study. By employing an unpaired t-test, we found no significant age differences across the groups (t(56) = −1.38, p = 0.172). Additionally, a chi-squared test revealed no sex differences between HC and CHR (X2 (1, N = 58) = 0.012, p = 0.912). The average scale of prodromal symptoms (SOPS) scores for the CHR group are reported in Table 1.

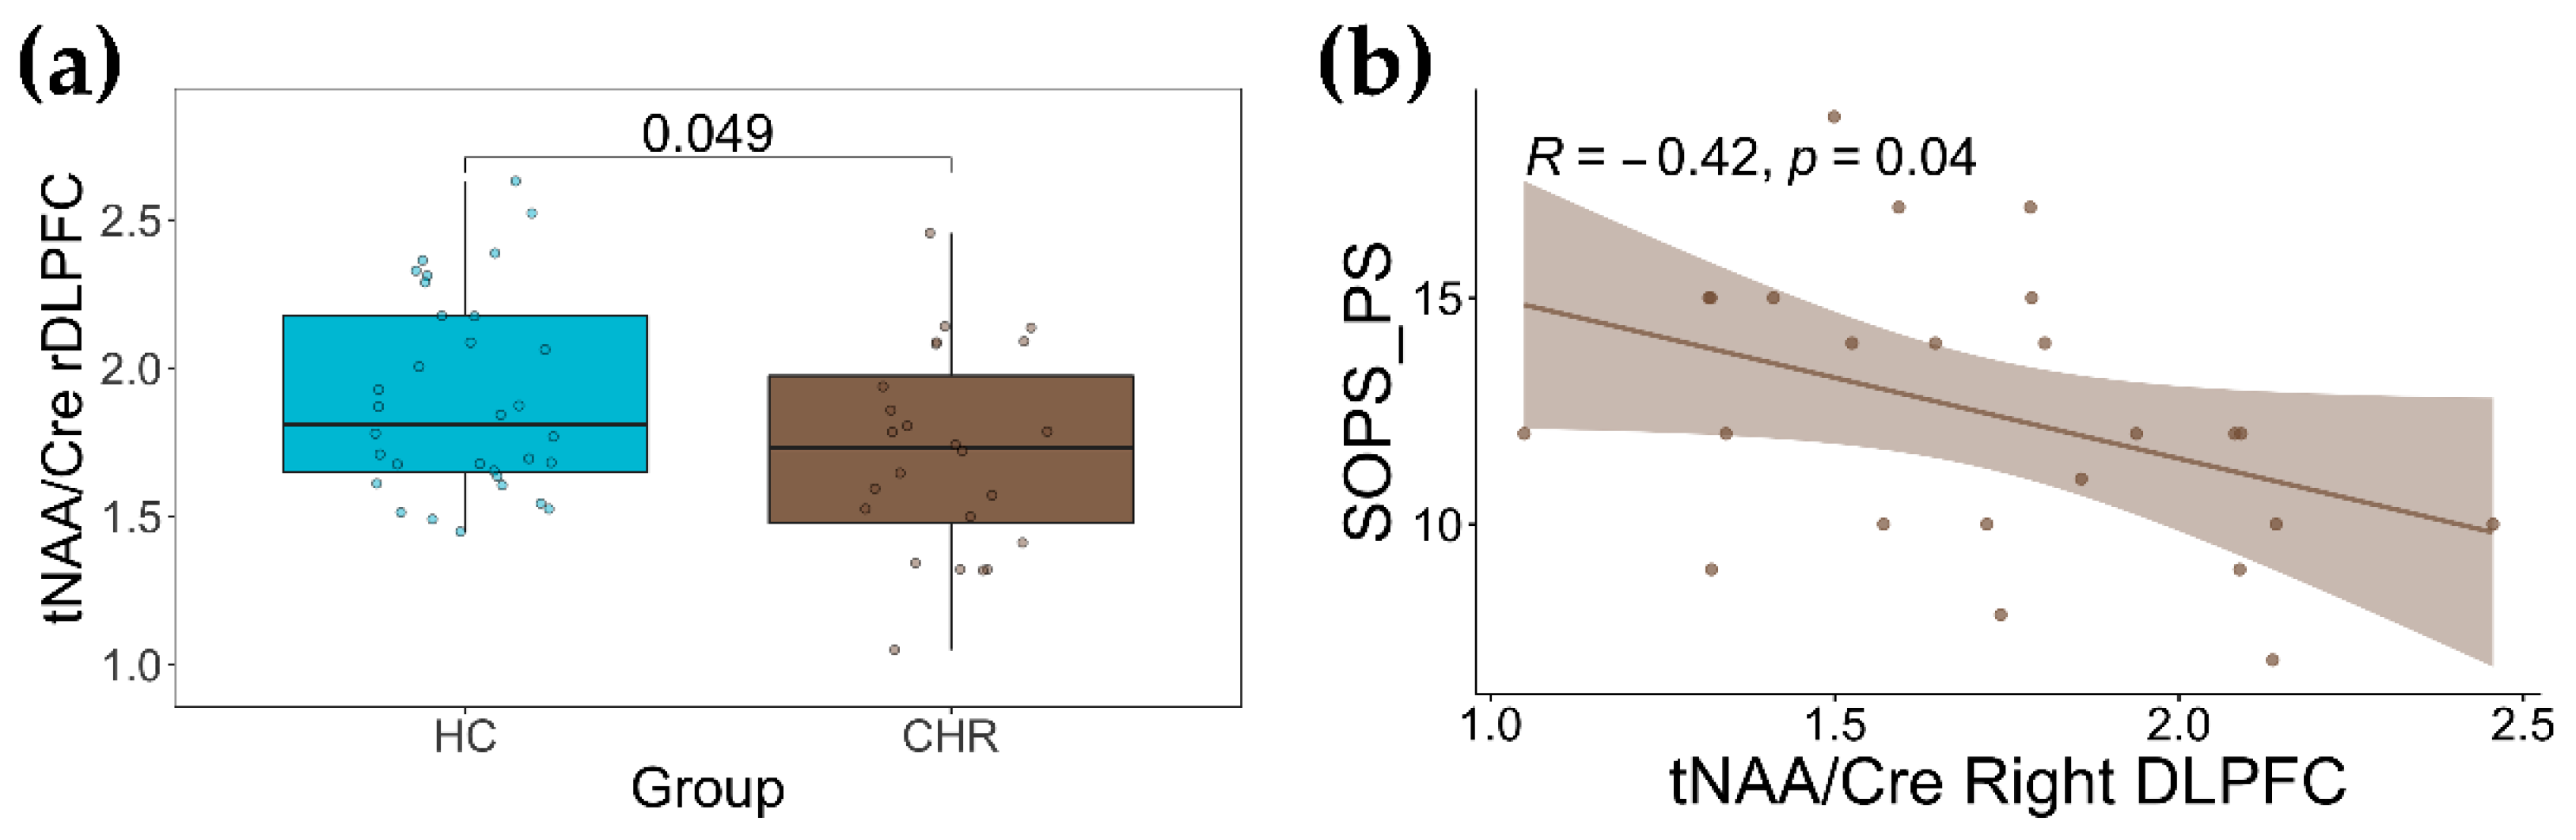
2.2. Group Differences in tNAA/Cre and tCho/Cre

We performed a one-way analysis of covariances (ANCOVAs) for tCho/Cre and tNAA/Cre between groups, and corrected them for individual age, sex, grey matter, and white matter fractions (Table 2). We found no significant differences in tCho/Cre levels in any brain regions of interest (ROIs) between CHR and HC (Table 2). In contrast, we found a lower tNAA/Cre, which was significant (p = 0.049; Cohen’s effect size = −0.546), in CHR relative to HC in the right DLPFC (Table 2 and Figure 1a). Further, the post hoc power analyses indicated the right DLPFC tNAA/Cre difference between groups (N = 58 total sample size) had a power level of >99%. There were no other differences in tNAA/Cre levels between CHR and HC in any other ROIs.

2.3. Association with Clinical Measurements

By performing Spearman correlations between tNAA/Cre levels in CHR and SOPS subscales, we found a significant correlation between tNAA/Cre levels and SOPS positive symptoms (rho = −0.42 and p = 0.040; Figure 1b). There was no correlation between right DLPFC tNAA/Cre levels and any other SOPS subscales (i.e., negative symptoms rho = 0.23 and p = 0.299; disorganized symptoms, rho = 0.20 and p = 0.371; general symptoms, rho = 0.15 and p = 0.490).

3. Discussion

By employing 7T MRSI, we computed tNAA/Cre and tCho/Cre levels in several cortical and subcortical brain ROIs in CHR and HC individuals. The ROIs selected for this study included both brain regions that previous work has shown to be altered in individuals at CHR or patients with SCZ, and brain regions which have been previously understudied in these patients. Our analysis revealed that tCho/Cre levels were not significantly different between the two study groups in any ROIs. In contrast, CHR individuals had lower tNAA/Cre in the right DLPFC compared to HC subjects. Furthermore, reduced tNAA/Cre levels in the right DLPFC in CHR were negatively associated with the severity of their positive, psychotic symptoms.
A first important finding of this study was that tCho/Cre levels did not differ between CHR and HC groups in any of the ROIs investigated. Our finding aligns with much of the existing literature that reported no Cho differences between CHR and HC groups in the PFC [13,15,37,38], thalamus [12,13,39], ACC [13,15,16,39], and DLPFC [12,13,18]. In addition, our study provided neurometabolite measurements for brain regions, which, to the best of our knowledge, have either not been previously investigated (insula), or have been understudied (caudate) in individuals at CHR. Given that the insula and the caudate are two brain regions known to be implicated in the pathophysiology of SCZ, and that Cho alterations have been previously reported in those regions [10,40], these negative results further corroborate the notion that alterations in Cho levels are not present in at-risk individuals, and are unlikely to be detectable before the diagnosis of SCZ.
We reported no significant decreases in NAA in the thalamus, the caudate, and the ACC in CHR vs. HC. These findings are consistent with negative findings by one MRS study examining NAA in the ACC of FES and ultrahigh risk (UHR) vs. HC [15], as well as two other spectroscopy recent studies in FEP [41] and chronic SCZ patients [42]. In contrast, two MRS meta-analyses found significant or trend-level NAA reductions in the thalamus of CHR vs. HC groups [12,25]. Several factors, including the heterogeneity of the CHR population, differences in sample sizes, and strength of the scanner (3T vs. 7T), may have contributed to these discrepant findings. In this regard, recent work comparing the measurement of total N-acetylaspartate (tNAA) using 7T and 3T MRS found a lower CRLB, which is thought to reflect a more precise measurement, for 7T vs. 3T [36]. Nonetheless, additional MRS studies are needed to further explore these inconsistent NAA findings in the thalamus. Relatedly, another meta-analysis study has shown reduced NAA levels in the ACC, thalamus, and frontal lobe in FEP, and in the frontal lobe, parietal lobe, temporal lobe, and thalamus in chronic schizophrenia, and showed progressive reduction in NAA in schizophrenia [23], which may indicate worsening neuronal integrity and function throughout the course of the disorder [43]. Together, these findings are consistent with the idea that NAA reductions in the caudate and ACC may reflect a progression of SCZ, rather than being present in the early stages of the disorder.
On the other hand, we established that CHR had lower tNAA/Cre levels in the rDLPFC relative to HC, with a medium effect size. Although a 3T MRS study reported no difference in NAA in the DLPFC of ultrahigh risk individuals vs. HC [26], our findings are consistent with a meta-analysis showing that high risk individuals had lower NAA/Cre levels (i.e., a 5.7% decrease on average) relative to healthy controls in the PFC, based on which it was concluded that NAA/Cre levels in the PFC could be considered as a biological vulnerability marker of schizophrenia [27].
We also found a significant negative correlation between reduced NAA in the rDLPFC and positive symptom severity in CHR. Specifically, CHR participants who reported worse psychotic symptoms with the SOPS assessment had significantly lower tNAA/Cre in the rDLPFC. These metabolic differences between the CHR group and the HC group could possibly represent putative state biomarkers that reflect the severity of psychosis. In line with this assumption, two recent systematic reviews reported that most studies identified increased NAA concentrations in response to treatment [22,44]. Furthermore, an MRS study investigating the relationship between alterations in metabolite levels in the DLPFC and clinical symptoms of patients with first episode SCZ longitudinally found that a one-year follow-up increase in the NAA/Cr level was detected in the left DLPFC of these patients, which was significantly correlated with the alteration in their positive symptom scores [45]. It remains to be established, though, whether these effects are specific and most prevalent for antipsychotic medications, and if they are associated with an improvement in positive symptoms. Similarly, future longitudinal studies in CHR are needed to confirm whether metabolic deviations, and especially reduced NAA in the DLPFC, are related to the positive psychosis symptoms of these individuals, and whether an increase in DLPFC NAA is associated with the response to antipsychotic treatment.
Additional work is needed to address some of the questions left unanswered by the present study. First, given the exploratory, hypothesis-generating nature of this study, we did not correct the Cho and NAA results for multiple comparisons. Our findings should, therefore, be interpreted with caution, and warrant replication in larger groups of patients. Future studies should also examine these metabolites and their alterations in relation to different stages of SCZ and related psychotic disorders. Second, the results reported here are cross-sectional. Longitudinal studies are, therefore, needed to assess whether lower NAA can predict and track illness trajectory in different stages of psychosis. Third, we found the most NAA alteration in CHR in the right DLPFC. The DLPFC plays a crucial role in regulating cognitive function, particularly working memory. Future studies should, therefore, investigate the relationship between cognition and tNAA/Cre in CHR individuals.

4. Materials and Methods

4.1. Participants

The study participants comprised twenty-six CHR individuals and thirty-two healthy control subjects.

4.2. Recruitment, Eligibility Criteria, and Clinical and Cognition Measurements

This study was approved by the University of Pittsburgh Institutional Review Board. HC and CHR participants were recruited via online and physical advertising efforts within the local community, as well as via referrals from other studies. CHR participants were also recruited from the University of Pittsburgh Medical Center clinical settings, referrals from other clinicians, and outside sources. Written consent from participants over 18 years old, and from parents of participants under 18 years old, was acquired prior to completing study procedures. Participants were informed that their participation was entirely voluntary. Participants were financially compensated for their participation in the study.
Each participant had to meet the following eligibility criteria: (1) be between ages 12 and 35; (2) have no lifetime diagnostic history of neurological disorders or of a head injury resulting in loss of consciousness for longer than a minute; (3) be proficient enough in English to be able to partake in clinical assessments and study procedures; (4) be able to travel to the Western Psychiatric Hospital to participate in study procedures; (5) no pregnancy; (6) have no history within the previous 12 months of alcohol or drug dependence; and (7) be capable of providing written consent. CHR participant eligibility was also assessed on the following criteria: (1) be assessed by the SIPS and meet one of the four prodromal states: (I) genetic risk and functional deterioration state, (II) attenuated positive symptom state, currently progressive, and (III) brief intermittent psychotic state, and (2) have no present diagnosis of a psychotic disorder. HC participants were excluded for the following criteria: (1) having an Axis-1 disorder diagnosis, as assessed by the structured clinical interview for DSM-IV disorders (SCID-IV); (2) having a high risk syndrome diagnosis; and (3) having first-degree relatives with a known diagnosis of a psychotic disorder.

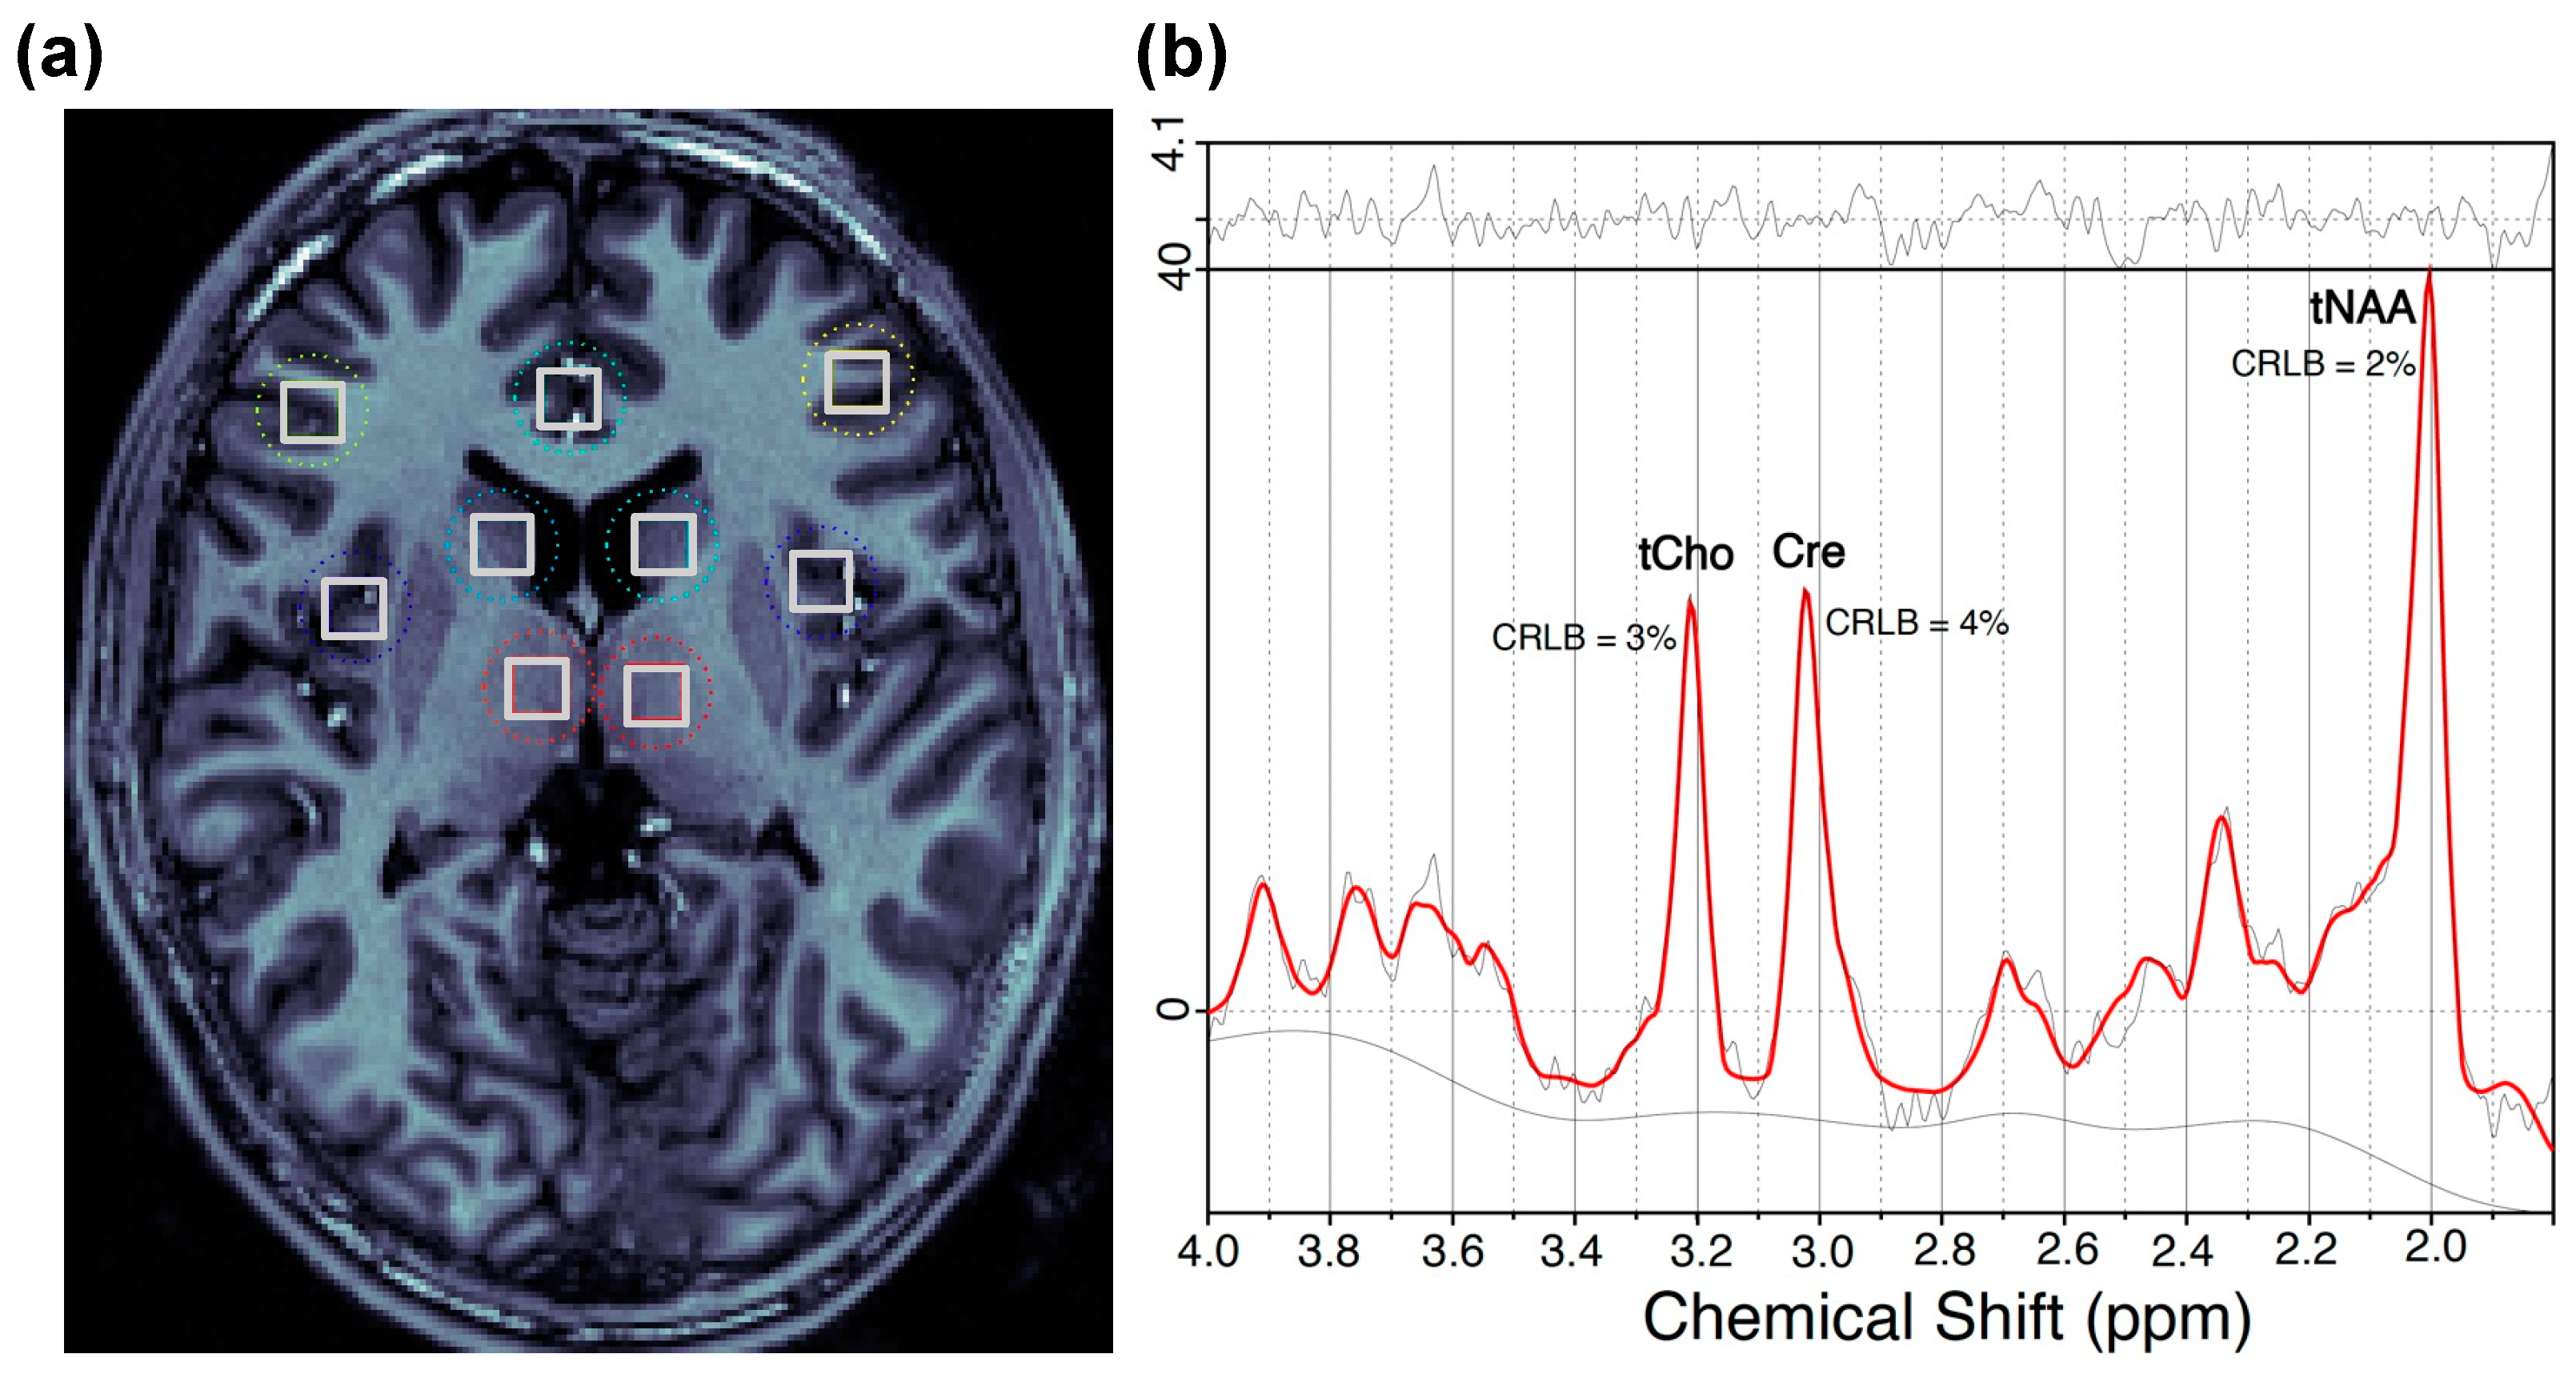
4.3. 1H MRSI Data Acquisition and Processing

Neuroimaging data were acquired on a 7T Siemens (Siemens Healthcare, Erlangen, Germany) Magnetom scanner using an 8-channel multiple transmit system with a body gradient coil, and an 8 × 2 transceiver array (2 rows, 8 coils/row, Resonance Research Inc., Billerica, MA, USA). A very high order shim (VHOS) insert coil (with a 38 cm inner diameter), providing 3rd and 4th order shims, and partial 5th order shims (Resonance Research Inc.), was used in conjunction with the standard 1st and 2nd order corrections for higher degree/order B0 shimming [46]. The VHOS was used, as it reduces in-plane magnetic field inhomogeneity by ~50% in comparison to what is achieved when using only 1st and 2nd order shims [46]. Planar MRSI data were acquired in a slice angulated along the DLPFC plane using a slice selective J-refocused coherence transfer sequence [47] with TE/TR = 34/1500 ms, matrix size = 24 × 24 over a FOV of 216 mm × 216 mm, and slice thickness = 10 mm (nominal voxel size = 9 mm × 9 mm × 10 mm). Four Hz of Gaussian broadening was used alongside a 100 Hz convolution difference in the spectral domain. A Hanning filter was applied before the Fourier transformation in the spatial domain. This resulted in the in-plane distribution having a full width at half maximum diameter of approximately 16.9 mm. The integrated volume weighted by efficiency is parallel to an unfiltered data set. A frequency-selective inversion recovery preparation module suppressed water and optimized semiselective refocusing pulses [48]. A 1.0 mm isotropic resolution in a FOV of 240 × 240 × 192 mm for anatomic identification was provided by an MP2RAGE sequence [49], with TR of 6000 ms and TI of 80 and 2700 ms. Scout images contained 33 3 mm thick 128 mm × 128 mm slices with in-plane resolution of 1.7 mm. The scout images were matched, and used to weigh and phase the data for coil recombination.
The anatomical brain images (MP2RAGE) were segmented into different cortical and subcortical regions of interest using Freesurfer (FreeSurfer, http://surfer.nmr.mgh.harvard.edu/, accessed on 1 November 2022). The scout image was coregistered to the MP2RAGE using SPM (SPM12, www.fil.ion.ucl.ac.uk/spm, accessed on 1 November 2022). SPM was also used to further transform MP2RAGE into the MNI space to assess the voxel center MNI coordinates and assign voxels to Brodmann areas. For each participant, we selected ROIs from the image that were coregistered into MNI, and confirmed that the placements of these ROIs were in either correct brain regions or Brodmann areas (e.g., for DLPFC, Brodmann area 9 or 46) using MNI152 brain Atlas.
The spectral data were quantified in the range of 1.8 to 4.0 ppm via LCModel [50]. This consisted of default macromolecule components and 14 basis metabolite functions (N-acetylaspartate (NAA), N-acetylaspartylglutamate (NAAG), aspartate, lactate, creatine (Cre), γ-aminobutyric acid (GABA), glucose, glutamate, glutamine, glutathione, glycerophosphorylcholine, phosphorylcholine, myoinositol, and taurine). GAMMA simulations incorporating the effects of the pulse sequence were used to calculate these basic functions [51]. Metabolite ratios (using Cre as the denominator in metabolite ratios) were calculated instead of absolute concentrations to avoid potential quantification errors. These errors could have been introduced by the partial volume effects through the inclusion of cerebrospinal fluid, transmit inhomogeneity due to high field effects, and spatially varying sensitivity due to the use of a receive array. As Cre is a metabolite with a strong signal, reliable chemical shift, and good stability, it is often utilized as an internal reference for other metabolites and for allowing a shorter acquisition time compared to using a water reference. For this study, two neurometabolic ratios were calculated: tNAA/Cre and tCho/Cre. In these ratios, Cre represented the sum of creatine and phosphocreatine, tNAA represented the total of NAA and N-acetylaspartylglutamate (NAAG), and tCho represented the total of major choline-containing compounds, glycerophosphorylcholine and phosphorylcholine.
The LCModel provides Cramer–Rao lower bounds (CRLB) values for each metabolite/neurotransmitter as a representation of the estimate’s uncertainty for any metabolite. More specifically, the CRLB measures data quality by estimating the lowest possible variance for an estimator, and indicating how well the measurement of a given metabolite fits the ideal spectrum for that metabolite. Data with poor spectral quality were filtered out using CRLB values for each metabolite ratio. The exclusion criteria for spectra were CRLB > 10 for the singlet resonances tNAA, Cre, or tCho.

4.4. Regions of Interest

In this study, we investigated tNAA/Cre and tCho/Cre in several cortical and subcortical regions. The cortical regions include the bilateral dorsolateral prefrontal cortex (DLPFC), anterior cingulate cortex (ACC), and bilateral insula. The subcortical ROIs include bilateral caudate and thalamus. Figure 2a represents the locations of selected brain regions. The spectra from those ROIs were then analyzed with LCModel to obtain the final values for each compound. A representative spectrum of a CHR patient is shown in Figure 2b.

4.5. Statistical Analysis

A 2-sided Pearson chi-square and an unpaired t-test were applied to test age and sex differences between CHR and HC, respectively. An unpaired t-test was applied to compare white matter, gray matter, and CSF for each brain region separately between CHR and HC. A one-way analysis of covariance (ANCOVA), with the group as the independent variable, the metabolite level as the dependent variable, and age, sex, gray matter, and white matter as the proportion covariates, was conducted for each metabolite ratio (i.e., tNAA/Cre and tCho/Cre). We calculated Cohen’s effect size for significant findings and post hoc statistical power using the G*Power tool [52].

5. Conclusions

In summary, by using 7T MRSI in CHR individuals and HC subjects, in this exploratory study, we found no alterations in the choline level of CHR individuals, while we reported lower NAA in the right DLPFC of CHR, which correlated with their positive symptoms. These findings are in line with previous reports in the early course and chronic patients with SCZ, and suggest that reduced tNAA/Cre in CHR vs. HC may represent a putative molecular biomarker for the risk of psychosis and SCZ that is associated with symptom severity.

Author Contributions

Conceptualization, F.F., H.P.H. and A.M.; methodology, A.M., F.F., C.-H.M. and H.P.H.; software, C.-H.M. and H.P.H.; formal analysis, A.M. and J.S.R.; resources, F.F.; data curation, A.M., C.-H.M. and H.P.H.; writing—original draft preparation, A.M., S.A.J., C.A.H., J.S.R., K.S., A.K., H.P.H. and F.F.; writing—review and editing, all authors; visualization, A.M., H.P.H. and F.F.; supervision, F.F.; project administration, S.A.J., C.A.H., J.S.R. and K.S.; funding acquisition, F.F. All authors have read and agreed to the published version of the manuscript.

Funding

This research was funded by the National Institute of Mental Health (NIMH), grant number R01 MH113827 awarded to Fabio Ferrarelli.

Institutional Review Board Statement

The study protocol was approved by the University of Pittsburgh Institutional Review Board (approval code: 19050166).

Informed Consent Statement

Informed written consent was obtained from all subjects involved in the study.

Data Availability Statement

Data can be requested from the authors.

Conflicts of Interest

The authors declare no conflict of interest.

References

  1. GBD 2019 Diseases and Injuries Collaborators. Global burden of 369 diseases and injuries in 204 countries and territories, 1990–2019: A systematic analysis for the Global Burden of Disease Study 2019. Lancet 2020, 396, 1204–1222. [Google Scholar] [CrossRef] [PubMed]
  2. Lewis-Fernández, R.; Rotheram-Borus, M.J.; Betts, V.T.; Greenman, L.; Essock, S.M.; Escobar, J.I.; Barch, D.; Hogan, M.F.; Arean, P.A.; Druss, B.G.; et al. Rethinking funding priorities in mental health research. Br. J. Psychiatry 2016, 208, 507–509. [Google Scholar] [CrossRef] [PubMed]
  3. Ferrarelli, F.; Mathalon, D. The prodromal phase: Time to broaden the scope beyond transition to psychosis? Schizophr. Res. 2020, 216, 5. [Google Scholar] [CrossRef] [PubMed]
  4. Fusar-Poli, P.; Bonoldi, I.; Yung, A.R.; Borgwardt, S.; Kempton, M.J.; Valmaggia, L.; Barale, F.; Caverzasi, E.; McGuire, P. Predicting psychosis: Meta-analysis of transition outcomes in individuals at high clinical risk. Arch. Gen. Psychiatry 2012, 69, 220–229. [Google Scholar] [CrossRef]
  5. Davison, J.; O’Gorman, A.; Brennan, L.; Cotter, D.R. A systematic review of metabolite biomarkers of schizophrenia. Schizophr. Res. 2018, 195, 32–50. [Google Scholar] [CrossRef]
  6. Zeisel, S.H.; Da Costa, K.A.; Franklin, P.D.; Alexander, E.A.; Lamont, J.T.; Sheard, N.F.; Beiser, A. Choline, an essential nutrient for humans. FASEB J. 1991, 5, 2093–2098. [Google Scholar] [CrossRef]
  7. Podo, F. Tumour phospholipid metabolism. NMR Biomed. Int. J. Devoted Dev. Appl. Magn. Reson. Vivo 1999, 12, 413–439. [Google Scholar] [CrossRef]
  8. Smucny, J.; Carter, C.S.; Maddock, R.J. Magnetic resonance spectroscopic evidence of increased choline in the dorsolateral prefrontal and visual cortices in recent onset schizophrenia. Neurosci. Lett. 2022, 770, 136410. [Google Scholar] [CrossRef]
  9. Kirtaş, D.; Karadağ, R.F.; Şengül, M.C.B.; Kiroğlu, Y. 1H-magnetic resonance spectroscopy in first episode and chronic schizophrenia patients. Turk. J. Med. Sci. 2016, 46, 862–871. [Google Scholar] [CrossRef]
  10. Bustillo, J.R.; Rowland, L.M.; Lauriello, J.; Petropoulos, H.; Hammond, R.; Hart, B.; Brooks, W.M. High choline concentrations in the caudate nucleus in antipsychotic-naive patients with schizophrenia. Am. J. Psychiatry 2002, 159, 130–133. [Google Scholar] [CrossRef]
  11. Yasukawa, R.; Miyaoka, T.; Mizuno, S.; Inagaki, T.; Horiguchi, J.; Oda, K.; Kitagaki, H. Proton magnetic resonance spectroscopy of the anterior cingulate gyrus, insular cortex and thalamus in schizophrenia associated with idiopathic unconjugated hyperbilirubinemia (Gilbert’s syndrome). J. Psychiatry Neurosci. 2005, 30, 416–422. [Google Scholar] [PubMed]
  12. Wang, Y.-m.; Xiao, Y.-h.; Xie, W.-l. Metabolite abnormalities in psychosis risk: A meta-analysis of proton magnetic resonance spectroscopy studies. Asian J. Psychiatry 2020, 54, 102220. [Google Scholar] [CrossRef]
  13. Byun, M.S.; Choi, J.-S.; Yoo, S.Y.; Kang, H.; Choi, C.-H.; Jang, N.P.; Jung, W.H.; Jung, M.H.; Jang, J.H.; Lee, J.-M.; et al. Depressive Symptoms and Brain Metabolite Alterations in Subjects at Ultra-high Risk for Psychosis: A Preliminary Study. Psychiatry Investig. 2009, 6, 264–271. [Google Scholar] [CrossRef] [PubMed]
  14. Wood, S.J.; Berger, G.; Velakoulis, D.; Phillips, L.J.; McGorry, P.D.; Yung, A.R.; Desmond, P.; Pantelis, C. Proton Magnetic Resonance Spectroscopy in First Episode Psychosis and Ultra High-Risk Individuals. Schizophr. Bull. 2003, 29, 831–843. [Google Scholar] [CrossRef]
  15. Uhl, I.; Mavrogiorgou, P.; Norra, C.; Forstreuter, F.; Scheel, M.; Witthaus, H.; Özgürdal, S.; Gudlowski, Y.; Bohner, G.; Gallinat, J.; et al. 1H-MR spectroscopy in ultra-high risk and first episode stages of schizophrenia. J. Psychiatr. Res. 2011, 45, 1135–1139. [Google Scholar] [CrossRef]
  16. Jessen, F.; Scherk, H.; Träber, F.; Theyson, S.; Berning, J.; Tepest, R.; Falkai, P.; Schild, H.-H.; Maier, W.; Wagner, M.; et al. Proton magnetic resonance spectroscopy in subjects at risk for schizophrenia. Schizophr. Res. 2006, 87, 81–88. [Google Scholar] [CrossRef]
  17. He, Y.; Kosciolek, T.; Tang, J.; Zhou, Y.; Li, Z.; Ma, X.; Zhu, Q.; Yuan, N.; Yuan, L.; Li, C.; et al. Gut microbiome and magnetic resonance spectroscopy study of subjects at ultra-high risk for psychosis may support the membrane hypothesis. Eur. Psychiatry 2018, 53, 37–45. [Google Scholar] [CrossRef] [PubMed]
  18. Romeo, B.; Petillion, A.; Martelli, C.; Benyamina, A. Magnetic resonance spectroscopy studies in subjects with high risk for psychosis: A meta-analysis and review. J. Psychiatr. Res. 2020, 125, 52–65. [Google Scholar] [CrossRef] [PubMed]
  19. Inglese, M.; Rusinek, H.; George, I.C.; Babb, J.S.; Grossman, R.I.; Gonen, O. Global average gray and white matter N-acetylaspartate concentration in the human brain. Neuroimage 2008, 41, 270–276. [Google Scholar] [CrossRef]
  20. Steel, A.; Mikkelsen, M.; Edden, R.A.; Robertson, C.E. Regional balance between glutamate+glutamine and GABA+ in the resting human brain. Neuroimage 2020, 220, 117112. [Google Scholar] [CrossRef]
  21. Bustillo, J.R.; Mayer, E.G.; Upston, J.; Jones, T.; Garcia, C.; Sheriff, S.; Maudsley, A.; Tohen, M.; Gasparovic, C.; Lenroot, R. Increased glutamate plus glutamine in the right middle cingulate in early schizophrenia but not in bipolar psychosis: A whole brain 1H-MRS study. Front. Psychiatry 2021, 12, 660850. [Google Scholar] [CrossRef]
  22. Schwerk, A.; Alves, F.D.S.; Pouwels, P.J.W.; Van Amelsvoort, T. Metabolic alterations associated with schizophrenia: A critical evaluation of proton magnetic resonance spectroscopy studies. J. Neurochem. 2013, 128, 1–87. [Google Scholar] [CrossRef]
  23. Whitehurst, T.S.; Osugo, M.; Townsend, L.; Shatalina, E.; Vava, R.; Onwordi, E.C.; Howes, O. Proton Magnetic Resonance Spectroscopy of N-acetyl Aspartate in Chronic Schizophrenia, First Episode of Psychosis and High-Risk of Psychosis: A Systematic Review and Meta-Analysis. Neurosci. Biobehav. Rev. 2020, 119, 255–267. [Google Scholar] [CrossRef]
  24. Smesny, S.; Berberich, D.; Gussew, A.; Schönfeld, N.; Langbein, K.; Walther, M.; Reichenbach, J.R. Alterations of neurometabolism in the dorsolateral prefrontal cortex and thalamus in transition to psychosis patients change under treatment as usual—A two years follow-up 1H/31P-MR-spectroscopy study. Schizophr. Res. 2021, 228, 7–18. [Google Scholar] [CrossRef]
  25. Brugger, S.; Davis, J.M.; Leucht, S.; Stone, J.M. Proton Magnetic Resonance Spectroscopy and Illness Stage in Schizophrenia—A Systematic Review and Meta-Analysis. Biol. Psychiatry 2011, 69, 495–503. [Google Scholar] [CrossRef] [PubMed]
  26. Smesny, S.; Gussew, A.; Schack, S.; Langbein, K.; Wagner, G.; Reichenbach, J.R. Neurometabolic patterns of an “at risk for mental disorders” syndrome involve abnormalities in the thalamus and anterior midcingulate cortex. Schizophr. Res. 2022, 243, 285–295. [Google Scholar] [CrossRef] [PubMed]
  27. Mondino, M.; Brunelin, J.; Saoud, M. N-Acetyl-Aspartate Level is Decreased in the Prefrontal Cortex in Subjects At-Risk for Schizophrenia. Front. Psychiatry 2013, 4, 99. [Google Scholar] [CrossRef]
  28. Liemburg, E.; Sibeijn-Kuiper, A.; Bais, L.; Pijnenborg, G.; Knegtering, H.; van der Velde, J.; Opmeer, E.; de Vos, A.; Lange, J.D.-D.; Wunderink, L.; et al. Prefrontal NAA and Glx Levels in Different Stages of Psychotic Disorders: A 3T 1H-MRS Study. Sci. Rep. 2016, 6, 21873. [Google Scholar] [CrossRef] [PubMed]
  29. Mayeli, A.; Sonnenschein, S.F.; Yushmanov, V.E.; Wilson, J.D.; Blazer, A.; Foran, W.; Perica, M.; Calabro, F.J.; Luna, B.; Hetherington, H.P.; et al. Dorsolateral Prefrontal Cortex Glutamate/Gamma-Aminobutyric Acid (GABA) Alterations in Clinical High Risk and First-Episode Schizophrenia: A Preliminary 7-T Magnetic Resonance Spectroscopy Imaging Study. Int. J. Mol. Sci. 2022, 23, 15846. [Google Scholar] [CrossRef]
  30. Sonnenschein, S.F.; Mayeli, A.; Yushmanov, V.E.; Blazer, A.; Calabro, F.J.; Perica, M.; Foran, W.; Luna, B.; Hetherington, H.P.; Ferrarelli, F.; et al. A longitudinal investigation of GABA, glutamate, and glutamine across the insula during antipsychotic treatment of first-episode schizophrenia. Schizophr. Res. 2022, 248, 98–106. [Google Scholar] [CrossRef]
  31. Zhu, H.; Barker, P.B. MR Spectroscopy and Spectroscopic Imaging of the Brain. Magn. Reson. Neuroimaging 2011, 711, 203–226. [Google Scholar]
  32. Van Zijl, P.C.; Barker, P.B. Magnetic Resonance Spectroscopy and Spectroscopic Imaging for the Study of Brain Metabolism a. Ann. N. Y. Acad. Sci. 1997, 820, 75–96. [Google Scholar] [CrossRef] [PubMed]
  33. Quiñones, G.M.; Mayeli, A.; Yushmanov, V.E.; Hetherington, H.P.; Ferrarelli, F. Reduced GABA/glutamate in the thalamus of individuals at clinical high risk for psychosis. Neuropsychopharmacology 2021, 46, 1133–1139. [Google Scholar] [CrossRef] [PubMed]
  34. Balchandani, P.; Naidich, T. Ultra-high-field MR neuroimaging. Am. J. Neuroradiol. 2015, 36, 1204–1215. [Google Scholar] [CrossRef] [PubMed]
  35. Younis, S.; Hougaard, A.; Christensen, C.E.; Vestergaard, M.B.; Petersen, E.T.; Boer, V.O.; Paulson, O.B.; Ashina, M.; Marsman, A.; Larsson, H.B.W. Feasibility of Glutamate and GABA Detection in Pons and Thalamus at 3T and 7T by Proton Magnetic Resonance Spectroscopy. Front. Neurosci. 2020, 14, 559314. [Google Scholar] [CrossRef]
  36. Terpstra, M.; Cheong, I.; Lyu, T.; Deelchand, D.K.; Emir, U.E.; Bednařík, P.; Eberly, L.E.; Öz, G. Test-retest reproducibility of neurochemical profiles with short-echo, single-voxel MR spectroscopy at 3T and 7T. Magn. Reson. Med. 2016, 76, 1083–1091. [Google Scholar] [CrossRef] [PubMed]
  37. Natsubori, T.; Inoue, H.; Abe, O.; Takano, Y.; Iwashiro, N.; Aoki, Y.; Koike, S.; Yahata, N.; Katsura, M.; Gonoi, W.; et al. Reduced frontal glutamate + glutamine and N-acetylaspartate levels in patients with chronic schizophrenia but not in those at clinical high risk for psychosis or with first-episode schizophrenia. Schizophr. Bull. 2014, 40, 1128–1139. [Google Scholar] [CrossRef]
  38. De la Fuente-Sandoval, C.; Reyes-Madrigal, F.; Mao, X.; León-Ortiz, P.; Rodríguez-Mayoral, O.; Solís-Vivanco, R.; Favila, R.; Graff-Guerrero, A.; Shungu, D.C. Cortico-striatal GABAergic and glutamatergic dysregulations in subjects at ultra-high risk for psychosis investigated with proton magnetic resonance spectroscopy. Int. J. Neuropsychopharmacol. 2016, 19, pyv105. [Google Scholar] [CrossRef]
  39. Stone, J.M.; Day, F.; Tsagaraki, H.; Valli, I.; McLean, M.A.; Lythgoe, D.J.; O’Gorman, R.L.; Barker, G.J.; McGuire, P.K.; OASIS. Glutamate Dysfunction in People with Prodromal Symptoms of Psychosis: Relationship to Gray Matter Volume. Biol. Psychiatry 2009, 66, 533–539. [Google Scholar] [CrossRef]
  40. Weber-Fahr, W.; Englisch, S.; Esser, A.; Tunc-Skarka, N.; Meyer-Lindenberg, A.; Ende, G.; Zink, M. Altered phospholipid metabolism in schizophrenia: A phosphorus 31 nuclear magnetic resonance spectroscopy study. Psychiatry Res. 2013, 214, 365–373. [Google Scholar] [CrossRef]
  41. Wang, M.; Barker, P.B.; Cascella, N.G.; Coughlin, J.M.; Nestadt, G.; Nucifora, F.C.; Sedlak, T.W.; Kelly, A.; Younes, L.; Geman, D.; et al. Longitudinal changes in brain metabolites in healthy controls and patients with first episode psychosis: A 7-Tesla MRS study. Mol. Psychiatry 2023. [Google Scholar] [CrossRef]
  42. Tarumi, R.; Tsugawa, S.; Noda, Y.; Plitman, E.; Honda, S.; Matsushita, K.; Chavez, S.; Sawada, K.; Wada, M.; Matsui, M.; et al. Levels of glutamatergic neurometabolites in patients with severe treatment-resistant schizophrenia: A proton magnetic resonance spectroscopy study. Neuropsychopharmacology 2020, 45, 632–640. [Google Scholar] [CrossRef]
  43. Öngür, D. Magnetic Resonance Spectroscopy Studies in Schizophrenia. In Neuroimaging in Schizophrenia; Springer: Cham, Switzerland, 2020; pp. 179–189. [Google Scholar]
  44. Paslakis, G.; Träber, F.; Roberz, J.; Block, W.; Jessen, F. N-acetyl-aspartate (NAA) as a correlate of pharmacological treatment in psychiatric disorders: A systematic review. Eur. Neuropsychopharmacol. 2014, 24, 1659–1675. [Google Scholar] [CrossRef] [PubMed]
  45. Huang, M.; Guo, W.; Lu, S.; Pan, F.; Chen, J.; Hu, J.; Hu, S.; Xu, W.; Shang, D.; Xu, Y. The relationship between the alterations in metabolite levels in the dorsolateral prefrontal cortex and clinical symptoms of patients with first-episode schizophrenia: A one year follow-up study. Oncotarget 2019, 10, 606–615. [Google Scholar] [CrossRef]
  46. Pan, J.W.; Lo, K.-M.; Hetherington, H.P. Role of very high order and degree B 0 shimming for spectroscopic imaging of the human brain at 7 tesla. Magn. Reson. Med. 2011, 68, 1007–1017. [Google Scholar] [CrossRef]
  47. Pan, J.; Avdievich, N.; Hetherington, H. J-refocused coherence transfer spectroscopic imaging at 7 T in human brain. Magn. Reson. Med. 2010, 64, 1237–1246. [Google Scholar] [CrossRef]
  48. Pradhan, S.; Bonekamp, S.; Gillen, J.S.; Rowland, L.M.; Wijtenburg, S.A.; Edden, R.A.; Barker, P.B. Comparison of single voxel brain MRS AT 3T and 7T using 32-channel head coils. Magn. Reson. Imaging 2015, 33, 1013–1018. [Google Scholar] [CrossRef]
  49. Marques, J.P.; Kober, T.; Krueger, G.; van der Zwaag, W.; Van de Moortele, P.-F.; Gruetter, R. MP2RAGE, a self bias-field corrected sequence for improved segmentation and T1-mapping at high field. Neuroimage 2010, 49, 1271–1281. [Google Scholar] [CrossRef] [PubMed]
  50. Provencher, S.W. Automatic quantitation of localized in vivo 1H spectra with LCModel. NMR Biomed. Int. J. Devoted Dev. Appl. Magn. Reson. Vivo 2001, 14, 260–264. [Google Scholar]
  51. Smith, S.; Levante, T.; Meier, B.; Ernst, R. Computer Simulations in Magnetic Resonance. An Object-Oriented Programming Approach. J. Magn. Reson. Ser. A 1994, 106, 75–105. [Google Scholar] [CrossRef]
  52. Faul, F.; Erdfelder, E.; Lang, A.-G.; Buchner, A. G* Power 3: A flexible statistical power analysis program for the social, behavioral, and biomedical sciences. Behav. Res. Methods 2007, 39, 175–191. [Google Scholar] [CrossRef] [PubMed]
Figure 1. (a) group difference in [N-acetylaspartate (NAA) + N-acetylaspartylglutamate (NAAG)/creatine] (tNAA/Cre) levels in the right dorsolateral prefrontal cortex (DLPFC) between clinical high risk for psychosis (CHR) and healthy control (HC). (b) Negative correlation between scale of prodromal symptoms (SOPS) positive symptoms and tNAA/Cre levels in the right DLPFC.
Ijms 24 07682 g001
Figure 2. (a) Representative location for the regions of interest of a clinical high risk for psychosis (CHR) individual. (b) Individual fits for the major compounds of interest; their Cramer–Rao lower bound (CRLB) values of magnetic resonance spectroscopic imaging (MRSI) spectrum are from the right dorsolateral prefrontal cortex (DLPFC) of the CHR individual, the brain of which is shown in part (a).
Ijms 24 07682 g002
Table 1. Clinical and demographic measures of the study participants.
MeasuresHealthy ControlClinical High Riskp-Value
Number of Subjects3226-
Sex (# female)18150.912 1
Average Age ± SD in Years (range)21.48 ± 4.98 (14–33)19.93 ± 3.16 (15–27)0.172 2
SOPS Positive Symptoms (average ± SD)-12.19 ± 3.10-
SOPS Negative Symptoms (average ± SD)-11.60 ± 4.34-
SOPS Disorganized Symptoms (average ± SD)-5.00 ± 1.94-
SOPS General Symptoms (average ± SD)-7.68 ± 2.56-
Abbreviations: SOPS: scale of prodromal symptoms; 1 Pearson chi-square 2-sided p-value; 2 unpaired two-tailed Student’s t-test p-value.
Table 2. Group differences between CHR and HC in tNAA/Cre and tCho/Cre by applying analysis of covariance (ANCOVA) and having the group as the main effect, and age, sex, and gray and white matter fraction as the covariates.
tCho/CretNAA/Cre
F-Statp-ValueF-Statp-Value
Right DLPFCGroup1.0860.3024.0380.049
Age0.6920.4100.0480.827
Sex0.2680.607<0.0010.999
GM%0.0580.8111.7460.192
WM%3.3300.0742.3620.131
Left DLPFCGroup0.4360.5132.0700.158
Age2.0590.1560.9050.347
Sex0.0030.9540.0640.802
GM%0.1700.6830.3170.577
WM%2.2800.1390.4000.531
ACCGroup0.2270.6360.2530.617
Age2.5570.1160.0210.887
Sex8.2890.0060.4190.520
GM%0.1440.7060.0990.755
WM%2.2650.138<0.0010.993
Right CaudateGroup0.7230.3991.5840.214
Age0.8640.3571.2900.261
Sex6.7580.0120.9700.329
GM%0.0750.7850.0350.852
WM%0.0800.7782.9070.094
Left CaudateGroup0.3190.5750.1150.736
Age0.2800.5990.0720.790
Sex2.1210.1520.8160.371
GM%0.5230.4730.3260.571
WM%<0.0010.9960.7020.406
Right InsulaGroup0.1100.7420.0480.826
Age0.0510.8220.0950.759
Sex6.3900.0151.7030.198
GM%2.0470.1590.3170.576
WM%0.0070.9310.4280.516
Left InsulaGroup0.4130.5230.1730.679
Age0.5570.4590.1840.970
Sex2.7350.1043.3160.074
GM%10.0450.0034.2320.045
WM%0.0020.9671.4010.242
Right ThalamusGroup0.5250.4720.3510.556
Age0.5580.4580.2690.606
Sex10.3160.0020.4490.506
GM%0.1660.6850.0420.839
WM%1.9600.1680.0030.953
Left ThalamusGroup0.5230.4730.9260.341
Age0.1820.6710.0010.974
Sex6.2270.0160.9170.172
GM%2.5680.1150.3410.562
WM%2.7180.1060.3560.131
Abbreviations: tCho: glycerophosphorylcholine + phosphorylcholine; tNAA: N-acetylaspartate (NAA) + N-acetylaspartylglutamate (NAAG); DLPFC: dorsolateral prefrontal cortex; ACC: anterior cingulate cortex; GM: gray matter; WM: white matter.
Disclaimer/Publisher’s Note: The statements, opinions and data contained in all publications are solely those of the individual author(s) and contributor(s) and not of MDPI and/or the editor(s). MDPI and/or the editor(s) disclaim responsibility for any injury to people or property resulting from any ideas, methods, instructions or products referred to in the content.

