Article

Glycosylation Analysis of Urinary Peptidome Highlights IGF2 Glycopeptides in Association with CKD

1
Center of Systems Biology, Biomedical Research Foundation of the Academy of Athens, 11527 Athens, Greece
2
Institute for Molecular Cardiovascular Research, RWTH Aachen University Hospital, 52074 Aachen, Germany
3
Mosaiques Diagnostics GmbH, 30659 Hannover, Germany
4
Department of Internal Medicine and Pediatrics, Nephrology Division, Ghent University Hospital, 9000 Gent, Belgium
*
Author to whom correspondence should be addressed.
Int. J. Mol. Sci. 2023, 24(6), 5402; https://doi.org/10.3390/ijms24065402
Submission received: 3 February 2023 / Revised: 26 February 2023 / Accepted: 8 March 2023 / Published: 11 March 2023
(This article belongs to the Special Issue Proteomic Analysis of Kidney Diseases)

Abstract

:
Chronic kidney disease (CKD) is prevalent in 10% of world’s adult population. The role of protein glycosylation in causal mechanisms of CKD progression is largely unknown. The aim of this study was to identify urinary O-linked glycopeptides in association to CKD for better characterization of CKD molecular manifestations. Urine samples from eight CKD and two healthy subjects were analyzed by CE-MS/MS and glycopeptides were identified by a specific software followed by manual inspection of the spectra. Distribution of the identified glycopeptides and their correlation with Age, eGFR and Albuminuria were evaluated in 3810 existing datasets. In total, 17 O-linked glycopeptides from 7 different proteins were identified, derived primarily from Insulin-like growth factor-II (IGF2). Glycosylation occurred at the surface exposed IGF2 Threonine 96 position. Three glycopeptides (DVStPPTVLPDNFPRYPVGKF, DVStPPTVLPDNFPRYPVG and DVStPPTVLPDNFPRYP) exhibited positive correlation with Age. The IGF2 glycopeptide (tPPTVLPDNFPRYP) showed a strong negative association with eGFR. These results suggest that with aging and deteriorating kidney function, alterations in IGF2 proteoforms take place, which may reflect changes in mature IGF2 protein. Further experiments corroborated this hypothesis as IGF2 increased plasma levels were observed in CKD patients. Protease predictions, considering also available transcriptomics data, suggest activation of cathepsin S with CKD, meriting further investigation.

1. Introduction

Chronic Kidney Disease (CKD) is prevalent in 10% of the world’s adult population and is increasingly considered as a silent epidemic, due to its eventual progression to end-stage renal disease (ESRD) [1,2]. CKD is defined by the presence of abnormalities in kidney function and/or structure, for a duration of three or more months. Three aspects: cause, glomerular filtration rate (GFR) and Albuminuria, are important in the classification of CKD [3], with the latter two factors (estimated GFR (eGFR) and levels of Albuminuria) also employed in the diagnosis of CKD [4,5]. However, these parameters have an increased diagnostic value in advanced disease stages, rendering treatment of CKD patients highly challenging.
Despite its complex composition and unlike other biological fluids, urine is highly stable [6] consisting of proteins and peptides from glomerular filtration, shed epithelial cells (kidney and urinary tract), tubular and seminal secretions, and secreted exosomes [7,8,9]. Urinary proteomics studies have gained momentum in recent years, as they provide opportunities for a non-invasive biopsy. In the case of CKD, urine proteomics have highlighted biomarkers for disease diagnosis and progression; guiding therapeutic strategies [10,11].
Protein glycosylation is the most common post translational modification (PTM) [12]. A glycoproteomic study predominantly focuses on the identification of glycoproteins, glycan structures and their sites of attachment in the protein [13,14]. Irrespective of the tremendous advancements in MS/MS-based technologies and respective data analysis solutions, the identification of PTMs, especially glycosylation, continues to be taxing. This can be attributed mainly to the complex and heterogenous nature of glycan structures linked to either Asparagine (N-linked) or Serine/Threonine (O-linked) amino acid residues [15]. The importance of different types of glycosylation (N-linked and O-linked) has already been highlighted in numerous physiological and pathological mechanisms related to inflammation, angiogenesis and cancer [16,17,18]. Along these lines, this study was carried out under the hypothesis that characterization of glycopeptides in the urine can reveal pathological mechanisms in CKD.
Urinary proteomics to date has identified more than 5000 proteins [19,20,21], while the analysis of urinary glycoproteins is still at its initial stage with the identified number being in the hundreds [22,23]. In the context of CKD, only a handful successful studies on urinary glycopeptidomics exist [24] in their vast majority, focusing on N-linked glycopeptides. Due to the availability of fragmentation knowledge on O-linked glycosylation, an in-depth characterization of O-linked glycans, their attachment sites and protein carriers is warranted. To the best of our knowledge, this is the first study that focuses on identifying “intact” urinary O-linked glycopeptides and exploring their association with CKD.
Specifically, in this study, urinary glycopeptides were identified by a combination of Capillary Electrophoresis-Tandem Mass Spectrometry (CE-MS/MS) and glycopeptide-specific MS data analysis. The CE-MS technology presents many advantages including high resolution, fast separation, use of inexpensive and robust capillaries, compatibility with common volatile buffers and analytes, and a stable and constant flow, while allowing an easy coupling with Higher-energy C-trap dissociation MS (HCD-MS) for peptide sequencing [25,26,27,28]. The applied approach (summarized in Figure 1) targeted the identification of “intact” naturally occurring urinary glycopeptides in humans, along with information on the glycan structure, composition and attachment sites; with the ultimate aim to identify urinary O-linked glycopeptides in association to CKD and contribute to better characterization of its molecular manifestations.

2. Results

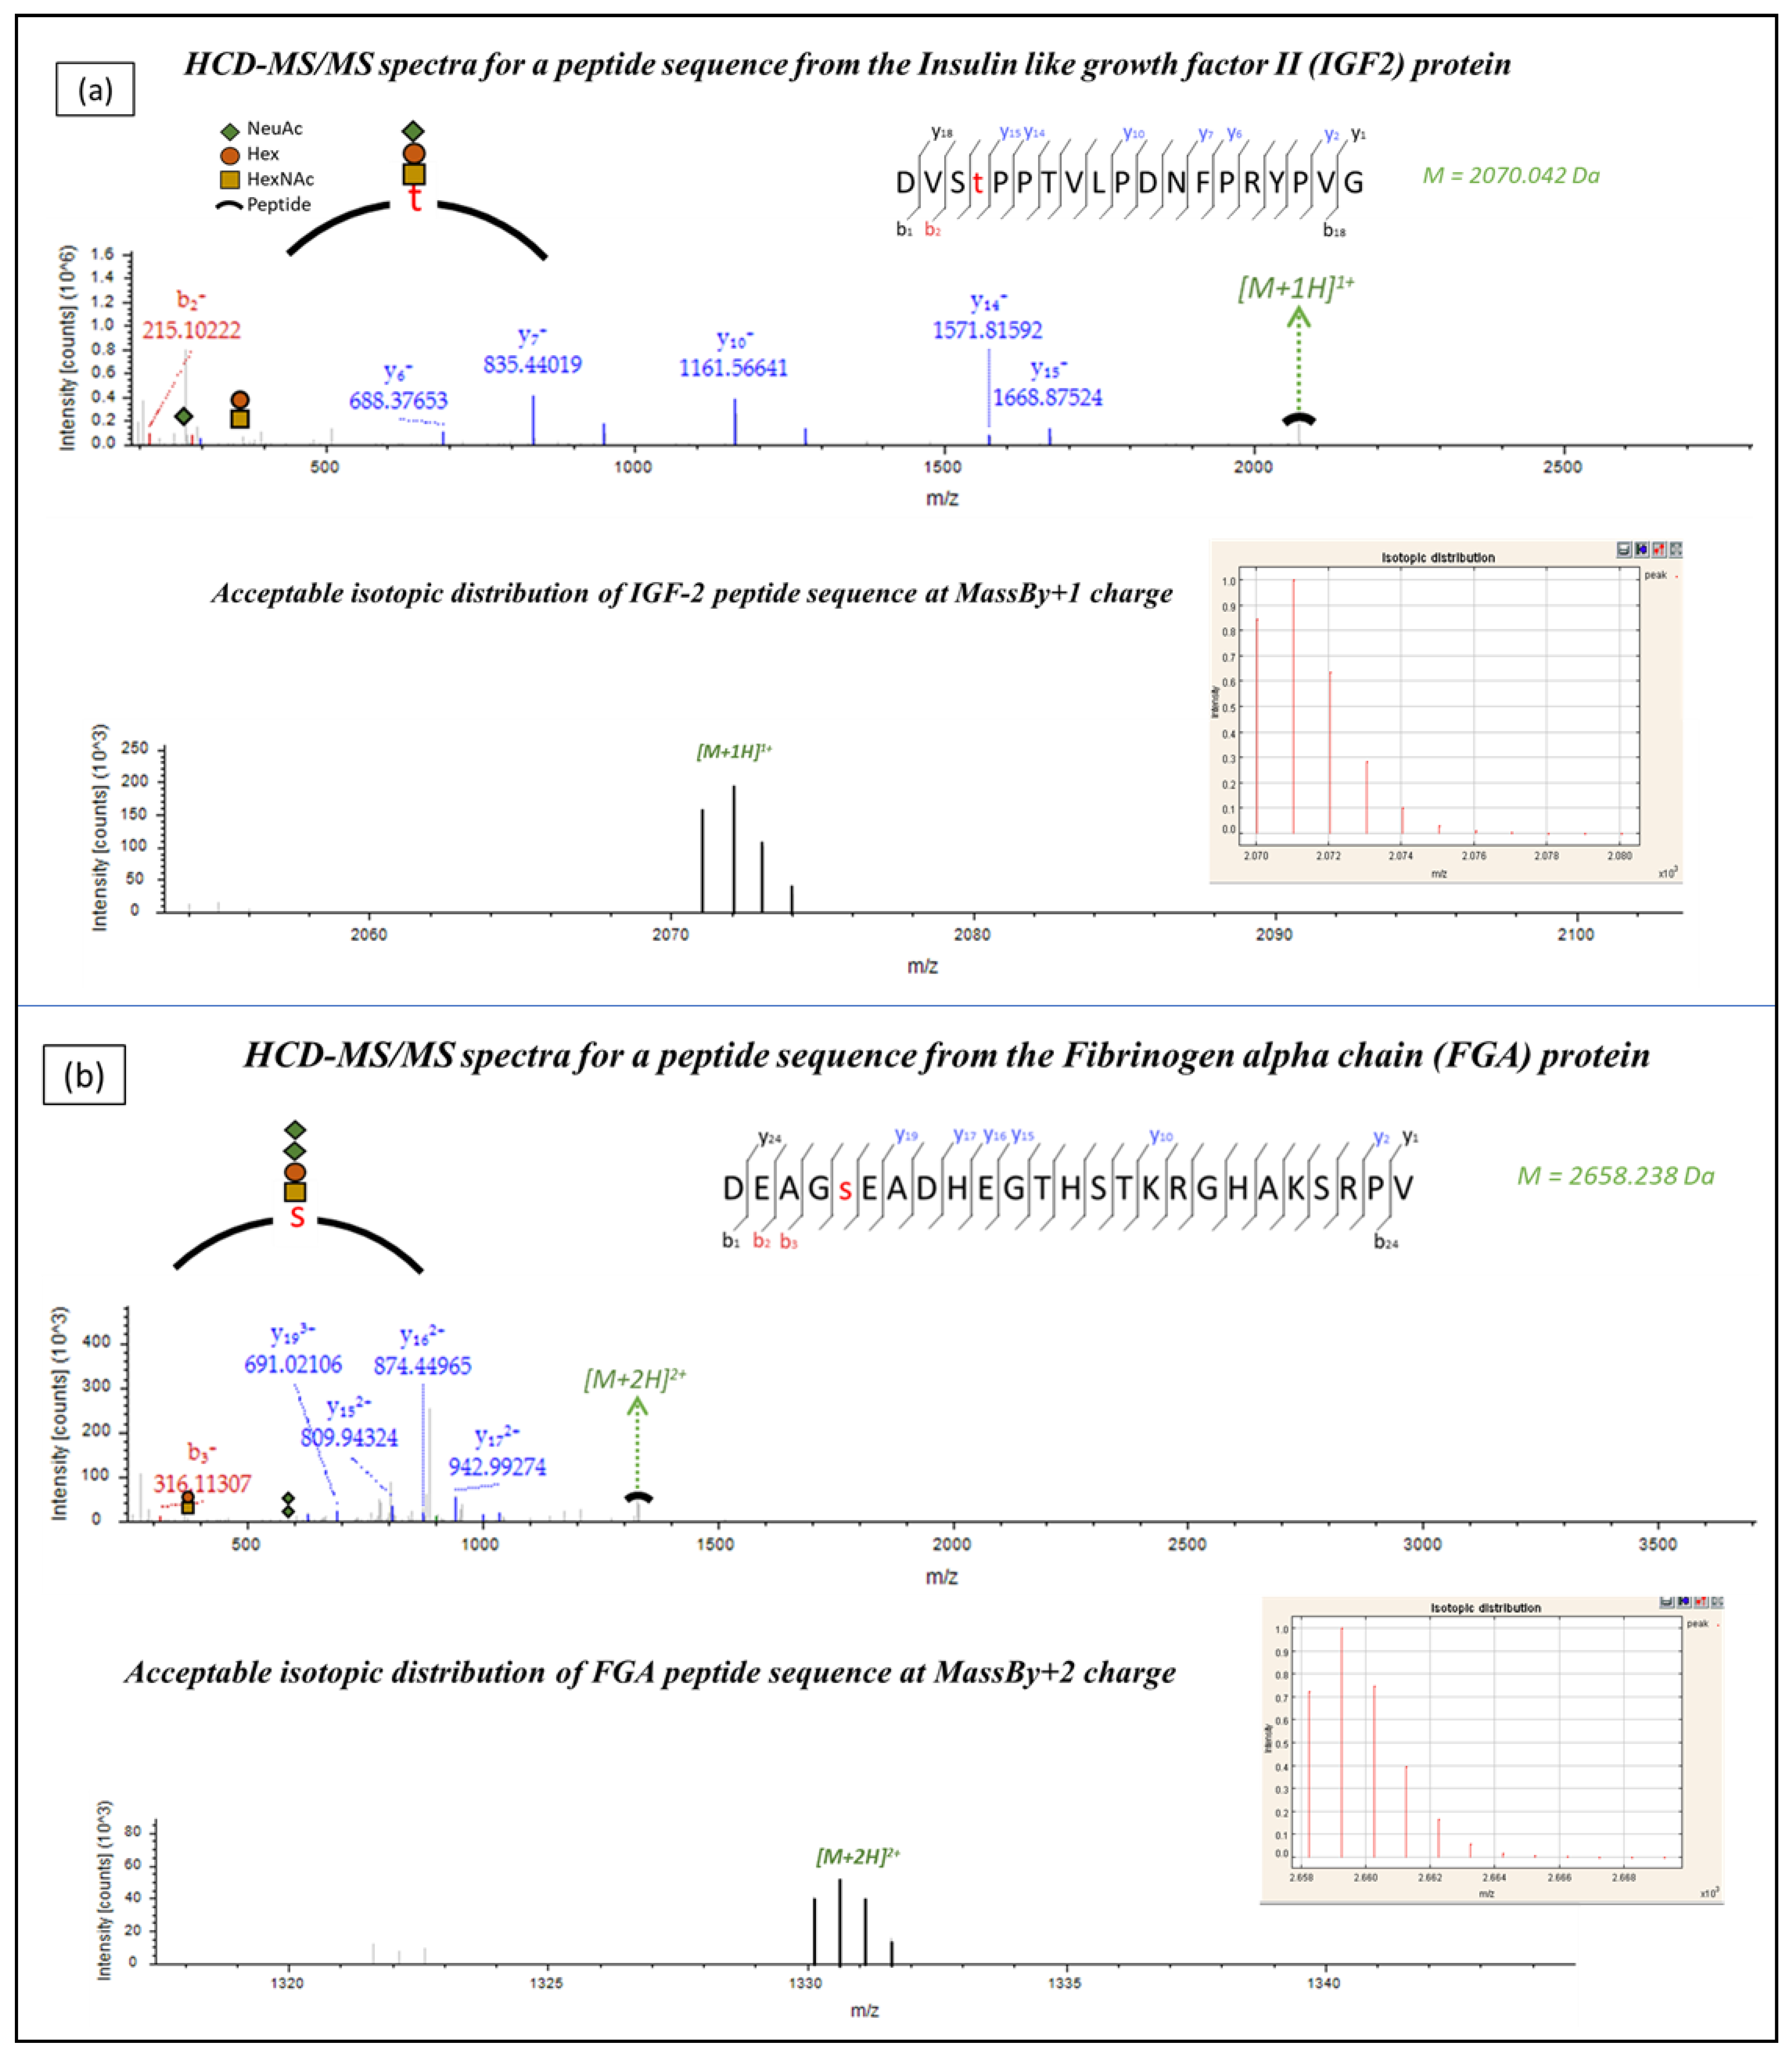
2.1. Identification of Urinary Glycopeptides

To identify naturally occurring urinary glycopeptides, urine samples from eight CKD patients and two healthy subjects were analyzed using CE-MS/MS. The MS/MS output datafiles were then processed by Proteome Discoverer 1.4 (the output of protein identifications is provided in Table S1 and peptide identifications in Table S2), that considered O-linked glycosylation as a variable modification, yielding a list of 120 possible glycopeptides. Further correlation of experimental and theoretically predicted CE migration times based on a regression equation described in detail by Zurbig et al. [29] yielded a shortlist of 65 possible glycopeptides which matched the predicted m/z and migration time location. The MS/MS spectra outputs of the resulting 65 possible glycopeptide peaks were further manually analyzed, including a comparison of the experimental and theoretical isotopic distributions of the glycopeptide peaks (examples are shown in Figure 2).
This manual spectral analysis step resulted in a final list of 17 high confidence glycopeptide identifications (Table 1). As shown (Table 1), the 17 glycopeptides were generated from seven different glycoproteins: six out of seventeen glycopeptides were derived from Insulin-like growth factor II [IGF2], three glycopeptides originated from Vitamin K-dependent protein C [PROC], three from Inter-alpha-trypsin inhibitor heavy chain H1 [ITIH1], two from Fibrinogen alpha chain [FGA] and one glycopeptide each of CD99 antigen [CD99], Fibronectin [FN1] and Tumor necrosis factor receptor superfamily member 10D [TNFRSF10D]. The detection frequency and abundance of these glycopeptides was then investigated in the Human Urinary proteome database (n = 3810) [21,30,31], as also depicted in Table 1.

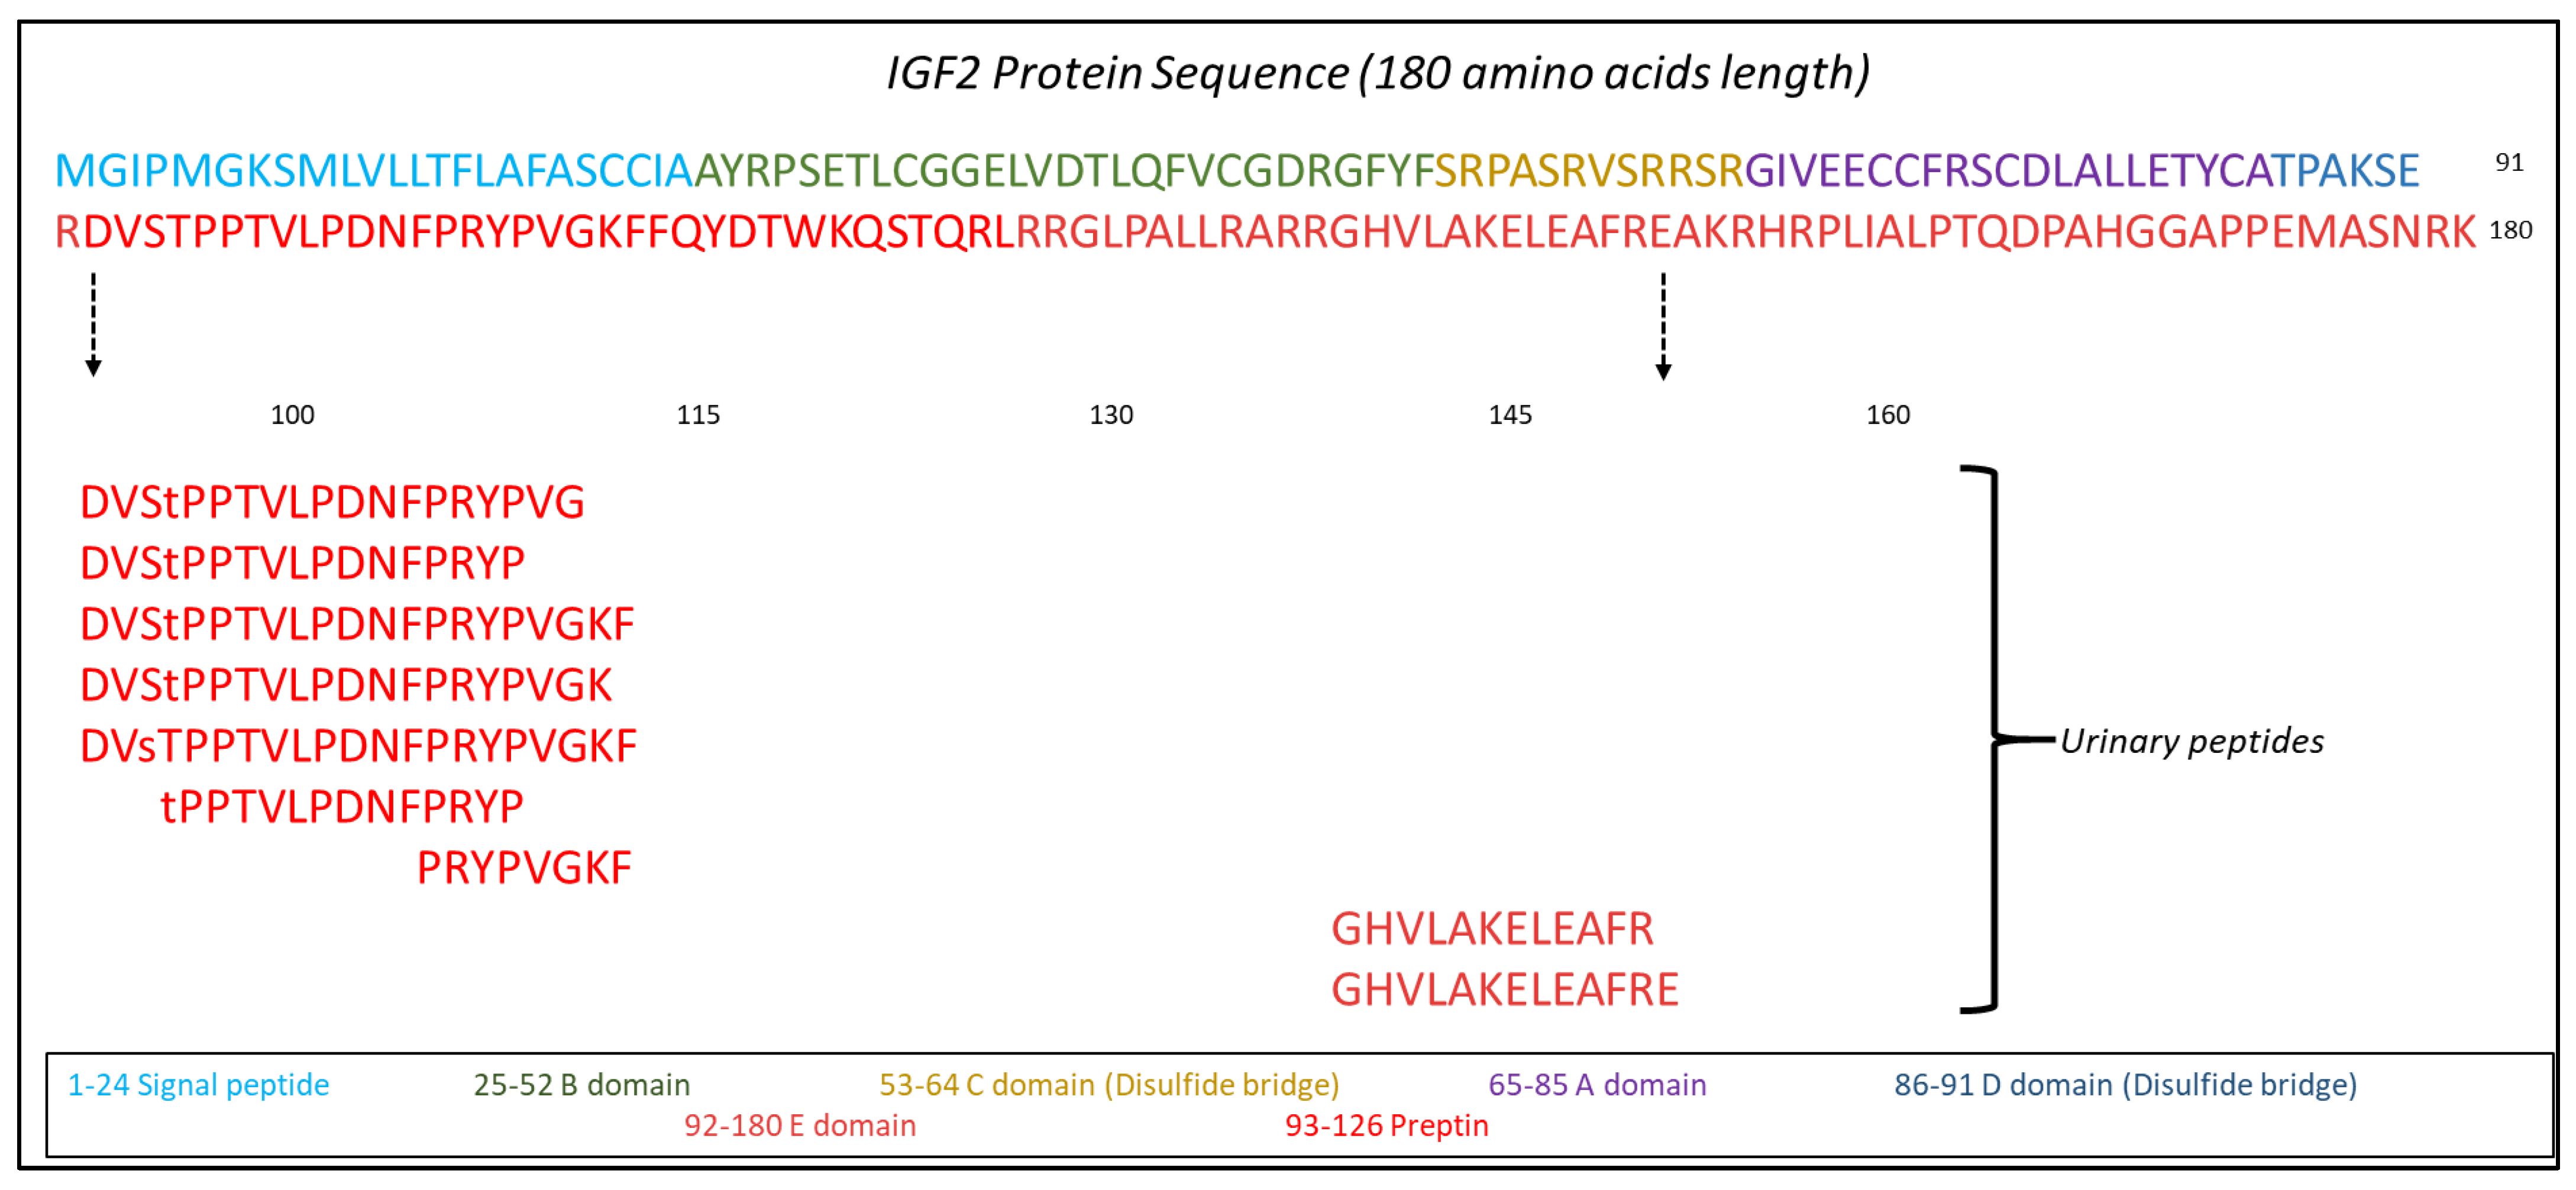
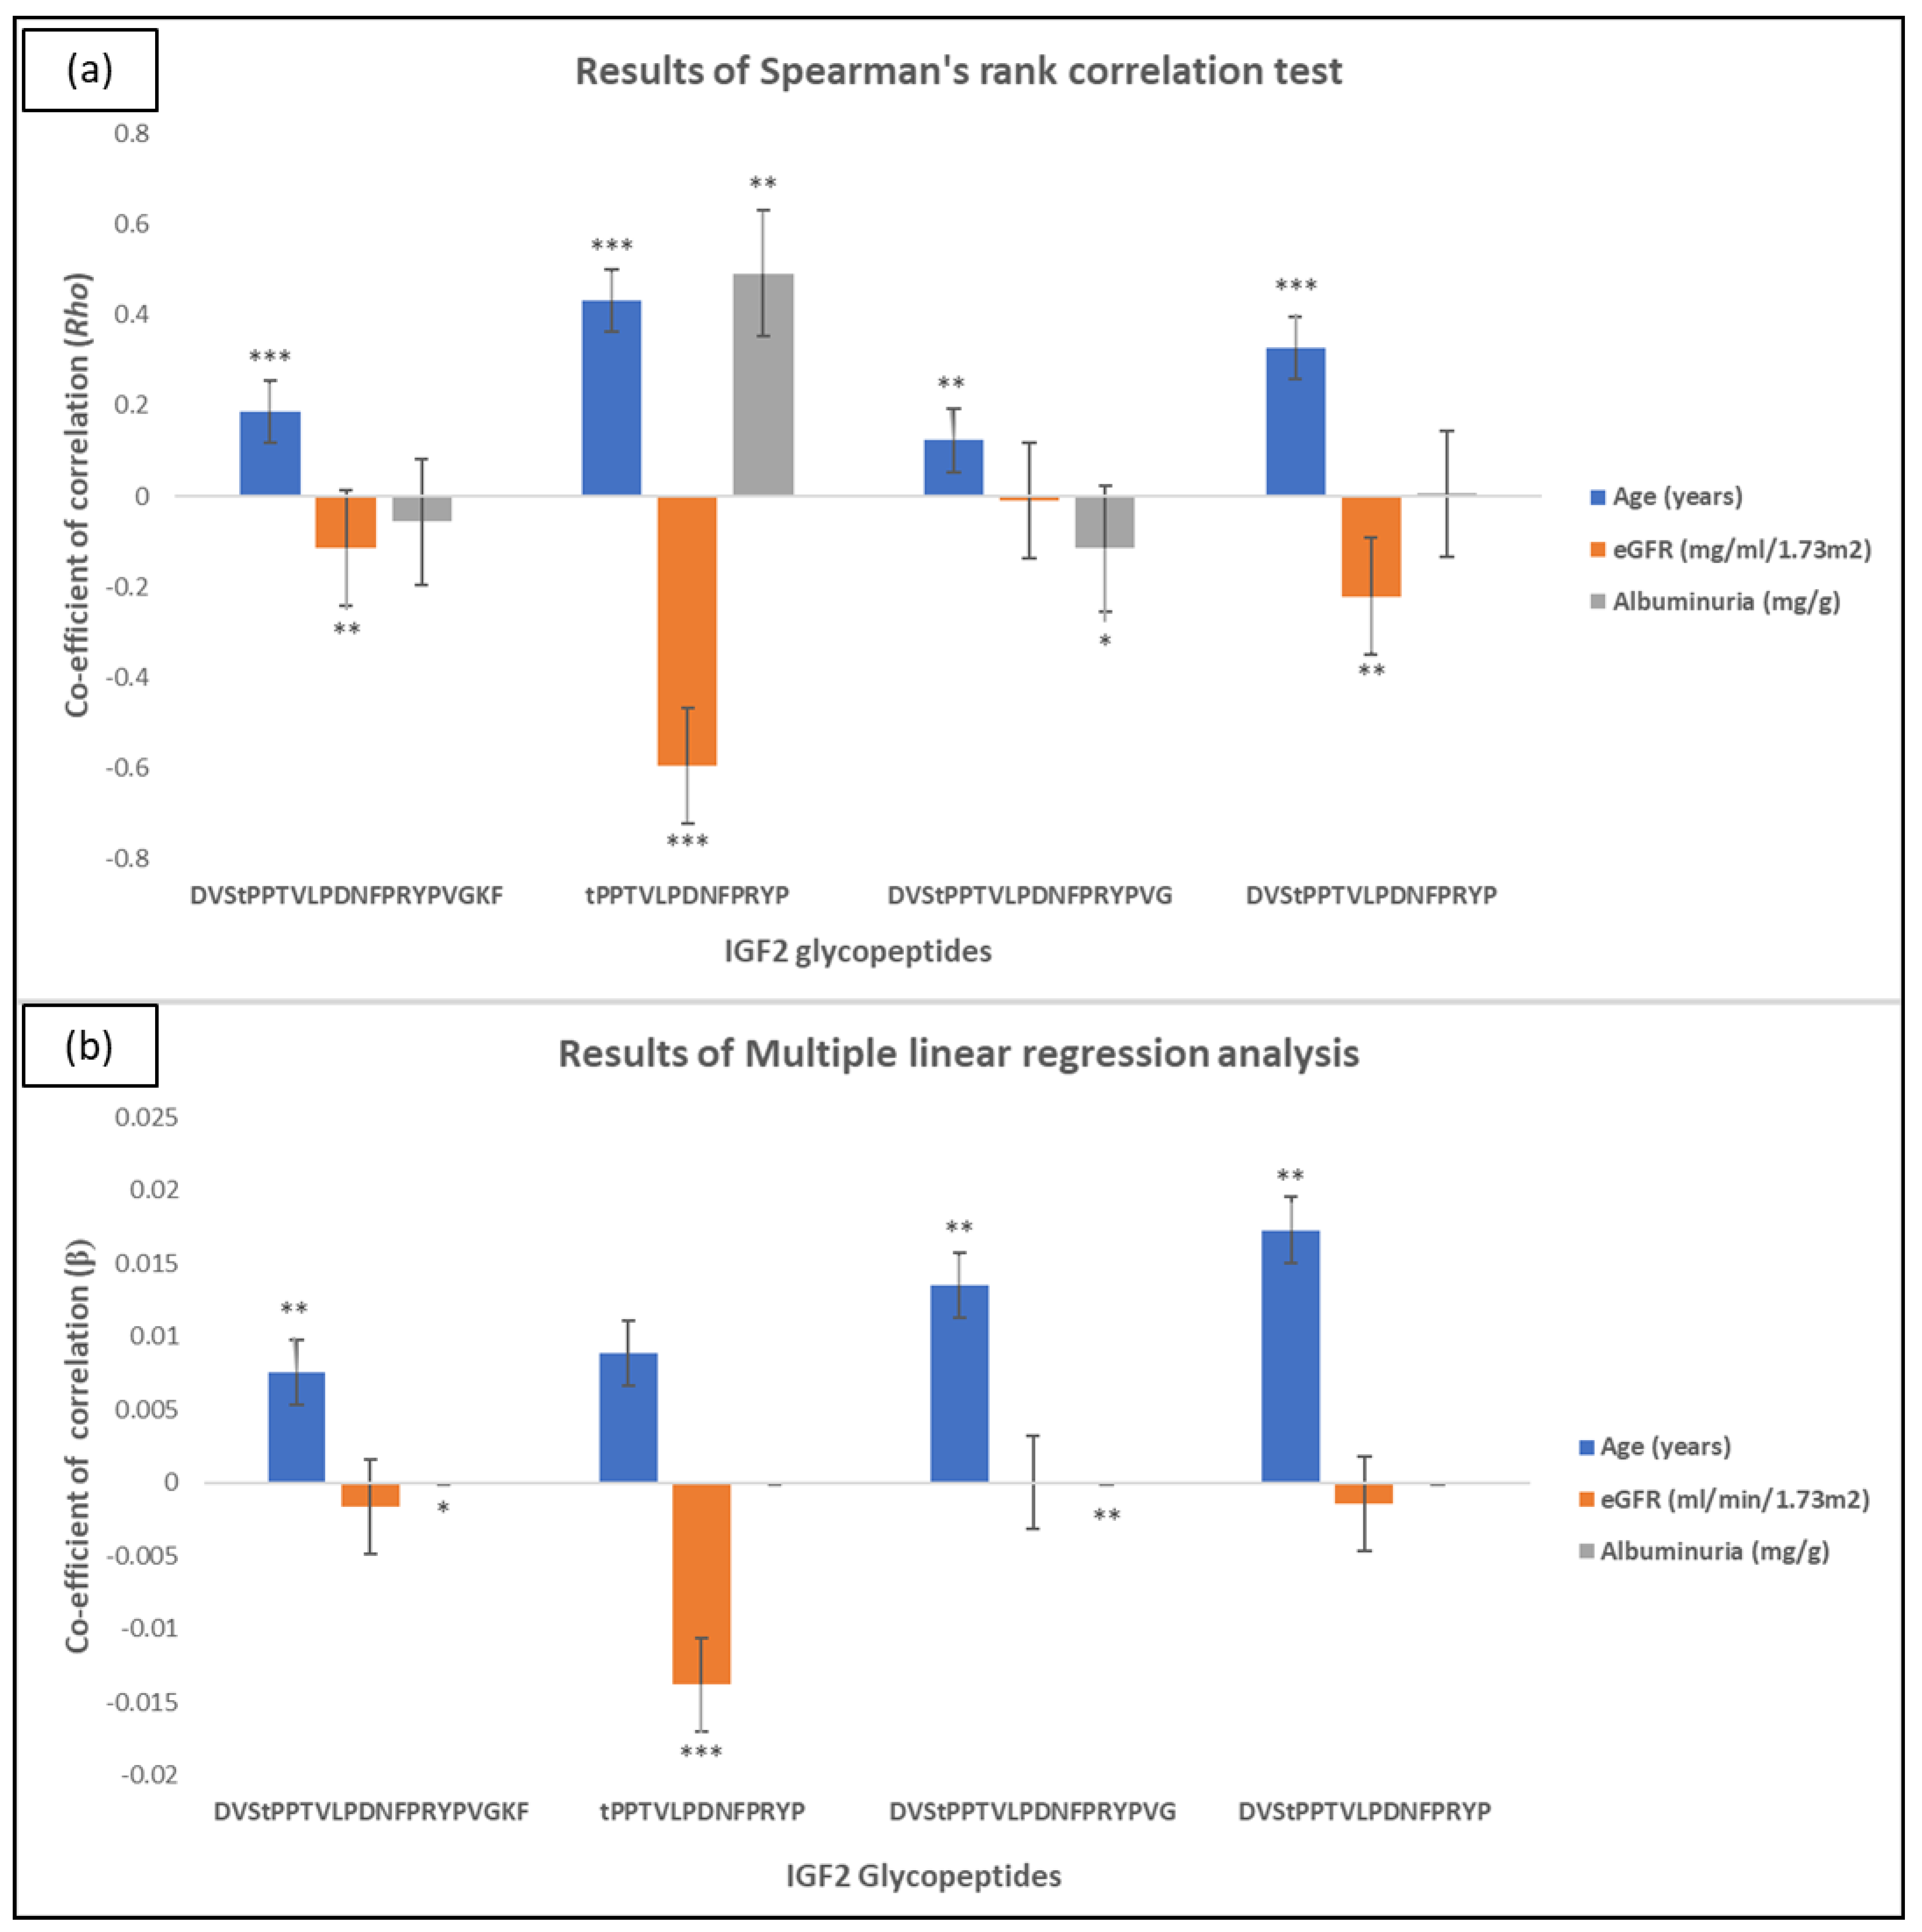
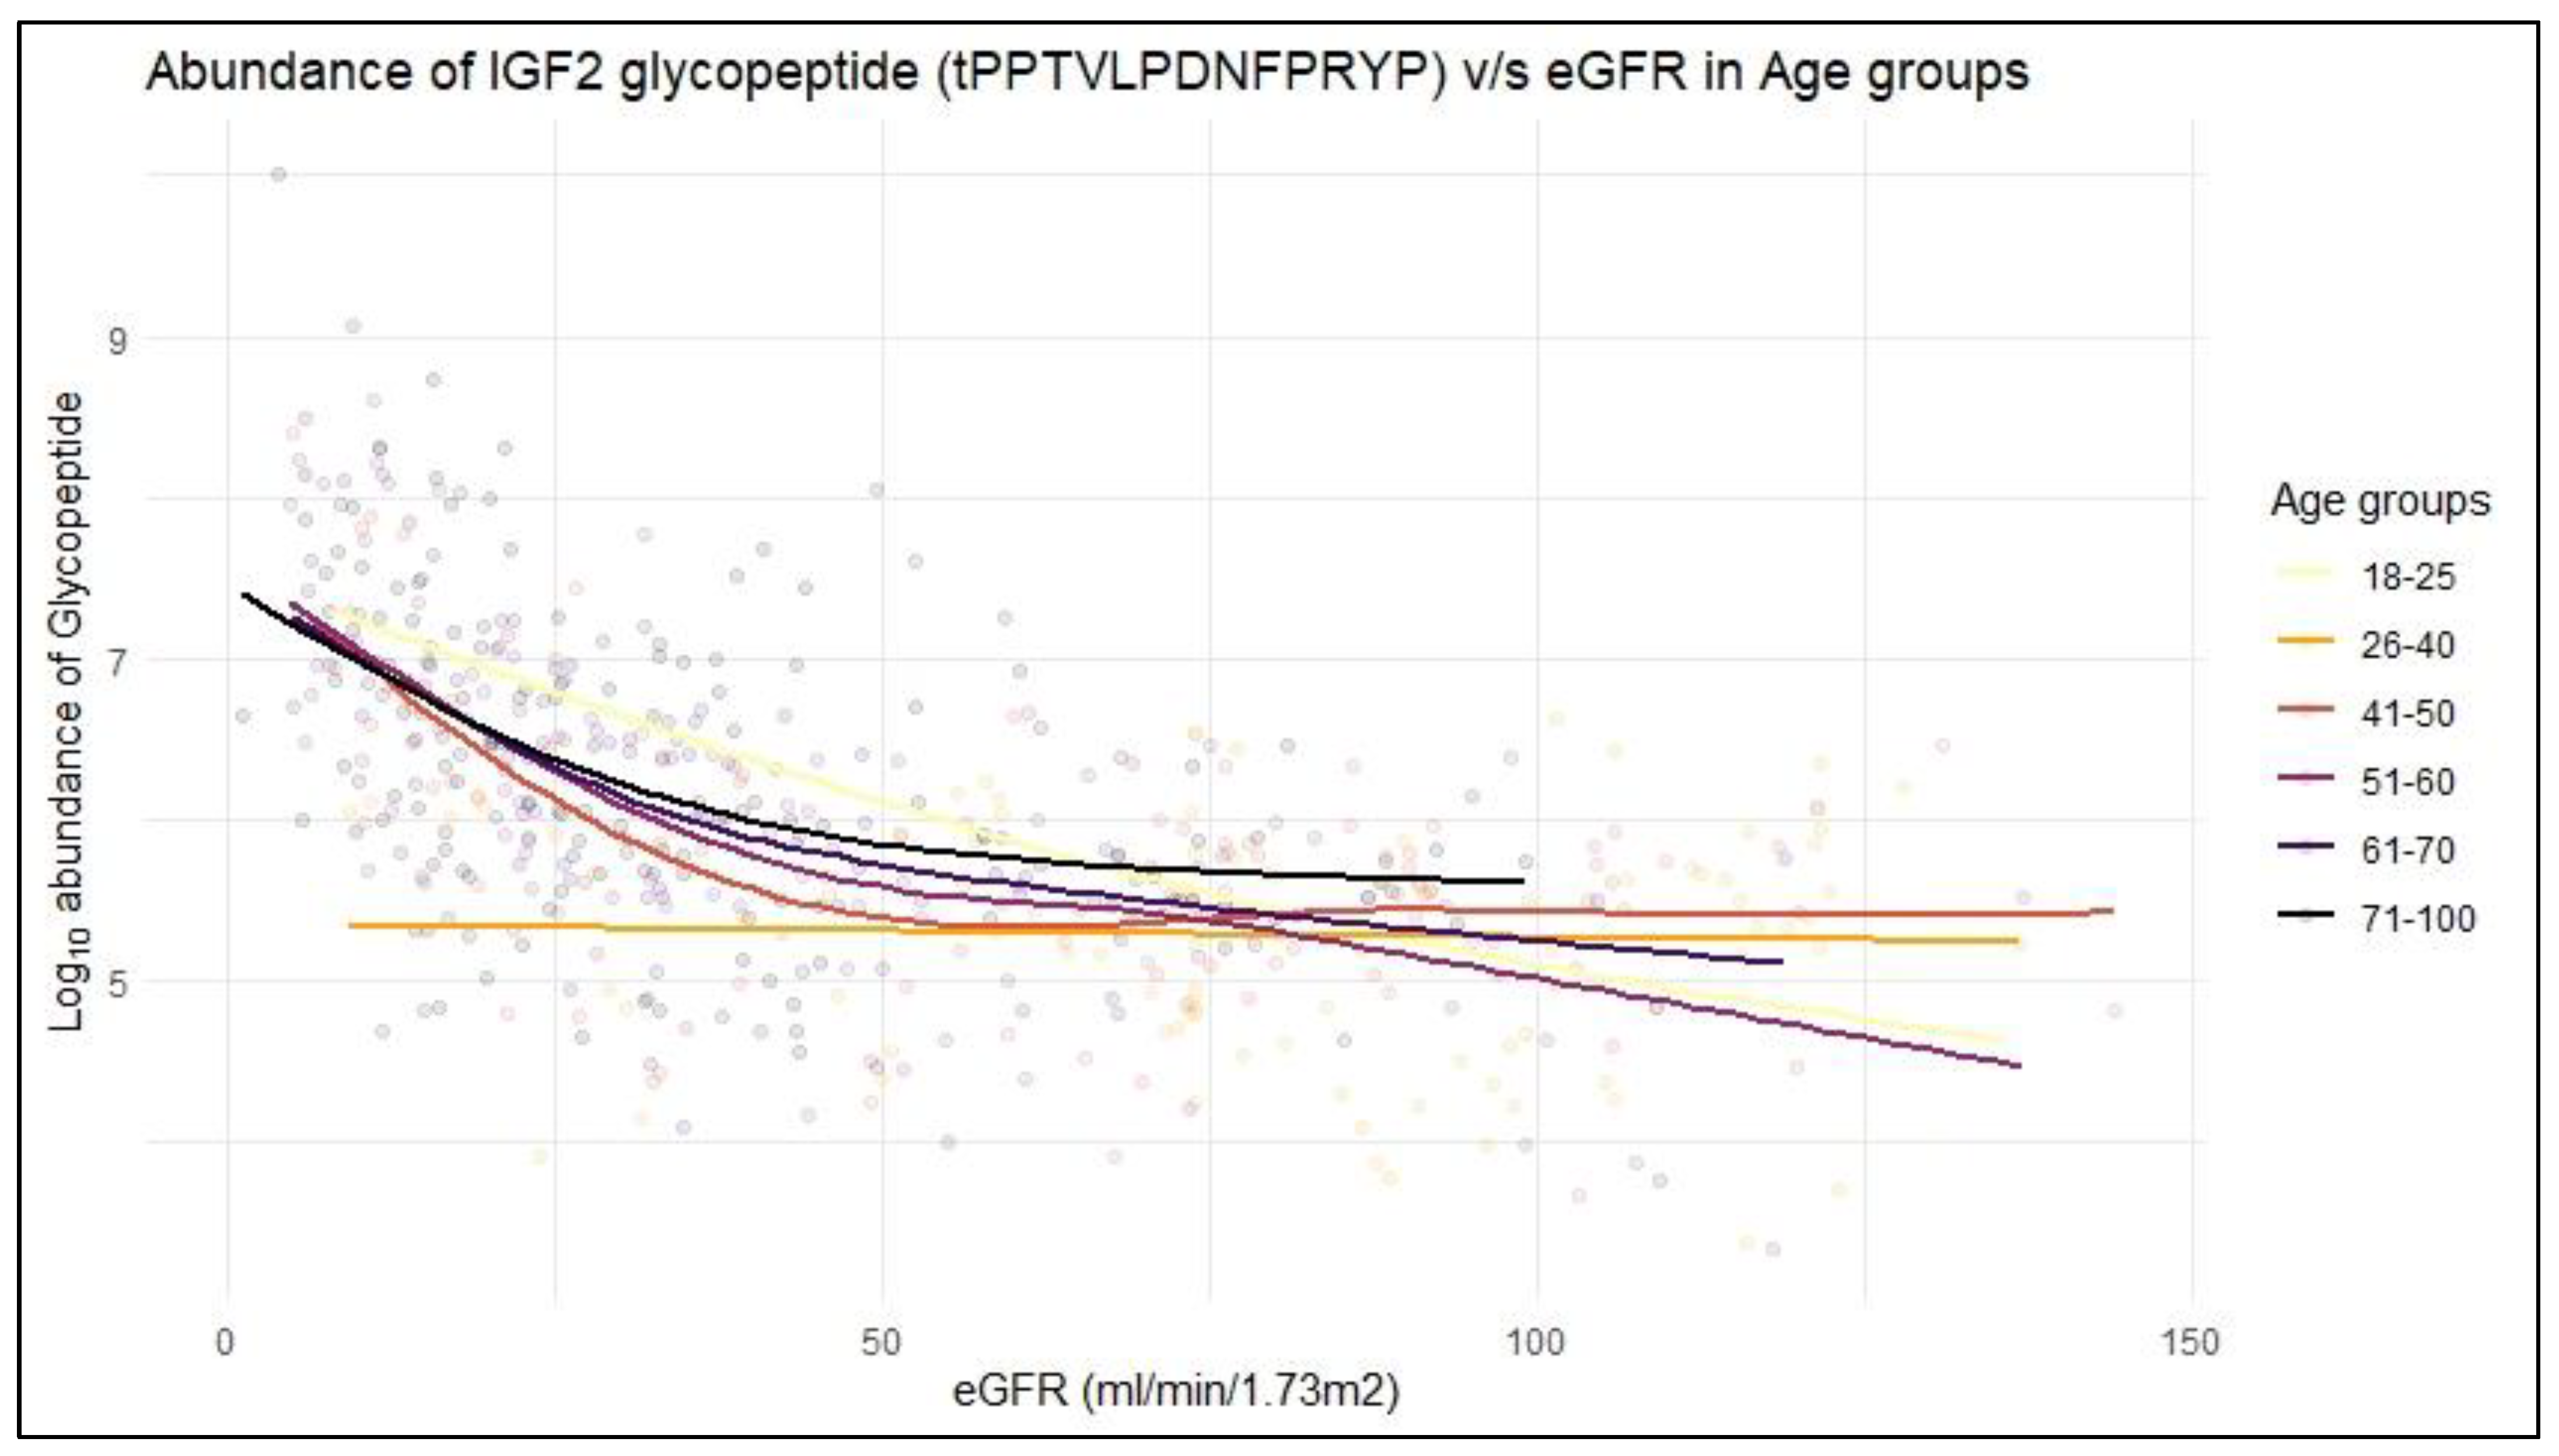
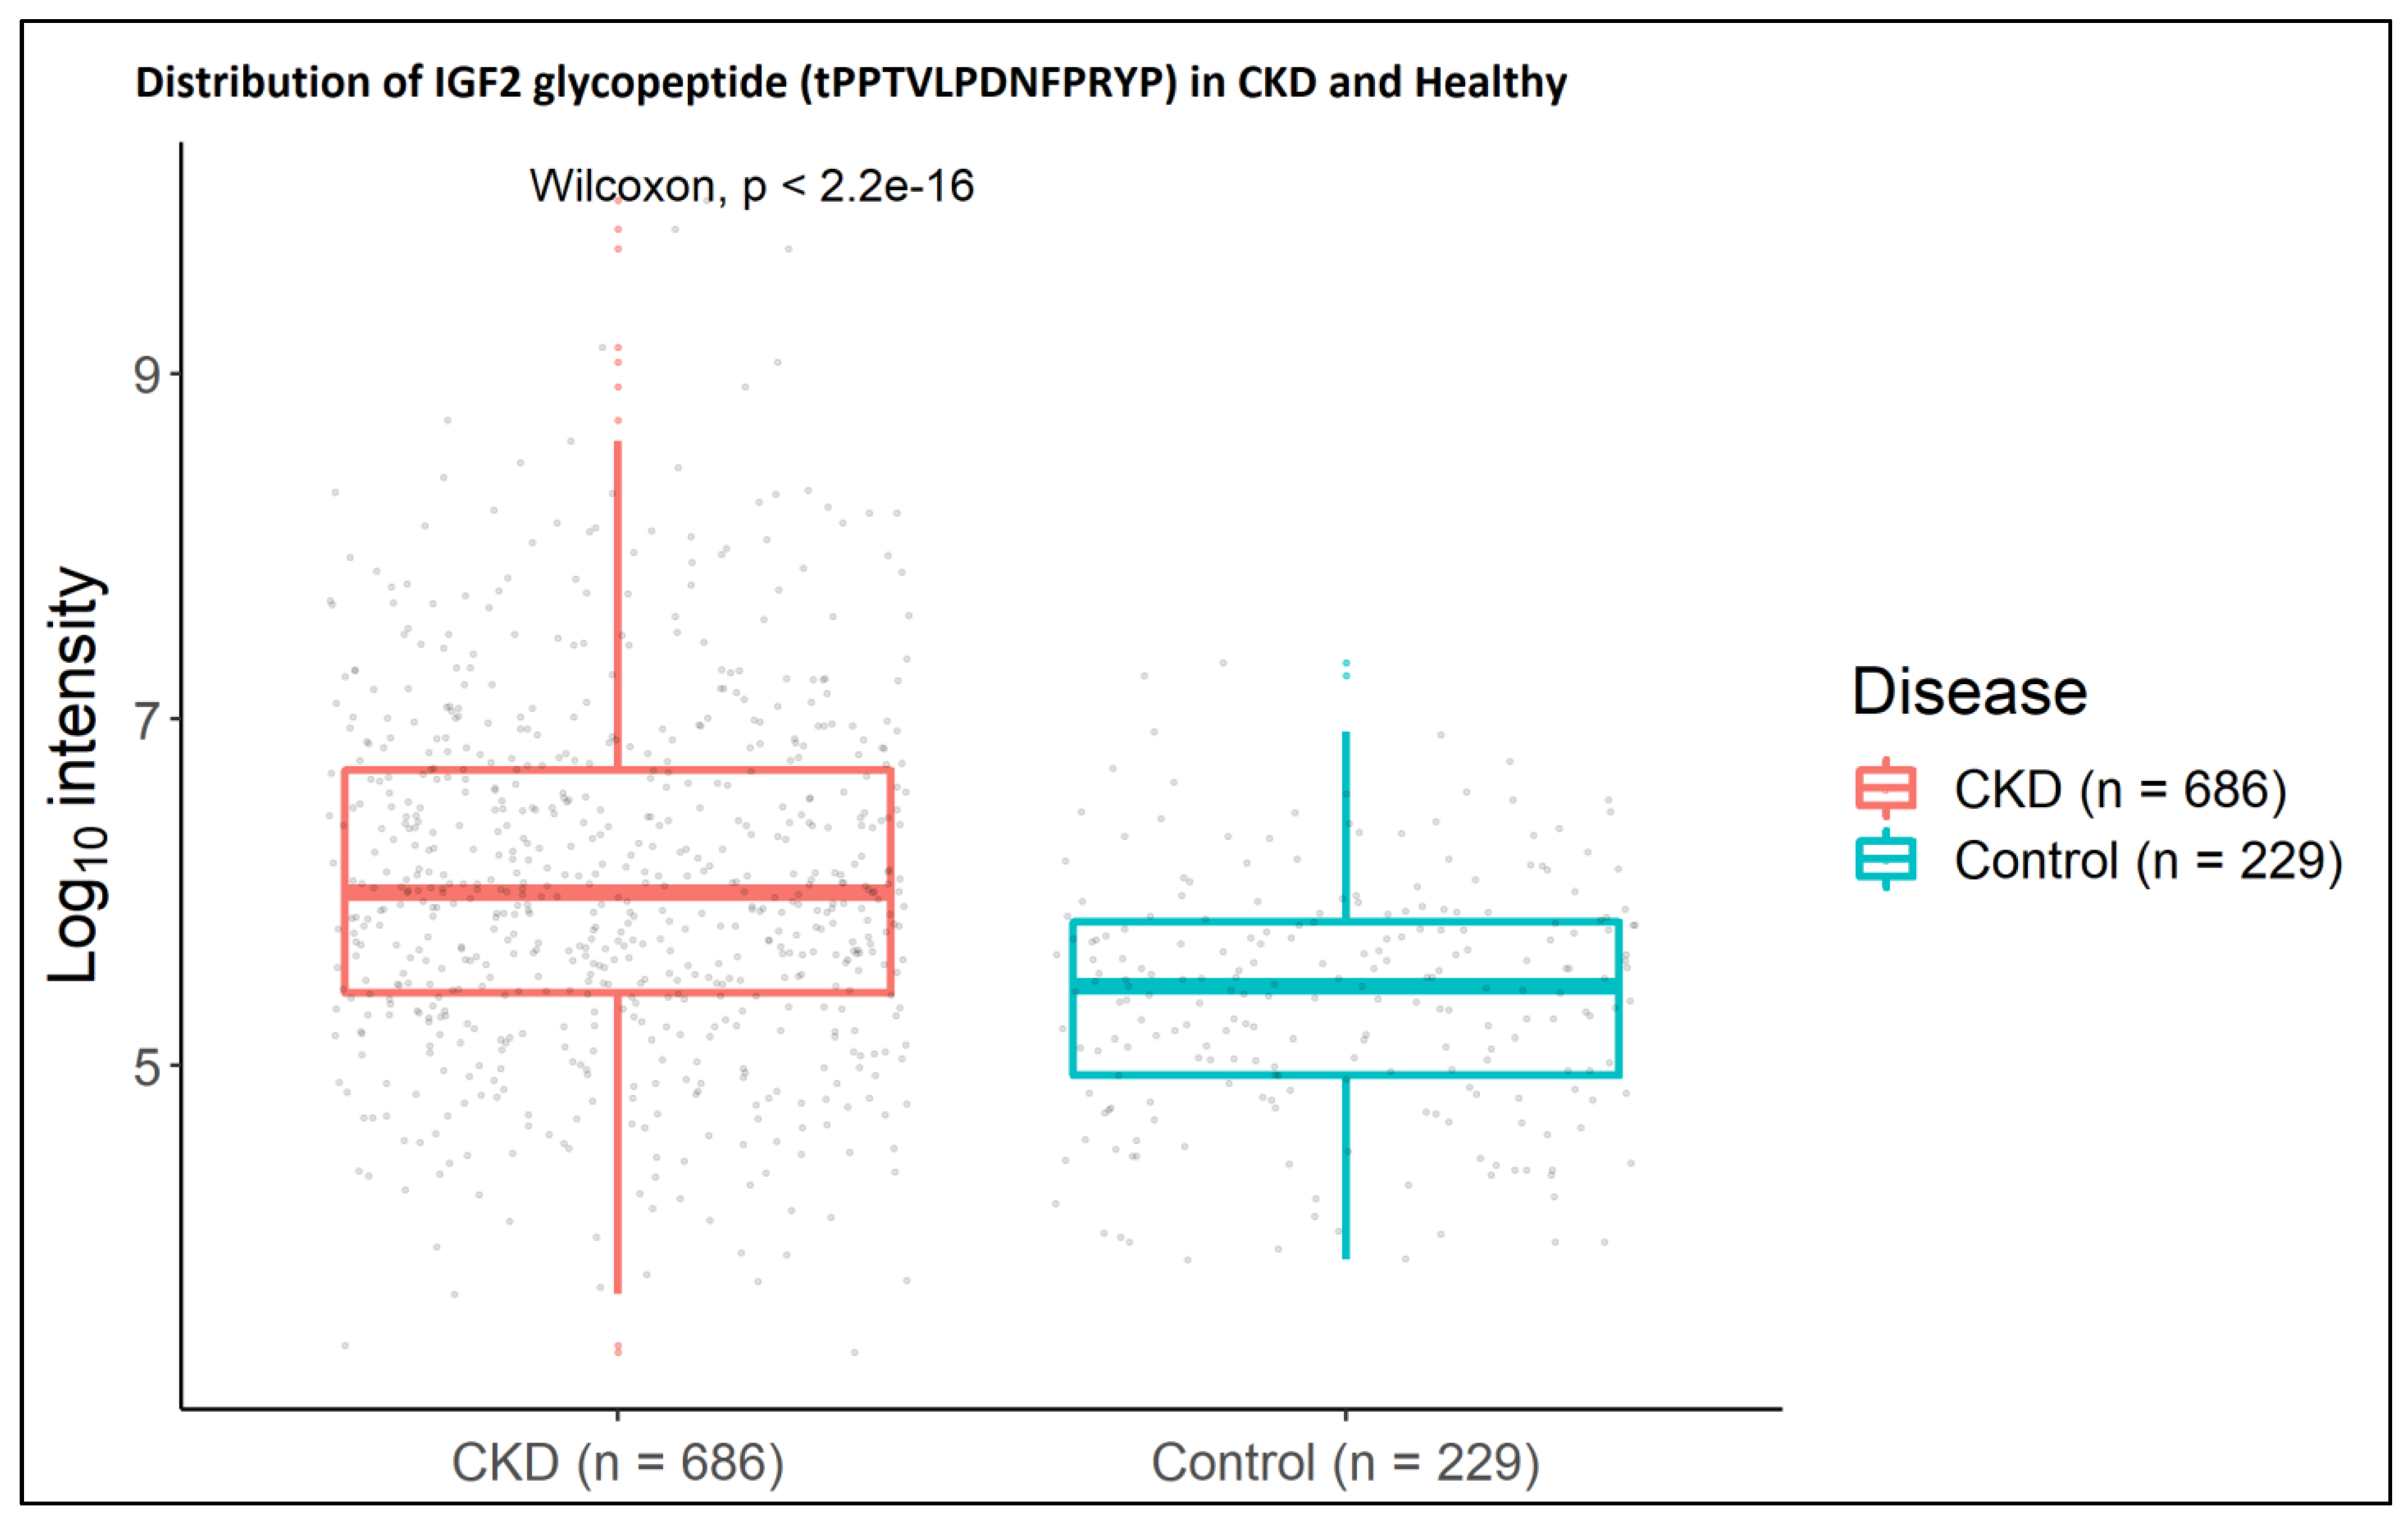
2.2. IGF2 Glycopeptides in Association to CKD

As the IGF2 glycopeptides were represented at the highest frequency and abundance in comparison to the rest of the identified glycopeptides (Table 1), a more detailed analysis was pursued to investigate their relevance to CKD. Further investigation of the Human urinary proteome database [21,30,31] also revealed three non-glycosylated peptides of IGF2 previously identified (Table S3). Interestingly, all the detected IGF2 peptides belonged to the E-domain of the protein, as illustrated in Figure 3.
Four IGF2 glycopeptides were observed in at least 10% of subjects from the Human urinary proteome database (Table 1, first four rows). Given that this high frequency would allow for reliable statistical analyses, these four glycopeptides were considered for further investigation in association with CKD. A correlation of their abundance with clinical parameters (Age, eGFR and Albuminuria) was then performed in the extracted urinary peptide profiles from the database (n = 3810), as allowed per data availability. A detailed correlation report is provided in the Supplementary information (Table S4). As shown (Figure 4a), all peptides exhibited positive correlations with Age, with three of them also exhibiting negative correlations with eGFR based on Spearman’s rank correlation analysis. Associations with Albuminuria could also be occasionally observed suggesting collectively an interplay of all clinical parameters in the determination of peptide abundance.
To better characterize this interplay, multiple linear regression analyses were also conducted (Table S4), with results being depicted in Figure 4b. As shown, 3 out of 4 glycopeptides (DVStPPTVLPDNFPRYPVGKF; DVStPPTVLPDNFPRYPVG and DVStPPTVLPDNFPRYP) retained an independent association to Age, with DVStPPTVLPDNFPRYPVG also retaining association to Albuminuria. Interestingly one of the peptides (tPPTVLPDNFPRYP) was significantly and independently associated with eGFR [β = −0.014, p < 0.0001].
To further enhance the validity of this observation related to the specific association of the glycopeptide (tPPTVLPDNFPRYP) with eGFR, correlation analysis of its abundance with eGFR was also performed, following stratification of the available cohort (urinary peptide profiles extracted from the database) in different age groups. In line to the multiple regression analysis, the glycopeptide tPPTVLPDNFPRYP retained a statistically significant and negative correlation with eGFR in five out of six age groups, 18–25 years [p < 0.001, Rho = −0.69], 41–50 years [p < 0.001, Rho = −0.43], 51–60 years [p < 0.001, Rho = −0.56], 61–70 years [p < 0.001, Rho = −0.56] and 71–100 years [p < 0.001, Rho = −0.54] with the other 3 glycopeptides showing no significant correlation with eGFR. These results for the peptide tPPTVLPDNFPRYP are also illustrated in Figure 5, where the data were fit using a generalized additive model (GAM), with the detailed correlation test report being provided in Table S4.
Given the interesting abundance pattern of the tPPTVLPDNFPRYP glycopeptide, a further analysis was performed targeting its investigation per disease etiology. As summarized in Table 2, the glycopeptide (tPPTVLPDNFPRYP) abundance exhibited statistically significant and negative correlations with eGFR in IgAN, CKD, DKD, Nephroscelrosis, FSGS, tubular nephritis as well as healthy control datasets. For comparison, correlations could occasionally also be observed for two of the other glycopeptides (DVStPPTVLPDNFPRYPVGKF and DVStPPTVLPDNFPRYP), which given the combined results of the Spearman’s correlation test and multiple linear regression analysis (Figure 4), may be related to Age and/or Albuminuria correlations of these peptides, respectively.
Along the same lines, the urinary IGF2 glycopeptide tPPTVLPDNFPRYP was found at a statistically significant increased abundance in CKD (n = 686) urinary peptide profiles in comparison to those of healthy controls (n = 229) (Figure 6).

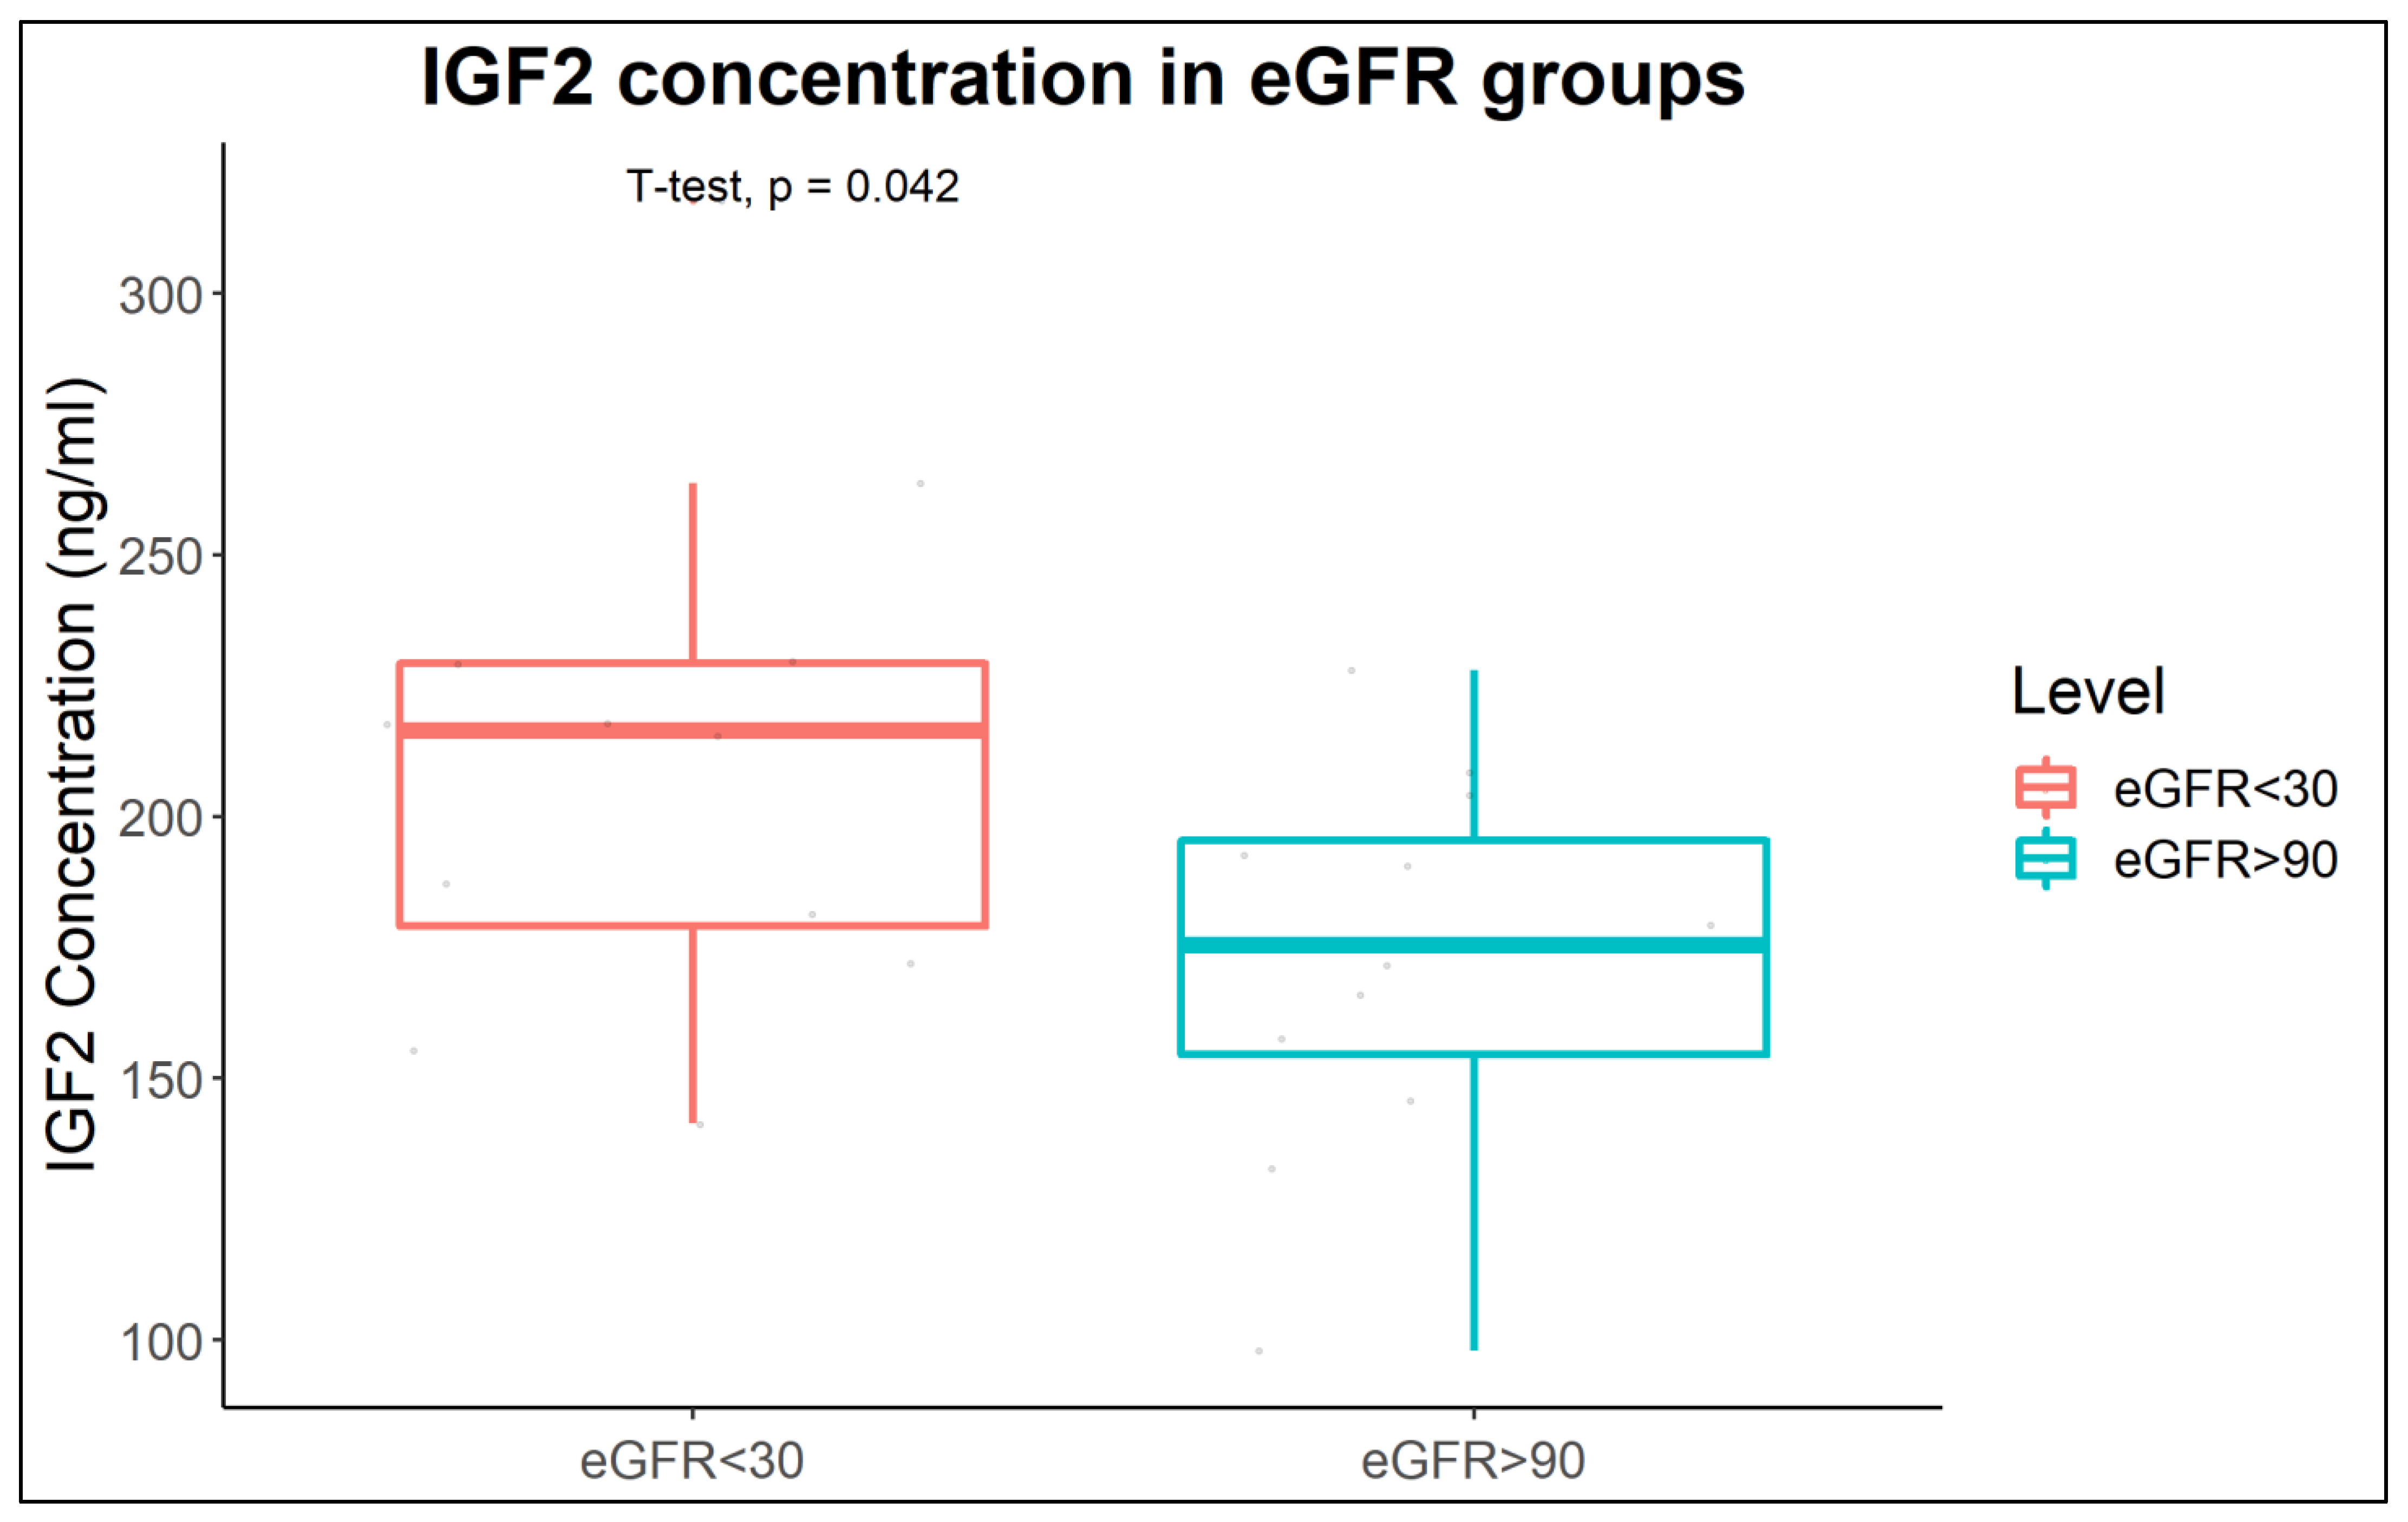
2.3. Increased IGF2 Abundance in Plasma of CKD Patients

The specific association of the urinary glycopeptide tPPTVLPDNFPRYP with eGFR generated the hypothesis that this may be reflective of increased IGF2 levels in CKD. To explore this hypothesis, a pilot study was conducted, targeting quantification of IGF2 protein in plasma. A total of 24 samples of well-matched CKD samples and controls were analyzed corresponding to eGFR < 30 mL/min/1.73 m2 (n = 12) and eGFR > 90 mL/min/1.73 m2 (n = 12). Figure 7 shows graphically the results of the enzyme-linked immunosorbent assay (ELISA) analysis supporting a statistically significant increase in plasma levels of the IGF2 protein in the eGFR < 30 mL/min/1.73 m2 group when compared with the eGFR > 90 mL/min/1.73 m2 group [t = 2.1676, df = 20.294, p = 0.04225]. The detailed ELISA analysis report is presented (Table S5).

2.4. Protease Prediction

To further predict proteases potentially involved in the cleavage of the CKD-specific IGF2 glycopeptide tPPTVLPDNFPRYP (at Serine 95-glycosylated Threonine 96 site), the Proteasix tool was used. The analysis yielded a list of six endopeptidases putatively associated with the cleavage of this peptide at N′ terminal and two endopeptidases responsible for cleavage at C′ terminal (Table S4). Proteases cleaving at the N′ terminal belonged to the Cathepsin (CTSL, CTSS, CTSK) family, Calpains (CAPN1, CAPN2) and meprin A subunit alpha (MEP1A). Neprilysin protease or membrane metallo-endopeptidase (MME) and matrix metalloproteinase (MMP) were predicted to cleave the C′ terminal of the glycopeptide. Given the specific association of only the IGF2 glycopeptide tPPTVLPDNFPRYP with CKD, predictions that were shared amongst the different IGF2 glycopeptides were disregarded, highlighting Cathepsins, as specifically cleaving glycopeptide tPPTVLPDNFPRYP at the N terminus. Of note, statistically significant increased expression of Cathepsin S (CTSS) in CKD in comparison to Normal Kidney was observed based on transcriptomic datasets as available from the Nephroseq database [p = 0.002, t-test = 5.797, fold change = 12.099; Table S6].

3. Discussion

Chronic kidney disease (CKD) is the twelfth most common cause of mortality in the adult population worldwide, with a projection to raise in rank to the fifth position by 2040 [32]. Despite glycosylation being considered a frequent protein modification, its role in CKD is largely unknown. This may be attributed to the highly complex and heterogeneous nature of the glycan structures, especially in the case of O-linked glycosylation, where no evident consensus motif exists. Aiming to fill this gap with this study, naturally occurring “O-linked” urinary glycopeptides were investigated and their association with clinical parameters (Age, eGFR and Albuminuria) relevant to the diagnosis of CKD was established.
In total, 17 glycopeptides deriving from 7 glycoproteins were identified at high confidence (Table 1). Here, IGF2 derived glycopeptides were observed at the highest frequency and abundance, followed by glycopeptides of PROC, ITIH1 and FGA. The generated glycoforms per protein in the clear majority of cases belonged to consistently similar regions of the protein chain with the different glycopeptides per protein varying amongst each other by one to three amino acids. Along these lines, 5 out of 6 IGF2 glycopeptides exhibited the presence of a glycan structure at the same Threonine 96 position, rendering the latter a highly confident site of glycosylation in the IGF2 protein chain. Similarly, in the case of FGA, a glycosylation site at Serine 609; for PROC, on Threonine 19; and for ITIH1 on Serine 651 could consistently be observed. In the case of IGF2, glycoforms of the same peptide DVSTPPTVLPDNFPRYPVGKF (IGF2) with different glycan positions (S3 and T4) and glycan structures [Hex(1)HexNAc(1)NeuAc(1) for S3 and Hex(1)HexNAc(1)NeuAc(2) for T4] were also observed. The identification of different glycoforms of the same glycopeptide confirms the complex microheterogeneity of O-linked glycosylation and the need for more site-specific glycosylation studies [33]. The narrow CE-migration time (mins) frame observed in between the glycoforms of IGF2 glycoprotein (Table 1), may also be reflective of this O-linked microheterogeneity. The reliable identification of these glycoforms can be associated with the fact that CE-MS/MS recognizes features based on their peptide composition (amino acid sequences) and not the glycan structure. In addition, peptides exhibit an affinity to protons, which further results in identification of [M + nH]n+ molecular ions of the glycopeptides [34]. All the glycoforms in this study were identified as singly and/or doubly charged and their isotopic distribution were compared to the theoretical distribution for validation.
Analysis of O-linked “intact” glycopeptides, has also been conducted by Belczacka et al. and Halim et al. [23,35]. In an analogous manner, these authors also focused on identification of intact urinary glycopeptides (both O-linked and N-linked) in healthy [23] or in association to cancer [35]. Some of the glycosylation sites highlighted in our study have also been reported in these and other studies: Threonine 19 in PROC protein was also identified as a highly confident O-linked glycosylation site in Belczacka et al. and Halim et al. [23,35]. Along the same lines, Darula et al. [36] and Campos et al. [37] detected CD99 as an O-linked glycoprotein with Threonine 41 as the glycan attachment site, a finding which was also supported in our study. N- and O-linked glycosylation are widely stated in the literature for FN1 [38] and TNFRSF10D [37] proteins; nevertheless, no previous reports for the presently shown O-linked glycosylation sites at Threonine 19 and Threonine 69, respectively, exist.
The IGF2 peptides exhibited high frequency, high abundance, and predominance in comparison to glycopeptides originating from other urinary proteins, which allowed for their further statistical analysis. Translated IGF2 is produced in the endoplasmic reticulum, in the pre-pro-protein form consisting of a 180 amino acid chain, divided into 6 domains (A to E) plus a 24 amino acid signaling peptide. In the post-translational process of pre-pro- IGF2, the E-domain undergoes O-linked glycosylation in 12 plausible sites, by addition of N-acetyl galactosamine residues, and in the trans-Golgi compartment sialic acid side chains are added to N-acetyl galactosamine. Glycosylation stimulates the next step in the processing of pro-IGF2, where the E-domain is cleaved by PCSK proteases, yielding the “mature IGF2” consisting of 67 amino acids and a molecular weight of 7.5 kDa. This (mature IGF2) is then released in the blood stream by exocytosis, where its pleiotropic roles associated with growth and development are carried out in an auto-/para-/endocrine mode [39,40,41,42].
Based on the abovementioned post-translational processing, numerous proteo-forms of IGF2, differing in size and/or glycosylation pattern exist, of varied affinity to the same targets (IGF2 or IGF1 receptors, insulin receptors). In a healthy adult, IGF2 (or “mature” IGF2) devoid of any glycosylation is easily degradable in the bloodstream [43]. Several IGF binding proteins (IGFBPs) exist in the extracellular matrix, forming IGF2 binary or ternary structures (IGF2-IGFBPs-acid labile subunit (ALS)) to increase stability of the protein and regulate its concentration in the bloodstream, prior to its degradation that occurs upon binding with the IGF2 receptor (IGF2R). O-linked glycosylation has been linked to inhibition in the formation of such ternary protein complexes, resulting in increased affinity for IGF1R, IR-A and IR-B [44,45]. Collectively, it is suggested that the “mature IGF2” protein form, important for maintaining homeostasis in adults, is most likely present in inactive ternary complexes, while detectable IGF2 proteins are in their vast majority proteo-forms of IGF2 consisting of O-linked glycosylation [46,47]. Along these lines in our study, all identified IGF2 peptides belonged to E-domain of IGF2, i.e., 92–180 aa, outside the “mature IGF2” (25–91 aa). Of note, and in agreement to the abovementioned evidence, in the database, only three unglycosylated urinary peptides of IGF2 could be identified, which were observed at significantly lower abundance and frequency in comparison to the glycosylated forms (Table S3).
Correlation analysis indicated moderate to strong [Rho = +0.27 (mean)], positive and statistically significant [p < 0.0001] correlation of all four IGF2 glycosylated peptides with Age with three of the glycopeptides (DVStPPTVLPDNFPRYPVGKF, DVStPPTVLPDNFPRYPVG and DVStPPTVLPDNFPRYP) maintaining this association after multiple linear regression analysis. This result enhances the biological relevance of IGF2 glycoforms and a need for their individual study. Importantly, one of the peptides (tPPTVLPDNFPRYP), showed strong association with eGFR independent of Age and Albuminuria, as supported by all applied analyses (Spearman’s rank correlation, multiple linear regression analysis and Wilcoxon rank sum test). Collectively, this finding indicates that with aging and deteriorating kidney function, alterations in IGF2 proteoforms take place, which may be reflective of respective changes in the mature IGF2 protein abundance and function as well as associated protease activity. Our results corroborate to some extent this hypothesis, as increased IGF2 plasma levels were observed in CKD patients versus the controls. In addition, the protease predictions, also combined with available transcriptomics data, suggest an activation of cathepsin S with CKD, meriting further investigation through future studies.
Increased levels of IGF2 in comparison to controls, in multiple diseases including cancer and diabetes have been detected [47]. In brief, associations of increased serum levels of IGF2 with hypoglycaemia [48] as well as of total and free IGF2 (defined as bound or unbound fractions of IGF2 with IGFBPs, respectively) with obesity accompanying Type 2 Diabetes mellitus (T2DM) have been suggested [49]. The E-domain of the IGF2 protein, also known as preptin has been further associated with obesity [50] and T2DM [51]. Interestingly, the upregulation of IGF2 in diabetic nephropathy (DKD) has also been proposed following analysis of renal biopsies from normal (n = 9) and early T2DM patients with (n = 9) or without (n = 11) histopathological characteristics of DKD [52]. In our study, associations to different disease etiologies including DKD could be observed for the tPPTVLPDNFPRYP glycopeptide. As suggested [53], any disturbance occurring in the somatotropic growth hormone axis can contribute to causal mechanisms in CKD. Interestingly, Fan et al. [54] recently reported a metabolic pathway that may also explain the increase of IGF2 in CKD. The study highlighted the important role of an endoplasmic reticulum protein RTN3 in the IGF2-JAK2-STAT3 pathway, where the reduction in RTN3 in the kidneys results in increased transcription of IGF2, which in turn activates the JAK2-STAT3 pathway, ultimately inducing kidney fibrosis and CKD. This pathway was proposed using animal (mice) models and cell lines, hence its translatability to humans is pending.
In summary, with this study naturally occurring “intact” urinary glycopeptides were identified highlighting IGF2 O-glycosylated proteoforms correlating with pathophysiological parameters, such as aging and kidney function, and apparently reflecting at least in part changes in IGF2 levels. The ability to probe these features simultaneously, i.e., site occupancy and O-glycan microheterogeneity, offers a unique opportunity towards untangling and identifying isoform-associated unique functions (similar to the observed specific association of the IGF2 glycopeptide tPPTVLPDNFPRYP with CKD). The results thus open up multiple questions meriting further investigation, including understanding the mechanism of this IGF2 peptide specific association and likely proteolytic cleavage by Cathepsins and their overall impact on CKD progression.

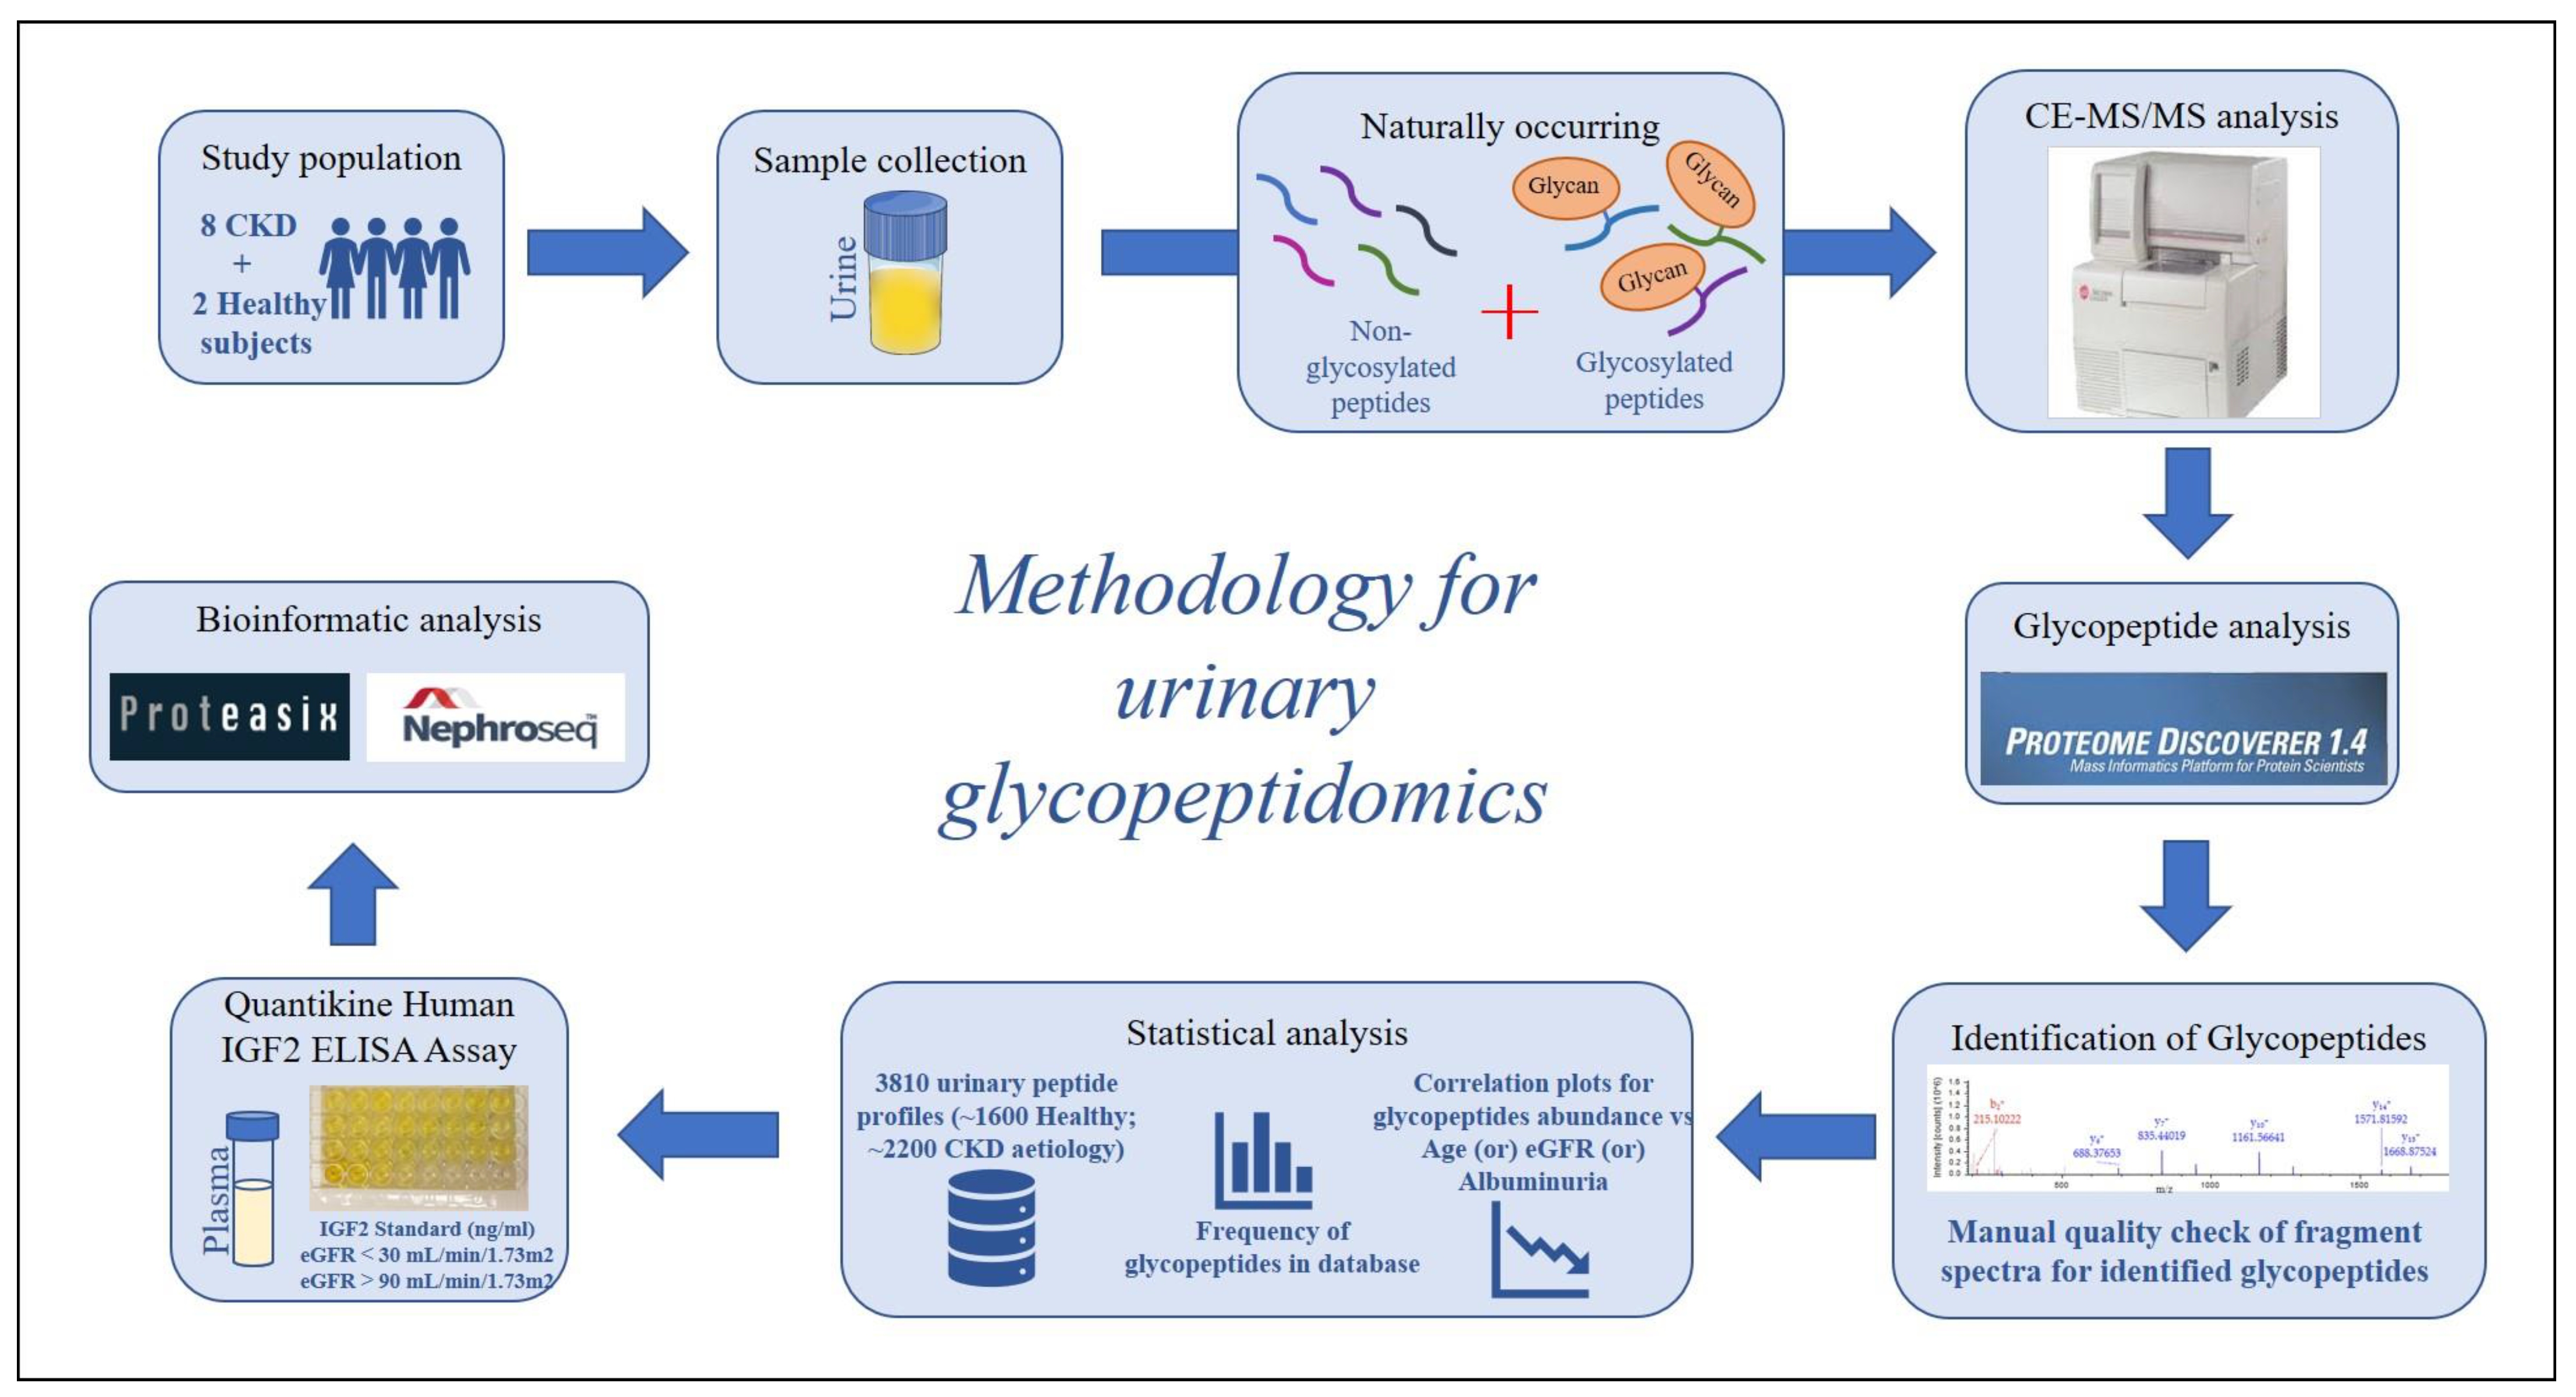
4. Materials and Methods

4.1. Study Population–Urine Samples

For identification of naturally occurring intact urinary glycopeptides, urine samples from eight CKD patients and two healthy volunteers were analyzed by CE-MS/MS, under ethics-approved protocols (Hannover Medical School, Ref. No. 3115-2016). The respective clinical information is presented in Table 3.
For the association of the identified glycopeptides with Age, eGFR and Albuminuria, anonymized CE-MS urinary peptide profiles from the Human Urinary Proteome database [21,30,31] were considered. These peptide datasets generated in previous studies [55,56,57,58,59,60,61] were selected based on availability of information on their diagnosis (control or CKD etiology), Age, eGFR and Albuminuria values. The distribution of disease etiology for the retrieved 3810 datasets is presented in Table 4.

4.2. Sample Preparation

Standard operating procedures (SOPs) were followed for urine sample collection, storage and further processing, as described in previous publications [62,63,64]. Briefly, 700 µL of an aqueous solution consisting of 2 M urea, 10 mM NH4OH and 0.02% sodium dodecyl sulfate (SDS) was used to dilute 700 µL of the thawed urine sample. To discard high molecular weight proteins, the sample was subjected to ultrafiltration using a Centristat (20 kDa molecular mass cut-off) centrifugal device (Sartorius, Göttingen, Germany) and centrifugation speed was set to 3000 rcf, to obtain approximately 1.1 mL filtrate. To eliminate urea, salts and electrolytes from the filtrate, a desalting process was carried out utilizing a PD-10 column gel (GE Healthcare Bio Sciences, Uppsala, Sweden) which was pre-equilibrated with 0.01% NH4OH in HPLC-grade water. The processed urine samples were then lyophilized and stored at 4 °C. Prior to the CE-MS/MS analysis, the samples were reconstituted in 10 µL of HPLC-grade water.

4.3. CE-MS/MS Analysis

The CE-MS/MS instrumental set up comprised a P/ACE MDQ capillary electrophoresis system (Beckman Coulter, Fullerton, CA, USA) connected to an Orbitrap Velos Fourier Transform (FT) MS (Thermo Finnigan, Bremen, Germany). The protocol for CE-MS/MS analysis and peptide sequencing based on data-dependent high (40%) energy collision dissociation (HCD) for the top 20 ions, has been previously described [65]. Briefly, Proxeon nano spray fitted with Agilent ESI sprayer (operated in positive ion mode) was utilized to ionize 230 µL-aliquot (1:50) of the processed urine sample. The ionization occurred at a voltage of 3.4 kV with 275 °C as the capillary temperature. Operating conditions were set to MS/MS mode that scanned from 350 to 1500 amu and triggered sequencing at a set threshold of 5000 counts. Ion resolution was 60,000 for MS1 and 7500 for MS2, with a detection limit of 0.05–0.2 fmol. Finally, full-scan MS spectra were acquired in the range of 300–2000 m/z, depicting the sequentially isolated fragmentation ions. The CE-MS/MS proteomics data have been deposited to the ProteomeXchange Consortium via the PRIDE partner repository with the dataset identifier PXD039829 and 10.6019/PXD039829.

4.4. Glycopeptide Analysis

Identification of glycopeptides was carried out using Proteome Discoverer 1.4 software. The SEQUEST search engine was applied for analysis of the CE-MS/MS raw files against the entire reviewed non-redundant human database downloaded as FASTA from UniProt (May 2022). The search parameters were set to no enzyme, HCD as the activation type, precursor mass tolerance at 10 ppm and fragment mass tolerance at 0.02 Da. In addition, only 2 maximum missed cleavage sites were allowed along with the peptide length set to 6–144 amino acids. There were no fixed modifications selected, while the variable modifications included oxidation of proline (+15.995 Da), Hex(1)HexNAc(1)NeuAc(1) of serine, threonine (+656.228 Da) and Hex(1)HexNAc(1)NeuAc(2) of serine, threonine (+947.323 Da). The latter two accounts for the most commonly occurring structures of O-linked glycans [66,67,68]. Three dynamic modifications per peptide and a false discovery rate of 1% for peptide identifications were allowed. To eliminate false-positive associations, a selection process based upon correlation between the experimental and theoretically predicted CE-migration time at the working pH of 2.2 of the identified peptides was applied, as described previously [29]. Each of the MS/MS fragment spectra of the resulting glycopeptide peaks were further analyzed manually, including a comparison of the theoretical and observed isotopic distributions.

4.5. Study Population–Plasma Samples

Plasma samples from CKD patients from the registered Biobank Kidney Ghent (BB190096) at the Ghent University Hospital in Belgium were analyzed under the ethics-approved protocol number (EC2010/033; Ghent University Hospital Ethics Committee). Two well-matched groups of 12 samples each were formed corresponding to eGFR > 90 mL/min/1.73 m2 and CKD patients with eGFR < 30 mL/min/1.73 m2, as shown in Table 5.
EDTA plasma samples were collected under SOPs. In brief, blood samples were centrifuged at 2095× g for 10 min at room temperature, within 30 min after collection. Samples were then aliquoted into labelled cryovials and stored in an upright position at −80 °C.

4.6. ELISA Assay

The quantification of Insulin-like growth factor-II (IGF2) protein (7.5 kDa) in plasma samples was performed by enzyme-linked immunosorbent assay (ELISA) using the Quantikine Human IGF-2 ELISA Kit (#DG200, R&D Systems, Minneapolis, MN, USA) as per the manufacturer’s instructions using 10 μL of plasma.

4.7. Statistical Analysis

Statistical analysis and results presented in this manuscript are based on R programming (R version 3.6.0 with IDE: R Studio Version 1.2.5, Boston, MA, USA). A peptide frequency threshold of 10% was applied, as a pre-requisite for statistical analysis. The peptide intensity values were Log10 transformed and entries with missing/no values were eliminated. Spearman’s rank correlation test and multiple linear regression analysis were used to define associations between abundance of the identified glycopeptides and clinical parameters (Age, eGFR and Albuminuria). In R, a correlation matrix was created with rcorr function of Hmisc package, while the regression analyses were performed with cor.test and lm functions of stats package. Matching for age and sex was performed in R using the MatchIt function where a 1:1 ratio was selected with the ‘nearest neighbor’ method. Wilcoxon Rank Sum test was applied to compare the glycopeptide intensities between groups (healthy subjects, n = 229 and CKD patients, n = 686). Welch two sample t-test was applied to compare the IGF2 protein levels between the two eGFR groups (n = 12 per group of plasma samples). Box and Whisker plots were generated in R using the ggplot2 package and colors in the correlation plot developed using a generalized additive model (GAM) were depicted with the viridis package.

4.8. Proteasix Analysis

An open-source tool “Proteasix” (http://www.proteasix.org, accessed on 3 October 2022) [69,70] was used to predict proteases involved in the cleavage of the identified glycopeptides. Briefly, Proteasix exploits information from databases such as UniProt Knowledgebase, MEROPs, CutDB and literature. In this study, we employed the “Predicted” tool of Proteasix for increased coverage in proteolysis information, using the default search parameters.

4.9. NephroSeq Analysis

The transcriptomics data analysis tool Nephroseq v4 (www.nephroseq.org, accessed on 23 December 2022) was utilized to investigate the expression of predicted proteases in existing human transcriptomics datasets. Initially, CKD datasets were identified using the primary filter: Group > chronic kidney disease. The mRNA expression levels of proteases in CKD vs. Normal Kidney were then searched in the available datasets. Significance was defined as p < 0.05 and with at least a 1.5-fold change in the expression levels.

Supplementary Materials

The following supporting information can be downloaded at: https://www.mdpi.com/article/10.3390/ijms24065402/s1.

Author Contributions

Conceptualization, S.L., A.L., H.M. and A.V.; methodology, S.L., A.L., H.M. and A.V.; software, S.L., A.L. and M.M.; validation, S.L., J.Z. and M.M.; formal analysis, S.L.; investigation, S.L.; resources, H.M., G.G., A.V. and V.J.; data curation, S.L.; writing—original draft preparation, S.L.; writing—review and editing, A.V.; visualization, S.L.; supervision, A.L., J.Z., M.M., H.M., G.G., A.V. and V.J.; project administration, H.M., G.G., A.V. and V.J.; funding acquisition, H.M., G.G., A.V. and V.J. All authors have read and agreed to the published version of the manuscript.

Funding

This project has received funding from the European Union’s Horizon 2020 research and innovation programme under the Marie Skłodowska-Curie grant agreement No 860329. Author V.J. is funded by the ‘Deutsche Forschunggemeinschaft’ (DFG, German Research Foundation) through the Transregional Collaborative Research Centre (TRR 219; Project-ID 322900939), (subproject S-03), (INST 948/4S-1); CRU 5011 project number 445703531. Authors H.M., G.G., A.V. and V.J. are funded by the Cost-Action CA 21165, IZKF Multiorgan complexity in Friedreich Ataxia, CA201165.

Institutional Review Board Statement

The urinary glycopeptidomics study was conducted under ethics approved protocol of the Hannover Medical School, Ref. No. 3115-2016. Plasma samples from CKD patients from the Ghent University Hospital Biobank (BB190096), Belgium were analyzed under the ethics approved protocol number EC2010/033; Ghent University Hospital Ethics Committee.

Informed Consent Statement

Informed consent was obtained from all subjects involved in the study.

Data Availability Statement

The CE-MS/MS proteomics data have been deposited to the ProteomeXchange Consortium via the PRIDE partner repository with the dataset identifier PXD039829 and 10.6019/PXD039829.

Acknowledgments

Author S.L. would like to extend deepest gratitude to the members of Vlahou Lab at BRFAA, Greece and Mosaiques Diagnostics, Germany. Author V.J. is funded by the ’Deutsche Forschunggemeinschaft’ (DFG, German Research Foundation) through the Transregional Collaborative Research Centre (TRR 219; Project-ID 322900939), (subproject S-03), (INST 948/4S-1); CRU 5011 project number 445703531, Authors H.M., G.G., A.V. and V.J. are funded by the Cost-Action CA 21165, IZKF Multiorgan complexity in Friedreich Ataxia, CA201165.

Conflicts of Interest

The authors declare no conflict of interest. Authors A.L. and H.M., are employees of Mosaiques Diagnostics which developed the CE-MS technology for peptidomics analysis.

References

  1. Ortiz, A.; Covic, A.; Fliser, D.; Fouque, D.; Goldsmith, D.; Kanbay, M.; Mallamaci, F.; Massy, Z.A.; Rossignol, P.; Vanholder, R.; et al. Epidemiology, contributors to, and clinical trials of mortality risk in chronic kidney failure. Lancet 2014, 383, 1831–1843. [Google Scholar] [CrossRef] [PubMed]
  2. Bellasi, A.; Di Lullo, L.; Di Iorio, B. Chronic Kidney Disease: The Silent Epidemy. J. Clin. Med. 2019, 8, 1795. [Google Scholar] [CrossRef] [Green Version]
  3. Levin, A.; Stevens, P.E. Summary of KDIGO 2012 CKD Guideline: Behind the scenes, need for guidance, and a framework for moving forward. Kidney Int. 2014, 85, 49–61. [Google Scholar] [CrossRef] [Green Version]
  4. Matsushita, K.; Coresh, J.; Sang, Y.; Chalmers, J.; Fox, C.; Guallar, E.; Jafar, T.; Jassal, S.K.; Landman, G.W.; Muntner, P.; et al. Estimated glomerular filtration rate and albuminuria for prediction of cardiovascular outcomes: A collaborative meta-analysis of individual participant data. Lancet Diabetes Endocrinol. 2015, 3, 514–525. [Google Scholar] [CrossRef] [PubMed] [Green Version]
  5. Vanholder, R.; Fouque, D.; Glorieux, G.; Heine, G.H.; Kanbay, M.; Mallamaci, F.; Massy, Z.A.; Ortiz, A.; Rossignol, P.; Wiecek, A.; et al. Clinical management of the uraemic syndrome in chronic kidney disease. Lancet Diabetes Endocrinol. 2016, 4, 360–373. [Google Scholar] [CrossRef]
  6. Good, D.M.; Thongboonkerd, V.; Novak, J.; Bascands, J.L.; Schanstra, J.P.; Coon, J.J.; Dominiczak, A.; Mischak, H. Body fluid proteomics for biomarker discovery: Lessons from the past hold the key to success in the future. J. Proteome Res. 2007, 6, 4549–4555. [Google Scholar] [CrossRef] [PubMed]
  7. Pieper, R.; Gatlin, C.L.; McGrath, A.M.; Makusky, A.J.; Mondal, M.; Seonarain, M.; Field, E.; Schatz, C.R.; Estock, M.A.; Ahmed, N.; et al. Characterization of the human urinary proteome: A method for high-resolution display of urinary proteins on two-dimensional electrophoresis gels with a yield of nearly 1400 distinct protein spots. Proteomics 2004, 4, 1159–1174. [Google Scholar] [CrossRef]
  8. Thongboonkerd, V.; McLeish, K.R.; Arthur, J.M.; Klein, J.B. Proteomic analysis of normal human urinary proteins isolated by acetone precipitation or ultracentrifugation. Kidney Int. 2002, 62, 1461–1469. [Google Scholar] [CrossRef]
  9. Pisitkun, T.; Shen, R.F.; Knepper, M.A. Identification and proteomic profiling of exosomes in human urine. Proc. Natl. Acad. Sci. USA 2004, 101, 13368–13373. [Google Scholar] [CrossRef] [Green Version]
  10. Schaub, S.; Rush, D.; Wilkins, J.; Gibson, I.W.; Weiler, T.; Sangster, K.; Nicolle, L.; Karpinski, M.; Jeffery, J.; Nickerson, P. Proteomic-based detection of urine proteins associated with acute renal allograft rejection. J. Am. Soc. Nephrol. 2004, 15, 219–227. [Google Scholar] [CrossRef] [Green Version]
  11. Magalhaes, P.; Pejchinovski, M.; Markoska, K.; Banasik, M.; Klinger, M.; Svec-Billa, D.; Rychlik, I.; Rroji, M.; Restivo, A.; Capasso, G.; et al. Association of kidney fibrosis with urinary peptides: A path towards non-invasive liquid biopsies? Sci. Rep. 2017, 7, 16915. [Google Scholar] [CrossRef] [Green Version]
  12. An, H.J.; Froehlich, J.W.; Lebrilla, C.B. Determination of glycosylation sites and site-specific heterogeneity in glycoproteins. Curr. Opin. Chem. Biol. 2009, 13, 421–426. [Google Scholar] [CrossRef] [Green Version]
  13. Lee, L.Y.; Moh, E.S.; Parker, B.L.; Bern, M.; Packer, N.H.; Thaysen-Andersen, M. Toward Automated N-Glycopeptide Identification in Glycoproteomics. J. Proteome Res. 2016, 15, 3904–3915. [Google Scholar] [CrossRef] [PubMed]
  14. Bollineni, R.C.; Koehler, C.J.; Gislefoss, R.E.; Anonsen, J.H.; Thiede, B. Large-scale intact glycopeptide identification by Mascot database search. Sci. Rep. 2018, 8, 2117. [Google Scholar] [CrossRef] [Green Version]
  15. Cao, L.; Qu, Y.; Zhang, Z.; Wang, Z.; Prytkova, I.; Wu, S. Intact glycopeptide characterization using mass spectrometry. Expert Rev. Proteom. 2016, 13, 513–522. [Google Scholar] [CrossRef] [Green Version]
  16. Jensen, P.H.; Kolarich, D.; Packer, N.H. Mucin-type O-glycosylation--putting the pieces together. FEBS J. 2010, 277, 81–94. [Google Scholar] [CrossRef] [PubMed]
  17. Wang, L.; Li, F.; Sun, W.; Wu, S.; Wang, X.; Zhang, L.; Zheng, D.; Wang, J.; Gao, Y. Concanavalin A-captured glycoproteins in healthy human urine. Mol. Cell. Proteom. 2006, 5, 560–562. [Google Scholar] [CrossRef] [Green Version]
  18. Yang, N.; Feng, S.; Shedden, K.; Xie, X.; Liu, Y.; Rosser, C.J.; Lubman, D.M.; Goodison, S. Urinary glycoprotein biomarker discovery for bladder cancer detection using LC/MS-MS and label-free quantification. Clin. Cancer Res. 2011, 17, 3349–3359. [Google Scholar] [CrossRef] [PubMed] [Green Version]
  19. Adachi, J.; Kumar, C.; Zhang, Y.; Olsen, J.V.; Mann, M. The human urinary proteome contains more than 1500 proteins, including a large proportion of membrane proteins. Genome Biol. 2006, 7, R80. [Google Scholar] [CrossRef] [Green Version]
  20. Cantley, L.G.; Colangelo, C.M.; Stone, K.L.; Chung, L.; Belcher, J.; Abbott, T.; Cantley, J.L.; Williams, K.R.; Parikh, C.R. Development of a Targeted Urine Proteome Assay for kidney diseases. Proteom. Clin. Appl. 2016, 10, 58–74. [Google Scholar] [CrossRef] [Green Version]
  21. Coon, J.J.; Zurbig, P.; Dakna, M.; Dominiczak, A.F.; Decramer, S.; Fliser, D.; Frommberger, M.; Golovko, I.; Good, D.M.; Herget-Rosenthal, S.; et al. CE-MS analysis of the human urinary proteome for biomarker discovery and disease diagnostics. Proteom. Clin. Appl. 2008, 2, 964. [Google Scholar] [CrossRef] [Green Version]
  22. Nilsson, J.; Halim, A.; Grahn, A.; Larson, G. Targeting the glycoproteome. Glycoconj. J. 2013, 30, 119–136. [Google Scholar] [CrossRef] [Green Version]
  23. Halim, A.; Nilsson, J.; Ruetschi, U.; Hesse, C.; Larson, G. Human urinary glycoproteomics; attachment site specific analysis of N- and O-linked glycosylations by CID and ECD. Mol. Cell. Proteom. 2012, 11, M111.013649. [Google Scholar] [CrossRef] [Green Version]
  24. Vivekanandan-Giri, A.; Slocum, J.L.; Buller, C.L.; Basrur, V.; Ju, W.; Pop-Busui, R.; Lubman, D.M.; Kretzler, M.; Pennathur, S. Urine glycoprotein profile reveals novel markers for chronic kidney disease. Int. J. Proteom. 2011, 2011, 214715. [Google Scholar] [CrossRef] [Green Version]
  25. Kolch, W.; Neususs, C.; Pelzing, M.; Mischak, H. Capillary electrophoresis-mass spectrometry as a powerful tool in clinical diagnosis and biomarker discovery. Mass Spectrom. Rev. 2005, 24, 959–977. [Google Scholar] [CrossRef] [PubMed]
  26. Fliser, D.; Novak, J.; Thongboonkerd, V.; Argiles, A.; Jankowski, V.; Girolami, M.A.; Jankowski, J.; Mischak, H. Advances in urinary proteome analysis and biomarker discovery. J. Am. Soc. Nephrol. 2007, 18, 1057–1071. [Google Scholar] [CrossRef] [Green Version]
  27. Schiffer, E.; Mischak, H.; Novak, J. High resolution proteome/peptidome analysis of body fluids by capillary electrophoresis coupled with MS. Proteomics 2006, 6, 5615–5627. [Google Scholar] [CrossRef] [PubMed]
  28. Good, D.M.; Zurbig, P.; Argiles, A.; Bauer, H.W.; Behrens, G.; Coon, J.J.; Dakna, M.; Decramer, S.; Delles, C.; Dominiczak, A.F.; et al. Naturally occurring human urinary peptides for use in diagnosis of chronic kidney disease. Mol. Cell. Proteom. 2010, 9, 2424–2437. [Google Scholar] [CrossRef] [PubMed] [Green Version]
  29. Zurbig, P.; Renfrow, M.B.; Schiffer, E.; Novak, J.; Walden, M.; Wittke, S.; Just, I.; Pelzing, M.; Neususs, C.; Theodorescu, D.; et al. Biomarker discovery by CE-MS enables sequence analysis via MS/MS with platform-independent separation. Electrophoresis 2006, 27, 2111–2125. [Google Scholar] [CrossRef] [PubMed]
  30. Siwy, J.; Mullen, W.; Golovko, I.; Franke, J.; Zurbig, P. Human urinary peptide database for multiple disease biomarker discovery. Proteom. Clin. Appl. 2011, 5, 367–374. [Google Scholar] [CrossRef]
  31. Latosinska, A.; Siwy, J.; Mischak, H.; Frantzi, M. Peptidomics and proteomics based on CE-MS as a robust tool in clinical application: The past, the present, and the future. Electrophoresis 2019, 40, 2294–2308. [Google Scholar] [CrossRef]
  32. Kovesdy, C.P. Epidemiology of chronic kidney disease: An update 2022. Kidney Int. Suppl. 2022, 12, 7–11. [Google Scholar] [CrossRef]
  33. Toghi Eshghi, S.; Yang, W.; Hu, Y.; Shah, P.; Sun, S.; Li, X.; Zhang, H. Classification of Tandem Mass Spectra for Identification of N- and O-linked Glycopeptides. Sci. Rep. 2016, 6, 37189. [Google Scholar] [CrossRef]
  34. Wada, Y.; Azadi, P.; Costello, C.E.; Dell, A.; Dwek, R.A.; Geyer, H.; Geyer, R.; Kakehi, K.; Karlsson, N.G.; Kato, K.; et al. Comparison of the methods for profiling glycoprotein glycans--HUPO Human Disease Glycomics/Proteome Initiative multi-institutional study. Glycobiology 2007, 17, 411–422. [Google Scholar] [CrossRef] [PubMed] [Green Version]
  35. Belczacka, I.; Pejchinovski, M.; Krochmal, M.; Magalhaes, P.; Frantzi, M.; Mullen, W.; Vlahou, A.; Mischak, H.; Jankowski, V. Urinary Glycopeptide Analysis for the Investigation of Novel Biomarkers. Proteom. Clin. Appl. 2019, 13, e1800111. [Google Scholar] [CrossRef]
  36. Darula, Z.; Pap, A.; Medzihradszky, K.F. Extended Sialylated O-Glycan Repertoire of Human Urinary Glycoproteins Discovered and Characterized Using Electron-Transfer/Higher-Energy Collision Dissociation. J. Proteome Res. 2019, 18, 280–291. [Google Scholar] [CrossRef] [Green Version]
  37. Campos, D.; Freitas, D.; Gomes, J.; Magalhaes, A.; Steentoft, C.; Gomes, C.; Vester-Christensen, M.B.; Ferreira, J.A.; Afonso, L.P.; Santos, L.L.; et al. Probing the O-glycoproteome of gastric cancer cell lines for biomarker discovery. Mol. Cell. Proteom. 2015, 14, 1616–1629. [Google Scholar] [CrossRef] [PubMed] [Green Version]
  38. Tajiri, M.; Yoshida, S.; Wada, Y. Differential analysis of site-specific glycans on plasma and cellular fibronectins: Application of a hydrophilic affinity method for glycopeptide enrichment. Glycobiology 2005, 15, 1332–1340. [Google Scholar] [CrossRef] [PubMed]
  39. Duguay, S.J.; Jin, Y.; Stein, J.; Duguay, A.N.; Gardner, P.; Steiner, D.F. Post-translational processing of the insulin-like growth factor-2 precursor. Analysis of O-glycosylation and endoproteolysis. J. Biol. Chem. 1998, 273, 18443–18451. [Google Scholar] [CrossRef] [PubMed] [Green Version]
  40. Daughaday, W.H.; Trivedi, B.; Baxter, R.C. Serum “big insulin-like growth factor II” from patients with tumor hypoglycemia lacks normal E-domain O-linked glycosylation, a possible determinant of normal propeptide processing. Proc. Natl. Acad. Sci. USA 1993, 90, 5823–5827. [Google Scholar] [CrossRef] [Green Version]
  41. Qiu, Q.; Basak, A.; Mbikay, M.; Tsang, B.K.; Gruslin, A. Role of pro-IGF-II processing by proprotein convertase 4 in human placental development. Proc. Natl. Acad. Sci. USA 2005, 102, 11047–11052. [Google Scholar] [CrossRef] [PubMed] [Green Version]
  42. Boulle, N.; Gicquel, C.; Logie, A.; Christol, R.; Feige, J.J.; Le Bouc, Y. Fibroblast growth factor-2 inhibits the maturation of pro-insulin-like growth factor-II (Pro-IGF-II) and the expression of insulin-like growth factor binding protein-2 (IGFBP-2) in the human adrenocortical tumor cell line NCI-H295R. Endocrinology 2000, 141, 3127–3136. [Google Scholar] [CrossRef] [PubMed]
  43. Chao, W.; D’Amore, P.A. IGF2: Epigenetic regulation and role in development and disease. Cytokine Growth Factor Rev. 2008, 19, 111–120. [Google Scholar] [CrossRef] [Green Version]
  44. Allard, J.B.; Duan, C. IGF-Binding Proteins: Why Do They Exist and Why Are There So Many? Front. Endocrinol. 2018, 9, 117. [Google Scholar] [CrossRef] [PubMed] [Green Version]
  45. Khosravi, M.J.; Diamandi, A.; Mistry, J.; Krishna, R.G.; Khare, A. Acid-labile subunit of human insulin-like growth factor-binding protein complex: Measurement, molecular, and clinical evaluation. J. Clin. Endocrinol. Metab. 1997, 82, 3944–3951. [Google Scholar] [CrossRef]
  46. Frystyk, J.; Skjaerbaek, C.; Dinesen, B.; Orskov, H. Free insulin-like growth factors (IGF-I and IGF-II) in human serum. FEBS Lett. 1994, 348, 185–191. [Google Scholar] [CrossRef] [PubMed] [Green Version]
  47. Holly, J.M.P.; Biernacka, K.; Perks, C.M. The Neglected Insulin: IGF-II, a Metabolic Regulator with Implications for Diabetes, Obesity, and Cancer. Cells 2019, 8, 1207. [Google Scholar] [CrossRef] [PubMed] [Green Version]
  48. Cotterill, A.M.; Holly, J.M.; Davies, S.C.; Coulson, V.J.; Price, P.A.; Wass, J.A. The insulin-like growth factors and their binding proteins in a case of non-islet-cell tumour-associated hypoglycaemia. J. Endocrinol. 1991, 131, 303–311. [Google Scholar] [CrossRef] [PubMed]
  49. Yamasaki, H.; Itawaki, A.; Morita, M.; Miyake, H.; Yamamoto, M.; Sonoyama, H.; Tanaka, S.; Notsu, M.; Yamauchi, M.; Fujii, Y.; et al. A case of insulin-like growth factor 2-producing gastrointestinal stromal tumor with severe hypoglycemia. BMC Endocr. Disord. 2020, 20, 60. [Google Scholar] [CrossRef]
  50. Ozkan, Y.; Timurkan, E.S.; Aydin, S.; Sahin, I.; Timurkan, M.; Citil, C.; Kalayci, M.; Yilmaz, M.; Aksoy, A.; Catak, Z. Acylated and desacylated ghrelin, preptin, leptin, and nesfatin-1 Peptide changes related to the body mass index. Int. J. Endocrinol. 2013, 2013, 236085. [Google Scholar] [CrossRef]
  51. Yang, G.; Li, L.; Chen, W.; Liu, H.; Boden, G.; Li, K. Circulating preptin levels in normal, impaired glucose tolerance, and type 2 diabetic subjects. Ann. Med. 2009, 41, 52–56. [Google Scholar] [CrossRef]
  52. Sireesha, M.; Sambasivan, V.; Kumar, V.K.; Radha, S.; Raj, A.Y.; Qurratulain, H. Relevance of insulin-like growth factor 2 in the etiopathophysiology of diabetic nephropathy: Possible roles of phosphatase and tensin homolog on chromosome 10 and secreted protein acidic and rich in cysteine as regulators of repair. J. Diabetes 2009, 1, 118–124. [Google Scholar] [CrossRef] [PubMed]
  53. Oh, Y. The insulin-like growth factor system in chronic kidney disease: Pathophysiology and therapeutic opportunities. Kidney Res. Clin. Pr. 2012, 31, 26–37. [Google Scholar] [CrossRef] [PubMed] [Green Version]
  54. Fan, L.L.; Du, R.; Liu, J.S.; Jin, J.Y.; Wang, C.Y.; Dong, Y.; He, W.X.; Yan, R.Q.; Xiang, R. Loss of RTN3 phenocopies chronic kidney disease and results in activation of the IGF2-JAK2 pathway in proximal tubular epithelial cells. Exp. Mol. Med. 2022, 54, 653–661. [Google Scholar] [CrossRef]
  55. Schanstra, J.P.; Zurbig, P.; Alkhalaf, A.; Argiles, A.; Bakker, S.J.; Beige, J.; Bilo, H.J.; Chatzikyrkou, C.; Dakna, M.; Dawson, J.; et al. Diagnosis and Prediction of CKD Progression by Assessment of Urinary Peptides. J. Am. Soc. Nephrol. JASN 2015, 26, 1999–2010. [Google Scholar] [CrossRef] [PubMed] [Green Version]
  56. Catanese, L.; Siwy, J.; Mavrogeorgis, E.; Amann, K.; Mischak, H.; Beige, J.; Rupprecht, H. A Novel Urinary Proteomics Classifier for Non-Invasive Evaluation of Interstitial Fibrosis and Tubular Atrophy in Chronic Kidney Disease. Proteomes 2021, 9, 32. [Google Scholar] [CrossRef]
  57. Pontillo, C.; Zhang, Z.Y.; Schanstra, J.P.; Jacobs, L.; Zurbig, P.; Thijs, L.; Ramirez-Torres, A.; Heerspink, H.J.L.; Lindhardt, M.; Klein, R.; et al. Prediction of Chronic Kidney Disease Stage 3 by CKD273, a Urinary Proteomic Biomarker. Kidney Int. Rep. 2017, 2, 1066–1075. [Google Scholar] [CrossRef]
  58. Rudnicki, M.; Siwy, J.; Wendt, R.; Lipphardt, M.; Koziolek, M.J.; Maixnerova, D.; Peters, B.; Kerschbaum, J.; Leierer, J.; Neprasova, M.; et al. Urine proteomics for prediction of disease progression in patients with IgA nephropathy. Nephrol. Dial. Transplant. 2021, 37, 42–52. [Google Scholar] [CrossRef]
  59. Siwy, J.; Zurbig, P.; Argiles, A.; Beige, J.; Haubitz, M.; Jankowski, J.; Julian, B.A.; Linde, P.G.; Marx, D.; Mischak, H.; et al. Noninvasive diagnosis of chronic kidney diseases using urinary proteome analysis. Nephrol. Dial. Transplant. 2017, 32, 2079–2089. [Google Scholar] [CrossRef]
  60. He, T.; Mischak, M.; Clark, A.L.; Campbell, R.T.; Delles, C.; Diez, J.; Filippatos, G.; Mebazaa, A.; McMurray, J.J.V.; Gonzalez, A.; et al. Urinary peptides in heart failure: A link to molecular pathophysiology. Eur. J. Heart Fail. 2021, 23, 1875–1887. [Google Scholar] [CrossRef]
  61. Mavrogeorgis, E.; Mischak, H.; Latosinska, A.; Vlahou, A.; Schanstra, J.P.; Siwy, J.; Jankowski, V.; Beige, J.; Jankowski, J. Collagen-Derived Peptides in CKD: A Link to Fibrosis. Toxins 2021, 14, 10. [Google Scholar] [CrossRef] [PubMed]
  62. Mischak, H.; Kolch, W.; Aivaliotis, M.; Bouyssie, D.; Court, M.; Dihazi, H.; Dihazi, G.H.; Franke, J.; Garin, J.; Gonzalez de Peredo, A.; et al. Comprehensive human urine standards for comparability and standardization in clinical proteome analysis. Proteom. Clin. Appl. 2010, 4, 464–478. [Google Scholar] [CrossRef] [PubMed] [Green Version]
  63. Haubitz, M.; Good, D.M.; Woywodt, A.; Haller, H.; Rupprecht, H.; Theodorescu, D.; Dakna, M.; Coon, J.J.; Mischak, H. Identification and validation of urinary biomarkers for differential diagnosis and evaluation of therapeutic intervention in anti-neutrophil cytoplasmic antibody-associated vasculitis. Mol. Cell. Proteom. 2009, 8, 2296–2307. [Google Scholar] [CrossRef] [Green Version]
  64. Kistler, A.D.; Mischak, H.; Poster, D.; Dakna, M.; Wuthrich, R.P.; Serra, A.L. Identification of a unique urinary biomarker profile in patients with autosomal dominant polycystic kidney disease. Kidney Int. 2009, 76, 89–96. [Google Scholar] [CrossRef] [Green Version]
  65. Klein, J.; Papadopoulos, T.; Mischak, H.; Mullen, W. Comparison of CE-MS/MS and LC-MS/MS sequencing demonstrates significant complementarity in natural peptide identification in human urine. Electrophoresis 2014, 35, 1060–1064. [Google Scholar] [CrossRef]
  66. Cao, Q.; Yu, Q.; Liu, Y.; Chen, Z.; Li, L. Signature-Ion-Triggered Mass Spectrometry Approach Enabled Discovery of N- and O-Linked Glycosylated Neuropeptides in the Crustacean Nervous System. J. Proteome Res. 2020, 19, 634–643. [Google Scholar] [CrossRef] [PubMed]
  67. Madsen, T.D.; Hansen, L.H.; Hintze, J.; Ye, Z.; Jebari, S.; Andersen, D.B.; Joshi, H.J.; Ju, T.; Goetze, J.P.; Martin, C.; et al. An atlas of O-linked glycosylation on peptide hormones reveals diverse biological roles. Nat. Commun. 2020, 11, 4033. [Google Scholar] [CrossRef]
  68. Zhang, Y.; Zhao, W.; Mao, Y.; Chen, Y.; Zheng, S.; Cao, W.; Zhu, J.; Hu, L.; Gong, M.; Cheng, J.; et al. O-Glycosylation Landscapes of SARS-CoV-2 Spike Proteins. Front. Chem. 2021, 9, 689521. [Google Scholar] [CrossRef]
  69. Klein, J.; Eales, J.; Zurbig, P.; Vlahou, A.; Mischak, H.; Stevens, R. Proteasix: A tool for automated and large-scale prediction of proteases involved in naturally occurring peptide generation. Proteomics 2013, 13, 1077–1082. [Google Scholar] [CrossRef] [PubMed]
  70. Petra, E.; He, T.; Lygirou, V.; Latosinska, A.; Mischak, H.; Vlahou, A.; Jankowski, J. Urine peptidome analysis in cardiorenal syndrome reflects molecular processes. Sci. Rep. 2021, 11, 16219. [Google Scholar] [CrossRef]
Figure 1. Study workflow.
Ijms 24 05402 g001
Figure 2. Quality check of HCD-MS/MS fragment spectra of the identified glycopeptides. Spectra as observed in Proteome Discoverer 1.4 are depicted along with their matched isotopic distributions of theoretical (insert) and experimental glycopeptide peaks. (a) Insulin-like growth factor II (IGF2) at a charge of +1 and (b) Fibrinogen alpha chain (FGA) at a charge of (+2).
Ijms 24 05402 g002
Figure 3. Identified naturally occurring IGF2 urinary peptides and their position in the IGF2 protein sequence. Lowercase “s” or “t” represent the presence of an O-linked glycan moiety.
Ijms 24 05402 g003
Figure 4. Results of (a) Spearman’s rank correlation test, (b) Multiple linear regression analysis for the abundance of four urinary IGF2 glycopeptides and Age, eGFR and Albuminuria. The statistically significant correlations are marked with asterisks (* p < 0.05, ** p < 0.0001, *** p < 0.00001).
Ijms 24 05402 g004
Figure 5. Correlation of the urinary IGF2 glycopeptide “tPPTVLPDNFPRYP” intensity with clinical parameter eGFR (mL/min/1.73 m2) for different age groups. Data were fit using a generalized additive model (GAM) suggesting significant correlations (p < 0.05) for all but one (age 61–70) age group.
Ijms 24 05402 g005
Figure 6. Box-Whisker plot depicting the increased urinary levels of IGF2 glycopeptide–tPPTVLPDNFPRYP in CKD subjects in comparison to healthy control subjects from the Human urinary proteome database.
Ijms 24 05402 g006
Figure 7. IGF2 protein levels in plasma of patients with eGFR < 30 mL/min/1.73 m2 in comparison to individuals with eGFR > 90 mL/min/1.73 m2 quantified by ELISA and depicted by a Box-Whisker plot.
Ijms 24 05402 g007
Table 1. List of 17 O-linked glycopeptides identified by CE-MS/MS-based urinary glycopeptidomics analysis. The peptide frequency of detection (%) and abundance distribution in the Human urinary proteome database (n = 3810) are provided.
Glycopeptide SequenceMassCE-Migration TimeProtein NameProtein Accession IDGene SymbolGlycan CompositionGlycan PositionAmino AcidFrequencyAbundance
[Da][mins](UniProt)StartStop(%)RangeMean
DVStPPTVLPDNFPRYPVG2726.2842.55Insulin-like growth factor IIP01344IGF2Hex(1)HexNAc(1)NeuAc(1)T49311152.8617.1–49,508.66115.74
tPPTVLPDNFPRYP2269.0539.25Insulin-like growth factor IIP01344IGF2Hex(1)HexNAc(1)NeuAc(1)T19610924.0228.4–22,103.9666.5
DVStPPTVLPDNFPRYP2861.2848.80Insulin-like growth factor IIP01344IGF2Hex(1)HexNAc(1)NeuAc(2)T49310923.6221.4–27,681.82067.24
DVStPPTVLPDNFPRYPVGKF3292.5339.27Insulin-like growth factor IIP01344IGF2Hex(1)HexNAc(1)NeuAc(2)T49311389.7419.0–85,8439884.46
DVStPPTVLPDNFPRYPVGK2854.3735.74Insulin-like growth factor IIP01344IGF2Hex(1)HexNAc(1)NeuAc(1)T4931120.3740.43–969.34281.18
DVsTPPTVLPDNFPRYPVGKF3001.4433.45Insulin-like growth factor IIP01344IGF2Hex(1)HexNAc(1)NeuAc(1)S3931132.3614.6–17,332.31904.29
tPAPLDSVFSSSERAHQVLR3143.4630.06Vitamin K dependent protein CP04070PROCHex(1)HexNAc(1)NeuAc(2)T119391.5810.0–589.32185.93
tPAPLDSVFSSSERAHQ2775.2038.31Vitamin K dependent protein CP04070PROCHex(1)HexNAc(1)NeuAc(2)T1193911.056.56–4972.9370.02
tPAPLDSVFSSSERAHQVLRI3256.5430.65Vitamin K dependent protein CP04070PROCHex(1)HexNAc(1)NeuAc(2)T1194037.0916.78–35,415.42030.91
sALQPSPTHSSSNTQRLPDRVTG3091.4529.11Inter-alpha-trypsin inhibitor heavy chain H1P19827ITIH1Hex(1)HexNAc(1)NeuAc(1)S16456680.0550.69–97.7774.23
LQPsPTHSSSNTQRLPD2520.1527.49Inter-alpha-trypsin inhibitor heavy chain H1P19827ITIH1Hex(1)HexNAc(1)NeuAc(1)S46486640.5512.12–270.39117.54
LQPsPTHSSSNTQRLPDRVTG2933.3828.59Inter-alpha-trypsin inhibitor heavy chain H1P19827ITIH1Hex(1)HexNAc(1)NeuAc(1)S46486680.3244.7–3739.5620.02
DEAGsEADHEGTHSTKRGHAKSRPV3605.5921.07Fibrinogen alpha chainP02671FGAHex(1)HexNAc(1)NeuAc(2)S560562920.7118.9–4788.0476.98
DEAGsEADHEGTHSTKRGHAKSRP3215.4219.996Fibrinogen alpha chainP02671FGAHex(1)HexNAc(1)NeuAc(1)S560562810.088.6–2873.3266.59
DGGFDLSDALPDNENKKPtAIP3260.4538.15CD99 antigenP14209CD99Hex(1)HexNAc(1)NeuAc(2)T19234425.5113.6–14,136.9986.31
tAVPSTGASKSKR1944.9524.88FibronectinP02751FN1Hex(1)HexNAc(1)NeuAc(1)T119314.1728.5–2130.5425.66
ATIPRQDEVPQQtVAPQQQ2789.3140.96Tumor necrosis factor receptor superfamily member 10DQ9UBN6TNFRSF10DHex(1)HexNAc(1)NeuAc(1)T1356742.0216.1–642.4205.34
Table 2. Results of Spearman’s rank correlation test for the abundance of urinary IGF2 glycopeptides with eGFR (mL/min/1.73 m2) in different kidney disease etiologies. The significant correlations (p < 0.05) are marked with an asterisk.
Disease EtiologyIGF2 Glycopeptide
DVStPPTVLPDNFPRYPVGKFtPPTVLPDNFPRYPDVStPPTVLPDNFPRYPVGDVStPPTVLPDNFPRYP
RhonRhonRhonRhon
Healthy−0.10 *802−0.23 *117−0.11310−0.21 *175
ADPKD−0.19 *2710.0458−0.05220−0.18 *120
IgAN−0.13 *452−0.51 *1880.08237−0.2179
CKD−0.32 *577−0.58 *243−0.04415−0.26 *151
DKD−0.28 *198−0.68 *64−0.01132−0.2749
Nephrosclerosis −0.18118−0.70 *71−0.0568−0.666
FSGS−0.26 *86−0.69 *320.0157−0.113
MCD−0.41 *52−0.4311−0.2529−0.310
MGN−0.31 *72−0.3727−0.1949−0.83 *8
MPGN−0.38200.327−0.04160.44
Nephritis−0.69 *16−0.690.179
Tubullar Nephritis−0.70 *24−0.86 *18−0.4616
CKD: Chronic kidney disease; IgAN: IgA nephropathy; ADPKD: Autosomal dominant polycystic kidney disease; DKD: Diabetic nephropathy; FSGS: Focal segmental glomerulosclerosis; MGN: Membranous glomerulonephritis; MCD: Minimal change disease; MPGN: Membranoproliferative glomerulonephritis.
Table 3. Clinical information of the study population. The mean values (ranges) are provided.
Healthy Subjects
(n = 2)
CKD Patients
(n = 8)
Gender (% females)10037.5
Age (years)2938.5 (29–50)
MAP (mmHg)<9089.04 (77–111)
Proteinuria (g/day)<0.11.28 (0.1–2.3)
eGFR (mL/min/1.73 m2)>9059.34 (13–99)
MAP: mean arterial blood pressure; eGFR: estimated glomerular filtration rate.
Table 4. Distribution of disease etiology, as obtained from the Human Urinary Proteome Database. (A small part, 391 subjects, were diagnosed with more than one kidney disease etiology).
Disease EtiologyNumber of Datasets
Healthy controls1616
Chronic kidney disease (CKD)865
IgA nephropathy (IgAN)586
Autosomal dominant polycystic kidney disease (ADPKD)290
Diabetic nephropathy (DKD)264
Nephrosclerosis184
Focal segmental glomerulosclerosis (FSGS)142
Membranous glomerulonephritis (MGN)115
Minimal change disease (MCD)64
Nephritis33
Tubulointerstitial Nephritis28
Membranoproliferative glomerulonephritis (MPGN)28
Table 5. Clinical information of the study population. The mean values (ranges) are provided.
eGFR > 90
mL/min/1.73 m2
(n = 12)
eGFR < 30
mL/min/1.73 m2
(n = 12)
Gender (% females)16.775
Age (years)38.1 (18–52)46.3 (18–67)
SBP (mmHg)120.3 (107–139)135.8 (115–164)
DBP (mmHg)77.91 (55–100)84.4 (72–99)
eGFR (mL/min/1.73 m2)107.8 (90–130)23.2 (15–29)
Creatinine (mmol/day)0.7 (0.5–0.9)3.0 (1.8–4.1)
Hemoglobin (g/dL)14.3 (12–16)13.1 (11–16)
Cholesterol (mg/dL)200.5 (155–252)192.3 (142–253)
SBP: systolic blood pressure; DBP: diastolic blood pressure; eGFR: estimated glomerular filtration rate.
Disclaimer/Publisher’s Note: The statements, opinions and data contained in all publications are solely those of the individual author(s) and contributor(s) and not of MDPI and/or the editor(s). MDPI and/or the editor(s) disclaim responsibility for any injury to people or property resulting from any ideas, methods, instructions or products referred to in the content.

