Article

Genome-Wide Identification of HSF Gene Family in Kiwifruit and the Function of AeHSFA2b in Salt Tolerance

Anhui Province Key Laboratory of Horticultural Crop Quality Biology, School of Horticulture, Anhui Agriculture University, Hefei 230036, China
*
Authors to whom correspondence should be addressed.
These authors contributed equally to the work.
Int. J. Mol. Sci. 2023, 24(21), 15638; https://doi.org/10.3390/ijms242115638
Submission received: 31 August 2023 / Revised: 19 October 2023 / Accepted: 24 October 2023 / Published: 27 October 2023
(This article belongs to the Special Issue Crop Stress Biology and Molecular Breeding 3.0)

Abstract

:
Heat shock transcription factors (HSFs) play a crucial role in regulating plant growth and response to various abiotic stresses. In this study, we conducted a comprehensive analysis of the AeHSF gene family at genome-wide level in kiwifruit (Actinidia eriantha), focusing on their functions in the response to abiotic stresses. A total of 41 AeHSF genes were identified and categorized into three primary groups, namely, HSFA, HSFB, and HSFC. Further transcriptome analysis revealed that the expression of AeHSFA2b/2c and AeHSFB1c/1d/2c/3b was strongly induced by salt, which was confirmed by qRT-PCR assays. The overexpression of AeHSFA2b in Arabidopsis significantly improved the tolerance to salt stress by increasing AtRS5, AtGolS1 and AtGolS2 expression. Furthermore, yeast one-hybrid, dual-luciferase, and electrophoretic mobility shift assays demonstrated that AeHSFA2b could bind to the AeRFS4 promoter directly. Therefore, we speculated that AeHSFA2b may activate AeRFS4 expression by directly binding its promoter to enhance the kiwifruit’s tolerance to salt stress. These results will provide a new insight into the evolutionary and functional mechanisms of AeHSF genes in kiwifruit.

1. Introduction

The growth and development of plants are influenced by multiple abiotic and biotic stresses [1]. Especially, abiotic stress, including high temperature, high salinity, drought, cold, and other abiotic threats, is recognized as the leading cause of crop loss on a global scale, resulting in an approximate decline of 50% in crop productivity each year [2]. Presently, saline–alkali hazards have emerged as a widespread problem. Salinization of soil has the capacity to modify soil characteristics, decrease soil moisture content, and cause soil compaction, thereby impeding the growth and development of plants [3]. Plants are unable to alter their location to evade unfavorable stresses as opposed to animals, yet they have acquired particular adjustments over the course of evolution to confront these quickly changing stressors [4]. The tolerance of plants to stress is amplified by a multifaceted network of stress response mechanisms and a diverse range of adaptive mechanisms at the physiological, biochemical, and molecular levels, which enable them to adapt to changing environmental conditions [5]. Transcription factors (TFs), which are sequence-specific DNA-binding protein molecules, regulate the transcriptional expression of many downstream genes responsible for adverse stress [6,7,8]. For example, increasing reports have indicated that heat shock factor (HSF) proteins can activate HSPs gene expression by recognizing the HS elements (HSE; 5′-AGAAnnTTCT-3′) conserved in promoters of HSPs responses to heat defense [9]. In Populus euphratica, HSF binds to HSE cis-elements in the WRKY1 gene promoter, therefore regulating WRKY1 transcription to enhance transgenic Arabidopsis salt tolerance [10].
Heat shock transcription factors (HSFs) are a significant group of stress-responsive transcription factors (TFs) in eukaryotes [6]. They have been identified in various plant species subsequent to their initial discovery in yeast [11,12]. Research on diverse plants of the HSF gene family has demonstrated that the structure of the HSF protein is highly conserved, including conserved domains DNA binding domain (DBD) at the N-terminal, an adjacent bipartite oligomerization domain (HR-A/B or OD), nuclear localization signal (NLS), nuclear export signal (NES), C-terminal activator peptide protein (AHA), and repressor domain (RD) [13]. Three plant HSF classes: A, B, and C are identified based on number of amino acids between HR-A and HR-B regions [9]. Class A HSFs play a crucial role in activating transcription via AHA motifs, which consist of aromatic, hydrophobic, and acidic amino acid residues [14]. Conversely, these types of residues are not present in class B and C HSF. Moreover, the variable length of the linker between the DBD domain and HR-A/B region provides further evidence to support this categorization [13].
Plants synthesize a multitude of compatible molecules solutes, including mannitol, proline, and several soluble oligosaccharides (namely, Galactinol, trehalose, raffinose, and stachyose) to act as regulatory compounds for coping with various abiotic stress [15]. Under abiotic stress conditions, the raffinose family of oligosaccharides (RFOs), particularly raffinose, play a significant role in elevating the osmotic pressure within cells. Moreover, raffinose family oligosaccharides (RFOs) also serve multiple functions such as antioxidants, signaling molecules, facilitators of carbon transport and storage, and membrane trafficking agents to protect the plant cell from dehydration [16]. It is well known that Galactinol synthase (GolS; EC: 2.4.1.123) and Raffinose Synthase (RFS, EC 2.4.1.82), which are responsible for raffinose biosynthesis, play a key role in response to abiotic stresses [17,18]. Regarding rapeseed and tobacco, BnGolS and NtGolS genes have been well studied at a genome-wide level [19]. The mRNA expression level of AtGolS1 and AtGolS2 were expressed under the induction of drought and salinity; by contrast, AtGolS3 was induced by cold stress but not by drought or salt stress [20,21]. Recently, Liu et al. reported that transgenic poplar of overexpression of AtGolS2 and PtrGolS3 enhanced salt stress tolerance compared with the control plants [22]. To date, there are a few reports regarding RFS genes in response to abiotic stresses. The mRNA expression level of BvRS1 was rapidly induced by cold stress, whereas BvRS2 was upregulated by salt stresses [23]. To conclude, the data indicate that the accumulation of galactinol and raffinose is associated with plant tolerance to abiotic stress.
The kiwifruit, belonging to Actinidia, contains a large genus containing more than 50 species that originated in China [24]. It is famous for its high vitamin C content and rich nutritional minerals that are beneficial for human health [25]. Significantly, abiotic stress can have a negative impact on both the yield and quality of kiwifruit. Some major varieties of kiwifruit exhibit a high level of sensitivity to salt stress, particularly exposed to NaCl [26]. Once the soil salinity concentration reaches 0.14%, it can result in salt damage to the plant and disrupt its regular growth and development. Furthermore, when the salt concentration rises to 0.54%, the kiwifruit yield will decrease sharply and the salinity may even lead to the death of the plant [27]. The problem of soil salinization in some kiwifruit production areas is becoming increasingly prominent, and salt stress has become the main obstacle to the sustainable development of the kiwifruit industry.
In previous work, we comprehensively analyzed the evolution and expression patterns of the RFS and GolS gene family, and found that the transgenic Arabidopsis of overexpression of AcRFS4 might enhance salt tolerance by modulation of raffinose content [28]. However, the mechanism underlying the regulation of RFS by transcription factors to enhance salt resistance remains unclear. In this study, gene structure, phylogenetic analyses, chromosomal location, gene duplication, and transcript profiles under abiotic stress of AeHSF gene family were performed. Moreover, AeHSFA2b has a strong correlation with RFS4 under salt stress conditions and was highly induced by salt stress. In addition, AeHSFA2b may bind to the HSE cis-elements site of the AeRFS4 promoter by electrophoretic mobility shift assay (EMSA) and dual-luciferase reporter assay (LUC). Consistently, overexpression of AeHSFA2b increases AtRS5, AtGolS1, and AtGolS2 expression level in transgenic Arabidopsis and increases salt tolerance. Taken together, AeHSFA2b plays a significant role in enhancing salt stress tolerance by positively regulating the raffinose synthesis via regulation of RFS4. The abovementioned results have significant theoretical and practical implications for improving our understanding of the molecular mechanism underlying salt tolerance in kiwifruit.

2. Results

2.1. Identification of the AeHSF Genes in Kiwifruit

We identified 41 AeHSF genes from the kiwifruit database (http://kiwifruitgenome.org/ accessed on 2 January 2023) utilizing 20 AtHSF proteins from Arabidopsis thaliana as query sequences (Table 1). AeHSFA1a-AeHSFC1b were named according to the AtHSF gene names. Their typical characters of the AeHSF gene family amino acid sequences, including locus ID, linkage group distribution, the length of coding sequences, molecular weight (MW), and theoretical isoelectric point (pI), were detected (Table 1). A total of 11 proteins consisting of 400–700 amino acids (aa), 28 proteins containing 200–300 aa, and only 2 proteins with a length of less than 100 aa were observed. Thirteen AeHSF proteins were alkaline with PI values greater than 7.5, 23 proteins were acidic with PI values less than 5.1–7.0, and only 5 proteins were acidic with PI values less than 5.0.

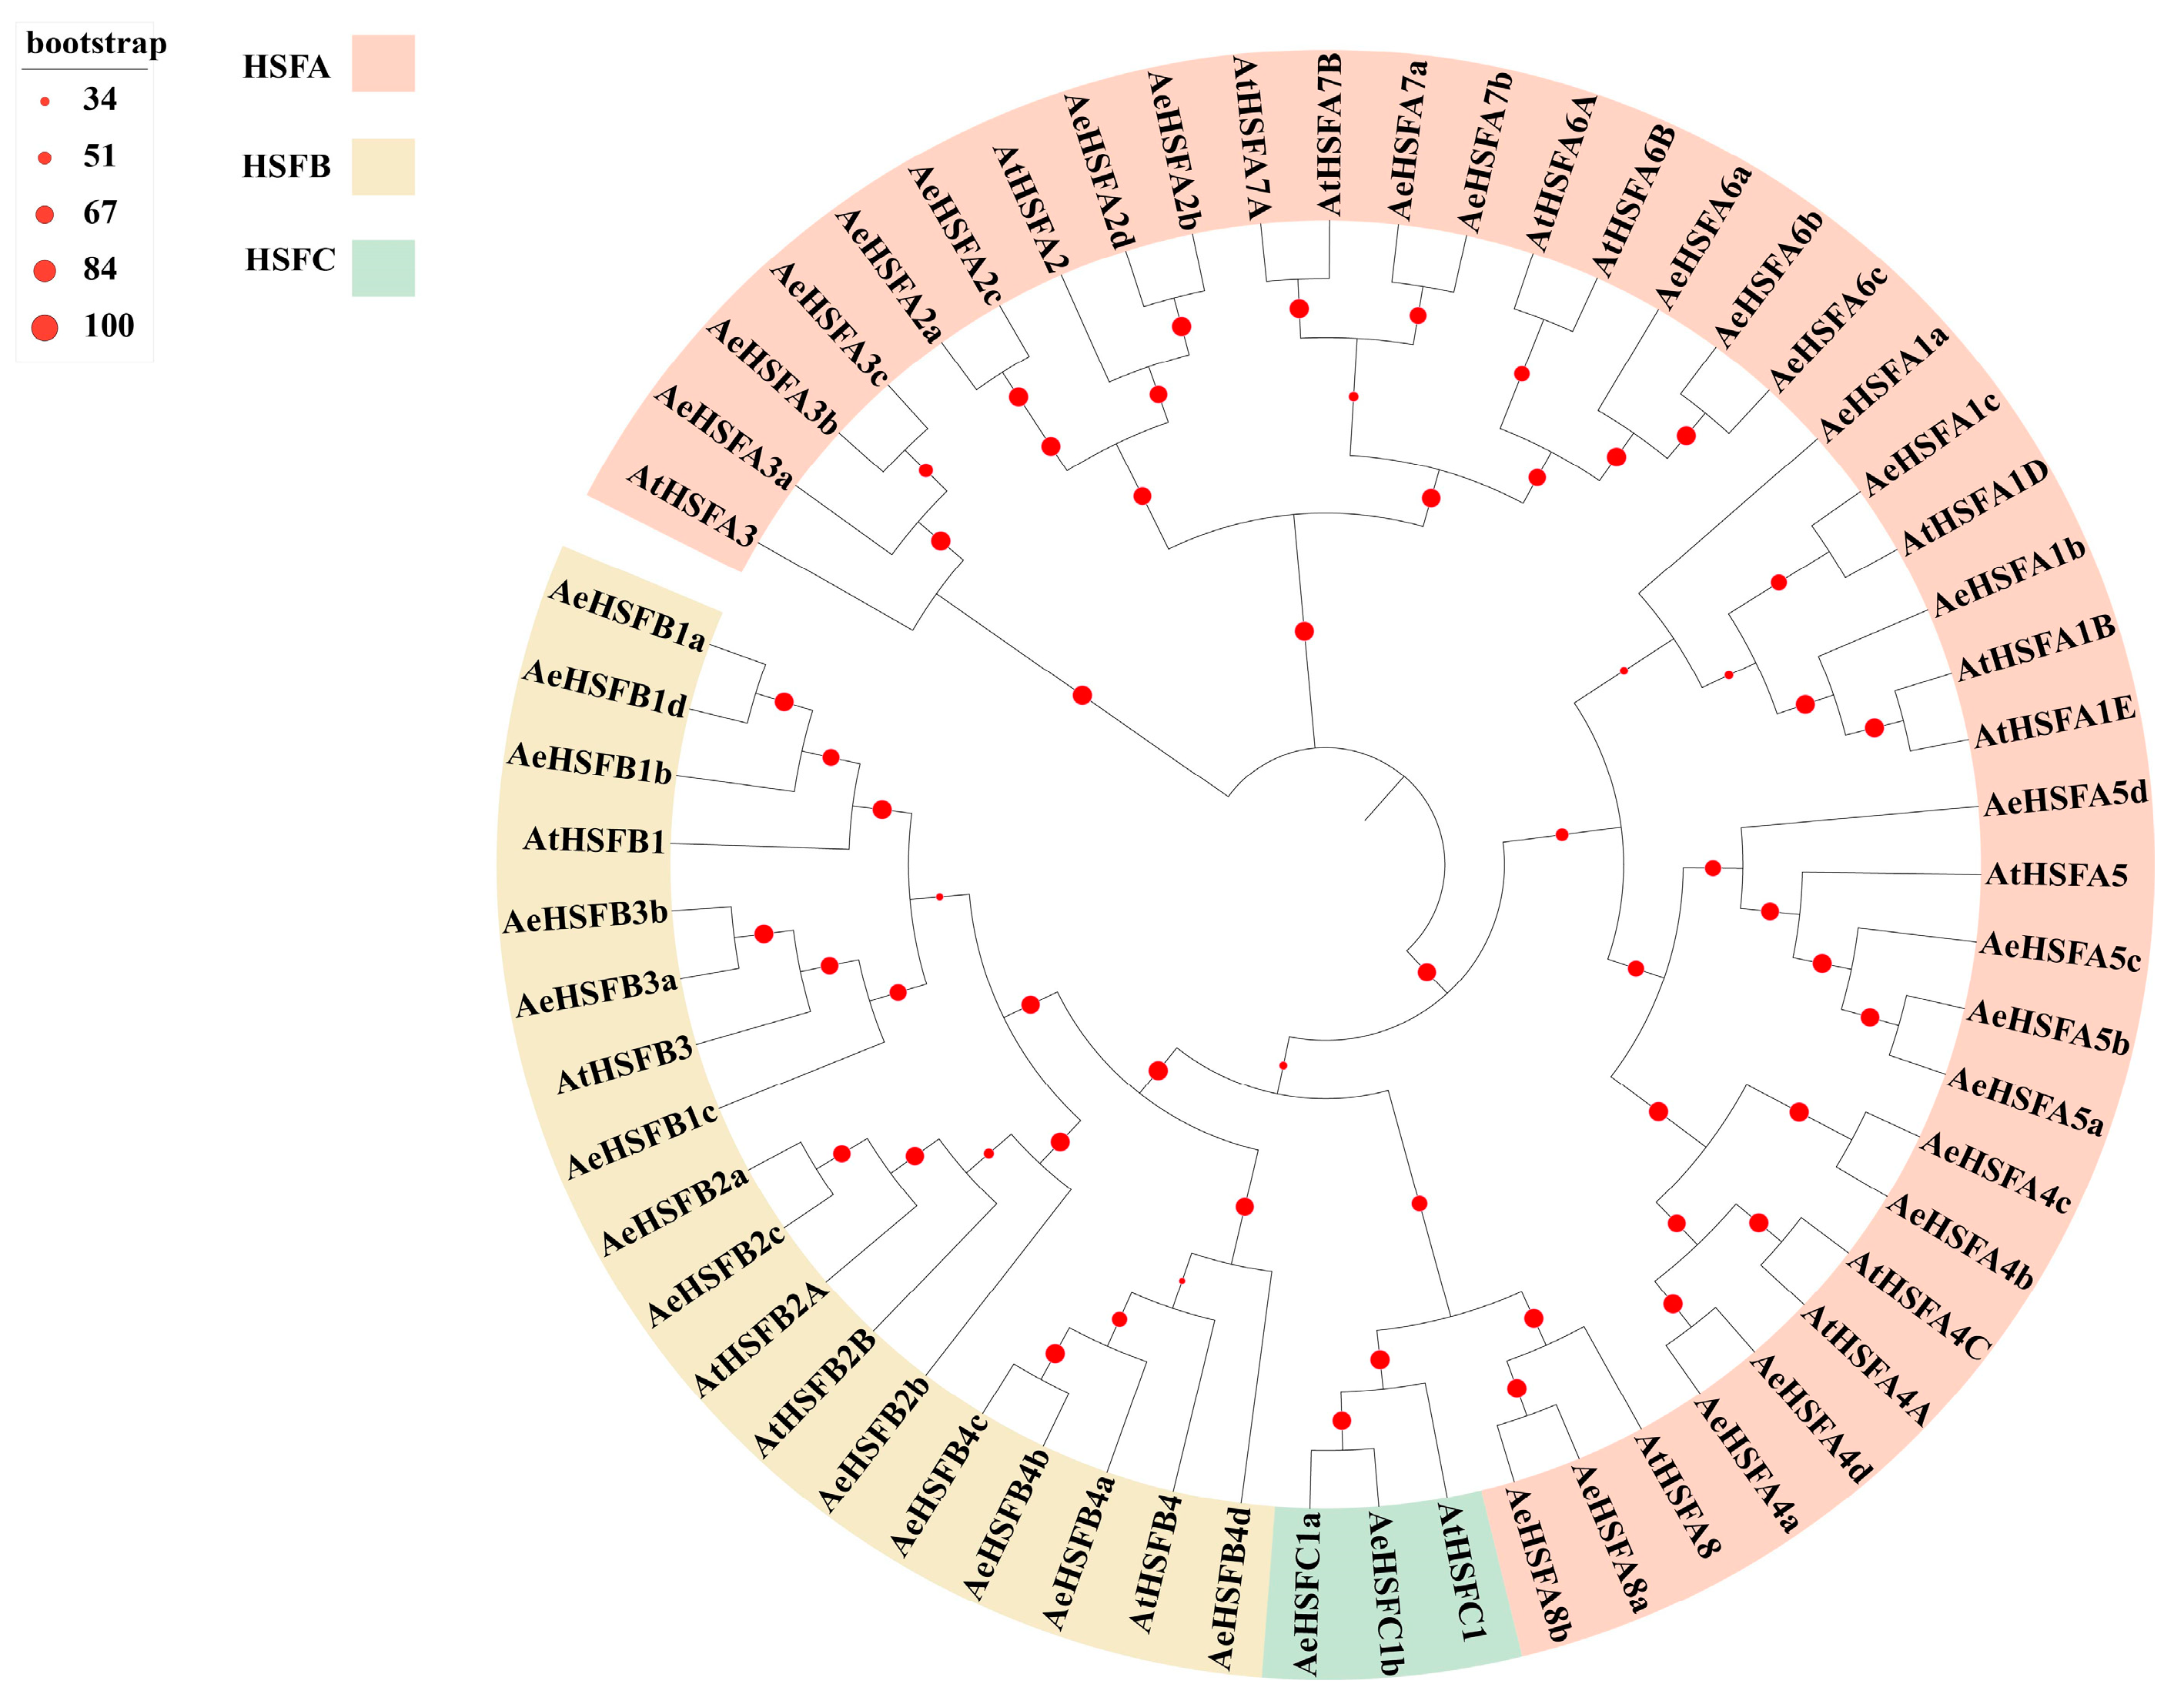
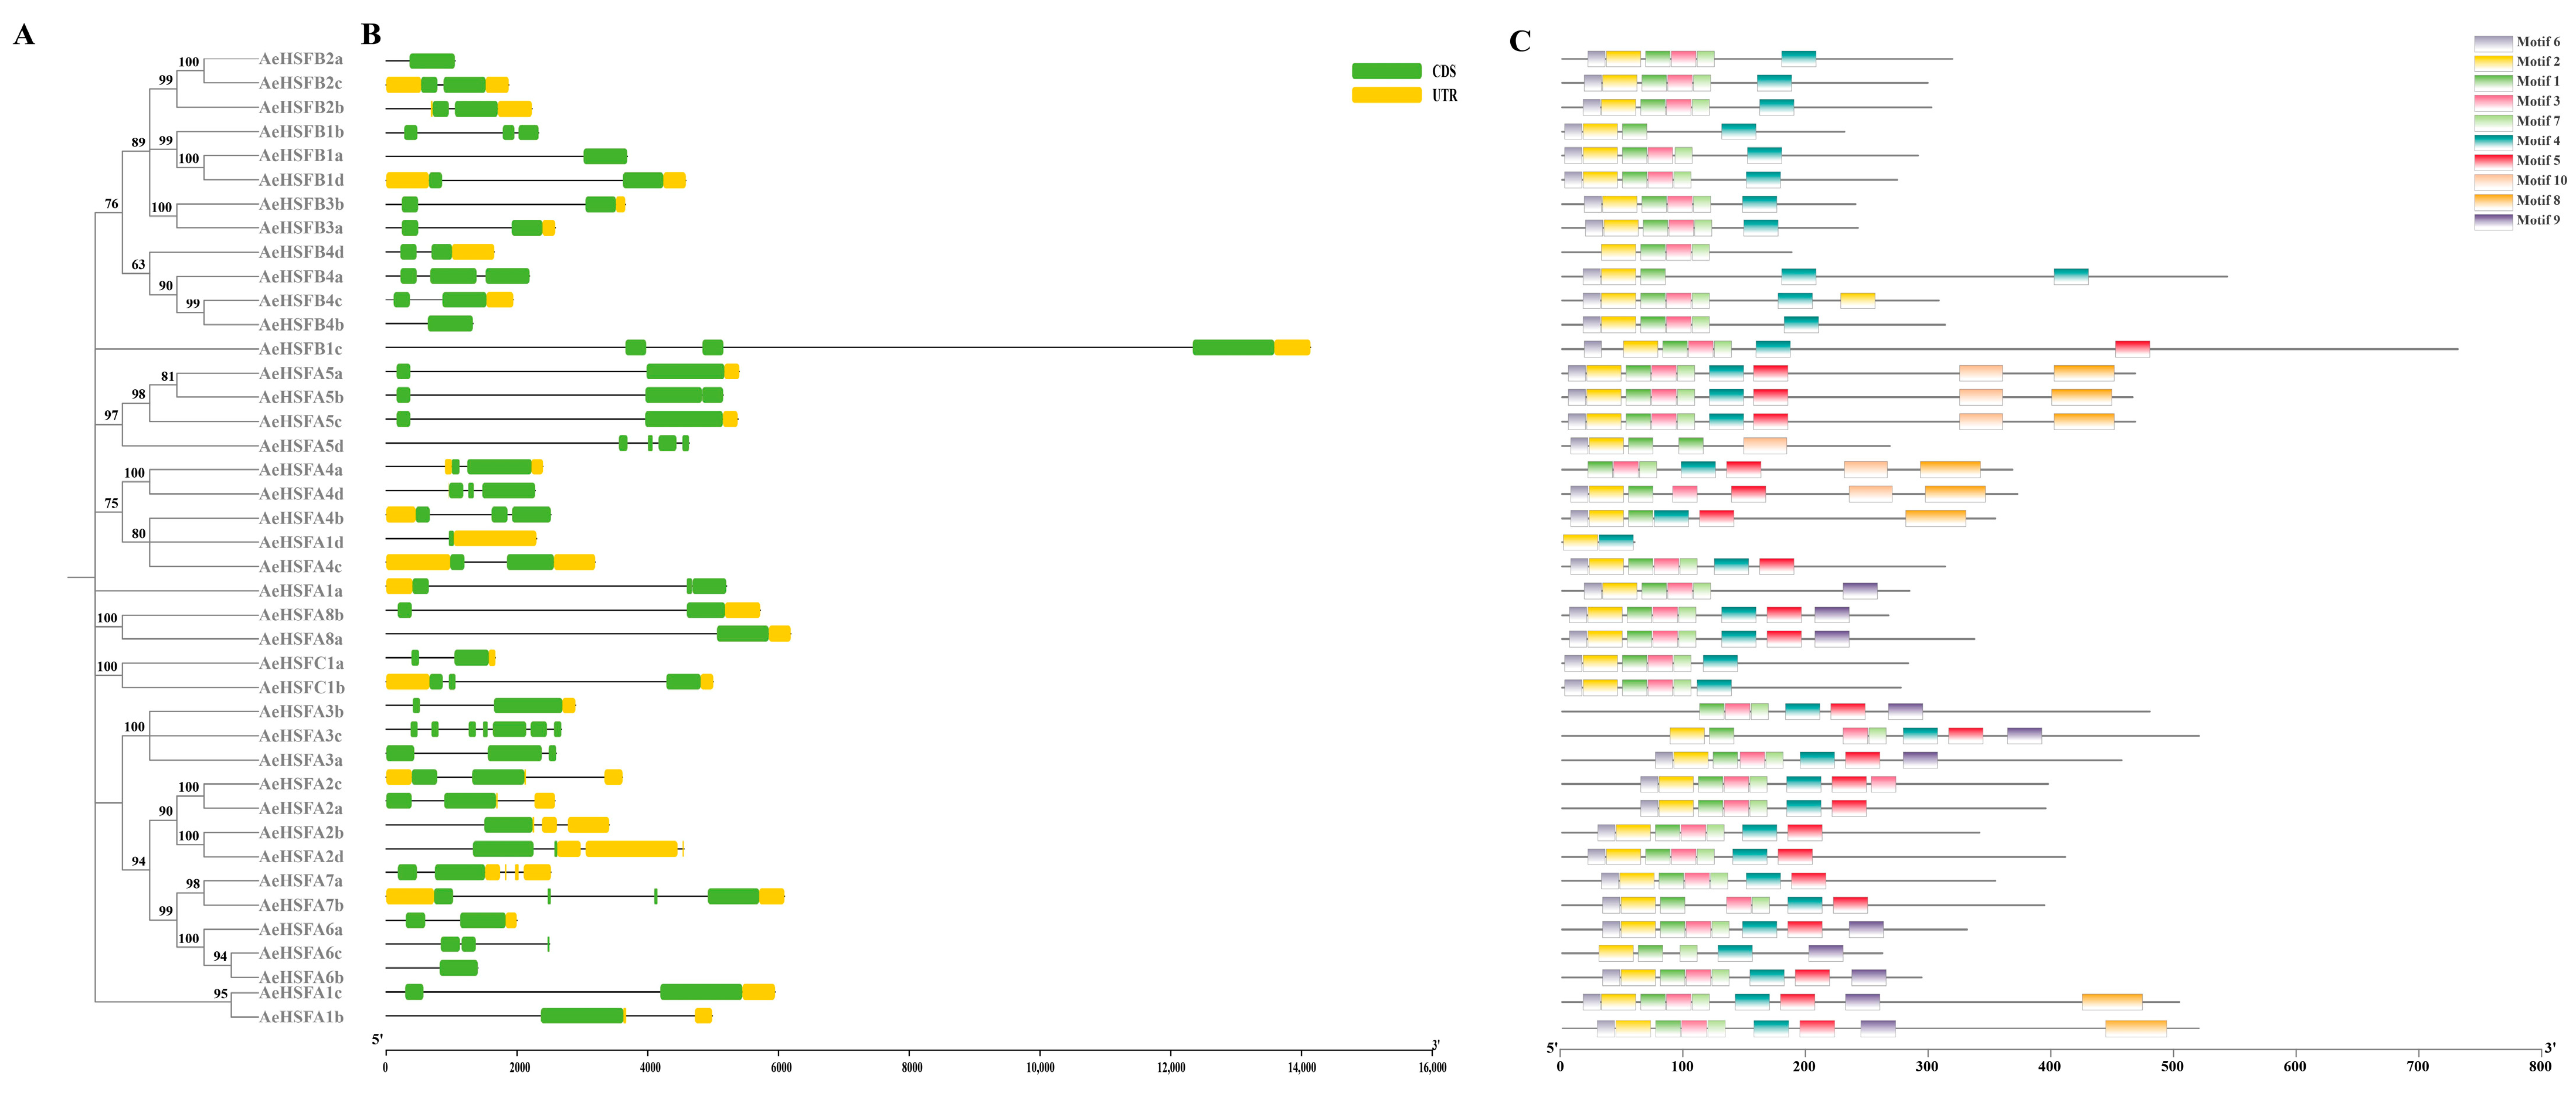
2.2. Phylogenetic Structure and Motif of AeHSF Genes

To further investigate the evolutionary relationships of AeHSFs, a total of 61 HSF protein sequences from Arabidopsis and kiwifruit were utilized to construct a phylogenetic tree. The 41 AeHSFs were categorized into three primary groups, namely, HSFA, HSFB, and HSFC (Figure 1). AeHSFA was the largest group with 26 members, which represented 63.4% of the total AeHSFs. The subsequent group was AeHSFB with 13 members, which accounted for 21.3% of the total AeHSFs. The smallest group was AeHSFC with only 2 members, which constituted only 4.8% of the total AeHSFs. In addition, the HSFA category is further divided into HSFA1-8 subgroups. The HSFB category is further divided into HSFB1-4 subgroups. The HSFC category is further divided into only one subgroup (Table 1).
In order to understand the evolutionary relationship and the exon–intron organization of the AeHSF gene family, we conducted an analysis of multiple sequence alignment to 41 AeHSF protein sequences and the gene structure and conserved motif of AeHSF gene members. As shown in Figure 2A,B, we observed considerable variation in the number of introns present within the AeHSF genes, with a range from 1 to 5. The exon distribution analysis revealed that AeHSF genes within the same group exhibited a conserved gene structure and a similar number of exons, indicating highly conserved structures. In total, 10 motifs were predicted. Motif 1, Motif 2, and Motif 3 were identified as distinctive structural motifs of HSF. Motif 1 and Motif 2 were commonly found in all AeHSF genes, while in AeHSFA3d, Motif 3 existed alone (Figure 2C). Many AeHSF genes in the same groups had similar exon–intron structure and conserved motif, which was highly conservative in kiwifruit (Figure 2A–C).

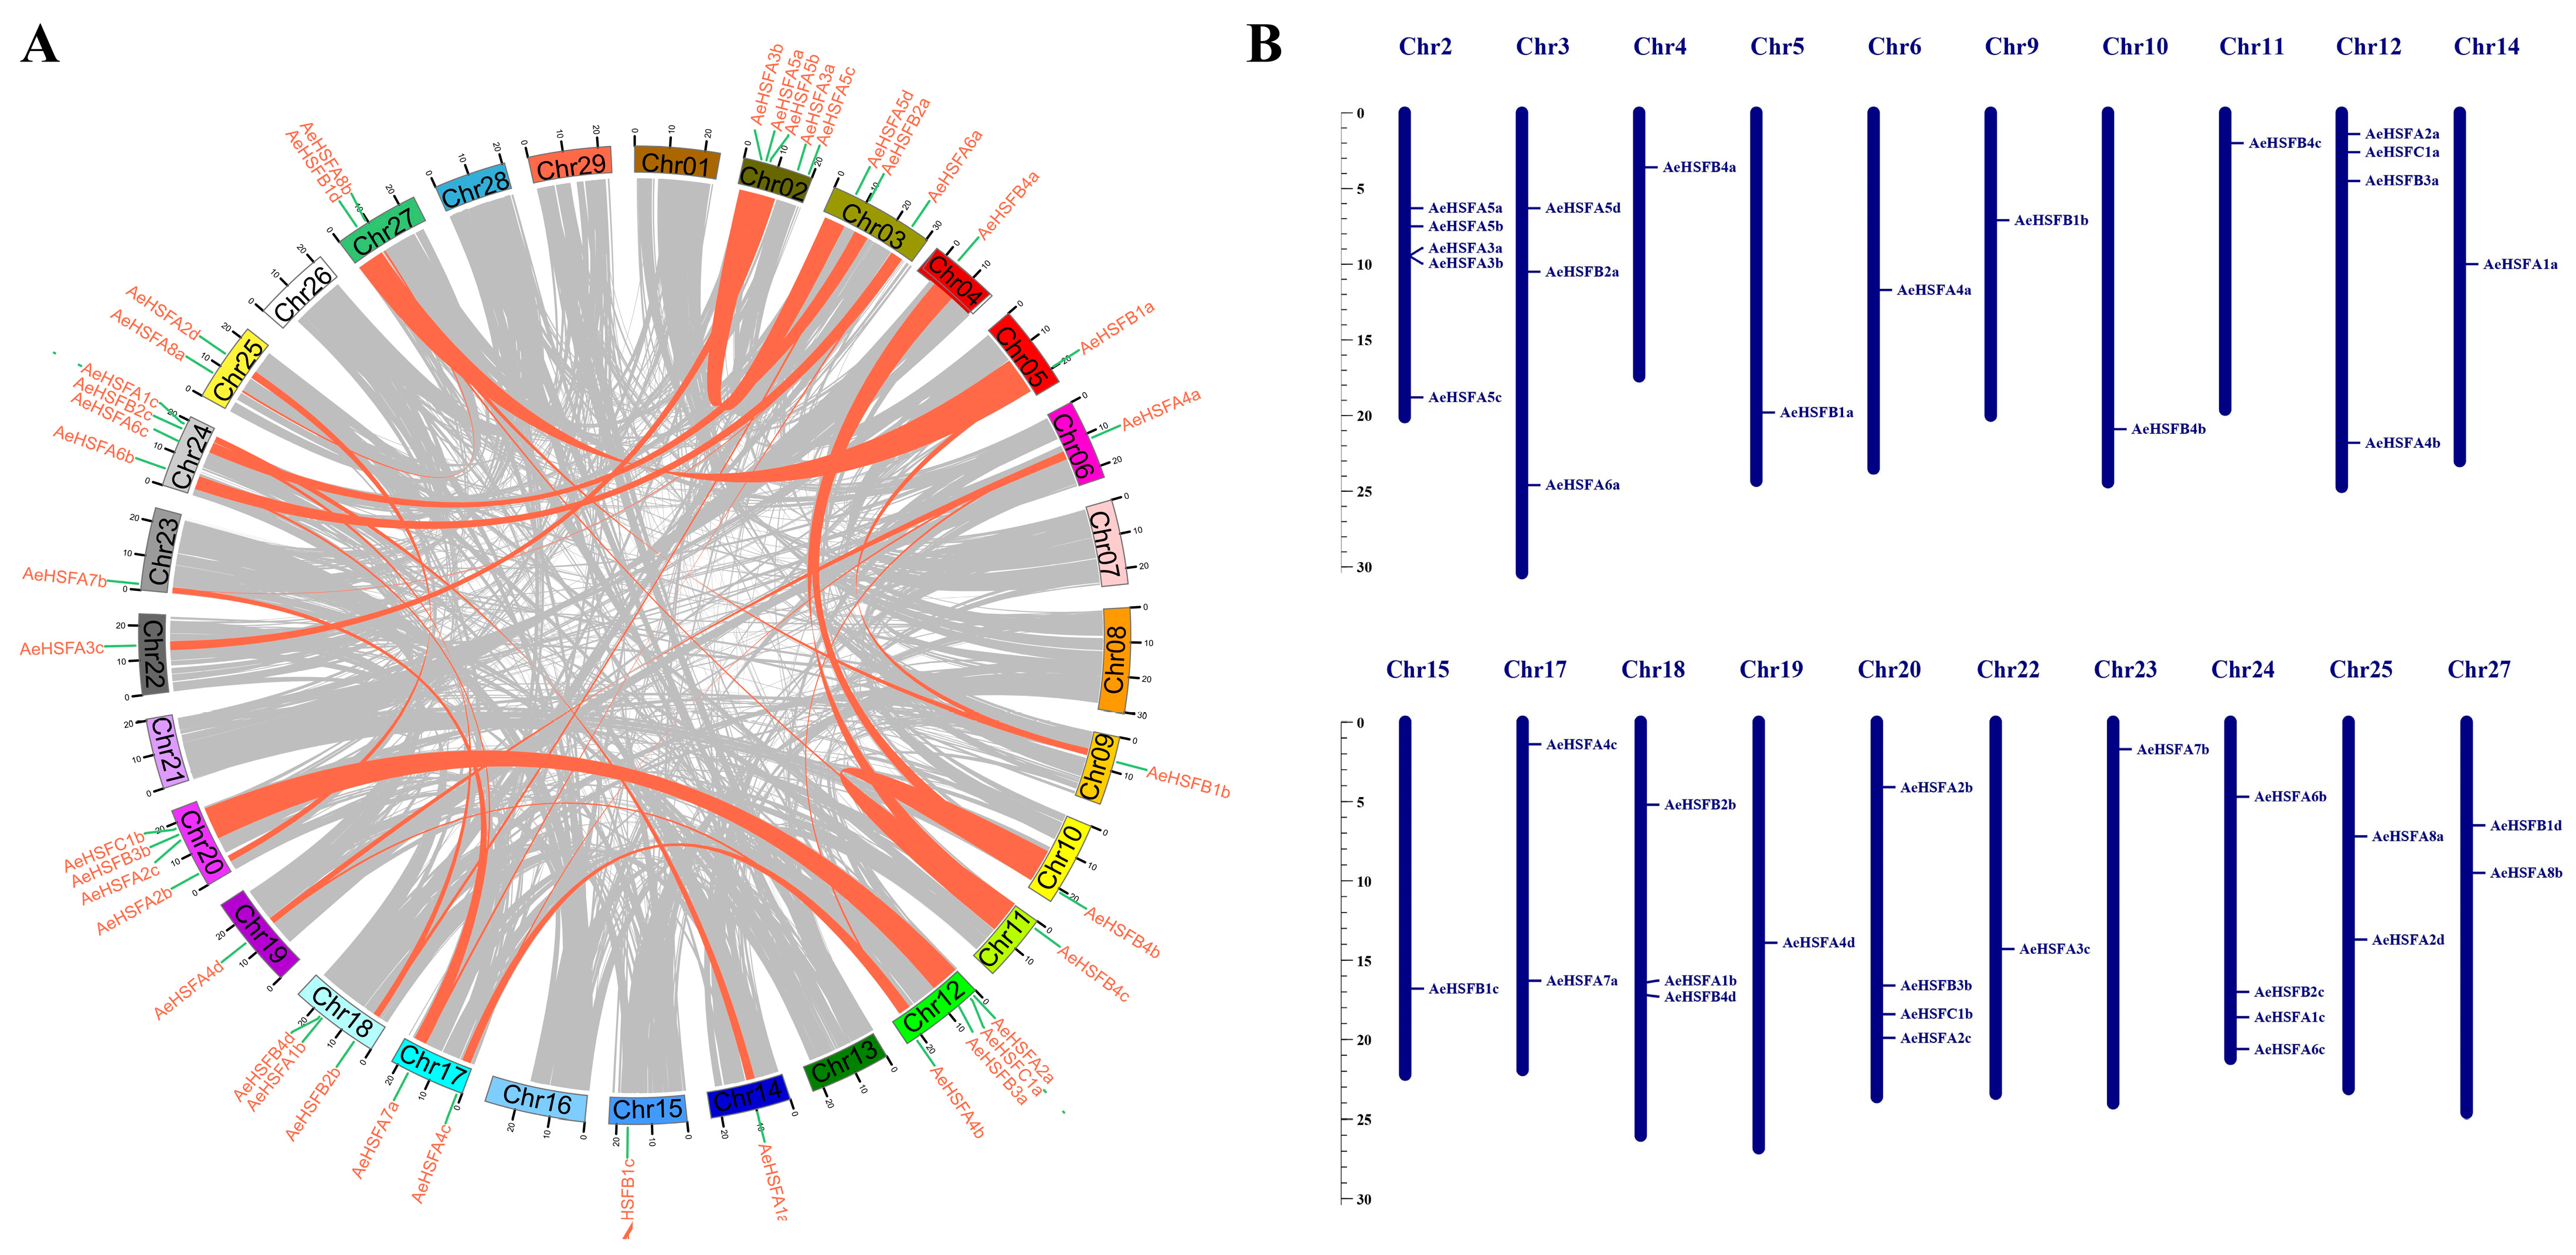
2.3. Duplication and Chromosomal Location of the AeHSF Genes

Gene duplication events are crucial in facilitating the emergence of novel functions and expanding the repertoire of genes. The duplication events of the HSF genes in the kiwifruit genome were analyzed. It was observed that no tandem duplication events occurred. However, a total of 28 pairs of segmental duplicates were identified (Figure 3A), suggesting that gene duplication serves as a fundamental mechanism for generating genetic diversity and facilitating the adaptation of organisms to changing environments. In A. eriantha, the positions of 41 AeHSF genes could be found on 20 chromosomes (Figure 3B). There was only one AeHSF gene on each of the chromosomes Chr4, Chr5, Chr6, Chr9, and Chr10. Five genes were located on chromosome 2, which contained the largest number of AeHSF genes in a chromosome (Figure 3B).
The 2000 bp sequences upstream promoter regions of the AeHSF genes were analyzed using PlantCARE (http://bioinformatics.psb.ugent.be/webtools/plantcare/html/ accessed on 4 June 2023). Some putative cis-elements responsive to stresses including W-box (defense and stress-responsive element), STRE (stress response element), DRE, CAAT--box (low-temperature responsive element), MBS (MYB binding site), and ABRE (ABA-responsive element) were found (Figure 4).

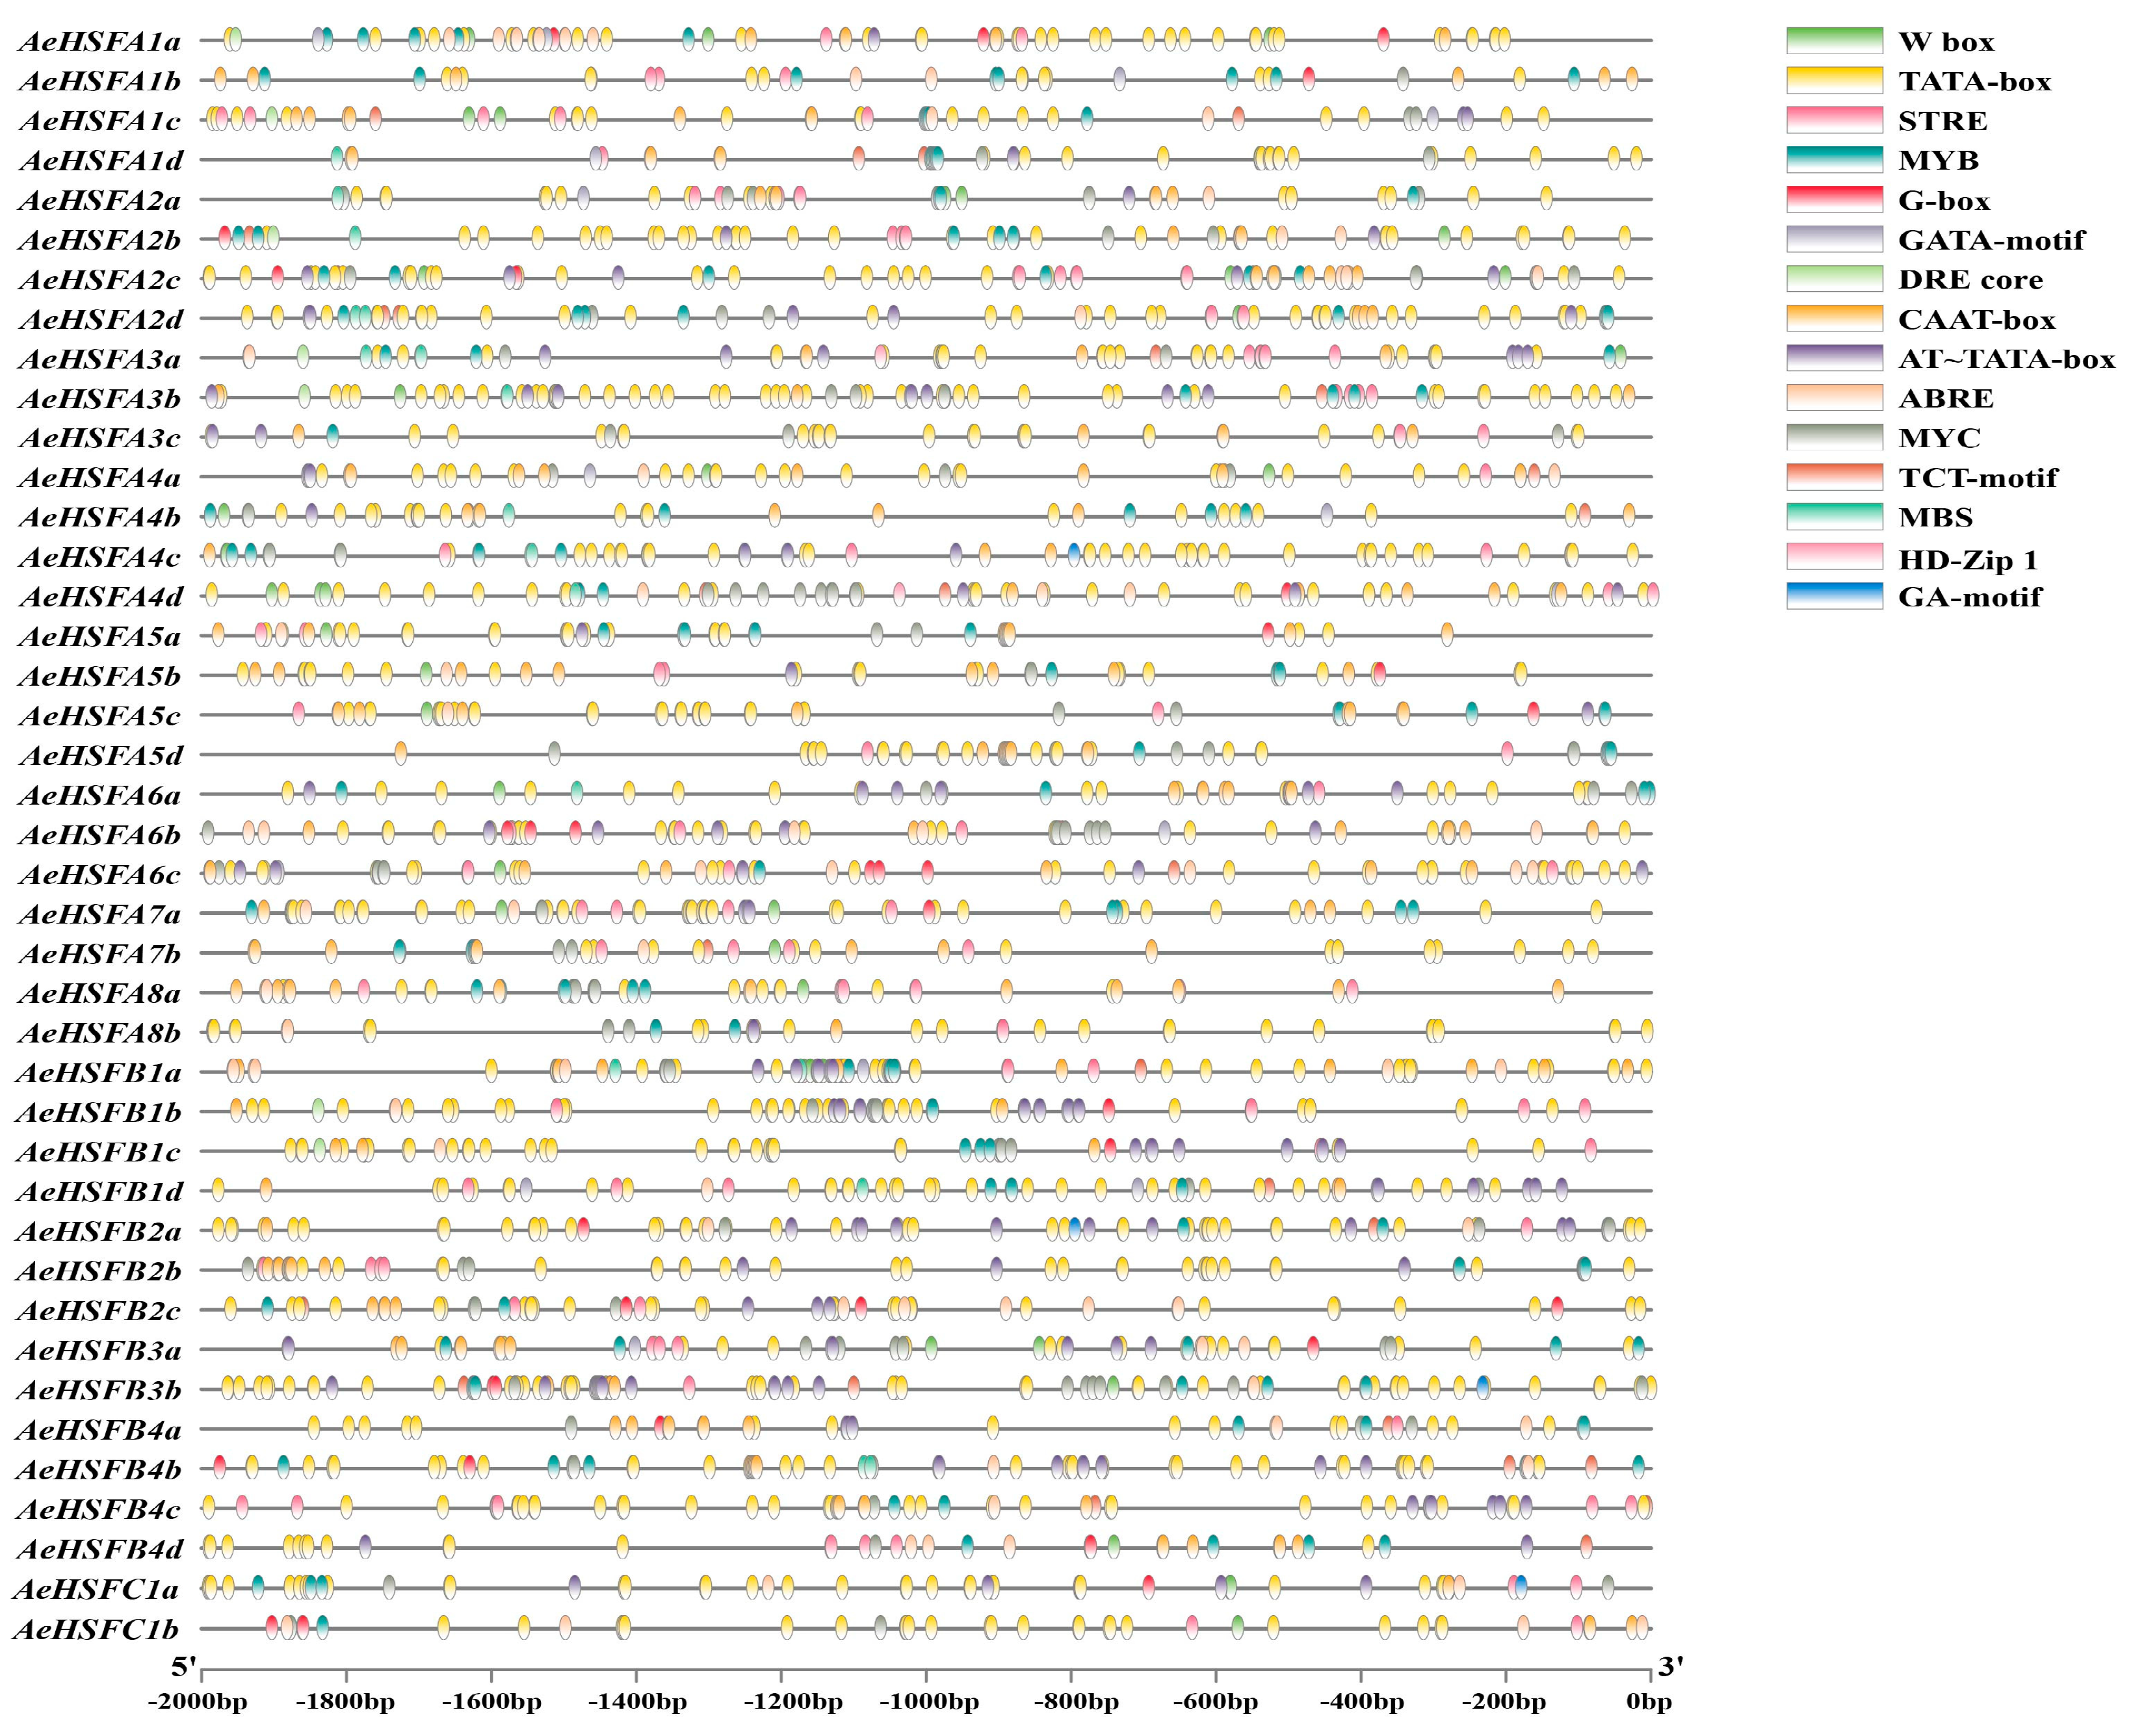
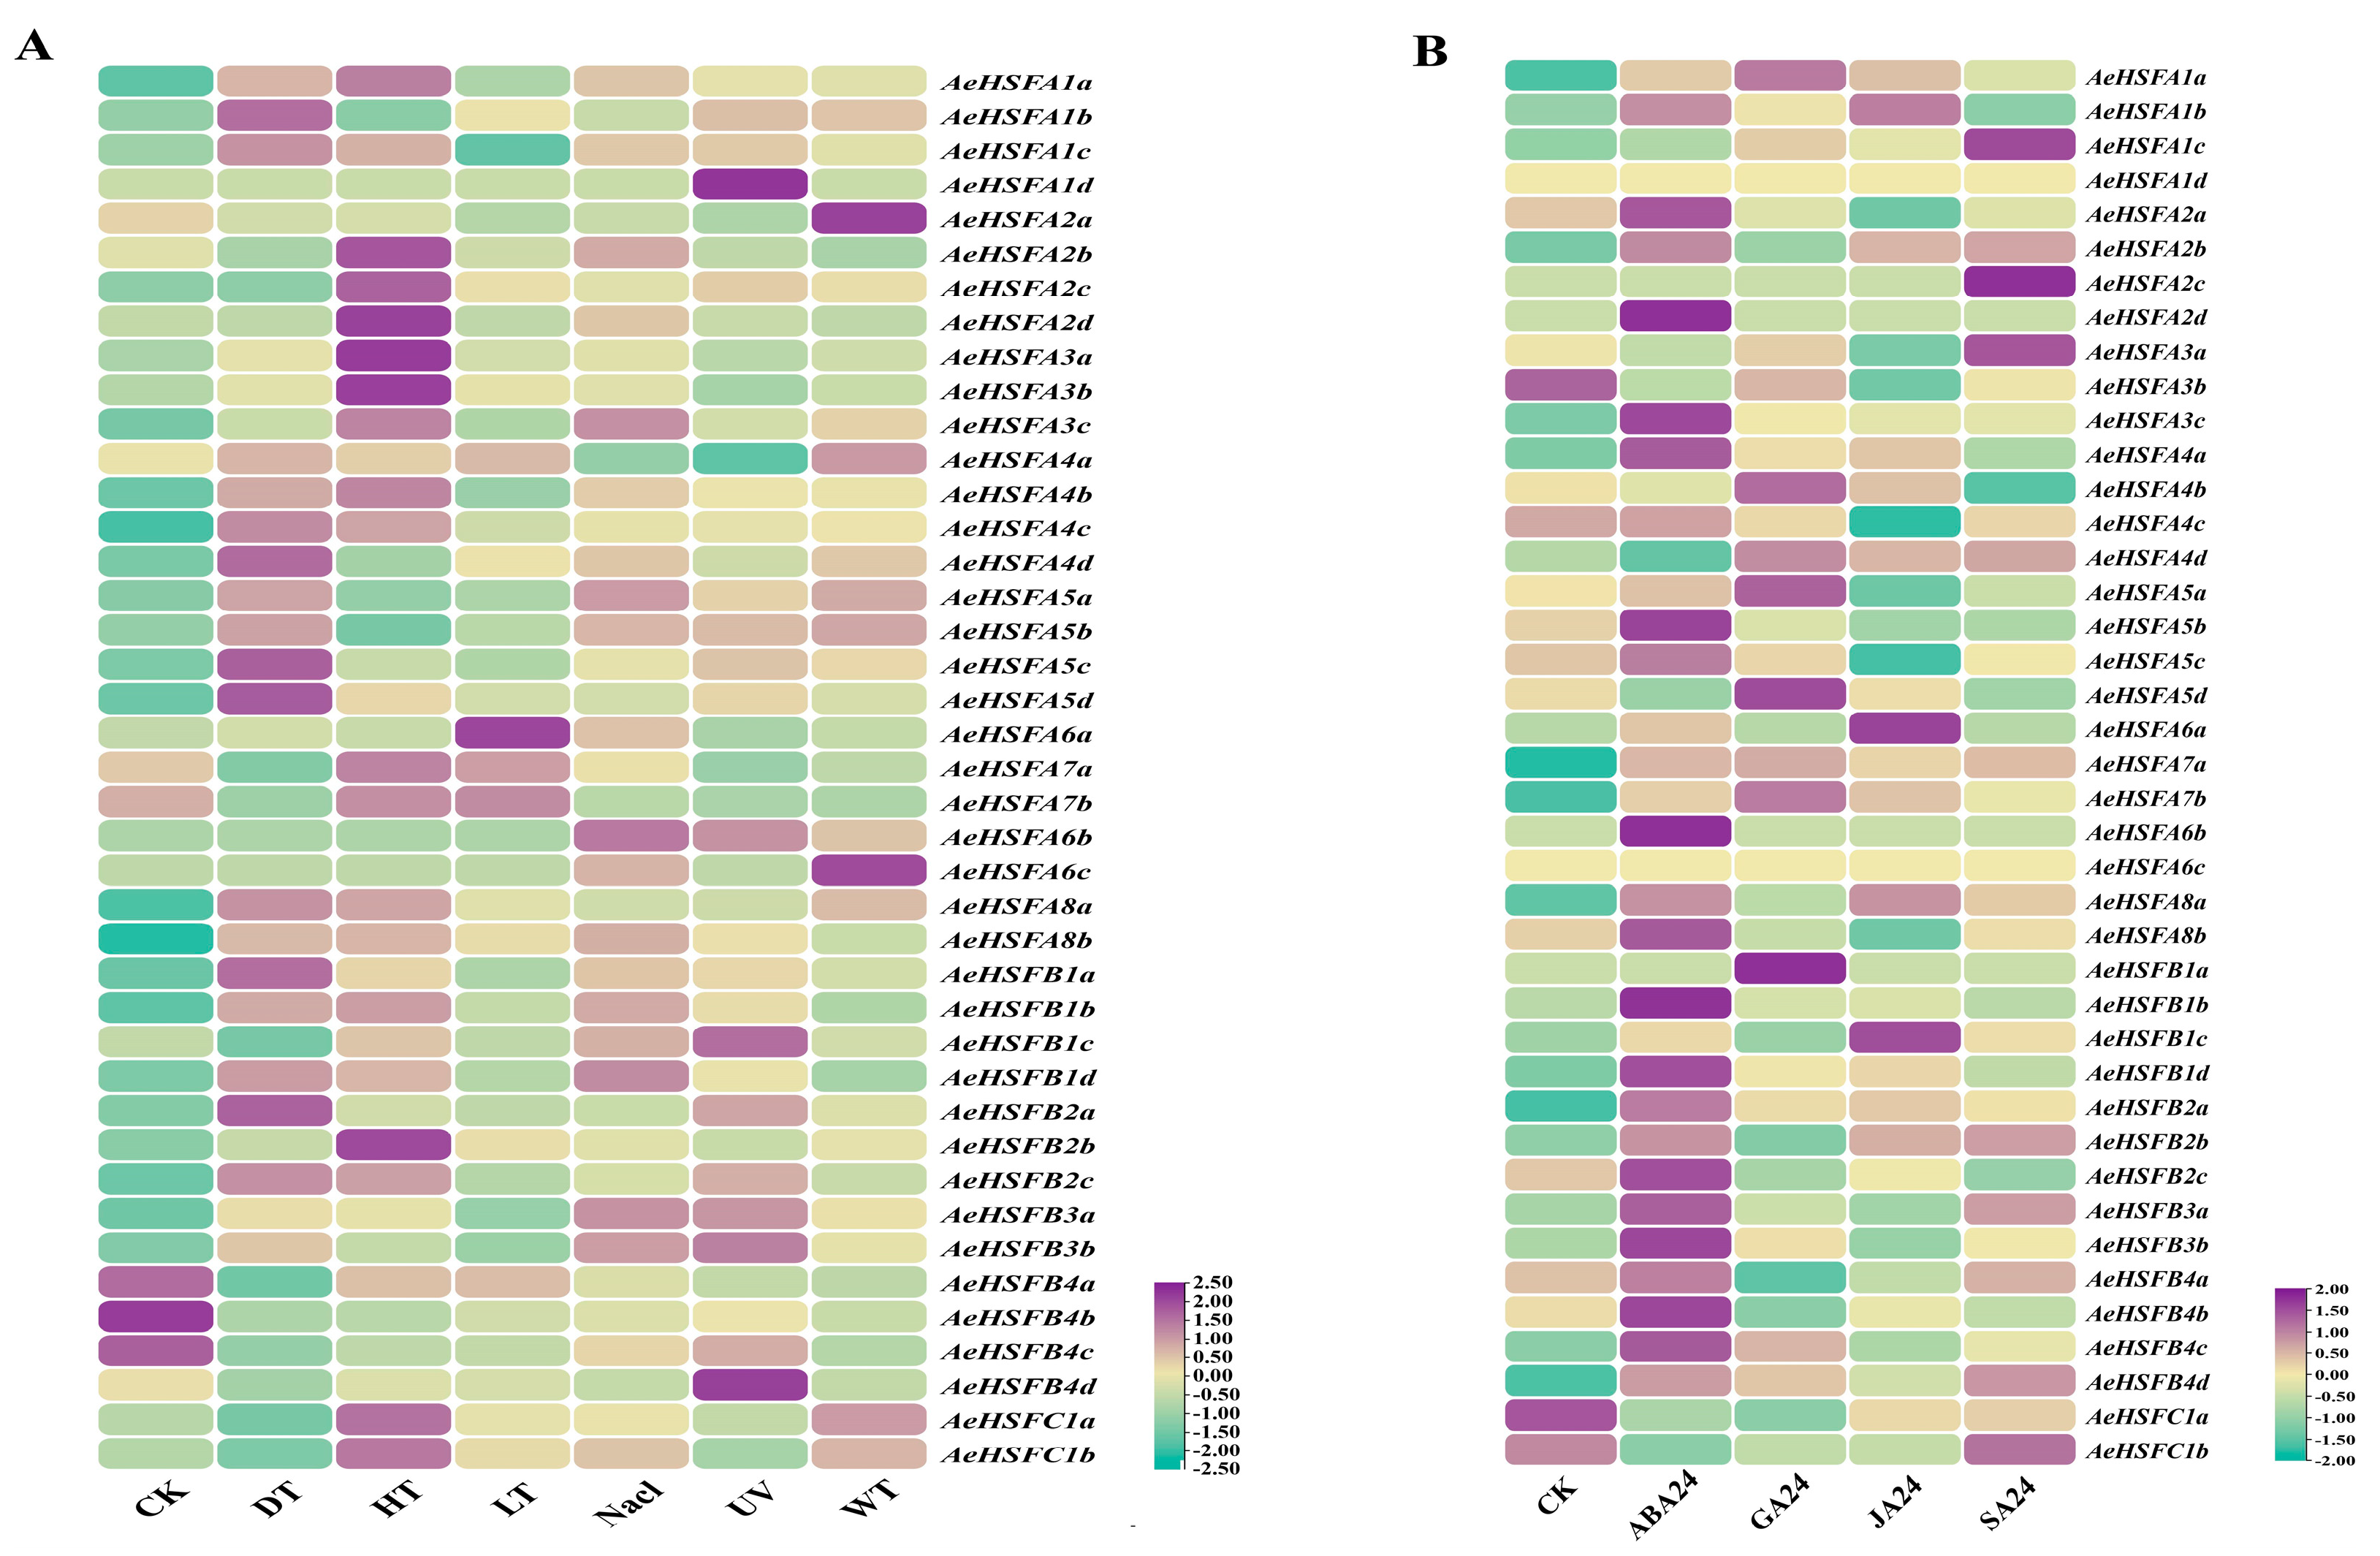
2.4. Expression of AeHSF Genes in Response to Abiotic Stresses and Hormone Treatments

Most of the AeHSF genes, with the exception of AeHSFB4a-4c, were significantly induced in response to abiotic stresses (Figure 5A). Noteworthily, 20 out of 41 AeHSF genes showed relatively higher expression levels after heat (HT) stress. Seventeen AeHSF genes were upregulated in response to drought (DT) stress. We also found that 18 AeHSF genes were expressed under NaCl stress. Among these genes, AeHSFA2b, AeHSFA3C, AeHSFA5a, AeHSFA6a, AeHSFA1a-1d, and AeHSFA3a-3b were strongly expressed, while the other genes were slightly expressed under NaCl stress. The gene AeHSFA2a was only expressed under waterlogging (WT) stress. As shown in Figure 5B, a significant induction was observed in about 61% of the AeHSF genes in response to ABA treatment. Especially, 10 AeHSF genes belonging to HSFB were strongly induced by ABA. Eight AeHSF genes were induced by GA. Only three AeHSF genes (AeHSFA1b, A6a, and B1c) had high expression in response to JA treatments. Only AeHSFA1c, AeHSFA2c, and AeHSFA3a were highly expressed after SA treatments.

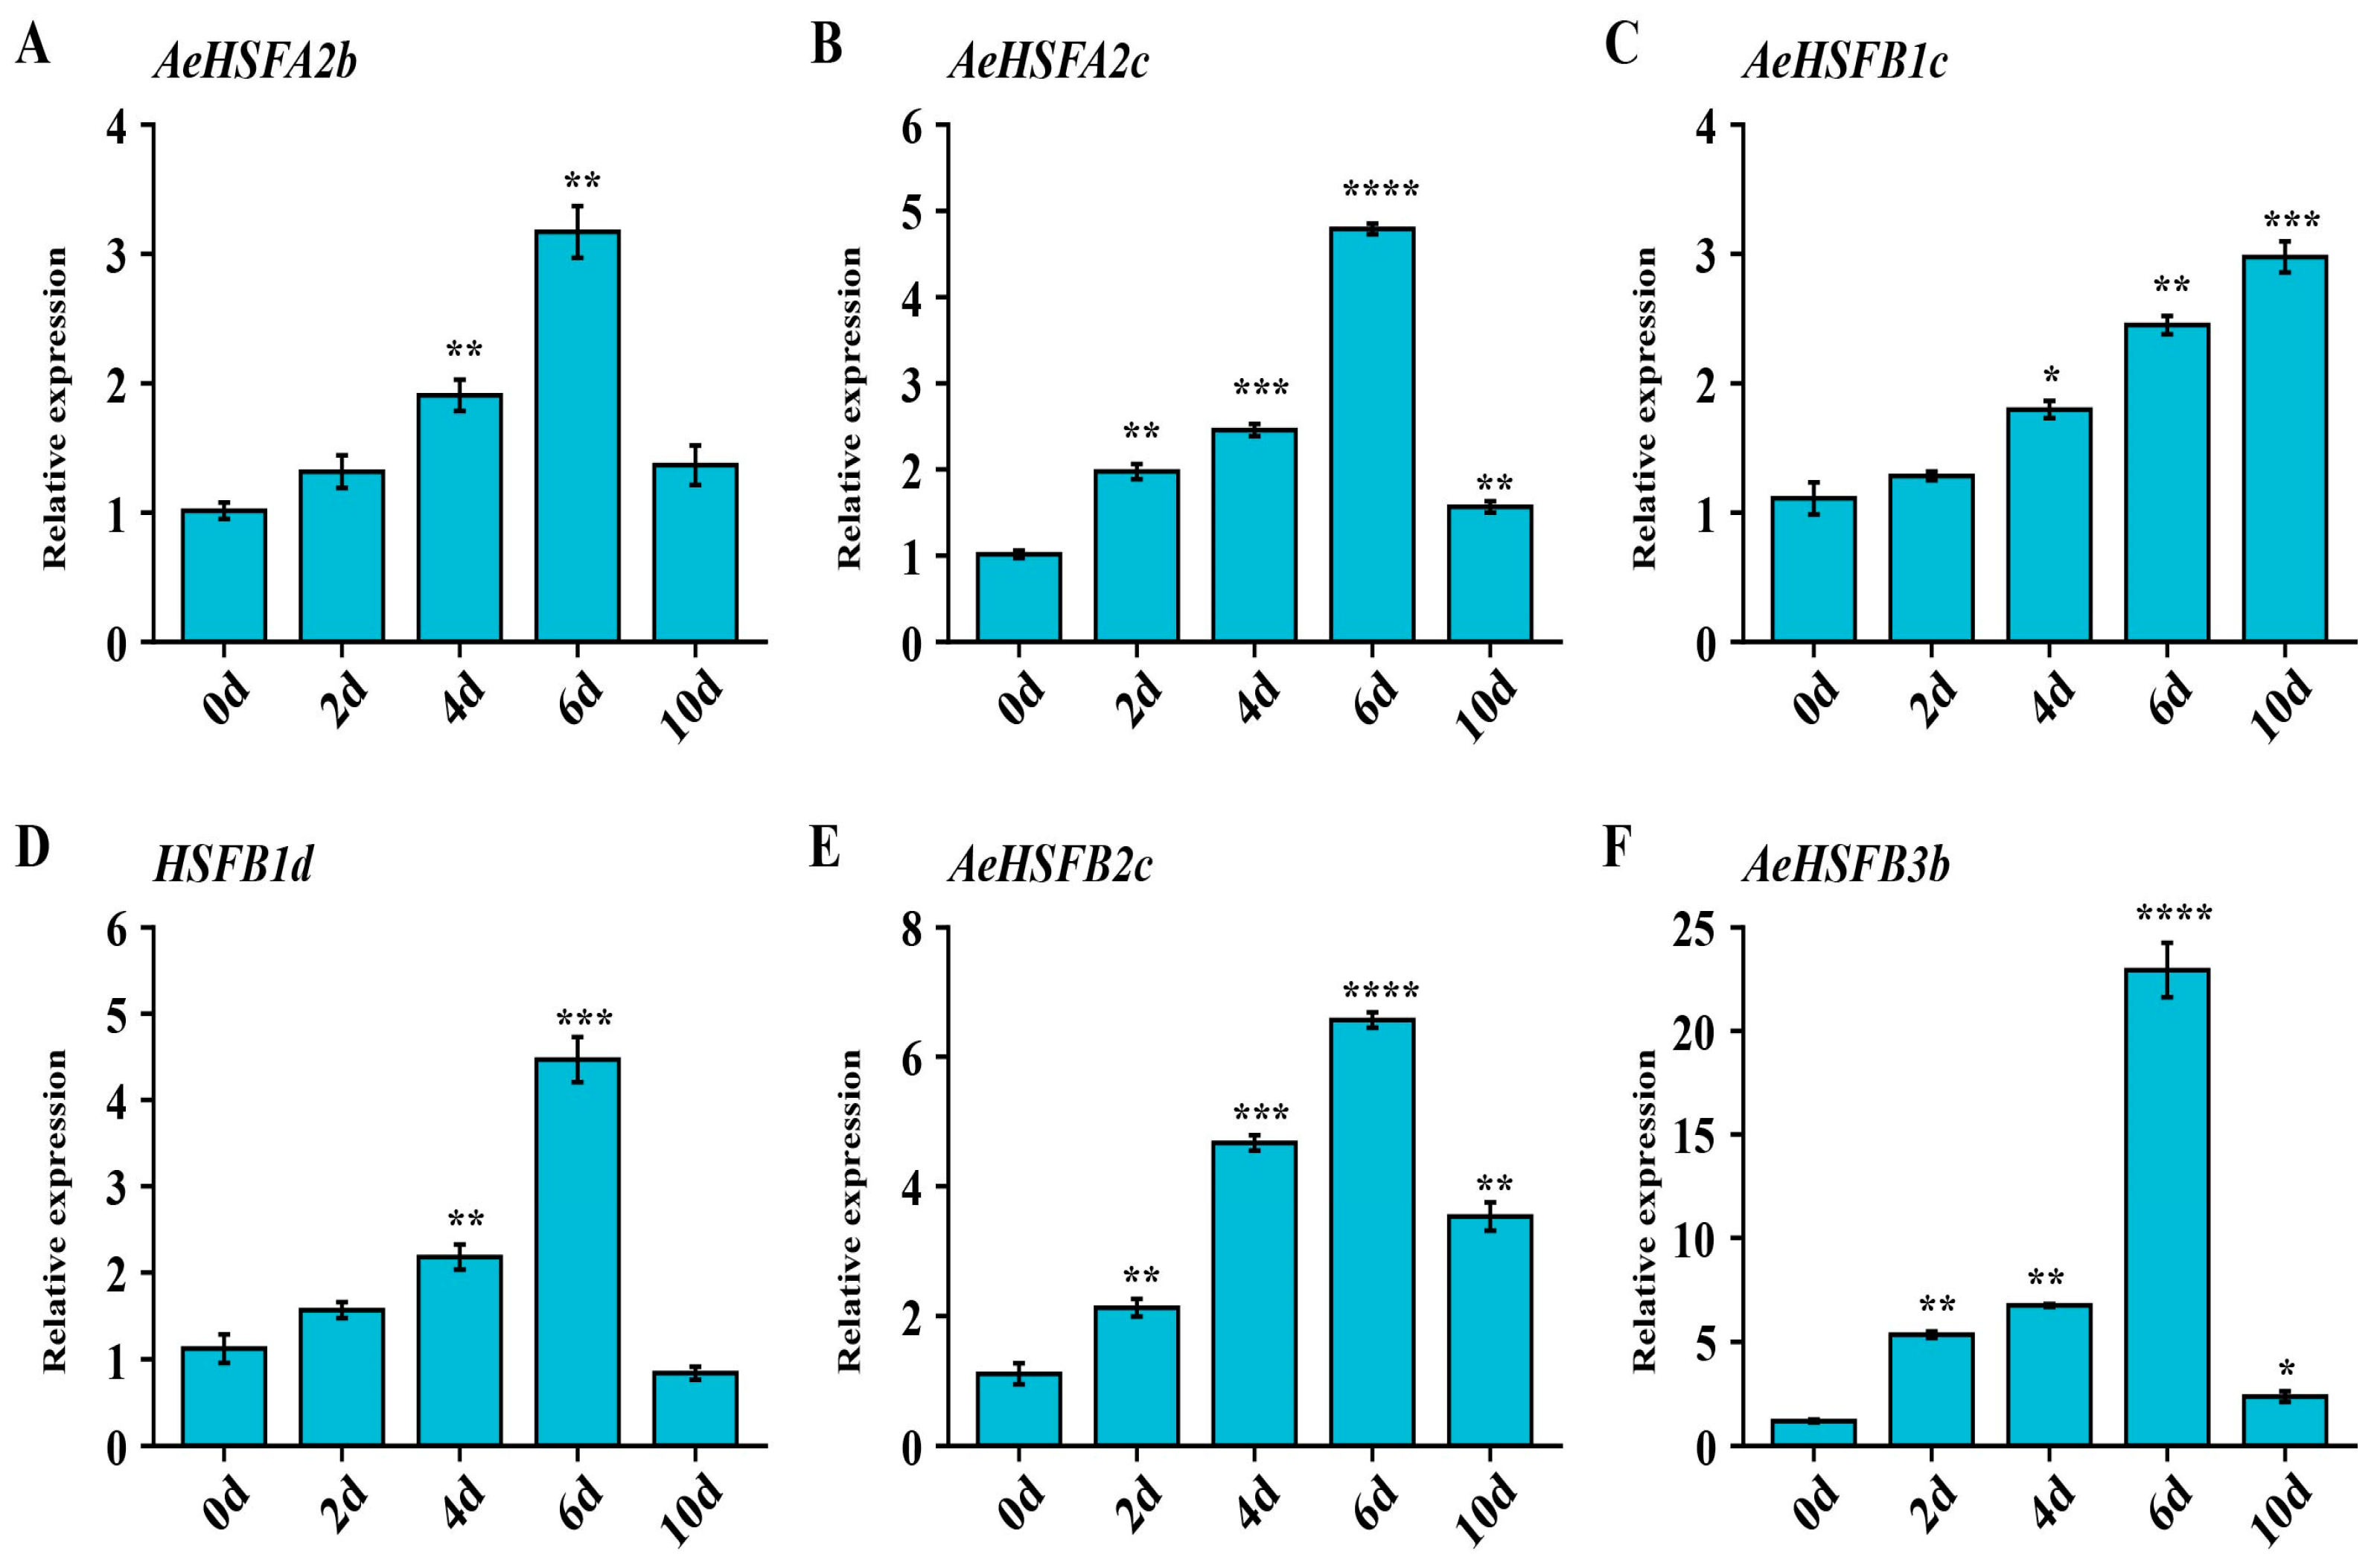
2.5. Verification of Key AeHSF Genes Expression under NaCl Stress by qRT−PCR

To further validate the expression pattern of key AeHSF genes under salt stress, AeHSFA2b/2c and AeHSFB1c/1d/2c/3b genes were selected for qRT-PCR analysis. As shown in Figure 6, the expression levels of AeHSFA2b/2c and AeHSFB1d/2c/3b were significantly induced and peaked at 6 d under salt treatment. The expression levels of AeHSFB1c increased gradually during the whole salt-treated time. These results indicate that these genes were really induced by salt stress.

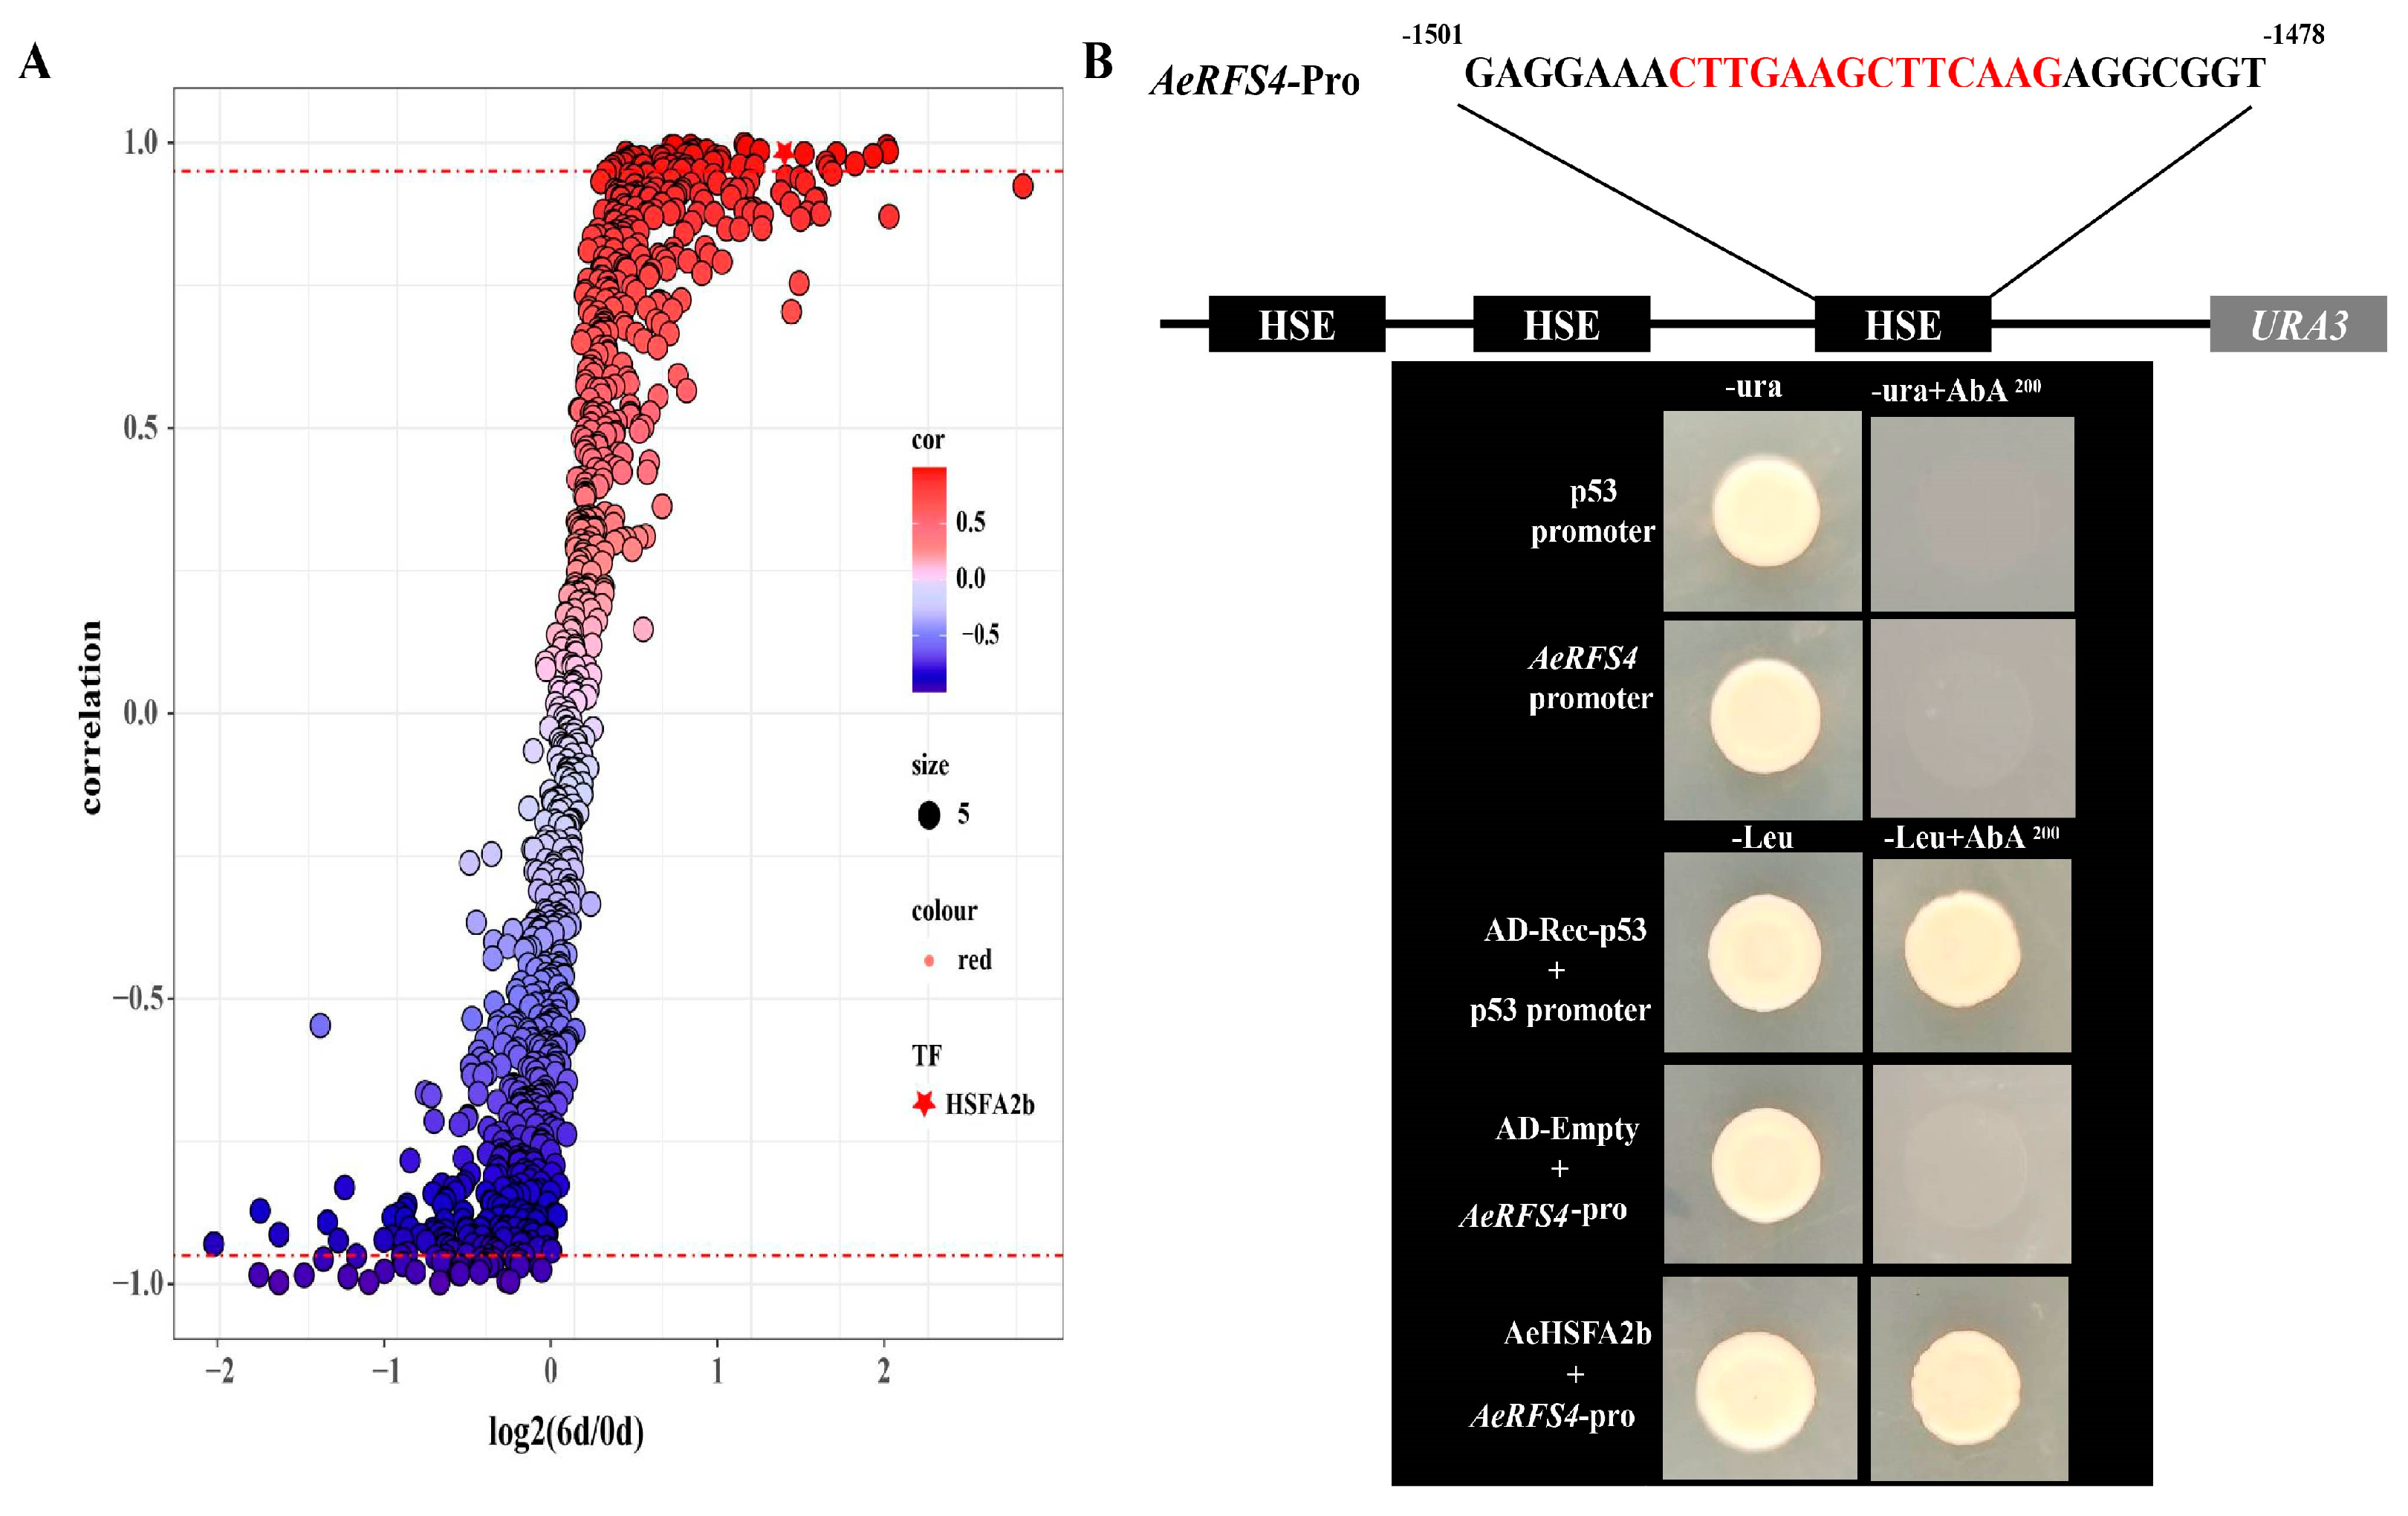
2.6. Correlation of All Transcription Factors with the Expressional Pattern of RFS4 under Salt Treatment and Transcriptional Activation of AeHSFA2b

The kiwifruit RNA-seqs of salt treatments were analyzed. The correlation results showed that AeHSFA2b transcription factors (TFs) had a strong correlation (R = approximately 0.95) with the expression patterns of AeRFS4 under salt treatment (Figure 7A). The self-activation result of the Y1H Gold promoter showed that the growth of Y1H Gold containing the pABAi-AeRFS4-Pro recombinant plasmid was inhibited when exposed to a concentration of ≥200 ng mL−1 aureobasidin A (AbA) (Figure 7B). Only the positive control strain and transformed Y1H Gold harboring both pABAi-AeRFS4-Pro and pGADT7-AeHSFA2b could grow in a medium without leucine (-Leu) (200 ng mL−1 AbA), indicating protein–DNA interaction of AeHSFA2b and the AeRFS4 promoter (Figure 7B).

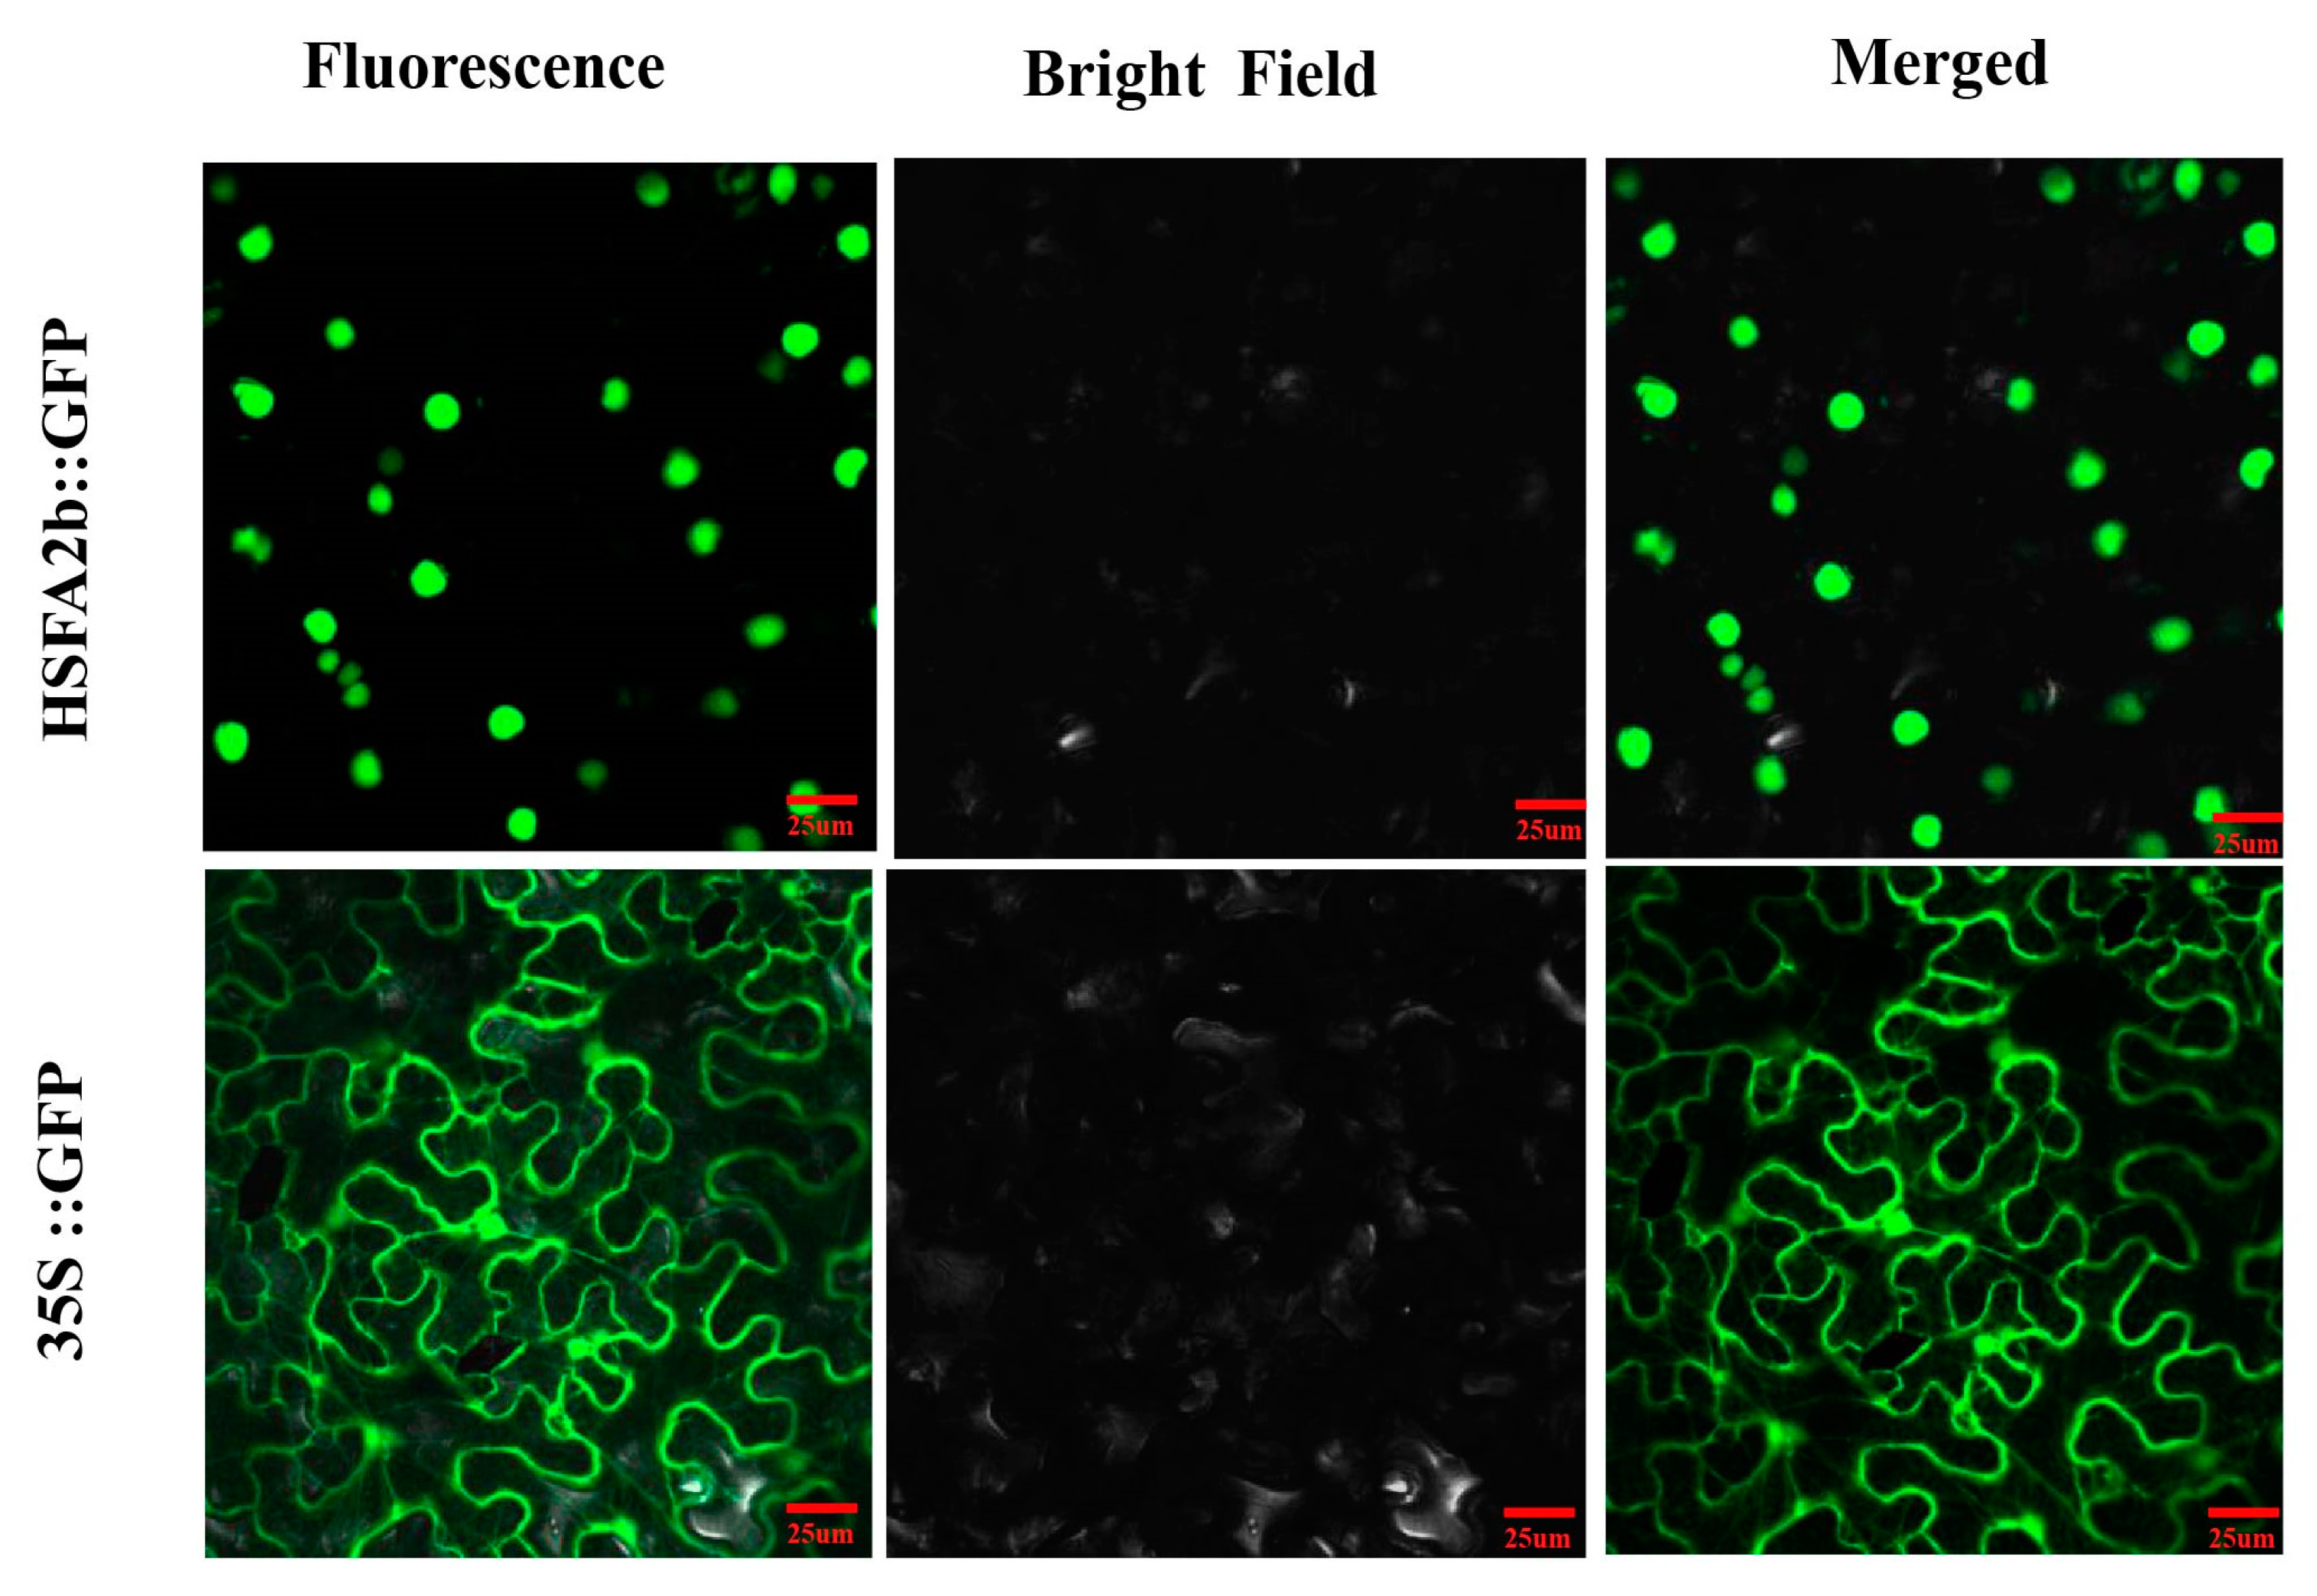
2.7. Subcellular Localization of the AeHSFA2b Protein

Transient expression of the 35S::GFP plasmid demonstrated widespread GFP fluorescence across all cells, whereas the 35S:: AeHSFA2b:GFP plasmid exhibited distinct green fluorescence signals specifically localized in the nucleus (Figure 8). This finding suggests that AeHSFA2b likely encodes a nuclear-localized protein, which aligns with the functional attributes in its role of regulating gene transcription.

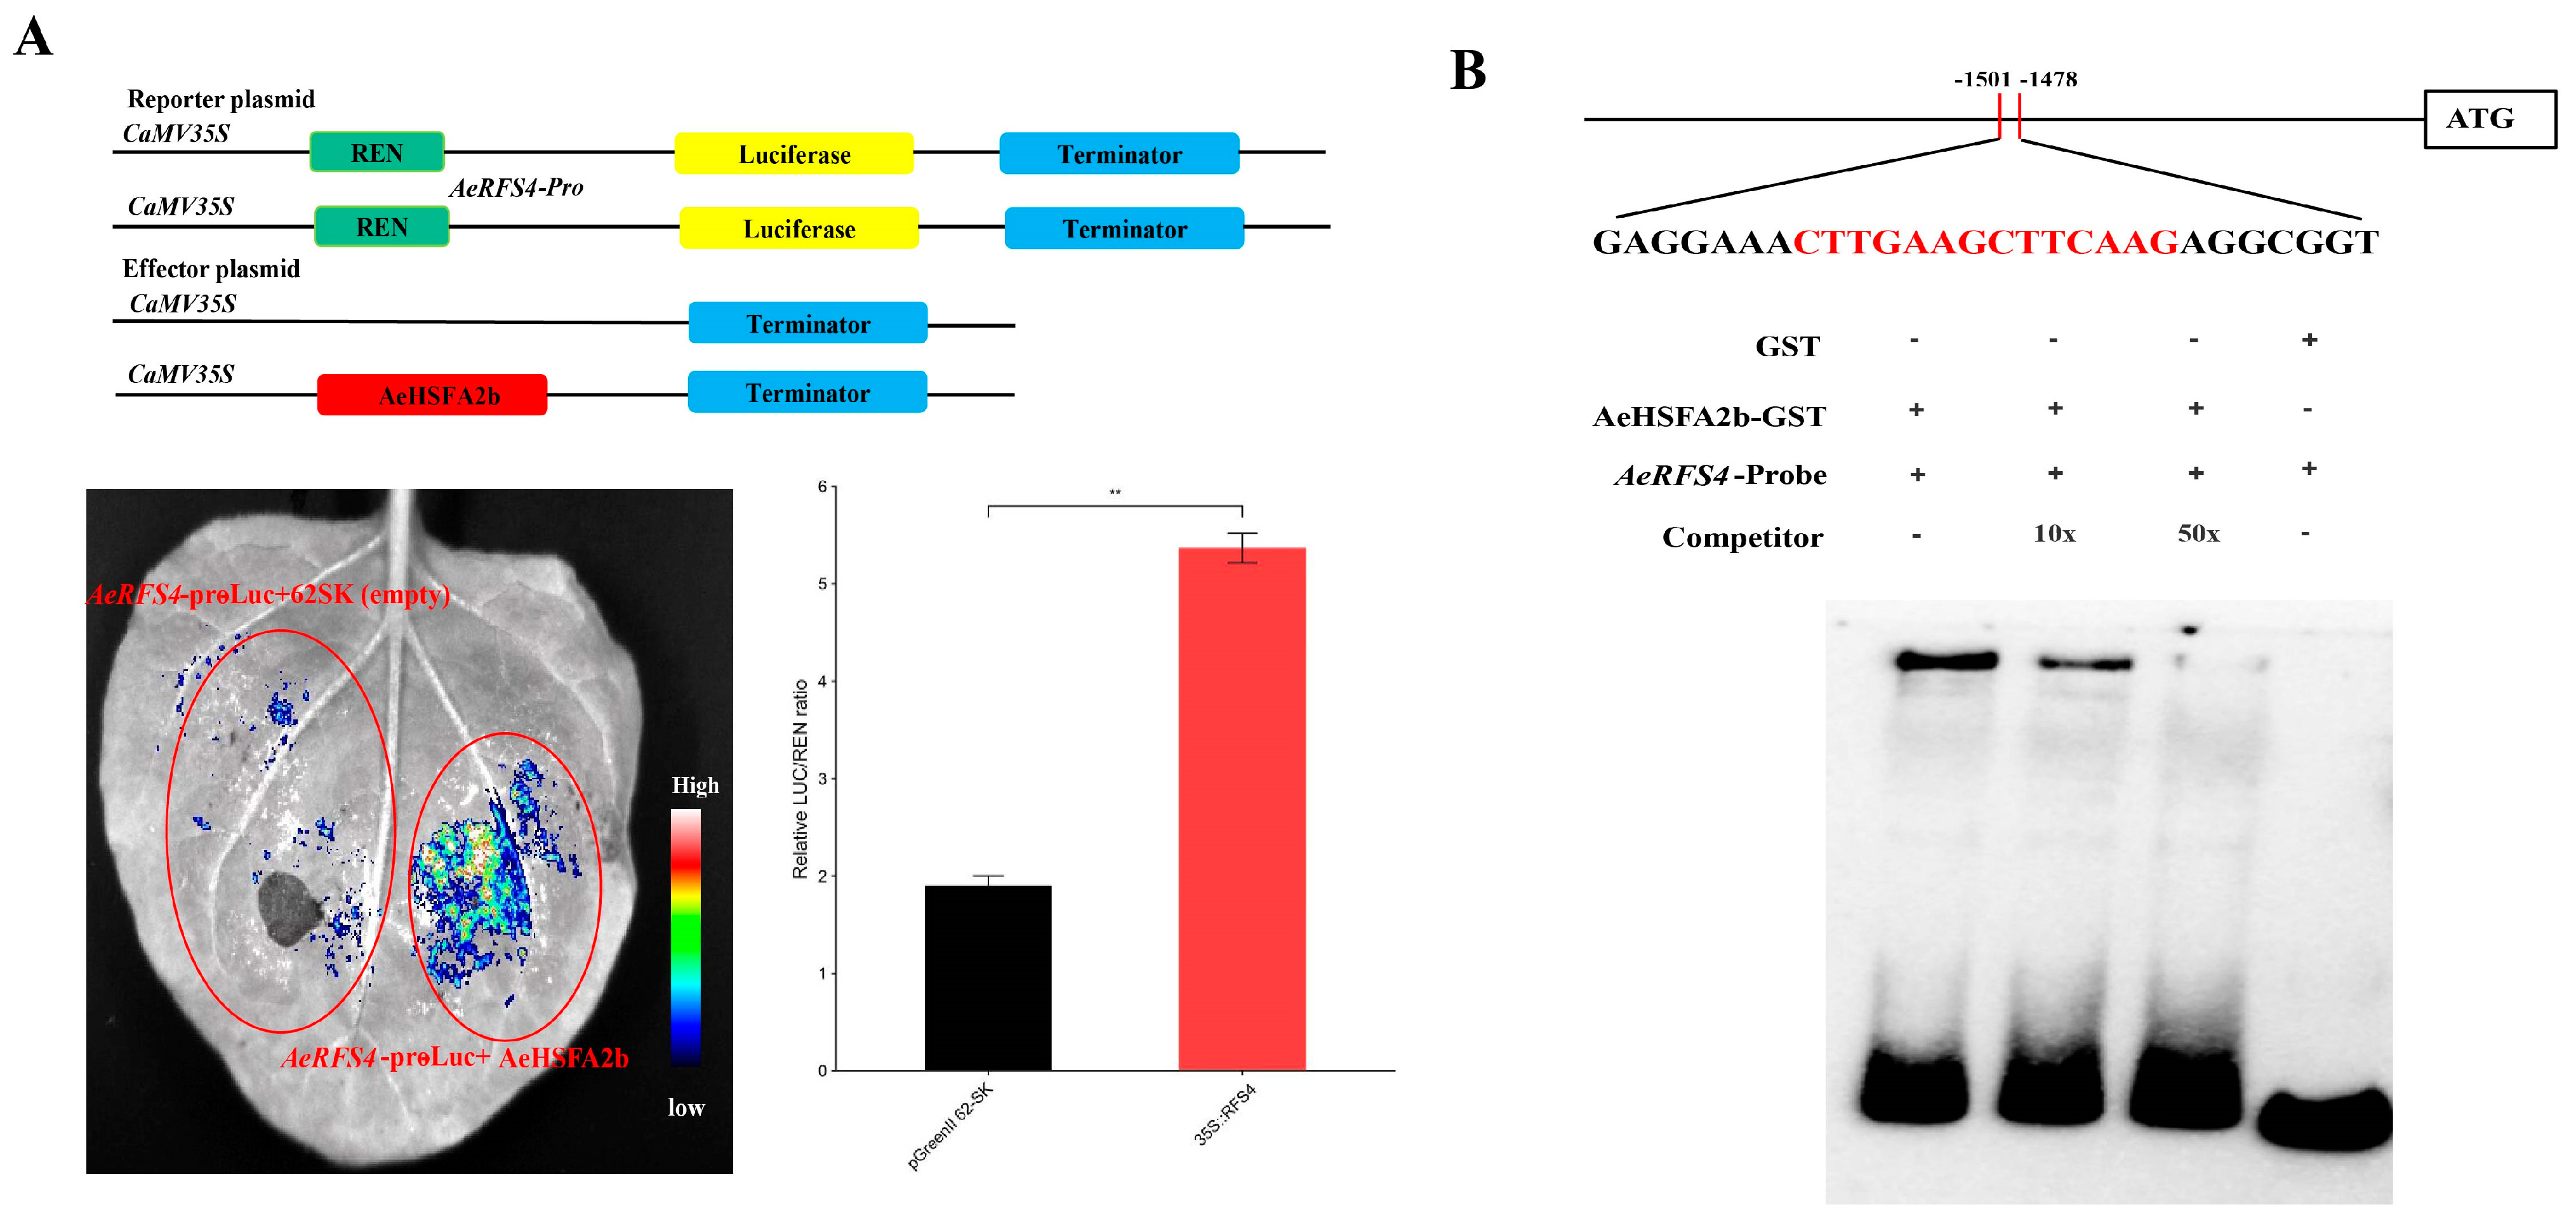
2.8. AeHSFA2b Regulates RFS4 Expression by Directly Activating and Binding to Its Promoter

In order to examine the regulatory role of AeHSFA2b on AeRFS4 transcription, we conducted dual-luciferase reporter assays in tobacco protoplasts. The presence of the RFS4-pro LUC reporter and the 35S:AeHSFA2b-GFP effector resulted in a strong LUC fluorescence signal (Figure 9A). Conversely, the use of the 35S:GFP empty vector suppressed the fluorescence. Consistently, the LUC/REN ratio was significantly increased by the co-transformation of the AeRFS4-pro LUC reporter and the 35S:AeHSFA2b-GFP effector compared to the empty control (transformed with the reporter and the empty vector 35S:GFP) (Figure 9A). Moreover, we performed an electrophoretic mobility shift assay (EMSA) to further elucidate the specific and direct interaction between AeHSFA2b and the AeRFS4 promoter. The EMSA result showed that the addition of increasing concentrations of cold probe resulted in a reduction in electrophoretic mobility shift from 0×–50×, suggesting that AeHSFA2b could physically bind to the HSE motif in the AeRFS4 promoter to increase their expression (Figure 9B). Taken together, these findings indicate that AeHSFA2b can directly control the expression of AeRFS4 by binding to the core HSE sequence (CTTGAAGCTTCAAG) located in the promoter regions of RFS4.

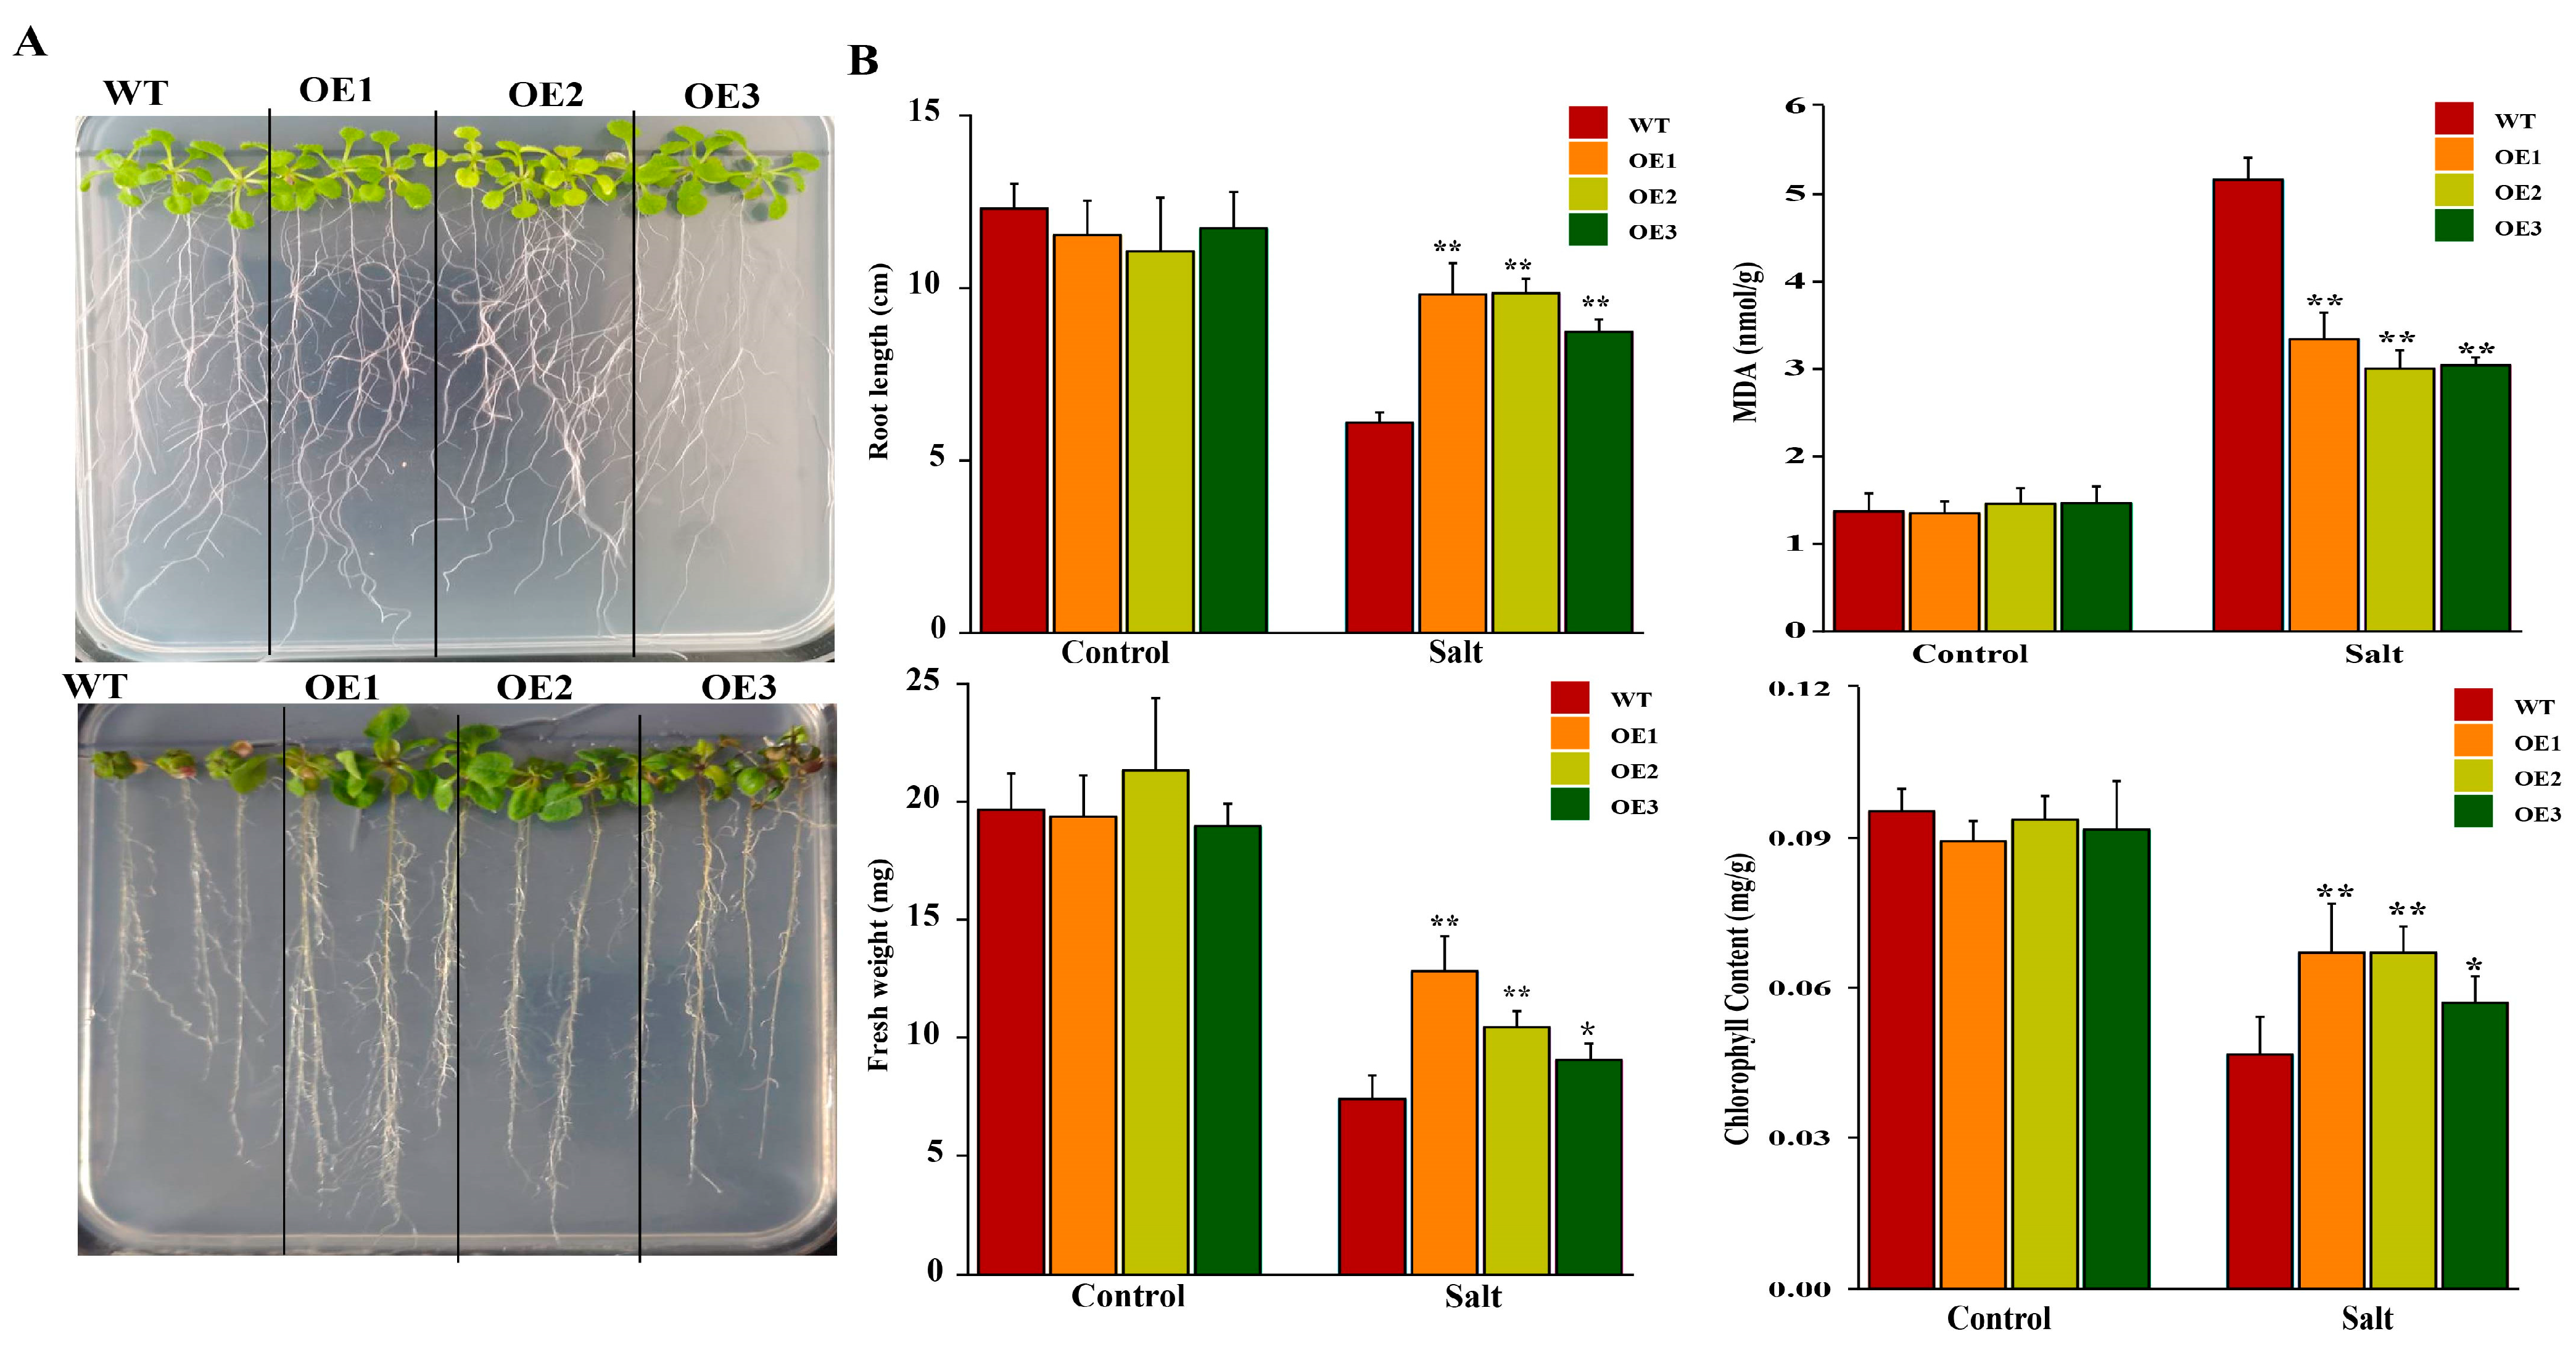
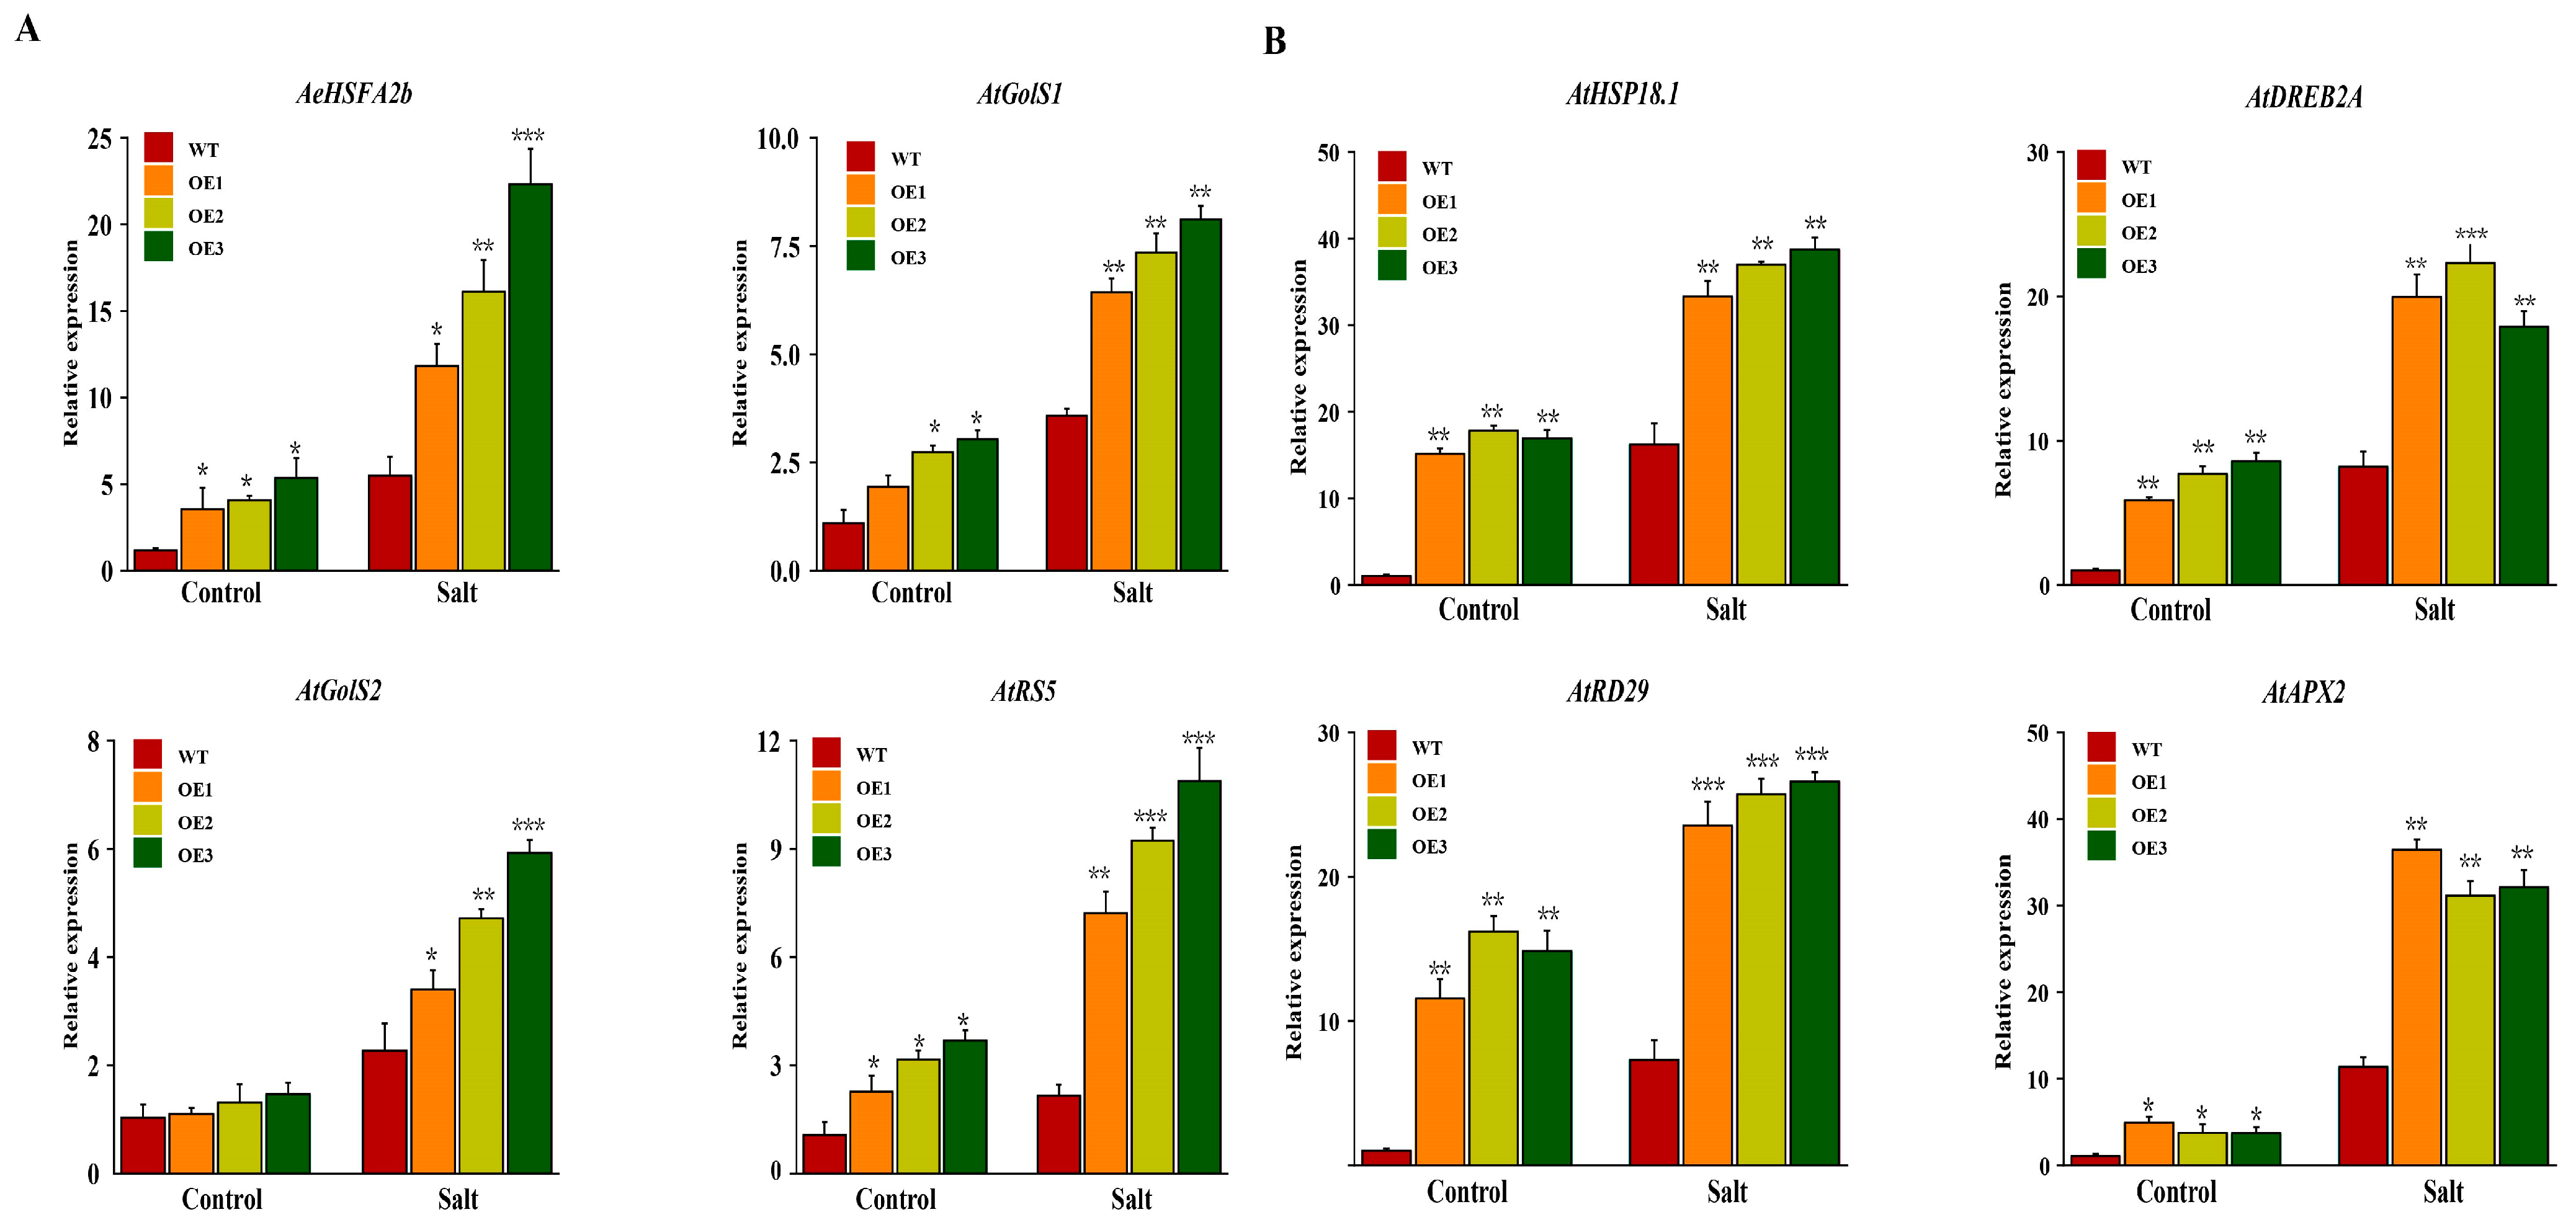
2.9. The Effects of Overexpression of AeHSFA2b in Arabidopsis

To identify functional characterization of AeHSFA2b under salt stress, three lines of transgenic Arabidopsis (designated as OE1, OE2, and OE3) were generated in this study. Under normal conditions (referred to as control), transgenic plants displayed robust growth without any noticeable differences. Compared to the wild-type, the transgenic plants of OE lines had significantly larger and heavier leaves after salt treatment (Figure 10A). The growth parameters (root length, plant fresh weight, and chlorophyll) of overexpressing the AeHSFA2b gene at seedlings were significantly higher than WT plants. The MDA contents of overexpressing the AeHSFA2b gene at seedlings were significantly lower than WT plants. These results indicate that AeHSFA2b overexpression indeed increased the tolerance to salt stress.
Under salt stress, the expression of AeHSFA2b, AtGolS1/2, AtRS5, and salt-responsive marker genes expression of AtHSP18.1, AtEGY3, AtRD29, and AtAPX2, which is homologous to AeRFS4, in transgenic Arabidopsis lines exhibited a significant increase compared to the wild-type (Figure 11A,B), indicating that the AeHSFA2b transgenic Arabidopsis plants potentially improved salt tolerance possibly by promoting the accumulation of raffinose or other salt-responsive marker genes.

3. Discussion

Heat shock factor (HSF) is an important family of transcription factors within the plant kingdom. In previous work, HSF genes have been identified as key players in safeguarding plants against abnormalities in growth patterns [29,30]. They play crucial roles in enabling plants to adapt to abiotic stress, and in maintaining the stability of cellular processes [1]. Over the past few years, the abundant availability of genomes has facilitated comprehensive research on the HSF gene family in many crop species, such a rice [31], tomato [32], wheat [33], pepper [34], potato [35], maize [36], etc. Nevertheless, there is currently no published research regarding the kiwifruit HSF gene family. In our study, we identified and classified 41 AeHSF genes in the kiwifruit genome. These genes were further categorized into three major classes (Table 1). We observed that the class A genes were the most abundant, totaling 24, followed by the class B members, which is consistent with findings in other plants [9]. Class A exhibited the highest diversity and abundance among all the identified clades, indicating significant evolutionary divergence and diversification (Figure 1). No HSF member belonging to the class A9 (At5g54070) was identified in kiwifruit. A similar result was found in both Chinese cabbage [37] and sesame [38]. In kiwifruit, a similar exon/intron structure was observed among most members of the AeHSF gene family within the same group, as evidenced by the phylogenetic relationships (Figure 2). These findings suggest that the AeHSF gene family has stayed relatively conservative during evolution.
In the former publication, the HSF gene was extensively studied for its capacity to specifically react to stress conditions caused by high temperatures in plants [11]. A total of 18 PmHSF gene members have been identified in Prunus mume, with 12 of them showing significant upregulation in response to high-temperature stress [39]. Under high-temperature and salt stress, the expression of genes belonging to the HSFA class, which constitutes one of the most active factors, exhibited a notable increase in Sorbus pohuashanensis [40]. The yield and quality of kiwifruit have been significantly impacted by abiotic stresses, such as salinity, drought, heat, cold, and waterlogging [26]. The HSF gene family orchestrates essential functions in diverse facets of plant growth and tolerance to abiotic stresses [9]. Nonetheless, only a limited number of studies have been conducted exploring the role of the HSF gene family in kiwifruit’s response to various abiotic stresses. In this study, analyses of the expression of AeHSF genes in kiwifruit were performed under different conditions: heat, low temperature, NaCl, waterlogging, UV, and drought, respectively. We founded that most of the AeHSF genes exhibited significant upregulation under heat stress, which is consistent with previous research [41]. Notably, AeHSFA2 and AeHSFA3 class gene members, with the exception of AeHSFA2a, were shown to be upregulated strongly under heat stress (Figure 5A). The role of HSFA2 in the response to heat stress has been reported in kiwifruit and tomato [42,43]. AeHSFB1b/1c/1d and AeHSFB3a/3b were significantly induced after salt stress (Figure 5A). In Arabidopsis, the transcription of AtHsfA2 was significantly induced under salt stress, and overexpression of AtHsfA2 enhanced transgenic Arabidopsis’s tolerance to salt [44]. However, OsHsfB2b has been identified as a negative regulator of the stress response to tolerate drought and salt conditions in rice [45]. In addition, only AeHSFA6a/6b/6c was strongly induced after cold stress (Figure 5A). Huang et al. reported that the expression of AtHSFA6b is upregulated in response to cold stress and ABA hormone treatment in Arabidopsis [46]. Plant hormones are responsible for regulating the growth and development of plants, as well as response to stress, and play a vital role in a wide range of physiological and biochemical processes [47]. Here, the expression profiles of HSF genes under various hormone treatments were analyzed via transcriptome data. We found that the expression levels of approximately 61% of the AeHSF genes showed a significant increase in response to ABA treatment (Figure 5B). A similar result was reported by Zhang et al. [48]. The gene HSFA6b functions as a downstream regulator of this pathway, highlighting its significance in conferring heat stress resistance [46]. Interestingly, in Arabidopsis, it was observed that the expression of HSFA6a and HSFA6b was significantly decreased in response to both salt stress and abscisic acid (ABA) treatment [49]. Additionally, the expression of HSFA1d/A6a, and HSFB1C increased significantly under jasmonic acid (JA) hormone treatment (Figure 5B), which is similar to the previous research by Qi et al. [50]. In order to further investigate whether AeHSF genes are regulated by hormones, the cis-elements in the promoter regions of 41 AeHSF genes in kiwifruit were predicted. Twelve different types of putative cis-elements responsive to abiotic stresses and hormone were found in the 2000 bp promoters of AeHSF genes (Figure 4), which is consistent with that previously reported in tartary buckwheat and carnation [51,52]. It is worth mentioning that many AeHSF genes promote the contain abscisic acid responsive element (ABRE). Unsurprisingly, a similar result was found in many plants, such as Brassica napus [53], wild jujube [54], and Arachis hypogaea [55]. In short, these results indicate that the AeHSF gene family in kiwifruit plays a crucial role in response to abiotic stresses and hormones treatment.
In recent years, multiple studies have consistently reported the function of HSF genes in many plants’ responses to abiotic stress. For example, the overexpression of VpHSF1, a member of the HSFB2 family, from Chinese Wild Vitis pseudoreticulata in tobacco revealed that VpHSF1 exerts a dual regulatory role, acting as a positive regulator in acquired thermotolerance [56]. The overexpression of chickpea CarHSFB2 in Arabidopsis has been shown to enhance the drought tolerance, which was achieved by promoting in the transcript levels of stress-responsive genes, specifically RD22, RD26, and RD29A, under drought stress conditions [57]. In wheat, TaHSFB4-2B transgenic Arabidopsis exhibited increased salt and drought tolerance [58]. The overexpression of the TaHsfA6f gene in Arabidopsis significantly enhanced tolerance to heat, drought, and salt stresses. Additionally, these transgenic plants exhibited heightened sensitivity to exogenous abscisic acid (ABA) [59]. However, a few reports have demonstrated how HSF genes regulate downstream stress-responsive genes to improve stress tolerance. In Arabidopsis, AtHSFA2 can specifically regulate a subset of stress response genes, including Hsp26.5, Hsp25.3, Hsp70b, APX2, RD29A, RD17, GolS1, IPS2, KSC1, ERD7, and ZAT10, under heat stress [60]. Recently, the overexpression of AcHsfA2-1 in kiwifruit was found to confer enhanced resistance to heat shock stress at 50 ℃ for a minimum of 2 h. It can bind to promoters of three specific AcHsp20 genes (Acc16656, Acc25875, and Acc11386) to improve heat tolerance [42]. AcHsfA2-1 in A. chinensis homologous gene is AeHSFA2c in A. eriantha, which was significantly induced after heat stress (Figure 5B). In the present study, we found that the AeHSFA2b transgenic Arabidopsis grew better than the wild-type under salt stress, and the expression level of gene related to raffinose synthesis was significantly increased (Figure 10A), indicating that the overexpressing transgenic plant reduced osmotic stress by increasing the content of raffinose, thus enhancing salt tolerance. Gu et al. suggested that the overexpression of ZmHSFA2 in Arabidopsis resulted in an upregulation of these genes, AtGOLS1, AtGOLS2, and AtRS5. This led to an increase in raffinose content in leaves and improved tolerance to heat stress [61]. RFS4 promoter contains a tandem inverted repeat of the HSE element. Apart from this, correlation analysis results indicated that AeHSFA2b and RFS4 show a strong positive correlation under salt stress conditions (Figure 7A). Therefore, we speculated that the transcription factor AeHSFA2b may activate RFS4 expression by directly binding its promoter to enhance the kiwifruit’s tolerance to salt stress. Yeast one-hybrid, dual-luciferase, and electrophoretic mobility shift assay results showed that AeHSFA2b is capable of binding to the HSE element on the promoter of AeRFS4 in our study (Figure 7B and Figure 9). Similar results were found in Arabidopsis [62]. Lang et al. found that BnHSFA4a probably participates in dehydration tolerance by binding to the HSE elements of the BhGolS4 promoter to regulate BhGolS4 expression and the overexpression lines exhibited increased antioxidant abilities [63]. Overexpression of AeHSFA2b increases AtRS5 (the homologous gene of AeRFS4), AtGolS1, and AtGolS2 expression level in transgenic Arabidopsis and promotes salt tolerance (Figure 10B), suggesting that the regulating role of AeHSFA2b on raffinose might be conserved. In our previous study, overexpressing AcRFS4 in Arabidopsis can enhance raffinose levels and increase the plant’s tolerance to salt stress. AcNAC30 specifically interacted with the AcRFS4 promoter, suggesting its involvement in regulating salt stress responses in kiwifruit plants [28]. Given the crucial roles of both AcNAC30 and AeHSFA2b transcription factors in salt stress responses, it would certainly be valuable to discuss the potential crosstalk and interaction between two genes. This could involve exploring whether AcNAC30 regulates the expression of AeHSFA2b genes or vice versa, and whether there are common AcRFS4 or regulatory elements shared between two genes. Investigating this interplay could provide a deeper understanding of the regulatory networks involved in salt stress responses and contribute to the development of strategies for enhancing salt stress tolerance in kiwifruit and other crops.

4. Materials and Methods

4.1. Identification and Phylogenetic Relationships Analysis of A. eriantha AeHSF Genes

The Actinidia eriantha (White) genome sequences and AeHSF protein family sequence were downloaded from the Kiwifruit Genome Database (http://kiwifruitgenome.org/, accessed on 10 March 2023) [64]. The profile hidden Markov model (PF00447) of HSF protein was obtained from Pfam32.0 database (http://pfam.xfam.org/, accessed on 12 March 2023), and all AeHSF protein sequences were screened in HMMER-3.3 (E-value < 1 × 10⁻⁵, other parameters set to defaults). All AtHSF amino acid sequences were downloaded from TAIR (https://www.arabidopsis.org/, accessed on 18 March 2023). The BLASTP program with a threshold of 1 × e−5 for the e-value was utilized to search the kiwifruit HSF protein using all AtHSF sequences amino acid as queries. The final members of the AeHSF gene family were identified through the combination of results obtained from both BLAST and HMMER results. We constructed the phylogenetic tree of related proteins using MEGA 11 software (bootstrap set at 1000, other parameters set to defaults) [65]. The phylogenetic tree was visualized and beautified using iTOL (https://itol.embl.de/, accessed on 25 March 2023) [66].

4.2. Gene Duplication and Chromosomal Locations

The AeHSF genes replication events were analyzed using multiple collinear scanning toolkits (MCScanX) with default parameters [67]. The physical location map of chromosomes was visualized by MapInspect 1.0.

4.3. Expression Profiles Analysis of AeHSF Genes in Different Tissue, Hormone Treatments, and Abiotic Stress Treatments

The RNAseq raw sequence data of samples under the abiotic stress and hormone treatments were obtained from the NCBI website (Bioproject ID PRJNA1028382). RNA extraction, library preparation, and sequencing were conducted as previously described [68]. Trimmomatic was performed to filter the raw sequence data [69]. The clean data were adopted to map the reference A. eriantha variety ‘White’ genome using HISAT2 [70]. The genes were quantified with the featureCounts package in R. A. chinensis variety ‘Hongyang’ (HY) tissue culture seedlings were transferred to a soil mixture of perlite and sand (3:1, v/v). All seedlings were grown in a growth chamber at a temperature of 18 °C (night) and 24 °C (day), relative humidity of 60–80%, and a 14/10 h photoperiod (daytime, 06:00–20:00). The seedlings were irrigated with water once every two days. After two months, they were randomly divided into six groups for stresses treatments. For heat and cold stress treatment, the seedlings were transferred into two chambers with the temperature set at 48 °C and 4 °C, respectively. Treated seedlings were harvested at 6 h after treatment. For salt, drought, and waterlogging stresses, the seedlings were soaked in 0.6% NaCl for 6 days. The seedlings were flooded for 7 days, and the seedlings were dried for 14 days. Nontreated seedlings were used as the control (CK). TBtools software (version 2.012) was used to draw the heatmaps [71].
To further verify key AeHSF genes expression, the expressions of these genes were detected using qRT-PCR on the Biorad CFX96 real-time PCR system using the ChamQ SYBR qPCR Master Mix (Vazyme, Nanjing, Jiangsu, China). Total RNA isolation was carried out as reported previously. The relative gene expression level was determined using the 2−∆∆Ct method. The primers for the nine AeHSF genes were designed using primer 3 software (http://frodo.wi.mit.edu/, accessed on 30 April 2023) (Table S1). The bar chart was created with R software version 4.2.1 (geom_bar in ggplot2 library).

4.4. Correlation Analysis of All Transcription Factors with the Expressional Pattern of AeRFS4 under Salt Treatment and Transcriptional Activation Analysis of AeHSFA2b

A scatter plot graph of correlation all transcription factors with the expressional pattern of AcRFS4 under salt stress was drawn with R software (geom_point in ggplot2 library). AeHSFA2b coding sequences were cloned into the pGBKT7 vector (Clontech, Madison, WI, USA) to create the pGBKT7-AeHSFA2b constructs, respectively (primers are listed in Table S2). AeHSFA2b constructs and positive/negative control were transformed into yeast strain AH109. Transcription activation was measured according to a previous method [28].

4.5. Dual-Luciferase Reporter Assay and AeHSFA2b Protein Subcellular Localization Assay

The full-length coding sequence (CDS) of AcHSFA2b was inserted into the pGreenII 62-SK vector as an effector, while the promoter fragment of RFS4 was cloned into the pGreenII0800-LUC vector to produce a reporter. A. tumefaciens strain EHA105 was utilized to transfer all the constructs vector (primers are listed in Table S2). The effectors and reporters were transiently co-infiltrated into 4-week-old tobacco leaves. The suspension buffer for A. tumefaciens cells (10 mM MgCl2, 10 mM MES, 150 mM acetosyringone, with a pH of 5.6) was cultivated until it reached an OD600 of 0.6. After 2–3 d of injection at 23 °C, tobacco leaves were sprayed with water for the control, and the experimental leaves were treated with 1000 mg/kg ethephon. The promoter activities expressed as a ratio (LUC/REN) were using a dual-luciferase kit (YEASEN, Shanghai, China), and determined by a microporous plate light detector (Berthold Centro LB960). Fluorescence in tobacco leaves was observed and photographed using a fully automated chemiluminescence imager (Tanon 5200, Shanghai, China).
The CDS of AeHSF2b without the stop codon was constructed into the vector pCAMBI A1305-35S-GFP vector using double-enzyme digestion (cut with Xbal and BamHI). Then, the plasmid (35S::AeHSF2b-GFP) was transferred into Agrobacterium strain EHA105. This strain was injected into 1-month-old tobacco leaves. Finally, the GFP fluorescence was detected by confocal laser scanning microscopy. Primers used to construct the 35S::AeHSF2b-GFP vector are provided in Supplementary Materials Table S2.

4.6. EMSA Protein Expression and Electrophoretic Mobility Shift Assay (EMSA)

The ORF of AeHSFA2b was cloned into the pGEX-4T-1 vector containing GST (primers are listed in Table S2), followed by transformation into competent cells of E. coli BL21 (DE3) (TransGen, Beijing, China) to generate recombinant AeHSFA2b-GST protein. The recombinant GST- AeHSFA2b E. coli cells were cultivated until they reached an OD600 of 0.6 at 37 °C, and then IPTG was added to 0.5 mM for a final concentration. Recombinant protein expression was induced for a period of 10–12 h at 28 °C and was purified using GST fusion protein purified magnetic beads kit (Beaver, Suzhou, Jiangsu, China) according to the manufacturer’s instructions. The probe sequence (Table S2) containing the AeHSFA2b binding sequences of AeRFS4 was predicted by PlantCare (http://bioinformatics.psb.ugent.be/webtools/plantcare/html/, accessed on 15 April 2023). The probes were synthesized Tsingke Biotechnology (Nanjing, Jiangsu, China) and labeled with EMSA Probe Biotin Labeling Kit (Beyotime Biotechnology, Nantong, Jiangsu, China). The Chemiluminescent EMSA Kit (Beyotime Biotechnology) was utilized to perform a DNA gel mobility shift assay following the manufacturer’s instructions.

4.7. AeHSFA2b-Overexpressing Arabidopsis Generation and Salt Stress Tolerance Analysis

The ORF of the AeHSFA2b was cloned into pCAMBIA1305 by the primers (Table S2). The flower dip method was employed to transform the confirmed constructs (AeHSFA2b-1305) into Arabidopsis ecotype Columbia plants (Col-0) via Agrobacterium-mediated transformation. The transgenic Arabidopsis lines (OE1, OE2, and OE3) were distinguished on 1/2 MS medium supplemented with 25 mg·L−1 Hygromycin B (HYG). Homozygous T3 seedlings of A. thaliana from transgenic lines and wild-type (WT) seedlings aged five weeks were individually grown on 1/2 MS medium containing 150 mmol·L−1 NaCl for 7 days. After 7 days, the root lengths of WT and transgenic Arabidopsis were measured by using ImageJ 1.8.0. The leaves of WT and transgenic Arabidopsis under salt stress treatments were collected. Physiological and biochemical indicators were measured using corresponding assay kits following the manufacturer’s protocols. In detail, the Chlorophyll Assay Kit (Solarbio, Cat#BC0990, Beijing, China) and Malondialdehyde (MDA) Assay Kit (Solarbio, Cat#BC0020) were used for subsequent spectrophotometric. AeHSFA2b, AtRS5, AtGolS1, and AtGolS2 genes were selected for qRT-PCR analysis (primers are listed in Table S1). In addition, the salt-responsive marker gene expression levels in the AeHSFA2b transgenic lines, such as AtHSP18.1, AtDREB2A, AtRD29, and AtAPX2 genes, were selected for qRT-PCR analysis (primers are listed in Table S1).

5. Conclusions

Overall, we conducted a comprehensive analysis of AeHSF family members in kiwifruit at the genome-wide level and successfully classified these members into three distinct groups based on the conserved domains. The transcription profile of the AeHSFA2b gene provided valuable insights into its potential role in enhancing salt tolerance. The ectopic expression technique was employed to investigate the impact of AeHSFA2b on salt stress tolerance in Arabidopsis. Moreover, yeast one-hybrid, dual-luciferase, and electrophoretic mobility shift assay results indicated that AeHSFA2b is capable of binding to the HSE element on the promoter of AeRFS4. Together, our research provides a foundational framework for further exploration of the functional significance of HSF genes in enhancing kiwifruit’s tolerance to abiotic stresses.

Supplementary Materials

The supporting information can be downloaded at: https://www.mdpi.com/article/10.3390/ijms242115638/s1.

Author Contributions

Conceptualization, J.Y. and S.W.; formal analysis, writing—original draft preparation, C.L.; methodology, C.L., Z.Y., J.X., Z.O. and Y.L.; software, Y.L., Z.Y., J.X. and Z.O.; validation, C.L. and J.Y.; visualization, C.L. and S.W. All authors have read and agreed to the published version of the manuscript.

Funding

This work was supported by funds from Anhui Provincial Key Laboratory of Quality Biology of Horticultural Crops, Startup Funding of Anhui Agricultural University, and the “Wanjiang Scholar” Program (Anhui Province).

Institutional Review Board Statement

Not applicable.

Informed Consent Statement

Not applicable.

Data Availability Statement

The datasets generated are available from the National Center for Biotechnology Information repository (https://dataview.ncbi.nlm.nih.gov/object/PRJNA1028382).

Conflicts of Interest

The authors declare no conflict of interest.

References

  1. Zhu, J.-K. Abiotic Stress Signaling and Responses in Plants. Cell 2016, 167, 313–324. [Google Scholar] [CrossRef]
  2. Wang, W.; Vinocur, B.; Shoseyov, O.; Altman, A. Role of plant heat-shock proteins and molecular chaperones in the abiotic stress response. Trends Plant Sci. 2004, 9, 244–252. [Google Scholar] [CrossRef] [PubMed]
  3. Liang, W.; Ma, X.; Wan, P.; Liu, L. Plant salt-tolerance mechanism: A review. Biochem. Biophys. Res. Commun. 2018, 495, 286–291. [Google Scholar] [CrossRef] [PubMed]
  4. Gill, S.S.; Tuteja, N. Reactive oxygen species and antioxidant machinery in abiotic stress tolerance in crop plants. Plant Physiol. Biochem. 2010, 48, 909–930. [Google Scholar] [CrossRef]
  5. Bartels, D.; Sunkar, R. Drought and Salt Tolerance in Plants. Crit. Rev. Plant Sci. 2005, 24, 23–58. [Google Scholar] [CrossRef]
  6. Baillo, E.H.; Kimotho, R.N.; Zhang, Z.; Xu, P. Transcription Factors Associated with Abiotic and Biotic Stress Tolerance and Their Potential for Crops Improvement. Genes 2019, 10, 771. [Google Scholar] [CrossRef] [PubMed]
  7. Franco-Zorrilla, J.M.; Lopez-Vidriero, I.; Carrasco, J.L.; Godoy, M.; Vera, P.; Solano, R. DNA-binding specificities of plant transcription factors and their potential to define target genes. Proc. Natl. Acad. Sci. USA 2014, 111, 2367–2372. [Google Scholar] [CrossRef]
  8. Yoon, Y.; Seo, D.H.; Shin, H.; Kim, H.J.; Kim, C.M.; Jang, G. The Role of Stress-Responsive Transcription Factors in Modulating Abiotic Stress Tolerance in Plants. Agronomy 2020, 10, 788. [Google Scholar] [CrossRef]
  9. Guo, M.; Liu, J.H.; Ma, X.; Luo, D.X.; Gong, Z.H.; Lu, M.H. The Plant Heat Stress Transcription Factors (HSFs): Structure, Regulation, and Function in Response to Abiotic Stresses. Front. Plant Sci. 2016, 7, 114. [Google Scholar] [CrossRef]
  10. Shen, Z.; Yao, J.; Sun, J.; Chang, L.; Wang, S.; Ding, M.; Qian, Z.; Zhang, H.; Zhao, N.; Sa, G.; et al. Populus euphratica HSF binds the promoter of WRKY1 to enhance salt tolerance. Plant Sci. 2015, 235, 89–100. [Google Scholar] [CrossRef]
  11. Scharf, K.D.; Berberich, T.; Ebersberger, I.; Nover, L. The plant heat stress transcription factor (Hsf) family: Structure, function and evolution. Biochim. Biophys. Acta 2012, 1819, 104–119. [Google Scholar] [CrossRef]
  12. Sorger, P.K.; Pelham, H.R.J.C. Yeast heat shock factor is an essential DNA-binding protein that exhibits temperature-dependent phosphorylation. Cell 1988, 54, 855–864. [Google Scholar] [CrossRef]
  13. Nover, L.; Bharti, K.; Döring, P.; Mishra, S.K.; Ganguli, A.; Scharf, K.D. Arabidopsis and the heat stress transcription factor world: How many heat stress transcription factors do we need? Cell Stress. Chaperones 2001, 6, 177–189. [Google Scholar] [CrossRef] [PubMed]
  14. Döring, P.; Treuter, E.; Kistner, C.; Lyck, R.; Chen, A.; Nover, L. The role of AHA motifs in the activator function of tomato heat stress transcription factors HsfA1 and HsfA2. Plant Cell 2000, 12, 265–278. [Google Scholar] [CrossRef] [PubMed]
  15. Elsayed, A.; Rafudeen, M.; Golldack, D. Physiological aspects of raffinose family oligosaccharides in plants: Protection against abiotic stress. Plant Biol. 2013, 16, 1–8. [Google Scholar] [CrossRef] [PubMed]
  16. Thole, J.M.; Nielsen, E. Phosphoinositides in plants: Novel functions in membrane trafficking. Curr. Opin. Plant Biol. 2008, 11, 620–631. [Google Scholar] [CrossRef]
  17. Lahuta, L.B.; Pluskota, W.E.; Stelmaszewska, J.; Szablinska, J. Dehydration induces expression of GALACTINOL SYNTHASE and RAFFINOSE SYNTHASE in seedlings of pea (Pisum sativum L.). J. Plant Physiol. 2014, 171, 1306–1314. [Google Scholar] [CrossRef]
  18. dos Santos, T.B.; Vieira, L.G.E. Involvement of the galactinol synthase gene in abiotic and biotic stress responses: A review on current knowledge. Plant Gene 2020, 24, 100258. [Google Scholar] [CrossRef]
  19. Fan, Y.; Yu, M.; Liu, M.; Zhang, R.; Sun, W.; Qian, M.; Duan, H.; Chang, W.; Ma, J.; Qu, C.; et al. Genome-Wide Identification, Evolutionary and Expression Analyses of the GALACTINOL SYNTHASE Gene Family in Rapeseed and Tobacco. Int. J. Mol. Sci. 2017, 18, 2768. [Google Scholar] [CrossRef]
  20. Shen, Y.; Jia, B.; Wang, J.; Cai, X.; Hu, B.; Wang, Y.; Chen, Y.; Sun, M.; Sun, X. Functional Analysis of Arabidopsis thaliana Galactinol Synthase AtGolS2 in Response to Abiotic Stress. Mol. Plant Breed. 2020, 11, 1–11. [Google Scholar] [CrossRef]
  21. Taji, T.; Ohsumi, C.; Iuchi, S.; Seki, M.; Kasuga, M.; Kobayashi, M.; Yamaguchi-Shinozaki, K.; Shinozaki, K. Important roles of drought- and cold-inducible genes for galactinol synthase in stress tolerance in Arabidopsis thaliana. Plant J. 2002, 29, 417–426. [Google Scholar] [CrossRef]
  22. Liu, L.; Wu, X.; Sun, W.; Yu, X.; Demura, T.; Li, D.; Zhuge, Q. Galactinol synthase confers salt-stress tolerance by regulating the synthesis of galactinol and raffinose family oligosaccharides in poplar. Ind. Crops Prod. 2021, 165, 113432. [Google Scholar] [CrossRef]
  23. Kito, K.; Yamane, K.; Yamamori, T.; Matsuhira, H.; Tanaka, Y.; Takabe, T. Isolation, functional characterization and stress responses of raffinose synthase genes in sugar beet. J. Plant Biochem. Biotechnol. 2017, 27, 36–45. [Google Scholar] [CrossRef]
  24. Li, X.; Li, J.; Soejarto, D.D. Advances in the study of the systematics of Actinidia Lindley. Front. Biol. China 2009, 4, 55–61. [Google Scholar] [CrossRef]
  25. Richardson, D.P.; Ansell, J.; Drummond, L.N. The nutritional and health attributes of kiwifruit: A review. Eur. J. Nutr. 2018, 57, 2659–2676. [Google Scholar] [CrossRef] [PubMed]
  26. Abid, M.; Zhang, Y.J.; Li, Z.; Bai, D.F.; Zhong, Y.P.; Fang, J.B. Effect of salt stress on growth, physiological and biochemical characters of four kiwifruit genotypes. Sci. Hortic. 2020, 271, 109473. [Google Scholar] [CrossRef]
  27. Chen, J.; Fang, J.; Qi, X.; Gu, H.; Lin, M.; Zhang, W.; Wei, C. Research progress on rootstock of kiwifruit. J. Fruit Sci. 2015, 32, 959–968. [Google Scholar]
  28. Yang, J.; Ling, C.; Liu, Y.; Zhang, H.; Hussain, Q.; Lyu, S.; Wang, S.; Liu, Y. Genome-Wide Expression Profiling Analysis of Kiwifruit GolS and RFS Genes and Identification of AcRFS4 Function in Raffinose Accumulation. Int. J. Mol. Sci. 2022, 23, 8836. [Google Scholar] [CrossRef]
  29. Scarpeci, T.E.; Zanor, M.I.; Valle, E.M. Investigating the role of plant heat shock proteins during oxidative stress. Plant Signal Behav. 2008, 3, 856–857. [Google Scholar] [CrossRef]
  30. Arrigo, A.P. Human small heat shock proteins: Protein interactomes of homo- and hetero-oligomeric complexes: An update. FEBS Lett. 2013, 587, 1959–1969. [Google Scholar] [CrossRef]
  31. Guo, J.; Wu, J.; Ji, Q.; Wang, C.; Luo, L.; Yuan, Y.; Wang, Y.; Wang, J. Genome-wide analysis of heat shock transcription factor families in rice and Arabidopsis. J. Genet. Genom. Yi Chuan Xue Bao 2008, 35, 105–118. [Google Scholar] [CrossRef] [PubMed]
  32. Yang, X.; Zhu, W.; Zhang, H.; Liu, N.; Tian, S. Heat shock factors in tomatoes: Genome-wide identification, phylogenetic analysis and expression profiling under development and heat stress. PeerJ 2016, 4, e1961. [Google Scholar] [CrossRef] [PubMed]
  33. Duan, S.; Liu, B.; Zhang, Y.; Li, G.; Guo, X. Genome-wide identification and abiotic stress-responsive pattern of heat shock transcription factor family in Triticum aestivum L. BMC Genom. 2019, 20, 257. [Google Scholar] [CrossRef]
  34. Guo, M.; Lu, J.P.; Zhai, Y.F.; Chai, W.G.; Gong, Z.H.; Lu, M.H. Genome-wide analysis, expression profile of heat shock factor gene family (CaHsfs) and characterisation of CaHsfA2 in pepper (Capsicum annuum L.). BMC Plant Biol. 2015, 15, 151. [Google Scholar] [CrossRef]
  35. Tang, R.; Zhu, W.; Song, X.; Lin, X.; Cai, J.; Wang, M.; Yang, Q. Genome-Wide Identification and Function Analyses of Heat Shock Transcription Factors in Potato. Front. Plant Sci. 2016, 7, 490. [Google Scholar] [CrossRef]
  36. Lin, Y.X.; Jiang, H.Y.; Chu, Z.X.; Tang, X.L.; Zhu, S.W.; Cheng, B.J. Genome-wide identification, classification and analysis of heat shock transcription factor family in maize. BMC Genom. 2011, 12, 76. [Google Scholar] [CrossRef]
  37. Wang, H.; Li, Z.; Ren, H.; Zhang, C.; Xiao, D.; Li, Y.; Hou, X.; Liu, T. Regulatory interaction of BcWRKY33A and BcHSFA4A promotes salt tolerance in non-heading Chinese cabbage [Brassica campestris (syn. Brassica rapa) ssp. chinensis]. Hortic. Res. 2022, 9, uhac113. [Google Scholar] [CrossRef]
  38. Dossa, K.; Diouf, D.; Cisse, N. Genome-Wide Investigation of Hsf Genes in Sesame Reveals Their Segmental Duplication Expansion and Their Active Role in Drought Stress Response. Front. Plant Sci. 2016, 7, 1522. [Google Scholar] [CrossRef]
  39. Wan, X.; Yang, J.; Guo, C.; Bao, M.; Zhang, J. Genome-wide identification and classification of the Hsf and sHsp gene families in Prunus mume, and transcriptional analysis under heat stress. PeerJ 2019, 7, e7312. [Google Scholar] [CrossRef] [PubMed]
  40. Zhao, D.; Qi, X.; Zhang, Y.; Zhang, R.; Wang, C.; Sun, T.; Zheng, J.; Lu, Y. Genome-wide analysis of the heat shock transcription factor gene family in Sorbus pohuashanensis (Hance) Hedl identifies potential candidates for resistance to abiotic stresses. Plant Physiol. Biochem. 2022, 175, 68–80. [Google Scholar] [CrossRef]
  41. Liu, G.; Chai, F.; Wang, Y.; Jiang, J.; Duan, W.; Wang, Y.; Wang, F.; Li, S.; Wang, L. Genome-wide Identification and Classification of HSF Family in Grape, and Their Transcriptional Analysis under Heat Acclimation and Heat Stress. Hortic. Plant J. 2018, 4, 133–143. [Google Scholar] [CrossRef]
  42. Shen, R.-J.; Xing, M.-Y.; Wang, W.-Q.; Su, W.-Y.; Zhu, J.-Z.; Li, K.-F.; Zhang, Y.; Allan, A.C.; Grierson, D.; Yin, X.-R.; et al. Over-expression of heat shock factor AcHsfA2-1 upregulates transcripts of multiple genes and enhances heat tolerance of kiwifruit plants. Environ. Exp. Bot. 2023, 207, 105196. [Google Scholar] [CrossRef]
  43. Fragkostefanakis, S.; Mesihovic, A.; Simm, S.; Paupière, M.J.; Hu, Y.; Paul, P.; Mishra, S.K.; Tschiersch, B.; Theres, K.; Bovy, A.; et al. HsfA2 Controls the Activity of Developmentally and Stress-Regulated Heat Stress Protection Mechanisms in Tomato Male Reproductive Tissues. Plant Physiol. 2016, 170, 2461–2477. [Google Scholar] [CrossRef]
  44. Ogawa, D.; Yamaguchi, K.; Nishiuchi, T. High-level overexpression of the Arabidopsis HsfA2 gene confers not only increased themotolerance but also salt/osmotic stress tolerance and enhanced callus growth. J. Exp. Bot. 2007, 58, 3373–3383. [Google Scholar] [CrossRef]
  45. Xiang, J.; Ran, J.; Zou, J.; Zhou, X.; Liu, A.; Zhang, X.; Peng, Y.; Tang, N.; Luo, G.; Chen, X. Heat shock factor OsHsfB2b negatively regulates drought and salt tolerance in rice. Plant Cell Rep. 2013, 32, 1795–1806. [Google Scholar] [CrossRef]
  46. Huang, Y.C.; Niu, C.Y.; Yang, C.R.; Jinn, T.L. The Heat Stress Factor HSFA6b Connects ABA Signaling and ABA-Mediated Heat Responses. Plant Physiol. 2016, 172, 1182–1199. [Google Scholar] [CrossRef] [PubMed]
  47. Verma, V.; Ravindran, P.; Kumar, P.P. Plant hormone-mediated regulation of stress responses. BMC Plant Biol. 2016, 16, 86. [Google Scholar] [CrossRef] [PubMed]
  48. Zhang, J.; Jia, H.; Li, J.; Li, Y.; Lu, M.; Hu, J. Molecular evolution and expression divergence of the Populus euphratica Hsf genes provide insight into the stress acclimation of desert poplar. Sci. Rep. 2016, 6, 30050. [Google Scholar] [CrossRef]
  49. Yoshida, T.; Fujita, Y.; Sayama, H.; Kidokoro, S.; Maruyama, K.; Mizoi, J.; Shinozaki, K.; Yamaguchi-Shinozaki, K. AREB1, AREB2, and ABF3 are master transcription factors that cooperatively regulate ABRE-dependent ABA signaling involved in drought stress tolerance and require ABA for full activation. Plant J. 2010, 61, 672–685. [Google Scholar] [CrossRef]
  50. Qi, C.; Dong, D.; Li, Y.; Wang, X.; Guo, L.; Liu, L.; Dong, X.; Li, X.; Yuan, X.; Ren, S.; et al. Heat shock-induced cold acclimation in cucumber through CsHSFA1d-activated JA biosynthesis and signaling. Plant J. 2022, 111, 85–102. [Google Scholar] [CrossRef]
  51. Liu, M.; Huang, Q.; Sun, W.; Ma, Z.; Huang, L.; Wu, Q.; Tang, Z.; Bu, T.; Li, C.; Chen, H. Genome-wide investigation of the heat shock transcription factor (Hsf) gene family in Tartary buckwheat (Fagopyrum tataricum). BMC Genom. 2019, 20, 871. [Google Scholar] [CrossRef] [PubMed]
  52. Li, W.; Wan, X.L.; Yu, J.Y.; Wang, K.L.; Zhang, J. Genome-Wide Identification, Classification, and Expression Analysis of the Hsf Gene Family in Carnation (Dianthus caryophyllus). Int. J. Mol. Sci. 2019, 20, 5233. [Google Scholar] [CrossRef] [PubMed]
  53. Zhu, X.; Huang, C.; Zhang, L.; Liu, H.; Yu, J.; Hu, Z.; Hua, W. Systematic Analysis of Hsf Family Genes in the Brassica napus Genome Reveals Novel Responses to Heat, Drought and High CO2 Stresses. Front. Plant Sci. 2017, 8, 1174. [Google Scholar] [CrossRef]
  54. Zhang, H.; Jin, J.; Fan, D.; Zhao, X.; Jia, P.; Hao, Q.; Yang, L.; Niu, J. Identification and expression analysis of HSF transcription factor family in wild jujube under heat stress. ISHS Acta Hortic. 2021, 1350, 205–214. [Google Scholar] [CrossRef]
  55. Wang, Q.; Zhang, Z.; Guo, C.; Zhao, X.; Li, Z.; Mou, Y.; Sun, Q.; Wang, J.; Yuan, C.; Li, C.; et al. Hsf transcription factor gene family in peanut (Arachis hypogaea L.): Genome-wide characterization and expression analysis under drought and salt stresses. Front. Plant Sci. 2023, 14, 1214732. [Google Scholar] [CrossRef] [PubMed]
  56. Peng, S.; Zhu, Z.; Zhao, K.; Shi, J.; Yang, Y.; He, M.; Wang, Y. A novel heat shock transcription factor, VpHsf1, from Chinese wild Vitis pseudoreticulata is involved in biotic and abiotic stresses. Plant Mol. Biol. Report. 2013, 31, 240–247. [Google Scholar] [CrossRef]
  57. Ma, H.; Wang, C.; Yang, B.; Cheng, H.; Wang, Z.; Mijiti, A.; Ren, C.; Qu, G.; Zhang, H.; Ma, L. CarHSFB2, a class B heat shock transcription factor, is involved in different developmental processes and various stress responses in chickpea (Cicer arietinum L.). Plant Mol. Biol. Report. 2016, 34, 1–14. [Google Scholar] [CrossRef]
  58. Yun, L.; Zhang, Y.; Li, S.; Yang, J.; Wang, C.; Zheng, L.; Ji, L.; Yang, J.; Song, L.; Shi, Y.; et al. Phylogenetic and expression analyses of HSF gene families in wheat (Triticum aestivum L.) and characterization of TaHSFB4-2B under abiotic stress. Front. Plant Sci. 2022, 13, 1047400. [Google Scholar] [CrossRef] [PubMed]
  59. Bi, H.; Zhao, Y.; Li, H.; Liu, W. Wheat Heat Shock Factor TaHsfA6f Increases ABA Levels and Enhances Tolerance to Multiple Abiotic Stresses in Transgenic Plants. Int. J. Mol. Sci. 2020, 21, 3121. [Google Scholar] [CrossRef]
  60. Schramm, F.; Ganguli, A.; Kiehlmann, E.; Englich, G.; Walch, D.; von Koskull-Döring, P. The heat stress transcription factor HsfA2 serves as a regulatory amplifier of a subset of genes in the heat stress response in Arabidopsis. Plant Mol. Biol. 2006, 60, 759–772. [Google Scholar] [CrossRef]
  61. Gu, L.; Jiang, T.; Zhang, C.; Li, X.; Wang, C.; Zhang, Y.; Li, T.; Dirk, L.M.A.; Downie, A.B.; Zhao, T. Maize HSFA2 and HSBP2 antagonistically modulate raffinose biosynthesis and heat tolerance in Arabidopsis. Plant J. 2019, 100, 128–142. [Google Scholar] [CrossRef]
  62. Song, C.; Chung, W.S.; Lim, C.O. Overexpression of Heat Shock Factor Gene HsfA3 Increases Galactinol Levels and Oxidative Stress Tolerance in Arabidopsis. Mol. Cells 2016, 39, 477–483. [Google Scholar] [CrossRef] [PubMed]
  63. Lang, S.; Liu, X.; Xue, H.; Li, X.; Wang, X. Functional characterization of BnHSFA4a as a heat shock transcription factor in controlling the re-establishment of desiccation tolerance in seeds. J. Exp. Bot. 2017, 68, 2361–2375. [Google Scholar] [CrossRef]
  64. Yue, J.; Liu, J.; Tang, W.; Wu, Y.Q.; Tang, X.; Li, W.; Yang, Y.; Wang, L.; Huang, S.; Fang, C.; et al. Kiwifruit Genome Database (KGD): A comprehensive resource for kiwifruit genomics. Hortic. Res. 2020, 7, 117. [Google Scholar] [CrossRef]
  65. Tamura, K.; Stecher, G.; Kumar, S. MEGA11: Molecular Evolutionary Genetics Analysis Version 11. Mol. Biol. Evol. 2021, 38, 3022–3027. [Google Scholar] [CrossRef]
  66. Letunic, I.; Bork, P. Interactive Tree Of Life (iTOL) v5: An online tool for phylogenetic tree display and annotation. Nucleic Acids Res. 2021, 49, W293–W296. [Google Scholar] [CrossRef]
  67. Wang, Y.; Tang, H.; Debarry, J.D.; Tan, X.; Li, J.; Wang, X.; Lee, T.H.; Jin, H.; Marler, B.; Guo, H.; et al. MCScanX: A toolkit for detection and evolutionary analysis of gene synteny and collinearity. Nucleic Acids Res. 2012, 40, e49. [Google Scholar] [CrossRef]
  68. Yang, J.; Zhang, J.; Niu, X.-Q.; Zheng, X.-L.; Chen, X.; Zheng, G.-H.; Wu, J.-C. Comparative transcriptome analysis reveals key genes potentially related to organic acid and sugar accumulation in loquat. PLoS ONE 2021, 16, e0238873. [Google Scholar] [CrossRef] [PubMed]
  69. Bolger, A.M.; Lohse, M.; Usadel, B. Trimmomatic: A flexible trimmer for Illumina sequence data. Bioinformatics 2014, 30, 2114–2120. [Google Scholar] [CrossRef]
  70. Kim, D.; Paggi, J.M.; Park, C.; Bennett, C.; Salzberg, S.L. Graph-based genome alignment and genotyping with HISAT2 and HISAT-genotype. Nat. Biotechnol. 2019, 37, 907–915. [Google Scholar] [CrossRef] [PubMed]
  71. Chen, C.; Chen, H.; Zhang, Y.; Thomas, H.R.; Frank, M.H.; He, Y.; Xia, R. TBtools: An Integrative Toolkit Developed for Interactive Analyses of Big Biological Data. Mol. Plant 2020, 13, 1194–1202. [Google Scholar] [CrossRef] [PubMed]
Figure 1. Phylogenetic analysis of A. eriantha (AeHSFs) and A. thaliana (AtHSFs) proteins. The tree was constructed using MEGA 6.0 by the neighbor-joining method with 1000 bootstrap replicates. The number on the branch denotes the reliability of the node based on 1000 bootstrap verification; Different colors of the inner ring indicate different classification results for HSFs.
Ijms 24 15638 g001
Figure 2. Analysis of the gene structure and conserved motif of AeHSF gene members. (A) Neighbor-joining phylogenetic tree of AeHSF members. (B) The gene structure of the AeHSF genes. Green boxes represent exons (CDS), black lines represent introns, and yellow boxes represent 5′ and 3′ untranslated regions. (C) The conserved motif of AeHSF genes. In total, 10 motifs were identified. The protein length is shown on the horizontal scale. The vertical scale indicates the sequence identity of each conserved motif.
Ijms 24 15638 g002
Figure 3. Gene duplication analysis and chromosomal locations of AeHSF genes. (A) Gene duplication analysis of AeHSF genes. Pink lines connect the syntenic regions between kiwifruit AeHSF genes. (B) Chromosomal locations of AeHSF genes in A. eriantha. The chromosome number is marked on each chromosome.
Ijms 24 15638 g003
Figure 4. Predicted cis–elements in the promoter upstream 2000 bp sequences of AeHSF genes, which are presented as colored rectangles.
Ijms 24 15638 g004
Figure 5. The expression analysis of AeHSF genes under abiotic stresses and hormone treatments. (A) Expression profiles of AeHSF genes under abiotic stresses. (B) Expression profiles of AeHSF genes under abiotic stresses under hormone treatments. The color bar to the right of the figures represents the log2 FPKM (fragments per kilobase of exon per million reads mapped) value.
Ijms 24 15638 g005
Figure 6. Expression levels of key AeHSF genes under salt stress. Three biological and technical replicates calculated the error bars. Asterisks indicate the corresponding gene significantly up- or downregulated under the different treatments using t-test (* p < 0.05, ** p < 0.01, *** p < 0.001, **** p < 0.0001).
Ijms 24 15638 g006
Figure 7. AeHSFA2b transcription factor in the modulation of AeRFS4. (A) Correlation analysis of all transcription factors with the expressional pattern of AeRFS4 based on the RNA−seq results. The x axis indicates log2 (FPKM ratio of salt 6 d: CK 0 d). The y axis indicates the values of correlation between RFS4 and each transcription factor. Pentangles show the AeHSFA2b that were highly correlated (R ≥ 0.95, red dashed lines) with the expression patterns of RFS4. (B) Interaction of AeHSFA2b with the promoter of RFS4 in the Y1H assay.
Ijms 24 15638 g007
Figure 8. Subcellular localization of AeHSFA2b and empty vector in Nicotiana benthamiana leaves after 2 days of infiltration. The green fluorescence of GFP is indicated. White arrows indicate the GFP signal from the nucleus. Scale bars = 25 μm.
Ijms 24 15638 g008
Figure 9. The direct targeting and transcriptional modulation of the RFS4 promoter by AeHSFA2b. (A) A dual−luciferase (LUC) assay in Nicotiana benthamiana leaves was performed to explore the transcriptional activation function of RFS4 on AeHSFA2b promoters. The control group for the experiment involved the use of an empty vector. Representative images were captured to visually represent the outcomes, and the activity of LUC/Renilla luciferase (REN) was quantified to validate the transcriptional activation of RFS by AeHSFA2b. The error bars in the graph indicate the standard deviation (SD). Statistical analysis was conducted using the Student’s t-test. Significance at p < 0.01 is denoted by **. (B) The AeHSFA2b protein exhibited binding affinity towards specific regions of the AeRFS4 promoter by using an electrophoretic mobility shift assay (EMSA).
Ijms 24 15638 g009
Figure 10. Phenotypic and genes expression T3 AeHSFA2b-transgenic Arabidopsis seedlings under different NaCl concentrations. (A) Observation of phenotype, the root length, and fresh weight under different NaCl concentrations NaCl. (B) Genes expression of AeHSFA2b, AtGolS1/2, and AtRS5 under different NaCl concentrations. Three biological and technical replicates calculated the error bars. Asterisks indicate the corresponding gene significantly up- or downregulated under the different treatments using t-test (* p < 0.05, ** p < 0.01). WT, wild-type Arabidopsis. OE1, OE2, and OE3, three different lines of transgenic Arabidopsis.
Ijms 24 15638 g010
Figure 11. Genes expression T3 AeHSFA2b-transgenic Arabidopsis seedlings under different NaCl concentrations. (A) Genes expression of AeHSFA2b, AtGolS1/2, and AtRS5 under different NaCl concentrations. (B) Salt-responsive marker genes expression of AtHSP18.1, AtEGY3, AtRD29, and AtAPX2 under different NaCl concentrations. Three biological and technical replicates calculated the error bars. Asterisks indicate the corresponding gene significantly up- or downregulated under the different treatments using t-test (* p < 0.05, ** p < 0.01, *** p < 0.001). WT, wild-type Arabidopsis. OE1, OE2, and OE3, three different lines of transgenic Arabidopsis.
Ijms 24 15638 g011
Table 1. Detailed information on 41 AeHSF genes in kiwifruit.
Gene NameGenome IDChr IDStart (bp)End (bp)Protein Length (aa)Molecular Weight (kDa)PI
DTZ79_14g07720AeHSFA1aChr1410,001,67910,006,88228331,275.385.47
DTZ79_18g08160AeHSFA1bChr1816,404,71516,409,70050355,972.836.19
DTZ79_24g12140AeHSFA1cChr2418,591,49618,597,44251256,190.777.76
DTZ79_12g13240AeHSFA1dChr1223,908,73423,911,031596772.637.83
DTZ79_12g01030AeHSFA2aChr121,389,7891,392,36739445,138.734.53
DTZ79_20g03210AeHSFA2bChr204,073,7764,077,18434039,266.256.43
DTZ79_20g13080AeHSFA2cChr2019,899,24819,902,86039645,173.6610.25
DTZ79_25g04820AeHSFA2dChr2513,660,19413,664,74541047,170.36.05
DTZ79_02g08920AeHSFA3aChr029,444,8879,447,48545651,324.325.1
DTZ79_02g08960AeHSFA3bChr029,502,6759,505,56947953,705.088.16
DTZ79_22g06060AeHSFA3cChr2214,257,37414,260,05251958,377.596.79
DTZ79_06g06820AeHSFA4aChr0611,684,71411,687,10836741,842.637.87
DTZ79_12g12240AeHSFA4bChr1221,843,25521,845,77235339,637.215.12
DTZ79_17g00990AeHSFA4cChr171,375,4831,378,67631236,435.815.95
DTZ79_19g05240AeHSFA4dChr1913,922,26313,924,54037142,169.338.3
DTZ79_02g06560AeHSFA5aChr026,267,3786,272,77646752,808.945.6
DTZ79_02g07500AeHSFA5bChr027,451,2817,456,43446552,607.759.15
DTZ79_02g14180AeHSFA5cChr0218,802,71018,808,08746752,763.848.93
DTZ79_03g06230AeHSFA5dChr036,337,6426,342,27326729,710.024.62
DTZ79_03g18750AeHSFA6aChr0324,588,10624,590,10333038,174.394.91
DTZ79_24g03470AeHSFA6bChr244,741,5524,742,95229334,385.116.37
DTZ79_24g13410AeHSFA6cChr2420,568,82720,571,32426130,050.227.53
DTZ79_17g08930AeHSFA7aChr1716,311,60516,314,12135340,323.586.76
DTZ79_23g01840AeHSFA7bChr231,719,6851,725,77439345,040.765.97
DTZ79_25g01580AeHSFA8aChr257,169,5007,175,68733638,474.75.11
DTZ79_27g07960AeHSFA8bChr279,529,7789,535,49726630,879.355.970
DTZ79_05g10500AeHSFB1aChr0519,792,04719,795,73329032,502.435.84
DTZ79_09g05760AeHSFB1bChr097,085,4267,087,75623025,915.036.72
DTZ79_15g12130AeHSFB1cChr1516,819,80516,833,94173083,846.598.83
DTZ79_27g06080AeHSFB1dChr276,538,9586,543,54027330,221.655.16
DTZ79_03g10230AeHSFB2aChr0310,487,78110,488,83131835,100.924.54
DTZ79_18g03510AeHSFB2bChr185,178,3045,180,53230133,379.456.3
DTZ79_24g11010AeHSFB2cChr2417,046,07217,047,94529833,423.128.23
DTZ79_12g03600AeHSFB3aChr124,511,1634,513,74624127,528.897.55
DTZ79_20g10710AeHSFB3bChr2016,559,51516,563,17123927,835.346.02
DTZ79_04g03520AeHSFB4aChr043,612,0123,614,20254260,737.755.93
DTZ79_10g10590AeHSFB4bChr1020,942,77920,944,10431235,352.015.65
DTZ79_11g01990AeHSFB4cChr112,045,9162,047,86030734,740.274.99
DTZ79_18g08770AeHSFB4dChr1817,220,84017,222,49018721,116.756.72
DTZ79_12g02240AeHSFC1aChr122,633,9422,635,60928232,163.467.69
DTZ79_20g11770AeHSFC1bChr2018,439,57518,444,57427631,061.175.88
Disclaimer/Publisher’s Note: The statements, opinions and data contained in all publications are solely those of the individual author(s) and contributor(s) and not of MDPI and/or the editor(s). MDPI and/or the editor(s) disclaim responsibility for any injury to people or property resulting from any ideas, methods, instructions or products referred to in the content.

