Review

Role of the Sodium-Dependent Organic Anion Transporter (SOAT/SLC10A6) in Physiology and Pathophysiology

1
Institute of Pharmacology and Toxicology, Faculty of Veterinary Medicine, Biomedical Research Center Seltersberg (BFS), Justus Liebig University of Giessen, Schubertstr. 81, 35392 Giessen, Germany
2
General Practice, Faculty of Medicine, University of Augsburg, 86159 Augsburg, Germany
*
Author to whom correspondence should be addressed.
Int. J. Mol. Sci. 2023, 24(12), 9926; https://doi.org/10.3390/ijms24129926
Submission received: 24 April 2023 / Revised: 2 June 2023 / Accepted: 3 June 2023 / Published: 8 June 2023

Abstract

:
The sodium-dependent organic anion transporter (SOAT, gene symbol SLC10A6) specifically transports 3′- and 17′-monosulfated steroid hormones, such as estrone sulfate and dehydroepiandrosterone sulfate, into specific target cells. These biologically inactive sulfo-conjugated steroids occur in high concentrations in the blood circulation and serve as precursors for the intracrine formation of active estrogens and androgens that contribute to the overall regulation of steroids in many peripheral tissues. Although SOAT expression has been detected in several hormone-responsive peripheral tissues, its quantitative contribution to steroid sulfate uptake in different organs is still not completely clear. Given this fact, the present review provides a comprehensive overview of the current knowledge about the SOAT by summarizing all experimental findings obtained since its first cloning in 2004 and by processing SOAT/SLC10A6-related data from genome-wide protein and mRNA expression databases. In conclusion, despite a significantly increased understanding of the function and physiological significance of the SOAT over the past 20 years, further studies are needed to finally establish it as a potential drug target for endocrine-based therapy of steroid-responsive diseases such as hormone-dependent breast cancer.

1. Introduction

Over the last two decades, the sodium-dependent organic anion transporter (SOAT, gene symbol SLC10A6) has been well-established as a specific carrier for sulfated steroid hormones in humans, rats, and mice [1,2,3,4]. The SOAT is a transmembrane protein with nine transmembrane domains (TMDs) that acts as a sodium-dependent uptake carrier for compounds such as dehydroepiandrosterone sulfate (DHEAS), estrone sulfate (E1S), or pregnenolone sulfate (PREGS) [2]. These sulfo-conjugated, biologically inactive steroid metabolites occur in quite high concentrations in the blood circulation and serve as precursors for the intracrine formation of active estrogens and androgens that contribute to the overall regulation of steroids in many peripheral tissues [5,6]. As sulfated steroids are negatively charged at physiological pH, uptake carriers such as SOAT are required to import these molecules for subsequent intracellular cleavage of the sulfate group by the steroid sulfatase STS (so-called sulfatase pathway) [6]. Based on this, only target cells that express uptake carriers such as the SOAT, together with STS, and estrogen/androgen receptors can respond to sulfated steroid hormones [7]. Although SOAT expression has been detected in several peripheral tissues, its quantitative contribution to the steroid sulfate uptake and sulfatase pathway in different organs is still not completely clear. Furthermore, the role of the SOAT in disease progression, particularly in steroid-responsive tumors, and its pharmaceutical potential, e.g., for anti-proliferative therapy, require further investigation. Given these facts, the present review provides a comprehensive overview of the current knowledge about the SOAT by summarizing all experimental findings obtained since its first cloning in 2004 and by processing SOAT/SLC10A6-related data from genome-wide protein and mRNA expression databases.

2. The SLC10 Carrier Family

The SOAT is assigned to the solute carrier family 10 (SLC10) based on its high phylogenetic relationship to the other six members of this carrier family [1,8,9]. The SLC10 family was established in the early 1990s when the first two members, the Na+/taurocholate co-transporting polypeptide (NTCP, gene symbol SLC10A1) and the apical sodium-dependent bile acid transporter (ASBT, gene symbol SLC10A2), were identified by expression cloning [10,11]. The NTCP and ASBT are essentially involved in the maintenance of the enterohepatic circulation of bile acids (Figure 1) by mediating sodium-dependent bile acid uptake in the liver and intestine, respectively [9,12]. Consistent with this function, the SLC10 family was formerly referred to as the “sodium/bile acid co-transporter family” [8]. Later, in the early 2000s, five more genes, referred to as SLC10A3-SLC10A7, were identified that phylogenetically belong to this carrier family [9,12]. Among them, Slc10a6/Soat was first cloned from rat adrenal gland mRNA in 2004 [2]. Just a few years later, the human SLC10A6/SOAT homolog was cloned and functionally characterized [1]. Interestingly, the SOAT showed no transport activity for the most physiologically important bile acids such as taurocholic acid and glycocholic acid, which are the typical substrates of the NTCP and ASBT (Table 1). Instead, the SOAT revealed specific transport activity for all physiologically relevant 3′- and 17′-monosulfated steroid hormones [1,3,13,14]. In addition, only two minor bile acid species, namely taurolithocholic acid-3-sulfate (TLCS) and taurolithocholic acid (TLC), were found to be transported by the SOAT [1,14].
Regarding the other four members of the SLC10 carrier family (namely SLC10A3, SLC10A4, SLC10A5, and SLC10A7), transport experiments in transfected HEK293 cells or Xenopus laevis oocytes revealed no transport activity for bile acids or sulfated steroid hormones at all. Therefore, these carriers are still classified as orphan carriers [9,15]. The SLC10A4 protein was detected in the synaptic vesicles of cholinergic and monoaminergic neurons in the central and peripheral nervous system [16,17]. Although no direct transport activity of the SLC10A4 protein could be detected for neurotransmitters such as dopamine, norepinephrine, serotonin, histamine, aspartate, GABA, glutamate, ATP, and acetylcholine [18], SLC10A4 appears to be involved in the regulation of the vesicular accumulation of dopamine and acetylcholine, at least in mice [19,20]. SLC10A5 showed the highest mRNA expression levels in the liver and kidney [21], and the phenotypic characterization of a corresponding knockout mouse model is ongoing in our laboratory. SLC10A7 was first cloned in 2007 and represents the most distant member of the SLC10 carrier family, with a low sequence homology of only <15% to the NTCP, ASBT, and SOAT [22] (Table 1). Patients with mutations in the SLC10A7 gene presented skeletal dysplasia with multiple large joint dislocations, short stature, and amelogenesis imperfecta [23,24,25]. More recently, the SLC10A7 protein has been renamed as “negative regulator of intracellular calcium signaling” (RCAS) due to its significant effect on store-operated calcium entry (SOCE) via the plasma membrane [26,27]. Taken together, our current knowledge of the SLC10 carrier family clearly points to functions beyond bile acid transport [9,15].

3. Genomic Organization of the SLC10A6/Slc10a6 Genes

Phylogenetically, the SOAT and ASBT are most closely related and share identical gene structures. All SLC10A6/Slc10a6 and SLC10A2/Slc10a2 (uppercase for humans, lowercase for animals) genes identified to date have six coding exons with highly conserved exon/intron boundaries, suggesting that both of them share a common ancestor gene [9]. In contrast, the human SLC10A1, SLC10A4, SLC10A5, and SLC10A7 genes exhibit different gene structures with five, three, one, and 11/12 coding exons, respectively. The open reading frame of the human SLC10A6 transcript consists of 1134 base pairs (Figure 2A) and codes for the 377-amino-acid (aa) SOAT protein [1] (Figure 2B). The Soat proteins in rats and mice are slightly shorter, exhibiting 370 and 373 aa, respectively [2,4].

4. SOAT Protein Structure, Sorting, and Dimerization

Based on the crystal structures of two bacterial SLC10-homologous proteins from Neisseria meningitidis and Yersinia frederiksenii named ASBTNm and ASBTYf, respectively [28,29], and the more recent cryogenic electron microscopy (cryo-EM) structures of human NTCP [30,31,32,33], the SOAT is suggested to have a nine-TMD structure with Nexo/Ccyt orientation (Figure 2B). This membrane topology is supported by the de novo structure prediction of the SOAT with AlphaFold [34]. Within this structure, TMDs 1, 5, and 6 form a panel domain, and the other TMDs (2/3/4 and 7/8/9) form a core domain. Within the core domain, TMDs 2/3/4 and 7/8/9 are topologically similar but oppositely orientated within the membrane, revealing an internal twofold pseudosymmetry. TMDs 3 and 8 are discontinuous and cross each other, thereby facilitating the binding of two Na+ ions as the co-substrates (Figure 2C). Substrate binding and translocation occur at the interface between both domains [32].
On the protein level, the SOAT shows the highest sequence homology with the ASBT (42% sequence identity, 70% sequence similarity), followed by the NTCP (33% sequence identity, 63% sequence similarity) [8,9]. The SOAT is a 46 kDa glycoprotein when expressed in HEK293 cells. After PNGase treatment, the apparent molecular weight was found to drop to 42 kDa, most likely representing the non-glycosylated SOAT core protein [1]. There are three potential N-glycosylation sites for the SOAT at amino acid positions Asn4, Asn14, and Asn157, but it is not yet clear where the glycosylation of the SOAT protein exactly occurs (Figure 2B). Sorting studies in transfected HEK293 cells clearly localized the SOAT protein to the plasma membrane [1,13,35,36]. However, immunohistochemistry (IHC) analysis of SOAT expression in different tissues also showed large parts of the protein in the Golgi compartment, at least in primary spermatocytes [13].
Recently, it was shown that homo- and heterodimerization is a common feature of all SLC10 carriers. Different experimental approaches, such as Western blot, co-immunoprecipitation, chemical cross-linking, and membrane-based yeast-two-hybrid screening, have clearly demonstrated the presence of homodimers for the SOAT, NTCP, and ASBT [37,38,39,40,41]. For all three proteins, dimerization seems to be relevant for their regulation and proper expression at the plasma membrane. Interestingly, heterodimerization between different SLC10 carriers has also been demonstrated (e.g., for NTCP/SOAT, NTCP/ASBT, ASBT/SOAT, or SLC10A4/SOAT), suggesting the presence of highly conserved dimerization domains in all SLC10 proteins [41].

5. SOAT Substrate Docking and Proposed Transport Mechanism

Very recently, cryo-EM structures of the human NTCP protein were independently solved by four research groups. These studies used detergent-solubilized recombinant NTCP or recombinant NTCP reconstituted in nanodiscs for high-resolution cryo-EM [30,31,32,33]. Essentially, three different conformations of the NTCP protein have been identified: inward-open conformation (PDB 7pqg [31]), outward-open conformation (PDB 7wsi [30], PDB 7fci [33], and PDB 7vad [30]), and open-pore conformation (PDB 7pqq [31] and PDB 7zyi [32]). Due to the high sequence homology between the NTCP and the SOAT, it is assumed that there are also similar protein conformations for the SOAT (Figure 3).
Based on these NTCP structures, different kinds of transport mechanisms have been proposed. Transitions between the outward-open and inward-open conformations could facilitate an alternating access transport mechanism, where the substrate-binding site has alternating access to the extra- and intracellular milieu and the binding of the co-substrate Na+ is important for inducing the conformational transition [29,30]. Alternatively, for the open-pore conformation of the NTCP, it was proposed that one bile acid molecule binds to an outer substrate-binding site (Sout), thereby preventing ion and water leakage by sealing the open pore. This bile acid molecule can then shift to a second binding site (Sin) while the transporter is reloading an additional substrate to Sout. The substrate then can be released from Sin to the intracellular milieu while the substrate binding at Sout is still sealing the open pore [32]. Finally, it cannot be excluded that the open-pore conformation of the NTCP is just an intermediate state of the transport cycle [31] so the transporter may undergo all three resolved conformations during the transport cycle.
In order to illustrate substrate binding and translocation for the SOAT, homology models were generated for representative structures of all three conformations, namely outward-open (Figure 3A), open-pore (Figure 3B), and inward-open (Figure 3C). These structures were then used for the virtual docking of DHEAS, the prototypic SOAT substrate. In the outward-open conformation, DHEAS binds at the bottom of a large outward accessible cavity, without allowing translocation of the substrate to the intracellular milieu in this conformation. In contrast, in the inward-open conformation, this entrance cavity is structurally covered at the top, and the DHEAS molecule has free access to the intracellular milieu. Based on this, the transition of the SOAT protein from the outward-open to the inward-open conformation may be sufficient to translocate the DHEAS molecule from the outside to the inside of the cell. As the DHEAS transport via the SOAT is strictly sodium-dependent [1], it is very likely that two Na+ ions act as co-substrates, thereby contributing to the conformational transition of the SOAT protein during the transport cycle, as demonstrated for the bacterial ASBT and human NTCP proteins [28,29,30,31,32,33]. However, based on the docking data for the open-pore conformation, it also seems possible that the protein traverses this conformation as an intermediate state. This would involve rotating the DHEAS molecule and positioning it in an orientation with the sulfate group toward the top (Figure 3B), from which it can be released in the inward-open conformation (Figure 3C). During this proposed transport cycle, the core domain seems to move in a slight lateral movement away from the panel domain, thereby allowing DHEAS to pass through the protein.
However, it must be emphasized that these data were only generated on homology models of the human SOAT and the actual structural conformations of the SOAT must be determined experimentally. Direct structural comparisons between the NTCP and the SOAT would be highly valuable for clarifying the differences in the ligand-binding and substrate translocation behavior of both proteins (NTCP and SOAT) at the molecular level. Although both carriers bind and translocate DHEAS as a substrate, only the NTCP accepts bile acids as additional substrates, whereas bile acids only bind to the SOAT without being translocated [1].

6. SOAT Substrate Recognition

The functional characterization of the SOAT has mostly been carried out in stably transfected Flp-In T-REx HEK293 cells, where the SOAT cDNA was stably integrated at the Flp recognition target (FRT) site, and SOAT expression could be induced by tetracycline treatment [1,3]. Systematic transport studies were performed using different classes of steroids through (I) radiolabeled substrates and liquid scintillation counting (e.g., for [3H]DHEAS, [3H]E1S, [3H]TLC), or (II) liquid chromatography-tandem mass spectrometry (LC-MS/MS) detection of unlabeled compounds (e.g., for 17β-estradiol-3,17-disulfate, 17α-OH-pregnenolone sulfate, testosterone sulfate) [1,3]. In these studies, the SOAT proved to be a very specific carrier for all physiological 3′- and 17′-monosulfated steroid hormones (see Table 2). In contrast, non-sulfated steroids (e.g., estrone, DHEA), glucuronidated steroids (e.g., estradiol-17β-D-glucuronide, estrone-3β-D-glucuronide), and disulfated steroids such as 17β-estradiol-3,17-disulfate were not transported [1,3,14]. This indicates that the presence of one single negatively charged sulfate group at the steroid nucleus is required for the SOAT substrates (Figure 4A). Thereby, α- or β-orientations of the sulfate group were accepted at both the 3′ and 17′ positions, as indicated by the substrate pairs androsterone sulfate (3α) and epiandrosterone sulfate (3β), and epitestosterone sulfate (17α) and testosterone sulfate (17β) (Table 2) [1,3,14].
All of these 3′- and 17′-monosulfated steroids are characterized by a lipophilic steroid backbone with a planar structure (A/B-trans, B/C-trans, C/D-trans) and a terminal negatively charged sulfate group [48]. The substrate recognition of both substrate groups can be explained by the pseudo-symmetry of the 3′- and 17′-monosulfated steroids, which show a close structural overlap when rotated by 180° against each other. Based on this, both 3′- and 17′-monosulfated steroids likely bind to the same substrate-binding site but in different orientations [3]. However, a second sulfate group might cause it to structurally exceed the substrate-binding pocket, thereby preventing the transportation of disulfated steroids such as 17β-estradiol-3,17-disulfate by the SOAT. In contrast, other modifications at the steroid backbone, such as 5α-reduction, 16α-hydroxylation, and 17α-hydroxylation were found to be acceptable for substrate recognition. Therefore, the compound pairs 5α-dihydrotestosterone sulfate and testosterone sulfate, 16α-OH-dehydroepiandrosterone sulfate and DHEAS, and 17α-OH-pregnenolone sulfate and pregnenolone sulfate could all be transported by the SOAT [3].
Table 2. SOAT substrates.
SubstratesSubstrate Km
Steroid 3’-monosulfates
Pregnenolone sulfate (PREGS)11.3 µM [1,3]
Estrone sulfate (E1S)12.0 µM [1,13]
Dehydroepiandrosterone sulfate (DHEAS)28.7 µM [1]
16α-OH-DHEAS319.0 µM [49]
17α-OH-PREGSn.d. [3]
Androstenediol-3-sulfaten.d. [13]
Androsterone sulfaten.d. [3]
Epiandrosterone sulfaten.d. [3]
17β-estradiol-3-sulfaten.d. [13]
Steroid 17’-monosulfates
17β-estradiol-17-sulfate n.d. [3]
5α-dihydrotestosterone sulfaten.d. [3]
Epitestosterone sulfaten.d. [3]
Testosterone sulfate n.d. [3]
Bile acids
Taurolithocholic acid19.3 µM [14]
Taurolithocholic acid-3-sulfaten.d. [1]
Non-steroidal organosulfates
2-Sulfooxymethylpyrene (2-SMP)n.d. [1]
4-Sulfooxymethylpyrene (4-SMP)n.d. [1]
Note: n.d. = Km not determined.
The 3D planar tetracyclic ring structure of the steroid hormones with the typical A/B-trans, B/C-trans, and C/D-trans conformation seems to be important for substrate recognition by the SOAT. This may explain why the planar organosulfates 2-sulfooxymethylpyrene (2-SMP) and 4-sulfooxymethylpyrene (4-SMP) are also recognized as substrates. However, steroid-based structures that deviate from this planar structure are generally not recognized as SOAT substrates. This applies to almost all bile acids (e.g., taurocholic acid, glycocholic acid) with the typical A/B-cis, B/C-trans, and C/D-trans conformation of the steroid ring system, as well as heart glycosides such as digoxin and ouabain with an A/B-cis, B/C-trans, and C/D-cis conformation. There are only two exceptions to this rule, namely the sulfated bile acid TLCS [1] and the secondary taurine-conjugated bile acid TLC [14], both of which are transported by the SOAT. Interestingly, TLC is the only substrate identified so far that is common to the NTCP, ASBT, and SOAT, suggesting that it binds to a highly conserved substrate-binding site among these three carriers that may be specific to this substrate and could explain this peculiarity in the substrate recognition of TLC and TLCS.

7. Sodium-Dependent Transport Mode of SOAT

The NTCP and ASBT are well-established sodium-dependent co-transporters for Na+ and bile acids [9,12,15]. In addition, the SOAT mediates the sodium-coupled co-transport of its substrates, and when sodium chloride in the transport buffer is replaced by an equimolar concentration of choline chloride, SOAT transport is completely abolished [1,2]. An electrogenic BA: Na+ transport stoichiometry of 2:1 was found for the NTCP and ASBT, which means that two positively charged Na+ ions are transported together with one negatively charged bile acid molecule [8]. In addition, the ASBT and NTCP structures mentioned above clearly demonstrate two distinct Na+ binding sites within the core domain of these proteins, clearly supporting this transport mode and substrate stoichiometry [28,32]. Interestingly, all amino acids involved in coordinative Na+ binding are highly conserved between the NTCP, ASBT, and SOAT. The Na+ binding site 1 (Na1) is formed by S105/S112/S112, N106/N113/N113, S119/S126/S126, T123/T130/T130, and E257/E261/E261, and the second Na+ binding site 2 (Na2) binds sodium via Q68/Q75/Q75, E257/E261/E261, T258/T262/T262, C260/M264/A264, and Q261/Q265/Q265 (amino acid positions in NTCP/ASBT/SOAT, respectively). However, there is one difference between the NTCP, ASBT, and SOAT regarding the acceptance of other monovalent cations as co-substrates. When sodium chloride in the transport buffer was replaced by equimolar concentrations of lithium chloride, bile acid transport via the NTCP and ASBT was completely abrogated, whereas the SOAT retained ~40% residual transport activity for DHEAS, even with Li+ as the co-substrate [1]. This indicates that although the substrate recognition of the SOAT seems to be much more restricted than that of the NTCP and ASBT, the SOAT is less selective in the acceptance of monovalent cations as co-substrates.

8. SOAT Genetic Variants

Genetic variants, including the more common single-nucleotide polymorphisms (SNPs) and rare genetic variants, in carrier genes often result in disease-associated transporter dysfunction or loss-of-function phenotypes [50]. In the case of the SOAT, several hundred naturally occurring genetic variants have been identified through the systematic screening of different SNP databases. Among them, 30 non-synonymous variants were analyzed more closely, all of which were predicted to affect the transport function [35,36]. All variants were analyzed for plasma membrane sorting and DHEAS transport function. Six variants, namely A83V, P107L, L204F, G241D, G263E, and Y308N, showed significantly lower membrane expression, leading to reduced transport activity. Seven other variants were completely transport deficient, even when they were properly sorted to the plasma membrane, namely L44P, Q75R, G109S, S112F, N113K, S133F, and G294R [35,36]. Although no clear genotype–phenotype correlation could be identified for the SOAT L204F variant in subjects with hypospermatogenesis (see Section 12.1), in the future, these loss-of-function genetic variants could potentially be used to subgroup patient populations based not only on high and low SOAT expression levels (see Section 12.1) but also on genotype-based functional and dysfunctional SOAT variants.

9. SOAT Inhibitors

The SOAT has been established as a potential drug target for anti-proliferative therapy of breast cancer cells (see Section 12.3) [51]. In addition, the inhibition of SOAT-mediated import of sulfated steroids using pharmacological inhibitors may be beneficial for other steroid-responsive tissues such as the skin, endometrium, adipose tissue, or prostate [52]. Therefore, structure–activity relationship (SAR) analyses of SOAT inhibitors are of particular interest (Table 3 and Figure 4B). First, it must be noted that some of the physiological bile acids, although not transported by the SOAT, are quite good SOAT inhibitors [1]. The SOAT inhibition potencies of monomeric bile acids have been ranked in the following order: TLCS (IC50 = 0.5 µM) > TLC (IC50 = 3.0–3.9 µM) > lithocholic acid 3-sulfate (IC50 = 4.2 µM) > lithocholic acid (IC50 = 10.4 µM) > chenodeoxycholic acid (IC50 = 11.2 µM) > glycochenodeoxycholic acid (IC50 = 26.6 µM) > taurochenodeoxycholic acid (IC50 = 38.1 µM) > glycodeoxycholic acid (IC50 = 46.7 µM) > tauroursodeoxycholic acid (IC50 = 49.6 µM) [48]. Of note, the dimeric bile acid molecules S 0960 (IC50 = 0.15 µM), S 1690 (IC50 = 0.7 µM), and S 3068 (IC50 = 1 µM) were found to be even more potent SOAT inhibitors as monomeric bile acid molecules [48]. However, these dimeric bile acids do not have any physiological relevance. In addition, some other plant-derived steroid-like molecules have shown potent SOAT inhibition, e.g., the heart glycoside digitonin (IC50 = 4.1 µM), betulinic acid (IC50 = 1.2 µM), or the betulin-derivatives SAL-II-68 (IC50 = 3.6 µM) and EMe I 4 (IC50 = 5.4 µM) [14,48] (Table 3).
Systematic screening of SOAT inhibition was also performed using a set of xenobiotic non-steroidal organosulfates. Here, 1-(ω-sulfooxyethyl)pyrene (1ω-SEP), bromosulfophthalein (BSP), 2-SMP, and 4-SMP were all found to be potent SOAT inhibitors [1]. Subsequent studies on BSP revealed an IC50 value of 3.6 µM [48], whereas 2-SMP and 4-SMP were identified as SOAT substrates (see Table 2). In contrast, other sulfo-conjugated organic molecules, such as ethylsulfate, phenylsulfate, phenylethylsulfate, 2-propylsulfate, 5-sulfooxymethylfurfural, hydroquinone sulfate, 4-methylumbelliferylsulfate, and indoxylsulfate [1], had little or no inhibitory effect on the SOAT transport of DHEAS (Table S1). Furthermore, among a series of differently substituted alpha-naphthyl derivatives, only alpha-naphthylsulfate showed SOAT inhibition, whereas alpha-naphthylisothiocyanate, alpha-naphthylphosphate, and alpha-naphtylamine did not show inhibitory effects, indicating that a sulfate group is an essential structural requirement for small organic SOAT inhibitors [1].
Apart from these bile acids and organosulfates, some additional molecules showed strong inhibition of the SOAT transporter, namely the phenyl sulfonamide S 1647 (IC50 = 1.1 µM); benzothiazepine S 0382 (IC50 = 75.2 µM); barbiturate derivative S 3740 (IC50 = 1.1 µM); propanolamines S 8214 (IC50 = 14.9 µM), S 9202 (IC50 = 18.7 µM), S 9086 (IC50 = 23.1 µM), S 9203 (IC50 = 37.7 µM), and S 9087 (IC50 = 50 µM); as well as the drugs troglitazone, irbesartan, losartan, and cyclosporine A [14,48] (Figure 4B and Table 3).
Table 3. SOAT inhibitors of different chemical classes.
InhibitorInhibitor IC50
Monomeric and dimeric bile acids
S 0960 (dimeric)0.15 µM [48]
Taurolithocholic acid-3-sulfate (TLCS) *0.5 µM [48]
S 1690 (dimeric)0.7 µM [48]
S 3068 (dimeric)1.0 µM [48]
Taurolithocholic acid (TLC) *3.0–3.9 µM [14,48]
Lithocholic acid-3-sulfate4.2 µM [48]
Lithocholic acid10.4 µM [48]
Chenodeoxycholic acid11.2 µM [48]
Glycochenodeoxycholic acid26.6 µM [48]
Taurochenodeoxycholic acid38.1 µM [48]
Glycodeoxycholic acid46.7 µM [48]
Glycolithocholic acid-3-sulfate46.7 µM [48]
Tauroursodeoxycholic acid49.6 µM [48]
Taurodeoxycholic acid76.3 µM [48]
Taurocholic acid65.3–99.7 µM [14,48]
Deoxycholic acid100.1 µM [48]
Glycoursodeoxycholic acid100.8 µM [48]
7-Ketolithocholic acid164.2 µM [48]
Hyodeoxycholic acid172.6 µM [48]
Cholic acid177.6 µM [48]
Glycocholic acid284.8 µM [48]
Ursododeoxycholic acid384.8 µM [48]
Hyocholic acid971.8 µM [48]
Glycolithocholic acidn.d. [1]
Steroids and steroid sulfates
Digitonin4.1 µM [48]
Pregnenolone-3-sulfate (PREGS) *9.1 µM [48]
Estrone-3-sulfate (E1S) *22.1 µM [48]
RR Scymnol sulfate 23.3 µM [48]
Cortisone29.6 µM [48]
Estriol~100 µM [48]
17β-estradiol-3,17-disulfate133.2 µM [48]
17β-estradiol-3-sulfate *145.9 µM [48]
Corticosterone-21-sulfate323.8 µM [48]
Betulin derivatives
Betulinic acid1.2 µM [14]
SAL-II-683.6 µM [48]
EMe I 45.4 µM [48]
SAL-II-15666.9 µM [48]
3-O-Caffeoyl betulin301.1 µM [14]
Lupenone664.5 µM [14]
Betulin912.2 µM [14]
Non-steroidal organosulfates
Bromosulfophthalein (BSP)3.6 µM [14,48]
4-Methylumbelliferyl sulfate 255.7 µM [48]
1-(ω-sulfooxyethyl)pyrenen.d. [1]
2-Sulfooxymethylpyrene (2-SMP) *n.d. [1]
4-Sulfooxymethylpyrene (4-SMP) *n.d. [1]
α-Naphthyl sulfaten.d. [1]
Others
S 16471.1 µM [48]
S 37401.1 µM [48]
T 58540159.0 µM [48]
T 0511-169815.0 µM [48]
L-Thyroxine49.5 µM [48]
T 557391557.0 µM [48]
S 038275.2 µM [48]
T 5239532137.0 µM [48]
Cyclosporine An.d. [14]
Erythrosine Bn.d. [14]
Ginkgolic acid 17:1n.d. [14]
Troglitazonen.d. [14]
Irbesartann.d. [14]
Losartann.d. [14]
Propanolamine derivatives
S 821414.9 µM [48]
S 920218.7 µM [48]
S 908623.1 µM [48]
S 920337.7 µM [48]
S 908750.0 µM [48]
Note: n.d. = not determined; * substrate inhibitor.
Using SAR analysis of 25 structurally divergent SOAT inhibitors that covered four orders of magnitude of IC50 values, a 3D pharmacophore model for the SOAT was established. The best hypothesis for the calculated SOAT pharmacophore model consisted of three hydrophobic sites and two hydrogen bond acceptors. This model achieved good prediction values and was used to screen a library of ~12 million commercially available compounds. Among the identified hits, four SOAT inhibitors with distinct chemical structures were validated experimentally. All of them demonstrated SOAT inhibition, although with varying potencies of IC50 = 9 µM (T 5854015), 15 µM (T 0511-1698), 57 µM (T 5573915), and 137 µM (T 5239532), respectively [48].
In addition to their partly overlapping and partly complementary substrate patterns, the NTCP, ASBT, and SOAT shared some inhibitors but also showed certain carrier inhibition specificities. A systematic comparison of an inhibitor set of 14 chemically divergent molecules indicated no significant correlation of the IC50 values between the most closely related carriers ASBT and SOAT. However, certain individual compounds were found to be quite good inhibitors against both carriers, e.g., S 3740 (IC50 = 8 µM for ASBT and 1.1 µM for SOAT), S 1647 (IC50 = 4 µM for ASBT and 1 µM for SOAT), and S 3068 (IC50 = 4 µM for ASBT and 1 µM for SOAT), clearly indicating some overlap in the inhibitor-binding sites of the two carriers. In another study, the inhibitory potencies of four different betulin derivatives were comparatively analyzed for the NTCP, ASBT, and SOAT. This study showed that there was no common inhibition pattern observed for either the individual carriers or the betulin derivative used as the inhibitor. As an example, betulinic acid was found to be a potent inhibitor for the NTCP and SOAT, with an IC50 value of ~1 µM but did not show any inhibition of the ASBT at all. In contrast, troglitazone and BSP were identified as potent inhibitors of all three carriers and, therefore, can be regarded as pan-SLC10 inhibitors [14]. However, it must be noted that all inhibitors of the SOAT at least partially interacted with one of the bile acid carriers so a SOAT-specific inhibitor could not be identified so far.

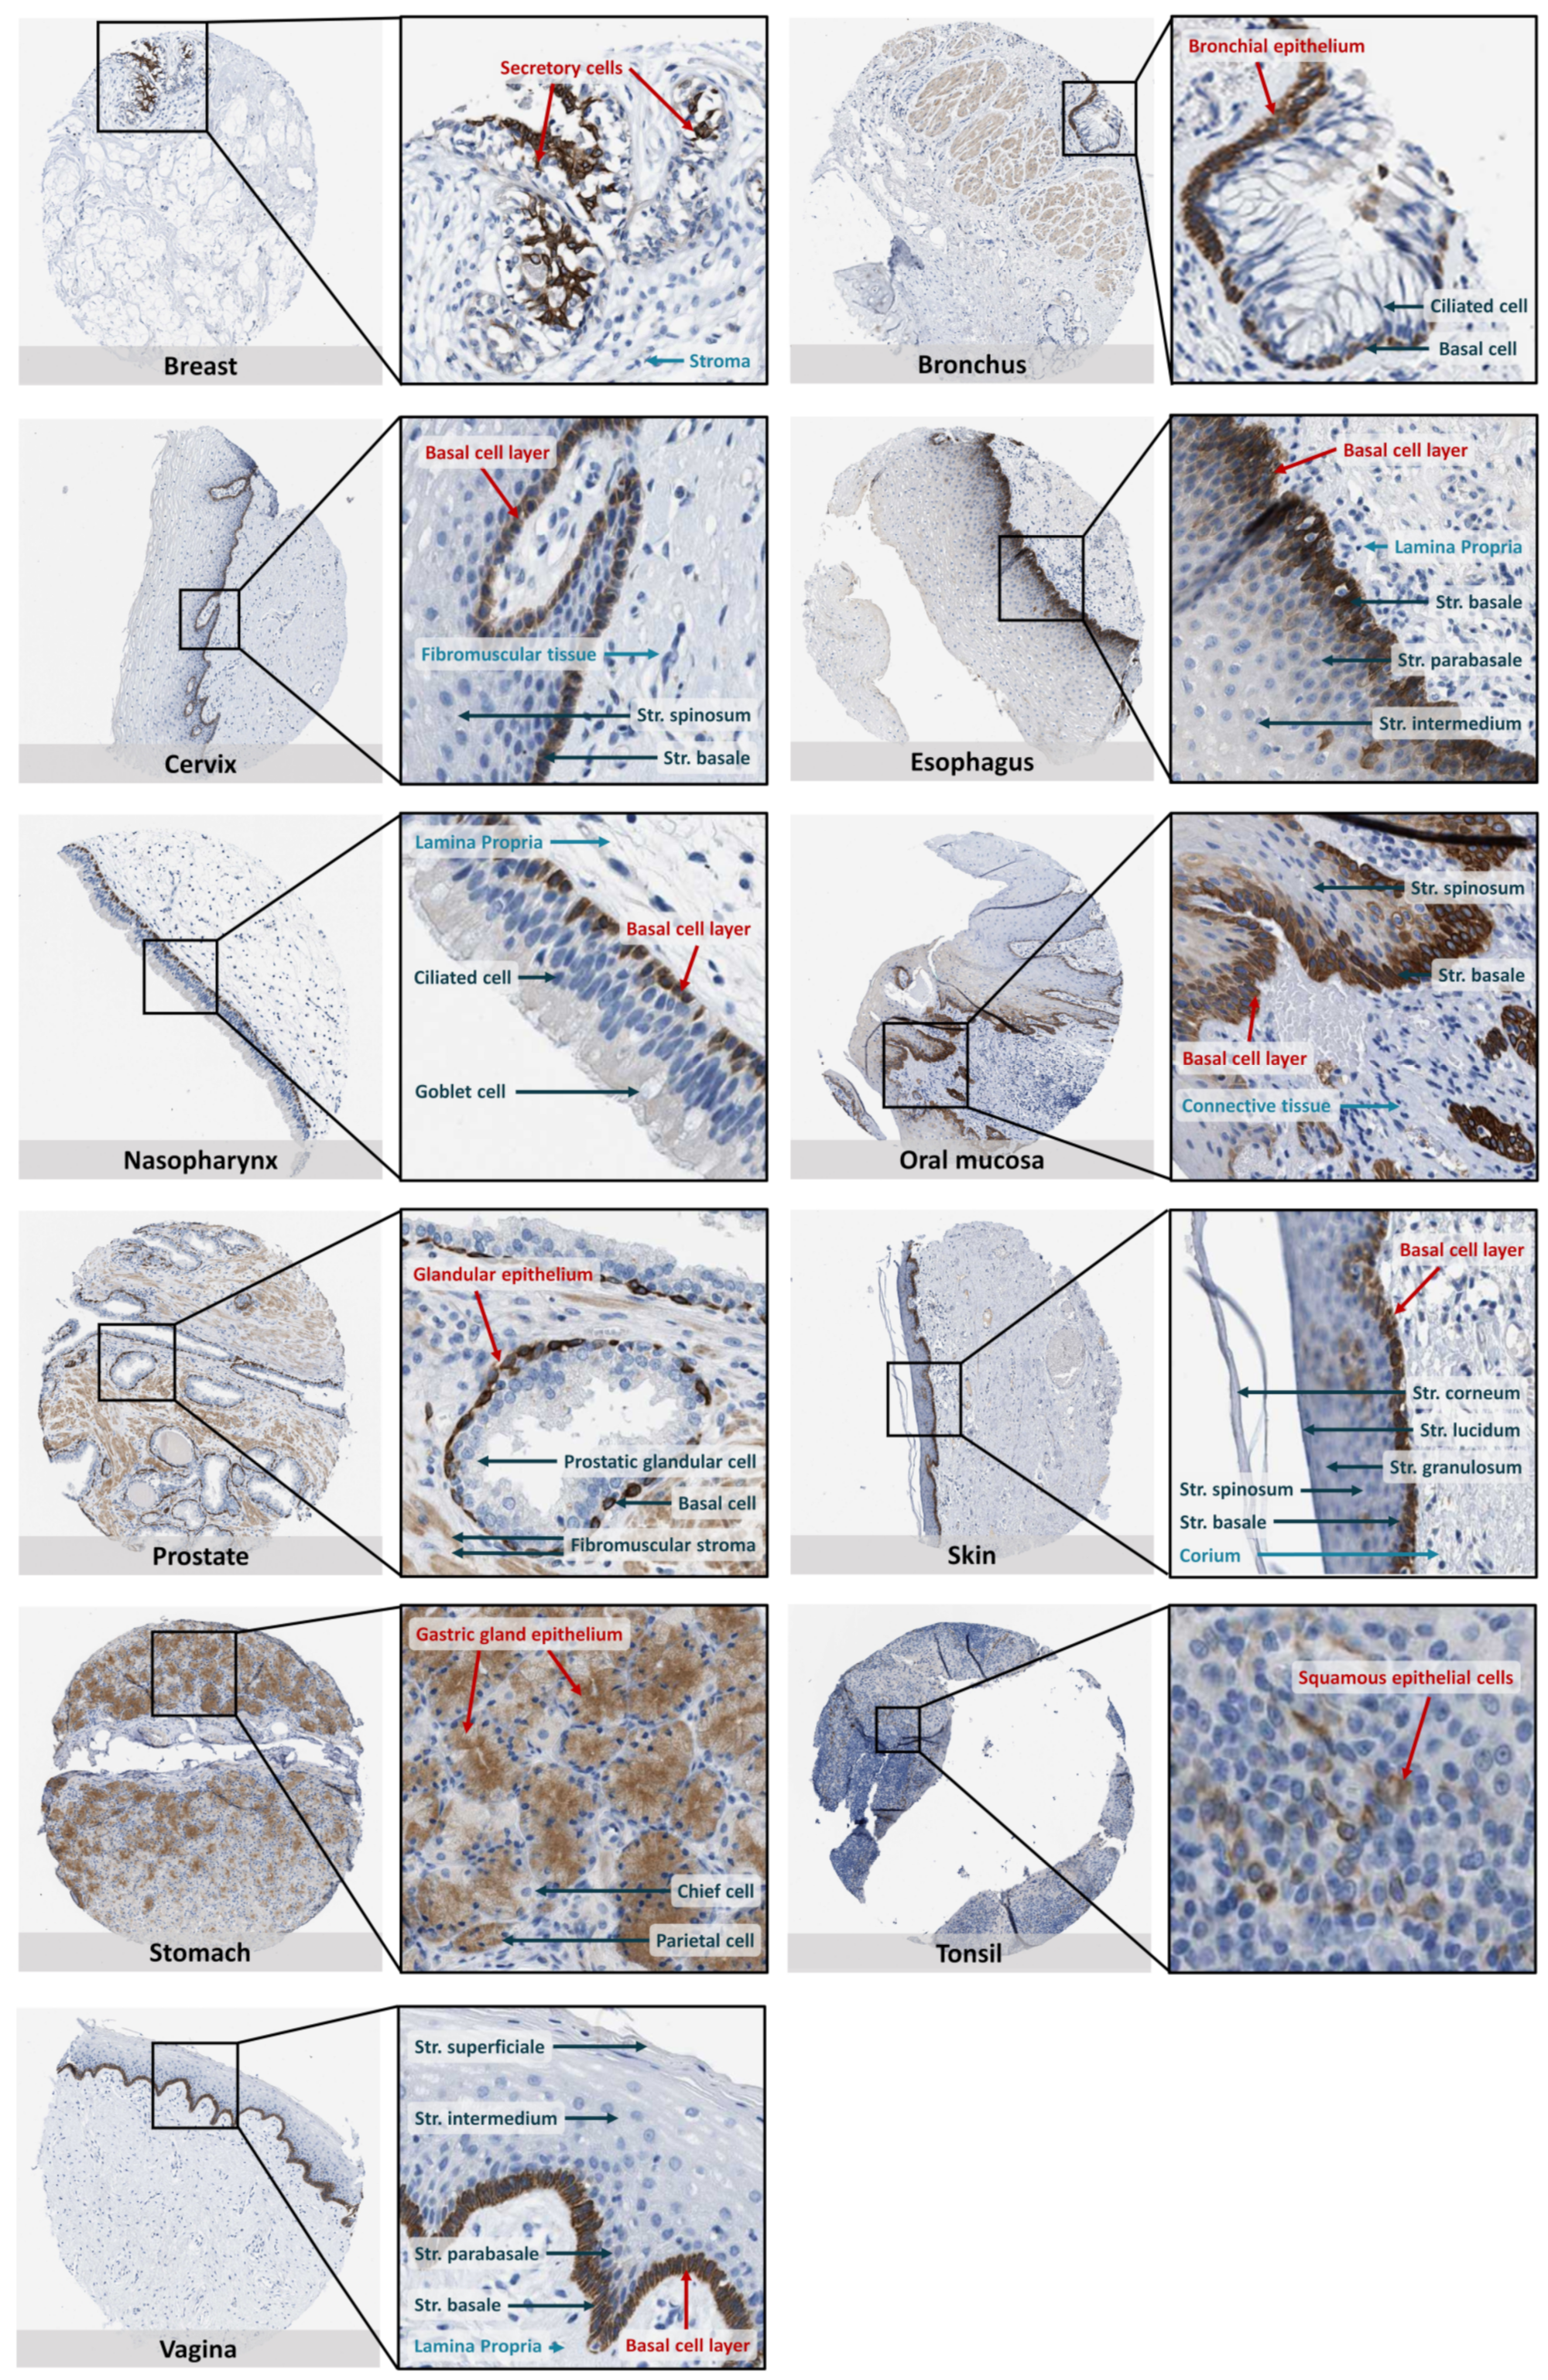
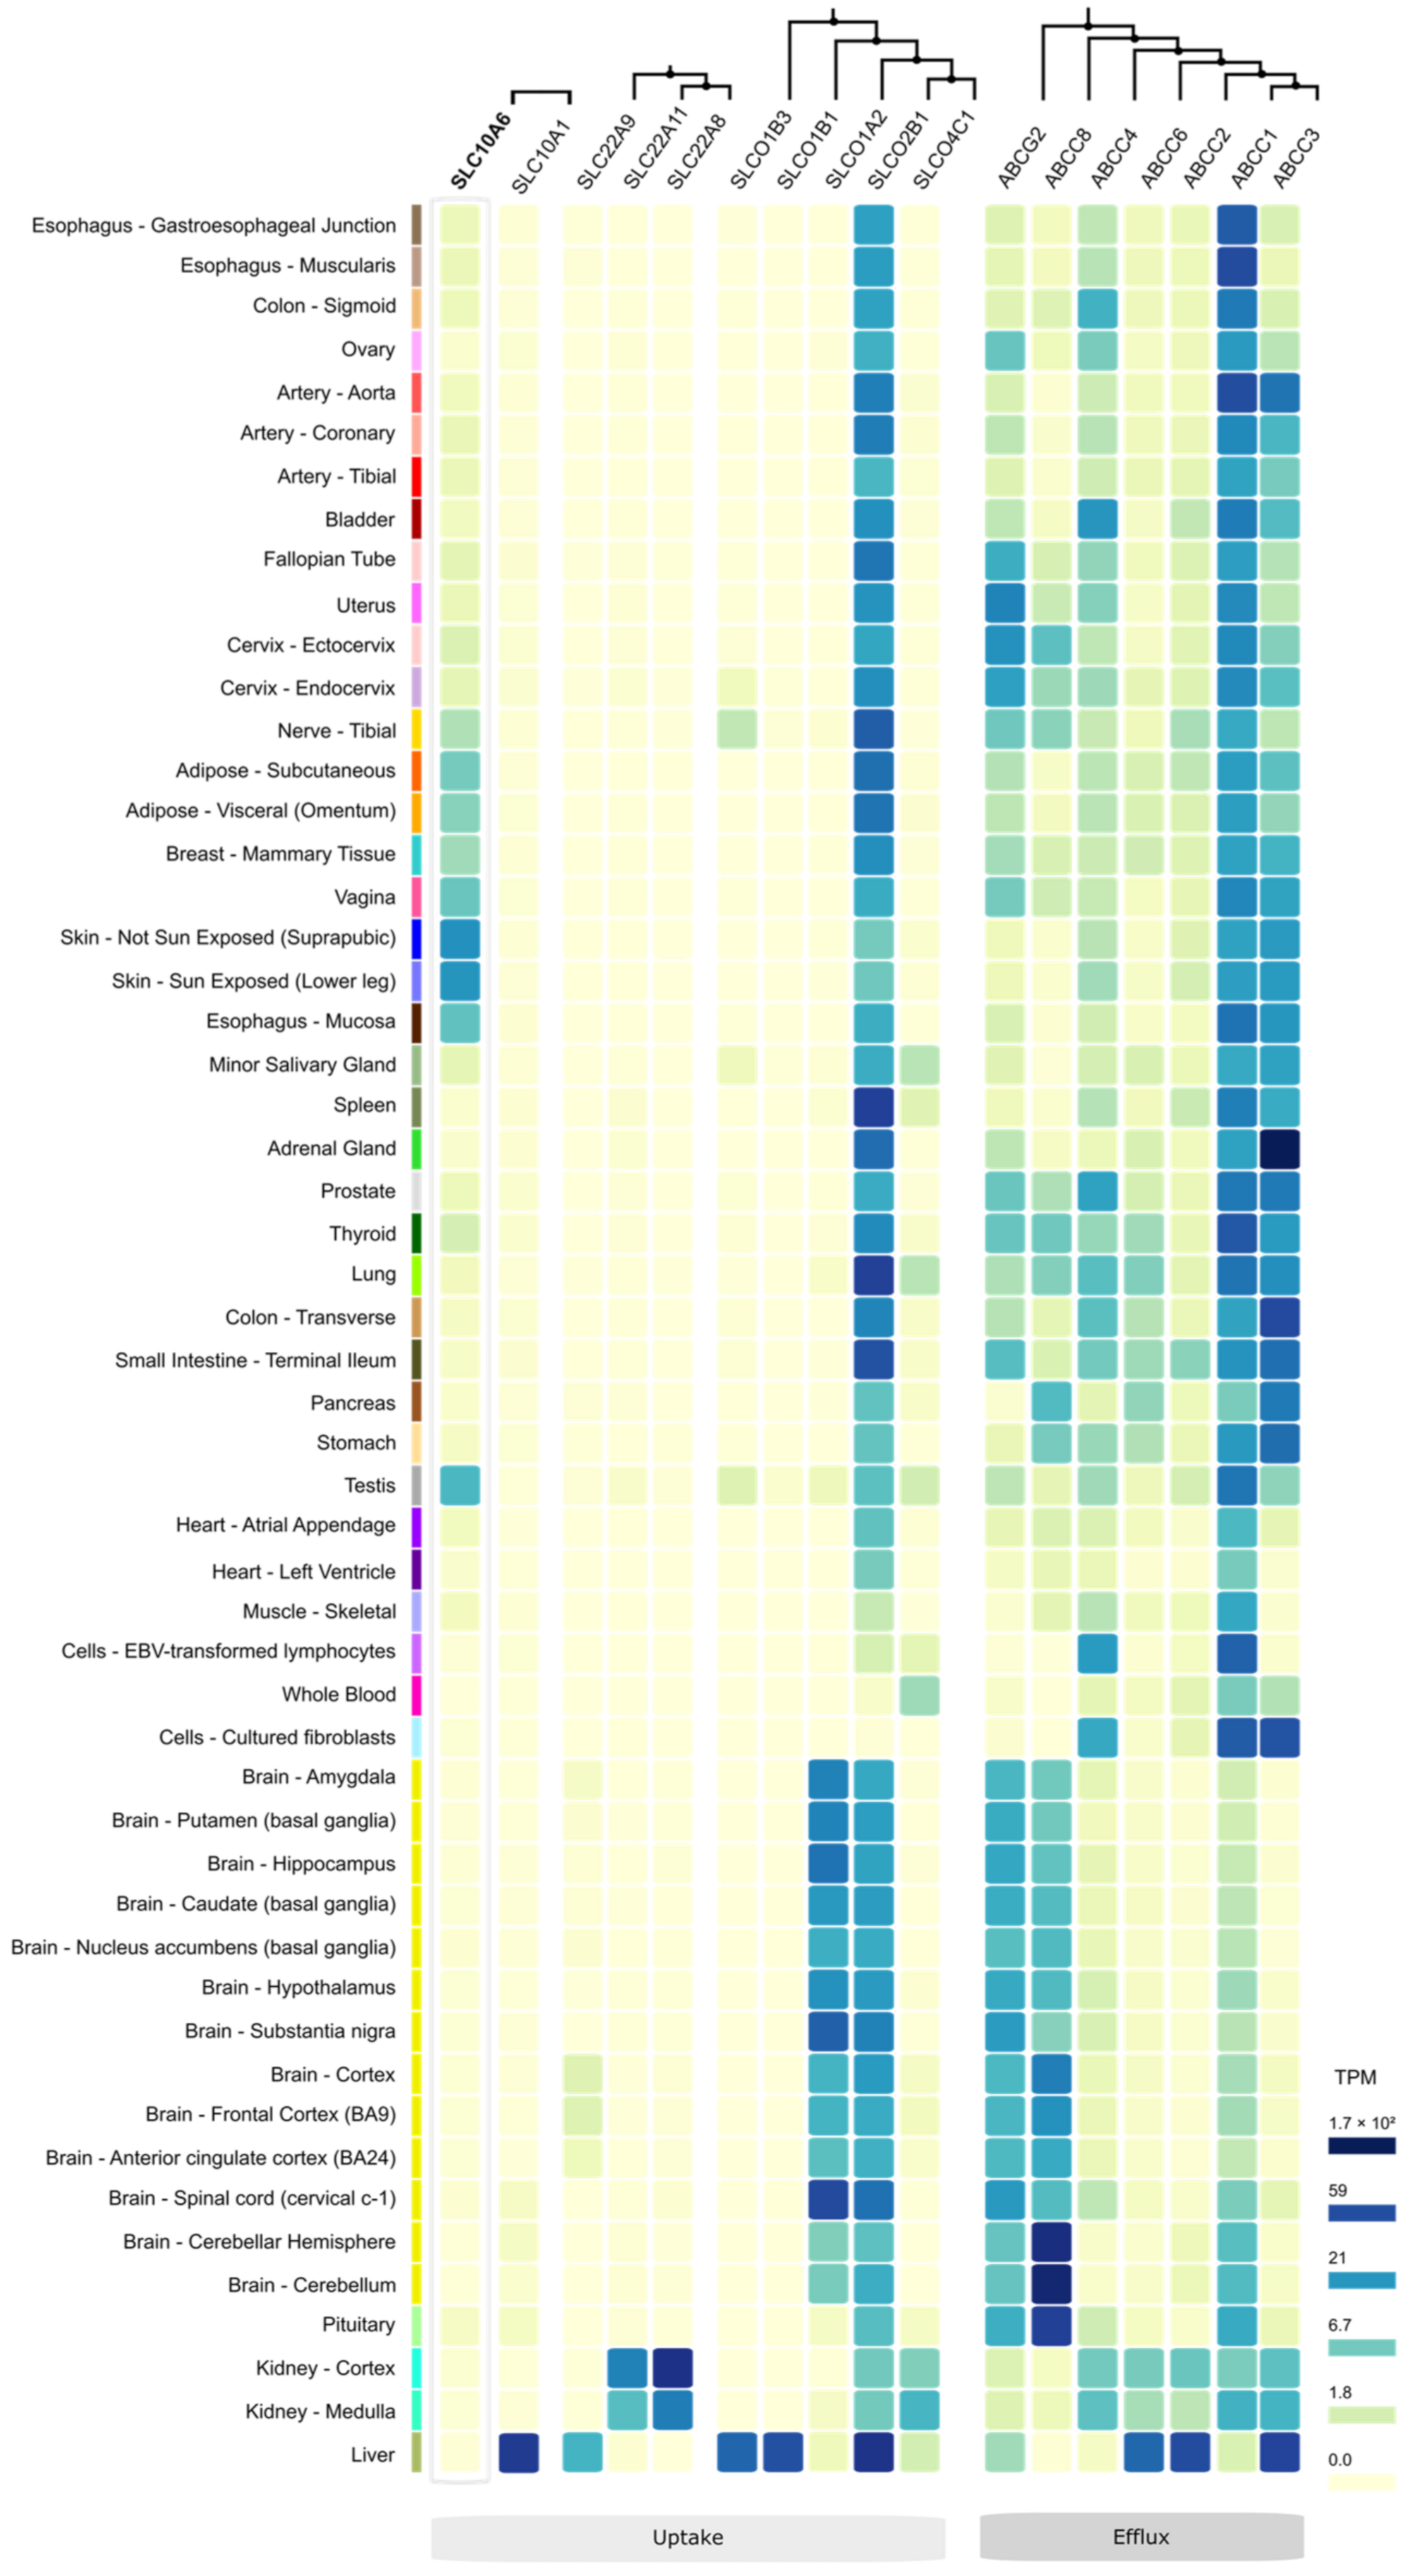
10. SOAT Tissue Expression Pattern

The first screening of the SOAT expression pattern was performed in 2007 by real-time PCR quantification of the SLC10A6 mRNA expression in a cDNA tissue panel comprising 16 major human organs [1]. Later, a larger human tissue cDNA panel comprising 24 organs was analyzed [13]. Both analyses revealed the highest SLC10A6 mRNA expression in the testis, and high expression levels in the skin, vagina, kidney, pancreas, placenta, mammary gland, lung, and heart. The high expression of the SLC10A6 mRNA transcript in the testis was further verified through RT-PCR analysis of human testicular biopsies [13]. Recently, more comprehensive SOAT protein and SLC10A6 mRNA expression data have become available through the Human Protein Atlas (HPA, www.proteinatlas.org), which provides genome-wide expression data obtained through systematic proteomic and transcriptomic analyses. The SOAT protein and SLC10A6 mRNA expression data provided by the HPA are classified with an enhanced reliability score, which represents the highest level of reliability offered by the HPA. The expression data provided by the HPA are presented in Figure 5, Figure 6, Figure 9 and Figure 11. In addition, SLC10A6 mRNA expression data from the Genotype-Tissue Expression (GTEx) project (www.gtexportal.org (accessed on 29–31 March 2022 and on 20 June 2022)) were used. The GTEx is another database that provides genome-wide gene expression data. The GTEx data are shown in Figure 5 and Figure 7.
In Figure 5A, the HPA and GTEx SLC10A6 mRNA expression data are presented for 58 different human organs. The highest SLC10A6 mRNA expression levels were detected in the skin, esophagus, adipose tissue, vagina, testis, breast, cervix, and salivary gland. In addition, Figure 5A indicates all organs in which SOAT protein expression was detected by IHC, including the breast, bronchus, cervix, esophagus, nasopharynx, oral mucosa, prostate, skin, stomach, tonsil, and vagina. Figure 5B,C illustrate SOAT expression in females and males, respectively.
A more detailed analysis of the IHC images revealed a very specific and typical expression pattern for the SOAT, which was mainly localized to epithelial structures in different tissues (Figure 6). Here, the basal cell layer of all epithelial structures and the glandular cells in secretory structures showed intense SOAT immunoreactivity. Accordingly, high SOAT expression was detected in the basal cell layer of the bronchial epithelium, cervix epithelium, esophagus epithelium, nasopharyngeal epithelium, oral mucosa, skin, and vaginal epithelium. In addition, strong SOAT staining was detected in the ductal epithelium of the breast, glandular epithelium of the prostate, gastric gland epithelium of the stomach, and squamous epithelial cells of the tonsil (Figure 6).
Figure 5. SLC10A6 mRNA and SOAT protein expression in different human tissues. (A) Blue bars indicate SLC10A6 mRNA expression levels in 58 different human tissues. The raw data were obtained from two different deep-sequencing RNA-seq projects: the Human Protein Atlas (HPA) (www.proteinatlas.org, version V21.0, accessed on 29–31 March 2022) and the Genotype-Tissue Expression (GTEx) project (www.gtexportal.org, accessed on 29–31 March 2022). Values are presented as units of normalized transcripts per million (nTPM) [53]. The absolute numbers of samples per tissue are listed in Table S2. Values with nTPM < 0.1 were not included. Green bars indicate SOAT protein expression according to the HPA. These data were derived from SOAT antibody-based protein profiling using immunohistochemistry (IHC) (see Figure 6). In tissues where SOAT-specific antibody staining was detectable, a green bar is shown in the graph, regardless of the intensity of the staining. (B,C) Schematic representation of SOAT expression in the female body and male body, respectively. Tissues where only SLC10A6 mRNA expression was detected above a cutoff value of 1 nTPM or SOAT protein expression could be detected by IHC are labeled. Tissues in which both SLC10A6 mRNA (>1 nTPM) and SOAT protein expression were detected are marked in dark red. Figure created with BioRender.com.
Ijms 24 09926 g005
Figure 6. SOAT protein expression in histological sections from non-neoplastic and morphologically normal tissues. All histological images were obtained from the online Human Protein Atlas database (HPA) (www.proteinatlas.org, version V21.0, accessed on 29 March 2022) and represent immunohistochemistry (IHC) detection of the SOAT protein (antibody HPA016662) with 3,3’-diaminobenzidine staining and hematoxylin counterstaining [53,54,55,56]. The URLs of all presented images are listed in Table S3. In total, 44 different tissues were analyzed. Representative IHC images are shown (an overview and a magnification of each) in which SOAT-staining was cell-type specific. SOAT protein expression is indicated with red arrows. Additionally, typical epithelial and mesenchymal structures of tissues are marked in light and dark blue, respectively.
Ijms 24 09926 g006
In addition, individual IHC studies have localized the SOAT protein in germ cells at various stages in human testis biopsies showing normal spermatogenesis [13]. In the human breast, SOAT expression was detected in the ductal epithelium [51], and in the human placenta, SOAT immunoreactivity was detected in the maternal-facing microvillous plasma membrane of syncytiotrophoblasts and vessel endothelium [49]. In contrast, SOAT immunoreactivity was weak in mesenchymal cells and was observed, for example, in the fibromuscular stroma of the prostate (Figure 6). This typical cell-type specific expression pattern of the SOAT was also confirmed by quantitative single-cell transcriptome data from the HPA, which showed dominant SOAT expression in epithelial and endothelial cells of the breast, endometrium, esophagus, prostate, and skin, as well as in early and late spermatids of the testis. In contrast, generally low or absent SOAT expression was detected in mesenchymal cells such as fibroblasts and smooth muscle cells (www.proteinatlas.org, version V21.0, accessed on 29–31 March 2022).

11. Other Steroid Sulfate Transporters

As outlined above, the intracrine formation of active steroids via the sulfatase pathway requires the cellular uptake and desulfation of sulfated steroid hormones in peripheral tissues. Therefore, the net import of sulfated steroids can be regarded as a balance between carrier-mediated steroid uptake and efflux [6,57]. Apart from the SOAT, many other uptake and efflux carriers such as DHEAS and E1S have been described that can transport sulfated steroid hormones [52,58]. These include uptake carriers from the organic anion transporting polypeptide (OATP) and organic anion transporter (OAT) carrier families SLCO and SLC22, as well as efflux carriers from the ATP-binding cassette (ABC) family (Table 4). According to the whole-genome transcriptome data from the GTEx project (Figure 7), some of these carriers show a specific expression pattern.
Figure 7. mRNA expression pattern of DHEAS/E1S uptake and efflux transporters. The raw data were obtained from the Genotype-Tissue Expression (GTEx) project (www.gtexportal.org, analysis release V8, dbGaP accession phs000424.v8. p2, accessed on 20 June 2022), via module expression > multi-gene query. Only steroid sulfate carriers were included for which Km values for DHEAS/E1S uptake or efflux are described in the literature (see Table 4). The phylogenetic relationships among the different carrier groups are indicated at the top of the diagram. Color-coding of the tissue expression is based on the mRNA expression level in transcripts per million (TPM) (see legend on the right).
Ijms 24 09926 g007
Table 4. Uptake carriers of sulfated steroids.
GeneProtein (Syn.)DHEAS Transport KmE1S Transport KmOther Selected Endogenous SubstratesSubstrate PatternTransport Mode
SLC10A1NTCP (LBAT)56.1 µM [14]57.6 µM [14]Bile acids, taurolithocholic acid [14]Multi-specificActive,
Na+-dependent
SLC10A6SOAT28.7 µM [1]12.0 µM [1]Testosterone sulfate, taurolithocholic acid [3,14]SpecificActive,
Na+-dependent
SLCO1A2OATP1A2 (OATP-A)7 µM [59,60]16–59 µM [59,61,62,63]Bile acids, bilirubin, thyroid hormones, prostaglandin E2 [64]Multi-specificNa+-independent
SLCO1B1OATP1B1 (OATP-C)22 µM [65,66]0.09–45 µM [59,65,67,68]Bile acids, bilirubin, thyroid hormones, glucuronide conjugates, prostaglandin E2 [66,69]Multi-specificNa+-independent
SLCO1B3OATP1B3 (OATP8)>30 µM [65]3–58 µM [70,71,72]Bile acids, bilirubin, thyroid hormones, leukotriene C4 [73]Multi-specificNa+-independent
SLCO2B1OATP2B1 (OATP-B)9 µM [74]1.56–21 µM [67,74,75,76]Taurocholic acid, prostaglandins, leukotriene C4, thromboxane B2 [77]Multi-specificNa+-independent
SLCO4C1OATP4C1 (OATP-H)-26.6 µM [78]Bile acids, conjugated steroids, thyroid hormones, eicosanoids [77,79]Multi-specificNa+-independent
SLC22A8OAT313 µM [80]2.2–21.2 µM [81]Creatinine, cAMP, glutarate, oxalate, prostaglandins E2 and F [77]Multi-specificNa+-independent
SLC22A11OAT40.63–29.2 µM [81]1.01–21.7 µM [81]Creatinine, glutarate, prostaglandins E2 and F [77]Multi-specificNa+-independent
SLC22A9OAT72.2 µM [81]8.7 µM [81]Creatinine, cGMP [82]Multi-specificNa+-independent
Note: Only the carriers for which Km values for the transport of DHEAS or E1S are described in the literature are listed.
The carriers NTCP (SLC10A1), OAT7 (SLC22A9), OATP1B1 (SLCO1B1), and OATP1B3 (SLCO1B3) are predominantly expressed in the liver. OAT4 (SLC22A11), OAT3 (SLC22A8), and OATP4C1 (SLCO4C1) are mostly found in the kidney, and OATP1A2 (SLCO1A2) is typically expressed in the brain. In contrast, OATP2B1 (SLCO2B1) is broadly expressed in nearly all human tissues. Regarding steroid sulfate efflux, most of the ABC carriers involved, namely ABCG2, ABCC8, ABCC4, ABCC6, ABCC2, ABCC1, and ABCC3, show broad expression patterns with a preference for the brain (ABCG2, ABCC8), liver (ABCC6, ABCC2), or peripheral organs (ABCC1, ABCC3) (Figure 7). Compared to the steroid sulfate uptake carriers from the OATP and OAT families, the SOAT exhibits some specific features (see Table 4): (1) SOAT transport is active and strictly sodium-dependent, (2) its substrate pattern is very much restricted to sulfated steroid hormones (Table 2), and (3) the SOAT is typically expressed in many steroid-responsive tissues such as the testis, skin, vagina, breast, and adipose tissue (Figure 5, Figure 6 and Figure 7) [52].

12. Role of SOAT in Health and Disease

Studies over the past two decades have revealed a potential role of the SOAT in the overall regulation of steroid-responsive tissues and the development of certain diseases, with a particular focus on male fertility/infertility, placenta function during pregnancy, breast carcinogenesis, and chronic inflammation during obesity. In the next section, the key findings of these studies are summarized and discussed in the context of the regulation of SOAT expression in various diseases.

12.1. Male Fertility/Infertility

At the mRNA level, the SOAT has shown very high expression levels in the testes of both humans and mice, and its expression has been analyzed more closely at both the mRNA and protein levels in both species. In human testis biopsies showing normal spermatogenesis, SOAT protein expression was detected through IHC in zygotene primary spermatocytes of stage V, pachytene spermatocytes across all stages (I–V), secondary spermatocytes of stage VI, and round spermatids (step 1 and step 2) in stages I and II [13]. This clear germ cell-specific expression pattern of the SOAT in the human testis was further verified through laser-assisted cell picking (LACP) experiments of paraffin-embedded tissues, followed by RT-PCR expression analysis. These experiments only showed SOAT expression in material picked from the seminiferous tubules (containing the peritubular cells, Sertoli cells, and germ cells) but not from the interstitial tissue (encompassing Leydig cells, blood vessels, and connective tissue) [13]. In addition, in mice, the Soat showed a clear germ cell-specific expression pattern, and IHC analysis revealed its localization in primary leptotene and pachytene spermatocytes, as well as in residual bodies of elongating spermatids at stages X and XI of spermatogenesis [4].
Due to this specific expression pattern in the testis, we proposed that the SOAT plays a role in germ cell differentiation toward mature spermatids and, consequently, in male fertility. This was supported by the finding that SOAT expression was significantly lower or even absent in severe disorders of spermatogenesis, characterized by the arrest of spermatocytes or spermatogonia, or the total loss of germ cells (so-called Sertoli cell-only syndrome) [13]. This drop in SOAT expression may play a role in the local supply of sulfated steroid hormones and the overall regulation of steroids during germ cell differentiation and thus may affect male fertility [13]. However, later fertility studies conducted in Slc10a6 knockout mice (see Section 13) showed that the impairment in Soat-mediated transport of sulfated steroids in the testis did not induce infertility [83].
In humans, a genotype–phenotype correlation study was performed on 20 subjects with normal spermatogenesis and 26 subjects with hypospermatogenesis. All of them were genotyped for the transport of the dysfunctional L204F SOAT polymorphism to compare the allelic frequencies between the two groups [35]. However, both groups showed nearly identical frequencies of the SOAT-L204F polymorphism, with ∼10% heterozygous and ∼5% homozygous subjects, indicating that this particular polymorphism shows no causal relationship with hypospermatogenesis in men. However, lifelong SOAT/Soat knockout, downregulation, or dysfunction might be compensated for by an upregulation of other steroid sulfate carriers, which could conceal the effects and thus make the physiological and pathophysiological role of SOAT/Soat in spermatogenesis unclear (Figure 8, testis).

12.2. Placenta Function during Pregnancy

It has been known for a long time that blood concentrations of the estrogens estrone, estradiol, and estriol markedly change in women during pregnancy [84,85]. As an example, maternal serum concentrations of estriol significantly increase in the final months of pregnancy, peaking just before birth [49]. During pregnancy, estriol is produced by the so-called fetoplacental unit. This involves the conversion of DHEAS produced by the fetal adrenals to 16α-DHEAS in the fetal liver, followed by its uptake into placental syncytiotrophoblasts, its desulfation by the steroid sulfatase, and finally, its conversion to estriol, which is then released into the maternal compartment. In addition, DHEAS from the fetal and maternal origin is converted to estradiol [86,87] (Figure 8, placental barrier). As DHEAS and 16α-DHEAS are negatively charged molecules, they need carrier-mediated uptake to enter the syncytiotrophoblast. In this process, SOAT is involved in the uptake of DHEAS via the maternal-facing microvillous plasma membrane of the syncytiotrophoblast and in the transport across the fetal blood vessel endothelium. In addition, the carriers OATP2B1 and OAT4 are involved in the transport of DHEAS and 16α-DHEAS across the basal plasma membrane of the syncytiotrophoblast, which is oriented toward the fetal circulation [49,88,89,90,91]. Low estriol concentrations during pregnancy have been correlated with fetal disorders such as Down syndrome or anencephaly [92,93]. Based on the mechanism for placental estriol synthesis outlined above, genetic defects in one of the DHEAS/16α-DHEAS uptake carriers in the syncytiotrophoblast could be a possible reason for low maternal estriol levels. This should be considered in future studies on maternal estriol levels during pregnancy.

12.3. Breast Cancer

Estrogens play a crucial role in the development and proliferation of hormone-dependent breast cancer by interacting with the estrogen receptor (ER) [51,94]. Accordingly, tamoxifen, which blocks the effect of estrogens on ER+ breast cancer cells, has been the cornerstone of endocrine breast cancer therapy for decades [95]. Due to the role of the SOAT in the cellular uptake of sulfated estrogen and androgen precursors such as E1S and DHEAS, this carrier may also be involved in the proliferation of estrogen-dependent breast cancer cells (Figure 8, breast). The SOAT showed relatively high expression levels in breast cancer tissue biopsies, showing no significant association with the tumor grade, stage, receptor status, or age of the patient [51].
In a study investigating the effect of SOAT-mediated E1S uptake into hormone-dependent T47D breast cancer cells, physiologically relevant concentrations of E1S significantly stimulated cell proliferation at high SOAT expression levels. This effect was completely reversed by the SOAT inhibitor 4-SMP. In addition, T47D cells with low SOAT expression levels showed significantly lower proliferation rates [51]. These data led to the conclusion that SOAT-mediated E1S uptake contributes to the overall cell proliferation of hormone-dependent breast cancer cells and that SOAT inhibitors have anti-proliferative potential. Inhibitors of SOAT from different chemical classes have already been identified. Based on the already established structure–activity relationships for some of them, more potent derivatives are expected to be developed in the near future.

12.4. Adiposity and Inflammation

Numerous studies have examined the relationship between overweight, central obesity, and plasma levels of DHEA and DHEAS [96,97,98,99,100,101], providing some valuable insights. For example, low serum levels of DHEAS have been associated with a high body mass index, central fat accumulation, and an increase in visceral fat [102,103,104,105]. Conversely, clinical trials have demonstrated that DHEA supplementation can help to decrease the total body fat mass, as well as the abdominal visceral and subcutaneous fat mass [106,107,108,109]. In vitro studies on adipocytes have revealed a stimulatory effect of DHEAS on lipolysis, suggesting that elevated levels of DHEAS may negatively influence lipid accumulation [103]. In addition, obesity has been associated with chronic low-grade inflammation [110]. Interestingly, Kosters et al. (2016) showed that in mice, the Slc10a6 mRNA expression level was dramatically increased in liver and white adipose tissue after lipopolysaccharide (LPS)-induced inflammation [111]. Based on this effect, an in vitro study with murine 3T3-L1 adipocytes was performed to investigate the effect of Soat expression on adipogenesis during LPS-induced inflammation (Figure 8, adipose tissue) [112]. It was demonstrated that LPS treatment of murine 3T3-L1 adipocytes significantly increased Slc10a6 mRNA levels. In addition, the combined LPS and DHEAS treatment of cells reduced the accumulation of intracellular lipid droplets and the overall lipid accumulation, most likely via the increased DHEAS uptake after Soat upregulation [112]. Similarly, the LPS treatment of mice led to significantly higher Slc10a6 mRNA levels in white intra-abdominal, subcutaneous, and perirenal adipose tissue compared to untreated control mice [112]. We, therefore, hypothesize that the overall expression level and import capacity of SOAT/Soat for DHEAS play a regulatory role in lipid accumulation and chronic inflammation in obesity.

12.5. SOAT Expression in Cancer Tissues

Based on experimental IHC data and data from the HPA, SOAT expression seems to be upregulated in different cancer types. In the case of breast cancer, strong SOAT immunoreactivity was detected in specimens showing ductal hyperplasia, intraductal papilloma, atypical ductal hyperplasia, intraductal carcinoma, and invasive ductal carcinoma [51]. In addition, strong SOAT immunoreactivity was detected in pancreas carcinoids, cervical cancer, head and neck cancer, lung cancer, skin cancer, and urothelial cancer (Figure 9). In some of these cancer types, the uptake of estrogen and androgen precursors via SOAT may contribute to the proliferation of tumor cells, as demonstrated for hormone-dependent T47D breast cancer cells [51].
To determine if SOAT expression is correlated with the survival probability of patients with specific types of cancer, the expression data from The Cancer Genome Atlas (TCGA) were re-analyzed using Kaplan–Meier analysis. The mean overall survival times were estimated and the differences were measured using the log-rank test, as shown in Figure 10, which shows a comparison of the survival probabilities of patients with either high or low SLC10A6 mRNA expression levels over time. The cutoff value between the high and low expression rates was defined to result in a maximum difference in survival between the two groups, as determined by the lowest log-rank p-value. As shown in Figure 10, high SOAT expression was significantly associated with a lower probability of overall survival for patients with glioma, breast cancer, renal cancer, urothelial cancer, and endometrial cancer. The mean (95% CI) survival times (days) in these cancer types (high vs. low gene expression) were glioma: 431 (324–537) vs. 588 (456–719); breast cancer: 3918 (3266–4570) vs. 5199 (4557–5841); renal cancer: 2937 (2742–3132) vs. 4475 (4066–4885); urothelial cancer: 1474 (1017–1931) vs. 2419 (2060–2779); and endometrial cancer: 3590 (2433–4747) vs. 4159 (3675–4643). These data support the concept that pharmacological inhibitors of SOAT may be beneficial for the overall survival of tumor patients, at least for the cancer types analyzed in Figure 10.
Figure 9. SOAT protein expression in histological sections from cancer tissues. All histological images were obtained from the online Human Protein Atlas (HPA) database (www.proteinatlas.org, version V21.0, accessed on 29 March 2022) and represent immunohistochemistry (IHC) detection of the SOAT protein (antibody HPA016662) with 3,3’-diaminobenzidine staining and hematoxylin counterstaining [53,54,55,56]. The URLs of all presented images are listed in Table S3. In total, 20 different cancer types from 216 patients were analyzed. Representative IHC images are shown (an overview and a magnification of each), where SOAT-specific staining occurred at a high (AD) to moderate (E,F) intensity. (A) Malignant carcinoid of the pancreas. (B) Squamous cell carcinoma of the cervix. (C) Adenocarcinoma of the salivary gland. (D) Basal cell carcinoma of the skin. (E) Squamous cell carcinoma of the lung. (F) High-grade urothelial carcinoma of the bladder.
Ijms 24 09926 g009
Figure 10. Probability of overall survival of patients with low or high SLC10A6 mRNA expression, visualized by Kaplan–Meier curves. Data derived from patients with glioma, breast cancer, renal cancer, urothelial cancer, and endometrial cancer. Graphs show the survival probability of patients as a function of time and low (blue curves) or high (red curves) SLC10A6 mRNA expression (Exp.). The raw SLC10A6 mRNA expression data were originally derived from The Cancer Genome Atlas (TCGA) and were obtained from the pathology section in the Human Protein Atlas (HPA) (www.proteinatlas.org, version V21.0, accessed on 30 March 2022). The SLC10A6 mRNA expression levels were analyzed as fragments per kb of exon per million mapped fragments (FPKM) for all available 17 cancer types, namely glioma, thyroid cancer, lung cancer, colorectal cancer, head and neck cancer, stomach cancer, liver cancer, pancreatic cancer, renal cancer, urothelial cancer, prostate cancer, testis cancer, breast cancer, cervical cancer, endometrial cancer, ovarian cancer, and melanoma. Based on the FPKM SLC10A6 mRNA expression data, patients were divided into two groups (low and high expression), and the relationship between prognosis (survival) and gene expression (FPKM) was examined. For this purpose, the HPA provided a cutoff value that could effectively discriminate between high and low SLC10A6 mRNA expression. This cutoff value corresponded to the FPKM value, which was chosen to maximize the difference in survival between the two groups with the lowest log-rank p-value. Only the cancer types with a significant difference in the probability of overall survival between patients with low and high SLC10A6 mRNA expression are shown. Kaplan–Meier curves were used to estimate survival, and the log-rank (Mantel–Cox) test was used to compare the times to events between the low- and high-expression groups.
Ijms 24 09926 g010

13. Slc10a6 Knockout Mouse Model

To elucidate the physiological role of the SOAT in the body, we established a Slc10a6 knockout mouse model with a C57BL/6N genetic background via homologous recombination-based target deletion of coding exons 2 and 3 [83]. Although there were some differences between the quantitative expression levels of the mouse Slc10a6 and the human SLC10A6 transcripts, the organ expression patterns with high expression levels in the skin, testis, and lung were generally consistent between both species [1,4]. Due to the high Soat expression in germ cells of the testis, we first analyzed spermatogenesis and performed reproductive phenotyping in these mice. As there were no significant differences in the number of offspring, infantile mortality, vitality of the offspring, gender distribution, or body weight at the time of weaning between Slc10a6(+/+) and Slc10a6(−/−) mice, the Soat knockout mice were considered to have a normal reproductive phenotype. In addition, there were no significant differences in testis weight, frequency, and duration of spermatogenesis, as well as sperm motility and velocity. However, a more detailed histomorphological analysis revealed that impaired spermatogenesis, total germ cell aplasia, and missing generations of germ cells all occurred more frequently in the Slc10a6(−/−) mice, but without reaching statistical significance [83].
As Soat is a specific steroid sulfate transporter in mice as well [4], changes in the serum steroid levels were expected. Thus, the serum levels of the Slc10a6(+/+) and Slc10a6(−/−) mice were comprehensively analyzed for 12 sulfo-conjugated and 9 unconjugated steroids using LC-MS/MS or GC-MS/MS analysis [83,113]. However, most steroids were either completely absent, detected only in certain samples, or present at concentrations below the limit of quantification. Therefore, statistical data analysis could only be performed for testosterone, corticosterone, and cholesterol sulfate. Interestingly, cholesterol sulfate (CS) was detected in the serum at relatively high concentrations of ~1000–2500 ng/mL and showed significantly higher levels in male Slc10a6(−/−) knockout mice compared to wild-type mice. However, this effect was confined to male mice [83]. Of note, there was also a trend toward lower testosterone levels in the serum of the Slc10a6(−/−) knockout mice, whereas testosterone was nearly absent from the serum of the female mice.
Since peripheral tissues such as skin and adipose tissue may also be active in intracrine steroid synthesis, we additionally investigated potential differences in the adipose tissue and lipid metabolism between Slc10a6(+/+) and Slc10a6(−/−) mice [112]. Immunofluorescence studies confirmed the expression of the Soat protein in the plasma membrane of white, subcutaneous, and brown adipocytes, reflecting the high SOAT/Soat mRNA expression levels in these tissues. Hence, the total body weight; mass of white intra-abdominal, subcutaneous, and brown adipose tissue; adipocyte size; and serum levels of the three adipokines, adiponectin, leptin, and resistin, were examined in Soat knockout and wild-type mice. Although there was only a trend for higher adipose tissue weights in the male Slc10a6(−/−) mice, significant differences were detected in the adipocyte size. Here, female Slc10a6(−/−) mice showed significantly larger adipocytes in white and subcutaneous adipose tissue in contrast to Slc10a6(+/+) mice. In addition, male Slc10a6(−/−) mice showed significantly larger adipocytes in brown adipose tissue and a trend toward larger adipocytes in white and subcutaneous adipose tissue. All other parameters investigated did not show any significant differences between the Slc10a6(−/−) and Slc10a6(+/+) mice.

14. Cell Models

In addition to the Soat knockout mouse model, cell lines with naturally high SOAT expression are valuable tools for characterizing the SLC10A6 expression and functional regulation of this membrane carrier. In these cell lines, the inducers and repressors of SLC10A6 mRNA expression can be investigated, as well as the cellular metabolism of sulfated steroid hormones imported via the SOAT. Systematic genome-wide expression data exist for several human cell lines in the Human Protein Atlas (Figure 11A, Table 5). In the case of the SOAT, several cell lines derived from skin and mesenchymal tissues show relatively high mRNA expression levels >1 nTPM, namely HaCaT, BJ, and BJ hTERT+. In particular, the human skin-derived cell line HaCaT seems to be very promising for SOAT/SLC10A6 expression studies, as this cell line was originally derived from skin keratinocytes and, therefore, could present an in vitro skin model for SOAT research. In addition, the cell lines ASC diff (from adipose stroma cells), HBEC3-KT (from bronchial epithelial cells), and HeLa (from cervical epithelial cells) are of interest, as they all reflect the in vivo expression pattern of human SOAT.
Figure 11. SLC10A6 and STS mRNA expression in different cell lines. The raw data were obtained from the cell line section of the Human Protein Atlas (HPA) (www.proteinatlas.org, version V21.0, accessed on 31 March 2022) that contains expression data of 69 different cell lines. Values are presented as units of normalized transcripts per million (nTPM) [53]. (A) Grouping of the cell lines based on the original organ they were obtained from. Organs from which single cell lines showed nTPM values >1 are highlighted in green. Organs from which single cell lines showed intermediate SLC10A6 expression (nTPM >0 and <1) are labeled in blue. Organs from which none of the established cells showed any SOAT expression are indicated in grey. (B) For all cell lines with significant SLC10A6 mRNA expression (dark-blue bars), expression of STS is additionally provided (light-blue bars). Figure created with BioRender.com.
Ijms 24 09926 g011
In contrast, the cell lines BJ, BJ hTERT+, HSkMC, hTCEpi, U-266/70, and U-266/84 appear to be less suitable for representative experiments on the SOAT since they do not fully reflect the in vivo tissue- and cell-type-specific SLC10A6/SOAT expression pattern. As mentioned above, the SOAT is considered to act in concert with steroid sulfatase to supply active estrogens and androgens to peripheral tissues. Therefore, in addition to the SOAT, studies focusing on the sulfatase pathway should also show sufficient expression of STS in the respective cell line. Data from the HPA show that STS mRNA is expressed in all cell lines that also express SLC10A6 mRNA, as shown in (Figure 11B). These data underline the suitability of the above-mentioned cell lines as suitable in vitro models for SOAT research.

15. Summary and Further Perspectives

Over the last two decades, much has been learned about the expression and function of the SOAT. The structural requirements for SOAT substrates are quite clear and are mostly restricted to 3′- and 17′-monosulfated steroid hormones. Several studies have identified SOAT inhibitors from different chemical classes and a valid pharmacophore model for SOAT inhibitors has been developed. Based on this, more potent and specific SOAT inhibitors can be developed using approaches such as optimized virtual library screening, which allows for the identification of novel inhibitors from other chemical classes.
The role of the SOAT within the concept of intracrine steroid synthesis via the sulfatase pathway is already well-established, although the quantitative contribution of SOAT-mediated steroid sulfate import into specific target cells still requires further investigation. For hormone-dependent breast cancer cells, proof-of-concept SOAT inhibition has already revealed an anti-proliferative effect, inspiring further research on additional cancer cell lines and the development of more potent SOAT inhibitors for anti-proliferative therapy. The development of such pharmacological SOAT inhibitors should benefit from the already established drug developmental programs for the ASBT and NTCP inhibitors. These bile acid transport inhibitors are used, e.g., in the treatment of cholestatic liver disease, against chronic constipation, or as cholesterol-lowering therapy [9]. Indeed, some of the NTCP and ASBT inhibitors have significant cross-reactivity against the SOAT (e.g., betulinic acid, BSP, troglitazone, S 1647, or S 3740).
The Soat knockout mouse model has been established and is available for further research on the significance of the Soat in the context of organs. However, this model has a limitation, that is, DHEAS, which is the predominant sulfated steroid hormone in humans, is almost absent in the mouse. For in vitro studies, several cell lines seem to be suitable for studying the regulation of SOAT expression and the quantitative contribution of, e.g., steroid sulfate transport to the cellular steroid profile and regulation.

Supplementary Materials

The supporting information can be downloaded at https://www.mdpi.com/article/10.3390/ijms24129926/s1.

Author Contributions

M.W. and J.G. wrote the manuscript; M.W., E.K. and J.B. created the figures; Z.A. and E.K. analyzed the data for certain cancer types of the TCGA and assessed the histological sections of cancer tissue images. All authors have read and agreed to the published version of the manuscript.

Funding

This research received no external funding.

Institutional Review Board Statement

Not applicable.

Informed Consent Statement

Not applicable.

Data Availability Statement

Publicly available datasets were used in this study. These data can be found at www.proteinatlas.org (accessed on 29–31 March 2022) (keyword: SLC10A6) and www.gtexportal.org (accessed on 29–31 March 2022 and 20 June 2022) (keyword: SLC10A6).

Acknowledgments

The authors thank Christopher Neelen for providing the docking analyses for DHEAS at the three homology models of SOAT protein. The authors also thank Dariusz Zakrzewicz for his help in creating the membrane topology models, and Edda Wacker for proofreading. The Genotype-Tissue Expression (GTEx) project was supported by the Common Fund of the Office of the Director of the National Institutes of Health, and by NCI, NHGRI, NHLBI, NIDA, NIMH, and NINDS.

Conflicts of Interest

The authors declare no conflict of interest.

References

  1. Geyer, J.; Döring, B.; Meerkamp, K.; Ugele, B.; Bakhiya, N.; Fernandes, C.F.; Godoy, J.R.; Glatt, H.; Petzinger, E. Cloning and functional characterization of human sodium-dependent organic anion transporter (SLC10A6). J. Biol. Chem. 2007, 282, 19728–19741. [Google Scholar] [CrossRef] [Green Version]
  2. Geyer, J.; Godoy, J.R.; Petzinger, E. Identification of a sodium-dependent organic anion transporter from rat adrenal gland. Biochem. Biophys. Res. Commun. 2004, 316, 300–306. [Google Scholar] [CrossRef] [PubMed]
  3. Grosser, G.; Bennien, J.; Sanchez-Guijo, A.; Bakhaus, K.; Döring, B.; Hartmann, M.; Wudy, S.A.; Geyer, J. Transport of steroid 3-sulfates and steroid 17-sulfates by the sodium-dependent organic anion transporter SOAT (SLC10A6). J. Steroid Biochem. Mol. Biol. 2018, 179, 20–25. [Google Scholar] [CrossRef] [PubMed]
  4. Grosser, G.; Fietz, D.; Gunther, S.; Bakhaus, K.; Schweigmann, H.; Ugele, B.; Brehm, R.; Petzinger, E.; Bergmann, M.; Geyer, J. Cloning and functional characterization of the mouse sodium-dependent organic anion transporter Soat (Slc10a6). J. Steroid Biochem. Mol. Biol. 2013, 138, 90–99. [Google Scholar] [CrossRef] [PubMed]
  5. Strott, C.A. Sulfonation and molecular action. Endocr. Rev. 2002, 23, 703–732. [Google Scholar] [CrossRef]
  6. Mueller, J.W.; Gilligan, L.C.; Idkowiak, J.; Arlt, W.; Foster, P.A. The Regulation of Steroid Action by Sulfation and Desulfation. Endocr. Rev. 2015, 36, 526–563. [Google Scholar] [CrossRef]
  7. Fietz, D. Transporter for sulfated steroid hormones in the testis—Expression pattern, biological significance and implications for fertility in men and rodents. J. Steroid Biochem. Mol. Biol. 2018, 179, 8–19. [Google Scholar] [CrossRef]
  8. Döring, B.; Lutteke, T.; Geyer, J.; Petzinger, E. The SLC10 carrier family: Transport functions and molecular structure. Curr. Top. Membr. 2012, 70, 105–168. [Google Scholar] [CrossRef]
  9. Geyer, J.; Wilke, T.; Petzinger, E. The solute carrier family SLC10: More than a family of bile acid transporters regarding function and phylogenetic relationships. Naunyn Schmiedebergs Arch. Pharmacol. 2006, 372, 413–431. [Google Scholar] [CrossRef] [Green Version]
  10. Hagenbuch, B.; Meier, P.J. Molecular cloning, chromosomal localization, and functional characterization of a human liver Na+/bile acid cotransporter. J. Clin. Invest. 1994, 93, 1326–1331. [Google Scholar] [CrossRef] [Green Version]
  11. Wong, M.H.; Oelkers, P.; Dawson, P.A. Identification of a mutation in the ileal sodium-dependent bile acid transporter gene that abolishes transport activity. J. Biol. Chem. 1995, 270, 27228–27234. [Google Scholar] [CrossRef] [PubMed] [Green Version]
  12. Hagenbuch, B.; Dawson, P. The sodium bile salt cotransport family SLC10. Pflugers Arch. 2004, 447, 566–570. [Google Scholar] [CrossRef] [PubMed]
  13. Fietz, D.; Bakhaus, K.; Wapelhorst, B.; Grosser, G.; Gunther, S.; Alber, J.; Döring, B.; Kliesch, S.; Weidner, W.; Galuska, C.E.; et al. Membrane transporters for sulfated steroids in the human testis--cellular localization, expression pattern and functional analysis. PLoS ONE 2013, 8, e62638. [Google Scholar] [CrossRef] [PubMed]
  14. Grosser, G.; Müller, S.F.; Kirstgen, M.; Döring, B.; Geyer, J. Substrate Specificities and Inhibition Pattern of the Solute Carrier Family 10 Members NTCP, ASBT and SOAT. Front. Mol. Biosci. 2021, 8, 689757. [Google Scholar] [CrossRef] [PubMed]
  15. Claro da Silva, T.; Polli, J.E.; Swaan, P.W. The solute carrier family 10 (SLC10): Beyond bile acid transport. Mol. Aspects Med. 2013, 34, 252–269. [Google Scholar] [CrossRef] [Green Version]
  16. Burger, S.; Döring, B.; Hardt, M.; Beuerlein, K.; Gerstberger, R.; Geyer, J. Co-expression studies of the orphan carrier protein Slc10a4 and the vesicular carriers VAChT and VMAT2 in the rat central and peripheral nervous system. Neuroscience 2011, 193, 109–121. [Google Scholar] [CrossRef]
  17. Geyer, J.; Fernandes, C.F.; Döring, B.; Burger, S.; Godoy, J.R.; Rafalzik, S.; Hubschle, T.; Gerstberger, R.; Petzinger, E. Cloning and molecular characterization of the orphan carrier protein Slc10a4: Expression in cholinergic neurons of the rat central nervous system. Neuroscience 2008, 152, 990–1005. [Google Scholar] [CrossRef]
  18. Schmidt, S.; Moncada, M.; Burger, S.; Geyer, J. Expression, sorting and transport studies for the orphan carrier SLC10A4 in neuronal and non-neuronal cell lines and in Xenopus laevis oocytes. BMC Neurosci. 2015, 16, 35. [Google Scholar] [CrossRef] [Green Version]
  19. Larhammar, M.; Patra, K.; Blunder, M.; Emilsson, L.; Peuckert, C.; Arvidsson, E.; Ronnlund, D.; Preobraschenski, J.; Birgner, C.; Limbach, C.; et al. SLC10A4 is a vesicular amine-associated transporter modulating dopamine homeostasis. Biol. Psychiatry 2015, 77, 526–536. [Google Scholar] [CrossRef] [Green Version]
  20. Melief, E.J.; Gibbs, J.T.; Li, X.; Morgan, R.G.; Keene, C.D.; Montine, T.J.; Palmiter, R.D.; Darvas, M. Characterization of cognitive impairments and neurotransmitter changes in a novel transgenic mouse lacking Slc10a4. Neuroscience 2016, 324, 399–406. [Google Scholar] [CrossRef] [Green Version]
  21. Fernandes, C.F.; Godoy, J.R.; Döring, B.; Cavalcanti, M.C.; Bergmann, M.; Petzinger, E.; Geyer, J. The novel putative bile acid transporter SLC10A5 is highly expressed in liver and kidney. Biochem. Biophys. Res. Commun. 2007, 361, 26–32. [Google Scholar] [CrossRef] [PubMed]
  22. Godoy, J.R.; Fernandes, C.; Döring, B.; Beuerlein, K.; Petzinger, E.; Geyer, J. Molecular and phylogenetic characterization of a novel putative membrane transporter (SLC10A7), conserved in vertebrates and bacteria. Eur. J. Cell. Biol. 2007, 86, 445–460. [Google Scholar] [CrossRef] [PubMed]
  23. Ashikov, A.; Abu Bakar, N.; Wen, X.Y.; Niemeijer, M.; Rodrigues Pinto Osorio, G.; Brand-Arzamendi, K.; Hasadsri, L.; Hansikova, H.; Raymond, K.; Vicogne, D.; et al. Integrating glycomics and genomics uncovers SLC10A7 as essential factor for bone mineralization by regulating post-Golgi protein transport and glycosylation. Hum. Mol. Genet. 2018, 27, 3029–3045. [Google Scholar] [CrossRef] [PubMed]
  24. Dubail, J.; Huber, C.; Chantepie, S.; Sonntag, S.; Tuysuz, B.; Mihci, E.; Gordon, C.T.; Steichen-Gersdorf, E.; Amiel, J.; Nur, B.; et al. SLC10A7 mutations cause a skeletal dysplasia with amelogenesis imperfecta mediated by GAG biosynthesis defects. Nat. Commun. 2018, 9, 3087. [Google Scholar] [CrossRef] [Green Version]
  25. Laugel-Haushalter, V.; Bar, S.; Schaefer, E.; Stoetzel, C.; Geoffroy, V.; Alembik, Y.; Kharouf, N.; Huckert, M.; Hamm, P.; Hemmerle, J.; et al. A New SLC10A7 Homozygous Missense Mutation Responsible for a Milder Phenotype of Skeletal Dysplasia With Amelogenesis Imperfecta. Front. Genet. 2019, 10, 504. [Google Scholar] [CrossRef] [Green Version]
  26. Karakus, E.; Wannowius, M.; Müller, S.F.; Leiting, S.; Leidolf, R.; Noppes, S.; Oswald, S.; Diener, M.; Geyer, J. The orphan solute carrier SLC10A7 is a novel negative regulator of intracellular calcium signaling. Sci. Rep. 2020, 10, 7248. [Google Scholar] [CrossRef]
  27. Wannowius, M.; Karakus, E.; Geyer, J. Functional Analysis of Rare Genetic Variants in the Negative Regulator of Intracellular Calcium Signaling RCAS/SLC10A7. Front. Mol. Biosci. 2021, 8, 741946. [Google Scholar] [CrossRef]
  28. Hu, N.J.; Iwata, S.; Cameron, A.D.; Drew, D. Crystal structure of a bacterial homologue of the bile acid sodium symporter ASBT. Nature 2011, 478, 408–411. [Google Scholar] [CrossRef]
  29. Zhou, X.; Levin, E.J.; Pan, Y.; McCoy, J.G.; Sharma, R.; Kloss, B.; Bruni, R.; Quick, M.; Zhou, M. Structural basis of the alternating-access mechanism in a bile acid transporter. Nature 2014, 505, 569–573. [Google Scholar] [CrossRef] [Green Version]
  30. Asami, J.; Kimura, K.T.; Fujita-Fujiharu, Y.; Ishida, H.; Zhang, Z.; Nomura, Y.; Liu, K.; Uemura, T.; Sato, Y.; Ono, M.; et al. Structure of the bile acid transporter and HBV receptor NTCP. Nature 2022, 606, 1021–1026. [Google Scholar] [CrossRef]
  31. Goutam, K.; Ielasi, F.S.; Pardon, E.; Steyaert, J.; Reyes, N. Structural basis of sodium-dependent bile salt uptake into the liver. Nature 2022, 606, 1015–1020. [Google Scholar] [CrossRef] [PubMed]
  32. Liu, H.; Irobalieva, R.N.; Bang-Sorensen, R.; Nosol, K.; Mukherjee, S.; Agrawal, P.; Stieger, B.; Kossiakoff, A.A.; Locher, K.P. Structure of human NTCP reveals the basis of recognition and sodium-driven transport of bile salts into the liver. Cell. Res. 2022, 32, 773–776. [Google Scholar] [CrossRef] [PubMed]
  33. Park, J.H.; Iwamoto, M.; Yun, J.H.; Uchikubo-Kamo, T.; Son, D.; Jin, Z.; Yoshida, H.; Ohki, M.; Ishimoto, N.; Mizutani, K.; et al. Structural insights into the HBV receptor and bile acid transporter NTCP. Nature 2022, 606, 1027–1031. [Google Scholar] [CrossRef] [PubMed]
  34. Varadi, M.; Anyango, S.; Deshpande, M.; Nair, S.; Natassia, C.; Yordanova, G.; Yuan, D.; Stroe, O.; Wood, G.; Laydon, A.; et al. AlphaFold Protein Structure Database: Massively expanding the structural coverage of protein-sequence space with high-accuracy models. Nucleic Acids Res. 2022, 50, D439–D444. [Google Scholar] [CrossRef] [PubMed]
  35. Bakhaus, K.; Fietz, D.; Kliesch, S.; Weidner, W.; Bergmann, M.; Geyer, J. The polymorphism L204F affects transport and membrane expression of the sodium-dependent organic anion transporter SOAT (SLC10A6). J. Steroid Biochem. Mol. Biol. 2018, 179, 36–44. [Google Scholar] [CrossRef]
  36. Bennien, J.; Fischer, T.; Geyer, J. Rare genetic variants in the sodium-dependent organic anion transporter SOAT (SLC10A6): Effects on transport function and membrane expression. J. Steroid Biochem. Mol. Biol. 2018, 179, 26–35. [Google Scholar] [CrossRef]
  37. Al-Ansari, N.; Xu, G.; Kollman-Bauerly, K.; Coppola, C.; Shefer, S.; Ujhazy, P.; Ortiz, D.; Ma, L.; Yang, S.; Tsai, R.; et al. Analysis of the effect of intestinal resection on rat ileal bile Acid transporter expression and on bile Acid and cholesterol homeostasis. Pediatr. Res. 2002, 52, 286–291. [Google Scholar] [CrossRef]
  38. Bijsmans, I.T.; Bouwmeester, R.A.; Geyer, J.; Faber, K.N.; Van de Graaf, S.F. Homo- and hetero-dimeric architecture of the human liver Na(+)-dependent taurocholate co-transporting protein. Biochem. J. 2012, 441, 1007–1015. [Google Scholar] [CrossRef] [Green Version]
  39. Chothe, P.P.; Czuba, L.C.; Moore, R.H.; Swaan, P.W. Human bile acid transporter ASBT (SLC10A2) forms functional non-covalent homodimers and higher order oligomers. Biochim. Biophys. Acta Biomembr. 2018, 1860, 645–653. [Google Scholar] [CrossRef]
  40. Kramer, W.; Girbig, F.; Gutjahr, U.; Kowalewski, S.; Jouvenal, K.; Muller, G.; Tripier, D.; Wess, G. Intestinal bile acid absorption. Na(+)-dependent bile acid transport activity in rabbit small intestine correlates with the coexpression of an integral 93-kDa and a peripheral 14-kDa bile acid-binding membrane protein along the duodenum-ileum axis. J. Biol. Chem. 1993, 268, 18035–18046. [Google Scholar] [CrossRef]
  41. Noppes, S.; Müller, S.F.; Bennien, J.; Holtemeyer, M.; Palatini, M.; Leidolf, R.; Alber, J.; Geyer, J. Homo- and heterodimerization is a common feature of the solute carrier family SLC10 members. Biol. Chem. 2019, 400, 1371–1384. [Google Scholar] [CrossRef] [PubMed]
  42. Halgren, T. New method for fast and accurate binding-site identification and analysis. Chem. Biol. Drug. Des. 2007, 69, 146–148. [Google Scholar] [CrossRef]
  43. Schrodinger, LLC. Schrödinger Release 2022-4: LigPrep; Schrödinger, LLC: New York, NY, USA, 2021. [Google Scholar]
  44. Friesner, R.A.; Banks, J.L.; Murphy, R.B.; Halgren, T.A.; Klicic, J.J.; Mainz, D.T.; Repasky, M.P.; Knoll, E.H.; Shelley, M.; Perry, J.K.; et al. Glide: A new approach for rapid, accurate docking and scoring. 1. Method and assessment of docking accuracy. J. Med. Chem. 2004, 47, 1739–1749. [Google Scholar] [CrossRef] [PubMed]
  45. Friesner, R.A.; Murphy, R.B.; Repasky, M.P.; Frye, L.L.; Greenwood, J.R.; Halgren, T.A.; Sanschagrin, P.C.; Mainz, D.T. Extra precision glide: Docking and scoring incorporating a model of hydrophobic enclosure for protein-ligand complexes. J. Med. Chem. 2006, 49, 6177–6196. [Google Scholar] [CrossRef] [Green Version]
  46. Halgren, T.A.; Murphy, R.B.; Friesner, R.A.; Beard, H.S.; Frye, L.L.; Pollard, W.T.; Banks, J.L. Glide: A new approach for rapid, accurate docking and scoring. 2. Enrichment factors in database screening. J. Med. Chem. 2004, 47, 1750–1759. [Google Scholar] [CrossRef] [PubMed]
  47. Schrodinger, LLC. The PyMOL Molecular Graphics System; Version 2.5.4; Schrödinger, LLC: New York, NY, USA, 2022. [Google Scholar]
  48. Grosser, G.; Baringhaus, K.H.; Döring, B.; Kramer, W.; Petzinger, E.; Geyer, J. Identification of novel inhibitors of the steroid sulfate carrier ‘sodium-dependent organic anion transporter’ SOAT (SLC10A6) by pharmacophore modelling. Mol. Cell. Endocrinol. 2016, 428, 133–141. [Google Scholar] [CrossRef] [PubMed]
  49. Schweigmann, H.; Sanchez-Guijo, A.; Ugele, B.; Hartmann, K.; Hartmann, M.F.; Bergmann, M.; Pfarrer, C.; Döring, B.; Wudy, S.A.; Petzinger, E.; et al. Transport of the placental estriol precursor 16alpha-hydroxy-dehydroepiandrosterone sulfate (16alpha-OH-DHEAS) by stably transfected OAT4-, SOAT-, and NTCP-HEK293 cells. J. Steroid Biochem. Mol. Biol. 2014, 143, 259–265. [Google Scholar] [CrossRef]
  50. Stieger, B.; Geier, A. Genetic variations of bile salt transporters as predisposing factors for drug-induced cholestasis, intrahepatic cholestasis of pregnancy and therapeutic response of viral hepatitis. Expert. Opin. Drug. Metab. Toxicol. 2011, 7, 411–425. [Google Scholar] [CrossRef] [Green Version]
  51. Karakus, E.; Zahner, D.; Grosser, G.; Leidolf, R.; Gundogdu, C.; Sanchez-Guijo, A.; Wudy, S.A.; Geyer, J. Estrone-3-Sulfate Stimulates the Proliferation of T47D Breast Cancer Cells Stably Transfected With the Sodium-Dependent Organic Anion Transporter SOAT (SLC10A6). Front. Pharmacol. 2018, 9, 941. [Google Scholar] [CrossRef]
  52. Geyer, J.; Bakhaus, K.; Bernhardt, R.; Blaschka, C.; Dezhkam, Y.; Fietz, D.; Grosser, G.; Hartmann, K.; Hartmann, M.F.; Neunzig, J.; et al. The role of sulfated steroid hormones in reproductive processes. J. Steroid Biochem. Mol. Biol. 2017, 172, 207–221. [Google Scholar] [CrossRef]
  53. Uhlen, M.; Fagerberg, L.; Hallstrom, B.M.; Lindskog, C.; Oksvold, P.; Mardinoglu, A.; Sivertsson, A.; Kampf, C.; Sjostedt, E.; Asplund, A.; et al. Proteomics. Tissue-based map of the human proteome. Science 2015, 347, 1260419. [Google Scholar] [CrossRef] [PubMed]
  54. Berglund, L.; Bjorling, E.; Oksvold, P.; Fagerberg, L.; Asplund, A.; Szigyarto, C.A.; Persson, A.; Ottosson, J.; Wernerus, H.; Nilsson, P.; et al. A genecentric Human Protein Atlas for expression profiles based on antibodies. Mol. Cell. Proteomics 2008, 7, 2019–2027. [Google Scholar] [CrossRef] [PubMed] [Green Version]
  55. Uhlen, M.; Bjorling, E.; Agaton, C.; Szigyarto, C.A.; Amini, B.; Andersen, E.; Andersson, A.C.; Angelidou, P.; Asplund, A.; Asplund, C.; et al. A human protein atlas for normal and cancer tissues based on antibody proteomics. Mol. Cell. Proteomics 2005, 4, 1920–1932. [Google Scholar] [CrossRef] [PubMed] [Green Version]
  56. Ponten, F.; Jirstrom, K.; Uhlen, M. The Human Protein Atlas--a tool for pathology. J. Pathol. 2008, 216, 387–393. [Google Scholar] [CrossRef] [PubMed]
  57. Hartmann, K.; Bennien, J.; Wapelhorst, B.; Bakhaus, K.; Schumacher, V.; Kliesch, S.; Weidner, W.; Bergmann, M.; Geyer, J.; Fietz, D. Current insights into the sulfatase pathway in human testis and cultured Sertoli cells. Histochem. Cell. Biol. 2016, 146, 737–748. [Google Scholar] [CrossRef] [PubMed]
  58. Rizner, T.L.; Thalhammer, T.; Ozvegy-Laczka, C. The Importance of Steroid Uptake and Intracrine Action in Endometrial and Ovarian Cancers. Front. Pharmacol. 2017, 8, 346. [Google Scholar] [CrossRef] [Green Version]
  59. Koenen, A.; Kock, K.; Keiser, M.; Siegmund, W.; Kroemer, H.K.; Grube, M. Steroid hormones specifically modify the activity of organic anion transporting polypeptides. Eur. J. Pharm. Sci. 2012, 47, 774–780. [Google Scholar] [CrossRef]
  60. Kullak-Ublick, G.A.; Fisch, T.; Oswald, M.; Hagenbuch, B.; Meier, P.J.; Beuers, U.; Paumgartner, G. Dehydroepiandrosterone sulfate (DHEAS): Identification of a carrier protein in human liver and brain. FEBS Lett. 1998, 424, 173–176. [Google Scholar] [CrossRef] [Green Version]
  61. Bossuyt, X.; Muller, M.; Meier, P.J. Multispecific amphipathic substrate transport by an organic anion transporter of human liver. J. Hepatol. 1996, 25, 733–738. [Google Scholar] [CrossRef]
  62. Lee, W.; Glaeser, H.; Smith, L.H.; Roberts, R.L.; Moeckel, G.W.; Gervasini, G.; Leake, B.F.; Kim, R.B. Polymorphisms in human organic anion-transporting polypeptide 1A2 (OATP1A2): Implications for altered drug disposition and central nervous system drug entry. J. Biol. Chem. 2005, 280, 9610–9617. [Google Scholar] [CrossRef] [Green Version]
  63. Meyer zu Schwabedissen, H.E.; Tirona, R.G.; Yip, C.S.; Ho, R.H.; Kim, R.B. Interplay between the nuclear receptor pregnane X receptor and the uptake transporter organic anion transporter polypeptide 1A2 selectively enhances estrogen effects in breast cancer. Cancer Res. 2008, 68, 9338–9347. [Google Scholar] [CrossRef] [PubMed] [Green Version]
  64. Franke, R.M.; Scherkenbach, L.A.; Sparreboom, A. Pharmacogenetics of the organic anion transporting polypeptide 1A2. Pharmacogenomics 2009, 10, 339–344. [Google Scholar] [CrossRef] [PubMed] [Green Version]
  65. Cui, Y.; Konig, J.; Leier, I.; Buchholz, U.; Keppler, D. Hepatic uptake of bilirubin and its conjugates by the human organic anion transporter SLC21A6. J. Biol. Chem. 2001, 276, 9626–9630. [Google Scholar] [CrossRef] [PubMed] [Green Version]
  66. Kullak-Ublick, G.A.; Ismair, M.G.; Stieger, B.; Landmann, L.; Huber, R.; Pizzagalli, F.; Fattinger, K.; Meier, P.J.; Hagenbuch, B. Organic anion-transporting polypeptide B (OATP-B) and its functional comparison with three other OATPs of human liver. Gastroenterology 2001, 120, 525–533. [Google Scholar] [CrossRef]
  67. Tamai, I.; Nozawa, T.; Koshida, M.; Nezu, J.; Sai, Y.; Tsuji, A. Functional characterization of human organic anion transporting polypeptide B (OATP-B) in comparison with liver-specific OATP-C. Pharm. Res. 2001, 18, 1262–1269. [Google Scholar] [CrossRef]
  68. Zhang, Y.; Hays, A.; Noblett, A.; Thapa, M.; Hua, D.H.; Hagenbuch, B. Transport by OATP1B1 and OATP1B3 enhances the cytotoxicity of epigallocatechin 3-O-gallate and several quercetin derivatives. J. Nat. Prod. 2013, 76, 368–373. [Google Scholar] [CrossRef] [Green Version]
  69. Hsiang, B.; Zhu, Y.; Wang, Z.; Wu, Y.; Sasseville, V.; Yang, W.P.; Kirchgessner, T.G. A novel human hepatic organic anion transporting polypeptide (OATP2). Identification of a liver-specific human organic anion transporting polypeptide and identification of rat and human hydroxymethylglutaryl-CoA reductase inhibitor transporters. J. Biol. Chem. 1999, 274, 37161–37168. [Google Scholar] [CrossRef] [Green Version]
  70. Gui, C.; Wahlgren, B.; Lushington, G.H.; Hagenbuch, B. Identification, Ki determination and CoMFA analysis of nuclear receptor ligands as competitive inhibitors of OATP1B1-mediated estradiol-17beta-glucuronide transport. Pharmacol. Res. 2009, 60, 50–56. [Google Scholar] [CrossRef] [Green Version]
  71. Ismair, M.G.; Stieger, B.; Cattori, V.; Hagenbuch, B.; Fried, M.; Meier, P.J.; Kullak-Ublick, G.A. Hepatic uptake of cholecystokinin octapeptide by organic anion-transporting polypeptides OATP4 and OATP8 of rat and human liver. Gastroenterology 2001, 121, 1185–1190. [Google Scholar] [CrossRef] [Green Version]
  72. Vavricka, S.R.; Van Montfoort, J.; Ha, H.R.; Meier, P.J.; Fattinger, K. Interactions of rifamycin SV and rifampicin with organic anion uptake systems of human liver. Hepatology 2002, 36, 164–172. [Google Scholar] [CrossRef]
  73. Van de Steeg, E.; Stranecky, V.; Hartmannova, H.; Noskova, L.; Hrebicek, M.; Wagenaar, E.; Van Esch, A.; De Waart, D.R.; Oude Elferink, R.P.; Kenworthy, K.E.; et al. Complete OATP1B1 and OATP1B3 deficiency causes human Rotor syndrome by interrupting conjugated bilirubin reuptake into the liver. J. Clin. Invest. 2012, 122, 519–528. [Google Scholar] [CrossRef] [PubMed] [Green Version]
  74. Pizzagalli, F.; Varga, Z.; Huber, R.D.; Folkers, G.; Meier, P.J.; St-Pierre, M.V. Identification of steroid sulfate transport processes in the human mammary gland. J. Clin. Endocrinol. Metab. 2003, 88, 3902–3912. [Google Scholar] [CrossRef] [PubMed] [Green Version]
  75. Nozawa, T.; Suzuki, M.; Takahashi, K.; Yabuuchi, H.; Maeda, T.; Tsuji, A.; Tamai, I. Involvement of estrone-3-sulfate transporters in proliferation of hormone-dependent breast cancer cells. J. Pharmacol. Exp. Ther. 2004, 311, 1032–1037. [Google Scholar] [CrossRef] [PubMed] [Green Version]
  76. Sai, Y.; Kaneko, Y.; Ito, S.; Mitsuoka, K.; Kato, Y.; Tamai, I.; Artursson, P.; Tsuji, A. Predominant contribution of organic anion transporting polypeptide OATP-B (OATP2B1) to apical uptake of estrone-3-sulfate by human intestinal Caco-2 cells. Drug. Metab. Dispos. 2006, 34, 1423–1431. [Google Scholar] [CrossRef] [Green Version]
  77. Lai, Y. Transporters in Drug Discovery and Development: Detailed Concepts and Best Practice, 1st ed.; Woodhead Publishing: Shaxton, UK, 2013; 734p. [Google Scholar]
  78. Yamaguchi, H.; Sugie, M.; Okada, M.; Mikkaichi, T.; Toyohara, T.; Abe, T.; Goto, J.; Hishinuma, T.; Shimada, M.; Mano, N. Transport of estrone 3-sulfate mediated by organic anion transporter OATP4C1: Estrone 3-sulfate binds to the different recognition site for digoxin in OATP4C1. Drug. Metab. Pharmacokinet. 2010, 25, 314–317. [Google Scholar] [CrossRef]
  79. Mikkaichi, T.; Suzuki, T.; Onogawa, T.; Tanemoto, M.; Mizutamari, H.; Okada, M.; Chaki, T.; Masuda, S.; Tokui, T.; Eto, N.; et al. Isolation and characterization of a digoxin transporter and its rat homologue expressed in the kidney. Proc. Natl. Acad. Sci. USA 2004, 101, 3569–3574. [Google Scholar] [CrossRef] [Green Version]
  80. Nozaki, Y.; Kusuhara, H.; Kondo, T.; Hasegawa, M.; Shiroyanagi, Y.; Nakazawa, H.; Okano, T.; Sugiyama, Y. Characterization of the uptake of organic anion transporter (OAT) 1 and OAT3 substrates by human kidney slices. J. Pharmacol. Exp. Ther. 2007, 321, 362–369. [Google Scholar] [CrossRef]
  81. Burckhardt, G.; Burckhardt, B.C. In vitro and in vivo evidence of the importance of organic anion transporters (OATs) in drug therapy. Handb. Exp. Pharmacol. 2011, 201, 29–104. [Google Scholar] [CrossRef]
  82. Mathialagan, S.; Costales, C.; Tylaska, L.; Kimoto, E.; Vildhede, A.; Johnson, J.; Johnson, N.; Sarashina, T.; Hashizume, K.; Isringhausen, C.D.; et al. In vitro studies with two human organic anion transporters: OAT2 and OAT7. Xenobiotica 2018, 48, 1037–1049. [Google Scholar] [CrossRef]
  83. Bakhaus, K.; Bennien, J.; Fietz, D.; Sanchez-Guijo, A.; Hartmann, M.; Serafini, R.; Love, C.C.; Golovko, A.; Wudy, S.A.; Bergmann, M.; et al. Sodium-dependent organic anion transporter (Slc10a6(−/−)) knockout mice show normal spermatogenesis and reproduction, but elevated serum levels for cholesterol sulfate. J. Steroid Biochem. Mol. Biol. 2018, 179, 45–54. [Google Scholar] [CrossRef]
  84. Raeside, J.I. A Brief Account of the Discovery of the Fetal/Placental Unit for Estrogen Production in Equine and Human Pregnancies: Relation to Human Medicine. Yale J. Biol. Med. 2017, 90, 449–461. [Google Scholar] [PubMed]
  85. Chatuphonprasert, W.; Jarukamjorn, K.; Ellinger, I. Physiology and Pathophysiology of Steroid Biosynthesis, Transport and Metabolism in the Human Placenta. Front. Pharmacol. 2018, 9, 1027. [Google Scholar] [CrossRef] [PubMed] [Green Version]
  86. Morel, Y.; Roucher, F.; Plotton, I.; Goursaud, C.; Tardy, V.; Mallet, D. Evolution of steroids during pregnancy: Maternal, placental and fetal synthesis. Ann. Endocrinol. 2016, 77, 82–89. [Google Scholar] [CrossRef] [PubMed]
  87. Pasqualini, J.R. Enzymes involved in the formation and transformation of steroid hormones in the fetal and placental compartments. J. Steroid Biochem. Mol. Biol. 2005, 97, 401–415. [Google Scholar] [CrossRef]
  88. Fokina, V.M.; Patrikeeva, S.; Wang, X.M.; Noguchi, S.; Tomi, M.; Konig, J.; Ahmed, M.S.; Nanovskaya, T. Role of Uptake Transporters OAT4, OATP2A1, and OATP1A2 in Human Placental Bio-disposition of Pravastatin. J. Pharm. Sci. 2022, 111, 505–516. [Google Scholar] [CrossRef] [PubMed]
  89. St-Pierre, M.V.; Hagenbuch, B.; Ugele, B.; Meier, P.J.; Stallmach, T. Characterization of an organic anion-transporting polypeptide (OATP-B) in human placenta. J. Clin. Endocrinol. Metab. 2002, 87, 1856–1863. [Google Scholar] [CrossRef]
  90. Ugele, B.; Bahn, A.; Rex-Haffner, M. Functional differences in steroid sulfate uptake of organic anion transporter 4 (OAT4) and organic anion transporting polypeptide 2B1 (OATP2B1) in human placenta. J. Steroid Biochem. Mol. Biol. 2008, 111, 1–6. [Google Scholar] [CrossRef]
  91. Ugele, B.; St-Pierre, M.V.; Pihusch, M.; Bahn, A.; Hantschmann, P. Characterization and identification of steroid sulfate transporters of human placenta. Am. J. Physiol. Endocrinol. Metab. 2003, 284, E390–E398. [Google Scholar] [CrossRef]
  92. Frandsen, V.A.; Stakemann, G. The Site of Production of Oestrogenic Hormones in Human Pregnancy. 3. Further Observations on the Hormone Excretion in Pregnancy with Anencephalic Foetus. Acta Endocrinol. 1964, 47, 265–276. [Google Scholar]
  93. Newby, D.; Aitken, D.A.; Howatson, A.G.; Connor, J.M. Placental synthesis of oestriol in Down’s syndrome pregnancies. Placenta 2000, 21, 263–267. [Google Scholar] [CrossRef]
  94. Conner, P.; Lundstrom, E.; Von Schoultz, B. Breast cancer and hormonal therapy. Clin. Obstet. Gynecol. 2008, 51, 592–606. [Google Scholar] [CrossRef] [PubMed]
  95. Osborne, C.K. Tamoxifen in the treatment of breast cancer. N. Engl. J. Med. 1998, 339, 1609–1618. [Google Scholar] [CrossRef] [PubMed]
  96. Aoki, K.; Terauchi, Y. Effect of Dehydroepiandrosterone (DHEA) on Diabetes Mellitus and Obesity. Vitam. Horm. 2018, 108, 355–365. [Google Scholar] [CrossRef] [PubMed]
  97. Cleary, M.P.; Seidenstat, R.; Tannen, R.H.; Schwartz, A.G. The effect of dehydroepiandrosterone on adipose tissue cellularity in mice. Proc. Soc. Exp. Biol. Med. 1982, 171, 276–284. [Google Scholar] [CrossRef]
  98. Coleman, D.L.; Schwizer, R.W.; Leiter, E.H. Effect of genetic background on the therapeutic effects of dehydroepiandrosterone (DHEA) in diabetes-obesity mutants and in aged normal mice. Diabetes 1984, 33, 26–32. [Google Scholar] [CrossRef]
  99. Granholm, N.H.; Staber, L.D.; Wilkin, P.J. Effects of dehydroepiandrosterone on obesity and glucose-6-phosphate dehydrogenase activity in the lethal yellow mouse (strain 129/Sv-Ay/Aw). J. Exp. Zool. 1987, 242, 67–74. [Google Scholar] [CrossRef]
  100. Corona, G.; Rastrelli, G.; Giagulli, V.A.; Sila, A.; Sforza, A.; Forti, G.; Mannucci, E.; Maggi, M. Dehydroepiandrosterone supplementation in elderly men: A meta-analysis study of placebo-controlled trials. J. Clin. Endocrinol. Metab. 2013, 98, 3615–3626. [Google Scholar] [CrossRef] [Green Version]
  101. Kimura, M.; Tanaka, S.; Yamada, Y.; Kiuchi, Y.; Yamakawa, T.; Sekihara, H. Dehydroepiandrosterone decreases serum tumor necrosis factor-alpha and restores insulin sensitivity: Independent effect from secondary weight reduction in genetically obese Zucker fatty rats. Endocrinology 1998, 139, 3249–3253. [Google Scholar] [CrossRef]
  102. De Pergola, G.; Giagulli, V.A.; Garruti, G.; Cospite, M.R.; Giorgino, F.; Cignarelli, M.; Giorgino, R. Low dehydroepiandrosterone circulating levels in premenopausal obese women with very high body mass index. Metabolism 1991, 40, 187–190. [Google Scholar] [CrossRef]
  103. Hernandez-Morante, J.J.; Perez-de-Heredia, F.; Lujan, J.A.; Zamora, S.; Garaulet, M. Role of DHEA-S on body fat distribution: Gender- and depot-specific stimulation of adipose tissue lipolysis. Steroids 2008, 73, 209–215. [Google Scholar] [CrossRef]
  104. Sayin, S.; Kutlu, R.; Kulaksizoglu, M. The relationship between sex steroids, insulin resistance and body compositions in obese women: A case-control study. J. Med. Biochem. 2020, 39, 25–31. [Google Scholar] [CrossRef] [PubMed] [Green Version]
  105. Tchernof, A.; Despres, J.P.; Belanger, A.; Dupont, A.; Prud’homme, D.; Moorjani, S.; Lupien, P.J.; Labrie, F. Reduced testosterone and adrenal C19 steroid levels in obese men. Metabolism 1995, 44, 513–519. [Google Scholar] [CrossRef] [PubMed]
  106. Morales, A.J.; Haubrich, R.H.; Hwang, J.Y.; Asakura, H.; Yen, S.S. The effect of six months treatment with a 100 mg daily dose of dehydroepiandrosterone (DHEA) on circulating sex steroids, body composition and muscle strength in age-advanced men and women. Clin. Endocrinol. 1998, 49, 421–432. [Google Scholar] [CrossRef] [PubMed]
  107. Nestler, J.E.; Barlascini, C.O.; Clore, J.N.; Blackard, W.G. Dehydroepiandrosterone reduces serum low density lipoprotein levels and body fat but does not alter insulin sensitivity in normal men. J. Clin. Endocrinol. Metab. 1988, 66, 57–61. [Google Scholar] [CrossRef] [PubMed]
  108. Villareal, D.T.; Holloszy, J.O. Effect of DHEA on abdominal fat and insulin action in elderly women and men: A randomized controlled trial. JAMA 2004, 292, 2243–2248. [Google Scholar] [CrossRef] [Green Version]
  109. Yen, S.S.; Morales, A.J.; Khorram, O. Replacement of DHEA in aging men and women. Potential remedial effects. Ann. N. Y Acad. Sci. 1995, 774, 128–142. [Google Scholar] [CrossRef]
  110. Kawai, T.; Autieri, M.V.; Scalia, R. Adipose tissue inflammation and metabolic dysfunction in obesity. Am. J. Physiol. Cell. Physiol. 2021, 320, C375–C391. [Google Scholar] [CrossRef]
  111. Kosters, A.; Abebe, D.F.; Felix, J.C.; Dawson, P.A.; Karpen, S.J. Inflammation-associated upregulation of the sulfated steroid transporter Slc10a6 in mouse liver and macrophage cell lines. Hepatol. Res. 2016, 46, 794–803. [Google Scholar] [CrossRef] [Green Version]
  112. Karakus, E.; Schmid, A.; Leiting, S.; Fuhler, B.; Schaffler, A.; Jakob, T.; Geyer, J. Role of the Steroid Sulfate Uptake Transporter Soat (Slc10a6) in Adipose Tissue and 3T3-L1 Adipocytes. Front. Mol. Biosci. 2022, 9, 863912. [Google Scholar] [CrossRef]
  113. Galuska, C.E.; Hartmann, M.F.; Sanchez-Guijo, A.; Bakhaus, K.; Geyer, J.; Schuler, G.; Zimmer, K.P.; Wudy, S.A. Profiling intact steroid sulfates and unconjugated steroids in biological fluids by liquid chromatography-tandem mass spectrometry (LC-MS-MS). Analyst 2013, 138, 3792–3801. [Google Scholar] [CrossRef]
Figure 1. Schematic representation of the enterohepatic circulation of bile acids (BA). After hepatic synthesis and efflux into the bile canaliculi, BA are released into the intestinal lumen and then reabsorbed via the apical sodium-dependent bile acid transporter (ASBT) in the terminal ileum. BA are transported back to the liver with the portal blood flow. Reuptake of BA from portal blood into hepatocytes via the Na+/taurocholate co-transporting polypeptide (NTCP) completes the enterohepatic circulation. Figure created with BioRender.com.
Ijms 24 09926 g001
Figure 2. SLC10A6 mRNA transcript and SOAT membrane topology. (A) The open reading frame (ORF) of the SLC10A6 transcript consists of 1134 base pairs (bp), which derive from six coding exons. This ORF is coding for the 377-amino-acid SOAT protein. (B) Schematic transmembrane topology model of the human SOAT protein with nine TMDs and Nexo/Ccyt orientation of the N- and C-terminal ends. The color code indicates which part of the protein is encoded by which corresponding exon. Small gray numbers indicate the amino acid positions of the respective TMD. Red flags indicate possible N-glycosylation sites. (C) Structural arrangement of the TMDs in the core and panel domains. TMDs are numbered from 1 to 9. TMDs 3 and 8 are discontinuous and are named 3a/3b and 8a/8b, respectively. Two Na+ ions are indicated at the proposed sodium-binding sites. The figure was created with BioRender.com.
Ijms 24 09926 g002
Figure 3. Structure of the SOAT protein and substrate docking. Top and side views of three different homology models of the human SOAT protein (GenBank accession number NP_932069.1) according to SWISS-MODEL predictions (https://swissmodel.expasy.org/ (accessed on 1 March 2023)). The models were generated based on the recent cryo-EM structures of human NTCP and represent three different conformations: outward-open conformation (A) PDB: 7fci; open-pore conformation (B) PDB: 7zyi; and inward-open conformation (C) PDB: 7pqg. In all the models, the core domain is shown in beige and the panel domain is shown in gray. All structures are shown in both top and side views. In addition, the side-view structures were virtually cut between the core and panel domains, and each was turned outwards to visualize the core/panel interface. All three homology models of human SOAT were used for in silico docking of the SOAT substrate DHEAS (indicated by white arrows). Briefly, the identification of potential binding sites was conducted using the Schrödinger SiteMap program [42] and the receptor grid was set to the interface between the core and the panel domain. The DHEAS structure (downloaded from PubChem at pubchem.ncbi.nlm.nih.gov) was prepared for docking using the Schrödinger LigPrep program [43]. Afterward, the DHEAS molecule was docked to the SOAT protein using the Schrödinger Glide XP program [44,45,46] with default settings. All the structures were visualized with PyMOL (version 2.5.4) [47]. N, N-terminus; C, C-terminus.
Ijms 24 09926 g003
Figure 4. SOAT substrates and inhibitors. (A) SOAT specifically transports steroid 3′- and 17′-monosulfates, represented here by dehydroepiandrosterone sulfate (DHEAS) and testosterone sulfate, respectively. Taurolithocholic acid (TLC) is the only non-sulfated bile acid that is transported by SOAT. 2-sulfooxymethylpyrene (2-SMP) and 4-sulfooxymtehylpyrene (4-SMP) are the only non-steroidal SOAT substrates identified so far. (B) SOAT inhibitors belong to different chemical classes, including steroid-based compounds (bile acids and heart glycosides), organosulfates (α-naphthylsulfate, bromosulfophthalein BSP), phenyl sulfonamides (S 1647, T 0511-1698, and T 5854015), benzothiazepines (S 0382), barbiturates (S 3740), propanolamines (S 8214), thiazolidinediones (troglitazone), and some others. Some of the SOAT inhibitors are also inhibitors of NTCP (e.g., betulinic acid, BSP, erythrosine B, losartan, and troglitazone) and ASBT (e.g., S 0382, S 0960, S 1647, S 3740, S 8214, and troglitazone).
Ijms 24 09926 g004
Figure 8. Role of SOAT in supplying sulfated steroid hormones to peripheral tissues. After the uptake of DHEAS and E1S via SOAT, these sulfate steroids can be converted to active steroids by steroid sulfatase (STS). Local steroid production via the sulfatase pathway then contributes to the overall estrogen and androgen regulation of the respective cell types and organs. Schematic illustration of SOAT expression in ductal epithelial cells in the breast, fetal capillary endothelium and apical membrane of syncytiotrophoblasts in the placenta, plasma membrane of adipocytes in adipose tissue, and spermatocytes and spermatids in the seminiferous tubules of the testes. Figure created with BioRender.com.
Ijms 24 09926 g008
Table 1. Phylogenic relationship of the SLC10 carriers and their substrate patterns.
GeneChromosomeProteinProtein LengthTransport Substrate
Steroid
Sulfates
Bile AcidsTLC
Ijms 24 09926 i001SLC10A114q24NTCP349 aa+++
SLC10A44p11P4437 aa
SLC10A213q33ASBT348 aa++
SLC10A64q21SOAT377 aa++
SLC10A58q21P5438 aa
SLC10A3Xq28P3477 aa
SLC10A74q31RCAS340 aa
Note: “+”, substrate of this carrier; “−“, no substrate of this carrier; aa, amino acids. The phylogenetic relationships among the carriers are indicated on the left.
Table 5. SLC10A6-expressing cell lines.
Cell LineOrganOriginCell TypeCategory
ASC diffMesenchymalAdipose tissueAdipose stromal cellsUncategorized
BJMesenchymalForeskinFibroblastFinite
BJ hTERT+MesenchymalForeskinFibroblastTelomerase immortalized
HaCaTSkinSkinKeratinocyteSpontaneously immortalized
HBEC3-KTLungCentral lung bronchioleBronchial epithelial cellTelomerase immortalized
HeLaFemale reproductive systemCervixEpithelial cells derived from cervical cancer cellsCancer
HSkMCMuscleTrapezius and erector spinae musclesSkeletal muscle cellsUncategorized
hTCEpiEyeCorneaCorneal epithelial cellsTelomerase immortalized
U-266/70LymphoidPeripheral bloodCells derived from multiple myeloma cellsCancer
U-266/84LymphoidPeripheral bloodCells derived from multiple myeloma cellsCancer
Disclaimer/Publisher’s Note: The statements, opinions and data contained in all publications are solely those of the individual author(s) and contributor(s) and not of MDPI and/or the editor(s). MDPI and/or the editor(s) disclaim responsibility for any injury to people or property resulting from any ideas, methods, instructions or products referred to in the content.

