Article

SERPINE1 mRNA Binding Protein 1 Is Associated with Ischemic Stroke Risk: A Comprehensive Molecular–Genetic and Bioinformatics Analysis of SERBP1 SNPs

1
Laboratory of Genomic Research, Research Institute for Genetic and Molecular Epidemiology, Kursk State Medical University, 305041 Kursk, Russia
2
Division of Neurology, Kursk Emergency Hospital, 305035 Kursk, Russia
3
Laboratory of Statistical Genetics and Bioinformatics, Research Institute for Genetic and Molecular Epidemiology, Kursk State Medical University, 305041 Kursk, Russia
4
Department of Biology, School of Biological and Behavioural Sciences, Queen Mary University of London, London E1 4NS, UK
5
Laboratory of Population Genetics, Research Institute of Medical Genetics, Tomsk National Research Medical Center, Russian Academy of Science, 634050 Tomsk, Russia
6
Laboratory of Genome Editing for Biomedicine and Animal Health, Belgorod State National Research University, 308015 Belgorod, Russia
7
Department of Pharmacology and Clinical Pharmacology, Belgorod State National Research University, 308015 Belgorod, Russia
8
Department of Medical Biological Disciplines, Belgorod State University, 308015 Belgorod, Russia
9
Department of Biology, Medical Genetics and Ecology, Kursk State Medical University, 305041 Kursk, Russia
*
Author to whom correspondence should be addressed.
Int. J. Mol. Sci. 2023, 24(10), 8716; https://doi.org/10.3390/ijms24108716
Submission received: 5 April 2023 / Revised: 5 May 2023 / Accepted: 10 May 2023 / Published: 13 May 2023
(This article belongs to the Special Issue New Trends in Diabetes, Hypertension and Cardiovascular Diseases)

Abstract

:
The SERBP1 gene is a well-known regulator of SERPINE1 mRNA stability and progesterone signaling. However, the chaperone-like properties of SERBP1 have recently been discovered. The present pilot study investigated whether SERBP1 SNPs are associated with the risk and clinical manifestations of ischemic stroke (IS). DNA samples from 2060 unrelated Russian subjects (869 IS patients and 1191 healthy controls) were genotyped for 5 common SNPs—rs4655707, rs1058074, rs12561767, rs12566098, and rs6702742 SERBP1—using probe-based PCR. The association of SNP rs12566098 with an increased risk of IS (risk allele C; p = 0.001) was observed regardless of gender or physical activity level and was modified by smoking, fruit and vegetable intake, and body mass index. SNP rs1058074 (risk allele C) was associated with an increased risk of IS exclusively in women (p = 0.02), non-smokers (p = 0.003), patients with low physical activity (p = 0.04), patients with low fruit and vegetable consumption (p = 0.04), and BMI ≥25 (p = 0.007). SNPs rs1058074 (p = 0.04), rs12561767 (p = 0.01), rs12566098 (p = 0.02), rs6702742 (p = 0.036), and rs4655707 (p = 0.04) were associated with shortening of activated partial thromboplastin time. Thus, SERBP1 SNPs represent novel genetic markers of IS. Further studies are required to confirm the relationship between SERBP1 polymorphism and IS risk.

1. Introduction

Ischemic stroke (IS), which accounts for ~80% of the total cases of stroke [1], is the second leading cause of death and the third leading cause of disability worldwide [2]. IS is caused by an interruption in cerebral blood flow, induced by thrombosis or embolism [3]. In this regard, the main factors contributing to IS are atherogenesis, instability of atherosclerotic plaque, and increased platelet aggregation. Accordingly, genetic studies revealed numerous IS-associated polymorphisms among the genes related to lipids turnover, inflammatory response, oxidative stress, and platelets activity [4,5,6,7]. Nevertheless, further genetic studies may help to reveal other molecular contributors, shedding light on the pathogenesis of IS.
Brain damage during acute ischemia is a very multifaceted and complex process. However, among the major diversity of molecular events, the following scenario can be distinguished as key: unbalanced functioning of the mitochondrion and reduced ATP production cause the accumulation of H+ and Ca2+ ions as well as free radicals. These toxic molecules directly damage cellular structure and provoke pathological responses displayed as excessive glutamate release and a switch to an inflammatory phenotype [8,9]. Finally, reaching the point of no return, the cell launches the “suicide programme” or worse, perishes via necrosis [10,11,12].
Under ischemia as well as under other pathological conditions, the cell utilizes all accessible resources to resist before it dies. One of the most powerful tools to decrease cellular damage is chaperone machinery. Chaperones refer to a functionally related group of proteins that provide proper folding of newly synthesized and unfolded proteins. The biological tasks of chaperones include providing correct protein folding, translocation of proteins across the membranes, helping in the assembly and disassembly of protein complexes, and participating in their degradation [13,14]. Obviously, the tremendously important role of chaperones determines their crucial significance for the course of brain ischemia. Moreover, being widely involved in the regulation of cellular proteostasis, the chaperones are important players in the development of IS [15].
SERPINE1 mRNA binding protein 1 (SERBP1) has first been identified as a protein bound to plasminogen activator inhibitor type 1 (PAI-1) mRNA [16] and which regulates the stability of the transcript. A significant role of PAI-1 in the increased risk of thrombosis and IS has been shown by a lot of studies [17,18,19]. Subsequent studies discovered that SERBP1 is involved in progesterone signaling via interactions with progesterone receptor membrane component 1 (PGRMC1) [20].
In 2020, Tsuboyama K et al. revealed SERBP1 among other small heat-resistant proteins in drosophila cell culture lysate that display chaperone-like activity even after being boiled [21]. As well as the other members, SERBP1 was named “heat-resistant obscure”, or, acronymically, “Hero”. The authors have also found mammalian orthologs of all the Hero-proteins and confirmed their chaperone-like properties. Our previous study has already shown an association of one of the “Hero” genes with the risk of IS [22].
Summarizing the biological roles of SERBP1 may suggest its probable link with IS. Indeed, the involvement of SERBP1 in the regulation of PAI-1, one of the main drivers of atherothrombosis, as well as the recently discovered “chaperone” properties of SERBP1, make this gene very attractive in determining the factors leading to the risk of IS. As far as such studies have not been previously carried out, we aimed to analyze the associations of functionally significant SERBP1 genetic variants with the risk and clinical manifestations of IS.

2. Results

2.1. Associations of SERBP1 SNPs with the Risk of Ischemic Stroke

The genotype frequencies of rs4655707, rs1058074, rs12561767, rs12566098, and rs6702742 SERBP1 in study groups are presented in Table S1. The distribution of genotype frequencies of all studied SNPs corresponded to the Hardy–Weinberg equilibrium in both the control and case groups (p > 0.05).
The analysis of the total sample revealed a significant association between SNP rs12566098 SERBP1 and IS risk (OR = 1.28, 95% CI 1.10–1.49, p = 0.001) (Table 1).
Owing to a potential sex difference in the associations of genetic variations with the risk of IS, the relationship between SERBP1 polymorphisms and the emergence of IS was examined separately in males and females. The genetic variant rs12566098 was found to affect the risk of the disease in both males (OR = 1.25; 95% CI = 1.02–1.53; p = 0.03) and females (OR = 1.39; 95% CI = 1.14–1.71; p = 0.002) (Table 2). Meanwhile, rs1058074 was associated with the increased risk of IS exclusively in females (OR = 1.29, 95% CI 1.05–1.58, p = 0.02) (Table 2).
The analysis of relationships between SERBP1 SNPs and the risk of IS depending on the smoking status revealed that rs1058074 (OR = 1.32, 95%CI 1.10–1.59, p = 0.003) and rs12566098 (OR = 1.43, 95%CI 1.20–1.72, p = 1 × 10⁻⁴) were associated with an increased risk of IS only in non-smokers (Table 2). Since revealed association between the genetic polymorphism and smoking-status may be biased by the disequilibrial proportion of smokers between males and females, we further performed separated analysis accounting both factors. The analysis has confirmed that smoking status has its own impact because we found that the association of rs1058074 and rs12566098 with the higher risk of IS in non-smokers still took place even after the exclusion of males (Table S2). Moreover, we found that two other SERBP1 SNPs, rs12561767 and rs6702742, were associated with a higher risk of IS in non-smoking men (OR = 1.36, 95% CI 1.05–1.77, p = 0.02, and OR = 1.33, 95% CI 1.03–1.73, p = 0.03, respectively) (Table S3).
The influence of other environmental factors that may have a substantial impact on the development of IS, such as physical activity and dietary intake of fresh fruits and vegetables, was also taken into account for evaluating associations. Yet, independent of the effect of these factors, rs12566098 SERBP1 was found to be related with the development of IS. (Table 2). Meanwhile, rs1058074 SERBP1 showed associations with an increased risk of IS in patients who indicated a low level of physical activity before cerebrovascular events (OR = 1.26, 95% CI 1.04–1.54, p = 0.02, Pbonf = 0.04) (Table 2) and in patients who noted insufficient consumption of fresh vegetables and fruits (OR = 1.24, 95% CI 1.04–1.48, p = 0.02, Pbonf = 0.04) (Table 2), suggesting that these environmental risk factors, along with smoking, modify the association of rs1058074 with IS risk.
Moreover, we examined how the body mass index (BMI) of IS patients affected the link between the researched SNPs and the emergence of the condition. It was found that the carriage of the minor allele C rs1058074 was associated with a 1.5-fold increase in the risk of IS in a patient with a BMI ≥ 25 (OR = 1.47, 95% CI 1.14–1.89, p = 0.0045, Pbonf = 0.007). Similar data were obtained in the analysis of rs12566098: OR = 1.52, 95% CI 1.19–1.95, p = 0.001, Pbonf = 0.002 (Table 2).

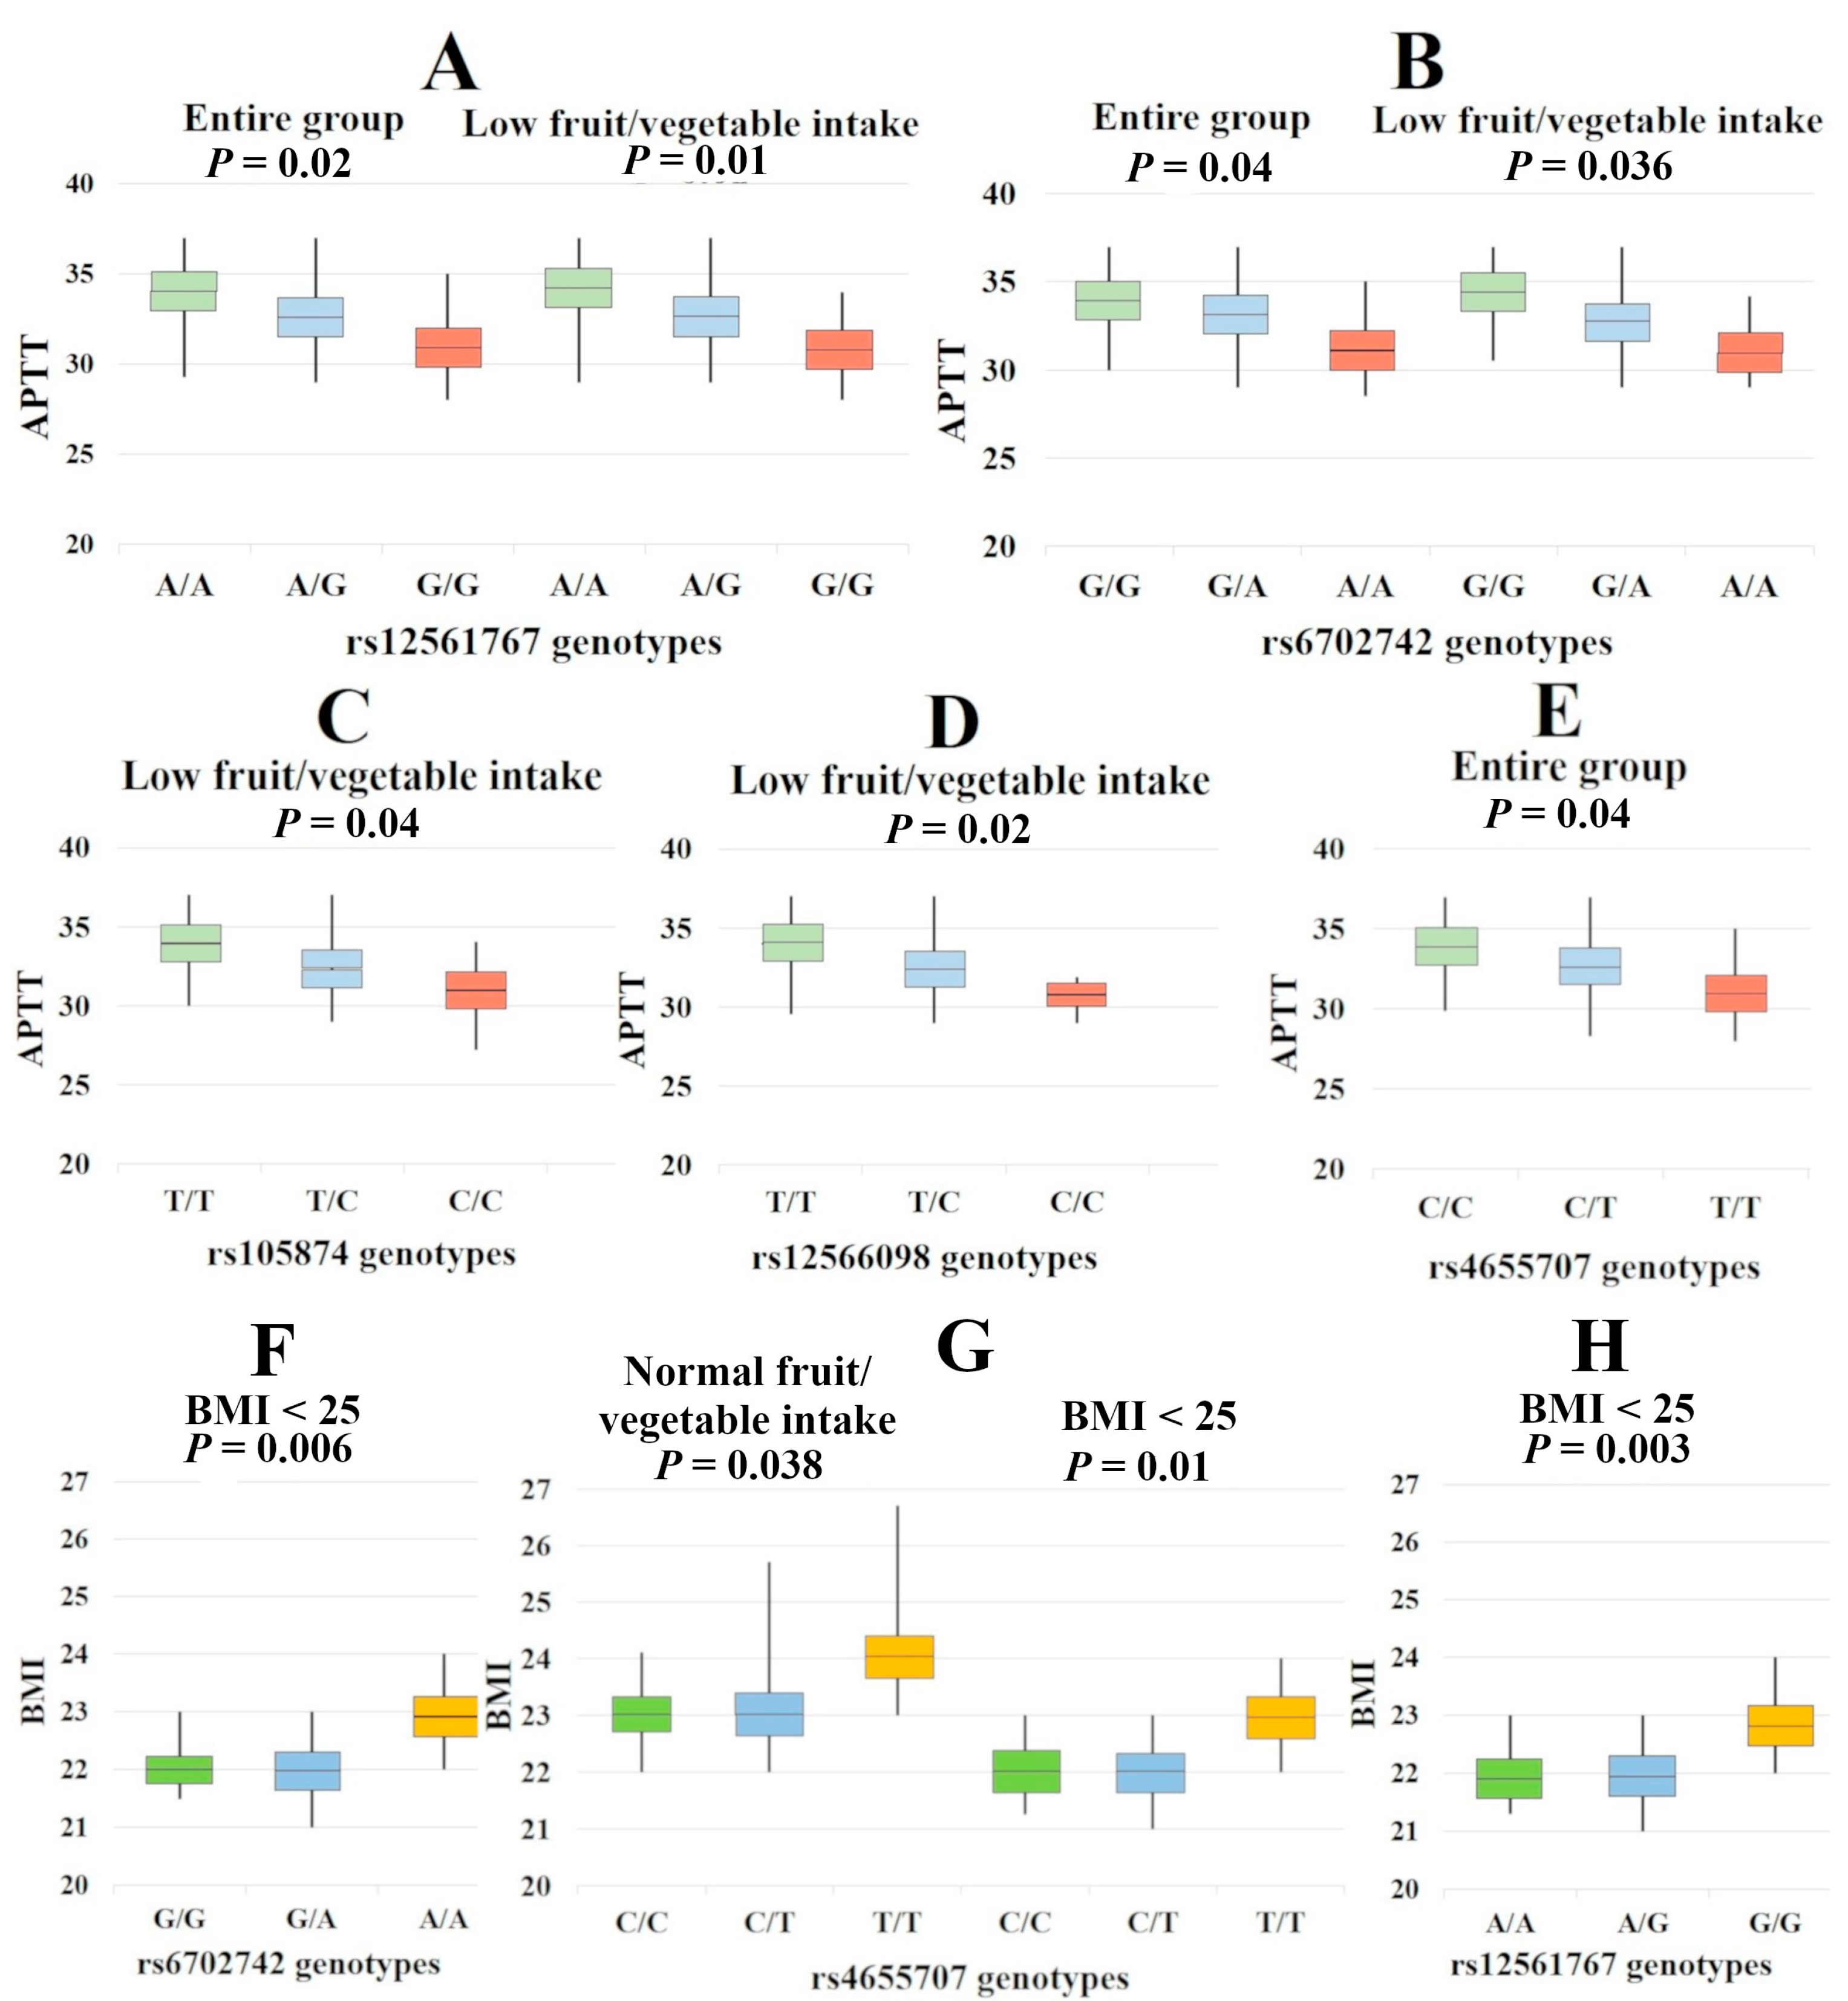
2.2. Associations of SERBP1 with the Clinical Features of IS

All of the tested SNPs showed associations with the Activated Partial Thromboplastin Time (APTT). Interestingly, homozygotes for major alleles (protective against IS) had the highest APTT rates, while heterozygotes were characterized by intermediate APTT indicators. Homozygotes for minor alleles (risk alleles) had the lowest APTT values, suggesting that coagulation has been stimulated and that these patients had a tendency towards thrombosis. It is significant that consumption of fresh vegetables and fruits affects the relationship between rs1058074, rs12561767, rs12566098, and rs6702742 and the APTT (Table S3, Figure 1).
An analysis of the influence of the studied SERBP1 genotypes on body mass index established a relationship between rs4655707, rs12561767, and rs6702742 with this indicator only in patients with normal BMI, suggesting that SERBP1 genetic variants lose their regulatory effects on BMI in patients with overweight. It is noteworthy that the association of rs4655707 with BMI was also observed in the group of patients with normal fruit and vegetable intake (Table S3, Figure 1).

2.3. Bioinformatics Analysis

GTEx Portal claims that the SERBP1 gene is expressed in brain tissues, blood vessels, and whole blood. In brain tissues, SERBP1 expression levels measured as median TPM (Transcripts Per Million) vary from 18.16 to 43.22; in blood vessels, from 70.52 to 246.5; and in whole blood, MeTPM = 79.88 (https://gtexportal.org/home/gene/SERBP1 (accessed on 21 January 2023)).

2.3.1. QTL-Effects

The results of the eQTL analysis for the studied SERBP1 SNPs are shown in Table 3. According to the GTEx Portal browser, all studied SNPs are associated with expression of the SERBP1 gene in the arteries (with cis-eQTL-mediated up-regulating effects of risk alleles) (Table 3). In the meantime, SERBP1 SNPs exhibit bidirectional effects on the cis-eQTL-mediated IL12RB2 level; they have a positive correlation with IL12RB2 expression in the arteries and aorta and a negative correlation with IL12RB2 expression in whole blood (Table 3).
Similar data were obtained in the analysis of eQTL effects using the eQTLGene browser data resource, which presents the results of the analysis of cis-eQTL effects in the blood: risk alleles of SERBP1 SNPs are associated with a cis-eQTL-mediated increase in IL12RB2 expression in blood (Table 3). Thus, the minor alleles of the studied SERBP1 SNPs (risk alleles) affect the increase in SERBP1 expression in the artery-tibial, the decrease in the expression of IL12RB2 in the artery-tibial, and the increase in the expression of IL12RB2 in the blood.
Analysis of cis-mQTL effects established a cis-mQTL-mediated effect of the risk alleles C rs1058074 and C rs12566098 on the decrease in methylation of cg24364144 (chr1:68102479) in the brain prefrontal cortex. At the same time, protective alleles C rs4655707 and G rs6702742 influenced the increase in methylation of cg24364144 (chr1:68102479) in the brain prefrontal cortex (Table 4). Given the fact that a decrease in methylation leads to an increase in gene expression, it can be concluded that the risk alleles of all IS-linked SERBP1 SNPs are associated with a decrease in cg24364144 (chr1:68102479) methylation and, accordingly, an increase in SERBP1 expression in the brain prefrontal cortex.

2.3.2. Analysis of Transcription Factors

The analysis of transcription factors revealed that the protective allele C rs4655707 SERBP1 creates DNA-binding sites for 60 TFs, co-controlling positive regulation of cysteine-type endopeptidase activity involved in the apoptotic signaling pathway (GO:0006919), response to hypoxia (GO:0001666), and cellular response to growth factor stimulus (GO:0071363) (Table S4).
Protective allele T rs1058074 SERBP1 creates DNA-binding sites for 127 TFs that are jointly involved in 24 overrepresented GO controlling neurogenesis, cardio- and vasculogenesis, apoptosis, and cell signaling: cerebral cortex GABAergic interneuron fate commitment (GO:0021892); neurogenesis (GO:0022008); regulation of cell death (GO:0010941); cardiac muscle tissue regeneration (GO:0061026); forebrain dorsal/ventral pattern formation (GO:0021798); BMP signaling pathway involved in heart development (GO:0061312); cellular response to growth factor stimulus (GO:0071363); forebrain neuron fate commitment (GO:0021877); hypothalamus development (GO:0021854); neuroblast differentiation (GO:0014016); forebrain morphogenesis (GO:0048853); cardiac pacemaker cell development (GO:0060926); negative regulation of oligodendrocyte differentiation (GO:0048715); negative regulation of neurogenesis (GO:0050768); ventricular cardiac muscle cell development (GO:0055015); cardiac atrium morphogenesis (GO:0003209); neuron fate specification (GO:0048665); oligodendrocyte differentiation (GO:0048709); neural precursor cell proliferation (GO:0061351); heart valve development (GO:0003170); neuron migration (GO:0001764); hippocampus development (GO:0021766); regulation of neural precursor cell proliferation (GO:2000177); and blood vessel morphogenesis (GO:0048514) (Table S5). Meanwhile, the risk allele C rs1058074 SERBP1 creates DNA-binding sites for 18 TFs jointly involved in the regulation of protein stability (GO:0031647), neurogenesis processes such as forebrain neuron development (GO:0021884), neuron fate commitment (GO:0048663), neuron migration (GO:0001764) (Table S5).
Protective allele A rs12561767 SERBP1 creates DNA-binding sites for 38 TFs characterized by the following overrepresented GO involved in cell signaling, apoptosis, and neurogenesis: steroid hormone mediated signaling pathway (GO:0043401); apoptotic process (GO:0006915); programmed cell death (GO:0012501); cell death (GO:0008219); neuron migration (GO:0001764); nervous system development (GO:0007399); and the generation of neurons (GO:0048699) (Table S6). Risk allele G rs12561767 SERBP1 creates DNA-binding sites for 15 TFs involved in the processes of programmed cell death: regulation of the apoptotic process (GO:0042981); and regulation of programmed cell death (GO:0043067) (Table S6).
Risk allele C rs12566098 SERBP1 creates DNA-binding sites for 62 TFs, co-controlling cellular response to growth factor stimulus (GO:0071363) and positive regulation of cytokine production (GO:0001819). At once, no IS-specific GO was found for nine TFs, binding to the protective allele G rs12566098 SERBP1 (Table S7).
Risk allele A rs6702742 SERBP1 creates DNA-binding sites for 41 TFs that jointly involved in the positive regulation of neuron apoptotic process (GO:0043525), positive regulation of cytokine production (GO:0001819), and negative regulation of apoptotic process (GO:0043066). Meanwhile, protective allele G rs6702742 SERBP1 creates DNA-binding sites for 23 TFs characterized by the following overrepresented GO: positive regulation of neuron death (GO:1901216); and regulation of neurogenesis (GO:0050767) (Table S8).

2.3.3. Bioinformatic Analysis of the Associations of SERBP1 SNPs with Cerebral Stroke and Intermediate Phenotypes

According to the bioinformatic resources, the Cerebrovascular Disease Knowledge Portal (CDKP) and the Cardiovascular Disease Knowledge Portal (CVDKP), which combine and analyze the results of genetic associations of the largest consortiums for the study of cardio- and cerebrovascular diseases, the IS-related SERBP1 SNPs are associated with stroke and a number of stroke-related intermediate phenotypes (Table 5).

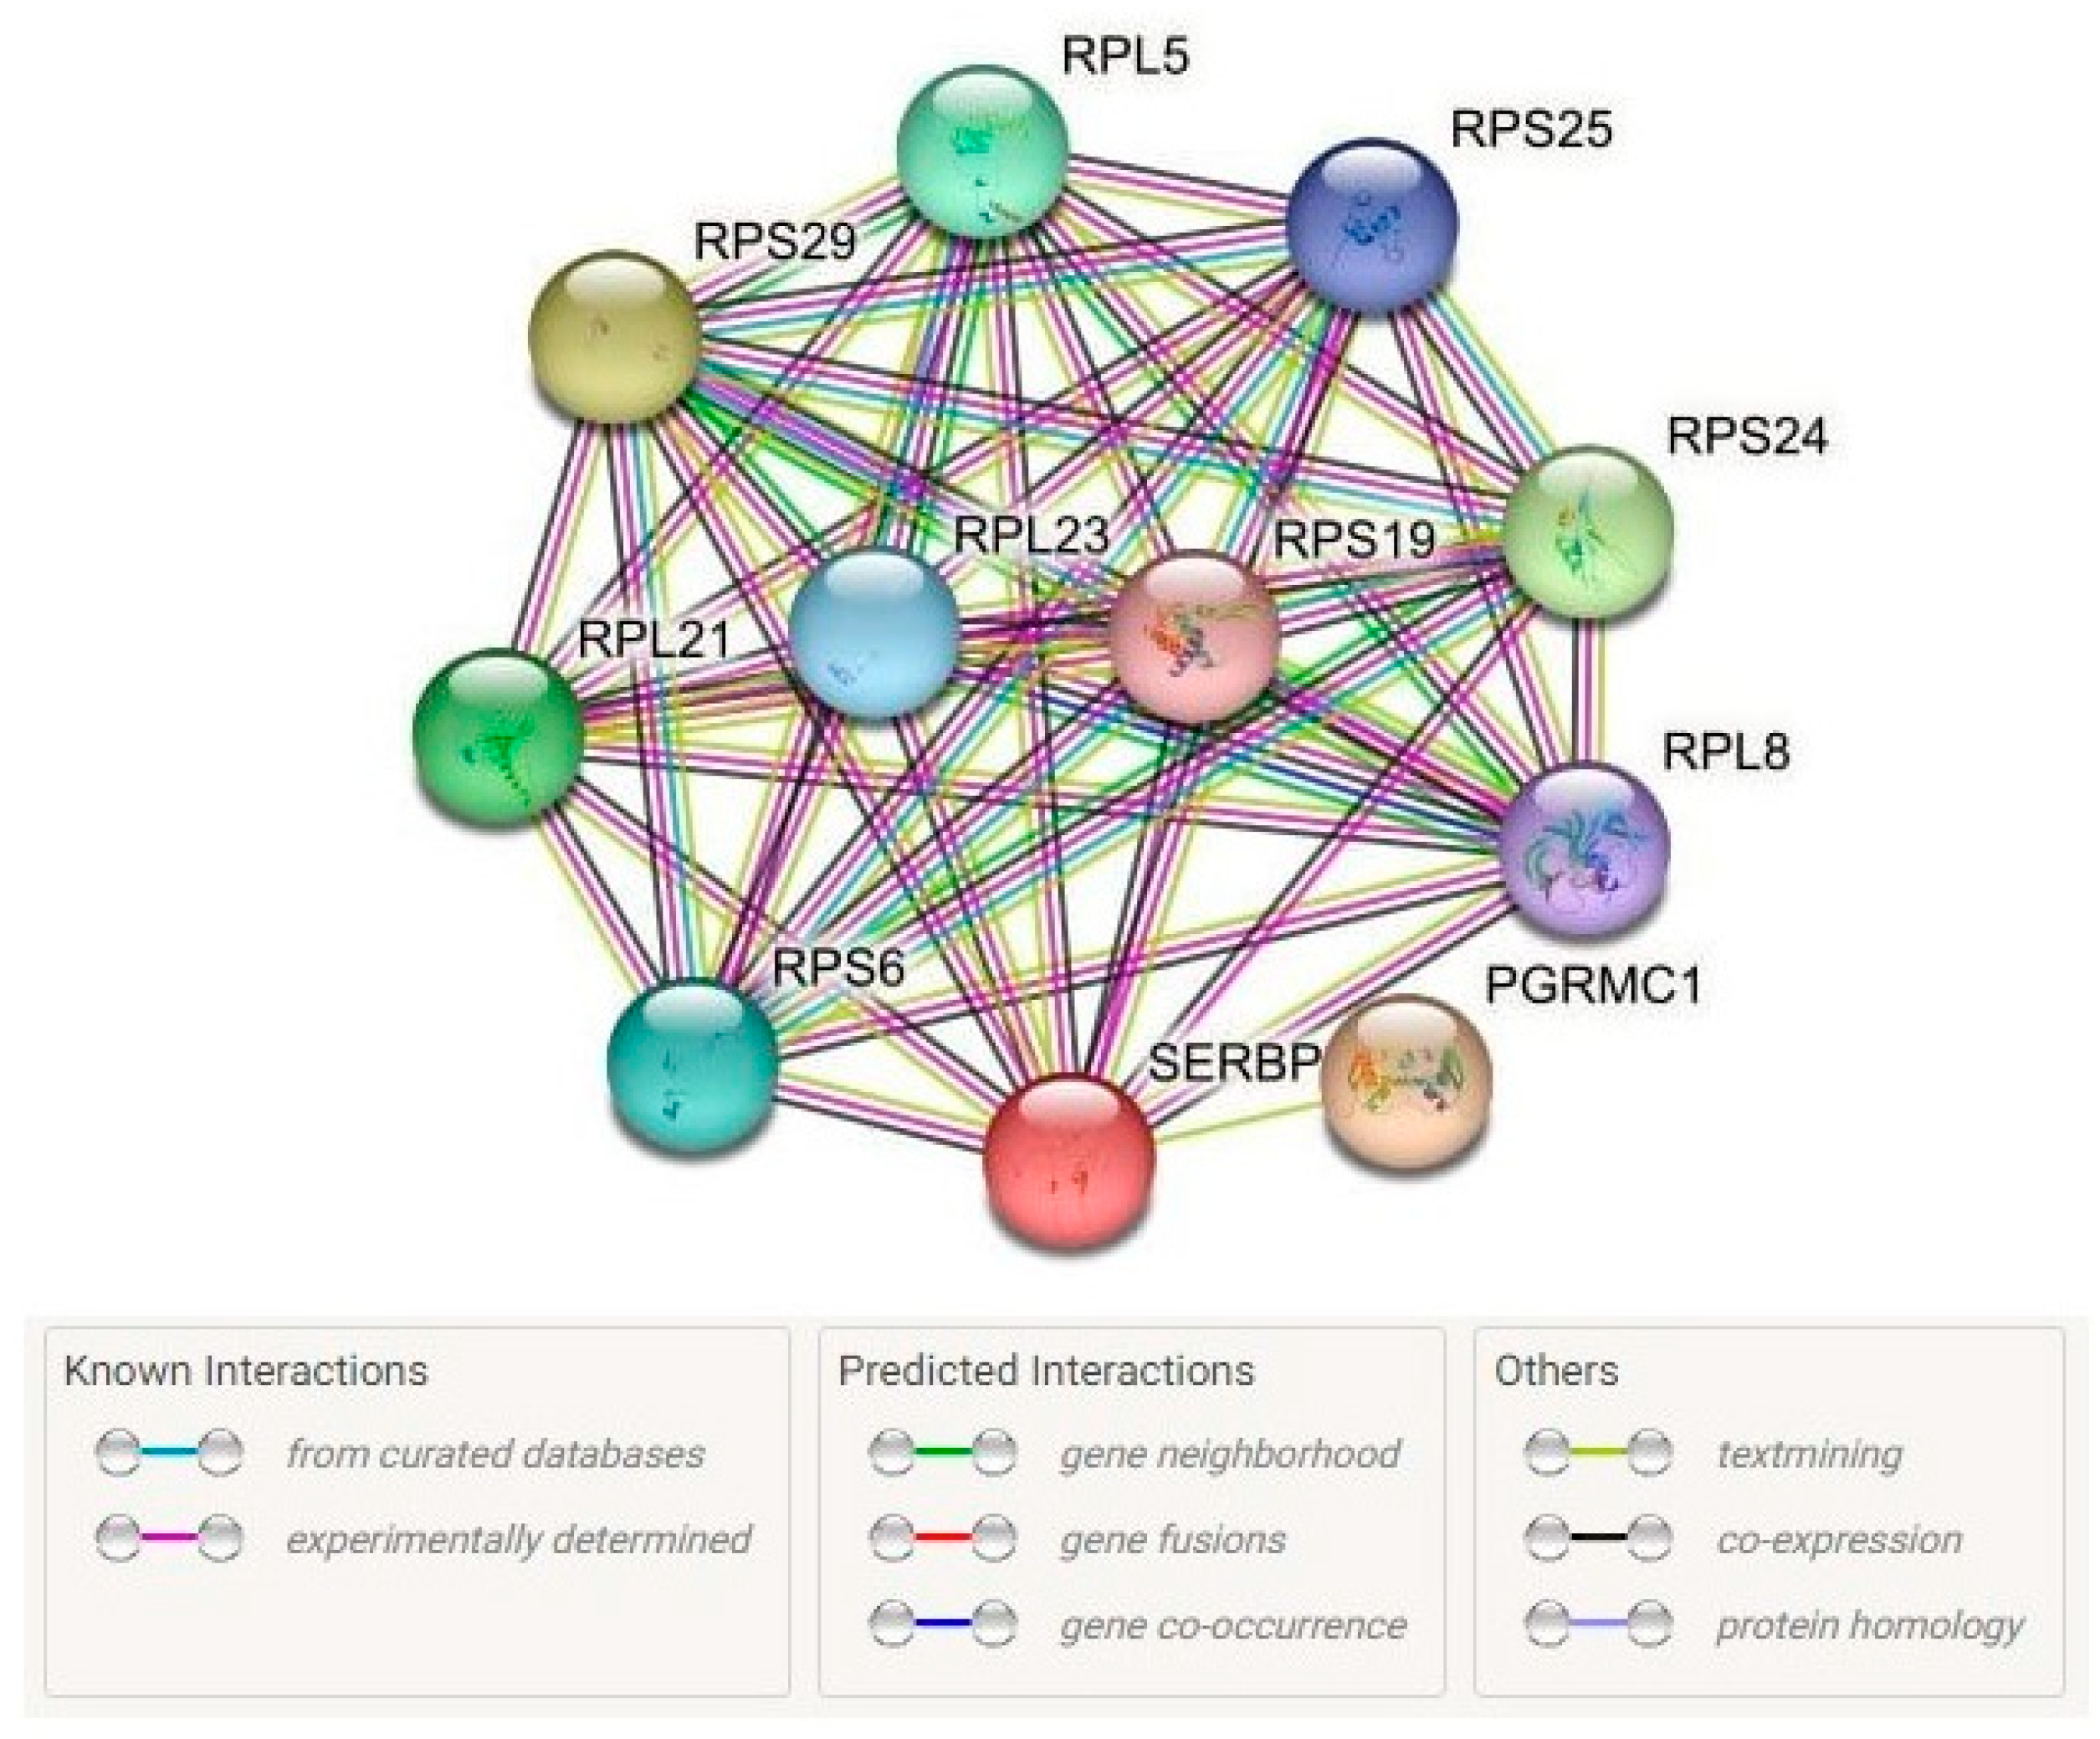
2.3.4. Protein–Protein Interactions

Using the STRING database, we identified 10 proteins characterized by the most pronounced interactions with SERBP1 (proteins of the first shell of interactors): PGRMC1, RPL21, RPL23, RPL5, RPL8, RPS19, RPS24, RPS25, RPS29, and RPS6 (PPI enrichment p-value = 1.54 × 10⁻¹⁰) (Figure 2). These proteins are characterized predominantly by co-expression. Moreover, the interactions between these genes were established experimentally and using the textmining approaches. It is noteworthy that most of the main interaction partners of SERBP1 (RPS29, RPS24, RPL21, RPL5, RPS6, RPL23, RPS25, RPL8, RPS19) are directly involved in protein synthesis since they are structural components of ribosomes (Table S9). The role of the PGRMC1 protein in the most significant interactions with SERBP1 should also be noted, since it is involved in the metabolism of progesterone and may play an essential role in the manifestation of the sex-specific effects of SERBP1 (Table S9).
Together, SERBP1 and its main interaction partners are involved in 14 biological processes and 6 molecular functions, reflecting not only the regulation of protein synthesis but also cotranslation, transport, ubiquitination, regulation of gene expression, the nitrogen compound biosynthetic process, and organic cyclic compound metabolism (Table S10).

3. Discussion

The present study shows for the first time that polymorphisms in the gene encoding SERPINE1 mRNA-binding protein 1 (SERBP1) are associated with the risk and clinical features of IS. In particular, tag SNP rs12566098 (risk allele C) was found to be associated with an elevated risk of IS in the total study population, in the group of males and in the group of females, regardless of the level of physical activity (both in patients with low physical activity and in patients with a normal level of physical activity). Nonetheless, we noticed that cigarette smoking and consumption of fresh vegetables and fruits act as modifiers of the associations of rs12566098 with IS: this genetic variant is associated with IS only in non-smokers and individuals with low fruit and vegetable consumption. In addition, the analysis based on the BMI revealed that rs12566098 correlates with IS among overweight individuals (BMI ≥ 25). Most likely, this genetic variant imparts more risk as compared to other SNPs linked to it; their risk effects were modified by all the studied environmental factors, sex and the BMI. In particular, rs1058074 (risk allele C) is associated with an increased risk of IS exclusively in women, non-smokers, individuals with low physical activity, individuals with low fruit and vegetable consumption, and individuals with the BMI ≥ 25. SNPs rs12561767 (risk allele G) and rs6702742 (risk allele A) proved to be associated with an elevated risk of IS only among non-smoking males.

3.1. SERBP1 SNPs and the IS Risk: Underlying Mechanisms

SERBP1 is expressed in vessels, brain tissues, and blood. SERBP1 regulates mRNA degradation and formation of RNA–protein complexes, affects mRNA stability, and controls the mRNA levels of target genes [16]. According to GTex Portal data, risk alleles of all IS-associated SNPs (rs12561767, rs12566098, rs6702742, and rs1058074) are linked to cis-eQTL-mediated up-regulation of SERBP1. Further evidence of associations between risk alleles and SERBP1 overexpression comes from the finding that risk alleles of all IS-related SNPs are associated with mQTLs, thus contributing to low methylation of CpG site cg24364144 (chr1:68102479) in the prefrontal cortex.
Because it binds to an AU-rich element in the 3′-untranslated region of PAI-1 mRNA and controls its stability, SERBP1 causes PAI-1 protein levels to increase. Accordingly, it has been previously known as PAI-1 mRNA-binding protein 1 [16]. Plasminogen activator inhibitor 1 (PAI-1), which is a SERPIN inhibitor, is well known as a regulator of fibrinolysis. A high serum level of PAI-1 correlates with enhanced thrombosis by reducing fibrin degradation [23] and is seen in stroke patients [24]. Moreover, PAI-1 is involved in mechanisms of atherosclerotic plaque formation [25] and stabilization [26]. J.H. Heaton and co-authors have proposed that nuclear SERBP1 stabilizes PAI-1 mRNA and that cytoplasmic SERBP1 destabilizes it [27]. Most likely, the carriage of risk alleles associated with higher SERBP1 expression contributes to the up-regulation of PAI-1. This notion is partially confirmed by our finding of the lowest APTT values in homozygotes for risk alleles of all the studied SNPs. It has been previously shown that hypofibrinolytic conditions are associated with shorter APTT and greater PAI-1 expression [28,29] and that PAI-1 overexpression correlates with a decrease in APTT [30]. Thus, our study indicates that risk alleles of SERBP1 SNPs may be risk factors for excessive thrombosis. Nonetheless, their role in the PAI-1–mediated mechanisms of thrombosis in IS remains incompletely understood, and to assess the influence of SERBP1 genotypes on the level of PAI-1 expression, functional studies are required: an analysis of the magnitude of PAI-1 expression depending on SERBP1 genotypes.
Because, to date, there have been no studies evaluating an association of SERBP1 SNPs with the IS risk, a bioinformatic analysis was carried out here to interpret the functional effects of genetic variants. First, it should be noted that protective alleles of SNPs that correlated with IS in our study also showed an association with a reduced risk of lacunar stroke (rs1058074), small artery occlusion (rs12566098), and cardio-aortic embolism (rs6702742), according to the Cerebrovascular Disease Knowledge Portal, which provides comprehensive genetic data on large numbers of patients with stroke from across the world (https://cd.hugeamp.org/ (accessed on 24 January 2023)). Second, data obtained using the bioinformatic resource, the Cardiovascular Disease Knowledge Portal (https://cvd.hugeamp.org/ (accessed on 24 January 2023)), showed that protective alleles of IS-associated SNPs reduce LDL cholesterol (rs1058074, rs12561767, rs12566098, and rs6702742), non-HDL cholesterol (rs12566098), and total cholesterol (rs1058074) levels and increase HDL3 cholesterol levels, thus pointing to the potentially significant participation of SERBP1 polymorphic variants in the development of atherosclerosis and thrombosis. Third, all IS-associated SNPs seem to contribute to the expression of IL12RB2 in the blood and arteries through cis-eQTL effects. IL12RB2 is involved in IL-35 control, which is important for atherosclerosis and inflammation [31] and has been shown to inhibit ischemia/hypoxia-induced angiogenesis, suggesting that this anti-inflammatory cytokine plays new roles at the recovery stage of angiogenesis [32].
Fourth, IS-associated SNPs affect transcriptional modulation by TFs and exert pronounced actions such as a loss or gain of function. For instance, carriage of the risk allele C rs1058074 leads to loss of DNA binding to the TFs that are predominantly involved in neurogenesis, cardio- and vasculogenesis, apoptosis, and cell signaling and creates binding sites for the TFs that jointly regulate “neuron migration”, “neuron fate commitment” and “regulation of protein stability”. The risk allele G rs12561767 causes a loss of binding to the TFs involved in the steroid hormone signaling pathway and neurogenesis (such as “neuron migration” and “formation of neurons”) and creates binding sites for the TFs driving processes of programmed cell death. Risk allele C rs12566098 SERBP1 creates binding sites for the TFs, which co-control the “cellular response to a growth factor stimulus” and “positive regulation of cytokine production”. The rs6702742 SERBP1 risk allele A generates binding sites for TFs that promote neuronal apoptosis and cytokine production. Allele C of SNP rs4655707 provides binding sites for TFs taking part in positive regulation of “cysteine-type endopeptidase activity involved in apoptotic signaling pathways”, “response to hypoxia”, and “cellular response to growth factor stimulus”. The above-mentioned biological processes may be implicated both in the risk of IS and in processes of ischemia-reperfusion.

3.2. Sex-Specific Correlates of SERBP1

Our study revealed that rs1058074 is associated with IS only in females. Other research has already shown that genetic markers have well-pronounced sexual dimorphism in their correlations with stroke [33,34,35,36]. First, sex hormones progesterone and 17β-estradiol both regulate SERBP1 mRNA levels [37]. On the other hand, according to the STRING database, one of the most important interaction partners of SERBP1 is PGRMC1 (progesterone receptor membrane component 1), which mediates the anti-apoptotic action of progesterone and whose mRNA is a target of SERBP1 [38]. Thus, SERBP1 is both involved in the metabolism of female sex hormones and subject to regulation by these hormones, which may mediate sex-specific effects in the association of rs1058074 (in SERBP1) with the IS risk.

3.3. Smoking-Associated Correlates of SERBP1

Our study indicates that rs1058074 and rs12566098 (in SERBP1) are associated with an increased risk of IS only among non-smokers. On the one hand, smoking is a substantial environmental risk factor for the IS, and may contribute more significantly to the disease’s onset than SERBP1 genetic variants. As a result, the link between SNPs and the IS risk is clearly shown in non-smokers. On the other hand, smoking can have a major impact on SERBP1 expression. By means of the bioinformatics resource, the Comparative Toxigenomic Database, it has been found that tobacco smoke pollution affects the expression of the SERBP1 protein in humans [39]. Nevertheless, the direction of this influence remains unclear. To further understand how SERBP1 interacts with various components of cigarette smoke, more research on SERBP1 expression levels in response to smoking status is required.

3.4. Low-Physical-Activity–Associated Correlates of SERBP1

We observed that rs1058074 is associated with an increased risk of IS only among individuals with low physical activity. The latter is a known risk factor for IS and may affect inflammatory, thrombotic, and oxidative markers [40], whose levels are modulated by chaperones [41]. Evidence for this is an observation that aerobic exercise training decreases plasma SERPINE1 levels in humans [42]. This lifestyle intervention may help to reduce the pathological effects of SERBP1 risk alleles potentially associated with elevated SERPINE1 (PAI-1) levels. Moreover, the level of SERPINE1, which is regulated by SERBP1, can be modulated by the magnitude of physical activity [43].

3.5. Low Fruit/Vegetable Intake–Related Correlates of SERBP1

The association of SNP rs1058074 with IS was found to be modified by a low intake of fresh vegetables and fruits. Nonetheless, the most important finding is that four SNPs showed an association with APTT in the presence of a risk factor such as low consumption of fresh vegetables and fruits, suggesting that the prothrombotic effects of SERBP1 risk alleles are significantly modified by this risk factor. Low consumption of fresh vegetables and fruits primarily correlates with oxidative stress [44,45], the role of which in the risk of IS and IS-related phenotypes has been demonstrated in a substantial number of studies [6,46,47,48,49,50]. Plant-based diets usually contain phenolic acids, flavonoids, and carotenoids, which have strong antioxidant properties and therefore eliminate an excess of active oxygen from the body and protect cells from damage, thereby reducing the risk of cardiovascular diseases [51]. It should be pointed out that the vasculo-protective influence of polyphenols (the main contributors to the antioxidant capacity of fruits and vegetables) may be linked to their antithrombotic action [52]. Antithrombotic mechanisms may be related to inhibition of platelet aggregation [53] and lower plasma homocysteine levels [54]. We believe that the manifestation of the risk effects of SERBP1 during low consumption of vegetables and fruits is primarily due to oxidative-stress–induced thrombosis, which is enhanced by the pro-thrombotic effects of risk alleles of SERBP1.

3.6. SERBP1 SNPs and the BMI

We noticed that rs1058074 and rs12566098 SERBP1 were associated with higher IS risk exclusively in individuals with a BMI of 25 or more. By contrast, no such correlations were found among individuals with a normal BMI. Moreover, SERBP1 SNPs were associated with a higher BMI among patients with a BMI < 25. This relation can be explained in terms of connections between obesity, leptin and the level of SERBP1 expression.
Leptin is a relevant adipokine that is involved in the regulation of food intake [55] and manifests its physiological actions by inhibiting food intake via actions on certain receptors in the brain [56]. In particular, considerable evidence implicates leptin in the conveying of satiety signals to the feeding center [57,58]. A bioinformatic analysis showed that the risk alleles of all the IS-linked SNPs contribute to lower leptin levels and hence weaker inhibitory effects of leptin on appetite, thereby increasing body weight. Nonetheless, these regulatory effects may only be seen in patients of normal body weight. In overweight individuals, leptin resistance (due to mutations in the genes encoding leptin or its receptors [59]) represents an inability of leptin to exert its anorexigenic actions [60]. Naturally, SERBP1-mediated regulation of the BMI was observed in a patient with a normal BMI who does not have leptin resistance.
In addition, obesity promotes this propensity for thrombosis. PAI-1 levels, regulated by SERBP1, positively correlate with obesity [61] and are significantly reduced by weight loss in obese individuals [62].

4. Materials and Methods

The outline of the study design is shown in Figure 3.
The study was carried out on an ethnically homogeneous sample of unrelated residents of Central Russia (mainly natives of the Kursk region) of Russian nationality, with a total number of 2060 (869 patients with IS and 1191 healthy individuals). The Ethical Review Committee of Kursk State Medical University approved the study protocol. All the participants gave written informed consent before their enrollment in this study, subject to the following inclusion criteria: self-declared Russian descent, with a birthplace inside of Central Russia [63].
Baseline and clinical characteristics of the study population are listed in Table 6.
The patients were enrolled in the study in two periods: at the Regional Vascular Center of Kursk Regional Clinical Hospital between 2015 and 2017 and at the Neurology Clinics of Kursk Emergency Medicine Hospital between 2010 and 2012 [64]. All the patients were examined by qualified neurologists. The results of the brain computed tomography and/or magnetic resonance imaging were used to make the diagnosis of IS during the acute phase of stroke. The patients were recruited consecutively. The IS patients were enrolled under the following exclusion criteria: hepatic or renal failure; endocrine, autoimmune, oncological, or other diseases that can cause an acute cerebrovascular event; intracerebral hemorrhage; hemodynamic or dissection-related stroke; and traumatic brain injury. All the patients with IS had a history of hypertension and received antihypertensive therapy.
According to the WHO recommendations, low fruit and vegetable consumption was defined as an intake of less than 400 g per day (excluding potatoes and other starchy tubers) [65]. Insufficient physical activity was defined as less than 180 min per week of physical activities of moderate to vigorous intensity. We included both physical activities performed in leisure time (for example, walking and running) and fitness club activities (for example, running on a treadmill, aerobics, or resistance training). It is this level of physical activity that is considered protective against the development of cardiovascular diseases by most authors [66,67,68]. According to the WHO criteria, overweight is defined as patients with a body mass index of 25 or over [69].
Healthy volunteers who had normal blood pressure without receiving antihypertensive treatment and no clinical signs of cardiovascular, cerebrovascular, or other serious illnesses comprised the control group. A healthy person met the criteria for inclusion in the control group if their systolic blood pressure was less than 130 mm Hg and their diastolic blood pressure was less than 85 mm Hg on at least three separate measurements. Control subjects were enrolled from Kursk hospitals during periodic medical examinations at public institutions and industrial enterprises of Kursk region [70,71]. This group was recruited from the same population and during the same period.
The selection of SNPs was based on the following criteria: the SNP must have a minor allele frequency of at least 0.05 in the European population and be characterized by a high regulatory potential. According to the bioinformatic tools SNPinfo Web Server (https://snpinfo.niehs.nih.gov/ (accessed on 19 March 2022)) and LD TAG SNP Selection (TagSNP), which were used to select SNPs based on the reference haplotypic structure of the Caucasian population (CEU) of the project HapMap, the SERBP1 (SERPINE1 MRNA Binding Protein 1, ID:26135) gene contains five SNPs (rs4655707, rs1058074, rs12561767, rs12566098, rs6702742). SNPs rs4655707 and rs1058074 are located in three prime UTR; rs12561767, rs12566098, and rs6702742 are located in introns.
The regulatory potential of these SNPs was evaluated using a variety of bioinformatic tools. RegulomeDB tool showed that rs4655707, rs1058074, and rs6702742 SERBP1 are characterized by a regulatory coefficient of 5 (TF binding or DNase peak); rs12566098, by a regulatory coefficient of 4 (TF binding + DNase peak); rs12561767, by a regulatory coefficient of 1f (eQTL + TF binding / DNase peak) (http://regulome.stanford.edu/ (accessed on 20 March 2022)) [72]. HaploReg (v4.1) database showed that this SNPs are characterized by enhancer histone marks in different tissues (rs4655707, rs12561767, rs12566098, rs6702742), regions of hypersensitivity for DNAse 1 (rs12561767, rs12566098, rs6702742), binding site for regulatory proteins (rs4655707, rs12561767), and DNA regulatory motifs (rs1058074, rs12561767, rs6702742) (http://archive.broadinstitute.org/mammals/haploreg/haploreg.php (accessed on March 20, 2022)) [73].
According to the data presented by the NCBI source (https://www.ncbi.nlm.nih.gov/snp/ (accessed on 20 January 2023)), these genetic variants are characterized by an average frequency of the minor alleles in European populations of 0.30 (rs12566098) to 0.46 (rs4655707) (https://www.ensembl.org/ (on 20 March 2022)). Thus, all five SNPs were selected for our research, which meets the necessary criteria for inclusion in the study.

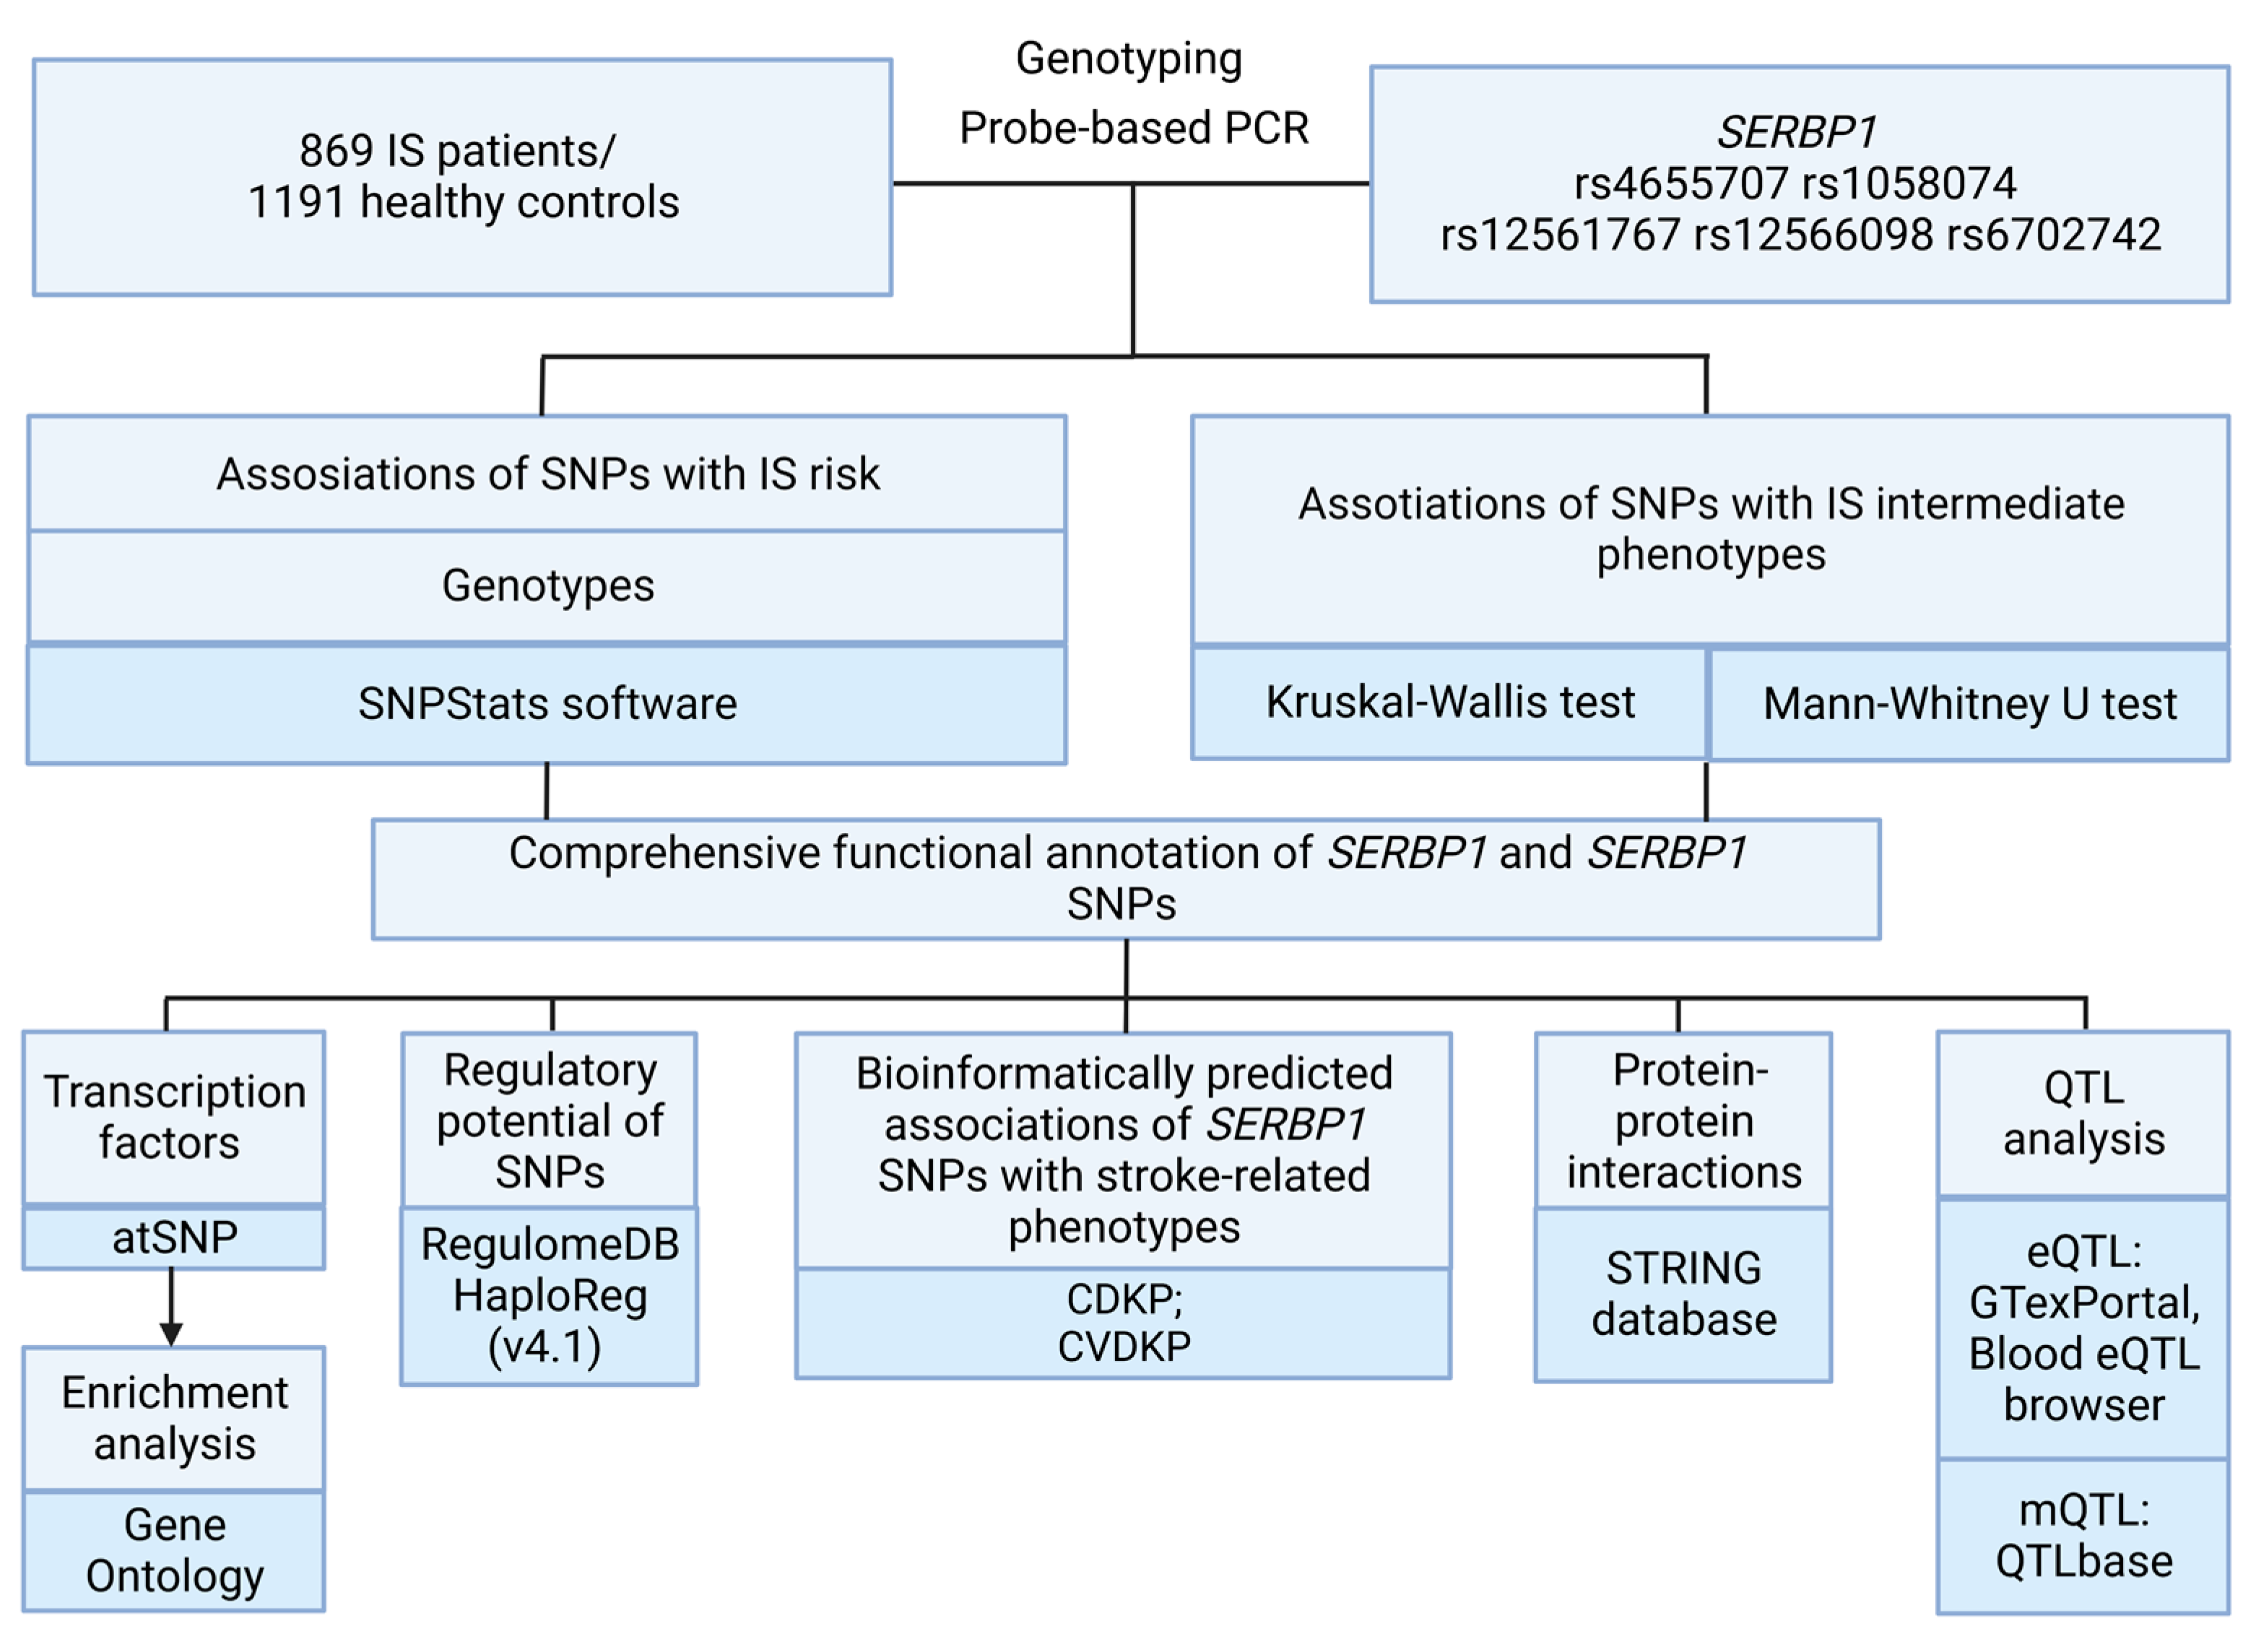
4.1. Genetic Analysis

DNA analysis was carried out at the Laboratory of Genomic Research of Research Institute for Genetic and Molecular Epidemiology of Kursk State Medical University (Kursk, Russia). Approximately 5 mL of venous blood from the cubital vein of each participant was collected into EDTA-coated tubes and maintained at −20 ◦C until processed. Genomic DNA was extracted from thawed blood samples by the standard procedure of phenol/chloroform extraction and ethanol precipitation. A NanoDrop spectrophotometer (Thermo Fisher Scientific, Waltham, MA, USA) was used to evaluate the extracted DNA solution’s purity, quality, and concentration.
Genotyping of the SNPs was conducted using allele-specific probe-based real-time polymerase chain reaction assays according to the protocols designed in the Laboratory of Genomic Research, Research Institute for Genetic and Molecular Epidemiology. Primers and probes were designed using the Primer3 program online (http://primer3.ut.ee/ (accessed on 30 March 2022)) [74], selected, and then synthesized by the Syntol company (Moscow, Russia).
The primers and probes used for genotyping the polymorphisms are presented in Table S. 11. A real-time PCR was conducted in a 25-mL reaction mixture containing 1.5 U of Hot Start Taq DNA polymerase (Biolabmix, Novosibirsk, Russia), about 1 μg of DNA, 0.25 μM each primer, 250 μM dNTPs, 3.0 mM MgCl2 (for rs4655707), 2.5 mM MgCl2 (for rs1058074, rs12566098, rs6702742), 1.5 mM MgCl2 (for rs12561767), and 1xPCR buffer (67 mM Tris-HCl, pH 8.8, 16.6 mM (NH4)2SO4, 0.01% Tween-20). The amplification reaction consisted of an initial denaturation for 10 min at 95 °C, followed by 39 cycles of 92 °C for 30 s and 64 °C, 49 °C, 64 °C, 56 °C, 53 °C for 1 min (for rs4655707, rs1058074, rs12561767, rs12566098, and rs6702742, respectively). To ensure quality control, 10% of DNA samples were genotyped in duplicates, blinded to the case-control status. The concordance rate was >99%.

4.2. Statistical and Bioinformatics Analysis

The genetic association study power calculator, accessible online at http://csg.sph.umich.edu/abecasis/gas_power_calculator/ (accessed on 15 January 2023), was used to calculate the statistical power for the study. Association analysis between the SERBP1 gene polymorphisms and IS risk could detect the genotype relative risk of 1.19–1.45 assuming 0.80 power and a 5% type-I error (α = 0.05) on the sample size of 869 cases and 1191 controls.
All statistical analyses were performed using the STATISTICA software (v13.3, USA). The distribution of quantitative data was tested for normality using Shapiro–Wilk’s test. Since the biochemical parameters and BMI showed a deviation from normal distribution, they were expressed as the median (Me) and first and third quartiles (Q1 and Q3). The Kruskal–Wallis test was used to compare quantitative variables among three independent groups. Following that, groups were contrasted pairwise using the Mann–Whitney test with FDR adjustment [75]. For categorical variables, the statistical significance of differences was evaluated by Pearson’s chi-squared test with Yates’s correction for continuity.
Compliance of the genotypes’ distributions with Hardy–Weinberg equilibrium was assessed using Fisher’s exact test. Genotype frequencies in the study groups and their associations with the disease risk were analyzed using SNPStats software (https://www.snpstats.net/start.htm (accessed on 15 January 2023)) [76]. For the analysis of associations among genotypes, additive models were considered. Associations in the entire group of IS patients/controls were adjusted for age, gender, and smoking status. In cases where there was no information about the environmental risk factor in the control group, associations were analyzed depending on the presence or absence of the risk factor in the group of patients, compared with the total control group. In this case, the Bonferroni correction was additionally introduced [77].
The following bioinformatics resources were used to analyze the functional effects of SERBP1 SNPs:
  • The bioinformatic tool GTExportal (http://www.gtexportal.org/ (accessed on 21 January 2023)) was used to analyze the expression levels of the studied genes in the brain, whole blood, and blood vessels, as well as to analyze expression quantitative trait loci (eQTLs) (The GTEx Consortium, 2020). Additionally, the eQTLGene browser (https://www.eqtlgen.org/ (accessed on 21 January 2023)) was used to analyze the cis-eQTL-mediated effects of SERBP1 SNPs in blood [78];
  • The methylation quantitative trait loci (mQTLs) in the brain, whole blood, and blood vessels were examined using QTLbase (http://www.mulinlab.org/qtlbase/index.html (accessed on 21 January 2023)) [79];
  • Bioinformatic tools of the STRING database (https://string-db.org/ (accessed on 22 January 2023)) were used for the analysis of the main interaction partners of SERBP1 [80]. Analysis of biological processes and molecular functions reflecting interactions with main functionally related proteins also was carried out in STRING database;
  • The atSNP Function Prediction online tool (http://atsnp.biostat.wisc.edu/search (accessed on 22 January 2023)) was used to evaluate the impact of SERBP1 SNPs on the binding of transcription factors (TFs) to DNA depending on the carriage of the reference/alternative alleles [81]. TFs were included based on the degree of influence of SNPs on the interaction of TFs with DNA, calculated on the basis of a positional weight matrix;
  • Using the Gene Ontology online tool (http://geneontology.org/ (accessed on 23 January 2023)), it was feasible to analyze the joint involvement of TFs linked to the reference/SNP alleles in overrepresented biological processes directly related to the pathogenesis of IS [82]. Biological functions controlled by transcription factors associated with SERBP1 SNPs were used as functional groups;
  • The Comparative Toxicogenomics Database (CTD) resource (http://ctdbase.org (accessed on 24 January 2023)) was used for the interpretation of environment-associated correlates of SERBP1. CTD provides the ability to analyze specific interactions between genes and chemicals in vertebrates and invertebrates based on data obtained from published scientific studies worldwide [83]. This tool was used to analyze binary interactions involving one chemical and one gene or protein;
  • The Cerebrovascular Disease Knowledge Portal (CDKP) (https://cd.hugeamp.org/ (accessed on 24 January 2023)) and Cardiovascular Disease Knowledge Portal (https://cvd.hugeamp.org/ (accessed on 24 January 2023)) online tools were used for bioinformatic analyses of the associations of SERBP1 SNPs with atherosclerosis-associated diseases, intermediate phenotypes, and risk factors for IS (such as total cholesterol, LDL, BMI, etc.).

Supplementary Materials

The following supporting information can be downloaded at: https://www.mdpi.com/article/10.3390/ijms24108716/s1, Table S1: Distribution of SERBP1 genotypes in ischemic stroke patients/healthy controls and their correspondence to the Hardy–-Weinberg equilibrium; Table S2: Results of the analysis of associations between SERBP1 gene SNPs and ischemic stroke risk depending on sex and smoking status; Table S3: Established statistically significant associations of SERBP1 genotypes with clinical and biological characteristics of IS patients; Table S4: Analysis of the effect of rs4655707 SERBP1 on the binding of DNA to transcription factors; Table S5: Analysis of the effect of rs1058074 SERBP1 on the binding of DNA to transcription factors; Table S6: Analysis of the effect of rs12561767 SERBP1 on the binding of DNA to transcription factors; Table S7: Analysis of the effect of rs12566098 SERBP1 on the binding of DNA to transcription factors. Table S8: Analysis of the effect of rs6702742 SERBP1 on the binding of DNA to transcription factors; Table S9: Main functional characteristics of predicted functional partners of SERBP1 (STRING database); Table S10: Functional enrichments of SERBP1 network; Table S11: Primers and probes were designed for this study.

Author Contributions

I.S. wrote the initial draft. I.S., K.K., M.S., and T.S. collected the data and conducted experiments. O.B. conceived and developed the study, supervised the experiments, and reviewed and edited the manuscript. M.F. participated in data analysis and interpretation and data curation. A.P. and M.C. administrated the project and interpreted and validated data. K.K. and O.B. developed the methodology. V.S., A.D., and M.F. were involved in funding and original writing. I.S. and O.B. confirm the authenticity of all raw data. All authors have read and agreed to the published version of the manuscript.

Funding

This research was funded by Russian Science Foundation (№ 22-15-00288, https://rscf.ru/en/project/22-15-00288/ (accessed on 23 January 2023)).

Institutional Review Board Statement

The study was conducted according to the guidelines of the Declaration of Helsinki and was approved by the Ethical Review Committee of Kursk State Medical University, Russia (Protocol No. 12 from 7.12.2015). All the participants gave written informed consent before the enrollment in this study.

Informed Consent Statement

Informed consent was obtained from all subjects involved in the study.

Data Availability Statement

The data presented in this study are available upon request from corresponding author.

Conflicts of Interest

The authors declare no conflict of interest.

Study Limitations

Our study has several limitations. First, we did not study the level of SERBP1 expression, which does not allow us to establish the effect of the studied SNPs on the level of SERBP1 mRNA. Secondly, no analysis of PAI-1 expression was performed; therefore, it is impossible to establish the influence of SERBP1 SNPs on PAI-1 expression. Thirdly, we did not conduct a biochemical analysis to determine the individual components of the fibrinolytic system (plasmin, plasminogen), which would have allowed us to more definitely testify to the relationship of the studied genetic variants to fibrinolysis, which is directly regulated by PAI-1. Fourthly, the number of subjects on which the study is based is too small to draw an unambiguous conclusion about the use of SERBP1 SNPs as a new markers of IS. Replicative studies are required in various populations around the world, involving large research samples.

References

  1. Chugh, C. Acute Ischemic Stroke: Management Approach. Indian J. Crit. Care Med. Peer-Rev. Off. Publ. Indian Soc. Crit. Care Med. 2019, 23 (Suppl. S2), S140–S146. [Google Scholar] [CrossRef]
  2. Johnson, W.; Onuma, O.; Owolabi, M.; Sachdev, S. Stroke: A Global Response Is Needed. Bull. World Health Organ. 2016, 94, 634. [Google Scholar] [CrossRef]
  3. Qin, C.; Yang, S.; Chu, Y.-H.; Zhang, H.; Pang, X.-W.; Chen, L.; Zhou, L.-Q.; Chen, M.; Tian, D.-S.; Wang, W. Signaling Pathways Involved in Ischemic Stroke: Molecular Mechanisms and Therapeutic Interventions. Signal Transduct. Target. Ther. 2022, 7, 215. [Google Scholar] [CrossRef]
  4. Lin, J.; Wang, Y.; Wang, Y.; Pan, Y. Inflammatory Biomarkers and Risk of Ischemic Stroke and Subtypes: A 2-Sample Mendelian Randomization Study. Neurol. Res. 2020, 42, 118–125. [Google Scholar] [CrossRef]
  5. Polonikov, A.; Rymarova, L.; Klyosova, E.; Volkova, A.; Azarova, I.; Bushueva, O.; Bykanova, M.; Bocharova, I.; Zhabin, S.; Churnosov, M.; et al. Matrix Metalloproteinases as Target Genes for Gene Regulatory Networks Driving Molecular and Cellular Pathways Related to a Multistep Pathogenesis of Cerebrovascular Disease. J. Cell. Biochem. 2019, 120, 16467–16482. [Google Scholar] [CrossRef] [PubMed]
  6. Bushueva, O.; Barysheva, E.; Markov, A.; Belykh, A.; Koroleva, I.; Churkin, E.; Polonikov, A.; Ivanov, V.; Nazarenko, M. DNA Hypomethylation of the MPO Gene in Peripheral Blood Leukocytes Is Associated with Cerebral Stroke in the Acute Phase. J. Mol. Neurosci. 2021, 71, 1914–1932. [Google Scholar] [CrossRef]
  7. Cui, J.; Li, H.; Chen, Z.; Dong, T.; He, X.; Wei, Y.; Li, Z.; Duan, J.; Cao, T.; Chen, Q.; et al. Thrombo-Inflammation and Immunological Response in Ischemic Stroke: Focusing on Platelet-Tregs Interaction. Front. Cell. Neurosci. 2022, 16, 955385. [Google Scholar] [CrossRef]
  8. Janardhan, V.; Qureshi, A.I. Mechanisms of Ischemic Brain Injury. Curr. Cardiol. Rep. 2004, 6, 117–123. [Google Scholar] [CrossRef] [PubMed]
  9. Singh, V.; Mishra, V.N.; Chaurasia, R.N.; Joshi, D.; Pandey, V. Modes of Calcium Regulation in Ischemic Neuron. Indian J. Clin. Biochem. 2019, 34, 246–253. [Google Scholar] [CrossRef]
  10. Yamashita, T.; Abe, K. Pathophysiology of Neuronal Cell Death After Stroke. In Stroke Revisited: Pathophysiology of Stroke: From Bench to Bedside; Lee, S.-H., Ed.; Stroke Revisited; Springer: Singapore, 2020; pp. 235–241. [Google Scholar] [CrossRef]
  11. Ludhiadch, A.; Sharma, R.; Muriki, A.; Munshi, A. Role of Calcium Homeostasis in Ischemic Stroke: A Review. CNS Neurol. Disord.-Drug Targets-CNS Neurol. Disord. 2022, 21, 52–61. [Google Scholar] [CrossRef]
  12. Chan, P.H. Reactive Oxygen Radicals in Signaling and Damage in the Ischemic Brain. J. Cereb. Blood Flow Metab. 2001, 21, 2–14. [Google Scholar] [CrossRef]
  13. Giffard, R.G.; Yenari, M.A. Many Mechanisms for Hsp70 Protection from Cerebral Ischemia. J. Neurosurg. Anesthesiol. 2004, 16, 53–61. [Google Scholar] [CrossRef] [PubMed]
  14. Frydman, J. Folding of Newly Translated Proteins In Vivo: The Role of Molecular Chaperones. Annu. Rev. Biochem. 2001, 70, 603–647. [Google Scholar] [CrossRef] [PubMed]
  15. Madrigal-Matute, J.; de Bruijn, J.; van Kuijk, K.; Riascos-Bernal, D.F.; Diaz, A.; Tasset, I.; Martín-Segura, A.; Gijbels, M.J.J.; Sander, B.; Kaushik, S.; et al. Protective Role of Chaperone-Mediated Autophagy against Atherosclerosis. Proc. Natl. Acad. Sci. USA 2022, 119, e2121133119. [Google Scholar] [CrossRef]
  16. Heaton, J.H.; Dlakic, W.M.; Dlakic, M.; Gelehrter, T.D. Identification and CDNA Cloning of a Novel RNA-Binding Protein That Interacts with the Cyclic Nucleotide-Responsive Sequence in the Type-1 Plasminogen Activator Inhibitor MRNA. J. Biol. Chem. 2001, 276, 3341–3347. [Google Scholar] [CrossRef] [PubMed]
  17. Griemert, E.-V.; Recarte Pelz, K.; Engelhard, K.; Schäfer, M.K.; Thal, S.C. PAI-1 but Not PAI-2 Gene Deficiency Attenuates Ischemic Brain Injury After Experimental Stroke. Transl. Stroke Res. 2019, 10, 372–380. [Google Scholar] [CrossRef]
  18. Hu, X.; Zan, X.; Xie, Z.; Li, Y.; Lin, S.; Li, H.; You, C. Association Between Plasminogen Activator Inhibitor-1 Genetic Polymorphisms and Stroke Susceptibility. Mol. Neurobiol. 2017, 54, 328–341. [Google Scholar] [CrossRef]
  19. Jood, K.; Ladenvall, P.; Tjärnlund-Wolf, A.; Ladenvall, C.; Andersson, M.; Nilsson, S.; Blomstrand, C.; Jern, C. Fibrinolytic Gene Polymorphism and Ischemic Stroke. Stroke 2005, 36, 2077–2081. [Google Scholar] [CrossRef] [PubMed]
  20. Taraborrelli, S. Physiology, Production and Action of Progesterone. Acta Obstet. Gynecol. Scand. 2015, 94, 8–16. [Google Scholar] [CrossRef]
  21. Tsuboyama, K.; Osaki, T.; Matsuura-Suzuki, E.; Kozuka-Hata, H.; Okada, Y.; Oyama, M.; Ikeuchi, Y.; Iwasaki, S.; Tomari, Y. A Widespread Family of Heat-Resistant Obscure (Hero) Proteins Protect against Protein Instability and Aggregation. PLoS Biol. 2020, 18, e3000632. [Google Scholar] [CrossRef]
  22. Kobzeva, K.A.; Shilenok, I.V.; Belykh, A.E.; Gurtovoy, D.E.; Bobyleva, L.A.; Krapiva, A.B.; Stetskaya, T.A.; Bykanova, M.A.; Mezhenskaya, A.A.; Lysikova, E.A.; et al. C9orf16 (BBLN) Gene, Encoding a Member of Hero Proteins, Is a Novel Marker in Ischemic Stroke Risk. Res. Results Biomed. 2022, 8, 278–292. [Google Scholar] [CrossRef]
  23. Schafer, K.; Müller, K.; Hecke, A.; Mounier, E.; Goebel, J.; Loskutoff, D.J.; Konstantinides, S. Enhanced Thrombosis in Atherosclerosis-Prone Mice Is Associated with Increased Arterial Expression of Plasminogen Activator Inhibitor-1. Arterioscler. Thromb. Vasc. Biol. 2003, 23, 2097–2103. [Google Scholar] [CrossRef] [PubMed]
  24. de Paula Sabino, A.; Ribeiro, D.D.; Domingueti, C.P.; dos Santos, M.S.; Gadelha, T.; Dusse LM, S.; das Graças Carvalho, M.; Fernandes, A.P. Plasminogen Activator Inhibitor-1 4G/5G Promoter Polymorphism and PAI-1 Plasma Levels in Young Patients with Ischemic Stroke. Mol. Biol. Rep. 2011, 38, 5355–5360. [Google Scholar] [CrossRef]
  25. Stefansson, S.; Lawrence, D.A.; Argraves, W.S. Plasminogen Activator Inhibitor-1 and Vitronectin Promote the Cellular Clearance of Thrombin by Low Density Lipoprotein Receptor-Related Proteins 1 and 2. J. Biol. Chem. 1996, 271, 8215–8220. [Google Scholar] [CrossRef] [PubMed]
  26. Chomiki, N.; Henry, M.; Alessi, M.C.; Anfosso, F.; Juhan-Vague, I. Plasminogen Activator Inhibitor-1 Expression in Human Liver and Healthy or Atherosclerotic Vessel Walls. Thromb. Haemost. 1994, 72, 44–53. [Google Scholar] [CrossRef]
  27. Heaton, J.H.; Dlakic, W.M.; Gelehrter, T.D. Posttranscriptional Regulation of PAI-1 Gene Expression. Thromb. Haemost. 2003, 89, 959–966. [Google Scholar]
  28. Lijnen, H.R. Pleiotropic Functions of Plasminogen Activator Inhibitor-1. J. Thromb. Haemost. 2005, 3, 35–45. [Google Scholar] [CrossRef]
  29. Alturfan, A.A.; Eralp, L.; Emekli, N. Investigation of Inflammatory and Hemostatic Parameters in Female Patients Undergoing Total Knee Arthroplasty Surgery. Inflammation 2008, 31, 414–421. [Google Scholar] [CrossRef] [PubMed]
  30. Jeon, Y.J.; Kim, Y.R.; Lee, B.E.; Choi, Y.S.; Kim, J.H.; Shin, J.E.; Rah, H.; Cha, S.H.; Lee, W.S.; Kim, N.K. Genetic Association of Five Plasminogen Activator Inhibitor-1 (PAI-1) Polymorphisms and Idiopathic Recurrent Pregnancy Loss in Korean Women. Thromb. Haemost. 2013, 110, 742–750. [Google Scholar] [CrossRef] [PubMed]
  31. Li, X.; Fang, P.; Yang, W.Y.; Wang, H.; Yang, X. IL-35, as a Newly Proposed Homeostasis-Associated Molecular Pattern, Plays Three Major Functions Including Anti-Inflammatory Initiator, Effector, and Blocker in Cardiovascular Diseases. Cytokine 2019, 122, 154076. [Google Scholar] [CrossRef]
  32. Fu, H.; Yu, J.; Choi, E.T.; Wang, H.; Yang, X. IL-35 Inhibits Ischemia/Hypoxia-Induced Angiogenesis, Suggesting That This Anti-Inflammatory Cytokine Plays New Roles in the Recovery Stage of Angiogenesis. Circulation 2018, 138 (Suppl. S1), 12666. [Google Scholar]
  33. Bushueva, O.Y.; Stetskaya, T.A.; Polonikov, A.V.; Ivanov, V.P. The relationship between polymorphism 640A>G of the CYBA gene with the risk of ischemic stroke in the population of the Central Russia. Zhurnal Nevrol. I Psikhiatrii Im. SS Korsakova 2015, 115 Pt 2, 38–41. [Google Scholar] [CrossRef] [PubMed]
  34. Fava, C.; Montagnana, M.; Danese, E.; Almgren, P.; Hedblad, B.; Engström, G.; Berglund, G.; Minuz, P.; Melander, O. Homozygosity for the EPHX2 K55R Polymorphism Increases the Long-Term Risk of Ischemic Stroke in Men: A Study in Swedes. Pharmacogenet. Genomics 2010, 20, 94–103. [Google Scholar] [CrossRef] [PubMed]
  35. Vaura, F.; Palmu, J.; Aittokallio, J.; Kauko, A.; Niiranen, T. Genetic, Molecular, and Cellular Determinants of Sex-Specific Cardiovascular Traits. Circ. Res. 2022, 130, 611–631. [Google Scholar] [CrossRef]
  36. Stetskaia, T.A.; Bushueva, O.I.; Bulgakova, I.V.; Vialykh, E.K.; Shuteeva, T.V.; Biriukov, A.E.; Ivanov, V.P.; Polonikov, A.V. Association of T174M polymorphism of the angiotensinogen gene with the higher risk of cerebral stroke in women. Ter. Arkh. 2014, 86, 66–71. [Google Scholar] [CrossRef] [PubMed]
  37. Intlekofer, K.A.; Petersen, S.L. 17β-Estradiol and Progesterone Regulate Multiple Progestin Signaling Molecules in the Anteroventral Periventricular Nucleus, Ventromedial Nucleus and Sexually Dimorphic Nucleus of the Preoptic Area in Female Rats. Neuroscience 2011, 176, 86–92. [Google Scholar] [CrossRef] [PubMed]
  38. Intlekofer, K.A.; Petersen, S.L. Distribution of mRNAs Encoding Classical Progestin Receptor, Progesterone Membrane Components 1 and 2, Serpine mRNA Binding Protein 1, and Progestin and ADIPOQ Receptor Family Members 7 and 8 in Rat Forebrain. Neuroscience 2011, 172, 55–65. [Google Scholar] [CrossRef] [PubMed]
  39. Ishikawa, S.; Matsumura, K.; Kitamura, N.; Takanami, Y.; Ito, S. Multi-Omics Analysis: Repeated Exposure of a 3D Bronchial Tissue Culture to Whole-Cigarette Smoke. Toxicol. Vitro Int. J. Publ. Assoc. BIBRA 2019, 54, 251–262. [Google Scholar] [CrossRef]
  40. Panagiotakos, D.B.; Kokkinos, P.; Manios, Y.; Pitsavos, C. Physical Activity and Markers of Inflammation and Thrombosis Related to Coronary Heart Disease. Prev. Cardiol. 2004, 7, 190–194. [Google Scholar] [CrossRef]
  41. Diteepeng, T.; del Monte, F.; Luciani, M. The Long and Winding Road to Target Protein Misfolding in Cardiovascular Diseases. Eur. J. Clin. Invest. 2021, 51, e13504. [Google Scholar] [CrossRef]
  42. Santos-Parker, J.R.; Santos-Parker, K.S.; McQueen, M.B.; Martens, C.R.; Seals, D.R. Habitual Aerobic Exercise and Circulating Proteomic Patterns in Healthy Adults: Relation to Indicators of Healthspan. J. Appl. Physiol. 2018, 125, 1646–1659. [Google Scholar] [CrossRef]
  43. Needham, E.J.; Humphrey, S.J.; Cooke, K.C.; Fazakerley, D.J.; Duan, X.; Parker, B.L.; James, D.E. Phosphoproteomics of Acute Cell Stressors Targeting Exercise Signaling Networks Reveal Drug Interactions Regulating Protein Secretion. Cell Rep. 2019, 29, 1524–1538.e6. [Google Scholar] [CrossRef]
  44. Yoshizaki, T.; Ishihara, J.; Kotemori, A.; Yamamoto, J.; Kokubo, Y.; Saito, I.; Yatsuya, H.; Yamagishi, K.; Sawada, N.; Iwasaki, M.; et al. Association of Vegetable, Fruit, and Okinawan Vegetable Consumption with Incident Stroke and Coronary Heart Disease. J. Epidemiol. 2020, 30, 37–45. [Google Scholar] [CrossRef] [PubMed]
  45. Wang, J.; Li, J.; Liu, F.; Huang, K.; Yang, X.; Liu, X.; Cao, J.; Chen, S.; Shen, C.; Yu, L.; et al. Genetic Predisposition, Fruit Intake and Incident Stroke: A Prospective Chinese Cohort Study. Nutrients 2022, 14, 5056. [Google Scholar] [CrossRef] [PubMed]
  46. Polonikov, A.; Vialykh, E.; Vasil’eva, O.; Bulgakova, I.; Bushueva, O.; Illig, T.; Solodilova, M. Genetic Variation in Glutathione S-Transferase Genes and Risk of Nonfatal Cerebral Stroke in Patients Suffering from Essential Hypertension. J. Mol. Neurosci. 2012, 47, 511–513. [Google Scholar] [CrossRef]
  47. Bushueva, O.Y.U.; Bulgakova, I.V.; Ivanov, V.P.; Polonikov, A.V. Association of Flavin Monooxygenase Gene E158K Polymorphism with Chronic Heart Disease Risk. Bull. Exp. Biol. Med. 2015, 159, 776–778. [Google Scholar] [CrossRef] [PubMed]
  48. Sorokin, A.V.; Kotani, K.; Bushueva, O.Y.; Polonikov, A.V. Antioxidant-Related Gene Polymorphisms Associated with the Cardio-Ankle Vascular Index in Young Russians. Cardiol. Young 2016, 26, 677–682. [Google Scholar] [CrossRef] [PubMed]
  49. Polonikov, A.; Bocharova, I.; Azarova, I.; Klyosova, E.; Bykanova, M.; Bushueva, O.; Polonikova, A.; Churnosov, M.; Solodilova, M. The Impact of Genetic Polymorphisms in Glutamate-Cysteine Ligase, a Key Enzyme of Glutathione Biosynthesis, on Ischemic Stroke Risk and Brain Infarct Size. Life 2022, 12, 602. [Google Scholar] [CrossRef]
  50. Sorokin, A.V.; Kotani, K.; Bushueva, O.Y. Association of Matrix Metalloproteinase 3 and γ-Glutamyltransferase 1 Gene Polymorphisms with the Cardio-Ankle Vascular Index in Young Russians. Cardiol. Young 2016, 26, 1238–1240. [Google Scholar] [CrossRef]
  51. Guan, R.; Van Le, Q.; Yang, H.; Zhang, D.; Gu, H.; Yang, Y.; Sonne, C.; Lam, S.S.; Zhong, J.; Jianguang, Z.; et al. Review of Dietary Phytochemicals and Their Relation to Oxidative Stress and Human Diseases. Chemosphere 2021, 271, 129499. [Google Scholar] [CrossRef]
  52. Pacifici, F.; Rovella, V.; Pastore, D.; Bellia, A.; Abete, P.; Donadel, G.; Santini, S.; Beck, H.; Ricordi, C.; Daniele, N.D.; et al. Polyphenols and Ischemic Stroke: Insight into One of the Best Strategies for Prevention and Treatment. Nutrients 2021, 13, 1967. [Google Scholar] [CrossRef]
  53. Vita, J.A. Polyphenols and Cardiovascular Disease: Effects on Endothelial and Platelet Function. Am. J. Clin. Nutr. 2005, 81, 292S–297S. [Google Scholar] [CrossRef] [PubMed]
  54. Bazzano, L.A.; He, J.; Ogden, L.G.; Loria, C.; Vupputuri, S.; Myers, L.; Whelton, P.K. Dietary Intake of Folate and Risk of Stroke in US Men and Women: NHANES I Epidemiologic Follow-up Study. National Health and Nutrition Examination Survey. Stroke 2002, 33, 1183–1188. [Google Scholar] [CrossRef]
  55. Margetic, S.; Gazzola, C.; Pegg, G.G.; Hill, R.A. Leptin: A Review of Its Peripheral Actions and Interactions. Int. J. Obes. 2002, 26, 1407–1433. [Google Scholar] [CrossRef] [PubMed]
  56. Funahashi, H.; Yada, T.; Suzuki, R.; Shioda, S. Distribution, Function, and Properties of Leptin Receptors in the Brain. Int. Rev. Cytol. 2003, 224, 1–27. [Google Scholar] [CrossRef] [PubMed]
  57. Cao, W.; Liu, F.; Li, R.W.; Yang, R.; Wang, Y.; Xue, C.; Tang, Q. Triacylglycerol Rich in Docosahexaenoic Acid Regulated Appetite via the Mediation of Leptin and Intestinal Epithelial Functions in High-Fat, High-Sugar Diet-Fed Mice. J. Nutr. Biochem. 2022, 99, 108856. [Google Scholar] [CrossRef]
  58. Bungau, S.; Behl, T.; Tit, D.M.; Banica, F.; Bratu, O.G.; Diaconu, C.C.; Nistor-Cseppento, C.D.; Bustea, C.; Aron, R.A.C.; Vesa, C.M. Interactions between Leptin and Insulin Resistance in Patients with Prediabetes, with and without NAFLD. Exp. Ther. Med. 2020, 20, 197. [Google Scholar] [CrossRef]
  59. Gruzdeva, O.; Borodkina, D.; Uchasova, E.; Dyleva, Y.; Barbarash, O. Leptin Resistance: Underlying Mechanisms and Diagnosis. Diabetes Metab. Syndr. Obes. 2019, 12, 191–198. [Google Scholar] [CrossRef]
  60. Izquierdo, A.G.; Crujeiras, A.B.; Casanueva, F.F.; Carreira, M.C. Leptin, Obesity, and Leptin Resistance: Where Are We 25 Years Later? Nutrients 2019, 11, 2704. [Google Scholar] [CrossRef]
  61. Loskutoff, D.J.; Samad, F. The Adipocyte and Hemostatic Balance in Obesity: Studies of PAI-1. Arterioscler. Thromb. Vasc. Biol. 1998, 18, 1–6. [Google Scholar] [CrossRef]
  62. Kershaw, E.E.; Flier, J.S. Adipose Tissue as an Endocrine Organ. J. Clin. Endocrinol. Metab. 2004, 89, 2548–2556. [Google Scholar] [CrossRef] [PubMed]
  63. Sergeeva, C.N.; Sokorev, S.N.; Efremova, O.A.; Sorokina, I.N. Analysis of the level of population endogamia as the basis of population-genetic and medical-genetic studies. Res. Results Biomed. 2021, 7, 375–387. [Google Scholar] [CrossRef]
  64. Vialykh, E.K.; Solidolova, M.A.; Bushueva, O.I.; Bulgakova, I.V.; Polonikov, A.V. [Catalase gene polymorphism is associated with increased risk of cerebral stroke in hypertensive patients]. Zhurnal Nevrol. I Psikhiatrii Im. SS Korsakova 2012, 112 Pt 2, 3–7. [Google Scholar]
  65. World Health Organization. Diet, Nutrition, and the Prevention of Chronic Diseases: Report of a Joint WHO/FAO Expert Consultation; World Health Organization: Geneva, Switzerland, 2003; Volume 916. [Google Scholar]
  66. Gutin, B.; Owens, S. The Influence of Physical Activity on Cardiometabolic Biomarkers in Youths: A Review. Pediatr. Exerc. Sci. 2011, 23, 169–185. [Google Scholar] [CrossRef]
  67. Fernandes, R.A.; Zanesco, A. Early Physical Activity Promotes Lower Prevalence of Chronic Diseases in Adulthood. Hypertens. Res. Off. J. Jpn. Soc. Hypertens. 2010, 33, 926–931. [Google Scholar] [CrossRef]
  68. Colbert, L.H.; Visser, M.; Simonsick, E.M.; Tracy, R.P.; Newman, A.B.; Kritchevsky, S.B.; Pahor, M.; Taaffe, D.R.; Brach, J.; Rubin, S.; et al. Physical Activity, Exercise, and Inflammatory Markers in Older Adults: Findings from The Health, Aging and Body Composition Study. J. Am. Geriatr. Soc. 2004, 52, 1098–1104. [Google Scholar] [CrossRef]
  69. World Health Organization. WHO European Regional Obesity Report 2022; World Health Organization. Regional Office for Europe: Geneva, Switzerland, 2022. [Google Scholar]
  70. Bushueva, O.; Solodilova, M.; Ivanov, V.; Polonikov, A. Gender-Specific Protective Effect of the −463G>A Polymorphism of Myeloperoxidase Gene against the Risk of Essential Hypertension in Russians. J. Am. Soc. Hypertens. 2015, 9, 902–906. [Google Scholar] [CrossRef] [PubMed]
  71. Bushueva, O. Single Nucleotide Polymorphisms in Genes Encoding Xenobiotic Metabolizing Enzymes Are Associated with Predisposition to Arterial Hypertension. Res. Results Biomed. 2020, 6, 447–456. [Google Scholar] [CrossRef]
  72. Dong, S.; Boyle, A.P. Predicting Functional Variants in Enhancer and Promoter Elements Using RegulomeDB. Hum. Mutat. 2019, 40, 1292–1298. [Google Scholar] [CrossRef]
  73. Ward, L.D.; Kellis, M. HaploReg: A Resource for Exploring Chromatin States, Conservation, and Regulatory Motif Alterations within Sets of Genetically Linked Variants. Nucleic Acids Res. 2012, 40, D930–D934. [Google Scholar] [CrossRef]
  74. Koressaar, T.; Remm, M. Enhancements and Modifications of Primer Design Program Primer3. Bioinforma. Oxf. Engl. 2007, 23, 1289–1291. [Google Scholar] [CrossRef]
  75. Strimmer, K. A Unified Approach to False Discovery Rate Estimation. BMC Bioinform. 2008, 9, 303. [Google Scholar] [CrossRef]
  76. Solé, X.; Guinó, E.; Valls, J.; Iniesta, R.; Moreno, V. SNPStats: A Web Tool for the Analysis of Association Studies. Bioinforma. Oxf. Engl. 2006, 22, 1928–1929. [Google Scholar] [CrossRef] [PubMed]
  77. Andrade, C. Multiple Testing and Protection Against a Type 1 (False Positive) Error Using the Bonferroni and Hochberg Corrections. Indian J. Psychol. Med. 2019, 41, 99–100. [Google Scholar] [CrossRef] [PubMed]
  78. Võsa, U.; Claringbould, A.; Westra, H.-J.; Bonder, M.J.; Deelen, P.; Zeng, B.; Kirsten, H.; Saha, A.; Kreuzhuber, R.; Kasela, S.; et al. Unraveling the Polygenic Architecture of Complex Traits Using Blood EQTL Metaanalysis. bioRxiv 2018. [Google Scholar] [CrossRef]
  79. Zheng, Z.; Huang, D.; Wang, J.; Zhao, K.; Zhou, Y.; Guo, Z.; Zhai, S.; Xu, H.; Cui, H.; Yao, H.; et al. QTLbase: An Integrative Resource for Quantitative Trait Loci across Multiple Human Molecular Phenotypes. Nucleic Acids Res. 2020, 48, D983–D991. [Google Scholar] [CrossRef]
  80. von Mering, C.; Jensen, L.J.; Snel, B.; Hooper, S.D.; Krupp, M.; Foglierini, M.; Jouffre, N.; Huynen, M.A.; Bork, P. STRING: Known and Predicted Protein–Protein Associations, Integrated and Transferred across Organisms. Nucleic Acids Res. 2005, 33, D433–D437. [Google Scholar] [CrossRef]
  81. Shin, S.; Hudson, R.; Harrison, C.; Craven, M.; Keleş, S. AtSNP Search: A Web Resource for Statistically Evaluating Influence of Human Genetic Variation on Transcription Factor Binding. Bioinforma. Oxf. Engl. 2019, 35, 2657–2659. [Google Scholar] [CrossRef] [PubMed]
  82. The Gene Ontology Consortium. The Gene Ontology Resource: 20 Years and Still GOing Strong. Nucleic Acids Res. 2019, 47, D330–D338. [Google Scholar] [CrossRef] [PubMed]
  83. Davis, A.P.; Grondin, C.J.; Johnson, R.J.; Sciaky, D.; Wiegers, J.; Wiegers, T.C.; Mattingly, C.J. Comparative Toxicogenomics Database (CTD): Update 2021. Nucleic Acids Res. 2021, 49, D1138–D1143. [Google Scholar] [CrossRef]
Figure 1. Associations of SERBP1 genotypes with activated partial thromboplastin time and body mass index. (A)—APTT values for rs12561767 in the entire group (p = 0.02) and in the group of patients with low fruit/vegetable intake (p = 0.01); (B)—APTT values for rs6702742 in the entire group (p = 0.04) and in the group of patients with low fruit/vegetable intake (p = 0.036); (C)—APTT values for rs105874 in the group of patients with low fruit/vegetable intake (p = 0.04); (D)—APTT values for rs12566098 in the group of patients with low fruit/vegetable intake (p = 0.02); (E)—APTT values for rs4655707 in the entire group (p = 0.04); (F)—BMI values for rs6702742 in the group of patients with BMI < 25 (p = 0.006); (G)—BMI values for rs4655707 in the group of patients with normal fruit/vegetable intake (p = 0.038) and in the group of patients with BMI < 25 (p = 0.01); (H)—BMI values for rs12561767 in the group of patients with BMI < 25 (p = 0.0023).
Ijms 24 08716 g001
Figure 2. Predicted Interaction Partners of SERBP1 (https://string-db.org/ (accessed on 22 January 2023)).
Ijms 24 08716 g002
Figure 3. Study design.
Ijms 24 08716 g003
Table 1. Results of the analysis of associations between SERBP1 gene SNPs and ischemic stroke risk.
Genetic VariantEffect AlleleOther AlleleNOR (95% CI) 1p 2
rs4655707TC18831.07 [0.93; 1.23]0.35
rs1058074CT19151.15 [0.99; 1.35]0.071
rs12561767 *GA18571.11 [0.96; 1.27]0.16
rs12566098 *CG20601.28 [1.10; 1.49]0.001
rs6702742AG18981.04 [0.91; 1.20]0.54
All calculations were performed relative to the minor alleles (Effect allele) with adjustment for sex, age, smoking; 1—odds ratio and 95% confidence interval; 2p-value; tag SNPs are marked with an asterisk; statistically significant differences are marked in bold.
Table 2. Subgroups analysis of associations between SERBP1 SNPs and IS risk depending on sex, smoking status, body mass index, physical activity level, and fruit and vegetable intake.
Genetic VariantEffect AlleleOther AlleleNOR (95% CI) 1p 2 (Pbonf)NOR (95% CI) 1p 2 (Pbonf)
MalesFemales
rs4655707TC9291.08 [0.90; 1.31]0.399541.07 [0.88; 1.29]0.51
rs1058074CT9501.12 [0.91; 1.38]0.299651.29 [1.05; 1.58]0.02
rs12561767 *GA9181.12 [0.93; 1.35]0.239391.09 [0.90; 1.32]0.39
rs12566098 *CG10261.25 [1.02; 1.53]0.0311241.39 [1.14; 1.71]0.002
rs6702742AG9391.10 [0.92; 1.32]0.299591.00 [0.82; 1.20]0.97
NonsmokersSmokers
rs4655707TC12811.11 [0.94; 1.31]0.226020.93 [0.73; 1.20]0.59
rs1058074CT13171.32 [1.10; 1.59]0.0035980.87 [0.67; 1.14]0.32
rs12561767 *GA12771.18 [1.00; 1.39]0.0545800.94 [0.73; 1.21]0.62
rs12566098 *CG14001.43 [1.20; 1.72]1 × 10−46601.02 [0.79; 1.32]0.89
rs6702742AG13051.09 [0.93; 1.29]0.295930.92 [0.72; 0.72]0.49
Low physical activity (f+)Normal physical activity level (f-)
rs4655707TC13871.07 [0.89; 1.28]0.46 (0.92)15461.06 [0.90; 1.24]0.48 (0.96)
rs1058074CT14001.26 [1.04; 1.54]0.02 (0.04)15671.14 [0.96; 1.36]0.14 (0.28)
rs12561767 *GA13641.17 [0.98; 1.40]0.086 (0.172)15261.05 [0.90; 1.23]0.54 (1.0)
rs12566098 *CG15251.39 [1.15; 1.68]9 × 10⁻⁴ (0.002)16921.26 [1.06; 1.49]0.009 (0.02)
rs6702742AG14111.10 [0.93; 1.31]0.3 (0.6)15641.00 [0.85; 1.17]0.99 (1.0)
Low fruit/vegetable intake (f+)Normal fruit/vegetable intake (f-)
rs4655707TC14921.08 [0.92; 1.28]0.32 (0.64)14411.04 [0.87; 1.23]0.68 (1.0)
rs1058074CT15141.24 [1.04; 1.48]0.02 (0.04)14531.13 [0.93; 1.37]0.21 (0.42)
rs12561767 *GA14681.08 [0.92; 1.28]0.33 (0.66)14221.11 [0.94; 1.32]0.22 (0.44)
rs12566098*CG16381.37 [1.15; 1.63]4 × 10⁻⁴
(8 × 10⁻⁴)
15791.24 [1.02; 1.49]0.03 (0.06)
rs6702742AG15101.04 [0.89; 1.22]0.62 (1.0)14651.04 [0.87; 1.23]0.67 (1.0)
BMI ≥ 25BMI < 25
rs4655707TC12341.20 [0.95; 1.53]0.13 (0.26)14431.01 [0.85; 1.20]0.91 (1.0)
rs1058074CT12521.47 [1.14; 1.89]0.0045 (0.007)14561.03 [0.85; 1.25]0.74 (1.0)
rs12561767 *GA12131.25 [0.98; 1.59]0.071 (0.142)14301.03 [0.87; 1.22]0.71 (1.0)
rs12566098 *CG13661.52 [1.19; 1.95]0.001 (0.002)15791.17 [0.97; 1.41]0.096 (0.192)
rs6702742AG12721.22 [0.97; 1.54]0.091 (0.182)14781.00 [0.84; 1.18]0.99 (1.0)
1—odds ratio and 95% confidence interval; 2p-value (p-value with Bonferroni correction). All calculations were performed relative to the minor allele (Effect allele). Statistically significant differences are marked in bold; tag SNPs are marked with an asterisk.
Table 3. Relationship between SERBP1 SNPs and cis-eQTL-mediated expression levels of genes in IS-related tissues (blood vessels, brain, whole blood) (according to browsers’ GTEx Portal, eQTLGene).
SNP GTEx Portal Data
(https://gtexportal.org (Accessed on 21 January 2023))
eQTLGene Browser Data (https://www.eqtlgen.org/ (Accessed on 21 January 2023))
Effect AlleleGene Expressedp-ValueEffect (NES)TissueEffect AlleleGene ExpressedZ-Scorep-Value
rs4655707
SERBP1
(T/C)
CIL12RB26.2 × 10−10↑(0.28)Artery—TibialTIL12RB2↑(25.93)2.93 × 10−148
SERBP11.8 × 10−6↓(−0.091)Artery—Tibial
IL12RB23.8 × 10−8↓(−0.13)Whole Blood
rs1058074
SERBP1
(C/T)
TIL12RB21.5 × 10−11↑(0.30)Artery—TibialCIL12RB2↑(16.31)9.01 × 10−60
SERBP18.7 × 10−10↓(−0.12)Artery—Tibial
IL12RB25.6 × 10−7↓(−0.12)Whole Blood
IL12RB23.6 × 10−5↑(0.25)Artery—Aorta
rs12561767 * SERBP1
(G/A)
AIL12RB22.8 × 10−10↑(0.28)Artery—TibialGIL12RB2↑(26.20)2.92 × 10−151
IL12RB29.1 × 10−9↓(−0.14)Whole Blood
SERBP12.3 × 10−6↓(−0.09)Artery—Tibial
rs12566098 * SERBP1
(C/G)
GSERBP11.3 × 10−9↓(−0.12)Artery—TibialCIL12RB2↑(17.40)8.60 × 10−68
IL12RB23.7 × 10−7↓(−0.13)Whole Blood
IL12RB22.3 × 10−11↑(0.30)Artery—Tibial
rs6702742
SERBP1
(A/G)
GIL12RB23.9 × 10−10↑(0.27)Artery—TibialAIL12RB2↑(26.29)2.42 × 10−152
IL12RB21.0 × 10−9↓(−0.14)Whole Blood
SERBP19.5 × 10−7↓(−0.092)Artery—Tibial
tag SNPs are marked with an asterisk.
Table 4. Established associations of the studied SERBP1 SNPs with the cis-mQTL-mediated effect on the level of methylation of CpG-sites.
TraitEffect AlleleTissueEffect Size (Beta)FDR
rs4655707 SERBP1
cg24364144 (chr1:68102479)C Brain-Prefrontal Cortex0.029.5 × 10−14
rs1058074 SERBP1
cg24364144 (chr1:68102479)C Brain-Prefrontal Cortex−0.011.6 × 10−10
rs12561767 SERBP1 *
cg24364144 (chr1:68102479)A Brain-Prefrontal Cortex0.029.5 × 10−14
rs12566098 SERBP1 *
cg24364144 (chr1:68102479)C Brain-Prefrontal Cortex−0.015.1 × 10−11
rs6702742 SERBP1
cg24364144 (chr1:68102479)GBrain-Prefrontal Cortex0.016.5 × 10−13
Note: mQTL with an undetermined effect allele was excluded from the analysis. tag SNPs are marked with an asterisk.
Table 5. Results of aggregated bioinformatic analyses of associations between SNPs in SERBP1 gene cerebrovascular diseases and their intermediate phenotypes.
SNPsPhenotypep-ValueBeta (OR)Sample Size
1.rs4655707 (T/C)1 TOAST other undetermined0.01OR▼ 0.77579487
2.1 TOAST cardio-aortic embolism0.02OR▼ 0.79469470
3.1 Lacunar stroke0.043OR▼ 0.961128,530
4.2 LDL cholesterol0.015Beta▼ −0.00312,028,070
5.2 Leptin0.038Beta▲ 0.009736,525
6.rs1058074 (C/T)1 Lacunar stroke0.020OR▼ 0.954628,530
7.1 TOAST other undetermined0.021OR▼ 0.95469487
8.2 Arm fat ratio0.007Beta▼ −0.0013232,276
9.2 Dyslipidemia0.020OR▲ 1.032256,375
10.2 LDL cholesterol0.020Beta▼ −0.00292,010,200
11.2 Leptin0.037Beta▲ 0.010832,169
12.2 Non-HDL cholesterol0.042Beta▼ −0.00321,096,010
13.2 Total cholesterol0.049Beta▼ −0.00261,921,240
14.rs12561767 * (G/A)1 TOAST other undetermined0.010OR▼ 0.77759487
15.2 LDL cholesterol0.010Beta▼ −0.00322,014,850
16.2 Dyslipidemia0.040OR▲ 1.026456,375
17.2 Leptin0.036Beta▲ 0.009836,521
18.rs12566098 * (C/G)1 TOAST small artery occlusion0.047OR▲ 2.5943254,558
19.2 LDL cholesterol0.010Beta▼ −0.00322,021,740
20.2 Arm fat ratio0.010Beta▼ −0.0112232,276
21.2 Dyslipidemia0.020OR▲ 1.031556,375
22.2 Leptin0.020Beta▲ 0.011834,005
23.2 Non-HDL cholesterol0.030Beta▼ −0.00351,108,320
24.rs6702742 (A/G)1 TOAST other undetermined0.009OR▼ 0.77269487
25.1 TOAST cardio-aortic embolism0.025OR▼ 0.79529470
26.2 Leptin0.002Beta▲ 0.018829,651
27.2 HDL3 cholesterol0.021Beta▲ 0.033610,984
28.2 LDL cholesterol0.024Beta▼ −0.00272,144,190
29.2 Leptin adj BMI0.028Beta▲ 0.017022,924
30.2 Dyslipidemia0.044OR▲ 1.026456,375
1—data obtained using the bioinformatic resource Cerebrovascular Disease Knowledge Portal (https://cd.hugeamp.org/ (accessed on 24 January 2023)); 2—data obtained using the bioinformatic resource Cardiovascular Disease Knowledge Portal (https://cvd.hugeamp.org/ (accessed on 24 January 2023)). Effect alleles are marked in bold; tag SNPs are marked with an asterisk.
Table 6. Baseline and clinical characteristics of the studied groups.
Baseline and Clinical CharacteristicsIS Patients (n = 869)Controls (n = 1191)p-Value
Age, Me [Q1; Q3]62 [55; 70]59 [53; 66] <0.001
GenderMales, N (%)482 (55.5%)544 (45.7%)<0.001
Females, N (%)387 (44.5%)647 (54.3%)
SmokingYes, N (%)419 (48.2%)241 (20.2%)<0.001
No, N (%)450 (51.8%)950 (79.8%)
Low physical activityYes, N (%)334 (40.0%)ND
No, N (%)501 (60.0%)
Low fruit/vegetable consumptionYes, N (%)447 (53.53%)ND
No, N (%)388 (46.47%)
Coronary artery diseaseYes, N (%)264 (26.72%)-
No, N (%)724 (73.28%)-
Type 2 diabetes mellitusYes, N (%)101 (12.11%)-
No, N (%)733 (87.89%)-
Body mass index, Me [Q1; Q3]23 [22; 26] (n = 563)-
OverweightNormal weight (BMI = 18.5–24.9), N (%)388 (68.92%)ND
Overweight (BMI of 25–29.9), N (%)118 (20.96%)
Obesity (BMI of 30 or greater), N (%)57 (10.12%)
Family history of cerebrovascular diseasesYes, N (%)311 (34.44%)ND
No, N (%)592 (65.56%)ND
Age at onset of stroke, Me [Q1; Q3]61 [53; 69] (n = 851)-
Number of strokes including event in question1, N (%)751 (88.35%)-
2, N (%)86 (10.12%)-
3, N (%)13 (1.53%)-
Type of strokeAtherothrombotic, N (%)616 (70.89%)-
Cardioembolic, N (%)160 (18.41%)-
Unspecified, N (%)93 (10.70%)-
Stroke localizationRight/left middle cerebral artery basin, N (%)705 (83.04%)-
Vertebrobasilar basin, N (%)144 (16.96%)-
Area of lesion in stroke, mm2, Me [Q1; Q3]99.50 [30; 461] (n = 776)-
Total cholesterol, mmol/L, Me [Q1; Q3]5.2 [4.4; 5.8] (n = 577)ND
Triglycerides, mmol/L, Me [Q1; Q3]1.3 [1.09; 1.80] (n = 571)ND
Glucose level, mmol/L, Me [Q1; Q3]4.8 [4.3; 5.5] (n = 840)ND
Prothrombin time, seconds, Me [Q1; Q3]10.79 [10.14; 11.70] (n = 827)ND
International normalized ratio, Me [Q1; Q3]1 [0.93; 1.09] (n = 566)ND
Activated partial thromboplastin time, seconds, Me [Q1; Q3]32.6 [29; 37] (n = 569)ND
Alanin aminotransferase, IU/L21.9 [18; 31.2] (n = 646)ND
Aspartate aminotransferase, IU/L28.2 [20.5; 37.4] (n = 646)ND
Statistically significant differences between groups are indicated in bold; ND—no data.
Disclaimer/Publisher’s Note: The statements, opinions and data contained in all publications are solely those of the individual author(s) and contributor(s) and not of MDPI and/or the editor(s). MDPI and/or the editor(s) disclaim responsibility for any injury to people or property resulting from any ideas, methods, instructions or products referred to in the content.

