
Combined Analysis of the Metabolome and Transcriptome to Explore Heat Stress Responses and Adaptation Mechanisms in Celery (Apium graveolens L.)

 , , , , , and
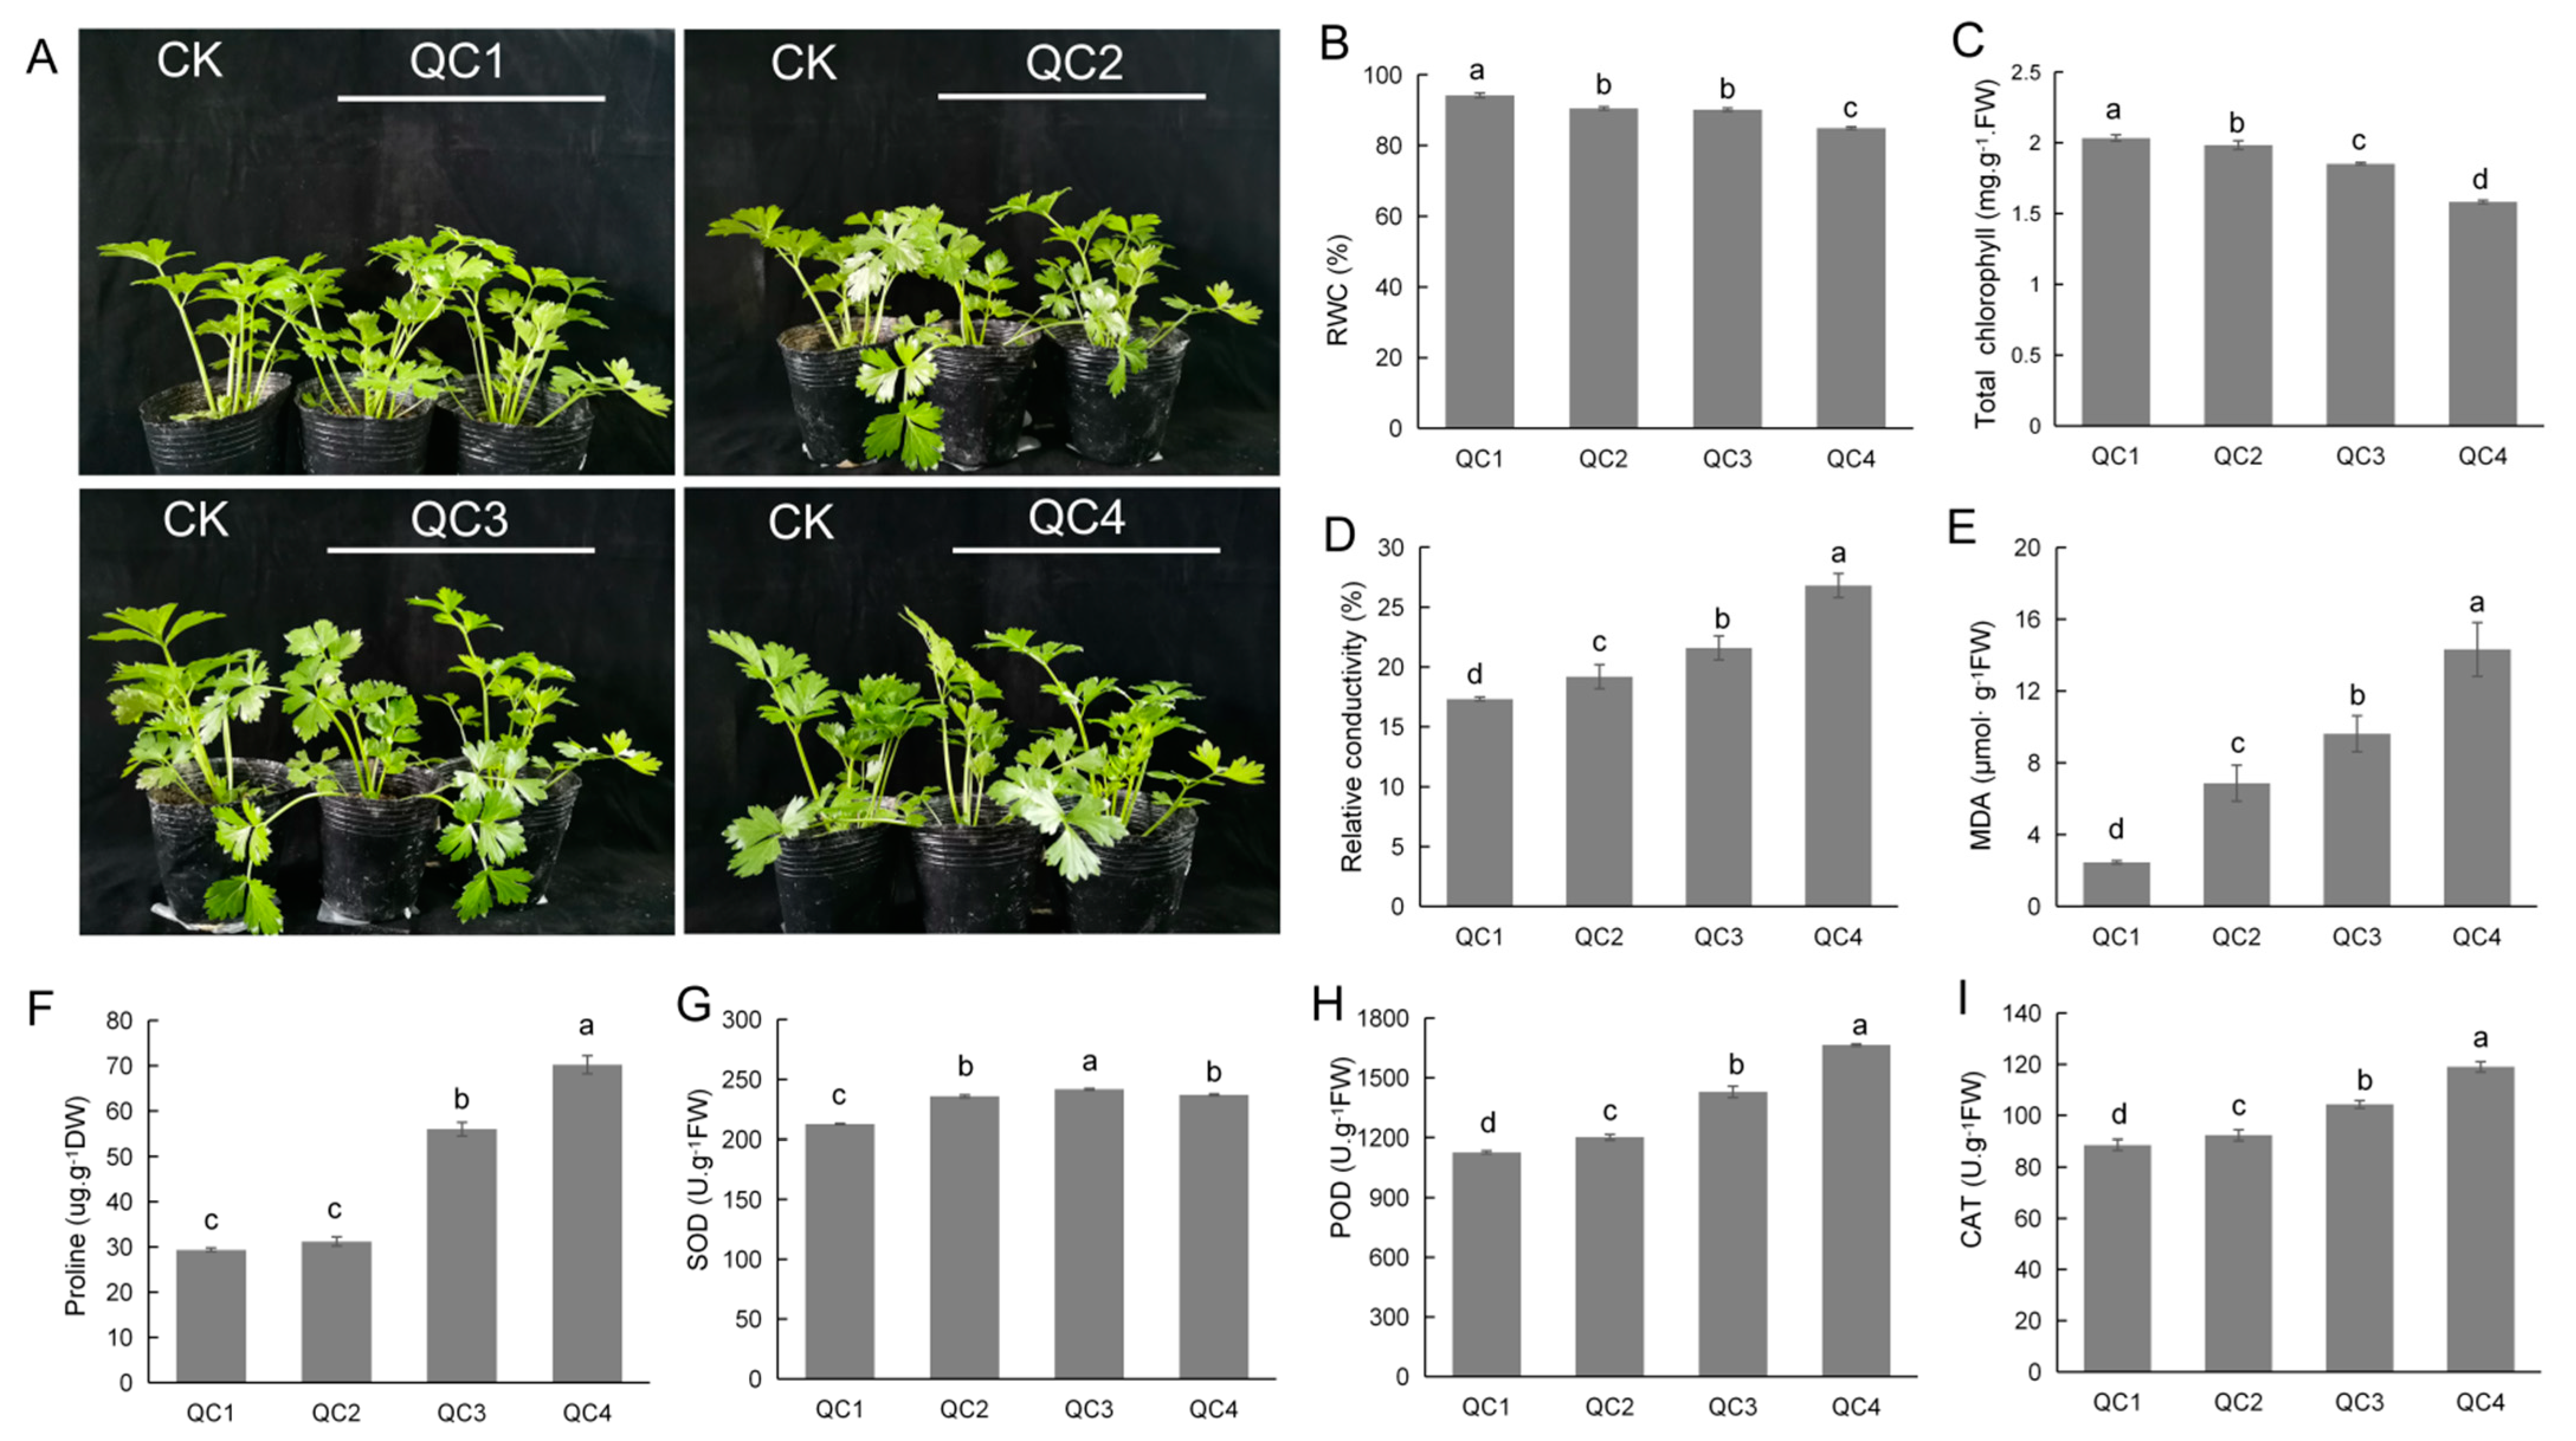
Abstract
:1. Introduction
2. Results
2.1. Analysis of Physiological Characteristics of Celery under Heat Stress
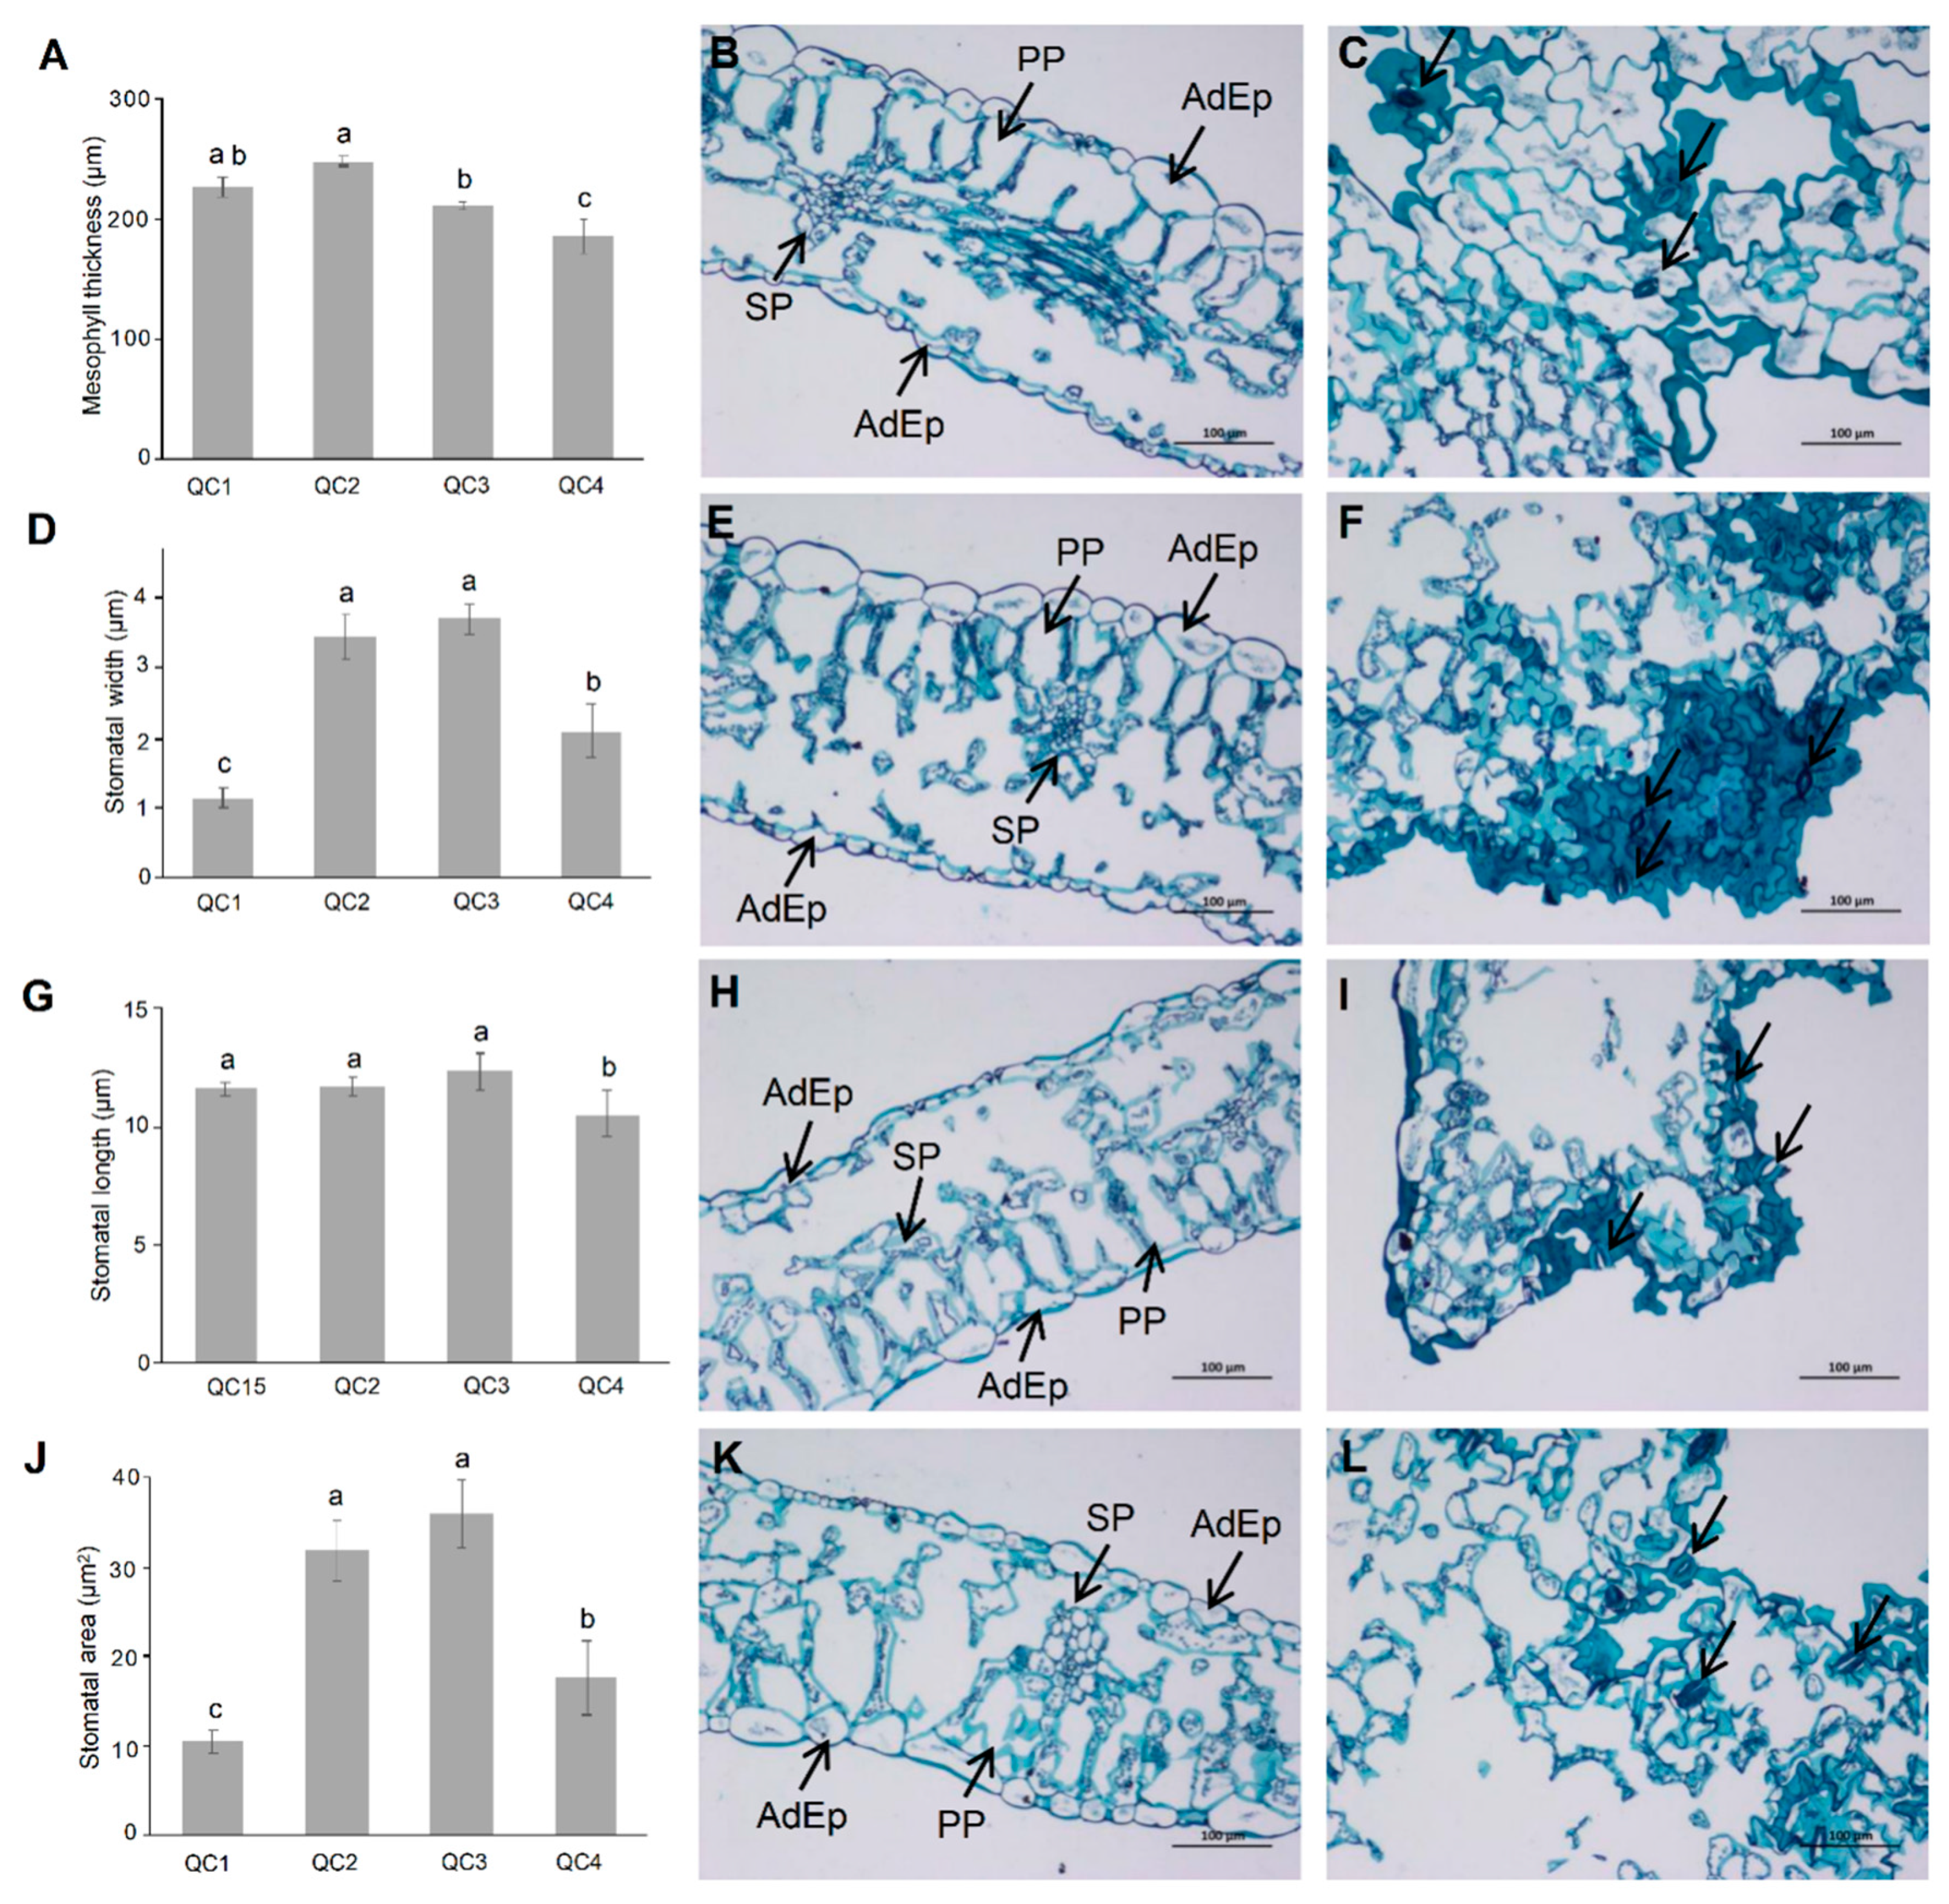
2.2. Changes in Stomatal Movement and Cross-Section of Celery Leaves under Heat Stress
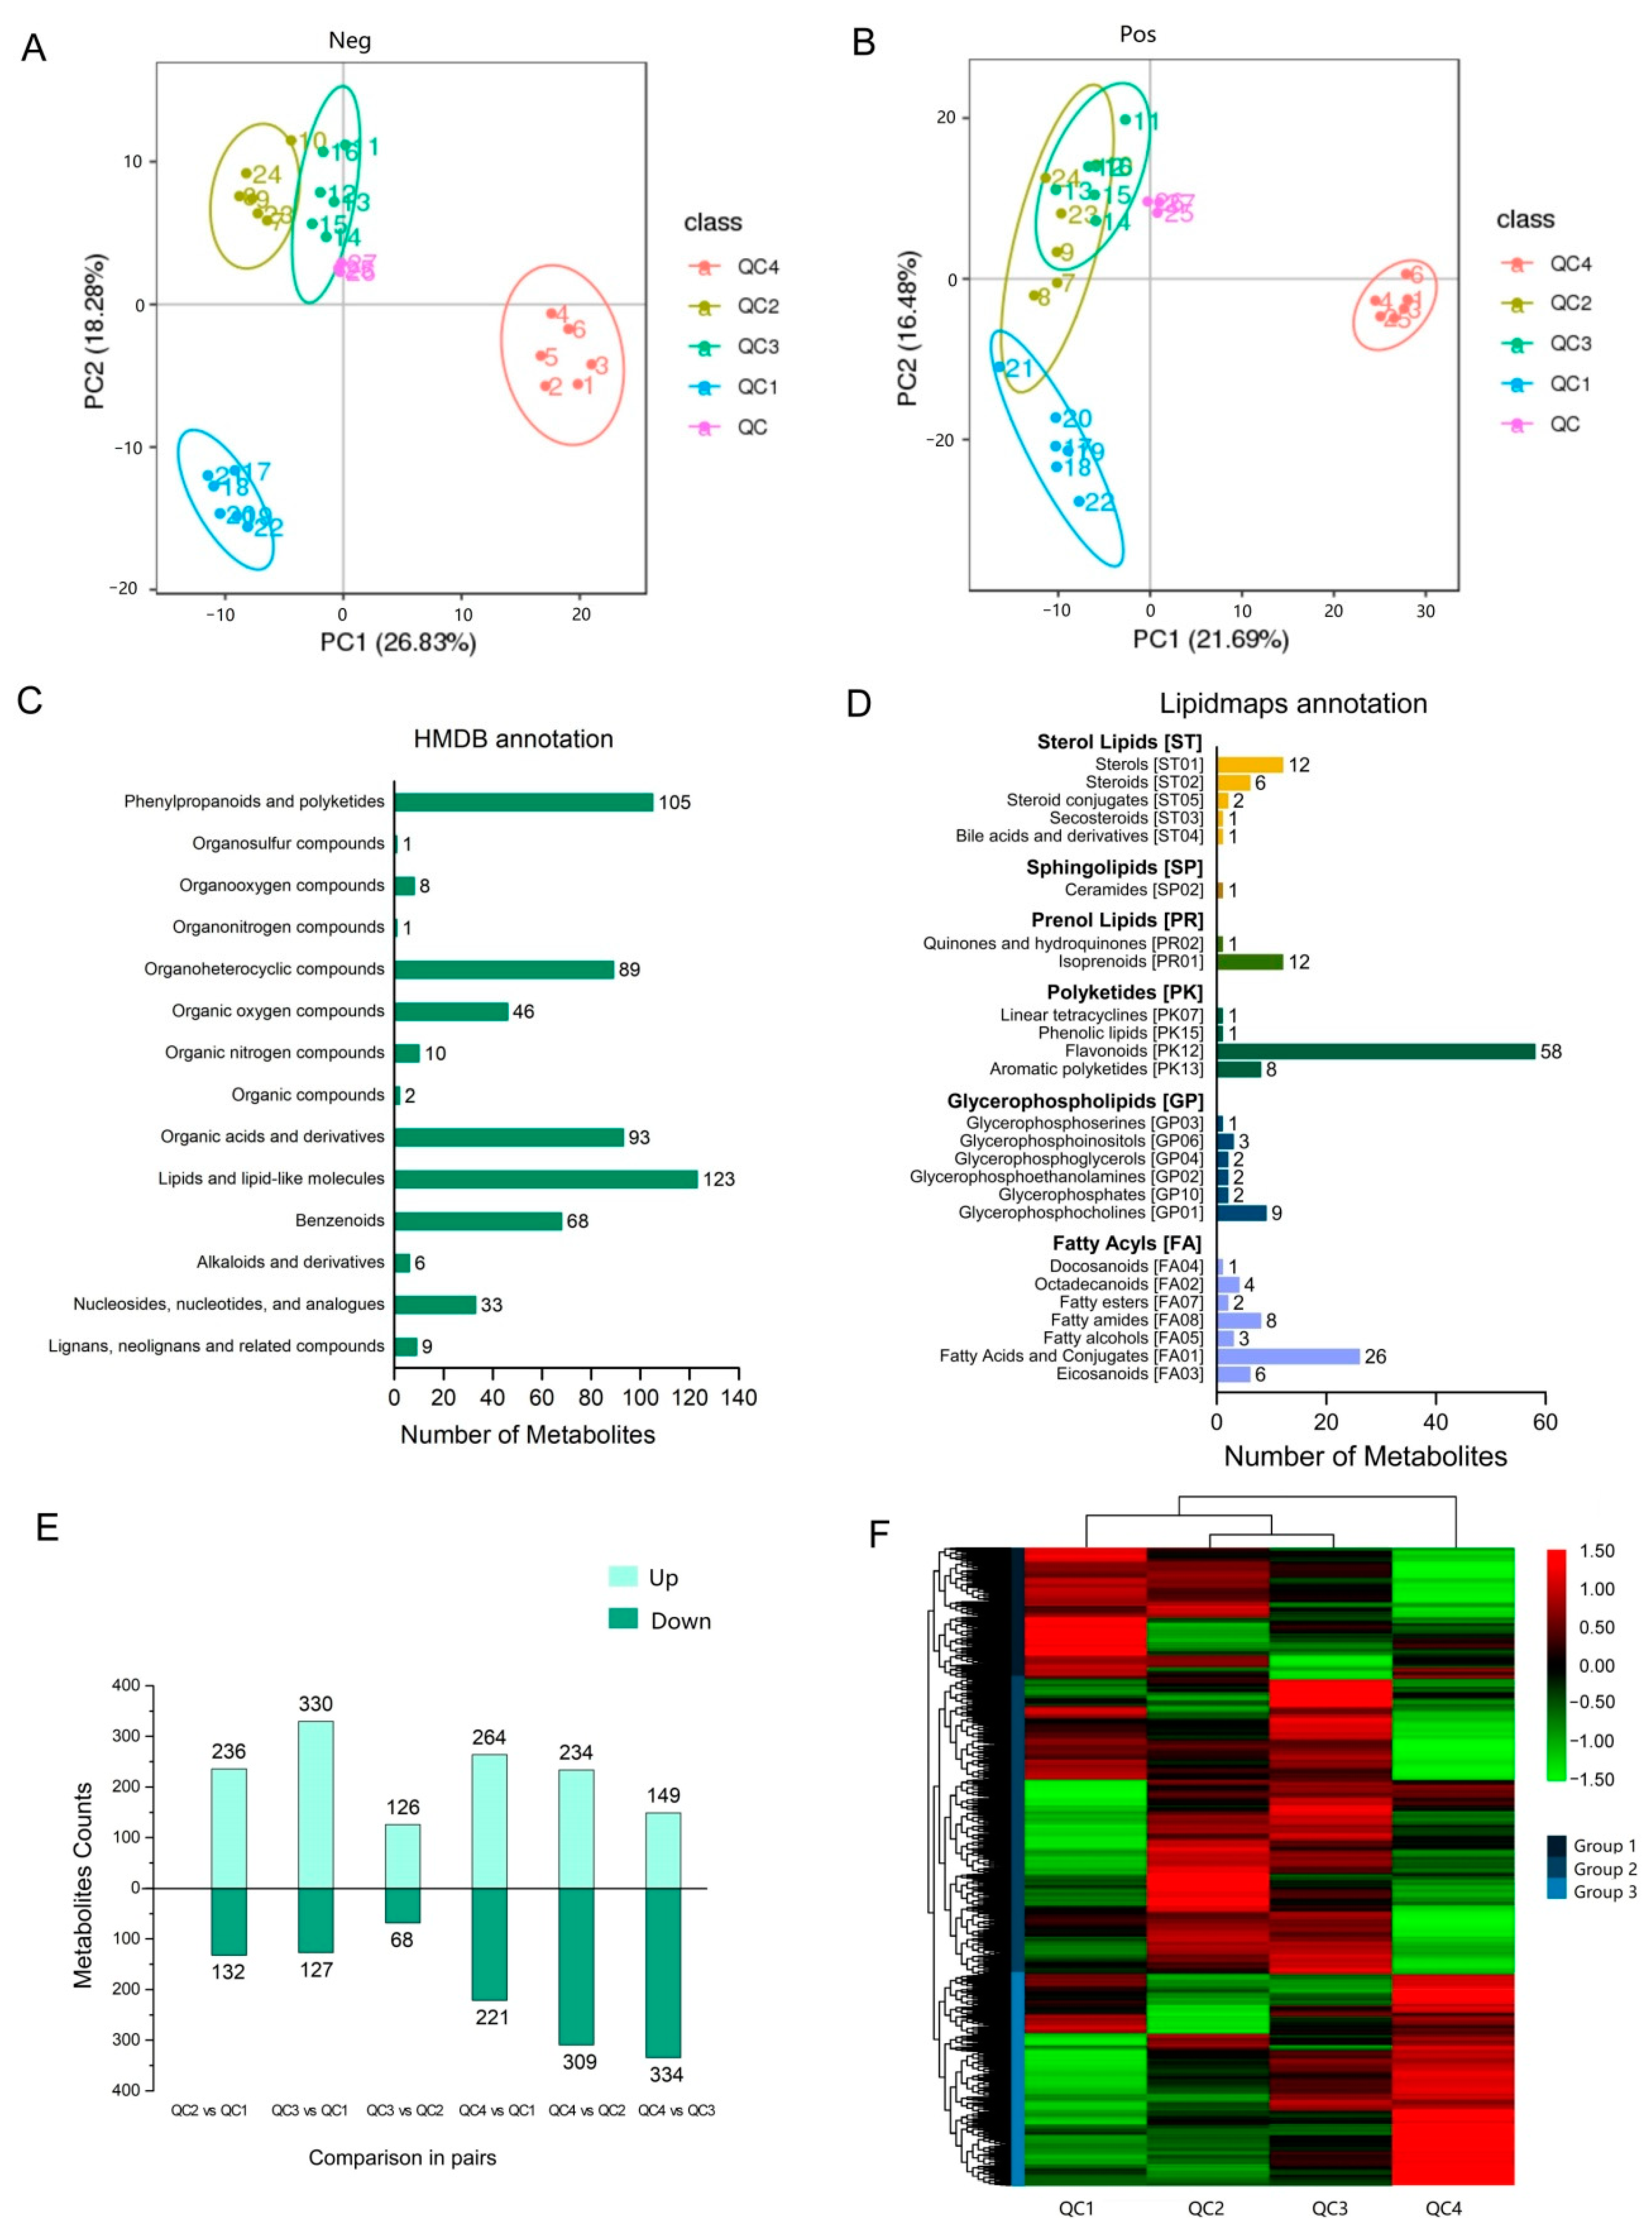
2.3. Metabolomic Analysis of Celery in Response to Heat Stress
2.3.1. Overall Analysis of Metabolite Components
2.3.2. Differential Metabolite Analysis
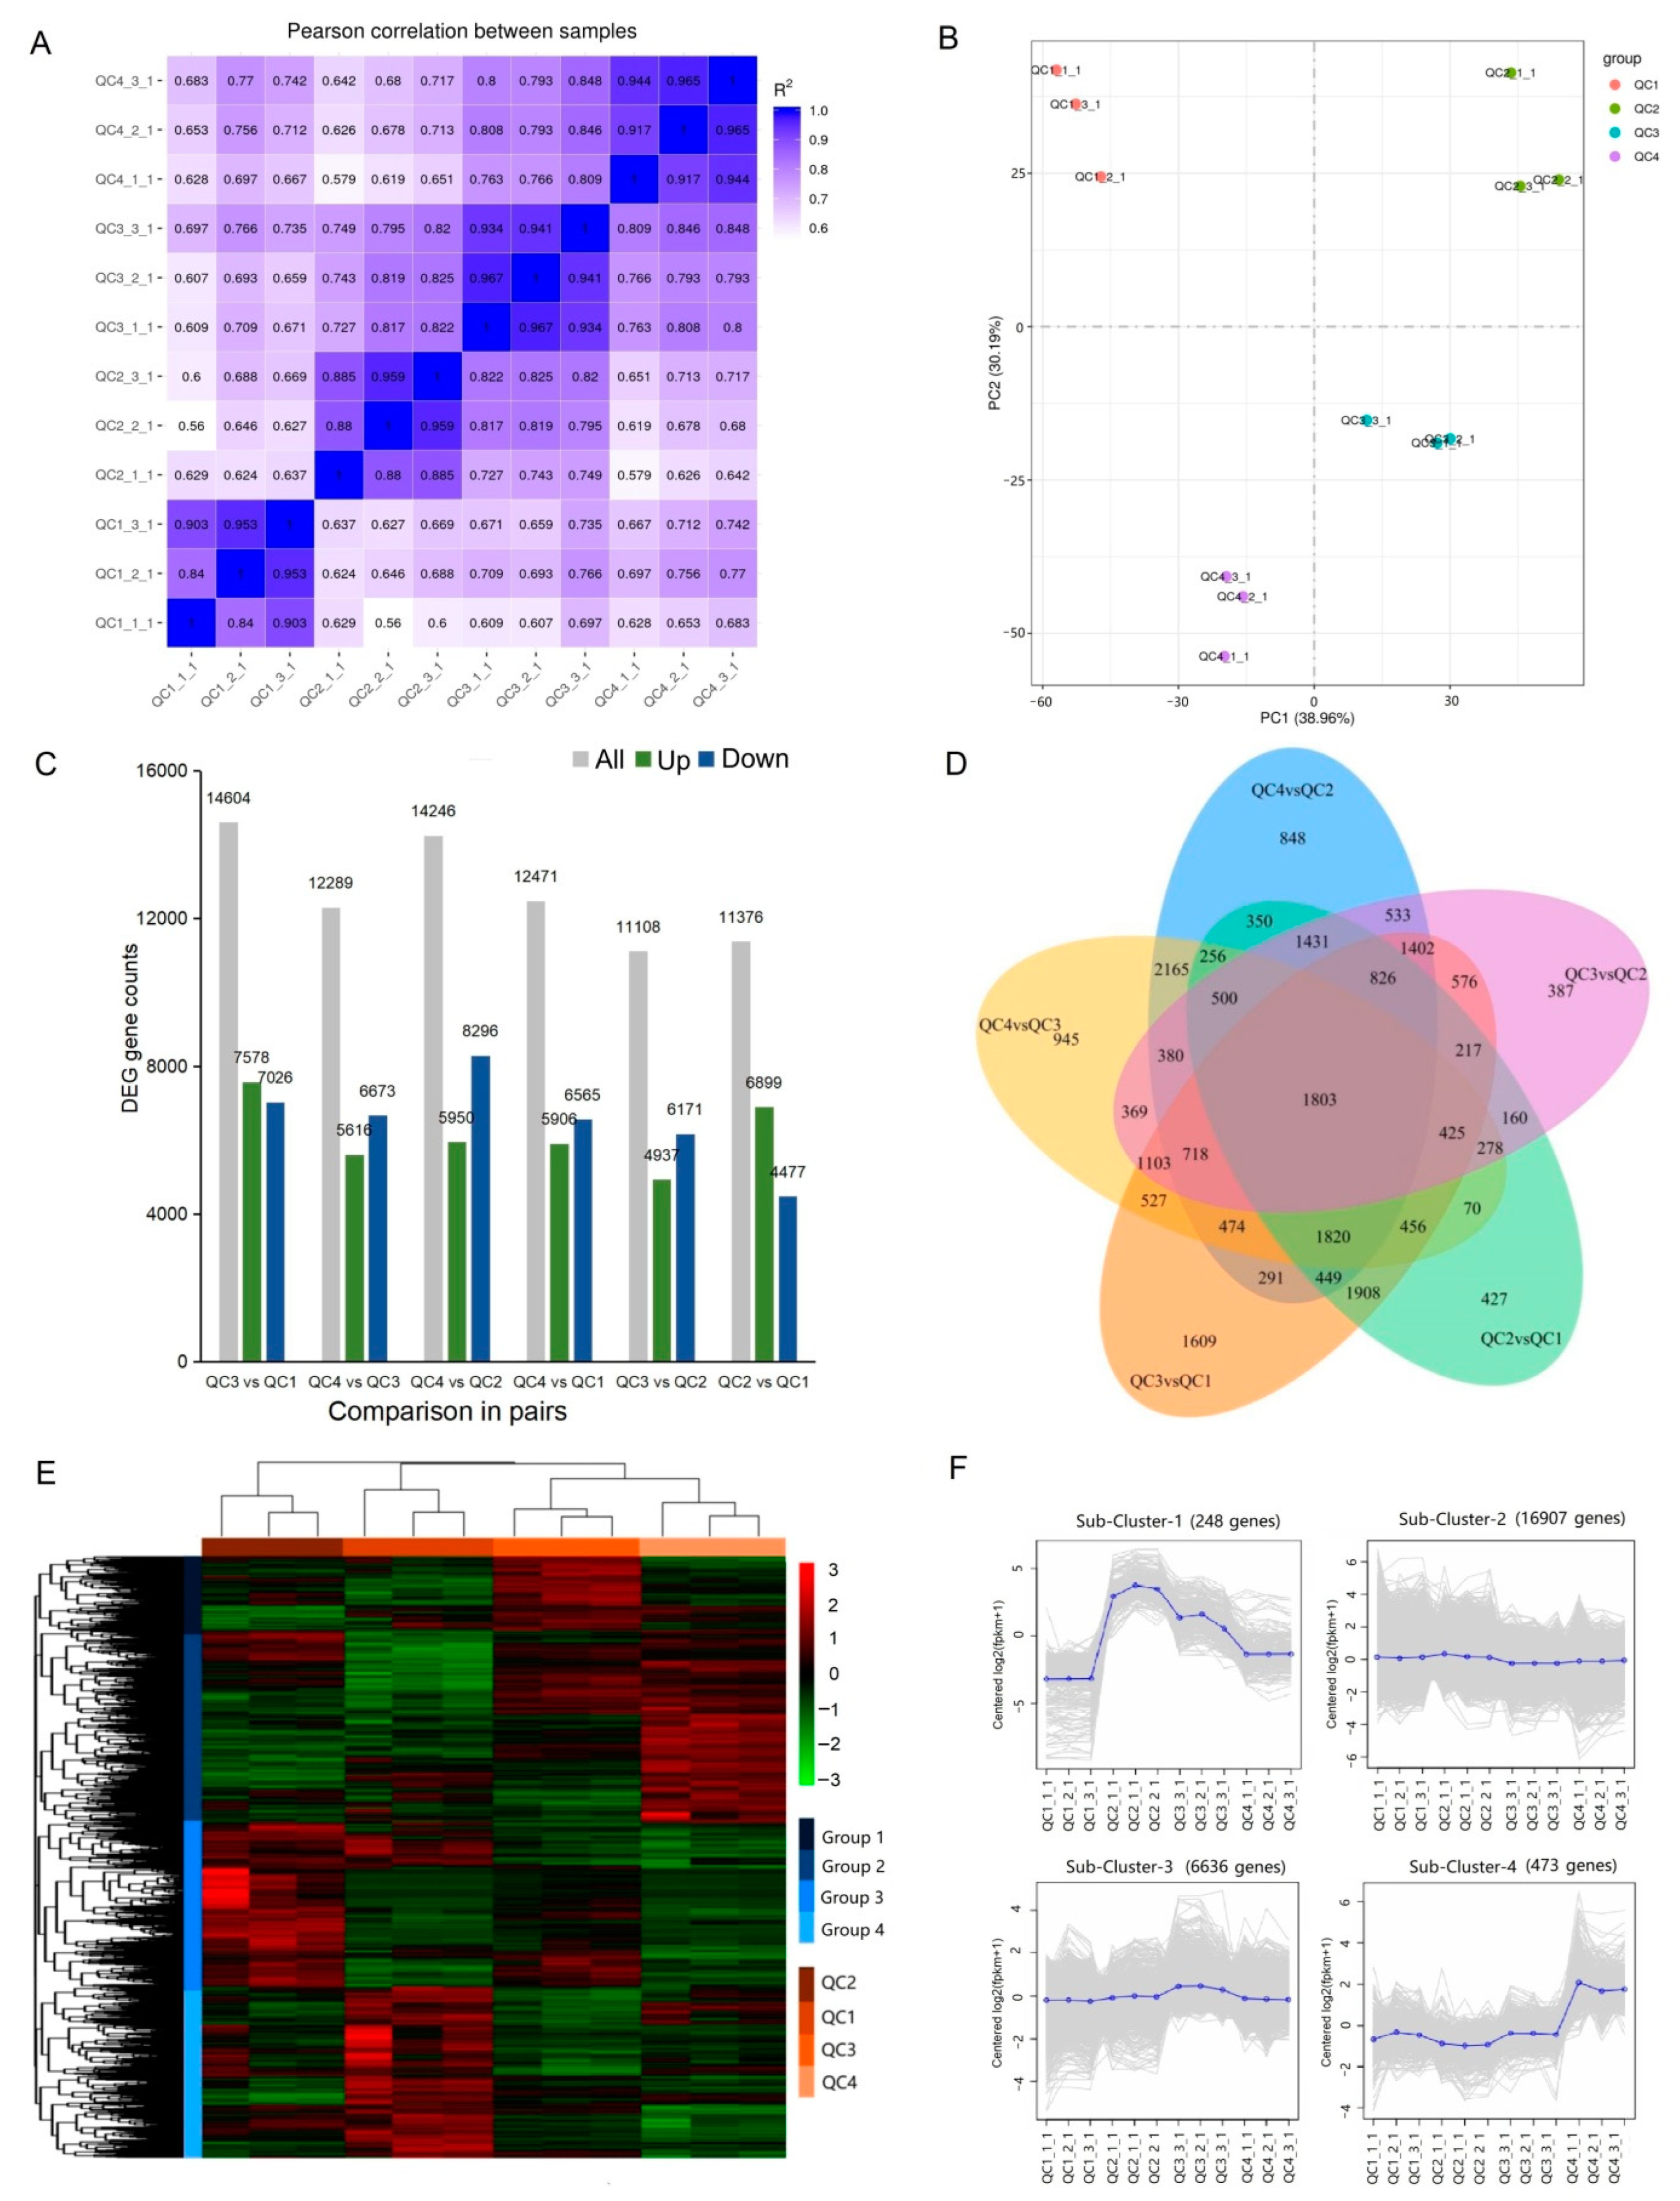
2.4. Transcriptomic Analysis of Celery in Response to Heat Stress
2.4.1. Transcriptome Sequencing and Whole Gene Expression Analysis
2.4.2. Identification and Analysis of Differentially Expressed Genes
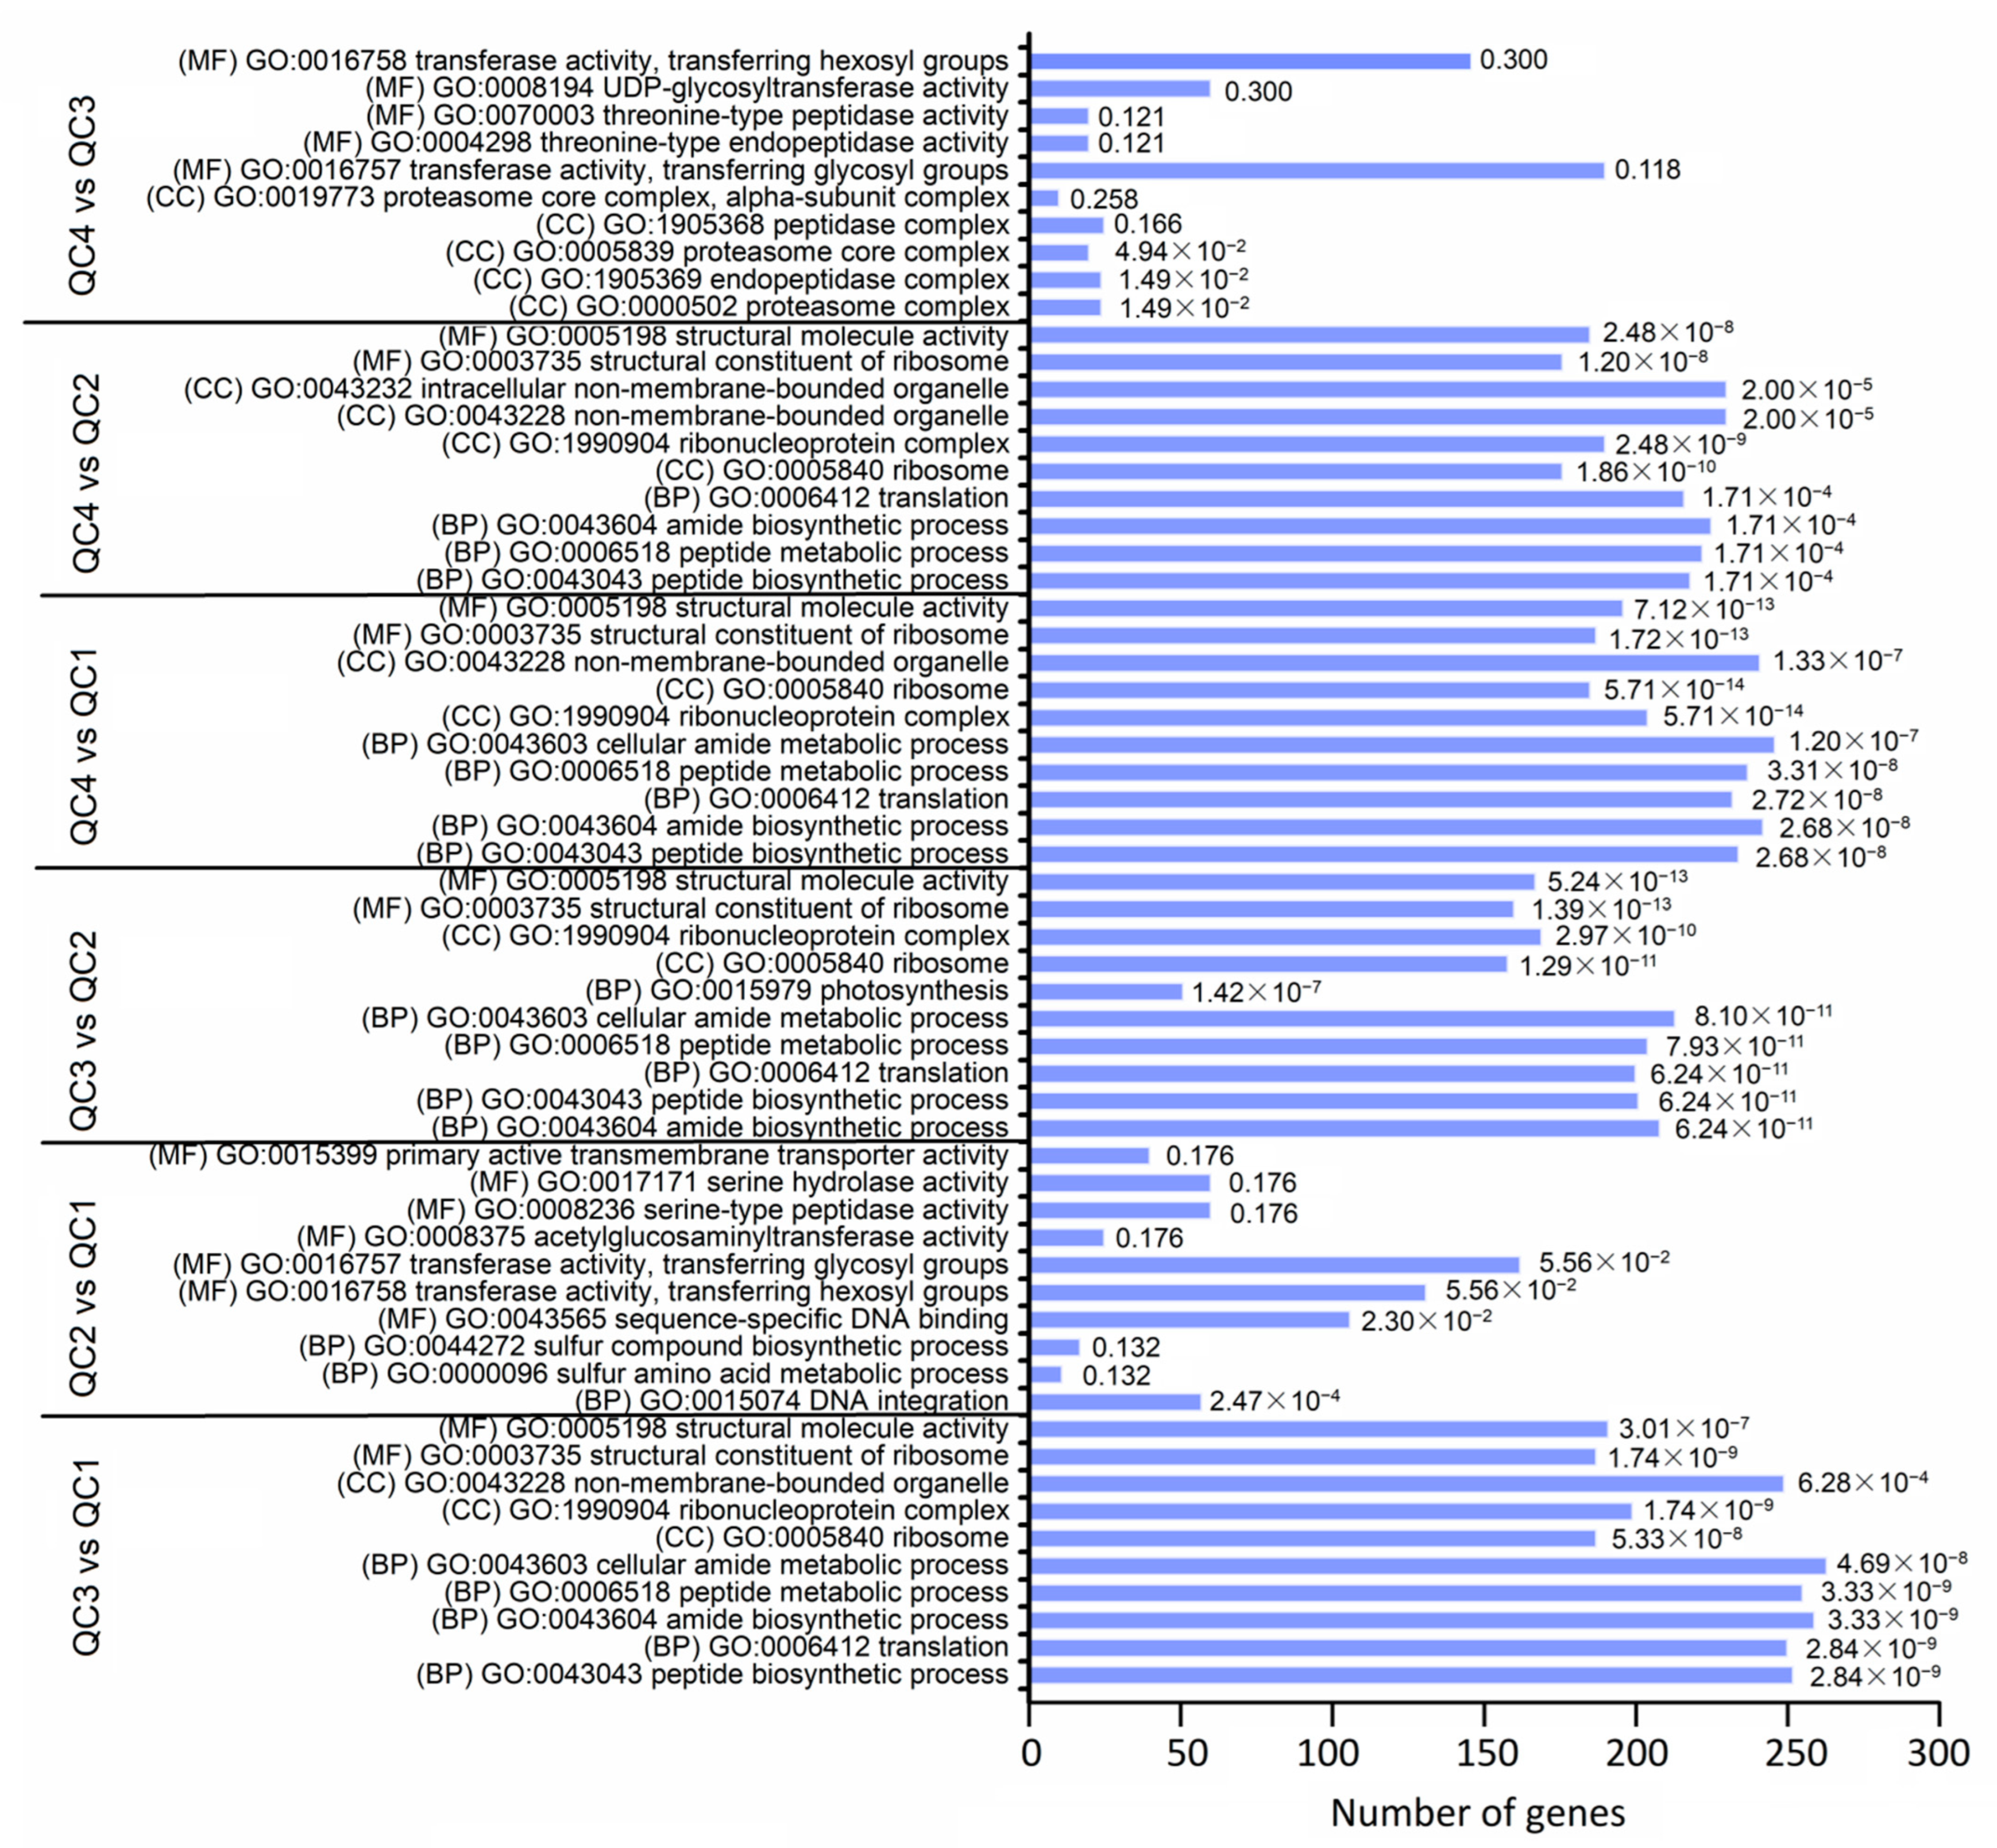
2.4.3. Function Annotation Analysis of DEGs
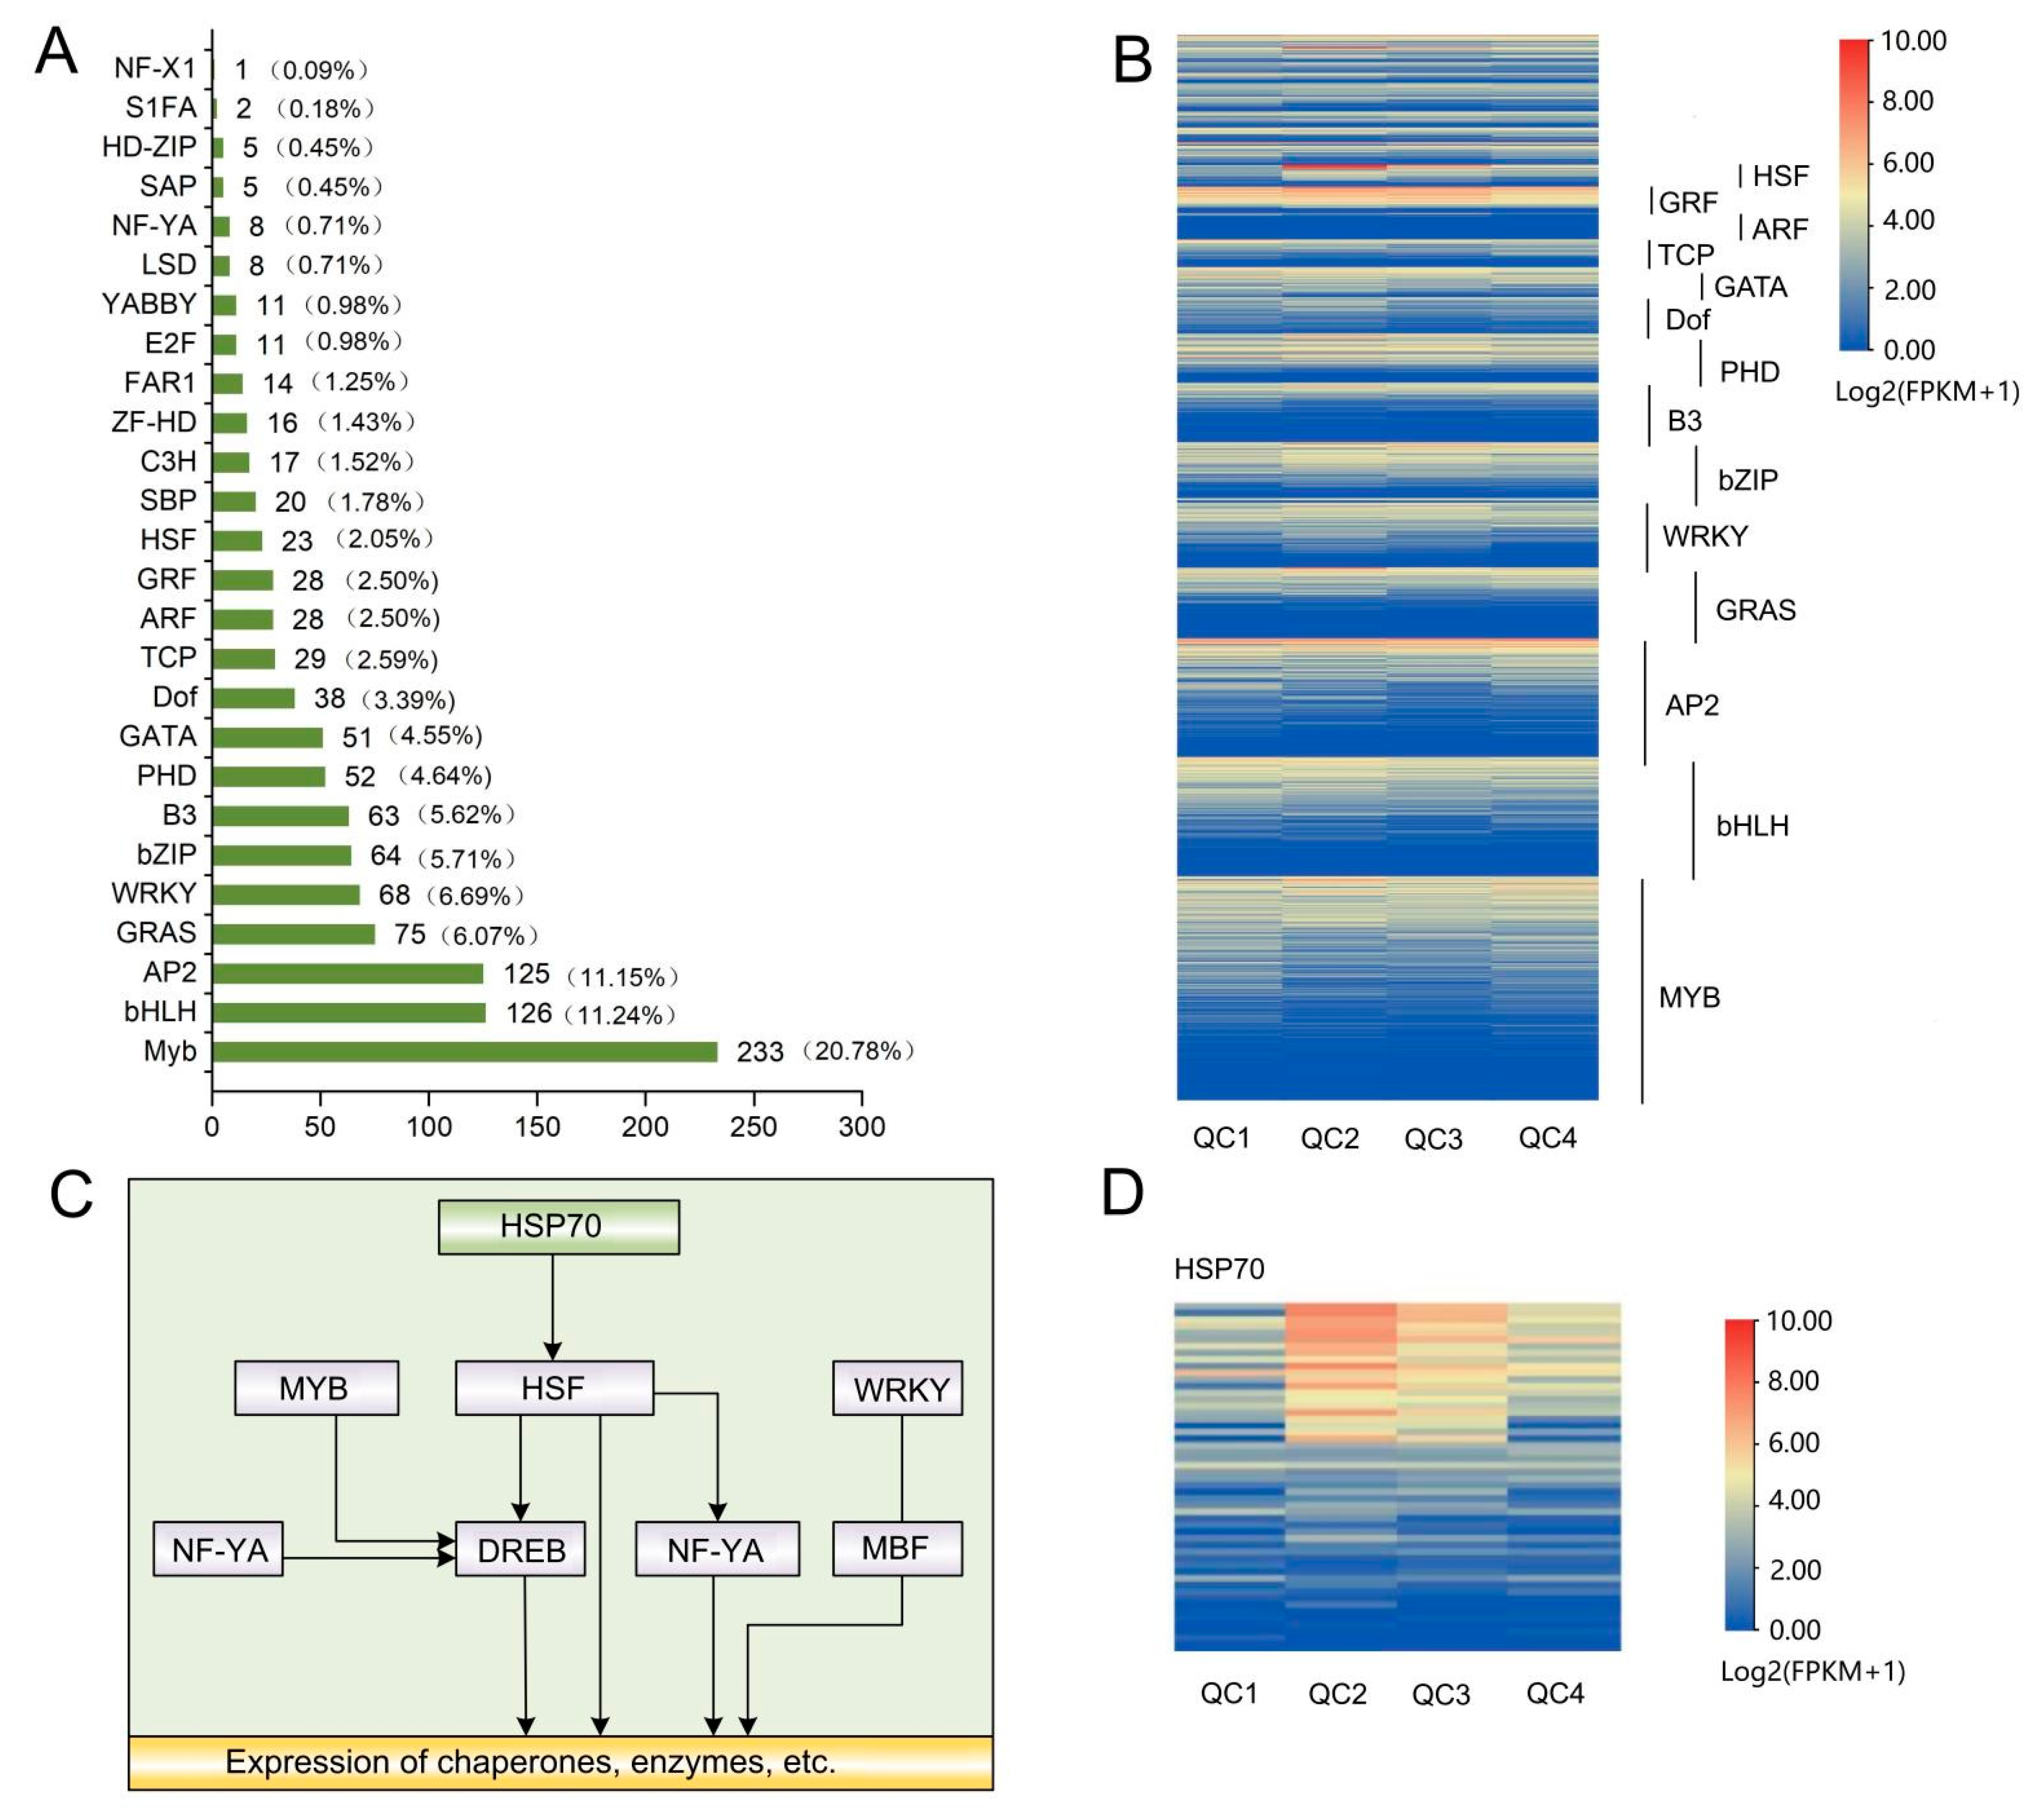
2.4.4. Analysis of Differential Transcription Factors
2.5. Combined Analysis of Transcriptome and Metabolome
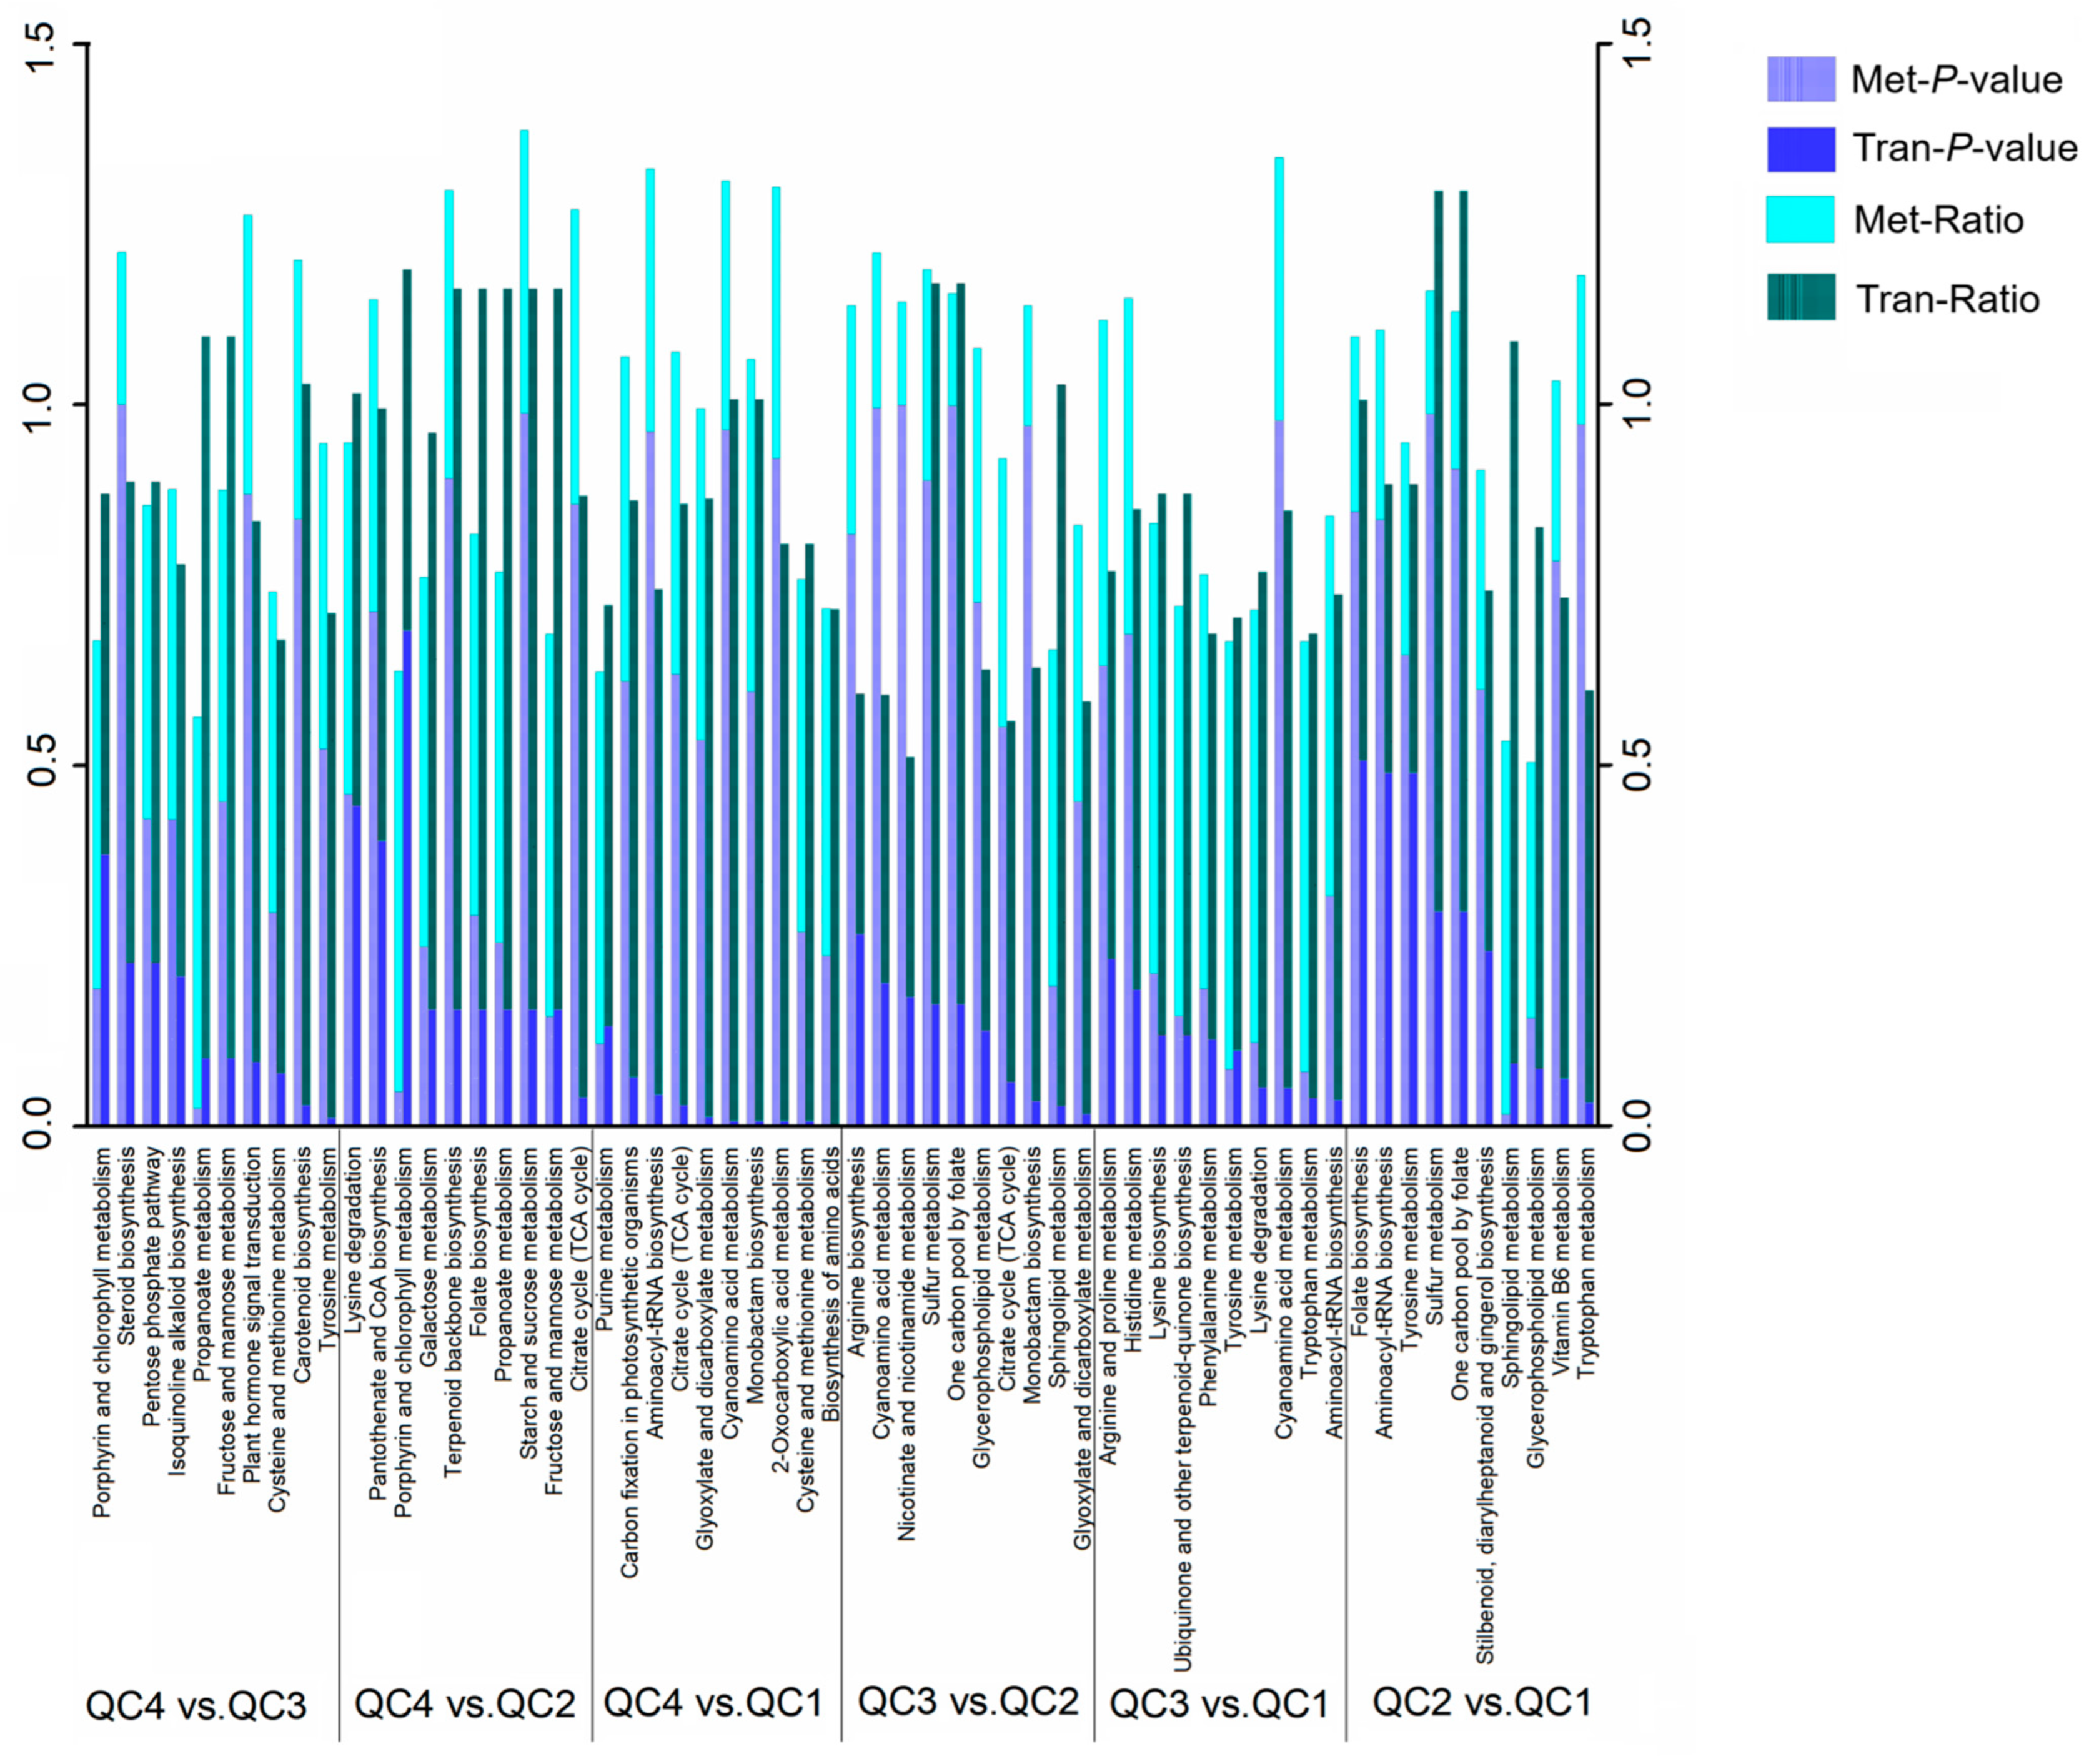
2.5.1. Transcriptome and Metabolome Pathway Enrichment Analysis
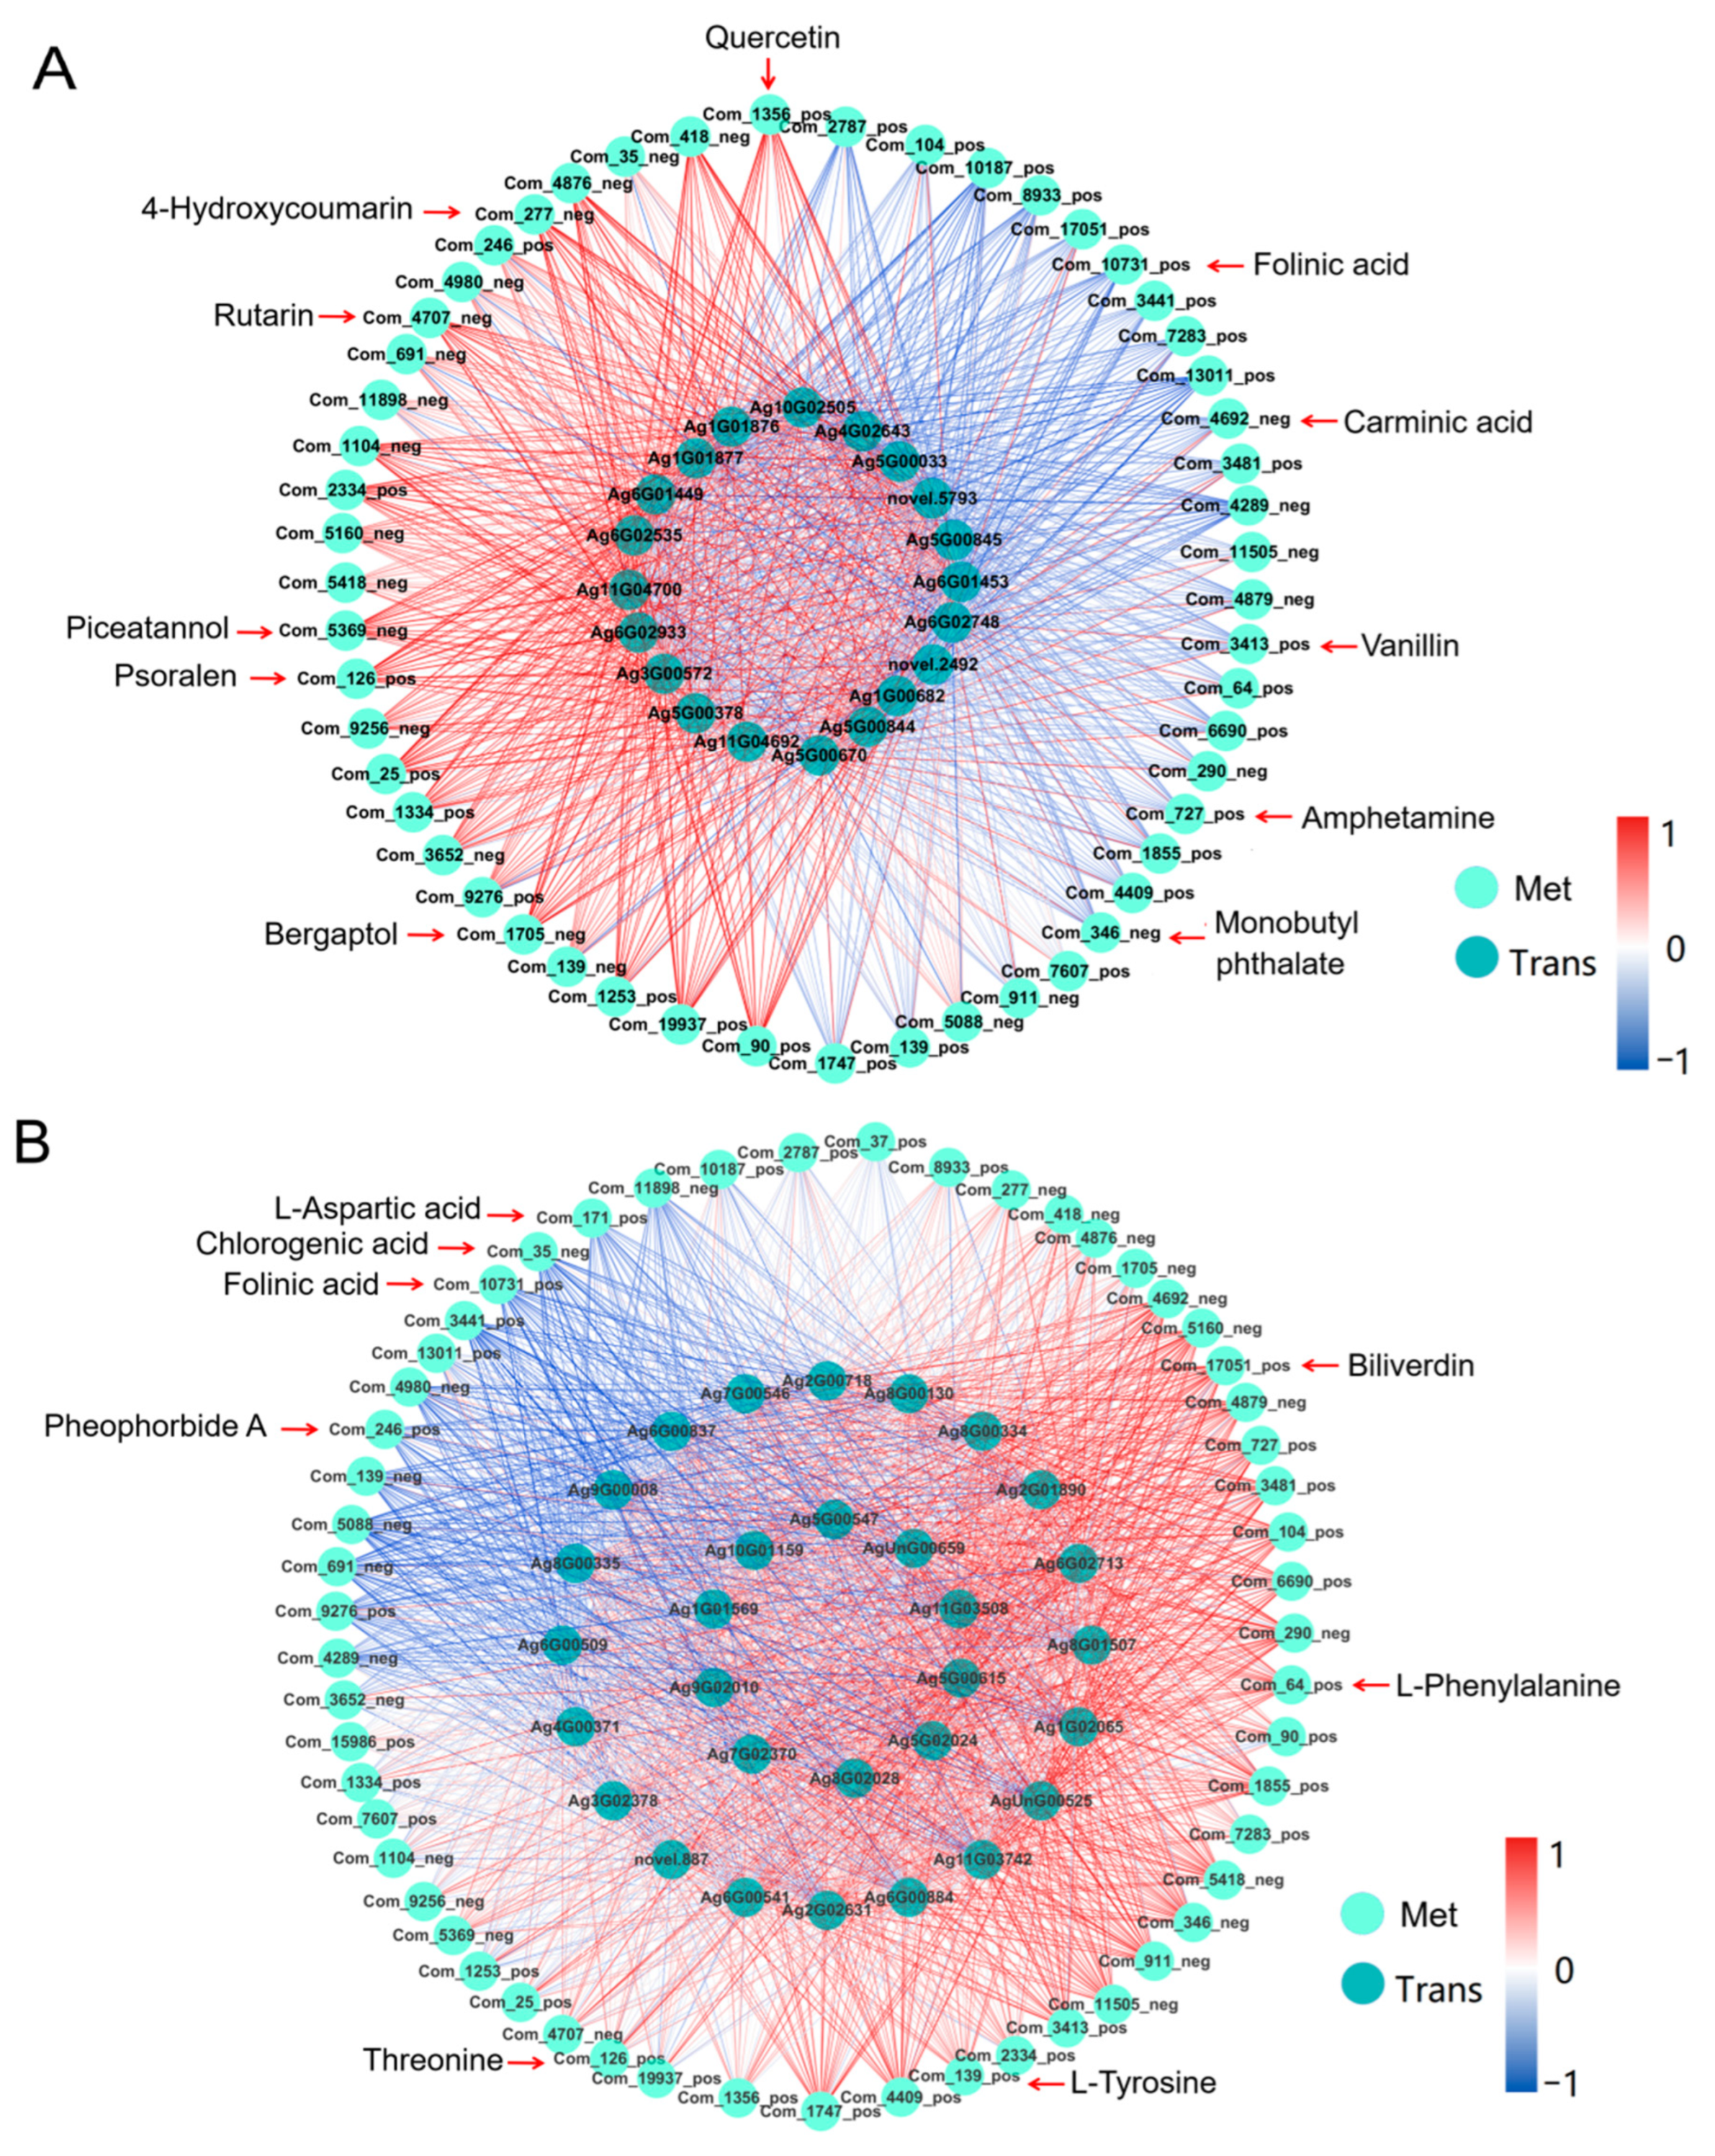
2.5.2. Correlation Analysis of Transcription and Metabolism
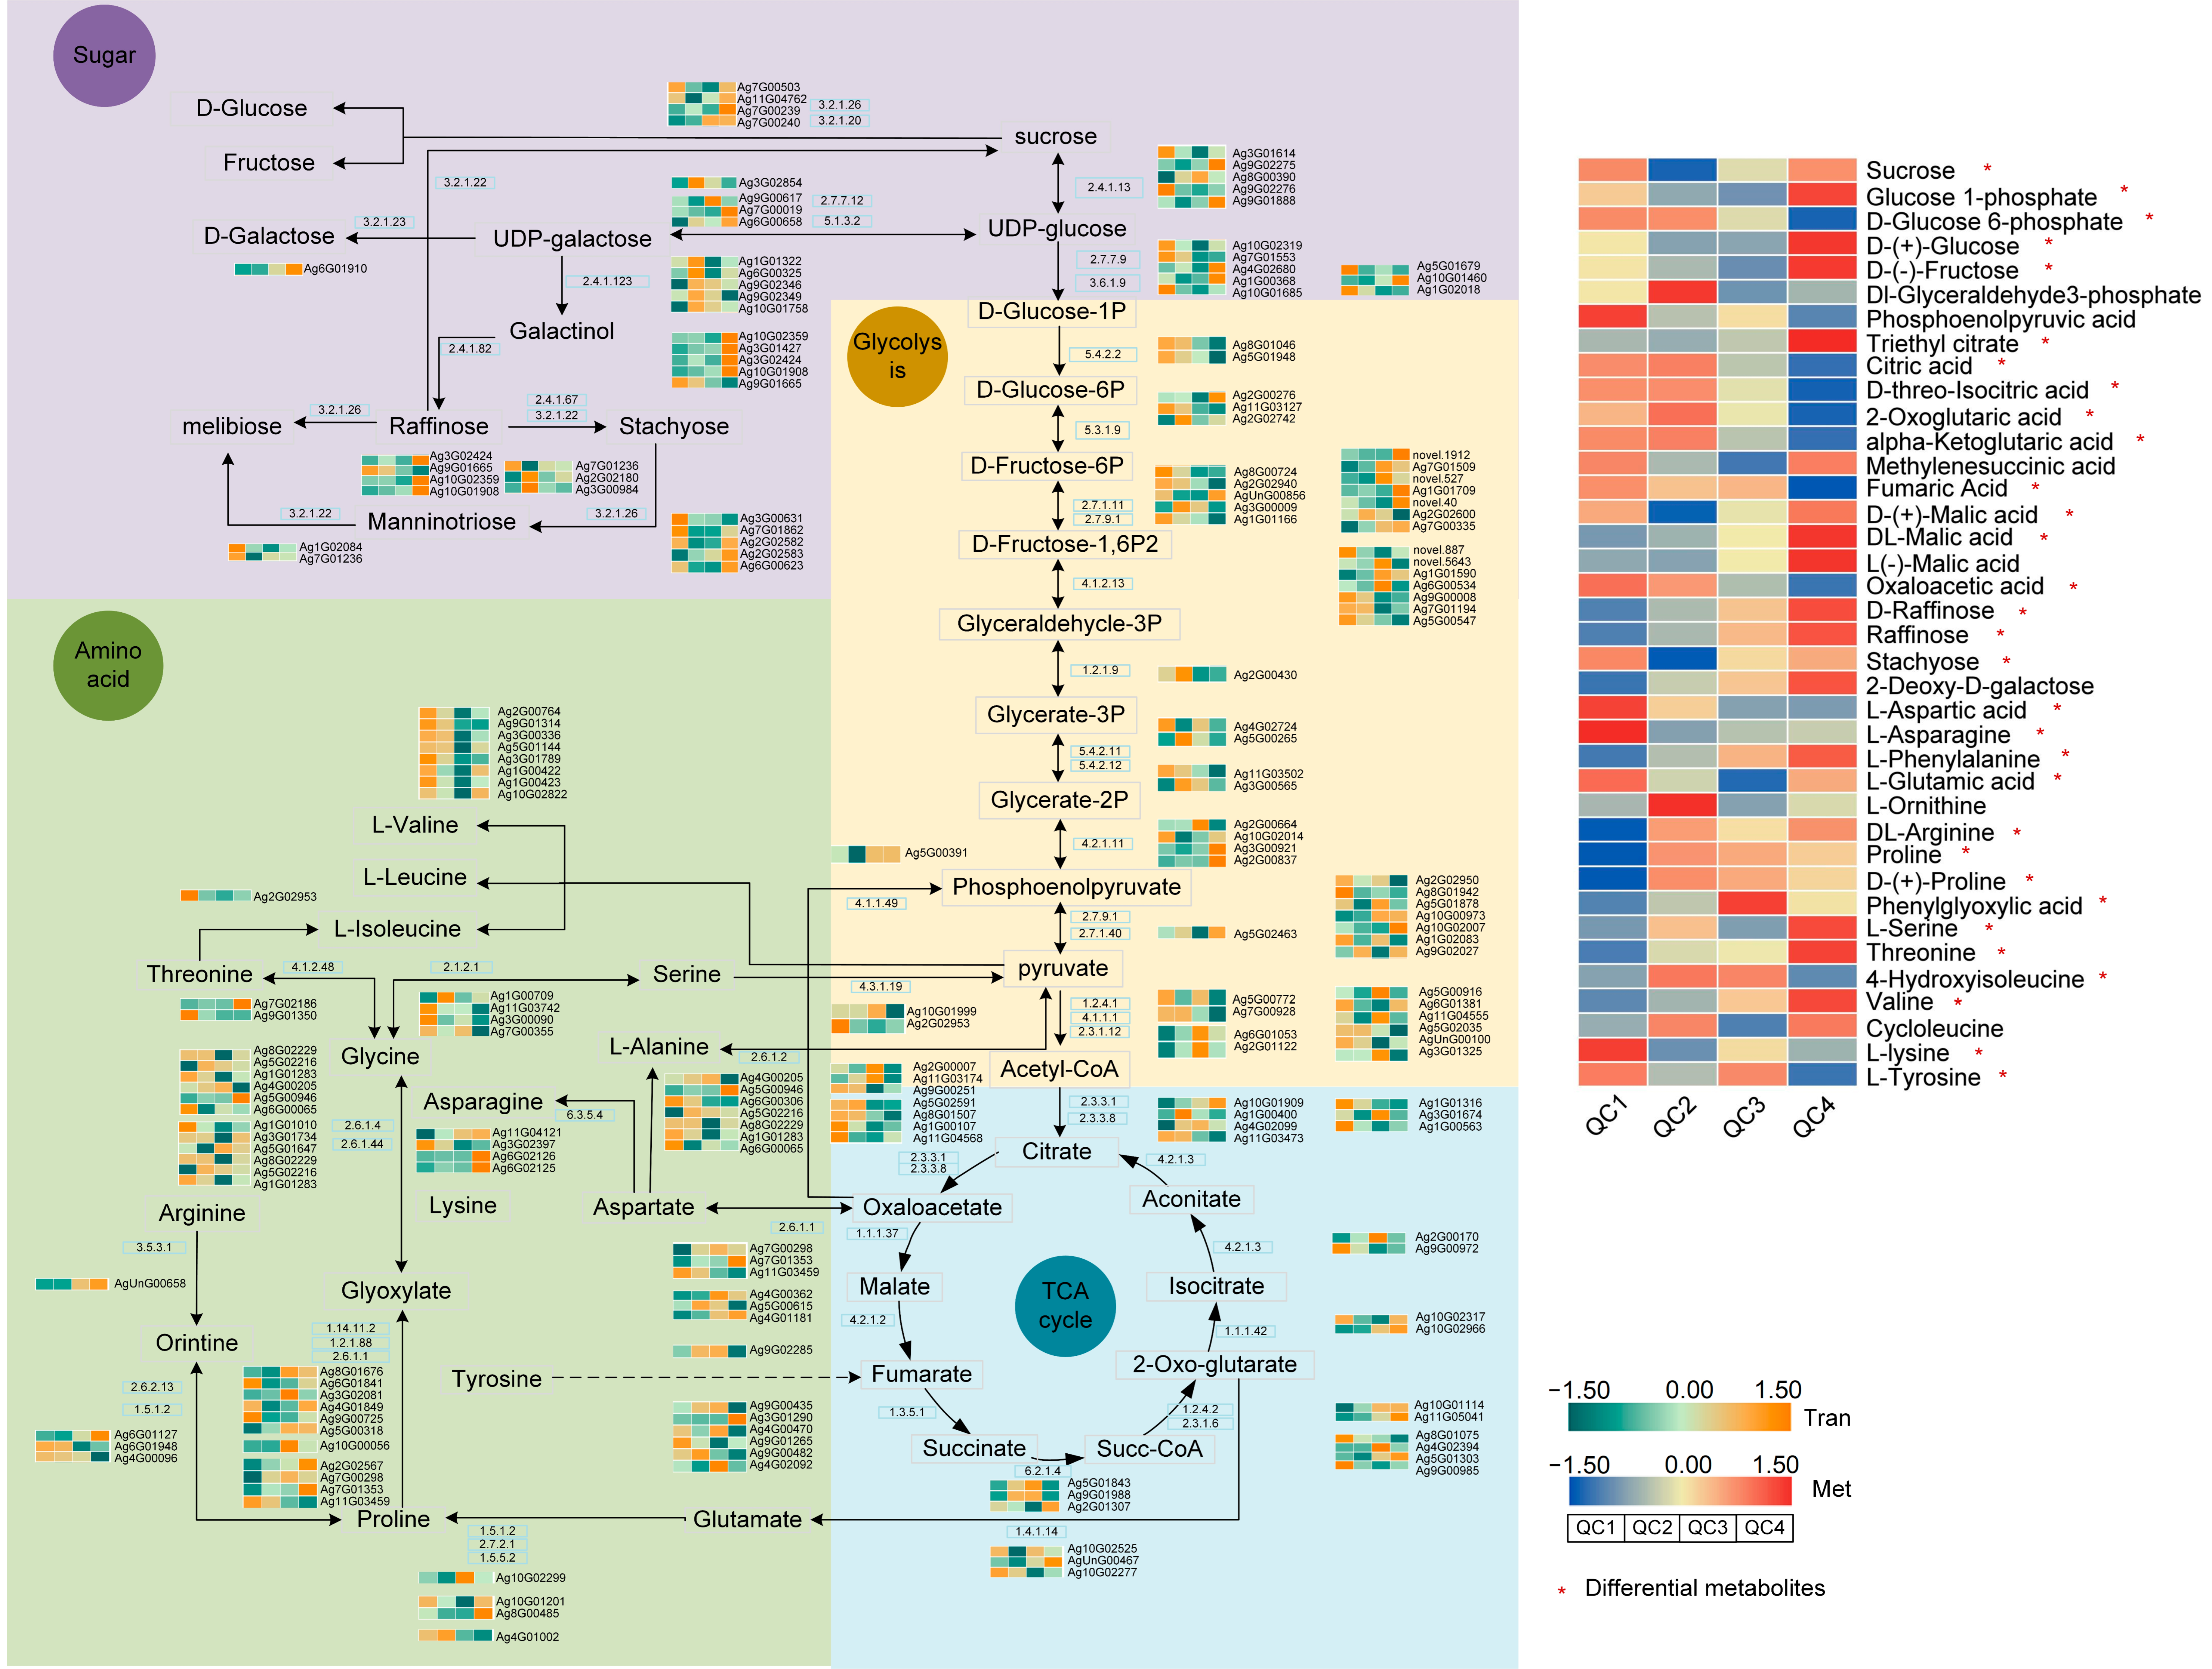
2.5.3. Transcriptome and Metabolome Analysis of Pathways Involved in Heat Stress Response
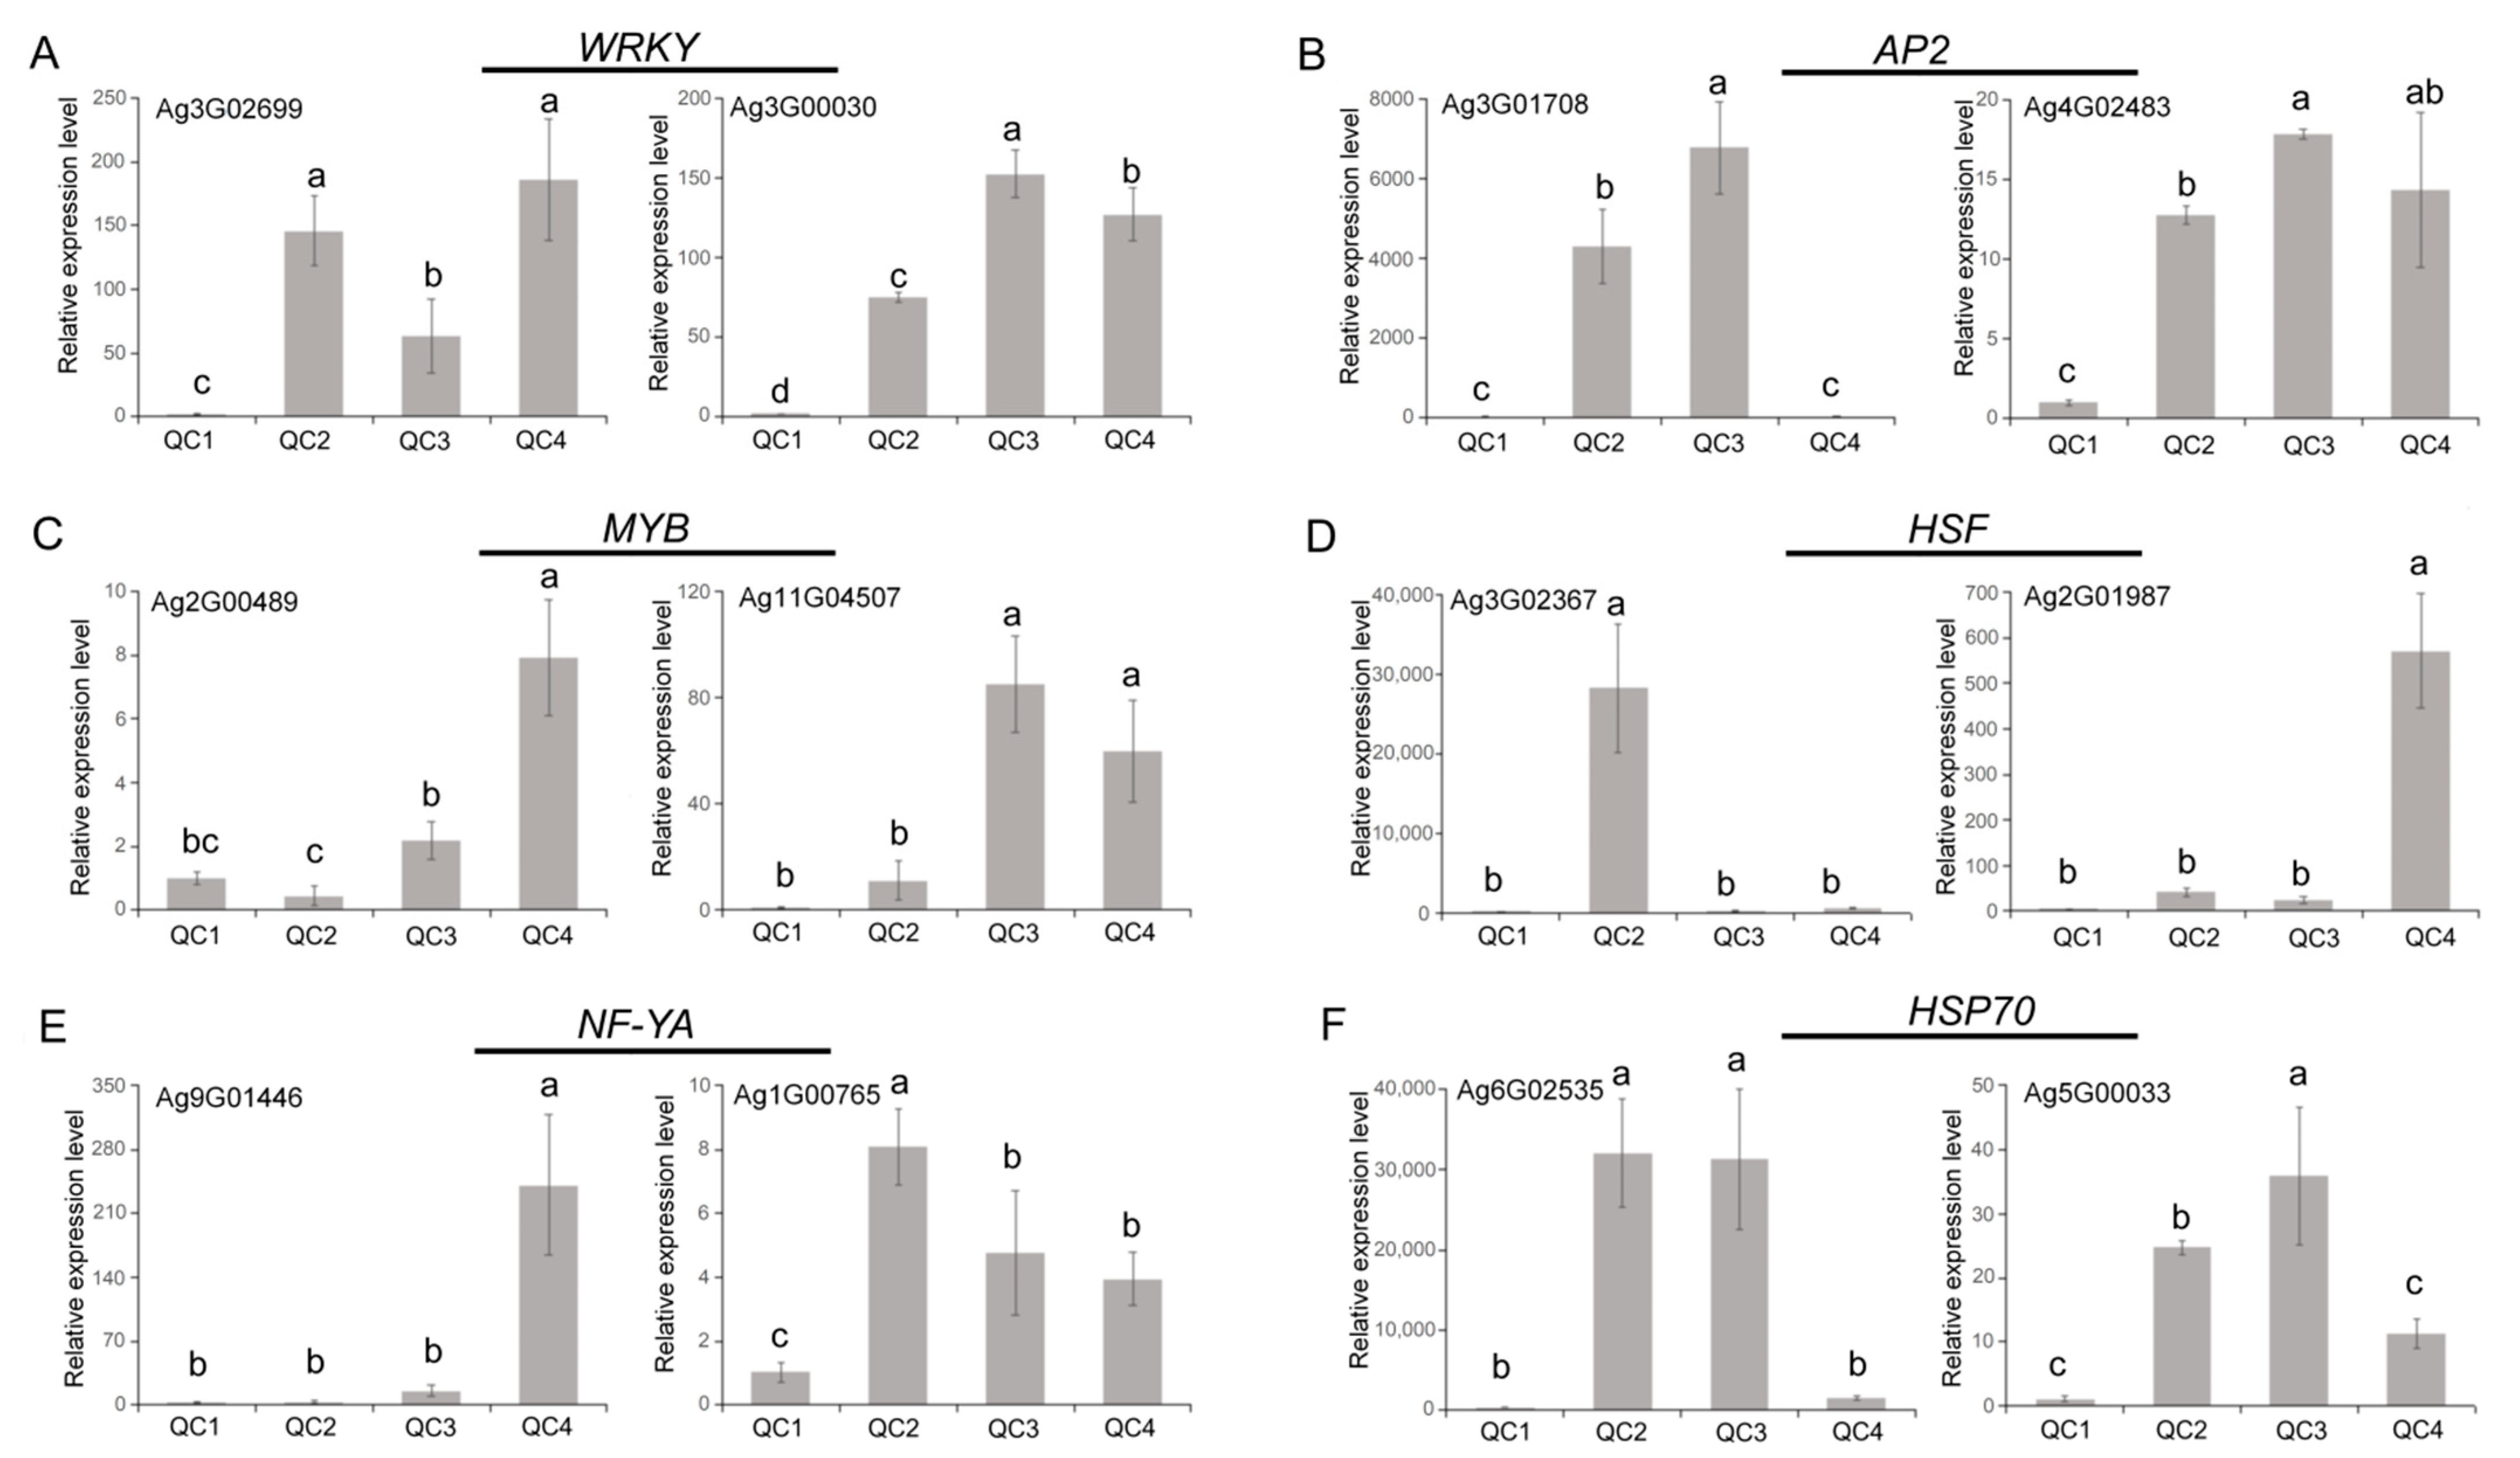
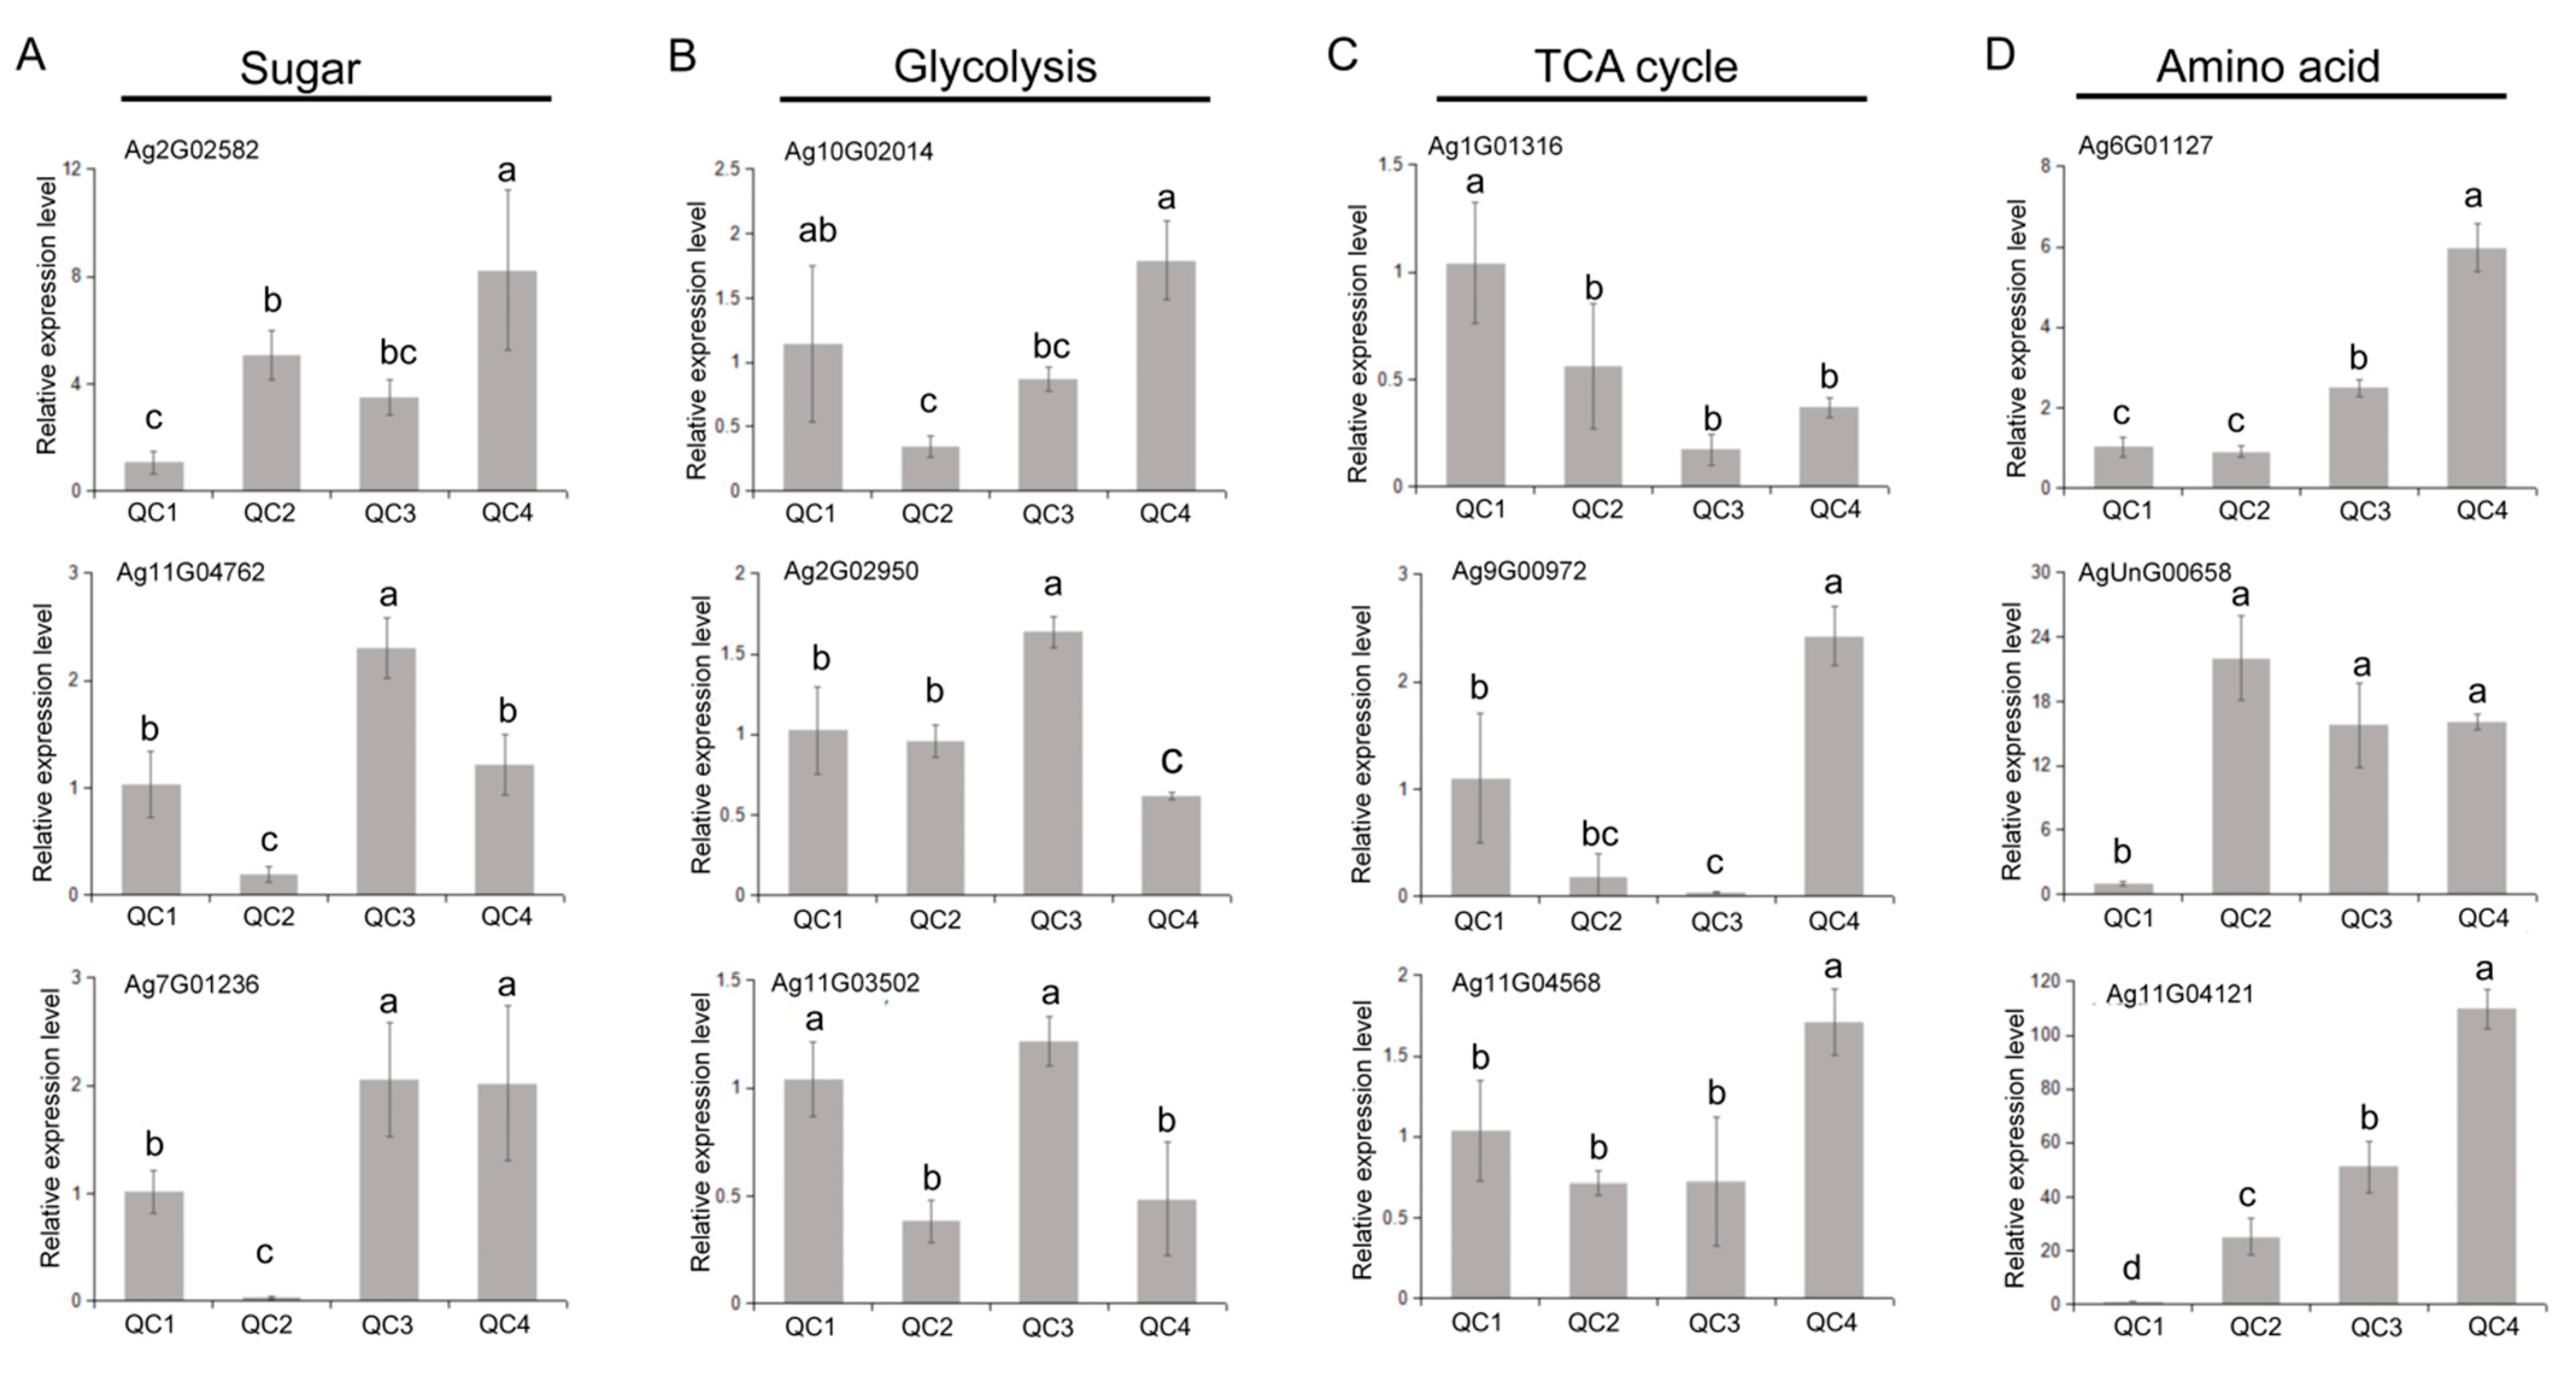
2.6. Verification of Gene Expression Levels
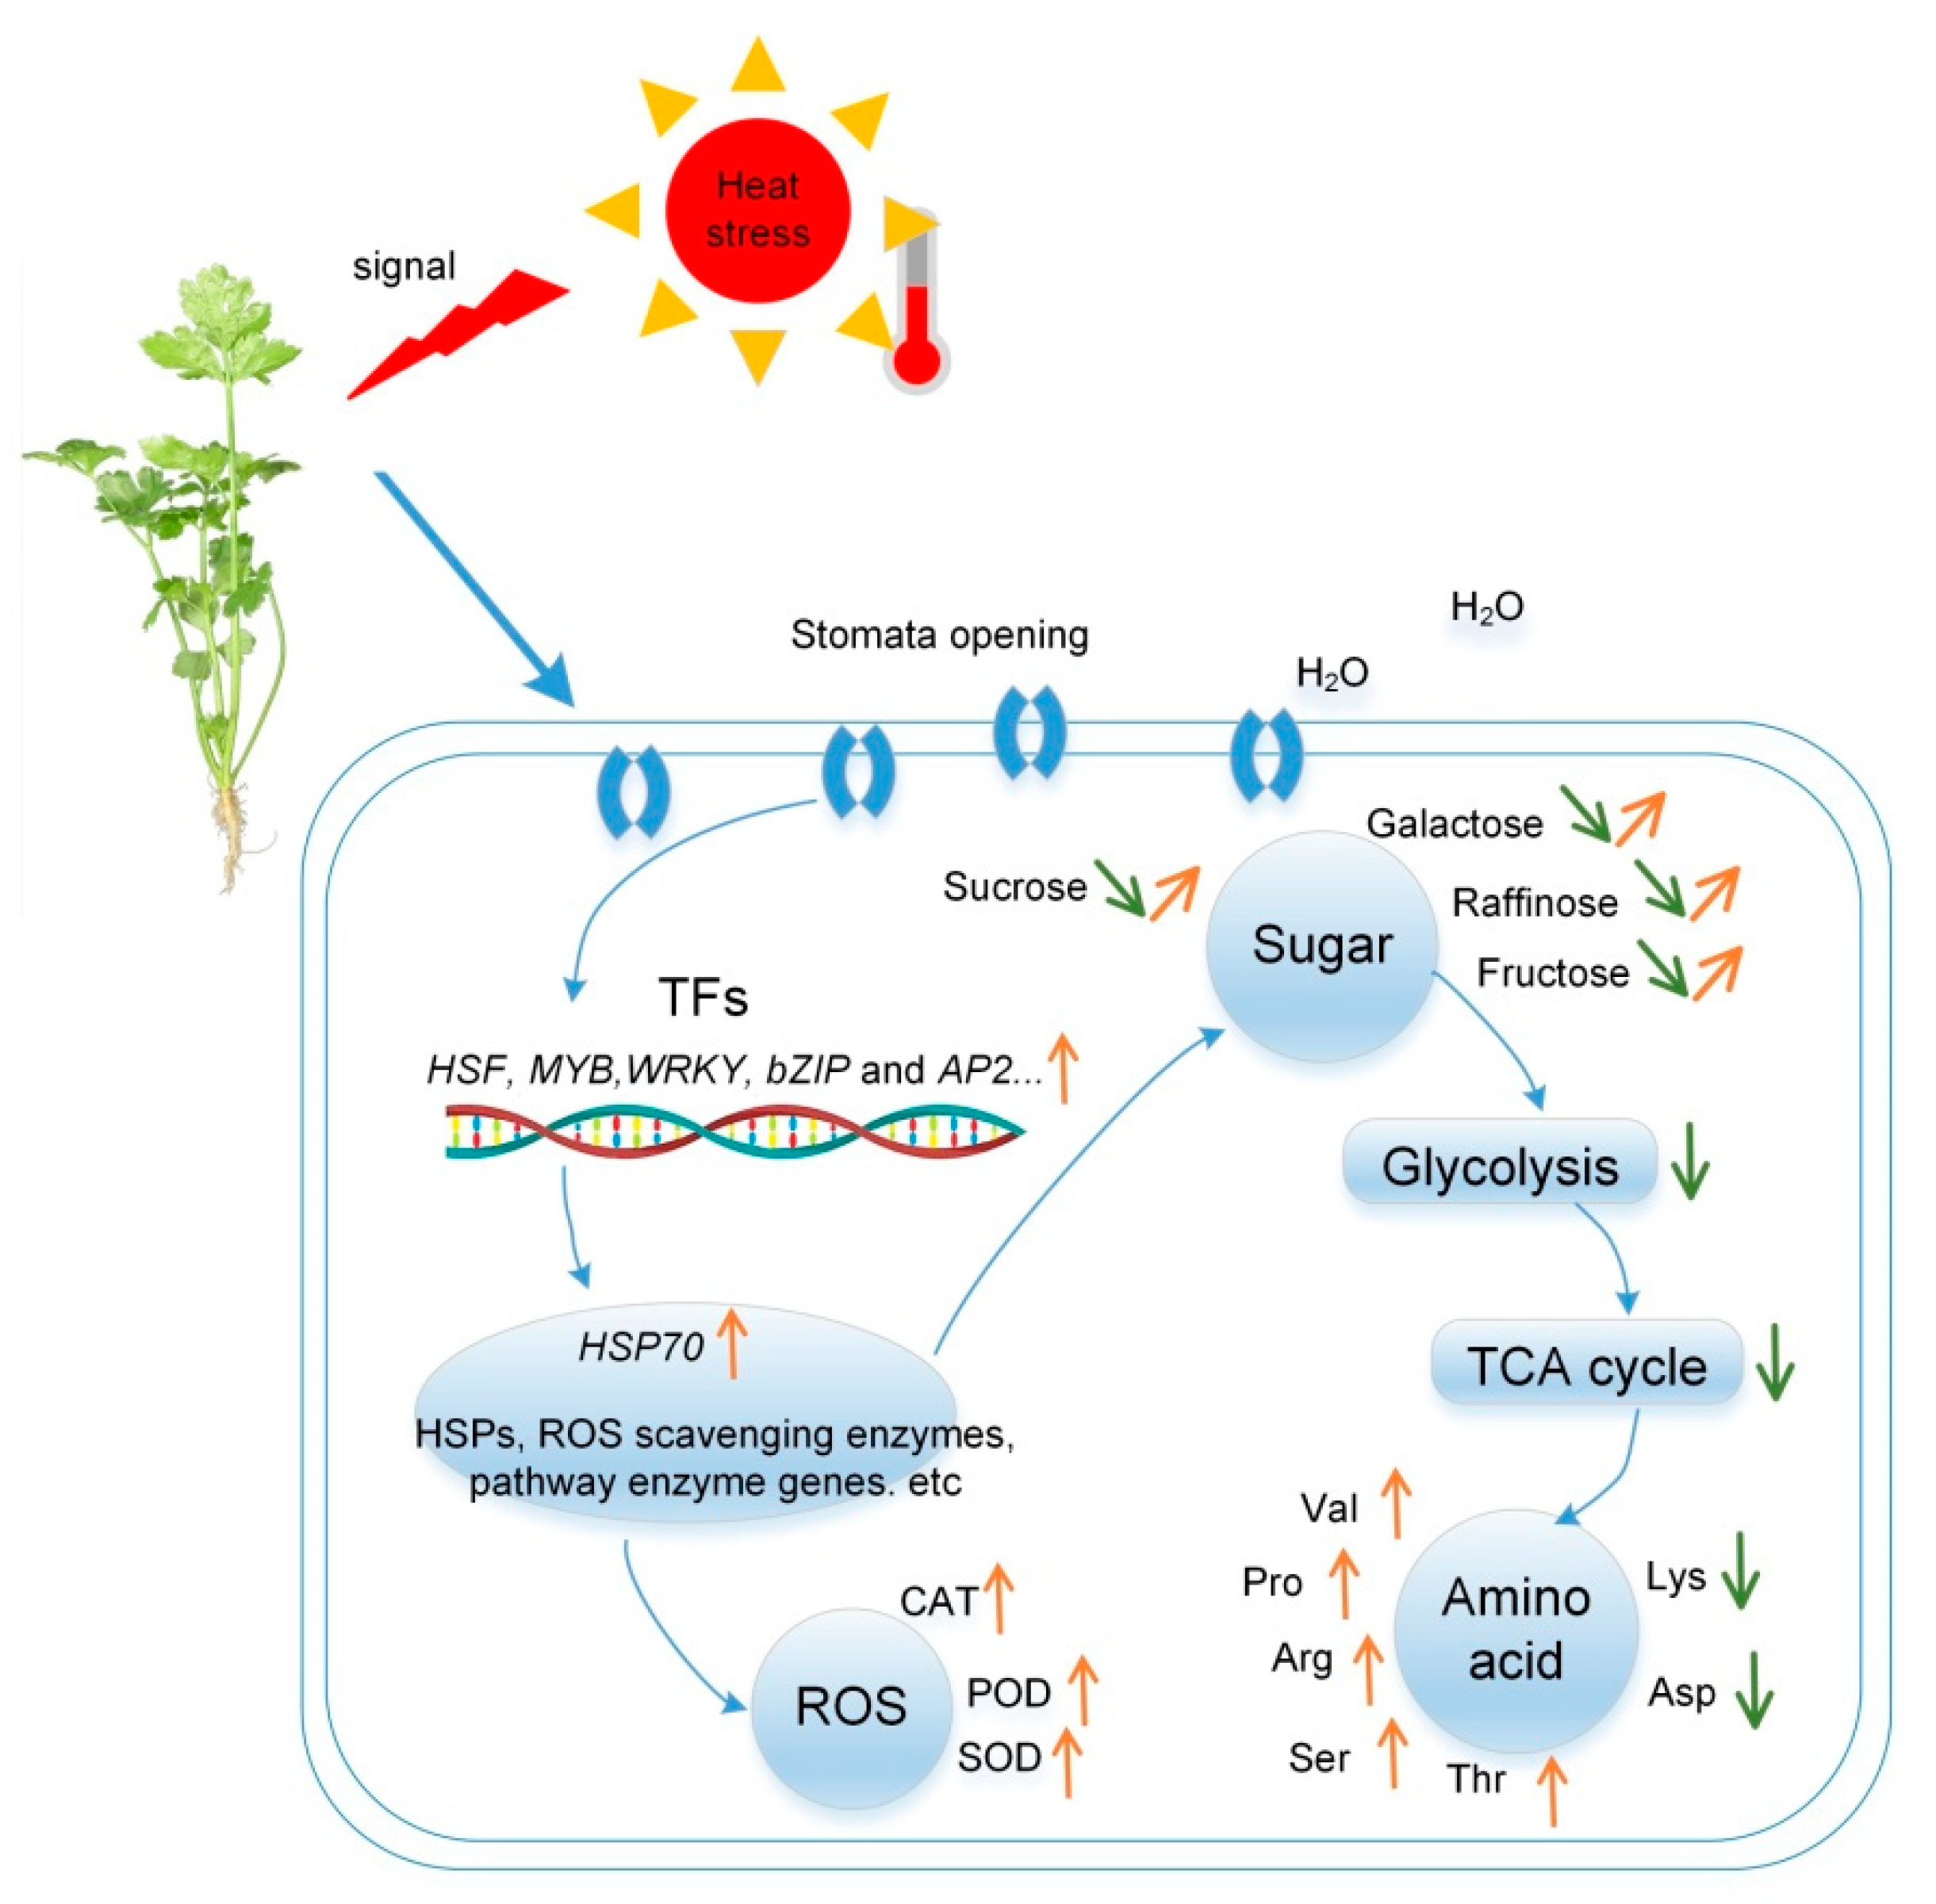
3. Discussion
4. Materials and Methods
4.1. Plant Material and Treatment
4.2. Measurement of Leaf Structure and Physiological Parameters
4.3. Metabolomics Analysis
4.3.1. Metabolite Extraction and Detection
4.3.2. Metabolite Data Analysis
4.4. Transcriptome Analysis
4.4.1. RNA-Sequencing and Assembly
4.4.2. Differential Gene Analysis and Function Enrichment
4.5. Metabolite-Gene Correlation Analysis
4.6. Validation of Gene Expression Levels
Supplementary Materials
Author Contributions
Funding
Institutional Review Board Statement
Informed Consent Statement
Data Availability Statement
Conflicts of Interest
References
- Li, Y.T.; Xu, W.W.; Ren, B.Z.; Zhao, B.; Zhang, J.W.; Liu, P.; Zhang, Z.S. High temperature reduces photosynthesis in maize leaves by damaging chloroplast ultrastructure and photosystem II. J. Agron. Crop Sci. 2020, 206, 548–564. [Google Scholar] [CrossRef]
- Ding, H.D.; He, J.; Wu, Y.; Wu, X.X.; Ge, C.L.; Wang, Y.J.; Zhong, S.L.; Peiter, E.; Liang, J.S.; Xu, W.F. The tomato mito-gen-activated protein kinase SlMPK1 is as a negative regulator of the high-temperature stress response. Plant Physiol. 2018, 177, 633–651. [Google Scholar] [CrossRef] [PubMed] [Green Version]
- Bita, C.E.; Gerats, T. Plant tolerance to high temperature in a changing environment: Scientific fundamentals and production of heat stress-tolerant crops. Front. Plant Sci. 2013, 4, 273. [Google Scholar] [CrossRef] [PubMed] [Green Version]
- Wang, L.; Ma, K.B.; Lu, Z.G.; Ren, S.X.; Jiang, H.R.; Cui, J.W.; Chen, G.; Teng, N.J.; Lam, H.M.; Jin, B. Differential physiological, transcriptomic and metabolomic responses of Arabidopsis leaves under prolonged warming and heat shock. BMC Plant Biol. 2020, 20, 86. [Google Scholar] [CrossRef] [PubMed]
- Xu, S.; Li, J.; Zhang, X.; Wei, H.; Gui, L. Effects of heat acclimation pretreatment on changes of membrane lipid peroxidation, antioxidant metabolites, and ultrastructure of chloroplasts in two cool-season turfgrass species under heat stress. Environ. Exp. Bot. 2006, 56, 274–285. [Google Scholar] [CrossRef]
- Zhu, J.K. Abiotic Stress Signaling and Responses in Plants. Cell 2016, 167, 313–324. [Google Scholar] [CrossRef] [PubMed] [Green Version]
- Mittler, R.; Finka, A.; Goloubinoff, P. How do plants feel the heat? Trends Biochem. Sci. 2012, 37, 118–125. [Google Scholar]
- Huang, W.; Ma, H.Y.; Huang, Y.; Li, Y.; Wang, G.L.; Jiang, Q.; Wang, F.; Xiong, A.S. Comparative proteomic analysis provides novel insights into chlorophyll biosynthesis in celery under temperature stress. Physiol. Plantarum. 2017, 161, 468–485. [Google Scholar] [CrossRef]
- Matthews, C.; Arshad, M.; Hannoufa, A. Alfalfa response to heat stress is modulated by microRNA156. Physiol. Plantarum. 2019, 165, 830–842. [Google Scholar] [CrossRef]
- Huo, L.; Sun, X.; Guo, Z.; Jia, X.; Che, R.; Sun, Y.; Zhu, Y.; Wang, P.; Gong, X.; Ma, F. MdATG18a overexpression improves basal thermotolerance in transgenic apple by decreasing damage to chloroplasts. Hortic. Res. 2020, 7, 21. [Google Scholar] [CrossRef] [Green Version]
- Jacob, P.; Hirt, H.; Bendahmane, A. The heat shock protein/chaperone network and multiple stress resistance. Plant Biotechnol. J. 2016, 15, 405–414. [Google Scholar] [CrossRef] [PubMed]
- Wang, R.; Zhang, Y.; Kieffer, M.; Yu, H.; Kepinski, S.; Kepinski, S.; Estelle, M. HSP90 regulates temperature-dependent seedling growth in Arabidopsis by stabilizing the auxin co-receptor F-box protein TIR1. Nat. Commun. 2016, 7, 1–11. [Google Scholar]
- Gupta, S.C.; Sharraa, A.; Mishra, M.; Mishra, R.K.; Chowdhuri, D.K. Heat shock proteins in toxicology: How close and how far? Life Sci. 2010, 86, 377–384. [Google Scholar] [PubMed]
- Yoshida, T.; Ohama, N.; Nakajima, J.; Kidokoro, S.; Mizoi, J.; Nakashima, K.; Maruyama, K.; Kim, J.M.; Seki, M.; Todaka, D.; et al. Arabidopsis HSFA1 transcription factors function as the main positive regulators in heat shock-responsive gene expression. Mol. Genet. Genom. 2011, 286, 321–332. [Google Scholar] [CrossRef] [PubMed]
- Song, Y.; Chen, Q.; Ci, D.; Shao, X.; Zhang, D. Effects of high temperature on photosynthesis and related gene expression in poplar. BMC Plant Biol. 2014, 14, 111. [Google Scholar] [CrossRef] [PubMed] [Green Version]
- Hao, S.; Lu, Y.; Peng, Z.; Wang, E.; Chao, L.; Zhong, S.; Yao, Y. McMYB4 improves temperature adaptation by regulating phenylpropanoidmetabolism and hormone signalling in apple. Hortic. Res. 2021, 8, 182. [Google Scholar] [CrossRef] [PubMed]
- Ding, L.; Wu, Z.; Teng, R.; Xu, S.; Cao, X.; Yuan, G.; Zhang, D.; Teng, N. LlWRKY39 is involved in thermotolerance by activating LlMBF1c and interacting with LlCaM3 in lily (Lilium longiflorum). Hortic. Res. 2021, 8, 36. [Google Scholar] [CrossRef]
- Oksman-Caldentey, K.M.; Saito, K. Integrating genomics and metabolomics for engineering plant metabolic pathways. Curr. Opin. Biotechnol. 2005, 16, 174–179. [Google Scholar] [CrossRef]
- Hu, T.; Sun, X.Y.; Zhao, Z.J.; Amombo, E.; Fu, J.M. High temperature damage to fatty acids and carbohydrate metabolism in tall fescue by coupling deep transcriptome and metabolome analysis. Ecotox. Environ. Safe. 2020, 203, 110943. [Google Scholar] [CrossRef]
- Wang, J.; Lv, J.; Liu, Z.; Liu, Y.; Song, J.; Ma, Y.; Ou, L.; Zhang, X.; Liang, C.; Wang, F.; et al. Integration of transcriptomics and metabolomics for pepper (Capsicum annuum L.) in response to heat stress. Int. J. Mol. Sci. 2019, 20, 5042. [Google Scholar] [CrossRef] [Green Version]
- Glaubitz, U.; Li, X.; Schaedel, S.; Erban, A.; Sulpice, R.; Kopka, J.; Hincha, D.K.; Zuther, E. Integrated analysis of rice transcriptomic and metabolomic responses to elevated night temperatures identifies sensitivity- and tolerance-related profiles. Plants Cell Environ. 2017, 40, 121–137. [Google Scholar] [CrossRef] [PubMed] [Green Version]
- Li, M.Y.; Feng, K.; Hou, X.L.; Jiang, Q.; Xu, Z.S.; Wang, G.L.; Liu, J.X.; Wang, F.; Xiong, A.S. The genome sequence of celery (Apium graveolens L.), an important leaf vegetable crop rich in apigenin in the Apiaceae family. Hortic. Res. 2020, 7, 9. [Google Scholar] [CrossRef] [PubMed] [Green Version]
- Lobell, D.B.; Gourdji, S.M. The influence of climate change on global crop productivity. Plant Physiol. 2012, 1686–1697. [Google Scholar] [CrossRef] [PubMed] [Green Version]
- Li, M.Y.; Wang, F.; Jiang, Q.; Ma, J.; Xiong, A.S. Identification of SSRs and differentially expressed genes in two cultivars of celery (Apium graveolens L.) by deep transcriptome sequencing. Hortic. Res. 2014, 1, 10. [Google Scholar] [CrossRef] [PubMed] [Green Version]
- Duan, A.Q.; Yang, X.L.; Feng, K.; Liu, J.X.; Xu, Z.S.; Xiong, A.S. Genome-wide analysis of NAC transcription factors and their response to abiotic stress in celery (Apium graveolens L.). Comput. Biol. Chem. 2020, 84, 107186. [Google Scholar] [CrossRef]
- Liu, X.S.; Liang, C.C.; Hou, S.G.; Wang, X.; Chen, D.H.; Shen, J.L.; Zhang, W.; Wang, M. The LRR-RLK protein HSL3 regulates stomatal closure and the drought stress response by modulating hydrogen peroxide homeostasis. Front. Plant Sci. 2020, 11, 548034. [Google Scholar] [CrossRef]
- Baxter, A.; Mittler, R.; Suzuki, N. ROS as key players in plant stress signalling. J. Exp. Bot. 2014, 65, 1229–1240. [Google Scholar] [CrossRef] [PubMed]
- Ashraf, M.; Foolad, M.R. Roles of glycine betaine and proline in improving plant abiotic stress resistance. Environ. Exp. Bot. 2007, 59, 206–216. [Google Scholar] [CrossRef]
- Ashraf, M.A.; Harris, P.J.C. Potential biochemical indicators of salinity tolerance in plants. Plant Sci. 2004, 166, 3–16. [Google Scholar] [CrossRef]
- Less, H.; Galili, G. Principal transcriptional programs regulating plant amino acid metabolism in response to abiotic stresses. Plant Physiol. 2008, 147, 316–330. [Google Scholar] [CrossRef] [Green Version]
- Ueda, A.; Yamamoto-Yamane, Y.; Takabe, T. Salt stress enhances proline utilization in the apical region of barley roots. Biochem. Biophys. Res. Commun. 2007, 355, 61–66. [Google Scholar] [CrossRef]
- Ren, S.X.; Ma, K.B.; Lu, X.G.; Chen, G.; Cui, J.W.; Tong, P.X.; Wang, L.; Teng, N.J.; Jin, B. Transcriptomic and metabolomic analysis of the heat-stress response of Populus tomentosa Carr. Forests 2019, 10, 383. [Google Scholar] [CrossRef] [Green Version]
- Behl, R.; Moawad, A.; Achtmich, W. Amino acid and protein profile changes in spring wheat mutant under prolonged heat stress. Ann. Biol. 1991, 7, 63–67. [Google Scholar]
- Hoekstra, F.A.; Crowe, J.H.; Crowe, L.M. Effect of sucrose on phase behavior of membranes in intact pollen of Typha latifolia L., as measured with Fourier transform infrared spectroscopy. Plant Physiol. 1991, 97, 1073–1079. [Google Scholar] [CrossRef] [PubMed] [Green Version]
- Shah, N.; Paulsen, G. Interaction of drought and high temperature on photosynthesis and grain-filling of wheat. Plant Soil 2003, 257, 219–226. [Google Scholar] [CrossRef]
- Boote, K.J.; Bennett, J.M.; Sinclair, T.R.; Paulsen, G.M. High temperature responses of crop plants. In Physiology and Determination of Crop Yield; American Society of Agronomy: Madison, WI, USA, 1994; pp. 365–389. [Google Scholar]
- Al-Khatib, K.; Paulsen, G.M. Mode of high temperature injury to wheat during grain development. Physiol. Plant. 1984, 61, 363–368. [Google Scholar] [CrossRef]
- Saidi, Y.; Finka, A.; Goloubinoffff, P. Heat perception and signalling in plants: A tortuous path to thermotolerance. New Phytol. 2011, 190, 556–565. [Google Scholar] [CrossRef] [PubMed]
- Wang, X.; Chen, S.; Shi, X.; Liu, D.; Zhao, P.; Lu, Y.; Cheng, Y.; Liu, Z.; Nie, X.; Song, W.; et al. Hybrid sequencing reveals insight into heat sensing and signaling of bread wheat. Plant J. 2019, 98, 1015–1032. [Google Scholar] [CrossRef] [PubMed]
- Olas, J.J.; Apelt, F.; Annunziata, M.G.; John, S.; Richard, S.I.; Gupta, S.; Kragler, F.; Balazadeh, S.; Mueller-Roeber, B. Primary carbohydrate metabolism genes participate in heat stress memory at the shoot apical meristem of Arabidopsis thaliana. Mol. Plant 2021, 14, 1508–1524. [Google Scholar] [CrossRef] [PubMed]
- Li, T.; Xu, X.; Li, Y.; Wang, H.; Li, Z.; Li, Z. Comparative transcriptome analysis reveals difffferential transcription in heat-susceptible and heat-tolerant pepper (Capsicum annum L.) cultivars under heat stress. J. Plant Biol. 2015, 58, 411–424. [Google Scholar] [CrossRef]
- Dang, F.F.; Wang, Y.N.; Yu, L.; Eulgem, T.; Lai, Y.; Liu, Z.Q.; Wang, X.; Qiu, A.L.; Zhang, T.X.; Lin, J.; et al. CaWRKY40, a WRKY protein of pepper, plays an important role in the regulation of tolerance to heat stress and resistance to Ralstonia solanacearum infection. Plant Cell Environ. 2013, 36, 757–774. [Google Scholar] [CrossRef] [PubMed]
- Cai, H.; Yang, S.; Yan, Y.; Xiao, Z.; Cheng, J.; Wu, J.; Qiu, A.; Lai, Y.; Mou, S.; Guan, D.; et al. CaWRKY6 transcriptionally activates CaWRKY40, regulates Ralstonia solanacearum resistance, and confers high-temperature and high-humidity tolerance in pepper. J. Exp. Bot. 2015, 66, 3163–3174. [Google Scholar] [CrossRef] [PubMed] [Green Version]
- He, Y.; Zhang, X.; Shi, Y.; Xu, X.; Li, L.; Wu, J.L. PREMATURE SENESCENCE LEAF 50 promotes heat stress tolerance in rice (Oryza sativa L.). Rice 2021, 14, 53. [Google Scholar] [CrossRef] [PubMed]
- Zheng, Y.X.; Xiao, J.C.; Zheng, K.M.; Ma, J.Y.; He, M.L.; Li, J.; Li, M.Y. Transcriptome profiling reveals the effects of nitric oxide on the growth and physiological characteristics of watermelon under aluminum stress. Genes 2021, 12, 1735. [Google Scholar] [CrossRef] [PubMed]
- Pertea, M.; Pertea, G.M.; Antonescu, C.M.; Chang, T.C.; Mendell, J.T.; Salzberg, S.L. StringTie enables improved reconstruction of a transcriptome from RNA-seq reads. Nat. Biotechnol. 2015, 33, 290–295. [Google Scholar] [CrossRef] [PubMed] [Green Version]
- Love, M.I.; Huber, W.; Anders, S. Moderated estimation of fold change and dispersion for RNA-seq data with DESeq2. Genome Biol. 2014, 15, 1–21. [Google Scholar] [CrossRef] [PubMed] [Green Version]
- Robinson, M.D.; McCarthy, D.J.; Smyth, G.K. EdgeR: A Bioconductor package for differential expression analysis of digital gene expression data. Bioinformatics 2010, 26, 139–140. [Google Scholar] [CrossRef] [PubMed] [Green Version]
- Pfaffl, M.W. A new mathematical model for relative quantification in real-time RT-PCR. Nucleic Acids Res. 2001, 29, e45. [Google Scholar] [CrossRef] [PubMed]


Publisher’s Note: MDPI stays neutral with regard to jurisdictional claims in published maps and institutional affiliations. |
© 2022 by the authors. Licensee MDPI, Basel, Switzerland. This article is an open access article distributed under the terms and conditions of the Creative Commons Attribution (CC BY) license (https://creativecommons.org/licenses/by/4.0/).
Share and Cite
Li, M.; Li, J.; Zhang, R.; Lin, Y.; Xiong, A.; Tan, G.; Luo, Y.; Zhang, Y.; Chen, Q.; Wang, Y.; et al. Combined Analysis of the Metabolome and Transcriptome to Explore Heat Stress Responses and Adaptation Mechanisms in Celery (Apium graveolens L.). Int. J. Mol. Sci. 2022, 23, 3367. https://doi.org/10.3390/ijms23063367
Li M, Li J, Zhang R, Lin Y, Xiong A, Tan G, Luo Y, Zhang Y, Chen Q, Wang Y, et al. Combined Analysis of the Metabolome and Transcriptome to Explore Heat Stress Responses and Adaptation Mechanisms in Celery (Apium graveolens L.). International Journal of Molecular Sciences. 2022; 23(6):3367. https://doi.org/10.3390/ijms23063367
Chicago/Turabian StyleLi, Mengyao, Jie Li, Ran Zhang, Yuanxiu Lin, Aisheng Xiong, Guofei Tan, Ya Luo, Yong Zhang, Qing Chen, Yan Wang, and et al. 2022. "Combined Analysis of the Metabolome and Transcriptome to Explore Heat Stress Responses and Adaptation Mechanisms in Celery (Apium graveolens L.)" International Journal of Molecular Sciences 23, no. 6: 3367. https://doi.org/10.3390/ijms23063367