Article

The Plastome Sequences of Triticum sphaerococcum (ABD) and Triticum turgidum subsp. durum (AB) Exhibit Evolutionary Changes, Structural Characterization, Comparative Analysis, Phylogenomics and Time Divergence

1
Department of Botany, Garden Campus, Abdul Wali Khan University, Mardan 23200, Pakistan
2
Natural and Medical Sciences Research Center, University of Nizwa, Nizwa 616, Oman
3
Division of Plant Biosciences, School of Applied Biosciences, College of Agriculture & Life Science, Kyungpook National University, Daegu 41566, Korea
4
Department of Engineering Technology, College of Technology, University of Houston, Sugar Land, TX 77479, USA
*
Authors to whom correspondence should be addressed.
These authors contributed equally to this work.
Int. J. Mol. Sci. 2022, 23(5), 2783; https://doi.org/10.3390/ijms23052783
Submission received: 2 February 2022 / Revised: 24 February 2022 / Accepted: 26 February 2022 / Published: 3 March 2022
(This article belongs to the Special Issue Plant Genomics and Genome Editing)

Abstract

:
The mechanism and course of Triticum plastome evolution is currently unknown; thus, it remains unclear how Triticum plastomes evolved during recent polyploidization. Here, we report the complete plastomes of two polyploid wheat species, Triticum sphaerococcum (AABBDD) and Triticum turgidum subsp. durum (AABB), and compare them with 19 available and complete Triticum plastomes to create the first map of genomic structural variation. Both T. sphaerococcum and T. turgidum subsp. durum plastomes were found to have a quadripartite structure, with plastome lengths of 134,531 bp and 134,015 bp, respectively. Furthermore, diploid (AA), tetraploid (AB, AG) and hexaploid (ABD, AGAm) Triticum species plastomes displayed a conserved gene content and commonly harbored an identical set of annotated unique genes. Overall, there was a positive correlation between the number of repeats and plastome size. In all plastomes, the number of tandem repeats was higher than the number of palindromic and forward repeats. We constructed a Triticum phylogeny based on the complete plastomes and 42 shared genes from 71 plastomes. We estimated the divergence of Hordeum vulgare from wheat around 11.04–11.9 million years ago (mya) using a well-resolved plastome tree. Similarly, Sitopsis species diverged 2.8–2.9 mya before Triticum urartu (AA) and Triticum monococcum (AA). Aegilops speltoides was shown to be the maternal donor of polyploid wheat genomes and diverged ~0.2–0.9 mya. The phylogeny and divergence time estimates presented here can act as a reference framework for future studies of Triticum evolution.

1. Introduction

Triticeae Dumort. is an economically valuable grass tribe with around 360 species and subspecies in 20–30 genera. The genus Triticum is an important agricultural allopolyploid complex containing two diploids, two tetraploids, and two hexaploids. Over 10,000 years, one diploid and both tetraploid species have been domesticated, whereas two hexaploid species emerged under cultivation in Eurasia [1]. Hybridization of a cultivated type of tetraploid Triticum turgidum (AABB genomes) with diploid goat grass Aegilops tauschii (DD genome) resulted in hexaploid common wheat, i.e., bread wheat (Triticum aestivum, AABBDD genomes). Similarly, Triticum zhukovskyi (AAGGAmAm genomes), the second hexaploid wheat, was produced by crossing tetraploid Timopheevi wheat (Triticum timopheevii, AAGG genomes) with diploid einkorn (Triticum monococcum ssp. monococcum, AmAm genome). The Emmer lineage of wheat includes T. turgidum and T. aestivum, whereas the Timopheevi lineage includes T. timopheevii and T. zhukovskyi [2]. Triticum urartu (genome AA) contributed the A genome to the Emmer and Timopheevi lineages as the male parent [3,4], whereas Aegilops speltoides (SS genome) contributed the cytoplasm [5] and G genome [6,7] to T. timopheevii as the female parent. Since Jenkins initially identified A. speltoides as a probable donor for the B genome and the cytoplasm of T. turgidum 90 years ago [8], the origin of the B genome and the cytoplasm of T. turgidum has been disputed. Previous research has proposed that the B genome came from one of the other diploid Sitopsis species in the genus Aegilops, i.e., Aegilops searsii (Ss Ss genome), Aegilops sharonensis (Ssh Ssh genome), Aegilops longissima (Sl Sl genome), or Aegilops bicornis (Sb Sb genome) [9].
Low barriers to hybridization are known to exist in Triticeae, which has resulted in mixed or even recombinant phylogenetic evidence from nuclear data [10,11]. In Triticum and the closely related genus Aegilops, chloroplast DNA is inherited maternally [12]; consequently, chloroplast evolution has been efficiently and critically investigated in Triticum and Aegilops with the aim of clarifying the genetic variety of the cytoplasm as well as the maternal lineage [13]. Organelles are typically uniparentally inherited and nonrecombining in angiosperms; hence, phylogenetic studies of chloroplast genomes offer unequivocal information on maternal lineages [14]. However, chloroplast capture [15] can result in conflicting phylogenetic assumptions. Currently, there is a scarcity of plastome sequencing information for Triticeae. Only a few studies [16,17,18,19,20] have employed a tribe-wide taxon sample and they have focused on a single plastome or a few plastomes markers. Although the number of full plastome sequences is growing [21,22,23,24,25,26,27,28], whole plastomes are mostly available for domesticated species and their near relatives. Because just one to a few accessions per taxon have been included in earlier research and given that support values for taxonomic units have generally been low, prior analyses have provided only limited insights into the maternal phylogeny of Triticeae [17,19,29].
Typically, plastomes are 115–165 kb in size [30]. Plastomes of the Poaceae family have a similar structure, with large single copy (LSC) and short single copy (SSC) regions of about 80 and 13 kb in length, respectively, placed between two inverted repeat sequences with lengths of about 20 kb [31,32,33]. Different genes of the nuclear genome and plastome appear to have different genealogical histories; however, it is not known whether the historical connections among the genera and species of this tribe can be resolved in a tree-like manner. If so, the true phylogenetic relationships remain unclear because published trees are in conflict for almost all taxon positions [10].
In the current study, we sequenced the complete plastomes of two Triticum species, T. sphaerococcum (AABBDD) and T. turgidum subsp. durum (AABB), and compared them with 19 complete Triticum plastomes available in NCBI database (1 June 2021). We intended to answer the following key questions about Triticum plastomes. (1) What are the common features of Triticum plastomes (such as gene order, gene content, gene gain, gene loss, and genome size variation)? (2) Elucidate the factors that influence the size of Triticum plastomes? (3) Based on the whole plastome and genes shared among the plastomes, what was the estimated divergence time of all Triticum available species? (4) To determine variation in the types of repeats found in these plastomes? Overall, our results will help elucidate the evolution of Triticum, as well as build a better taxonomy for this economically important genus.

2. Material and Methods

2.1. Sequencing, Assembly and Annotation

Fresh young leaves of T. sphaerococcum (AABBDD) and T. turgidum subsp. durum (AABB) were collected from plants growing in Swat region of Khyber Pakhtunkhwa province, Pakistan. The plants were identified by lead taxonomist at National Agricultural Research Centre (NARC), Pakistan. Both species, T. sphaerococcum and T. turgidum subsp. durum are available with accesion number 3 and 25, respectively at Gene Bank of Bioresources Conservation Institute, Pakistan. The leaf samples were collected in plastic zip bags and immediately kept in liquid nitrogen and stored at −80 °C for further analysis. A standard protocol for DNA extraction was followed, as described previously [34]. Pure DNA was sequenced using an Illumina HiSeq2000. In total, 115,455,321 and 86,123,254 raw reads were generated for T. sphaerococcum and T. turgidum subsp. durum, respectively. Next, the quality of paired-end Illumina reads was assessed in FastQC and the pipeline GetOrganelle version 1.6.2. [35] was used to select trimmed reads with default settings that corresponded to the plastid using the plastome of T. aestivum as a reference. Finally, the plastid-filtered reads from GetOrganelle version 1.6.2 were imported into Geneious Prime using the default settings. Furthermore, the complete plastomes of 19 Triticum species available in GenBank (as of 18 May 2021) were downloaded from the NCBI database (Table S1). The species with incorrect annotations were reannotated using CpGAVAS [36] and DOGMA [37] (http://dogma.ccbb.utexas.edu/ accessed on 25 February 2022, China). Moreover, tRNAscan-SE version 1.21 [38] was used to detect tRNA genes. Finally, the annotations were verified by Geneious Prime [39]. Graphical presentations were completed in R 4.0 and the ggplot2 package [40]. The number of genes shared among Triticum plastomes was identified via a Venn diagram webtool (bioinformatics.psb.ugent.be/webtools/Venn/ accessed on 25 February 2022). Pearson’s correlation coefficients were used to evaluate the associations among different plastomes characteristics, and the graphs were illustrated using R software (https://www.r-project.org/ accessed on 25 February 2022) cor function.

2.2. Characterization of Repetitive Sequences and SSRs

REPuter was used to determine the repetitive sequences (direct, reverse, and palindromic repeats) within plastomes [41]. For repeat identification, the following settings were used in REPuter: (1) a minimum repeat size of 30 bp, (2) ≥90% sequence identity, and (3) a Hamming distance of 1. Tandem Repeats Finder version 4.07b was used to find tandem repeats with the default settings applied [42]. To find SSRs, MISA [43] was employed with the search parameters set to ≥3 repeat units for pentanucleotide and hexanucleotide repeats, ≥4 repeat units for trinucleotide and tetranucleotide repeats, ≥8 repeat units for dinucleotide repeats, and ≥10 repeat units for mononucleotide repeats.

2.3. Sequence Divergence, Phylogenetic Analyses, and Divergence Time

For genome divergence among Triticum plastomes, mVISTA [44] in Shuffle-LAGAN mode was used with T. turgidum subsp. durum selected as a reference genome. The complete plastome and 42 shared protein-coding genes sequence divergence among Triticum species was calculated. Comparative analysis was performed after multiple sequence alignment and gene order was compared to identify ambiguous and missing gene annotations. To align the complete plastomes, MAFFT version 7.222 [45] was used with the default parameters and Kimura’s two-parameter (K2P) model [46] was used to determine pairwise sequence divergence. To resolve the phylogenetic position of Triticum, the complete plastomes and 42 shared genes from 71 (including 23 complete and 39 draft plastomes) of Triticum were used for analysis. Initially, a separate ML analysis of these data were conducted using RAxML [47] implemented in CIPRES with the default general time reversible (GTR + G) model and the fast bootstrap option, as previously reported by [48]. The resulting phylogenetic reconstruction was displayed using FigTree version 1.4.1 [49] and Interactive Tree Of Life (iTOL) version 6 [50].
To determine the divergence time of the Triticum genus relative to those of Triticeae species, we used a concatenated data matrix. Briefly, the GTR + G substitution model was used with four rate categories and a Yule tree speciation model was applied with a lognormal relaxed clock model in BEAST [51] using a prior rate of substitution. We used an average substitution rate of 3.0 × 10⁻⁹ substitutions per site per year (s/s/y) and a fossil-based method to calibrate the molecular divergence as previously reported [52]. To root the calibration time, we included four outgroup Hordeum species: H. vulgare subsp. vulgare, H. vulgare subsp. spontaneum, H. jubatum, and H. bogdani. We also incorporated four fossil constraints (Supplementary Table S2) that are widely recognized and have been used in previous molecular dating of Triticeae [53]. The mean root height constraint of 11.8 ± 1.8 mya was based on the work of [53,54]. This calibration is consistent with previous work completed by [22]. We selected these outgroups as all these species are closely related to our study model species and have fossil records older than that of the Triticum genus [53].
Calibration limited to the root height was used to compare with internal calibrations and assess their influence on divergence time estimates. The dating analyses involved three independent Markov Chain Monte Carlo runs of 25 million generations. LogCombiner was used to combine the tree files from each of the three runs. Convergence and effective sample sizes were assessed in Tracer 1.5 [55]. From each analysis, we removed 25% of trees as burn-in. Finally, the tree was calculated using TreeAnnotator and a tree with the 95% highest posterior density was visualized in FigTree 1.4.

3. Results

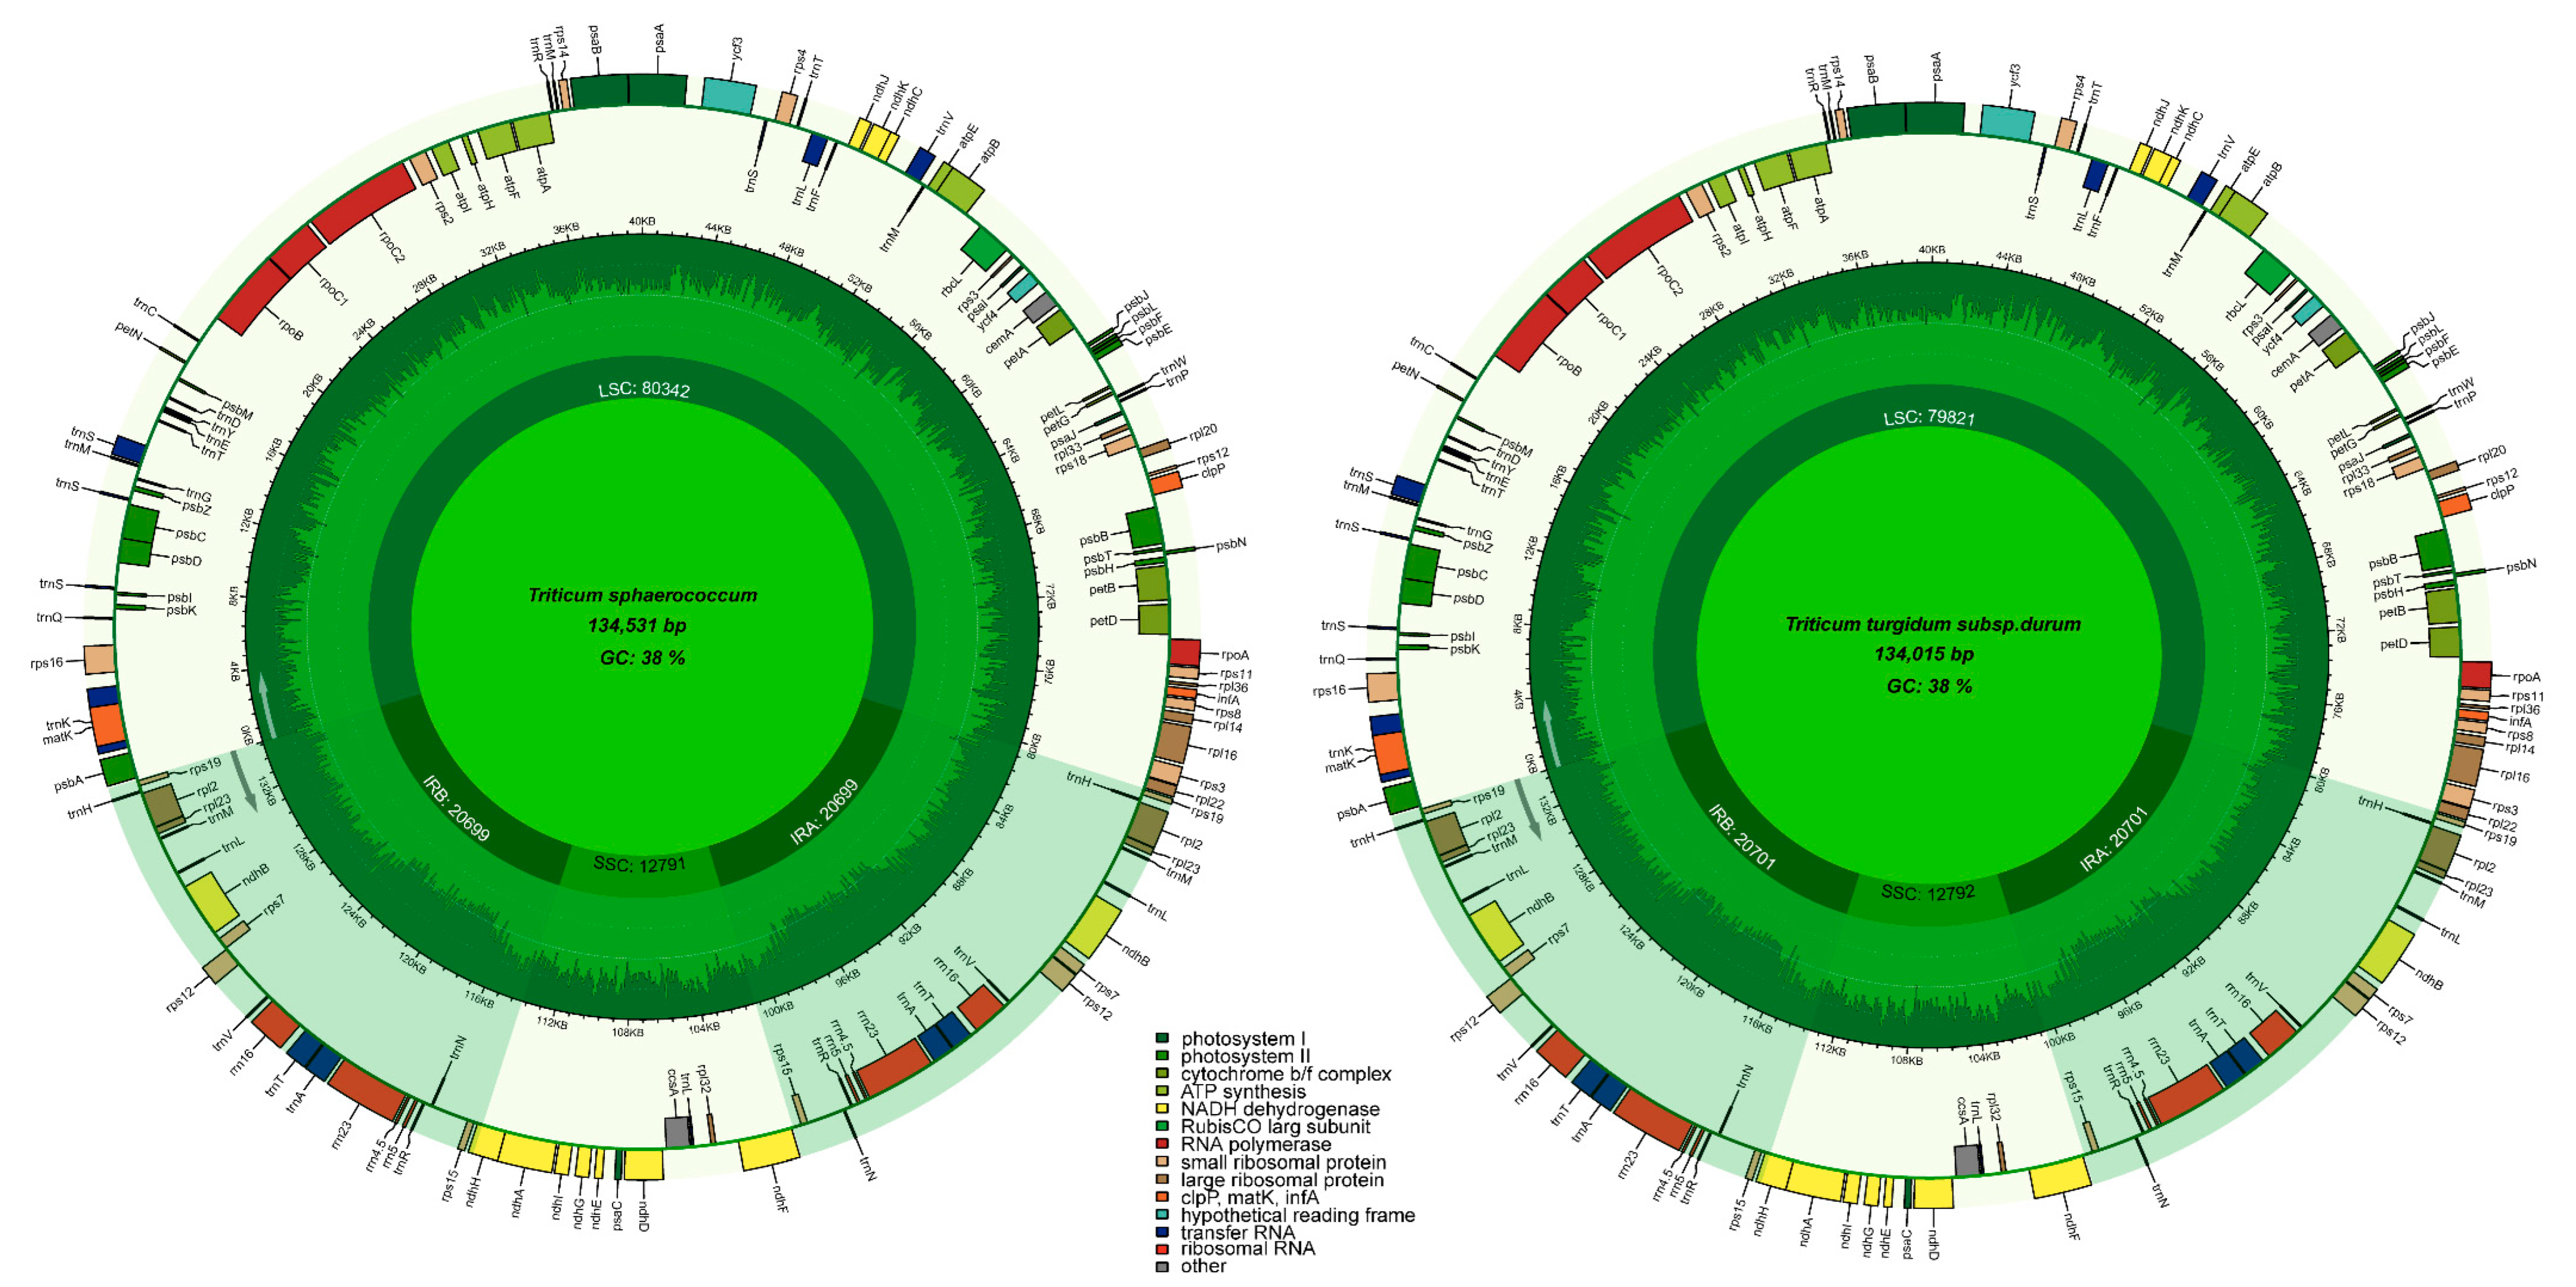
3.1. Triticum Plastome Characteristics (Genome Size and GC Content Variation)

The complete chloroplast genomes (cp) of the two sequenced Triticum species, T. sphaerococcum (MZ230675), T. turgidum subsp. durum (MZ230674), are circular molecules like typical angiosperm cp genomes having quadripartite structures. The sizes of the T. sphaerococcum and T. turgidum subsp. durum plastomes are 134,015 bp and 134,531 bp, respectively (Figure 1). Both T. sphaerococcum and T. turgidum subsp. durum plastomes were analyzed and compared with 19 associated Triticum cp genomes, with sizes ranging from 133,873 bp (T. aestivum; KJ592713) to 136,886 bp (T. monococcum subsp. monococcum (LC005977)) (Table 1). Even in the sequenced plastomes of similar species reported by various authors, variation in plastome length was detected in Triticum species. Both T. sphaerococcum and T. turgidum subsp. durum species in this study, had a pair of IR regions 20,699 and 20,701 bp, which divided the LSC region from the SSC, respectively, whereas the LSC and SSC lengths in T. sphaerococcum (80,342 and 12,791) and T. turgidum subsp. durum (79,817 and 12,788 bp). Both of these species had the same GC content in their genomes, 38.3% in the whole plastome and 44% in the IR regions (Figure 1, Table 1).

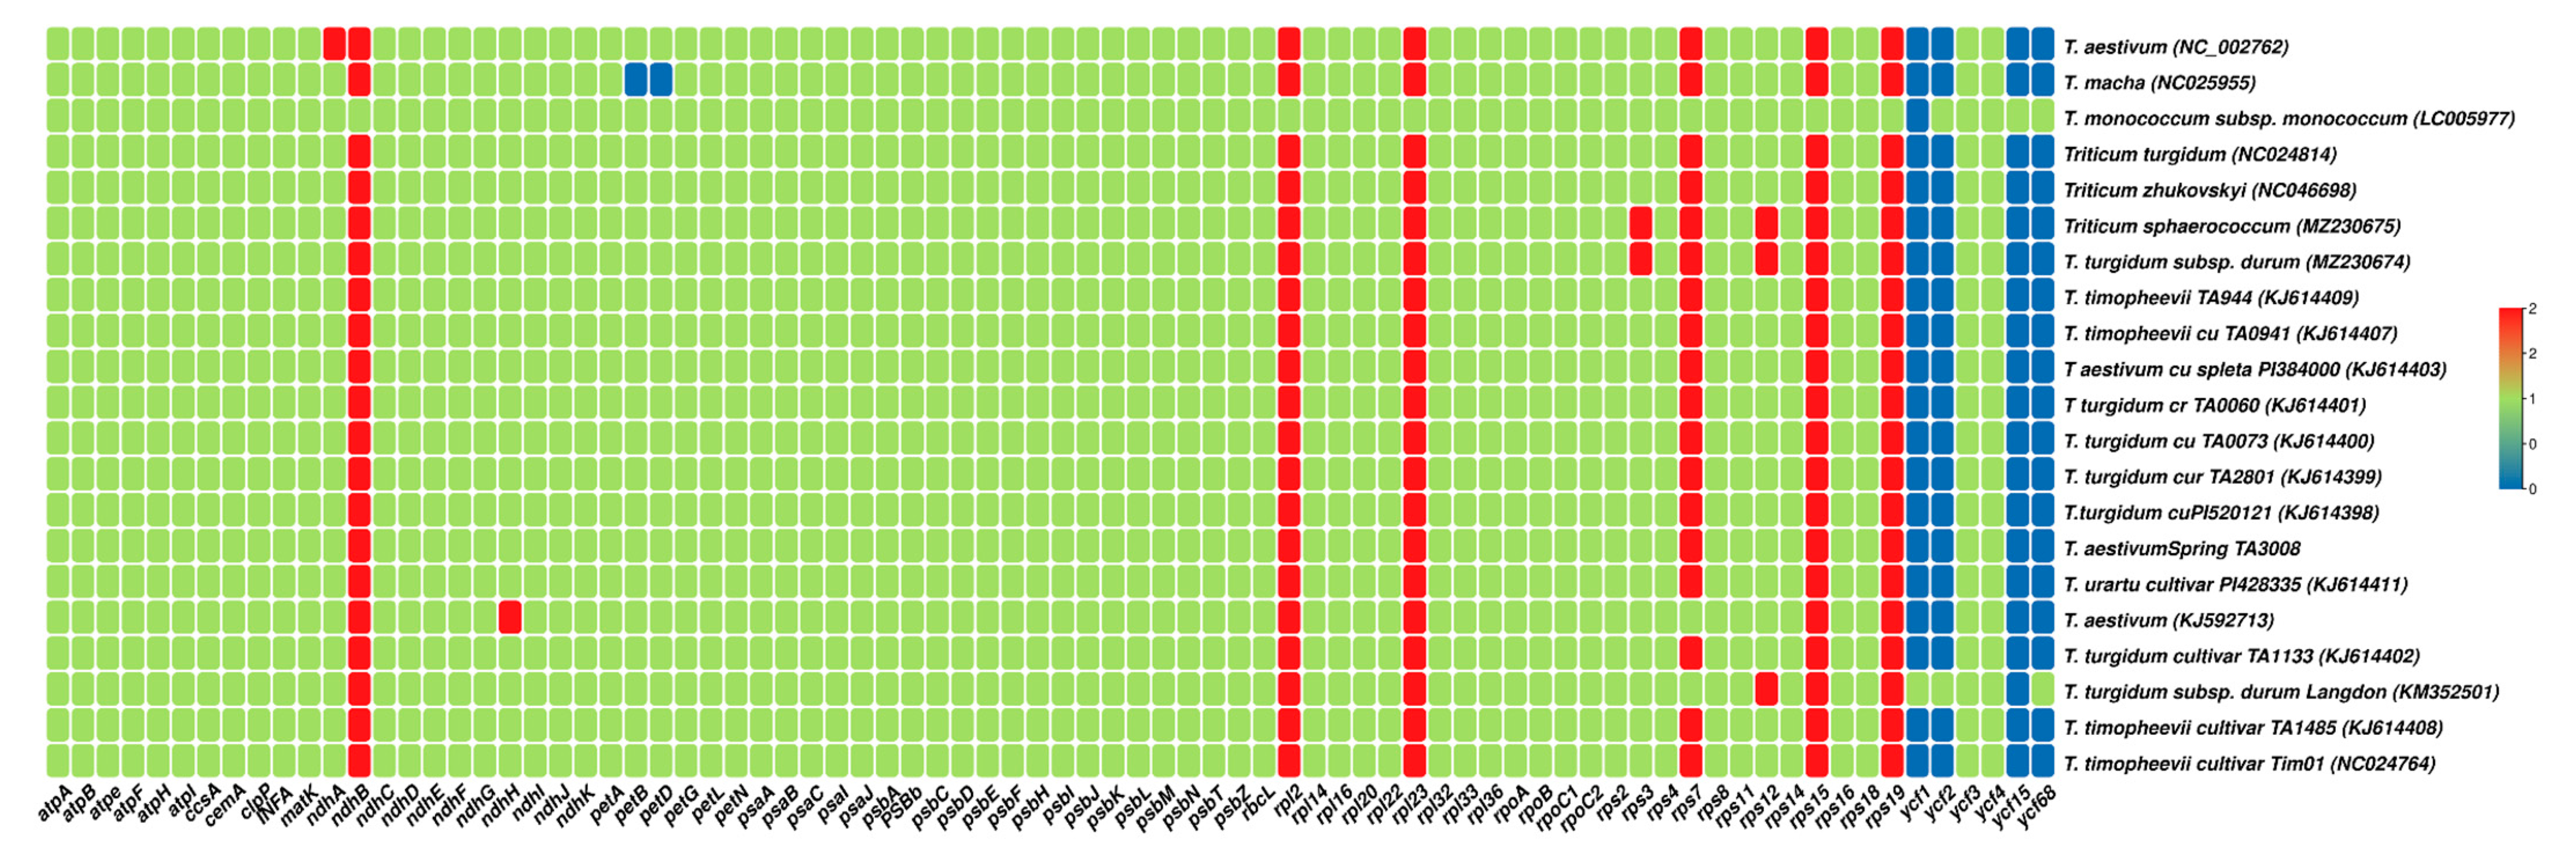
3.2. Gene Content and Gene Loss in Triticum Plastomes

The gene content of the 21 Triticum plastomes varied considerably. There were 72–89 protein-coding genes, 8 rRNA genes, and 32–42 tRNA genes in these plastomes (Figure 1, Table 1). The number of genes annotated in a plastome ranged from 112 (T. macha, T. monococcum subsp. monococcum) to 136 (T. turgidum subsp. durum cultivar Langdon). Both the plastomes sequenced in this study had 131 genes including 8 rRNA genes, 39 tRNA genes, and 84 protein-coding genes (5 genes for photosystem I, 15 genes associated with photosystem II, 11 genes for large ribosomal proteins, and 17 genes related to small ribosomal proteins) (Table 2). In both plastomes, the lengths of the protein-coding region, tRNA, and rRNA were 59,538, 3004, and 9192 bp, respectively (Table 1). The gene contents were generally conserved throughout all Triticum species (Figure 2). The ycf1, ycf2, ycf15, and ycf68 genes were lacking in almost all plastomes (Figure 2), with the exception of the T. turgidum subsp. durum langdon plastome in which the ycf1 gene was detected. Notably, as in previous plastomes, the plastid gene accD was lost in all Triticum plastomes. The rps12 gene (small ribosomal protein 12) is trans spliced and has one intron; the 5′ end exon is in the LSC region, whereas the 3′ end exon is in the IRb regions and duplicated in the IRa region.
Each of the sequenced Triticum species contained 12 intron-containing protein genes and 8 tRNA genes. Similar to in other angiosperm plastomes, ycf3 contained two introns, whereas the remaining genes had only a single intron while the rps12 gene is trans-spliced. The smallest introns were found in the trnS-CGA gene in both T. sphaerococcum and T. turgidum subsp. durum (658 bp), whereas the largest intron-containing gene was found in trnK-UUU in T. sphaerococcum (2486 bp) and in T. turgidum subsp. durum (2490 bp) (Table 3). The protein-coding region formed 44.2% of the whole plastome of T. sphaerococcum and 44.4% of that of T. turgidum subsp. durum. Similarly, tRNA and rRNA respectively comprised 2.23% and 6.83% of former species and 2.24% and 6.85% of the latter species.

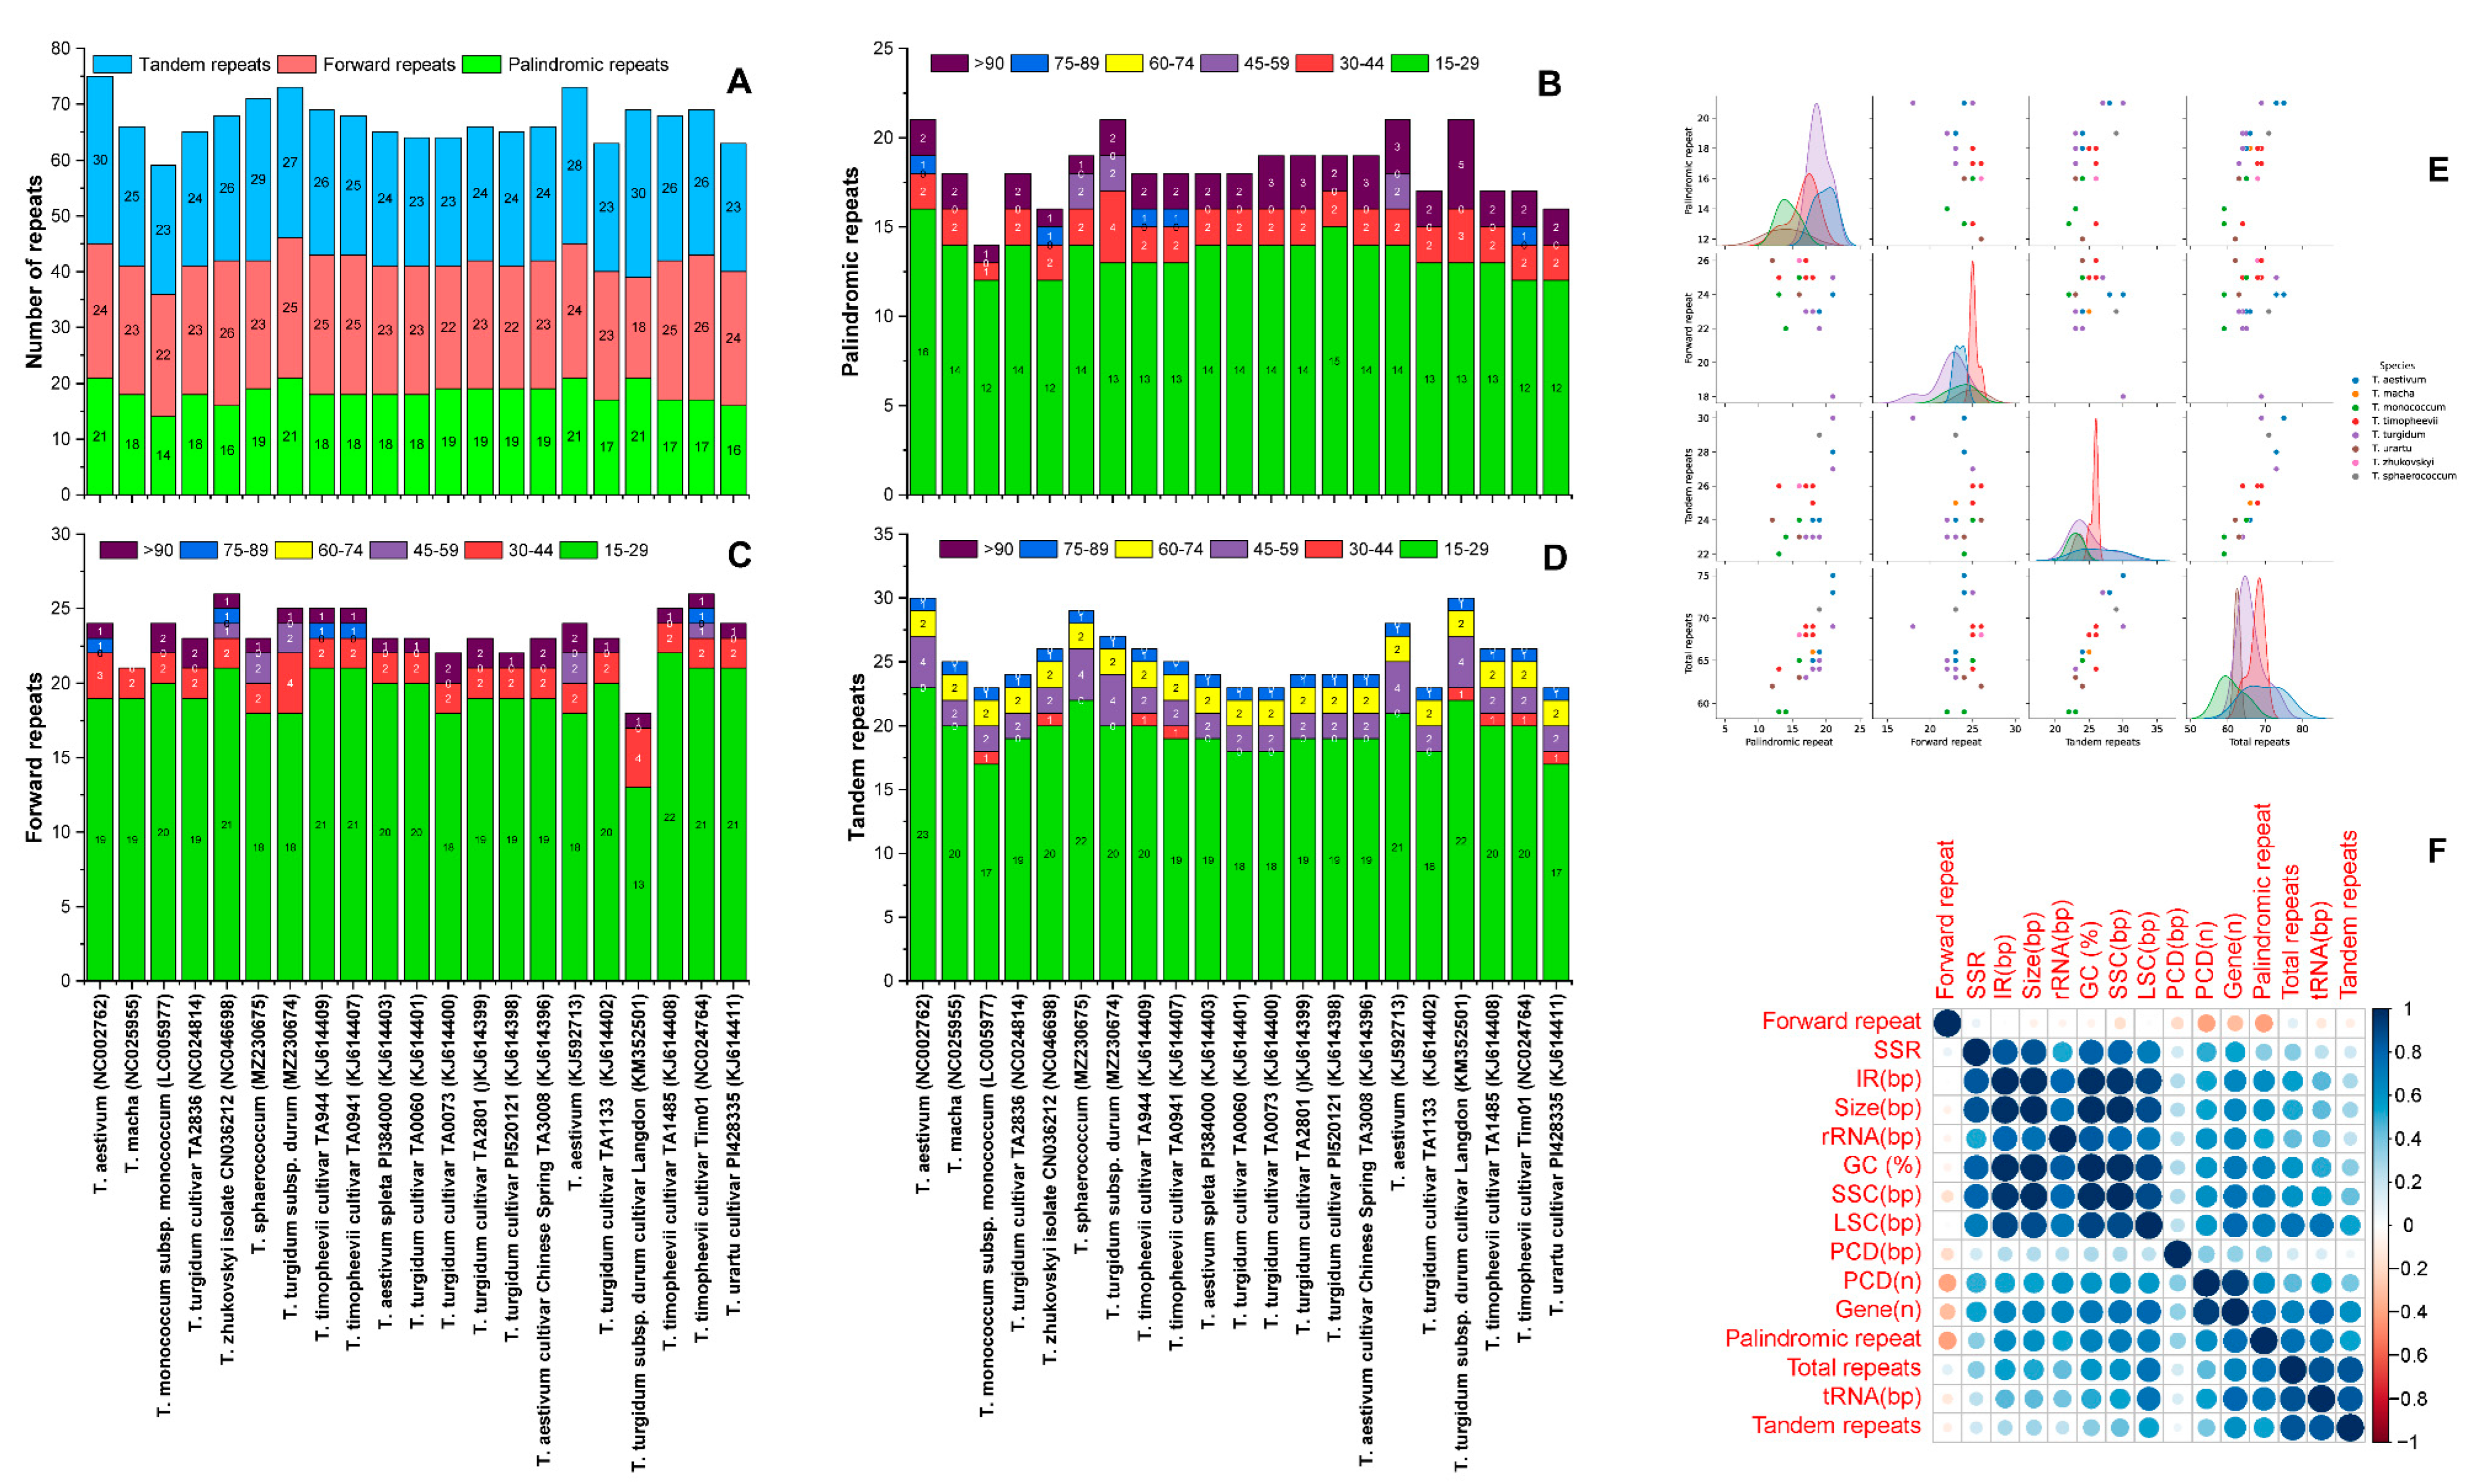
3.3. Functional Repeats within Triticum Plastomes

In repeat analysis, different forms of repeat sequences in the 21 plastomes, including T. sphaerococcum and T. turgidum subsp. durum, were analyzed. T. sphaerococcum had 19 palindromic repeats, 23 forward repeats, and 29 tandem repeats, whereas T. turgidum had 21 palindromic repeats, 25 forward repeats, and 27 tandem repeats (Figure 3). Across all species, there was some variation in the number of repeats. The overall number of repeats in these genomes (including palindromic, forward, and tandem repeats) ranged from 59 (T. monococcum subsp. monococcum) to 75 T. aestivum (NC002762), with 71 and 73 repeats found in T. sphaerococcum and T. turgidum subsp. durum respectively. Among these repeats, the highest number of palindromic repeats (21) were detected in four species including T. turgidum subsp. durum (Figure 3A–E). However, the highest number of forward repeats (26) was detected in the T. timopheevii cultivar Tim01 and T. zhukovskyi plastomes. Similarly, the highest number of tandem repeats were detected in the T. aestivum (NC002762) and T. turgidum subsp. durum cultivar Langdon plastomes. Overall, there was a positive correlation between plastome size and IR length (Figure 3F). Among these repeats, about 14 and 13 repeats were 15–29 bp in length in T. sphaerococcum and T. turgidum subsp. durum, respectively, while 2 and 4 repeats were 30–44 bp in length, 2 and 2 repeats were 45–59 bp in length, and 1 and 2 repeats were >90 bp in length Similarly, in both plastomes, 18 and 18 forward repeats were 15–29 bp in length, whereas 22 and 20 tandem repeats were also detected 15–29 bp in length (Figure 3A–E).

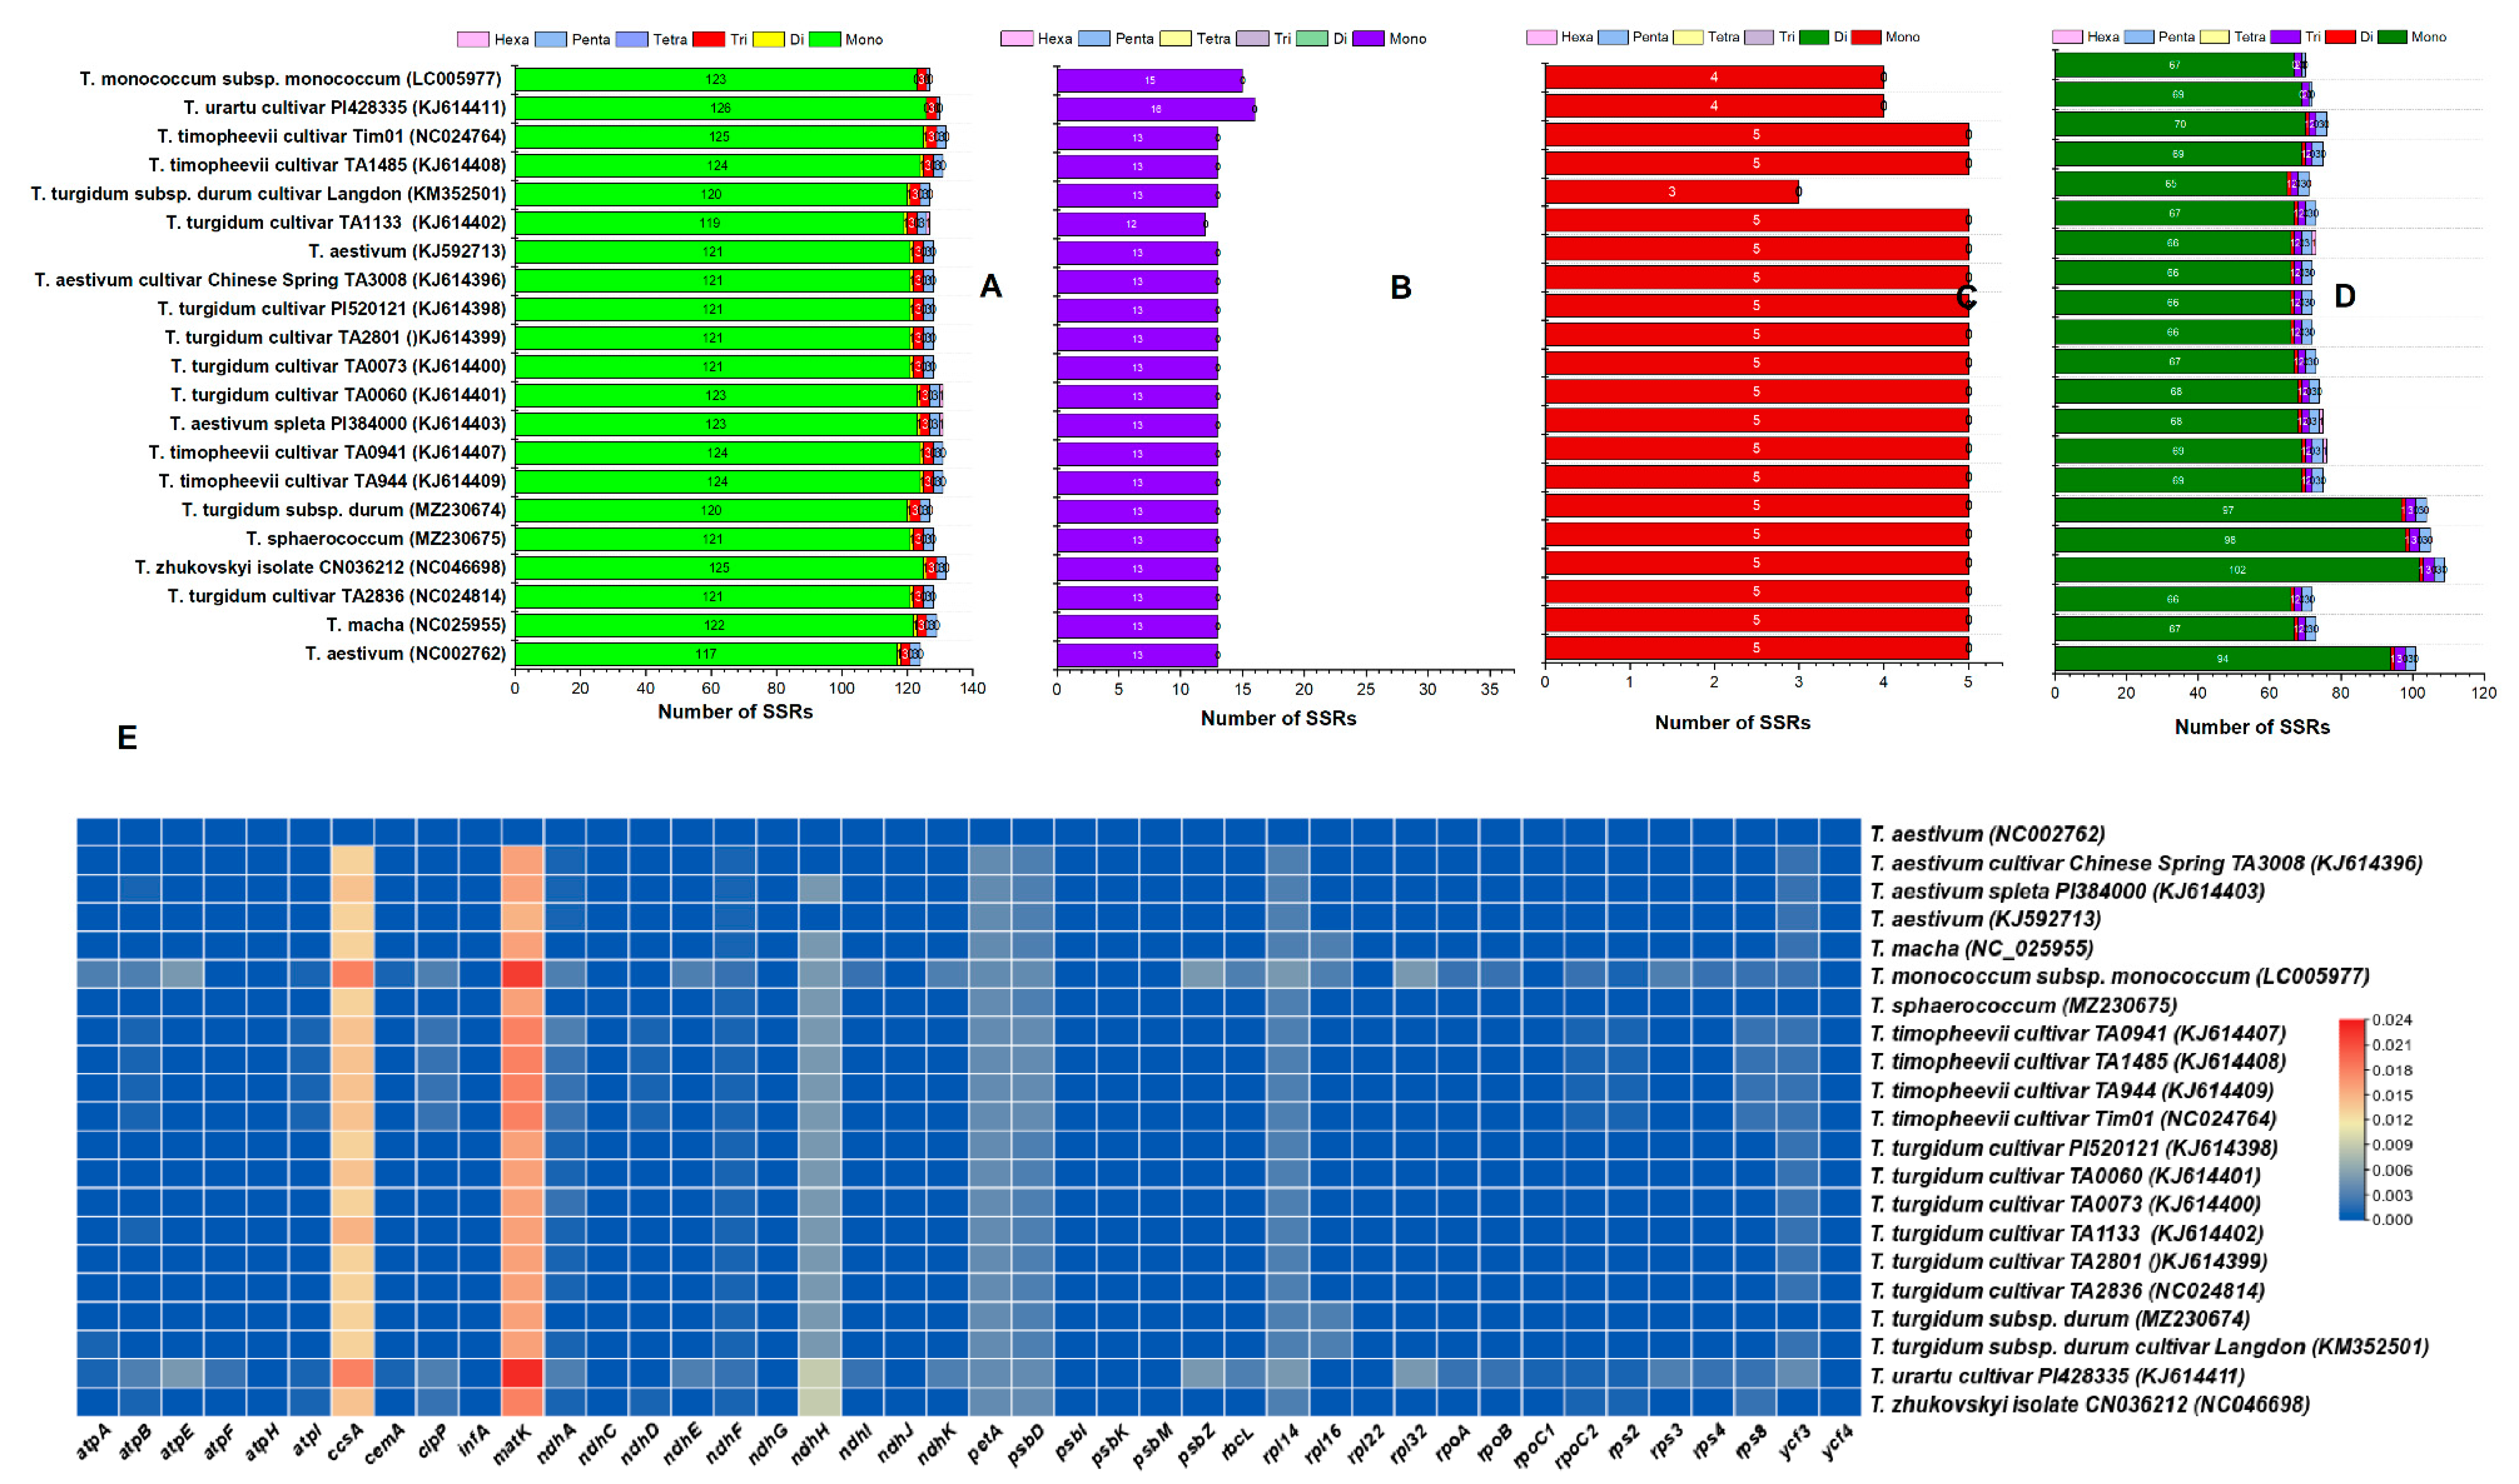
3.4. Simple Sequence Repeat (SSR) Analysis in Triticum Plastomes

We analyzed perfect SSRs in all studied plastomes (Figure 4). Similar to other plastome characteristics, there were some variations in the number of SSRs in these plastomes: SSR numbers ranged from 124 (T. aestivum NC002762) to 132 (T. timopheevii cultivar Tim01 and T. zhukovskyi). Unexpectedly, SSR numbers also varied even in plastomes of the same species; for example, in T. aestivum (NC002762) 124 SSRs were detected whereas 131 were detected in T. aestivum (KJ614403). We observed a positive association between SSR numbers and plastome size in Triticum (Figure 3F). The T. sphaerococcum and T. turgidum subsp. durum plastomes sequenced in this study contained 128 and 127 SSRs, respectively. In T. sphaerococcum, of the 128 SSRs, 121 were mononucleotide repeats (Figure 4A); 1 di, 3 tri, and 3 pentanucleotides were detected; and 82% of SSRs were found in LSC regions, around 10.1% were in SSC regions, and 3.9% were in IR regions. Similarly, T. turgidum subsp. durum contained 120 mononucleotides, with similar numbers of di, tri, and pentanucleotides to those in the T. sphaerococcum plastome, and SSRs present at 81.8% in LSC regions, 10.2% in SSC regions, and 3.9% in IR regions (Figure 4). In all plastomes, the most abundant repeat motifs were mononucleotides, ranging from 117 in T. aestivum (NC002762) to 125 in T. timopheevii (Tim01), followed by trinucleotides and pentanucleotides, which were next most abundant in most plastomes (Figure 4). Using our search criterion, tetranucleotides and hexanucleotide SSRs were absent in most plastomes except in those of T. aestivum spleta PI384000, T. turgidum TA0060, and T. turgidum cultivar TA1133, in which one hexanucleotide was observed in each plastome. Notably, only one dinucleotide SSR was detected in most plastomes.

3.5. Comparative Analysis and Divergence of Triticum Plastomes

Comparison of T. sphaerococcum and T. turgidum subsp. durum with the 19 related plastomes showed that variation existed in whole plastomes. We aligned and compared all plastomes to find the average pairwise distance among the species (Table S2). T. sphaerococcum was used a reference in pairwise sequence divergence analysis, in which it showed the highest divergence (0.004) with T. monococcum and the lowest divergence with all of Triticum astivum, Triticum trugidum, and T. timopheevii species (0.001) (Table S2). Similarly, the synteny of T. sphaerococcum and T. turgidum subsp. durum plastomes with the 19 plastomes of the other Triticum species was analyzed by mVISTA. The results showed high sequence similarities among the plastomes of several species, especially in protein-coding and IR regions (Figure S1). However, divergence was observed in noncoding regions compared with coding regions. The matK gene exhibited almost similar divergence in all plastomes. The region between the rps16 and psbl genes showed the highest divergence, except for in T. sphaerococcum that had comparatively low divergence. The atpF gene exhibited divergence in all cp genomes excluding those of T. sphaerococcum and T. turgidum subsp. durum. Similarly, the noncoding region between the trnL and ndhJ genes of T. monococcum subsp. monococcum showed large divergence with the region in T. turgidum subsp. durum plastomes. Similar results were observed in psbE and petL regions. Furthermore, a significant divergence was observed in all plastomes between rpl23-ndhB regions. Moreover, 42 protein-coding gene sequences were compared to obtain the average pairwise distance among 21 Triticum plastomes. Results showed relatively lower levels of average pairwise divergence and various divergent genes, i.e., matK, ccsA, ndhH, petA, psbD, rpl14, and ycf3, were detected in these plastomes. The highest pairwise divergence was detected in the matK (0.67) and ccsA (0.56) genes (Figure 4E).

3.6. Evolution and Origin of IRs in Triticum Plastomes

IR regions are considered to be the most conserved regions in a chloroplast genome. Larger plastome sizes correlate with larger IR lengths. Similar to previously described angiosperm plastomes, both the T. sphaerococcum and T. turgidum subsp. durum plastomes also contained IRs with lengths of 20,699 and 20,701 bp, respectively. The gene arrangement in the IR region of these plastomes was more similar to that of T. aestivum, in which, seven protein-coding genes (rpl2, rpl23, rps12, rps7, ndhB, rps15, and ndhH) are duplicated. Comparative analyses of the plastomes suggested that the smallest IR region was found in T. turgidum subsp. durum cultivar Langdon (17,066 bp), whereas the largest was detected in all four T. timopheevii cultivars (21,553 bp). Furthermore, the IR borders for different genes in the T. sphaerococcum and T. turgidum subsp. durum plastomes were compared with already published plastomes of Triticum. Due to the conserved nature of these Triticum plastomes no significant changes were observed in four IR junctions (JLB, JSB, JSA, and JLA) and genes located across these borders. Although, few variations were detected in some plastomes like location of ndhH at JSA is 975 bp in SSC and 207 bp in IRa in all plastomes except in Triticum turgidum subsp. durum cultivar Langdon which slightly deviating and located 1004 bp in SSC and 208 bp in IRa. (Figure S2). Furthermore, the rps19 is present in IRa region at JLA of all plastomes but it is located in LSC at JLA in Triticum turgidum subsp. durum cultivar Langdon and resulted in changing the location of rpl22 gene comparing to all other plastomes. The overall nature of all compared plastomes was found very conserved.

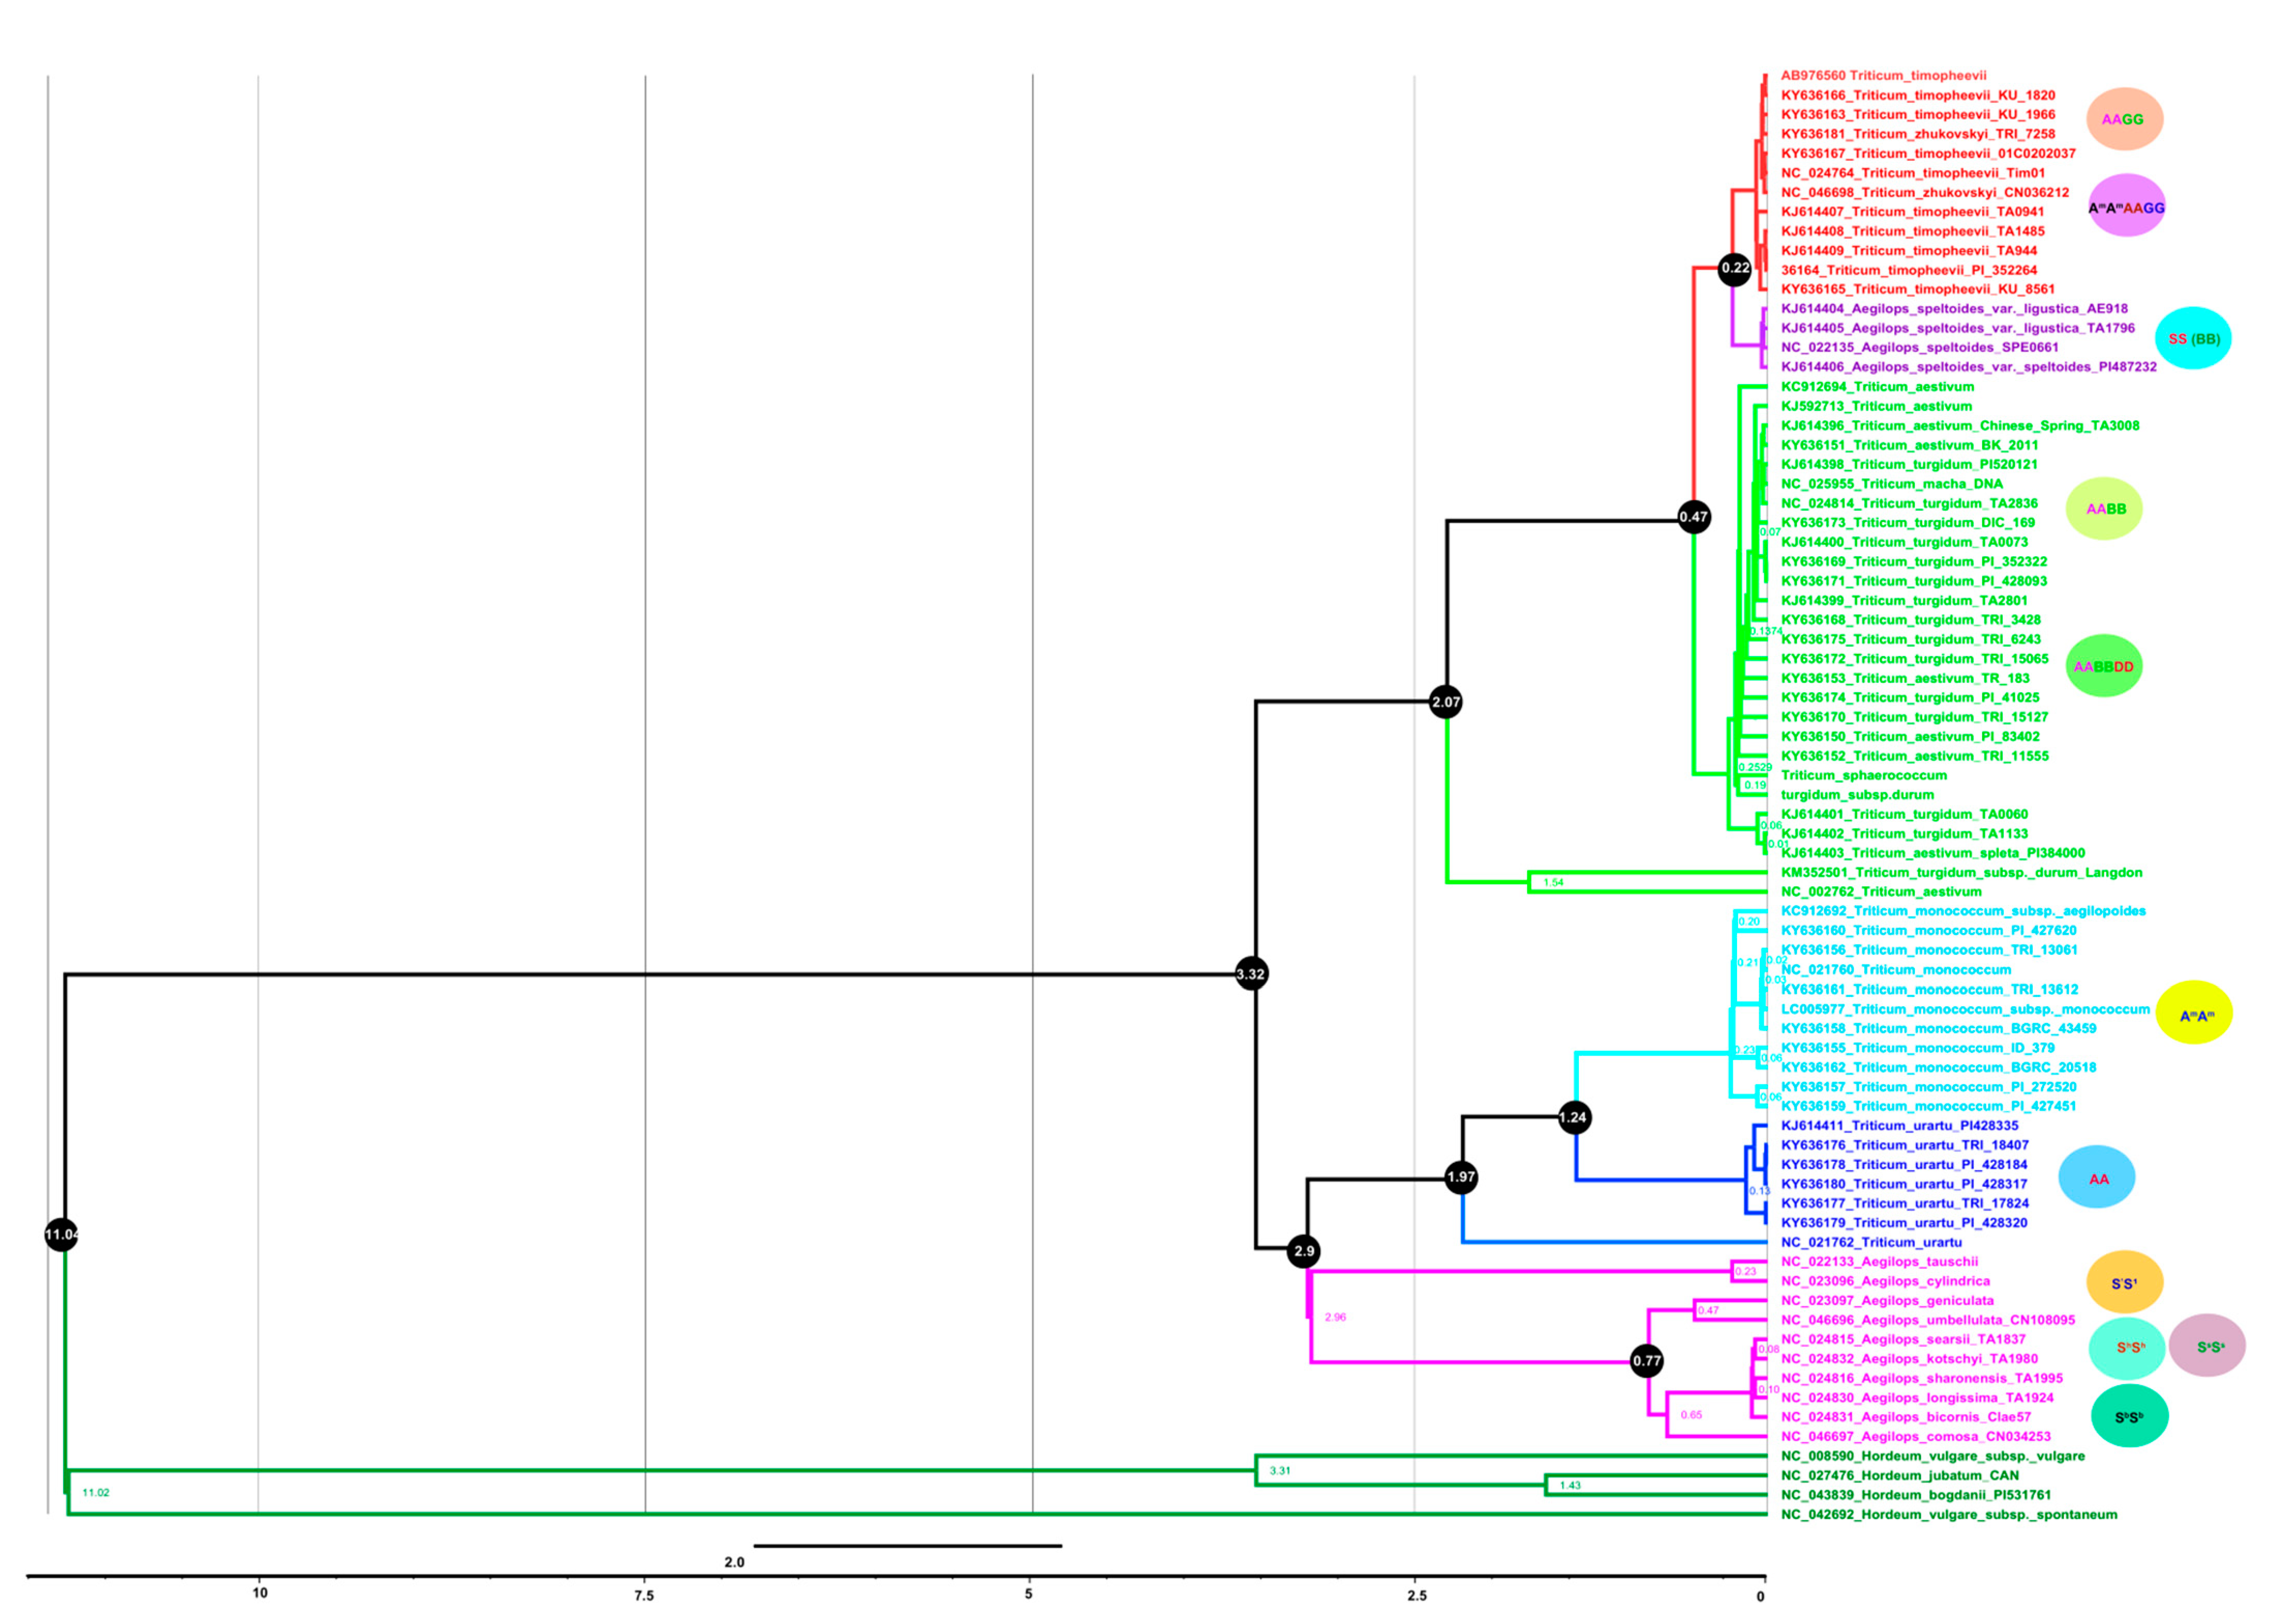
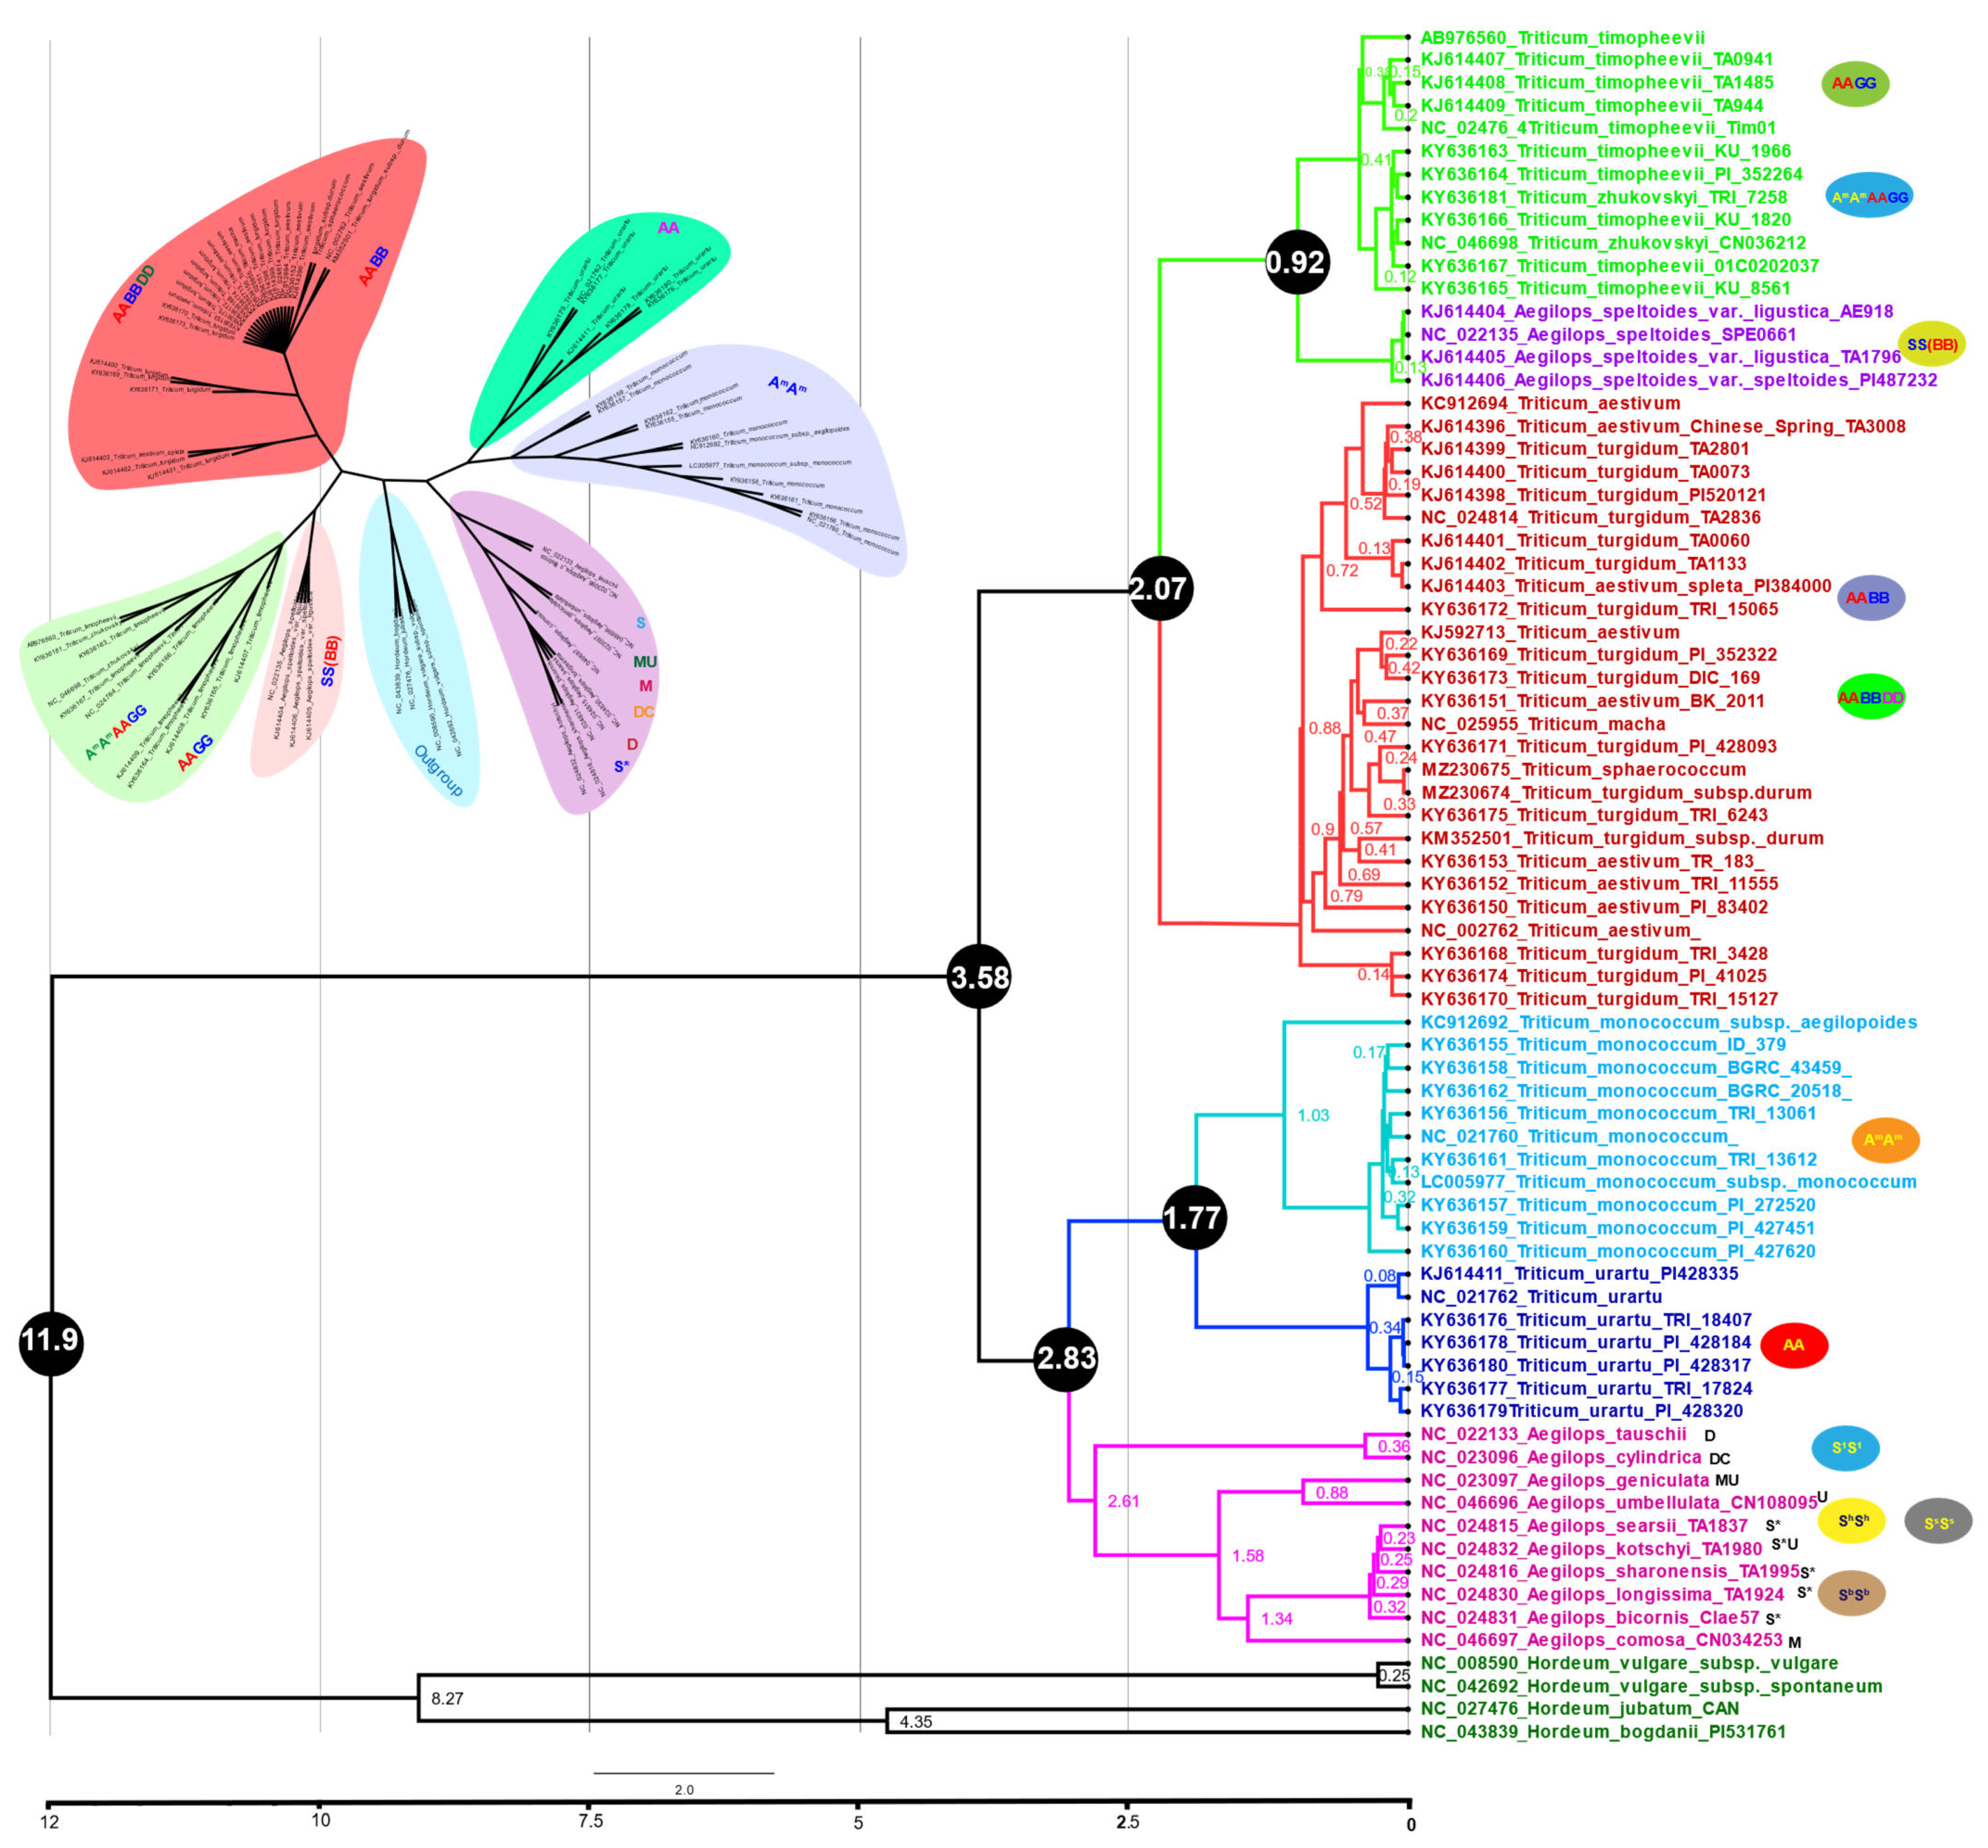
3.7. Plastome Phylogenomics and Diversification of Triticum Plastomes

We used full-length plastome sequences and 42 shared protein-coding concatenated genes among all Triticum species to infer the phylogenetic position and divergence time of both T. sphaerococcum and T. turgidum subsp. durum in relation to the other Triticum species. Phylogenetic analyses were performed using maximum likelihood (ML) and Bayesian inference methods. Interestingly, the current study provides the first molecular phylogeny of the Triticum genus based on the complete plastomes and 42 shared genes from all the Triticum species available in the NCBI database. The plastomes of barley (Hordeum species) were used as an outgroup for the Triticum/Aegilops complex. The molecular clock was calibrated using 11.6 million years ago (mya) for the divergence time between barley and wheat (Figure 5 and Figure 6). The topology of these trees is almost identical. According to our phylogenetic analysis, Sitopsis species including S1S1, SsSs, ShSh, and SbSb genomes diverged before T. urartu (AA) and T. monococcum (AA). Similarly, A. speltoides (SS) form a monophyletic clade with T. timopheevii (AAGG) and T. zhukovskyi (AmAmAAGG), as previously reported [56]. Polyploid Triticum species and A. speltoides formed a clade indicating that A. speltoides is the maternal donor of polypoloid wheat genomes (Figure 5). The precise phylogenetic relationship among the A, B, and D genomes remains a topic for debate. In current results, all hexaploidy T. aestivum species form a clade with wild tetraploid T. turgidum species based on 60 protein-coding genes. Similar results were observed from whole plastome results except for those from T. turgidum subsp. durum and T. aestivum (NC002762) that both made a separate clade (Figure 6). The divergence time of AB and ABD genomes was estimated at 0.8 to 0.4 mya based on both the complete plastomes and 42 shared genes. The sequenced plastomes of T. sphaerococcum and Triticum T. turgidum subsp. durum shared the same clade and diverged 0.19 to 0.24 mya on both complete plastomes and protein-coding genes (Figure 5 and Figure 6).

4. Discussion

In this study, we sequenced two plastomes from the Triticum genus, those of T. sphaerococcum (ABD) and T. turgidum subsp. durum (AB), and compared them to 19 complete plastomes that were accessible from GenBank to investigate the relationships within Triticum. Both the T. sphaerococcum and T. turgidum subsp. durum plastomes were found to have a quadripartite structure with plastome lengths of 134,531 and 134,015 bp, respectively. Variations were observed in plastome size and GC content compared with those of plastomes from related species, especially with AA genomes. As with previously reported plastomes, variation in plastome length may be due to factors such as loss of IR regions and absence of essential genes [57,58,59]. Diploid (AA), Tetraploid (AB, AG) and hexaploid (ABD, AGAm) Triticum species plastomes showed conserved gene content and commonly harbored an identical set of annotated unique genes. These plastomes comprised 72–89 protein-coding genes, 4–8 rRNA genes, and 32–42 tRNA genes (Table 1), which are characteristic of plastomes [60,61,62,63]. The number of genes annotated in plastomes ranged from 112 (T. macha and T. monococcum subs monococcum) to 136 (T. turgidum subsp. durum cultivar Langdon).
Gene transfer and loss commonly occur in plant plastomes [64,65]. For example, accD, ycf1, ycf2, rpl23, rpl22, infA, rps16, and ycf4 were reported partially or completely lost from the legume plastomes [66,67]. Of these, some genes, such as infA, have even b plant plastomes een lost multiple times. To the best of our knowledge, this is the first study to use such a large number of representative plastomes to assess gene loss patterns in closely related plants; here, we observed that the ycf1, ycf2, ycf15, and ycf68 genes were lost from the Triticum plastomes that have been sequenced and analyzed (Figure 2). According to our findings the T. macha has the highest number of missing protein coding genes comparing to other Triticum plastomes i.e., ycf1, ycf2, ycf 15, ycf68, petB and petD whereas the T. monococcum subs monococcum and T. turgidum subsp. durum cultivar Langdon misses one (each) protein coding gene (ycf1 and ycf15 respectively) (Figure 2). All these plastomes lacked the accD gene, which encodes for a subunit of acetyl-CoA carboxylase. Similar findings have previously been observed in plastomes [59] of Poaceae members. However, this gene has been lost or pseudogenized in several species from Campanulaceae [68,69], Geraniaceae [70], Oleaceae [71], and all Poaceae [59] including the Triticeae studied in this work. The deletion of the accD gene from chloroplast genomes and its related protein encoded by a nuclear gene in Poaceae perhaps is the first example for a non-ribosomal component [72]. In conclusion, to reduce the size of a chloroplast genome, in addition to gene transfer from the chloroplast to the nucleus, a chloroplast gene could be deleted and a nuclear gene could instead encode the related protein [59].
The remarkable feature of a plastome is the conservation of its most prominent structure and genome size [73]. To determine the contribution of repetitive DNA sequences to genome variation and evolution, we investigated their evolutionary dynamics across these closely related plastomes. The total number of repeats (including palindromic, forward, and tandem repeats) in these genomes ranged from 59 (T. monococcum) to 75 (T. aestivum (NC002762)) as shown in Figure 3. Overall, there was a positive correlation between the number of repeats and plastome size. In all plastomes, the number of tandem repeats was higher than the number of palindromic and forward repeats. However, the molecular mechanism underlying the de novo generation of novel repeated sequences in a chloroplast genome remains largely unresolved [74]. Numerous repeat numbers have previously been identified in angiosperm plastomes [52,74,75], but the mechanisms underlying the appearance of these tandem repeats remain to be elucidated. Nevertheless, plastome rearrangement, gene expansion, and gene duplication are known to be associated with such repeats [76,77].
Plastome SSR diversity is an attractive research area in plant biology because of SSR’s codominant inheritance, high reproducibility, multiallelic composition, richness, and ease of detection [78,79]. SSRs are normally small tandem mononucleotide repeats, typically found in the chloroplast genome noncoding regions, which usually exhibit intraspecific repeat number differences [80,81]. Genome-wide characterization of SSRs showed that, similar to other plastome characteristics, there was variation in the number of SSRs in these plastomes: SSR numbers ranged from 124 (T. aestivum NC002762) to 132 (T. timopheevii cultivar Tim01 and T. zhukovskyi). The T. sphaerococcum and T. turgidum subsp. durum plastomes sequenced in this study contained 128 and 127 SSRs, respectively (Figure 4). Among these SSR motifs, the most abundant repeat motifs were mononucleotides, ranging from 117 in T. aestivum (NC002762) to 126 in T. urartu cultivar PI428335, followed by trinucleotides and pentanucleotides. Using our search criterion, tetranucleotide and hexanucleotide SSRs were absent in most plastomes. Similarly, a linear relationship between SSR numbers and plastome size was detected in Triticum plastomes. A similar correlation was discovered in previous analysis of various plant whole genomes [79]. As previously reported, genome rearrangement and sequence diversity occur due to an incorrect recombination of these repeat sequences and slipped strand mispairing [82,83]. Furthermore, the occurrence of these repeats indicate that the region is a critical hotspot for the reconfiguration of the plastome genome [83]. Additionally, these repeats represent a useful source for developing genetic markers for Triticum species, which could be further applied in phylogenetic and population studies.
Comparative analysis of Triticum plastomes showed that analysis of genes with known functions shared 42 protein-coding genes. Furthermore, pairwise sequence divergence analysis shown that T. sphaerococcum exhibited the highest divergence with T. urartu. Similarly, synteny analysis showed high sequence similarities among the Triticum plastomes, especially in the protein-coding and IR regions. The psbD and atpF genes exhibited divergence in all plastomes excluding T. sphaerococcum and T. turgidum subsp. durum. Similarly, the noncoding region between the trnL-ndhJ gene of T. monococcum subsp. monococcum was significantly divergent from that of the T. turgidum subsp. durum plastomes. Similar results were observed for psbE and petL regions. Furthermore, a significant divergence was observed in all plastomes between the rpl23-ndhB regions. Moreover, the average pairwise distances among 42 shared protein-coding genes revealed that the most divergent genes were matK, ccsA, ndhH, petA, psbD, rpl14, and ycf3 in almost all species. This is in agreement with previously reported findings for the plastomes of angiosperms [33,52]. Menezes, et al. [84] concluded that divergent plastome genes are predominantly detected in the LSC regions, suggesting a more rapid evolution trend [85].
In addition to the overall conservation of gene content, the analyzed Triticum plastomes were structurally conserved and they displayed an almost uniform order of the same set of genes with slight differences at boundary junctions. The plastomes of Triticum in general are smaller (like other Poaceae members) [59] than most angiosperms due to the pseudogenization of the ycf1 and ycf2 genes, i.e., two of the longest open reading frames in angiosperms. Due to the conserved nature of these Triticum plastomes, no substantial changes in four IR junctions and gene positions across IR boundaries were identified, with only minor variations between plastomes. This is not exceptional, as a slight IR expansion/contraction has also been reported in other angiosperm plastomes [71,86,87].
Despite a plethora of molecular phylogenies, it remains a lack of understanding of the relationships among the Triticum genus [20,22,23,88,89,90,91,92]. The acceptance levels of taxa vary greatly among studies at the genus level and below [20,93,94]. One important reason for this is the complex mode of evolution within Triticeae. The majority of species are allopolyploids and many of them likely originated repeatedly with the process involving genetically different parent species [95,96,97]. Bread wheat is the most prominent polyploid and evolved via consecutive hybridizations of three diploids; thus, it combines three related genomes (A, B, and D) [11,92]. It is assumed that diploid species and monogenomic taxa are the basic units within Triticeae and that the heterogenomic polyploids form a second level of taxonomic entities [98,99]. The paternal ancestors of polyploid wheat, i.e., T. urartu, T. monococcum, and A. tauschii, have been well established based on the sequence analysis of many nuclear genes. The history of the maternal ancestors of the G genome of Timopheevi and the B genome of Emmer wheat has been more difficult to decipher based on nuclear genome sequences.
We presented phylogenetic analyses of Triticum based on complete plastomes and 42 concatenated protein-coding genes shared among these Triticum species. Our results are similar to those of previous studies and in particular the divergence of H. vulgare from wheat, which was estimated previously to have occurred approximately 8–12 mya [53,56,100] is 11.04 and 11.9 mya using complete plastomes and protein-coding genes, respectively. These values are in the range of estimates reported by [53] (approx. 7–16 mya) and [100] (8.3–11.3 mya), but more similar to the 11.4 ± 0.6 mya reported by [56]. Similarly, of particular interest to us was the precise phylogeny and dating of the age of the wheat genome donors. Our analysis indicates that the donors (or their close relatives) of the wheat genomes diverged within the past 3 million years as previously reported [101]. According to our phylogenetic analysis, Sitopsis species, including S1S1, SsSs, ShSh, and SbSb genomes, diverged before T. urartu (AA) and T. monococcum (AA) around 2.8–2.9 mya. Our estimates are in the range of previous reports [53,56], which ranged rather widely from 2 to 6 mya. Similarly, T. monococcum diverged from T. urartu about 1.7–1.9 mya. These results are more recent than the previous estimates [53,56]. Furthermore, our results showed that polyploid Triticum species and A. speltoides formed a clade indicating that A. speltoides is the maternal donor of polyploid wheat genomes and diverged ~0.2–0.9 mya based on complete plastomes and protein-coding gene trees, respectively, from T. timopheevii (AABB) and T. zhukovskyi (GG) genomes. Similar results were reported previously by various researchers [22,53,101]. The relationships within this clade support the hypothesis that two different A. speltoides lineages were involved in their formation [5,9,22,102]. As in previous studies, the direct maternal donor for T. timopheevii and T. zhukovskyi (G) were identifiable because they share the chloroplast haplotype of A. speltoides genomes. According to our results, the donor remains uncertain for T. turgidum and T. aestivum (B), indicating that either our sampling of A. speltoides was insufficient to cover the species diversity or that a now extinct donor lineage previously existed. Aegilops speltoides and the polyploid wheat species form three groups: (1) most A. speltoides accessions form a clade of their own (S), (2) they share a clade with T. timopheevii and T. zhukovskyi wheat, and (3) all accessions of T. turgidum and T. aestivum share the same haplotype (B). Additionally, the usage of entire plastomes and shared protein-coding genes also suggests that diploid Triticum species (A) diverged from D-genome taxa and the remaining Aegilops species 2.83 mya.

5. Conclusions

Decoding Triticum plastomes during the last three decades has greatly increased levels of available plastomic data and provided an improved picture of Triticum plastome evolution. The elucidated plastomes of diploid (AA), tetraploids (AB, AG) and hexaploids (ABD, AGAm) show conserved gene content. Despite significant effort to determine Triticum plastomes at the genus/species level, certain species remain poorly studied; thus, full systematic phylogenetic studies are lacking. Based on 42 shared genes and full plastomes, the tree height between H. vulgare and Triticum was found to be 11.04 and 11.9 mya, respectively. In the future, additional plastomes will be sequenced and comparatively analyzed to provide a more complete picture of Triticum plastome evolution.

Supplementary Materials

The following are available online at https://www.mdpi.com/article/10.3390/ijms23052783/s1.

Author Contributions

L., S.A. (Sajjad Asaf), A.L.K. and A.A.-H. performed the analysis, R.J., S.A. (Saleem Asif). and W.A. performed simple sequence repeats and phylogenetic analysis. A.A.-H., K.-M.K. and I.-J.L. edited and drafted the manuscript. All authors have read and agreed to the published version of the manuscript.

Funding

This research received no external funding.

Data Availability Statement

All the 75 plastomes are available at the NCBI database.

Acknowledgments

This research was supported by the Basic Science Institute (National research Facilites and Equipment center) grand funded by the Ministry of Education (2021R1A6C101A416).

Conflicts of Interest

The authors declare no conflict of interest.

References

  1. Salamini, F.; Özkan, H.; Brandolini, A.; Schäfer-Pregl, R.; Martin, W. Genetics and geography of wild cereal domestication in the near east. Nat. Rev. Genet. 2002, 3, 429–441. [Google Scholar] [CrossRef]
  2. Gill, B.; Friebe, B. Cytogenetics, Phylogeny and Evolution of Cultivated Wheats. Bread Wheat: Improvement and Production; Food and Agriculture Organization of the United Nations: Rome, Italy, 2002; pp. 71–88. [Google Scholar]
  3. Dvorak, J.; McGuire, P.E.; Cassidy, B. Apparent sources of the A genomes of wheats inferred from polymorphism in abundance and restriction fragment length of repeated nucleotide sequences. Genome 1988, 30, 680–689. [Google Scholar] [CrossRef]
  4. Kerby, K.; Kuspira, J.; Jones, B. Biochemical data bearing on the relationship between the genome of Triticum urartu and the A and B genomes of the polyploid wheats. Genome 1988, 30, 576–581. [Google Scholar] [CrossRef] [PubMed]
  5. Wang, G.-Z.; Miyashita, N.T.; Tsunewaki, K. Plasmon analyses of Triticum (wheat) and Aegilops: PCR–single-strand conformational polymorphism (PCR-SSCP) analyses of organellar DNAs. Proc. Natl. Acad. Sci. USA 1997, 94, 14570–14577. [Google Scholar] [CrossRef] [PubMed] [Green Version]
  6. Kimber, G. A reassessment of the origin of the polyploid wheats. Genetics 1974, 78, 487–492. [Google Scholar] [CrossRef]
  7. Dvořák, J.; Zhang, H.-B. Reconstruction of the phylogeny of the genus Triticum from variation in repeated nucleotide sequences. Theor. Appl. Genet. 1992, 84, 419–429. [Google Scholar] [CrossRef]
  8. Jenkins, J. Chromosome homologies in wheat and Aegilops. Am. J. Bot. 1929, 16, 238–245. [Google Scholar] [CrossRef]
  9. Haider, N. The origin of the B-genome of bread wheat (Triticum aestivum L.). Russ. J. Genet. 2013, 49, 263–274. [Google Scholar] [CrossRef]
  10. Escobar, J.S.; Scornavacca, C.; Cenci, A.; Guilhaumon, C.; Santoni, S.; Douzery, E.J.; Ranwez, V.; Glémin, S.; David, J. Multigenic phylogeny and analysis of tree incongruences in Triticeae (Poaceae). BMC Evol. Biol. 2011, 11, 181. [Google Scholar] [CrossRef] [Green Version]
  11. Marcussen, T.; Sandve, S.R.; Heier, L.; Spannagl, M.; Pfeifer, M.; Jakobsen, K.S.; Wulff, B.B.; Steuernagel, B.; Mayer, K.F.; Olsen, O.-A. Ancient hybridizations among the ancestral genomes of bread wheat. Science 2014, 345, 1250092. [Google Scholar] [CrossRef]
  12. Tsunewaki, K.; Ogihara, Y. The molecular basis of genetic diversity among cytoplasms of Triticum and Aegilops species. II. On the origin of polyploid wheat cytoplasms as suggested by chloroplast DNA restriction fragment patterns. Genetics 1983, 104, 155–171. [Google Scholar] [CrossRef] [PubMed]
  13. Tsunewaki, K. Plasmon analysis in the Triticum-Aegilops complex. Breed. Sci. 2009, 59, 455–470. [Google Scholar] [CrossRef] [Green Version]
  14. Sang, T. Utility of low-copy nuclear gene sequences in plant phylogenetics. Crit. Rev. Biochem. Mol. Biol. 2002, 37, 121–147. [Google Scholar] [CrossRef]
  15. Baenfer, G.; Moog, U.; Fiala, B.; Mohamed, M.; Weising, K.; Blattner, F.R. A chloroplast genealogy of myrmecophytic Macaranga species (Euphorbiaceae) in Southeast Asia reveals hybridization, vicariance and long-distance dispersals. Mol. Ecol. 2006, 15, 4409–4424. [Google Scholar] [CrossRef] [PubMed]
  16. Bordbar, F.; Rahiminejad, M.R.; Saeidi, H.; Blattner, F.R. Phylogeny and genetic diversity of D-genome species of Aegilops and Triticum (Triticeae, Poaceae) from Iran based on microsatellites, ITS, and trn LF. Plant Syst. Evol. 2011, 291, 117–131. [Google Scholar] [CrossRef]
  17. Petersen, G.; Seberg, O. Phylogenetic Analysis of the Triticeae (Poaceae) Based onrpoA Sequence Data. Mol. Phylogenetics Evol. 1997, 7, 217–230. [Google Scholar] [CrossRef] [PubMed]
  18. Golovnina, K.; Glushkov, S.; Blinov, A.; Mayorov, V.; Adkison, L.; Goncharov, N. Molecular phylogeny of the genus Triticum L. Plant Syst. Evol. 2007, 264, 195–216. [Google Scholar] [CrossRef]
  19. Seberg, O.; Petersen, G. Phylogeny of Triticeae (Poaceae) based on three organelle genes, two single-copy nuclear genes, and morphology. Aliso J. Syst. Evol. Bot. 2007, 23, 362–371. [Google Scholar] [CrossRef] [Green Version]
  20. Bernhardt, N.; Brassac, J.; Kilian, B.; Blattner, F.R. Dated tribe-wide whole chloroplast genome phylogeny indicates recurrent hybridizations within Triticeae. BMC Evol. Biol. 2017, 17, 141. [Google Scholar] [CrossRef] [Green Version]
  21. Ogihara, Y.; Isono, K.; Kojima, T.; Endo, A.; Hanaoka, M.; Shiina, T.; Terachi, T.; Utsugi, S.; Murata, M.; Mori, N. Chinese spring wheat (Triticum aestivum L.) chloroplast genome: Complete sequence and contig clones. Plant Mol. Biol. Report. 2000, 18, 243–253. [Google Scholar] [CrossRef]
  22. Gornicki, P.; Zhu, H.; Wang, J.; Challa, G.S.; Zhang, Z.; Gill, B.S.; Li, W. The chloroplast view of the evolution of polyploid wheat. New Phytol. 2014, 204, 704–714. [Google Scholar] [CrossRef] [PubMed]
  23. Middleton, C.P.; Senerchia, N.; Stein, N.; Akhunov, E.D.; Keller, B.; Wicker, T.; Kilian, B. Sequencing of chloroplast genomes from wheat, barley, rye and their relatives provides a detailed insight into the evolution of the Triticeae tribe. PLoS ONE 2014, 9, e85761. [Google Scholar] [CrossRef] [Green Version]
  24. Saarela, J.M.; Wysocki, W.P.; Barrett, C.F.; Soreng, R.J.; Davis, J.I.; Clark, L.G.; Kelchner, S.A.; Pires, J.C.; Edger, P.P.; Mayfield, D.R. Plastid phylogenomics of the cool-season grass subfamily: Clarification of relationships among early-diverging tribes. AoB Plants 2015, 7, plv046. [Google Scholar] [CrossRef] [PubMed] [Green Version]
  25. Zeng, Q.X.; Yuan, J.H.; Wang, L.Y.; Xu, J.Q.; Nyima, T. The complete chloroplast genome of Tibetan hulless barley. Mitochondrial DNA Part A 2017, 28, 324–325. [Google Scholar] [CrossRef] [PubMed]
  26. Gogniashvili, M.; Jinjikhadze, T.; Maisaia, I.; Akhalkatsi, M.; Kotorashvili, A.; Kotaria, N.; Beridze, T.; Dudnikov, A.J. Complete chloroplast genomes of Aegilops tauschii Coss. and Ae. cylindrica Host sheds light on plasmon D evolution. Curr. Genet. 2016, 62, 791–798. [Google Scholar] [CrossRef] [PubMed]
  27. Shizuka, T.; Mori, N.; Ozkan, H.; Ohta, S. Chloroplast DNA haplotype variation within two natural populations of wild emmer wheat (Triticum turgidum ssp. dicoccoides) in southern Turkey. Biotechnol. Biotechnol. Equip. 2015, 29, 423–430. [Google Scholar] [CrossRef] [Green Version]
  28. Gogniashvili, M.; Naskidashvili, P.; Bedoshvili, D.; Kotorashvili, A.; Kotaria, N.; Beridze, T. Complete chloroplast DNA sequences of Zanduri wheat (Triticum spp.). Genet. Resour. Crop Evol. 2015, 62, 1269–1277. [Google Scholar] [CrossRef]
  29. Catalán, P.; Kellogg, E.A.; Olmstead, R.G. Phylogeny of Poaceae Subfamily Pooideae Based on ChloroplastndhF Gene Sequences. Mol. Phylogenetics Evol. 1997, 8, 150–166. [Google Scholar] [CrossRef]
  30. Jansen, R.K.; Kaittanis, C.; Saski, C.; Lee, S.-B.; Tomkins, J.; Alverson, A.J.; Daniell, H. Phylogenetic analyses of Vitis (Vitaceae) based on complete chloroplast genome sequences: Effects of taxon sampling and phylogenetic methods on resolving relationships among rosids. BMC Evol. Biol. 2006, 6, 32. [Google Scholar] [CrossRef] [Green Version]
  31. Ogihara, Y.; Isono, K.; Kojima, T.; Endo, A.; Hanaoka, M.; Shiina, T.; Terachi, T.; Utsugi, S.; Murata, M.; Mori, N. Structural features of a wheat plastome as revealed by complete sequencing of chloroplast DNA. Mol. Genet. Genom. 2002, 266, 740–746. [Google Scholar] [CrossRef]
  32. Saski, C.; Lee, S.-B.; Fjellheim, S.; Guda, C.; Jansen, R.K.; Luo, H.; Tomkins, J.; Rognli, O.A.; Daniell, H.; Clarke, J.L. Complete chloroplast genome sequences of Hordeum vulgare, Sorghum bicolor and Agrostis stolonifera, and comparative analyses with other grass genomes. Theor. Appl. Genet. 2007, 115, 571–590. [Google Scholar] [CrossRef] [PubMed] [Green Version]
  33. Asaf, S.; Waqas, M.; Khan, A.L.; Khan, M.A.; Kang, S.-M.; Imran, Q.M.; Shahzad, R.; Bilal, S.; Yun, B.-W.; Lee, I.-J. The complete chloroplast genome of wild rice (Oryza minuta) and its comparison to related species. Front. Plant Sci. 2017, 8, 304. [Google Scholar] [CrossRef] [Green Version]
  34. Shi, C.; Hu, N.; Huang, H.; Gao, J.; Zhao, Y.-J.; Gao, L.-Z. An improved chloroplast DNA extraction procedure for whole plastid genome sequencing. PLoS ONE 2012, 7, e31468. [Google Scholar] [CrossRef] [PubMed]
  35. Jin, J.-J.; Yu, W.-B.; Yang, J.-B.; Song, Y.; Yi, T.-S.; Li, D.-Z. GetOrganelle: A simple and fast pipeline for de novo assembly of a complete circular chloroplast genome using genome skimming data. bioRxiv 2018, 4, 256479. [Google Scholar]
  36. Liu, C.; Shi, L.; Zhu, Y.; Chen, H.; Zhang, J.; Lin, X.; Guan, X. CpGAVAS, an integrated web server for the annotation, visualization, analysis, and GenBank submission of completely sequenced chloroplast genome sequences. BMC Genom. 2012, 13, 715. [Google Scholar] [CrossRef] [Green Version]
  37. Wyman, S.K.; Jansen, R.K.; Boore, J.L. Automatic annotation of organellar genomes with DOGMA. Bioinformatics 2004, 20, 3252–3255. [Google Scholar] [CrossRef] [Green Version]
  38. Lowe, T.M.; Eddy, S.R. tRNAscan-SE: A program for improved detection of transfer RNA genes in genomic sequence. Nucleic Acids Res. 1997, 25, 955–964. [Google Scholar] [CrossRef]
  39. Kearse, M.; Moir, R.; Wilson, A.; Stones-Havas, S.; Cheung, M.; Sturrock, S.; Buxton, S.; Cooper, A.; Markowitz, S.; Duran, C. Geneious Basic: An integrated and extendable desktop software platform for the organization and analysis of sequence data. Bioinformatics 2012, 28, 1647–1649. [Google Scholar] [CrossRef]
  40. Wickham, H. Ggplot2: Elegant Graphics for Data Analysis (Use R!); Springer: New York, NY, USA, 2009; Volume 10, pp. 970–978. [Google Scholar]
  41. Kurtz, S.; Choudhuri, J.V.; Ohlebusch, E.; Schleiermacher, C.; Stoye, J.; Giegerich, R. REPuter: The manifold applications of repeat analysis on a genomic scale. Nucleic Acids Res. 2001, 29, 4633–4642. [Google Scholar] [CrossRef] [Green Version]
  42. Benson, G. Tandem repeats finder: A program to analyze DNA sequences. Nucleic Acids Res. 1999, 27, 573–580. [Google Scholar] [CrossRef] [Green Version]
  43. Beier, S.; Thiel, T.; Münch, T.; Scholz, U.; Mascher, M. MISA-web: A web server for microsatellite prediction. Bioinformatics 2017, 33, 2583–2585. [Google Scholar] [CrossRef] [PubMed] [Green Version]
  44. Frazer, K.A.; Pachter, L.; Poliakov, A.; Rubin, E.M.; Dubchak, I. VISTA: Computational tools for comparative genomics. Nucleic Acids Res. 2004, 32, W273–W279. [Google Scholar] [CrossRef] [PubMed]
  45. Katoh, K.; Standley, D.M. MAFFT multiple sequence alignment software version 7: Improvements in performance and usability. Mol. Biol. Evol. 2013, 30, 772–780. [Google Scholar] [CrossRef] [PubMed] [Green Version]
  46. Kimura, M. A simple method for estimating evolutionary rates of base substitutions through comparative studies of nucleotide sequences. J. Mol. Evol. 1980, 16, 111–120. [Google Scholar] [CrossRef]
  47. Stamatakis, A.; Hoover, P.; Rougemont, J. A rapid bootstrap algorithm for the RAxML web servers. Syst. Biol. 2008, 57, 758–771. [Google Scholar] [CrossRef]
  48. Crisp, M.D.; Cook, L.G. Cenozoic extinctions account for the low diversity of extant gymnosperms compared with angiosperms. New Phytol. 2011, 192, 997–1009. [Google Scholar] [CrossRef]
  49. Rambaut, A. FigTree v1. 3.1. 2009. Available online: http://tree.bio.ed.ac.uk/software/figtree/ (accessed on 25 February 2022).
  50. Letunic, I.; Bork, P. Interactive Tree Of Life (iTOL) v4: Recent updates and new developments. Nucleic Acids Res. 2019, 47, W256–W259. [Google Scholar] [CrossRef] [Green Version]
  51. Bouckaert, R.; Heled, J.; Kühnert, D.; Vaughan, T.; Wu, C.-H.; Xie, D.; Suchard, M.A.; Rambaut, A.; Drummond, A.J. BEAST 2: A software platform for Bayesian evolutionary analysis. PLoS Comput. Biol. 2014, 10, e1003537. [Google Scholar] [CrossRef] [Green Version]
  52. Asaf, S.; Khan, A.L.; Khan, A.; Khan, G.; Lee, I.-J.; Al-Harrasi, A. Expanded inverted repeat region with large scale inversion in the first complete plastid genome sequence of Plantago ovata. Sci. Rep. 2020, 10, 3881. [Google Scholar] [CrossRef] [Green Version]
  53. Chalupska, D.; Lee, H.; Faris, J.; Evrard, A.; Chalhoub, B.; Haselkorn, R.; Gornicki, P. Acc homoeoloci and the evolution of wheat genomes. Proc. Natl. Acad. Sci. USA 2008, 105, 9691–9696. [Google Scholar] [CrossRef] [Green Version]
  54. Won, H.; Renner, S.S. Dating dispersal and radiation in the gymnosperm Gnetum (Gnetales)—Clock calibration when outgroup relationships are uncertain. Syst. Biol. 2006, 55, 610–622. [Google Scholar] [CrossRef] [PubMed] [Green Version]
  55. Rambaut, A.; Drummond, A.J.; Xie, D.; Baele, G.; Suchard, M.A. Posterior summarization in Bayesian phylogenetics using Tracer 1.7. Syst. Biol. 2018, 67, 901. [Google Scholar] [CrossRef] [PubMed] [Green Version]
  56. Huang, S.; Sirikhachornkit, A.; Su, X.; Faris, J.; Gill, B.; Haselkorn, R.; Gornicki, P. Genes encoding plastid acetyl-CoA carboxylase and 3-phosphoglycerate kinase of the Triticum/Aegilops complex and the evolutionary history of polyploid wheat. Proc. Natl. Acad. Sci. USA 2002, 99, 8133–8138. [Google Scholar] [CrossRef] [Green Version]
  57. Wolfe, K.H.; Morden, C.W.; Palmer, J.D. Function and evolution of a minimal plastid genome from a nonphotosynthetic parasitic plant. Proc. Natl. Acad. Sci. USA 1992, 89, 10648–10652. [Google Scholar] [CrossRef] [PubMed] [Green Version]
  58. Qu, X.-J.; Fan, S.-J.; Wicke, S.; Yi, T.-S. Plastome reduction in the only parasitic gymnosperm Parasitaxus is due to losses of photosynthesis but not housekeeping genes and apparently involves the secondary gain of a large inverted repeat. Genome Biol. Evol. 2019, 11, 2789–2796. [Google Scholar] [CrossRef]
  59. Huang, Y.-Y.; Cho, S.-T.; Haryono, M.; Kuo, C.-H. Complete chloroplast genome sequence of common bermudagrass (Cynodon dactylon (L.) Pers.) and comparative analysis within the family Poaceae. PLoS ONE 2017, 12, e0179055. [Google Scholar]
  60. Khan, A.L.; Al-Harrasi, A.; Asaf, S.; Park, C.E.; Park, G.-S.; Khan, A.R.; Lee, I.-J.; Al-Rawahi, A.; Shin, J.-H. The first chloroplast genome sequence of Boswellia sacra, a resin-producing plant in Oman. PLoS ONE 2017, 12, e0169794. [Google Scholar] [CrossRef] [Green Version]
  61. Khan, A.L.; Asaf, S.; Al-Rawahi, A.; Al-Harrasi, A. Decoding first complete chloroplast genome of toothbrush tree (Salvadora persica L.): Insight into genome evolution, sequence divergence and phylogenetic relationship within Brassicales. BMC Genom. 2021, 22, 312. [Google Scholar] [CrossRef]
  62. Nie, X.; Lv, S.; Zhang, Y.; Du, X.; Wang, L.; Biradar, S.S.; Tan, X.; Wan, F.; Weining, S. Complete chloroplast genome sequence of a major invasive species, crofton weed (Ageratina adenophora). PLoS ONE 2012, 7, e36869. [Google Scholar] [CrossRef] [Green Version]
  63. Raubeson, L.A.; Peery, R.; Chumley, T.W.; Dziubek, C.; Fourcade, H.M.; Boore, J.L.; Jansen, R.K. Comparative chloroplast genomics: Analyses including new sequences from the angiosperms Nuphar advena and Ranunculus macranthus. BMC Genom. 2007, 8, 174. [Google Scholar] [CrossRef] [Green Version]
  64. Frailey, D.C.; Chaluvadi, S.R.; Vaughn, J.N.; Coatney, C.G.; Bennetzen, J.L. Gene loss and genome rearrangement in the plastids of five Hemiparasites in the family Orobanchaceae. BMC Plant Biol. 2018, 18, 30. [Google Scholar] [CrossRef] [PubMed] [Green Version]
  65. Oyebanji, O.; Zhang, R.; Chen, S.-Y.; Yi, T.-S. Corrigendum: New Insights into the Plastome Evolution of the Millettioid/Phaseoloid Clade (Papilionoideae, Leguminosae). Front. Plant Sci. 2021, 12, 652483. [Google Scholar] [CrossRef] [PubMed]
  66. Millen, R.S.; Olmstead, R.G.; Adams, K.L.; Palmer, J.D.; Lao, N.T.; Heggie, L.; Kavanagh, T.A.; Hibberd, J.M.; Gray, J.C.; Morden, C.W. Many parallel losses of infA from chloroplast DNA during angiosperm evolution with multiple independent transfers to the nucleus. Plant Cell 2001, 13, 645–658. [Google Scholar] [CrossRef] [PubMed] [Green Version]
  67. Magee, A.M.; Aspinall, S.; Rice, D.W.; Cusack, B.P.; Sémon, M.; Perry, A.S.; Stefanović, S.; Milbourne, D.; Barth, S.; Palmer, J.D. Localized hypermutation and associated gene losses in legume chloroplast genomes. Genome Res. 2010, 20, 1700–1710. [Google Scholar] [CrossRef] [PubMed] [Green Version]
  68. Haberle, R.C.; Fourcade, H.M.; Boore, J.L.; Jansen, R.K. Extensive rearrangements in the chloroplast genome of Trachelium caeruleum are associated with repeats and tRNA genes. J. Mol. Evol. 2008, 66, 350–361. [Google Scholar] [CrossRef] [PubMed]
  69. Cheon, K.-S.; Kim, K.-A.; Jang, S.-K.; Yoo, K.-O. Complete chloroplast genome sequence of Campanula takesimana (Campanulaceae), an endemic to Korea. Mitochondrial DNA Part A 2016, 27, 2169–2171. [Google Scholar]
  70. Blazier, J.C.; Guisinger, M.M.; Jansen, R.K. Recent loss of plastid-encoded ndh genes within Erodium (Geraniaceae). Plant Mol. Biol. 2011, 76, 263–272. [Google Scholar] [CrossRef]
  71. Lee, H.-L.; Jansen, R.K.; Chumley, T.W.; Kim, K.-J. Gene relocations within chloroplast genomes of Jasminum and Menodora (Oleaceae) are due to multiple, overlapping inversions. Mol. Biol. Evol. 2007, 24, 1161–1180. [Google Scholar] [CrossRef] [Green Version]
  72. Konishi, T.; Shinohara, K.; Yamada, K.; Sasaki, Y. Acetyl-CoA carboxylase in higher plants: Most plants other than gramineae have both the prokaryotic and the eukaryotic forms of this enzyme. Plant Cell Physiol. 1996, 37, 117–122. [Google Scholar] [CrossRef] [Green Version]
  73. Palmer, J.D.; Nugent, J.M.; Herbon, L.A. Unusual structure of geranium chloroplast DNA: A triple-sized inverted repeat, extensive gene duplications, multiple inversions, and two repeat families. Proc. Natl. Acad. Sci. USA 1987, 84, 769–773. [Google Scholar] [CrossRef] [Green Version]
  74. Gao, L.-Z.; Liu, Y.-L.; Zhang, D.; Li, W.; Gao, J.; Liu, Y.; Li, K.; Shi, C.; Zhao, Y.; Zhao, Y.-J. Evolution of Oryza chloroplast genomes promoted adaptation to diverse ecological habitats. Commun. Biol. 2019, 2, 278. [Google Scholar] [CrossRef] [PubMed] [Green Version]
  75. Khan, A.; Asaf, S.; Khan, A.L.; Al-Harrasi, A.; Al-Sudairy, O.; AbdulKareem, N.M.; Khan, A.; Shehzad, T.; Alsaady, N.; Al-Lawati, A. First complete chloroplast genomics and comparative phylogenetic analysis of Commiphora gileadensis and C. foliacea: Myrrh producing trees. PLoS ONE 2019, 14, e0208511. [Google Scholar]
  76. Hirao, T.; Watanabe, A.; Kurita, M.; Kondo, T.; Takata, K. Complete nucleotide sequence of the Cryptomeria japonica D. Don. chloroplast genome and comparative chloroplast genomics: Diversified genomic structure of coniferous species. BMC Plant Biol. 2008, 8, 70. [Google Scholar] [CrossRef] [PubMed] [Green Version]
  77. Yi, X.; Gao, L.; Wang, B.; Su, Y.-J.; Wang, T. The complete chloroplast genome sequence of Cephalotaxus oliveri (Cephalotaxaceae): Evolutionary comparison of Cephalotaxus chloroplast DNAs and insights into the loss of inverted repeat copies in gymnosperms. Genome Biol. Evol. 2013, 5, 688–698. [Google Scholar] [CrossRef] [PubMed] [Green Version]
  78. Powell, W.; Machray, G.C.; Provan, J. Polymorphism revealed by simple sequence repeats. Trends Plant Sci. 1996, 1, 215–222. [Google Scholar] [CrossRef]
  79. Ranade, S.S.; Lin, Y.-C.; Zuccolo, A.; Van de Peer, Y.; del Rosario García-Gil, M. Comparative in silico analysis of EST-SSRs in angiosperm and gymnosperm tree genera. BMC Plant Biol. 2014, 14, 220. [Google Scholar] [CrossRef] [Green Version]
  80. Provan, J.; Powell, W.; Hollingsworth, P.M. Chloroplast microsatellites: New tools for studies in plant ecology and evolution. Trends Ecol. Evol. 2001, 16, 142–147. [Google Scholar] [CrossRef]
  81. Jakobsson, M.; Säll, T.; Lind-Halldén, C.; Halldén, C. Evolution of chloroplast mononucleotide microsatellites in Arabidopsis thaliana. Theor. Appl. Genet. 2007, 114, 223. [Google Scholar] [CrossRef]
  82. Timme, R.E.; Kuehl, J.V.; Boore, J.L.; Jansen, R.K. A comparative analysis of the Lactuca and Helianthus (Asteraceae) plastid genomes: Identification of divergent regions and categorization of shared repeats. Am. J. Bot. 2007, 94, 302–312. [Google Scholar] [CrossRef]
  83. Gao, L.; Yi, X.; Yang, Y.-X.; Su, Y.-J.; Wang, T. Complete chloroplast genome sequence of a tree fern Alsophila spinulosa: Insights into evolutionary changes in fern chloroplast genomes. BMC Evol. Biol. 2009, 9, 130. [Google Scholar] [CrossRef] [Green Version]
  84. Menezes, A.P.; Resende-Moreira, L.C.; Buzatti, R.S.; Nazareno, A.G.; Carlsen, M.; Lobo, F.P.; Kalapothakis, E.; Lovato, M.B. Chloroplast genomes of Byrsonima species (Malpighiaceae): Comparative analysis and screening of high divergence sequences. Sci. Rep. 2018, 8, 2210. [Google Scholar] [CrossRef] [PubMed] [Green Version]
  85. Khakhlova, O.; Bock, R. Elimination of deleterious mutations in plastid genomes by gene conversion. Plant J. 2006, 46, 85–94. [Google Scholar] [CrossRef]
  86. Yue, F.; Cui, L.; Claude, W.d.; Moret, B.M.; Tang, J. Gene rearrangement analysis and ancestral order inference from chloroplast genomes with inverted repeat. BMC Genom. 2008, 9, S25. [Google Scholar] [CrossRef] [Green Version]
  87. Asaf, S.; Khan, A.L.; Khan, A.R.; Waqas, M.; Kang, S.-M.; Khan, M.A.; Lee, S.-M.; Lee, I.-J. Complete chloroplast genome of Nicotiana otophora and its comparison with related species. Front. Plant Sci. 2016, 7, 843. [Google Scholar] [CrossRef] [PubMed] [Green Version]
  88. Hsiao, C.; Chatterton, N.; Asay, K.; Jensen, K. Phylogenetic relationships of the monogenomic species of the wheat tribe, Triticeae (Poaceae), inferred from nuclear rDNA (internal transcribed spacer) sequences. Genome 1995, 38, 211–223. [Google Scholar] [CrossRef] [PubMed]
  89. Kellogg, E.A.; Appels, R.; Mason-Gamer, R.J. When genes tell different stories: The diploid genera of Triticeae (Gramineae). Syst. Bot. 1996, 321–347. [Google Scholar] [CrossRef]
  90. De Bustos, A.; Jouve, N. Phylogenetic relationships of the genus Secale based on the characterisation of rDNA ITS sequences. Plant Syst. Evol. 2002, 235, 147–154. [Google Scholar] [CrossRef]
  91. Mason-Gamer, R.J.; Orme, N.L.; Anderson, C.M. Phylogenetic analysis of North American Elymus and the monogenomic Triticeae (Poaceae) using three chloroplast DNA data sets. Genome 2002, 45, 991–1002. [Google Scholar] [CrossRef] [Green Version]
  92. Petersen, G.; Seberg, O.; Yde, M.; Berthelsen, K. Phylogenetic relationships of Triticum and Aegilops and evidence for the origin of the A, B, and D genomes of common wheat (Triticum aestivum). Mol. Phylogenetics Evol. 2006, 39, 70–82. [Google Scholar] [CrossRef]
  93. Bernhardt, N. Taxonomic treatments of Triticeae and the wheat genus Triticum. In Alien Introgression in Wheat; Molnár-Láng, M., Ceoloni, C., Doležel, J., Eds.; Springer: Cham, Switzerland, 2015; pp. 1–19. [Google Scholar]
  94. Kellogg, E.A. Flowering plants. In Monocots; Springer International Publishing: Cham, Switzerland, 2015; Volume 10, pp. 973–978. [Google Scholar]
  95. Soltis, D.E.; Soltis, P.S. Polyploidy: Recurrent formation and genome evolution. Trends Ecol. Evol. 1999, 14, 348–352. [Google Scholar] [CrossRef]
  96. Jakob, S.S.; Blattner, F.R. Two extinct diploid progenitors were involved in allopolyploid formation in the Hordeum murinum (Poaceae: Triticeae) taxon complex. Mol. Phylogenetics Evol. 2010, 55, 650–659. [Google Scholar] [CrossRef] [PubMed]
  97. Brassac, J.; Blattner, F.R. Species-level phylogeny and polyploid relationships in Hordeum (Poaceae) inferred by next-generation sequencing and in silico cloning of multiple nuclear loci. Syst. Biol. 2015, 64, 792–808. [Google Scholar] [CrossRef] [Green Version]
  98. Kellogg, E.A. Comments on genomic genera in the Triticeae (Poaceae). Am. J. Bot. 1989, 76, 796–805. [Google Scholar] [CrossRef]
  99. Seberg, O.; Frederiksen, S. A phylogenetic analysis of the monogenomic Triticeae (Poaceae) based on morphology. Bot. J. Linn. Soc. 2001, 136, 75–97. [Google Scholar] [CrossRef]
  100. Dvorak, J.; Akhunov, E.D. Tempos of gene locus deletions and duplications and their relationship to recombination rate during diploid and polyploid evolution in the Aegilops-Triticum alliance. Genetics 2005, 171, 323–332. [Google Scholar] [CrossRef] [PubMed] [Green Version]
  101. El Baidouri, M.; Murat, F.; Veyssiere, M.; Molinier, M.; Flores, R.; Burlot, L.; Alaux, M.; Quesneville, H.; Pont, C.; Salse, J. Reconciling the evolutionary origin of bread wheat (Triticum aestivum). New Phytol. 2017, 213, 1477–1486. [Google Scholar] [CrossRef] [PubMed] [Green Version]
  102. Kilian, B.; Mammen, K.; Millet, E.; Sharma, R.; Graner, A.; Salamini, F.; Hammer, K.; Özkan, H. Aegilops. In Wild Crop Relatives: Genomic and Breeding Resources; Kole, C., Ed.; Springer: Berlin/Heidelberg, Germany, 2011; pp. 1–76. [Google Scholar]
Figure 1. Genome map of the T. sphaerococcum and T. turgidum subsp. durum plastomes. The extent of the IR regions is represented by dark colors, which divide the cp genome into large (LSC) and small (SSC) single copy regions. Genes drawn inside the circle are transcribed clockwise, whereas those outside of the circle are transcribed counter-clockwise. Genes belonging to different functional groups are color coded. The light green in the inner circle corresponds to the GC content, whereas the dark green corresponds to the AT content.
Ijms 23 02783 g001
Figure 2. Summary of genes lost across Triticum plastomes. Blue color shows the missing genes, whereas the red color shows the genes duplicated in plastomes.
Ijms 23 02783 g002
Figure 3. Analysis of repeated sequences in the 21 Triticum plastomes. (A) Total number of three-repeat types in all plastomes. (B) Number of palindromic repeats by length. (C) Number of forward repeats by length. (D) Number of tandem repeats by length. (E) Pair plot showing the distribution of repeats in Triticum species. (F) Correlation among different characteristics of Triticum plastomes.
Ijms 23 02783 g003
Figure 4. Analysis of simple sequence repeats (SSRs) in the 21 Triticum plastomes. (A) SSR numbers detected in the 25 species whole plastomes. (B) Frequency of identified SSRs in Triticum the small single copy (SSC) regions. (C) Frequency of identified SSRs in inverted repeat (IR) region. (D) Frequency of identified SSRs in the long single copy (LSC) region. (E) For T. turgidum subsp. turgidum, pairwise sequence distance of 42 protein-coding genes shared with the plastomes of related species.
Ijms 23 02783 g004
Figure 5. Maximum credible molecular chronogram (time tree) of Triticum from BEAST based on whole plastomes, with branch lengths proportional to time and lognormal fossil-based calibrations. The GTR + G substitution model was used with four rate categories and a Yule tree speciation model was applied with a lognormal relaxed clock model in BEAST. Different color branches represent Triticum species based on their genomes. The diploid, tetraploid, and hexaploid genomes are shown at the right side of the tree. The 95% highest posterior density credibility intervals are shown for the node ages in black circles (mya). Numbers indicate date estimates for different nodes. A geological time scale is shown at the bottom of the figure.
Ijms 23 02783 g005
Figure 6. (A) Maximum likelihood tree for Triticum plastome sequences using 1000 bootstrap repetitions with four outgroup Hordeum species: Hordeum vulgare subsp. vulgare, Hordeum vulgare subsp. spontaneum, Hordeum jubatum, and Hordeum bogdani. Different colors represent Triticum species based on their genome types. (B) Divergence time estimates of Triticeae species based on 42 protein-coding shared genes from Triticeae. The GTR + G substitution model was used with four rate categories and a Yule tree speciation model was applied with a lognormal relaxed clock model in BEAST. Different color branches represent Triticum species based on their genomes. The diploid, tetraploid, and hexaploid genomes are shown at the right side of the tree. The 95% highest posterior density credibility intervals are shown for the node ages in black circles (mya). Numbers indicate date estimates for different nodes. A geological time scale is shown at the bottom of the figure.
Ijms 23 02783 g006
Table 1. Summary of the genome features of complete Triticum plastomes.
Size (bp)GC (%)LSC (bp) SSC (bp) IR (bp) PCD (bp)tRNA (bp) rRNA (bp) Gene (n)PCD (n)tRNA (n)Accesion No.
T. sphaerococcum134,53138.380,34212,79120,69959,538300491921318439MZ230675
T. turgidum subsp. durum134,01538.379,81712,78820,70159,538300491921318439MZ230674
T. aestivum (NC_002762)134,54538.380,34812,79020,70359,946326491911338342NC002762
T. aestivum spleta PI384000135,91938.356,29613,14421,54158,701246991921238233KJ614403
T. aestivum (KJ592713)133,87338.356,22812,79120,57359,664294391921318439KJ592713
T. aestivum cultivar Chinese Spring TA3008135,83538.356,25412,79221,54158,683246991921238233KJ614396
T. macha135,89938.356,29812,79121,52254,723248091901127232NC_025955
T. monococcum subsp. monococcum136,88638.356,49212,80621,54754,723248091921127232LC005977
T. timopheevii cultivar Tim01136,15738.356,55012,79521,55358,686246991921238233NC024764
T. timopheevii cultivar TA0941136,07438.356,47412,78921,55358,686246991921238233KJ614407
T. timopheevii cultivar TA944136,12438.356,52312,78921,55358,686246991921238233KJ614409
T. timopheevii cultivar TA1485136,11938.356,51812,78921,55358,686246991921238233KJ614408
T. turgidum cultivar TA0060135,92638.356,28412,79221,54158,701246991921238233KJ614401
T. turgidum cultivar TA0073135,86538.356,26612,79221,54158,683246991921238233KJ614400
T. turgidum cultivar TA1133 135,88938.356,28712,79321,54158,701246991921238233KJ614402
T. turgidum cultivar TA2801135,83538.356,25412,79221,54185,683246991921238233KJ614399
T. turgidum cultivar TA2836135,83538.356,25412,79221,54158,683246991921238233NC_024814
T. turgidum cultivar PI520121135,83638.356,25512,79221,54158,683246991921238233KJ614398
T. turgidum subsp. durum cultivar Langdon135,94838.356,29315,99217,06661,746291391921368939KM352501
T. urartu cultivar PI428335136,86538.356,45412,82421,54758,683246991921238233KJ614411
T. zhukovskyi isolate CN036212136,02838.380,25712,79021,49559,208287190611288238NC_046698
Table 2. Gene composition in T. sphaerococcum and T. turgidum subsp. durum plastomes.
Category of GenesGroup of GenesName of Genes
Genes for photosynthesisSubunits of ATP synthaseatpA, atpB, atpE, atpF, atpH, atpI
Subunits of photosystem IIpsbA, psbB, psbC, psbD, psbE, psbF, psbI, psbJ, psbK, psbL, psbM, psbN, psbT, psbZ, ycf3
Subunits of NADH-dehydrogenasendhA, ndhB*, ndhC, ndhD, ndhE, ndhF, ndhG, ndhH, ndhI, ndhJ, ndhK
Subunits of cytochrome b/f complexpetA, petB, petD, petG, petL, petN
Subunits of photosystem IpsaA, psaB, psaC, psaI, psaJ
Subunit of rubiscorbcL
Self-replicationLarge subunit of ribosomerpl14, rpl16, rpl2*, rpl20, rpl22, rpl23*, rpl32, rpl33, rpl36
DNA dependent RNA polymeraserpoA, rpoB, rpoC1, rpoC2
Small subunit of ribosomerps11, rps12*, rps14, rps15*, rps16, rps18, rps19*, rps2, rps3, rps3, rps4, rps7*, rps8
Other genesc-type cytochrom synthesis geneccsA
Envelop membrane proteincemA
ProteaseclpP
Translational initiation factorinfA
MaturasematK
UnknownConserved open reading framesycf4
* represent duplicated genes.
Table 3. The genes with introns in the T. sphaerococcum and T. turgidum subsp. durum plastomes and the length of exons and introns.
GeneStrandExonIIntronIExonIIIntronIIExonIII
T.ST.TT.ST.TT.ST.TT.ST.TT.ST.T
trnK-UUU3838248624903636
rps164040843845218218
trnS-CGA31316586586262
atpF+145145825825407407
ycf3124124756756230230731731159159
rps12+114114 2232235405403232
trnL-UAA+36365885885151
trnV-UAC38385815815353
petB+66748748642642
petD+88749749475475
rpl169910431043402402
rpl2 *385388663663431431
ndhB *775775712712758758
trnT-CGU+32327877875959
trnA-UGC+37378058053636
ndhA55055010361036539539
trnA-UGC37378058053636
trnT-CGU32327877875959
* Represent duplicated genes. T. sphaerococcum = (T.S), T. turgidum subsp. durum = (T.T).
Publisher’s Note: MDPI stays neutral with regard to jurisdictional claims in published maps and institutional affiliations.

