
Genome-Wide Identification and Functions against Tomato Spotted Wilt Tospovirus of PR-10 in Solanum lycopersicum

 ,
, 
 ,
,  ,
,
Abstract
:1. Introduction
2. Results
2.1. Genome-Wide Identification and Analysis of Solanum Lycopersicum PR-10 Genes
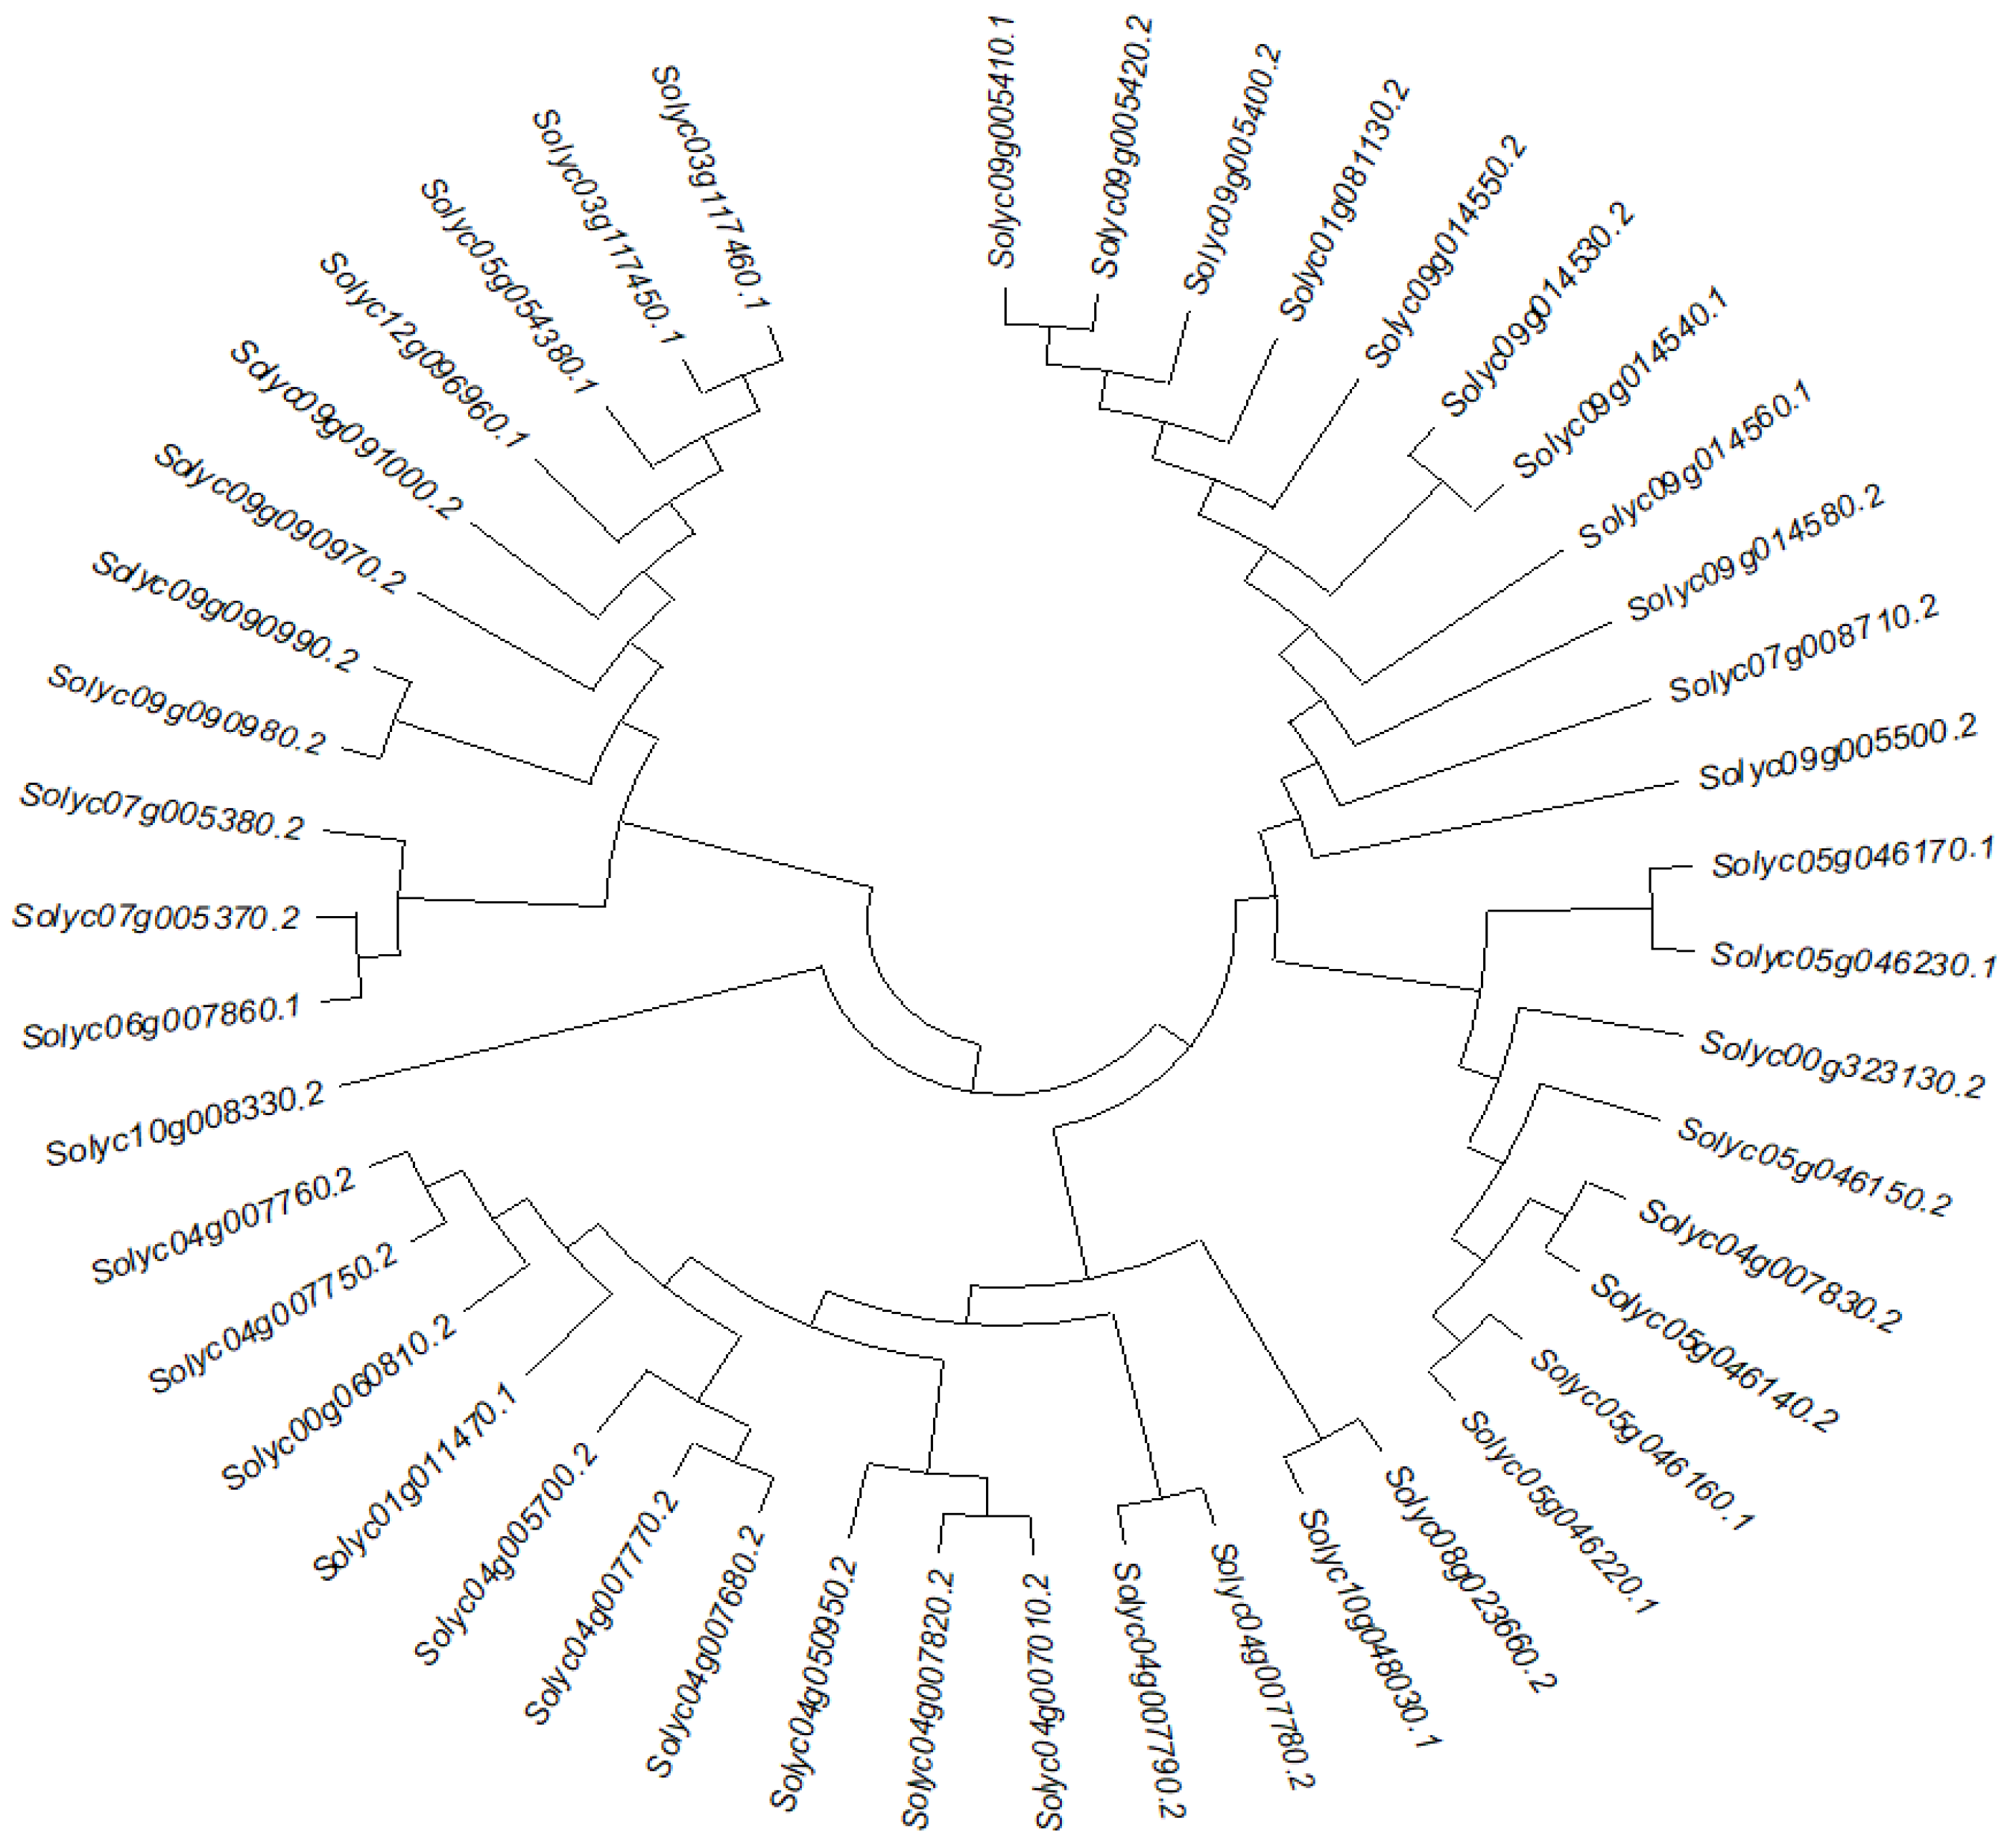
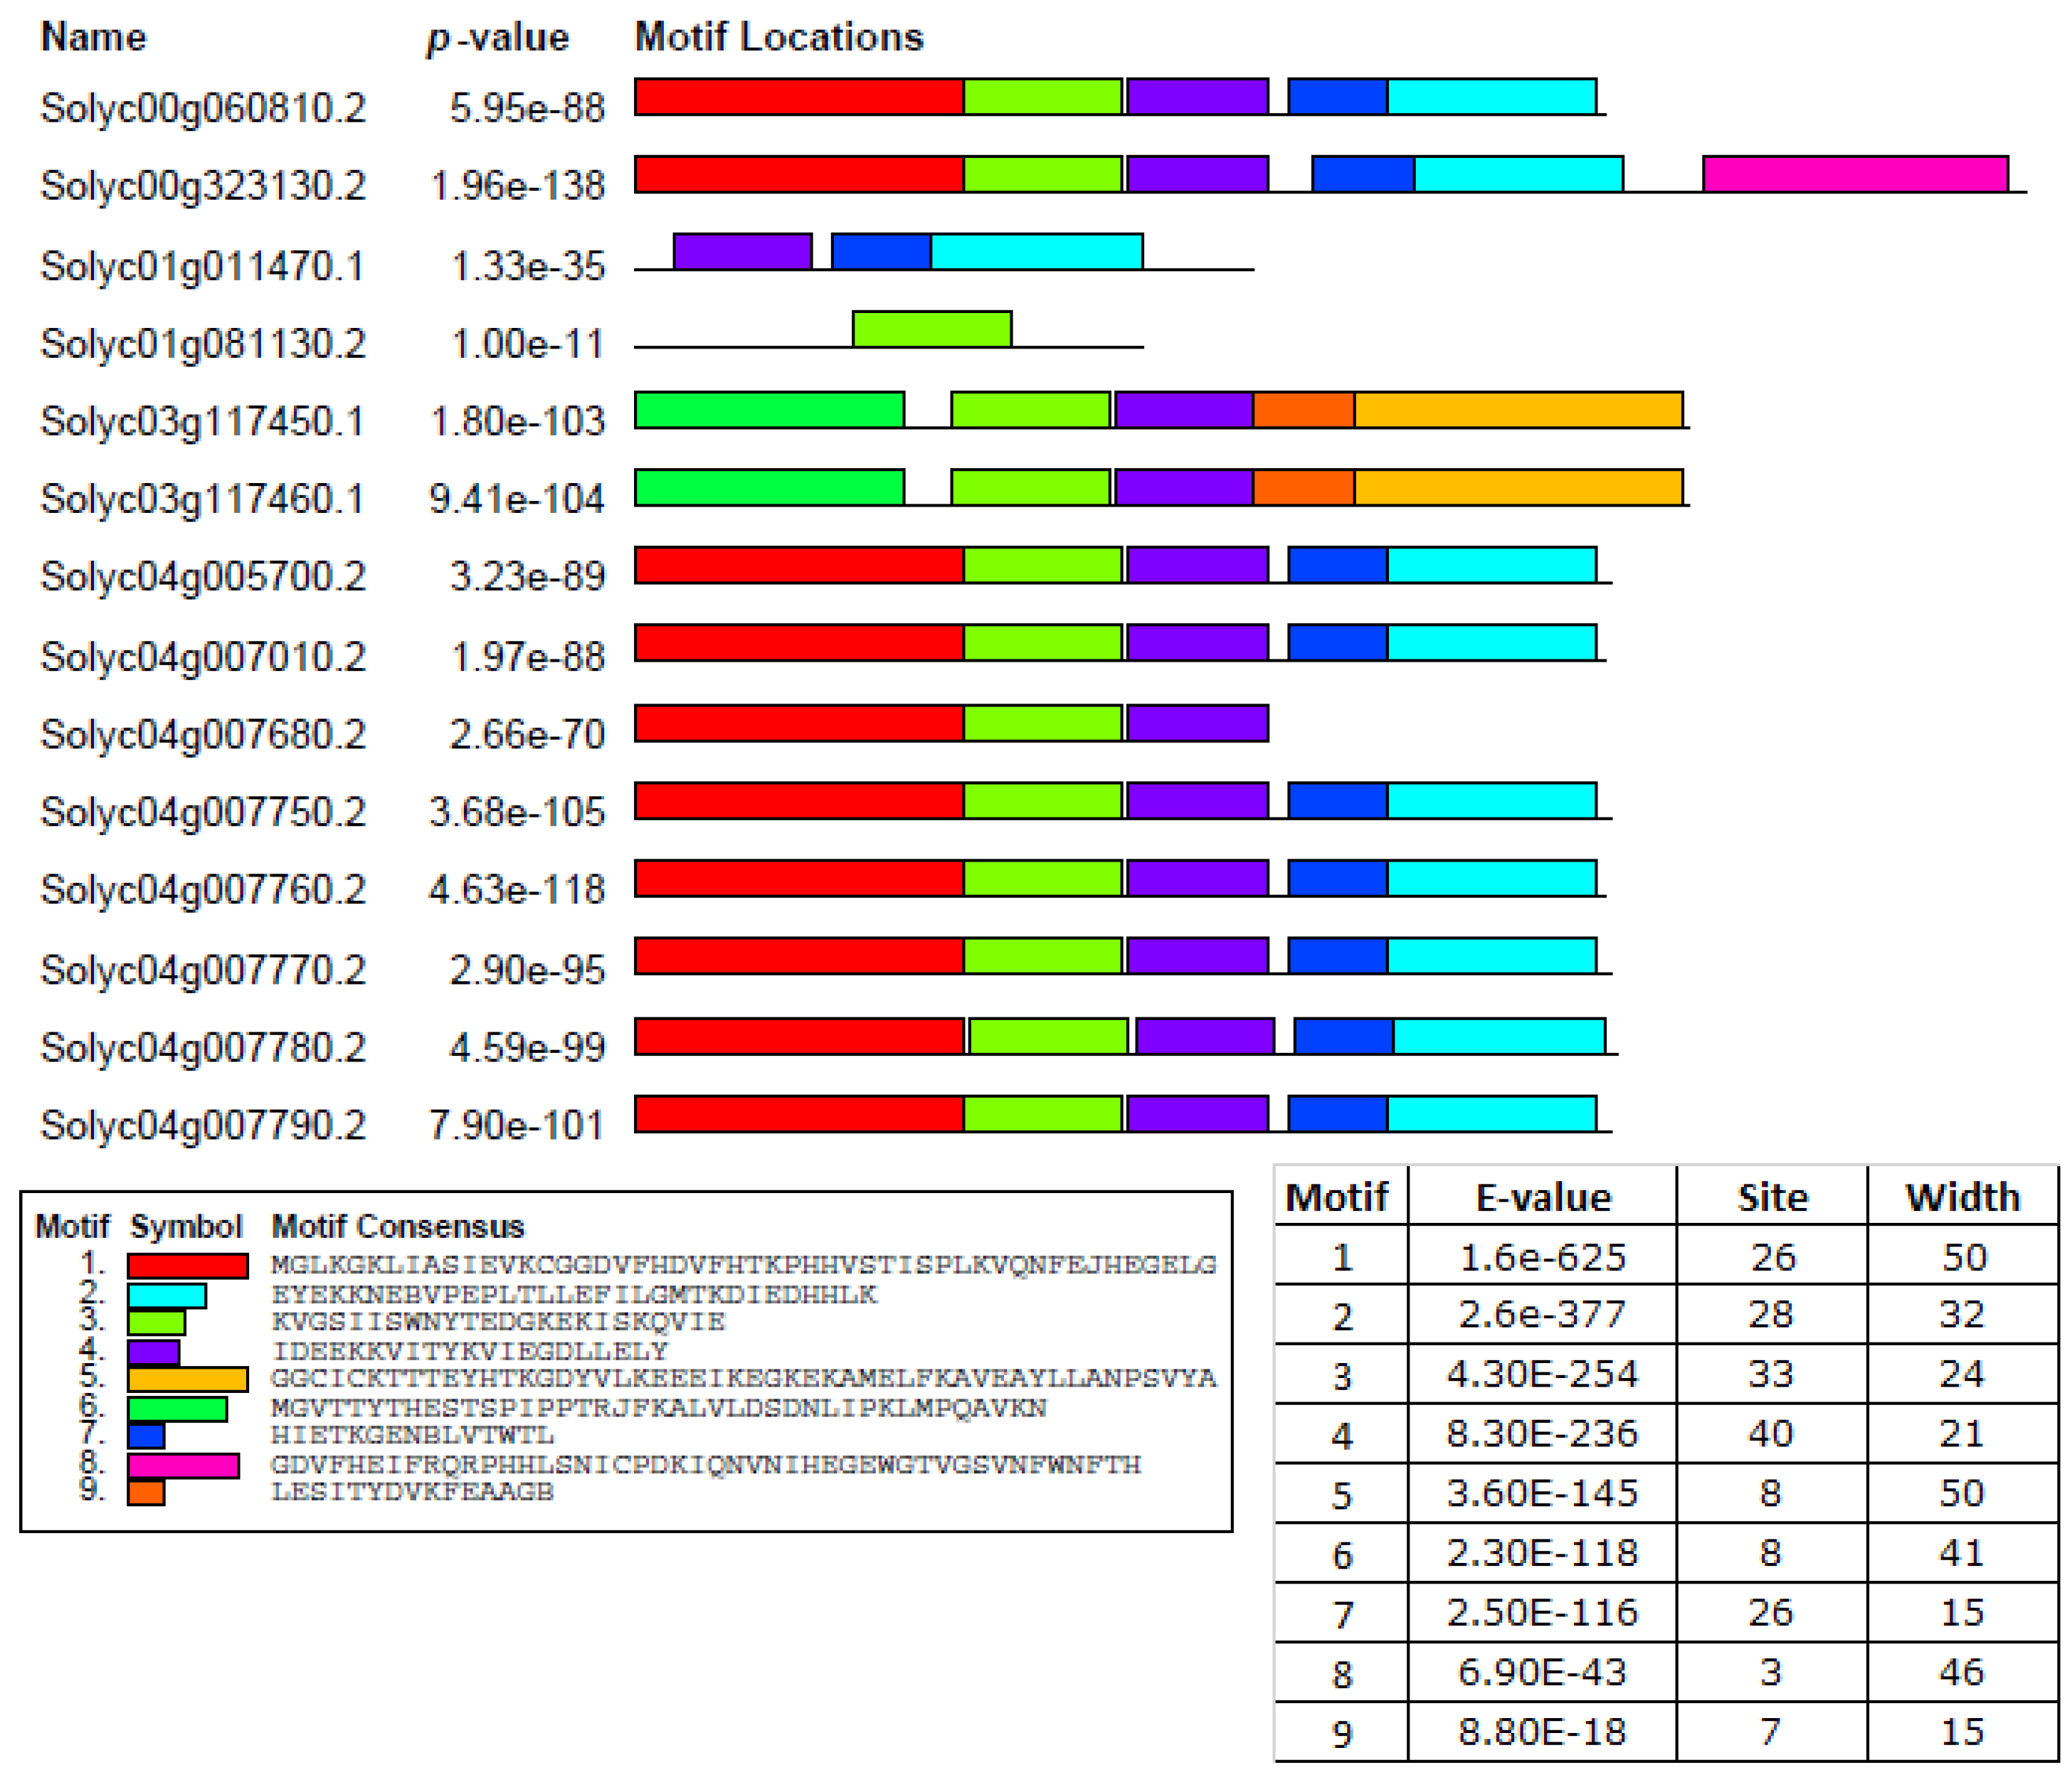
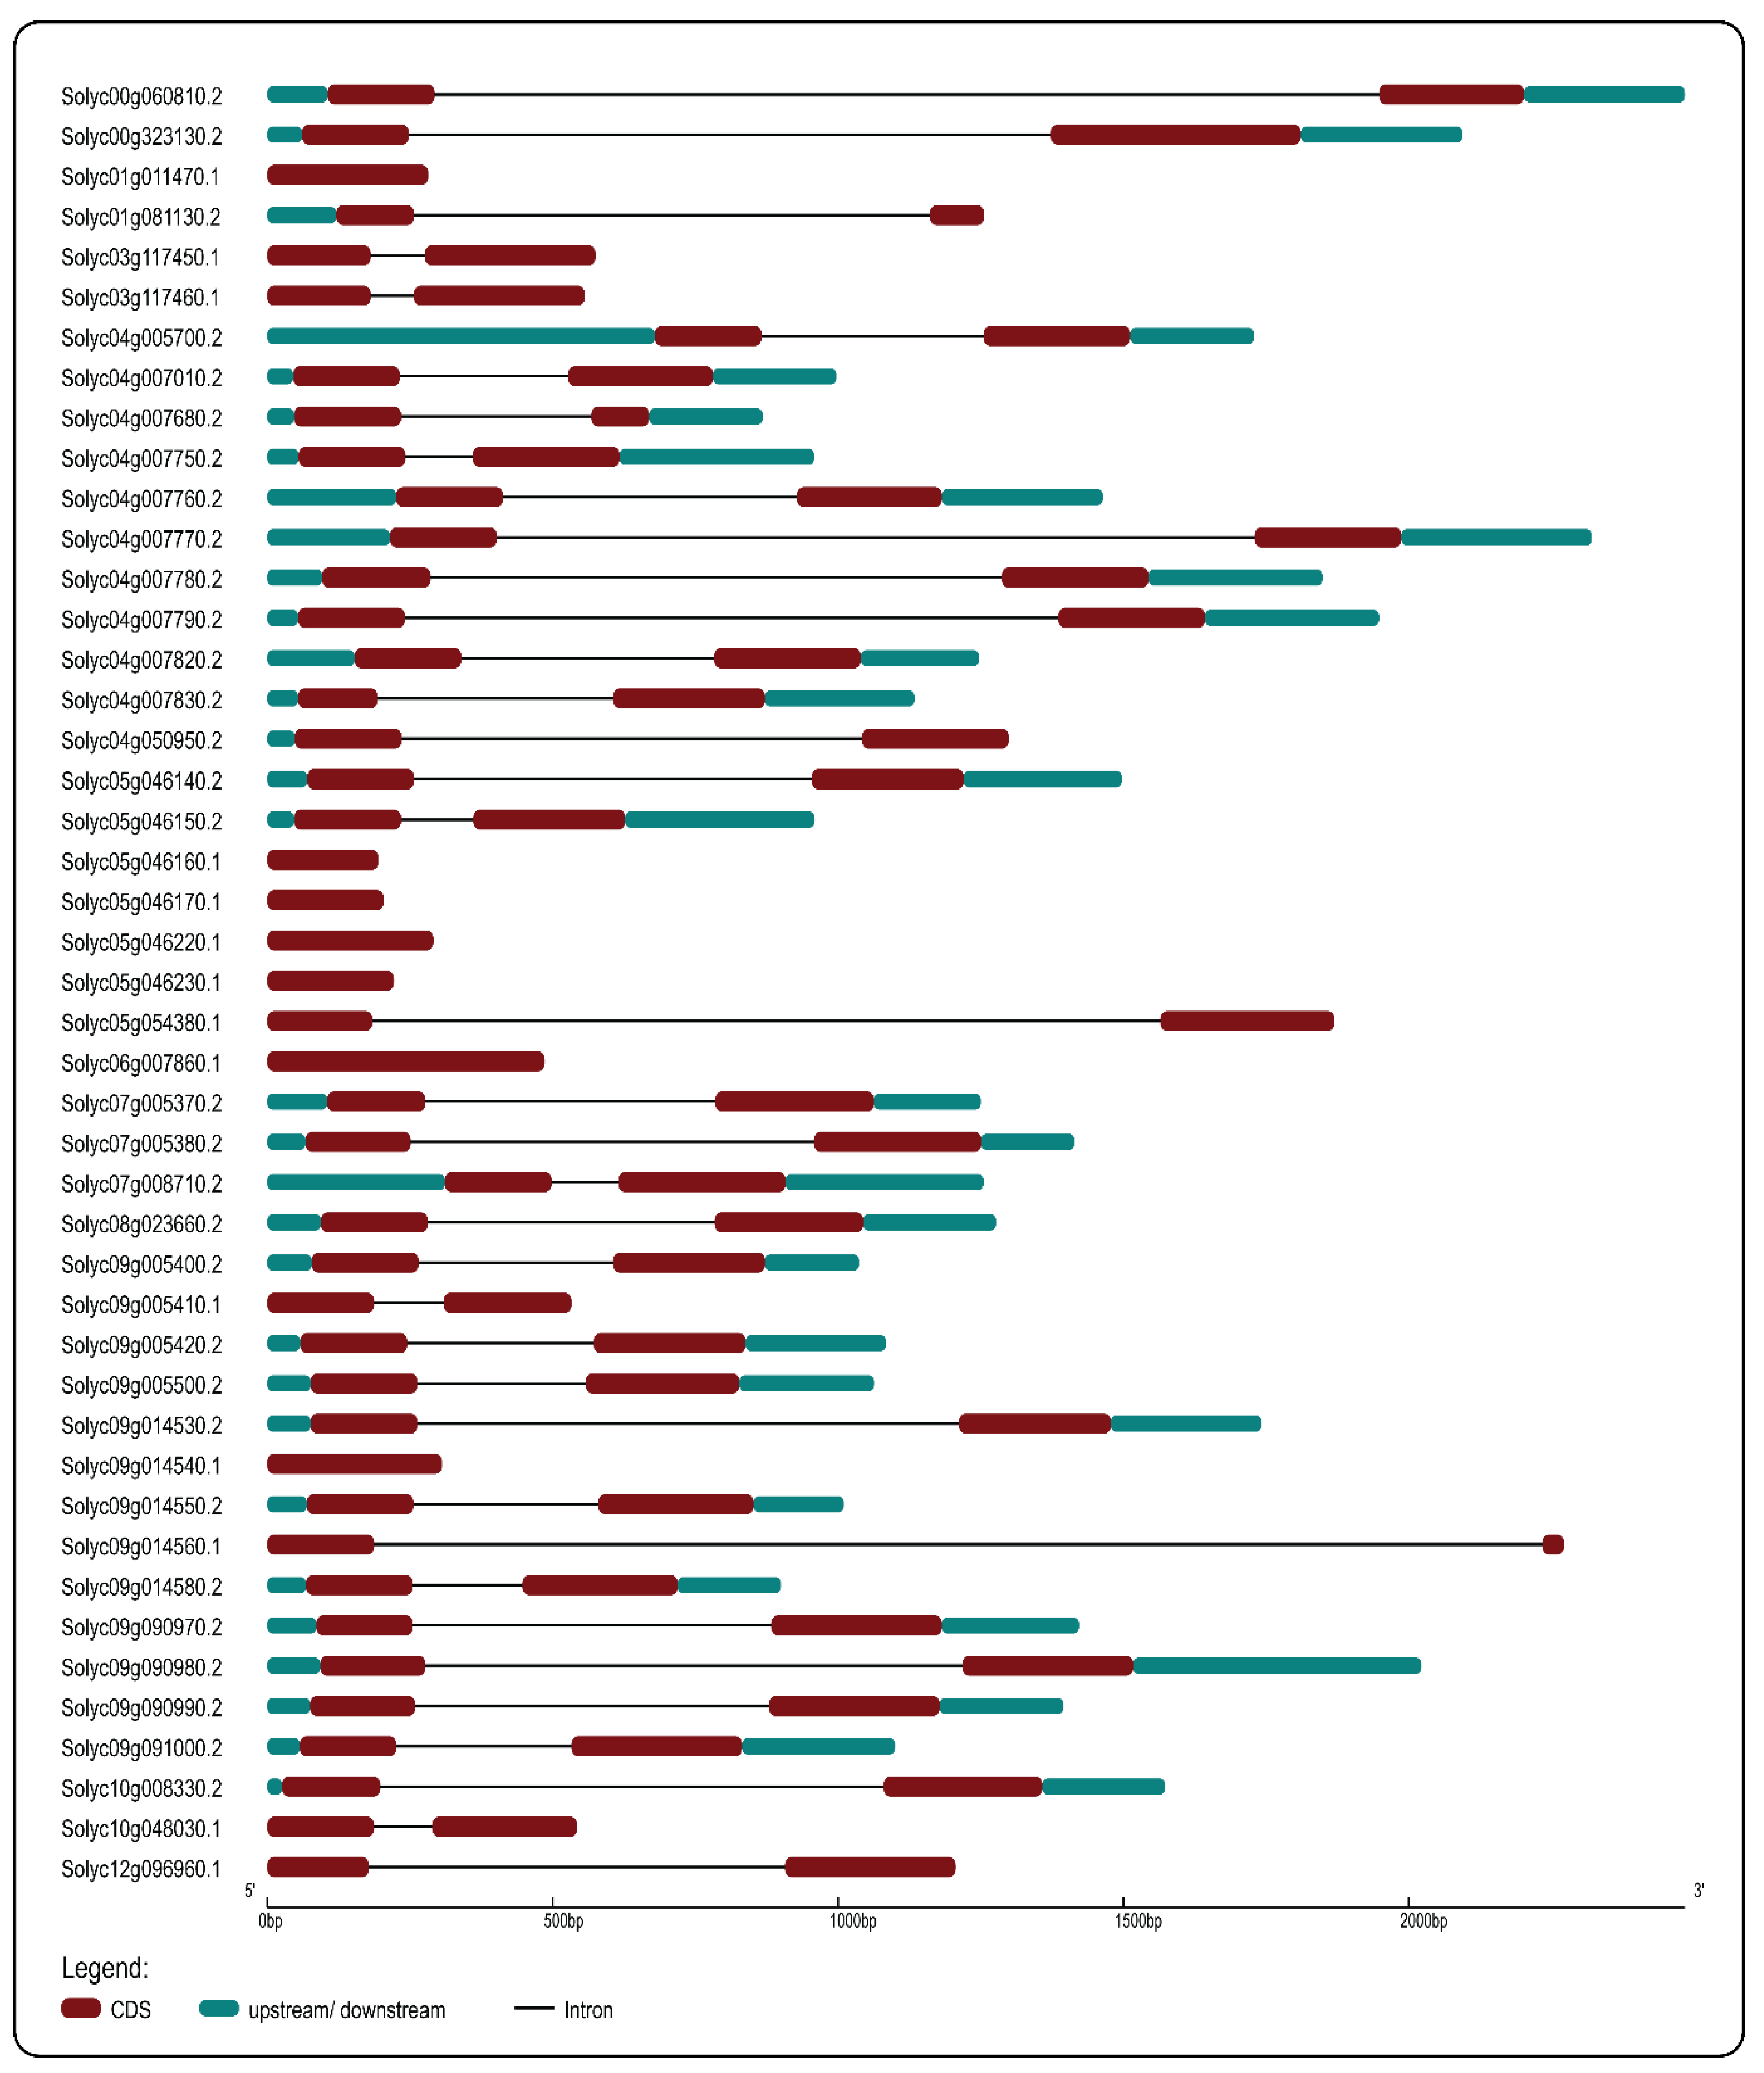
2.2. Phylogenetic Analysis, Conserved Motifs, and Gene Structures
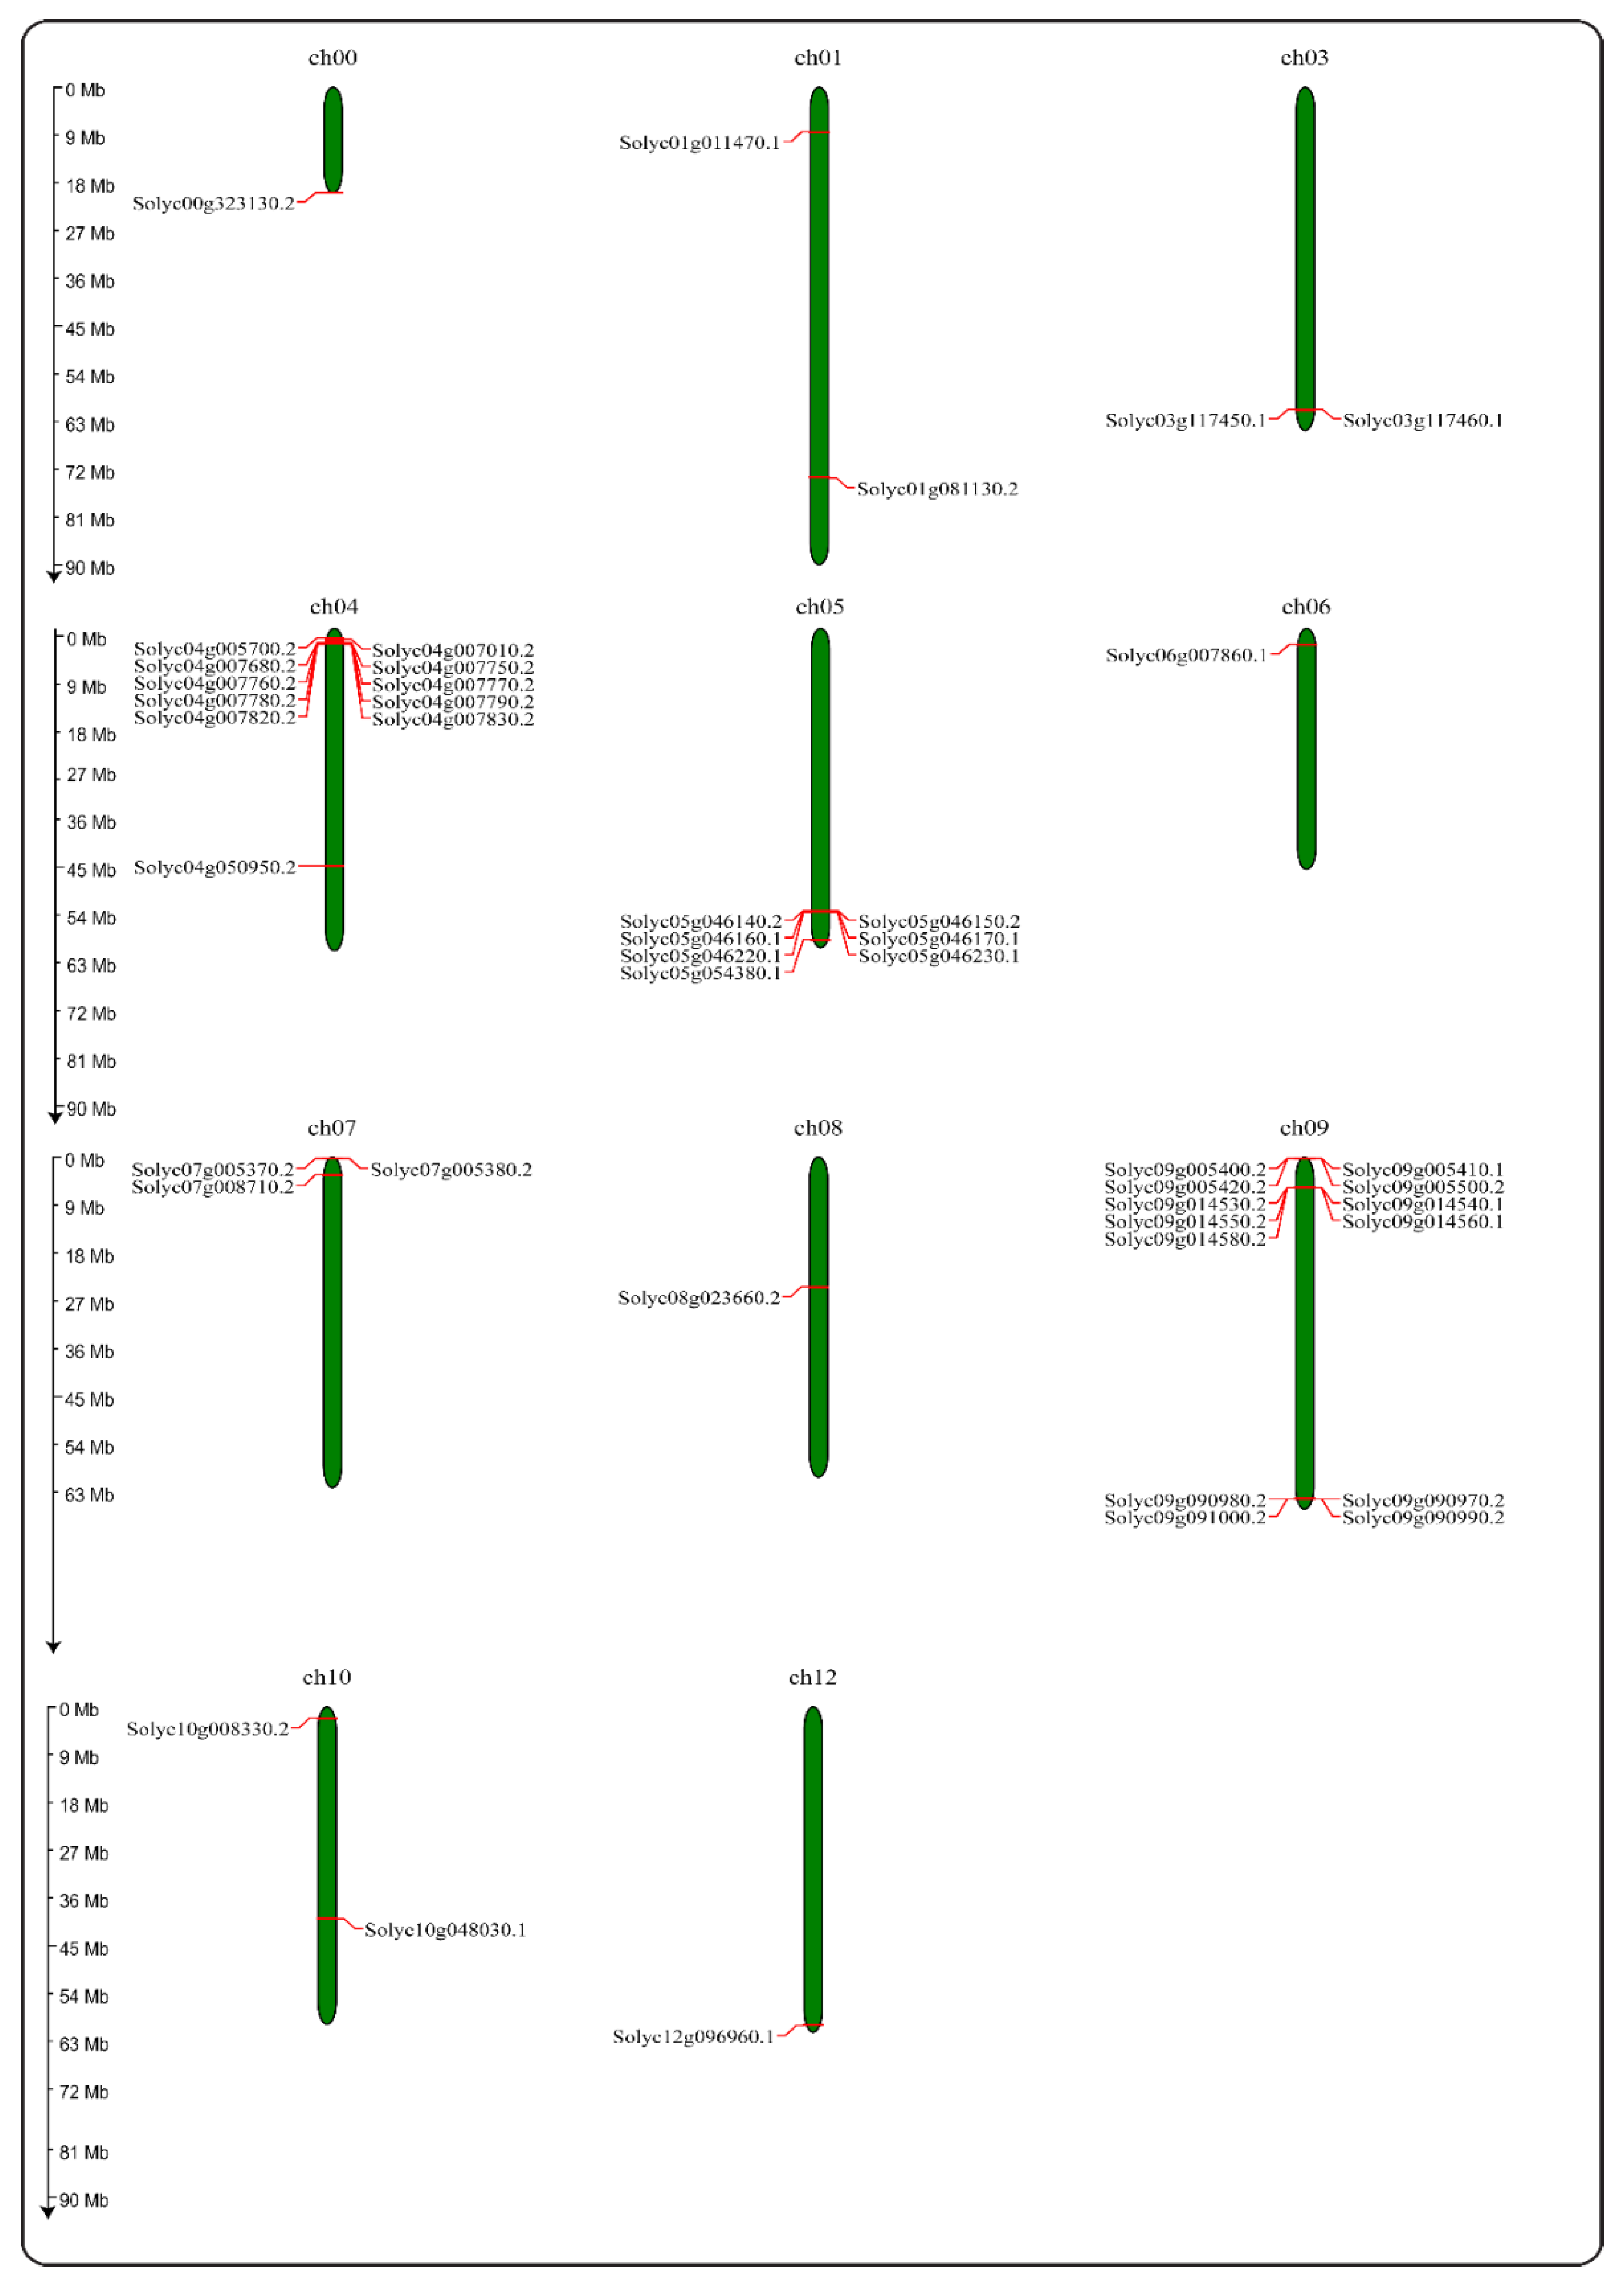
2.3. Chromosome Mapping of the PR-10 Gene
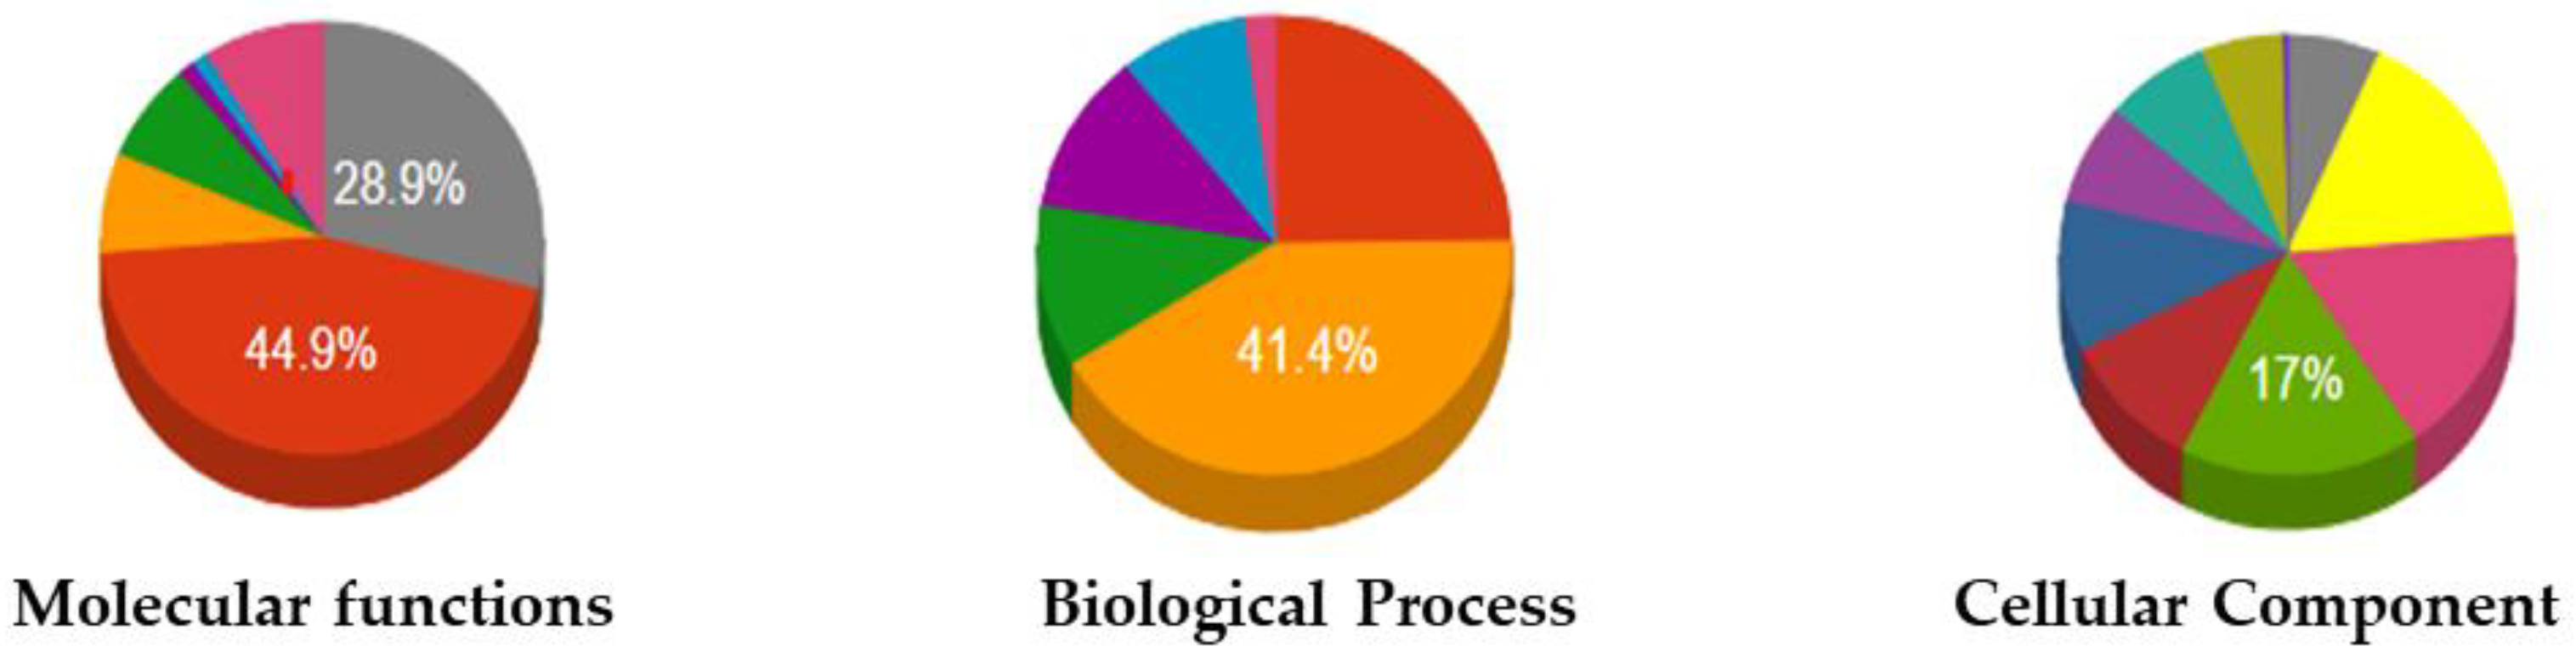
2.4. GO Analysis
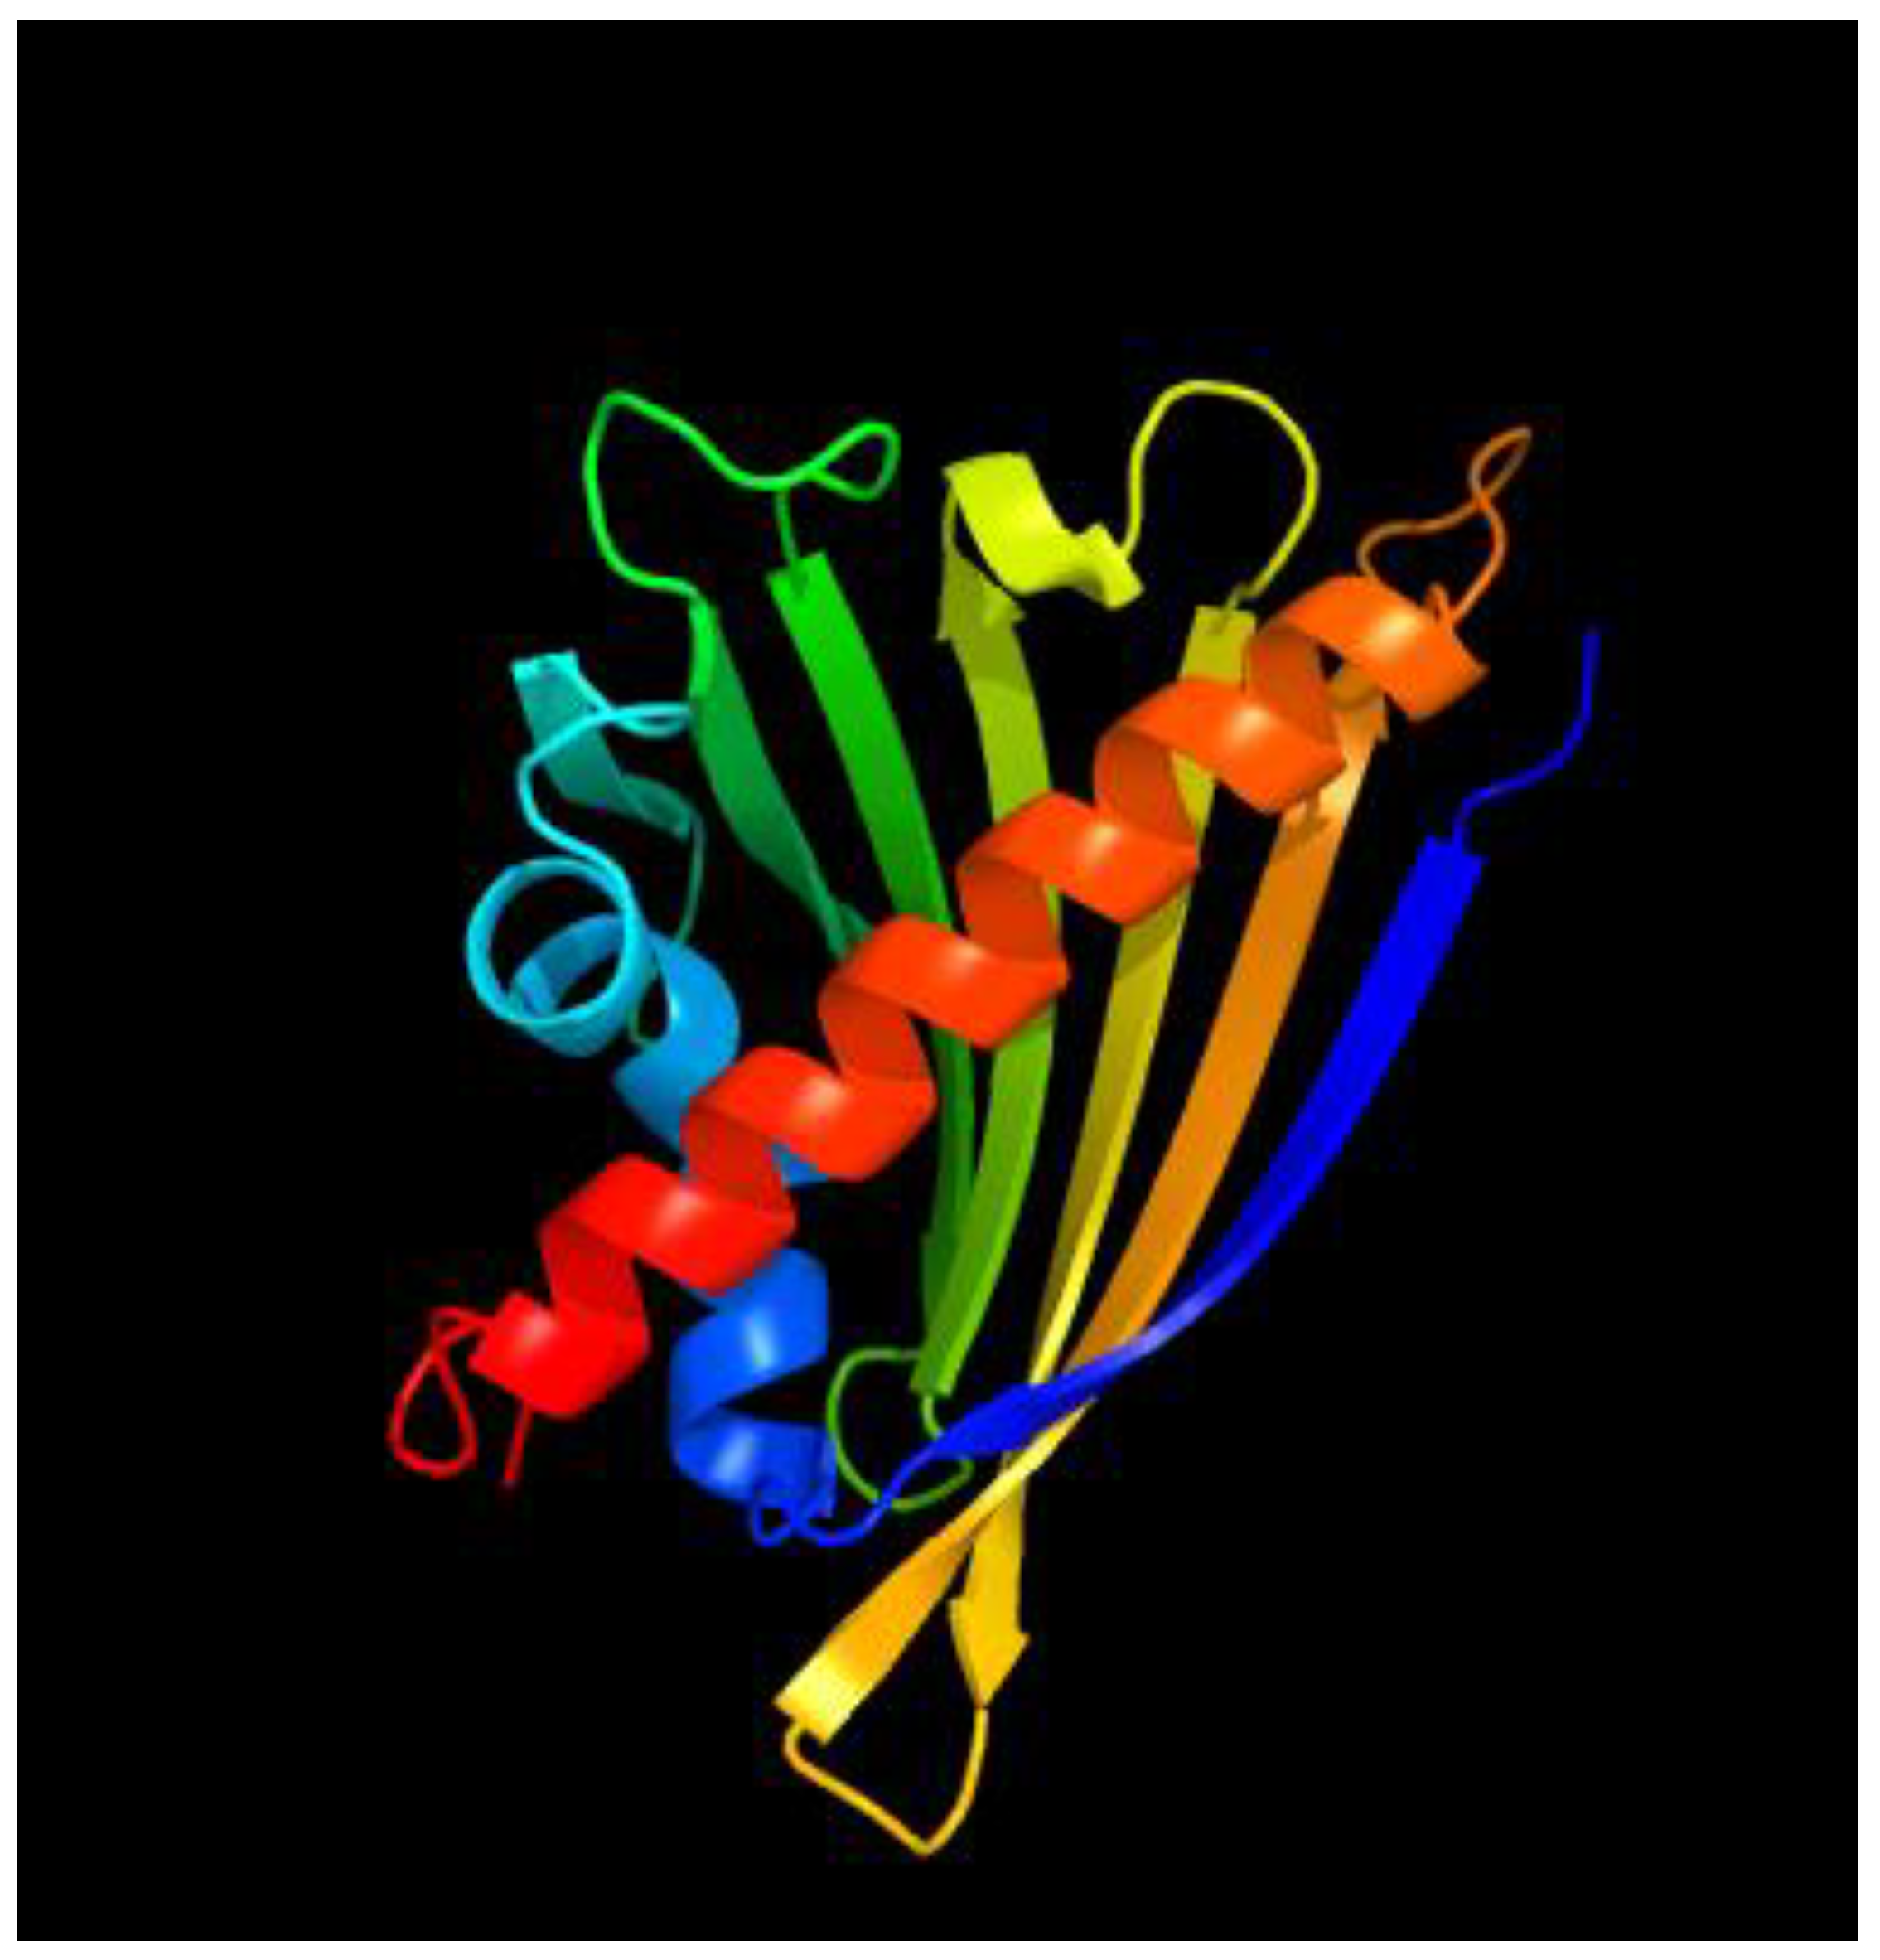
2.5. Three-Dimensional Structure of the PR-10 Protein
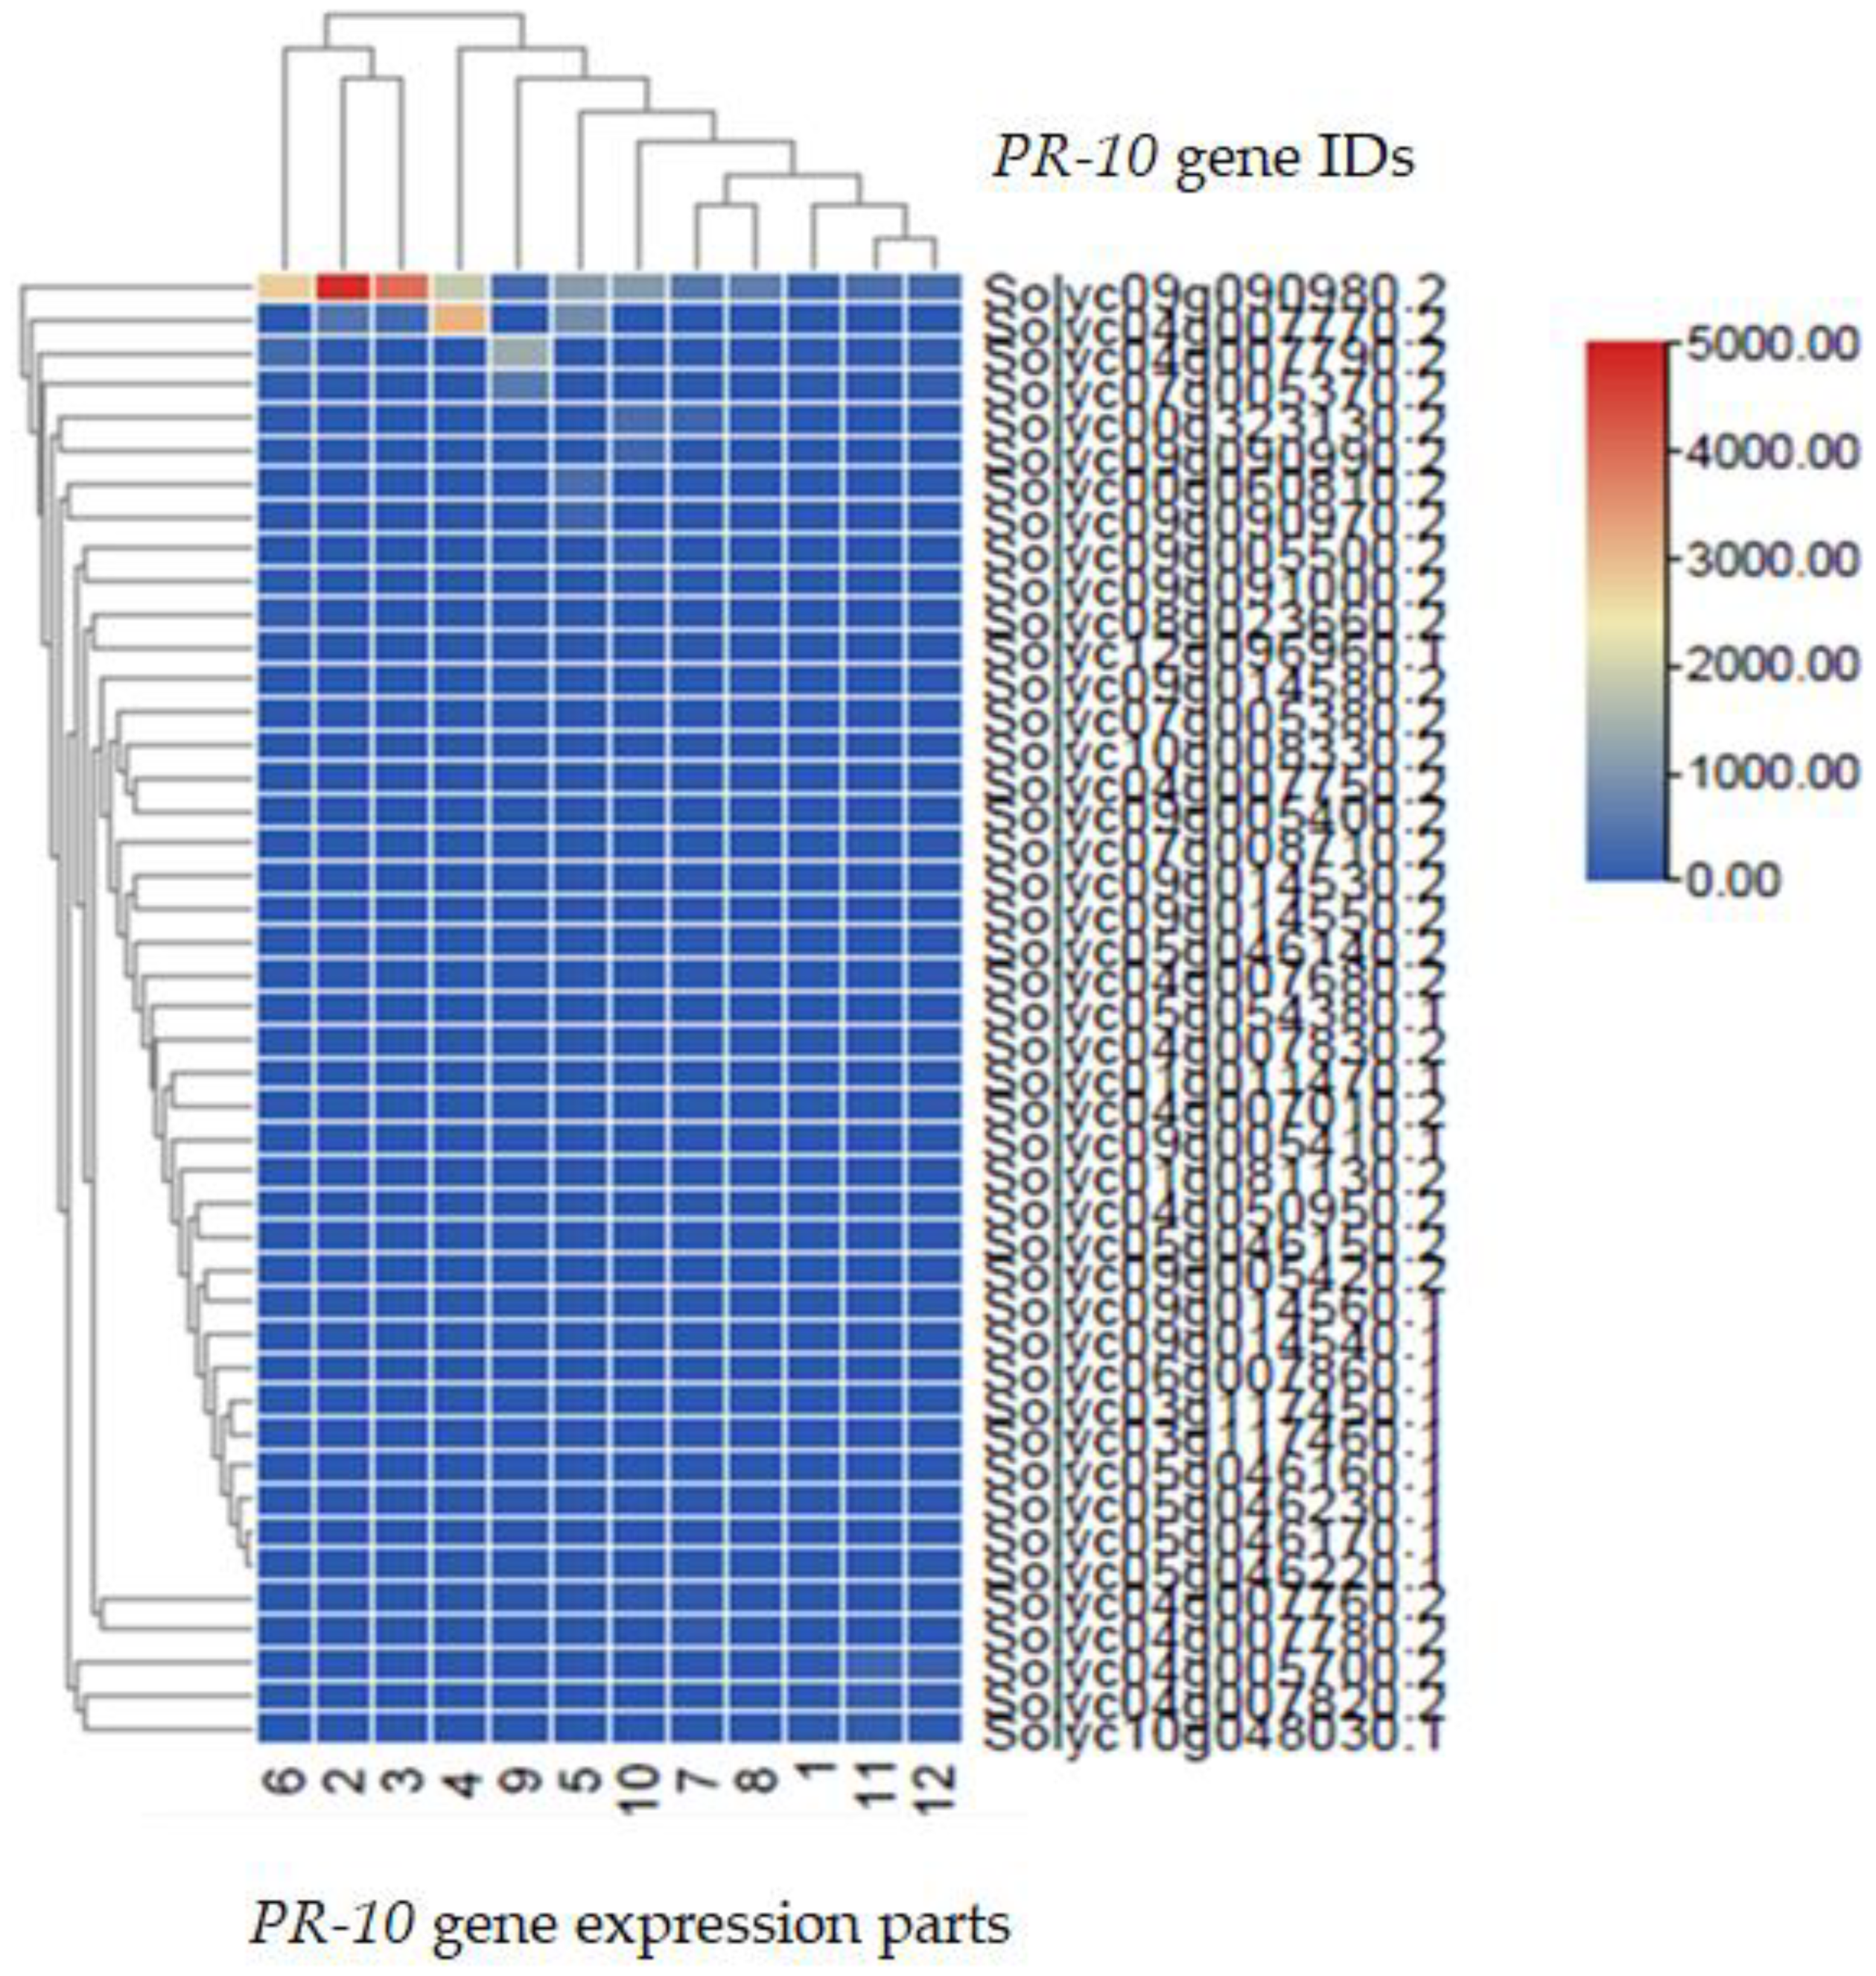
2.6. Transcriptomic Analysis of the PR-10 Protein of Tomato
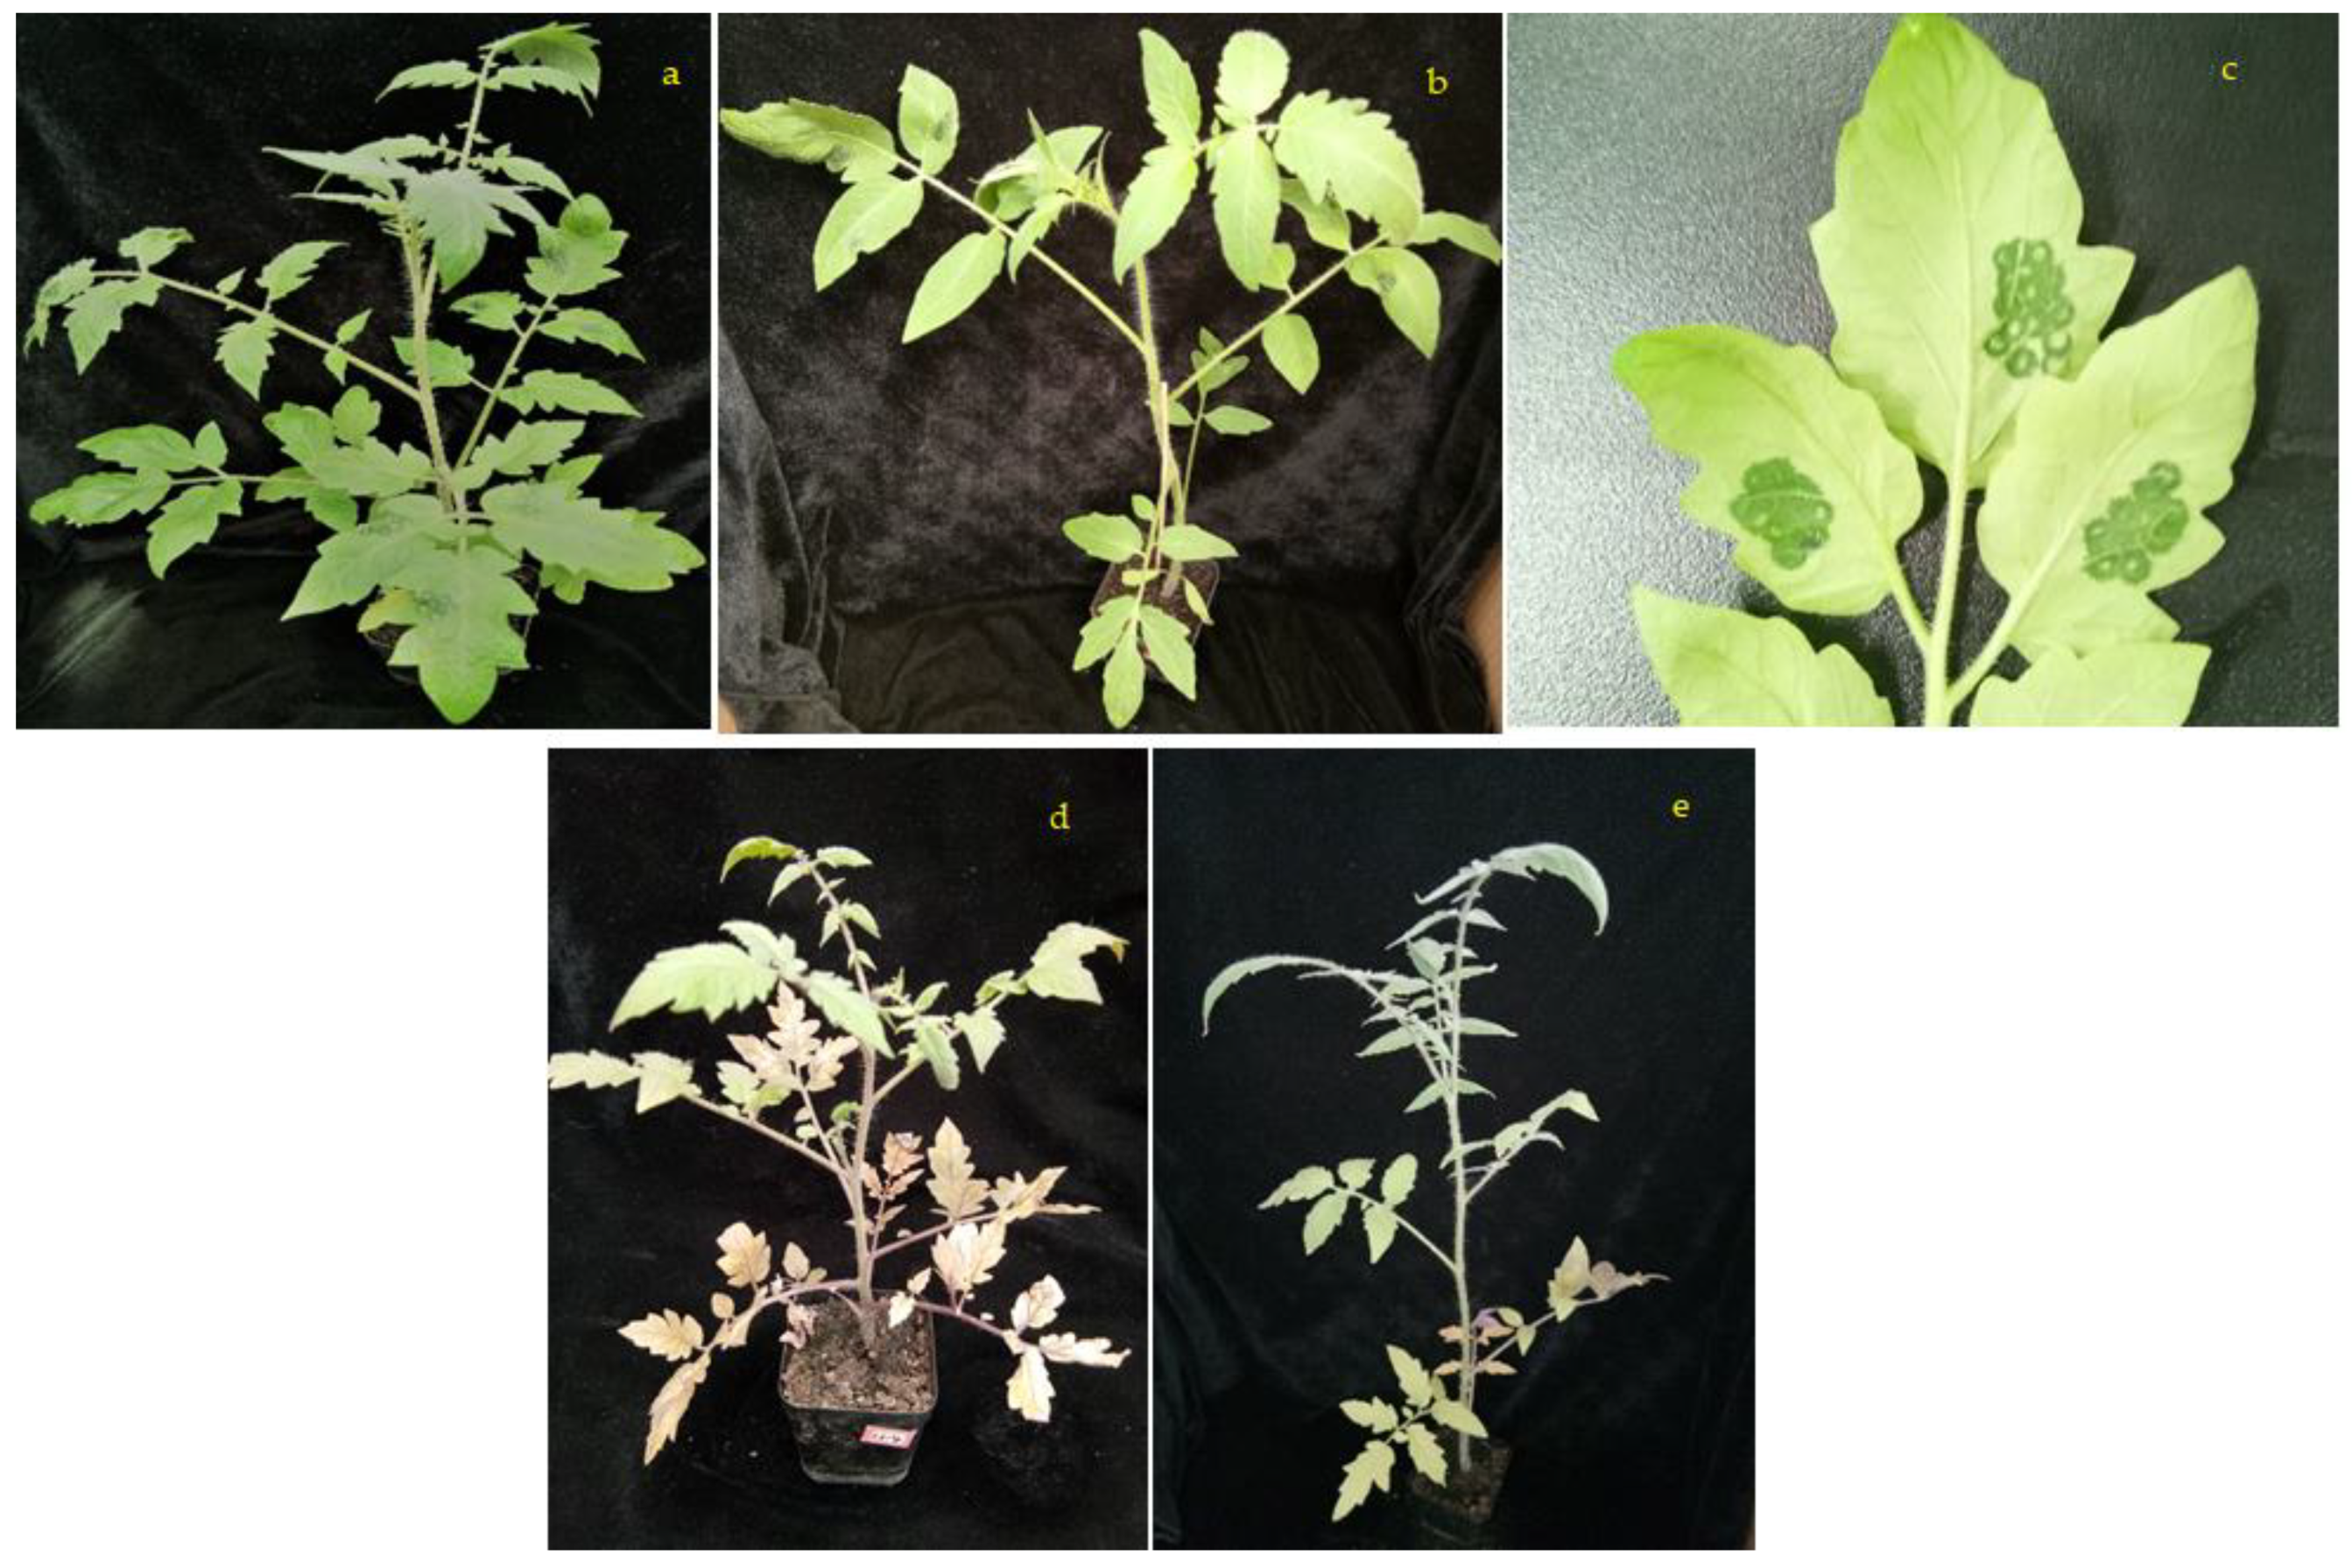
2.7. Incidence and Disease Index Level of TSWV in Each Group of Tomato Plants at Each Observation Time Point
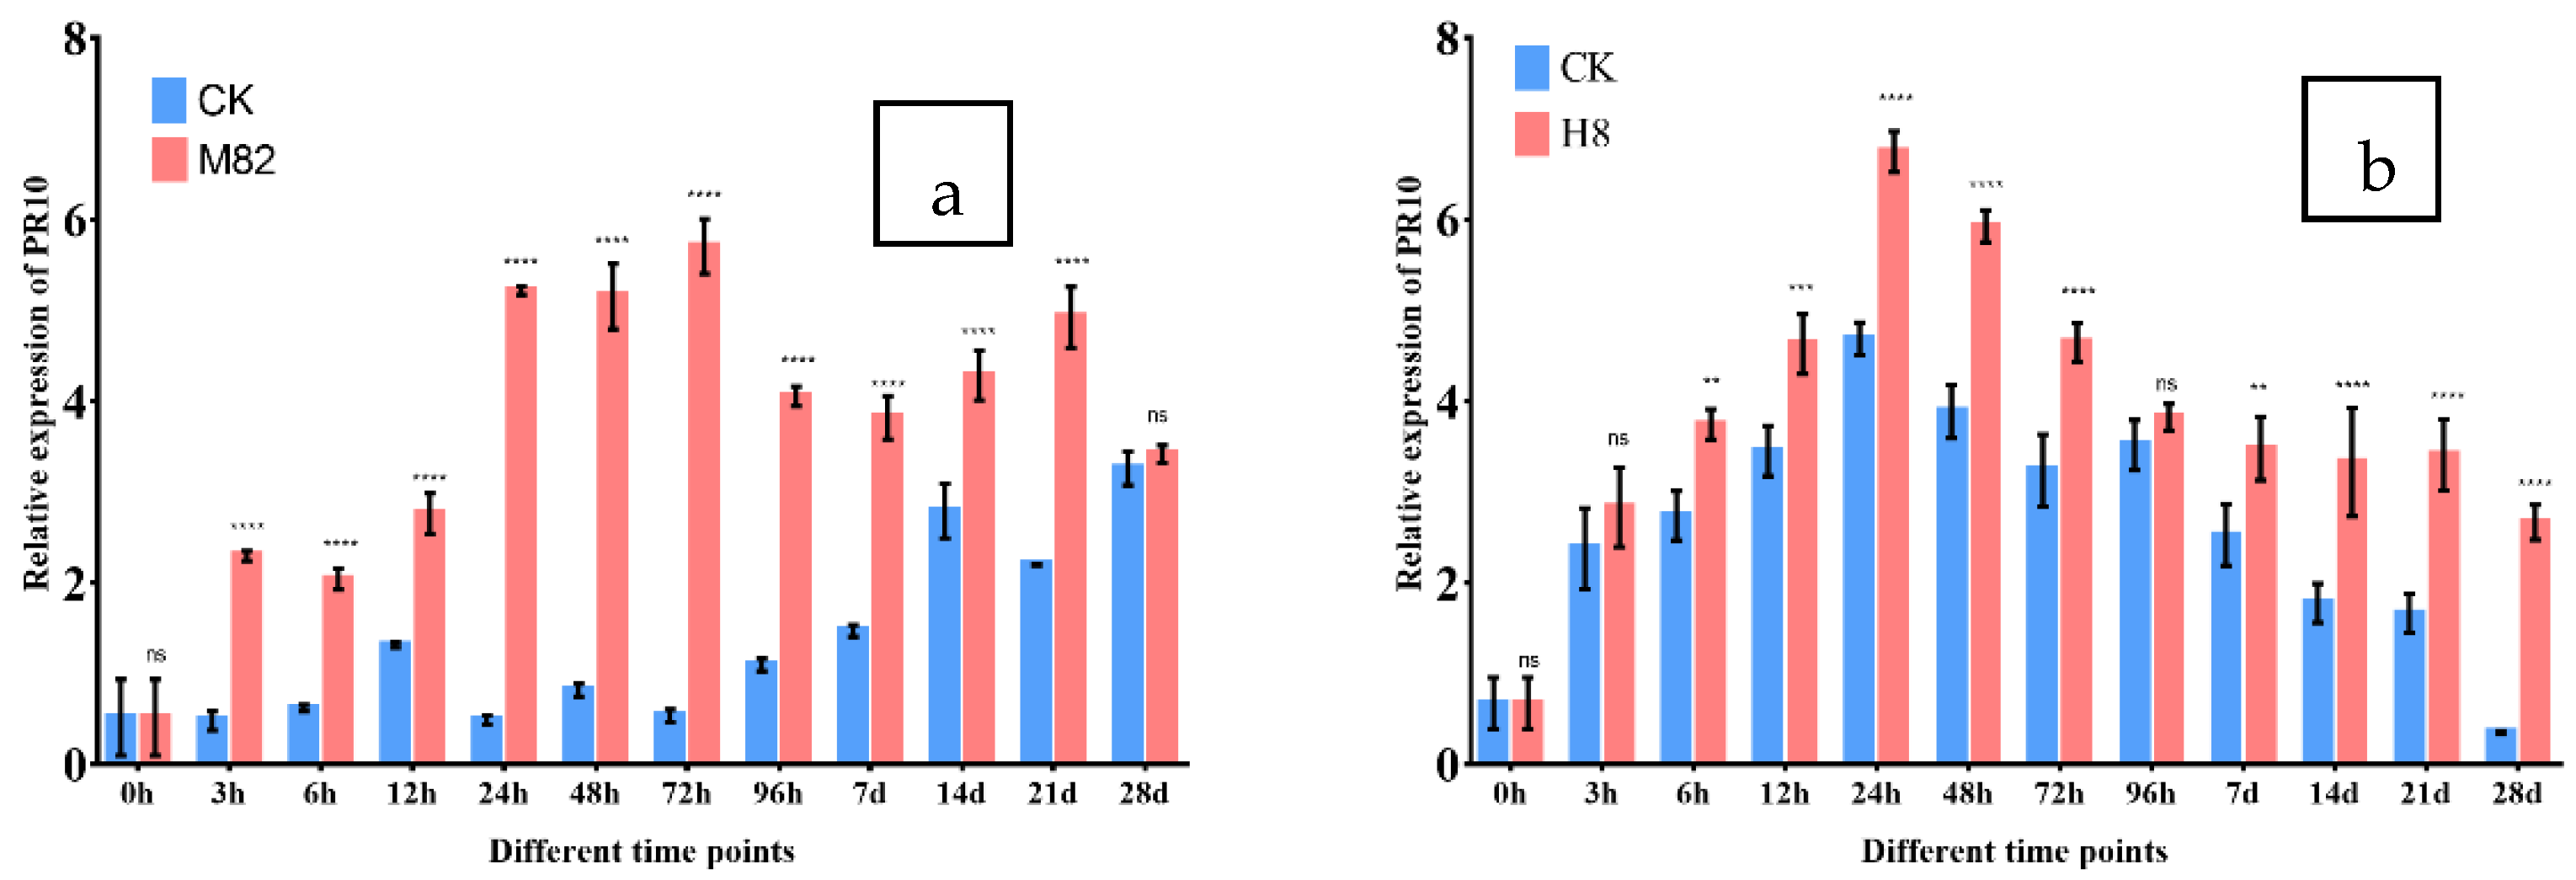
2.8. PR-10 Expression in M82 and H8 Plants
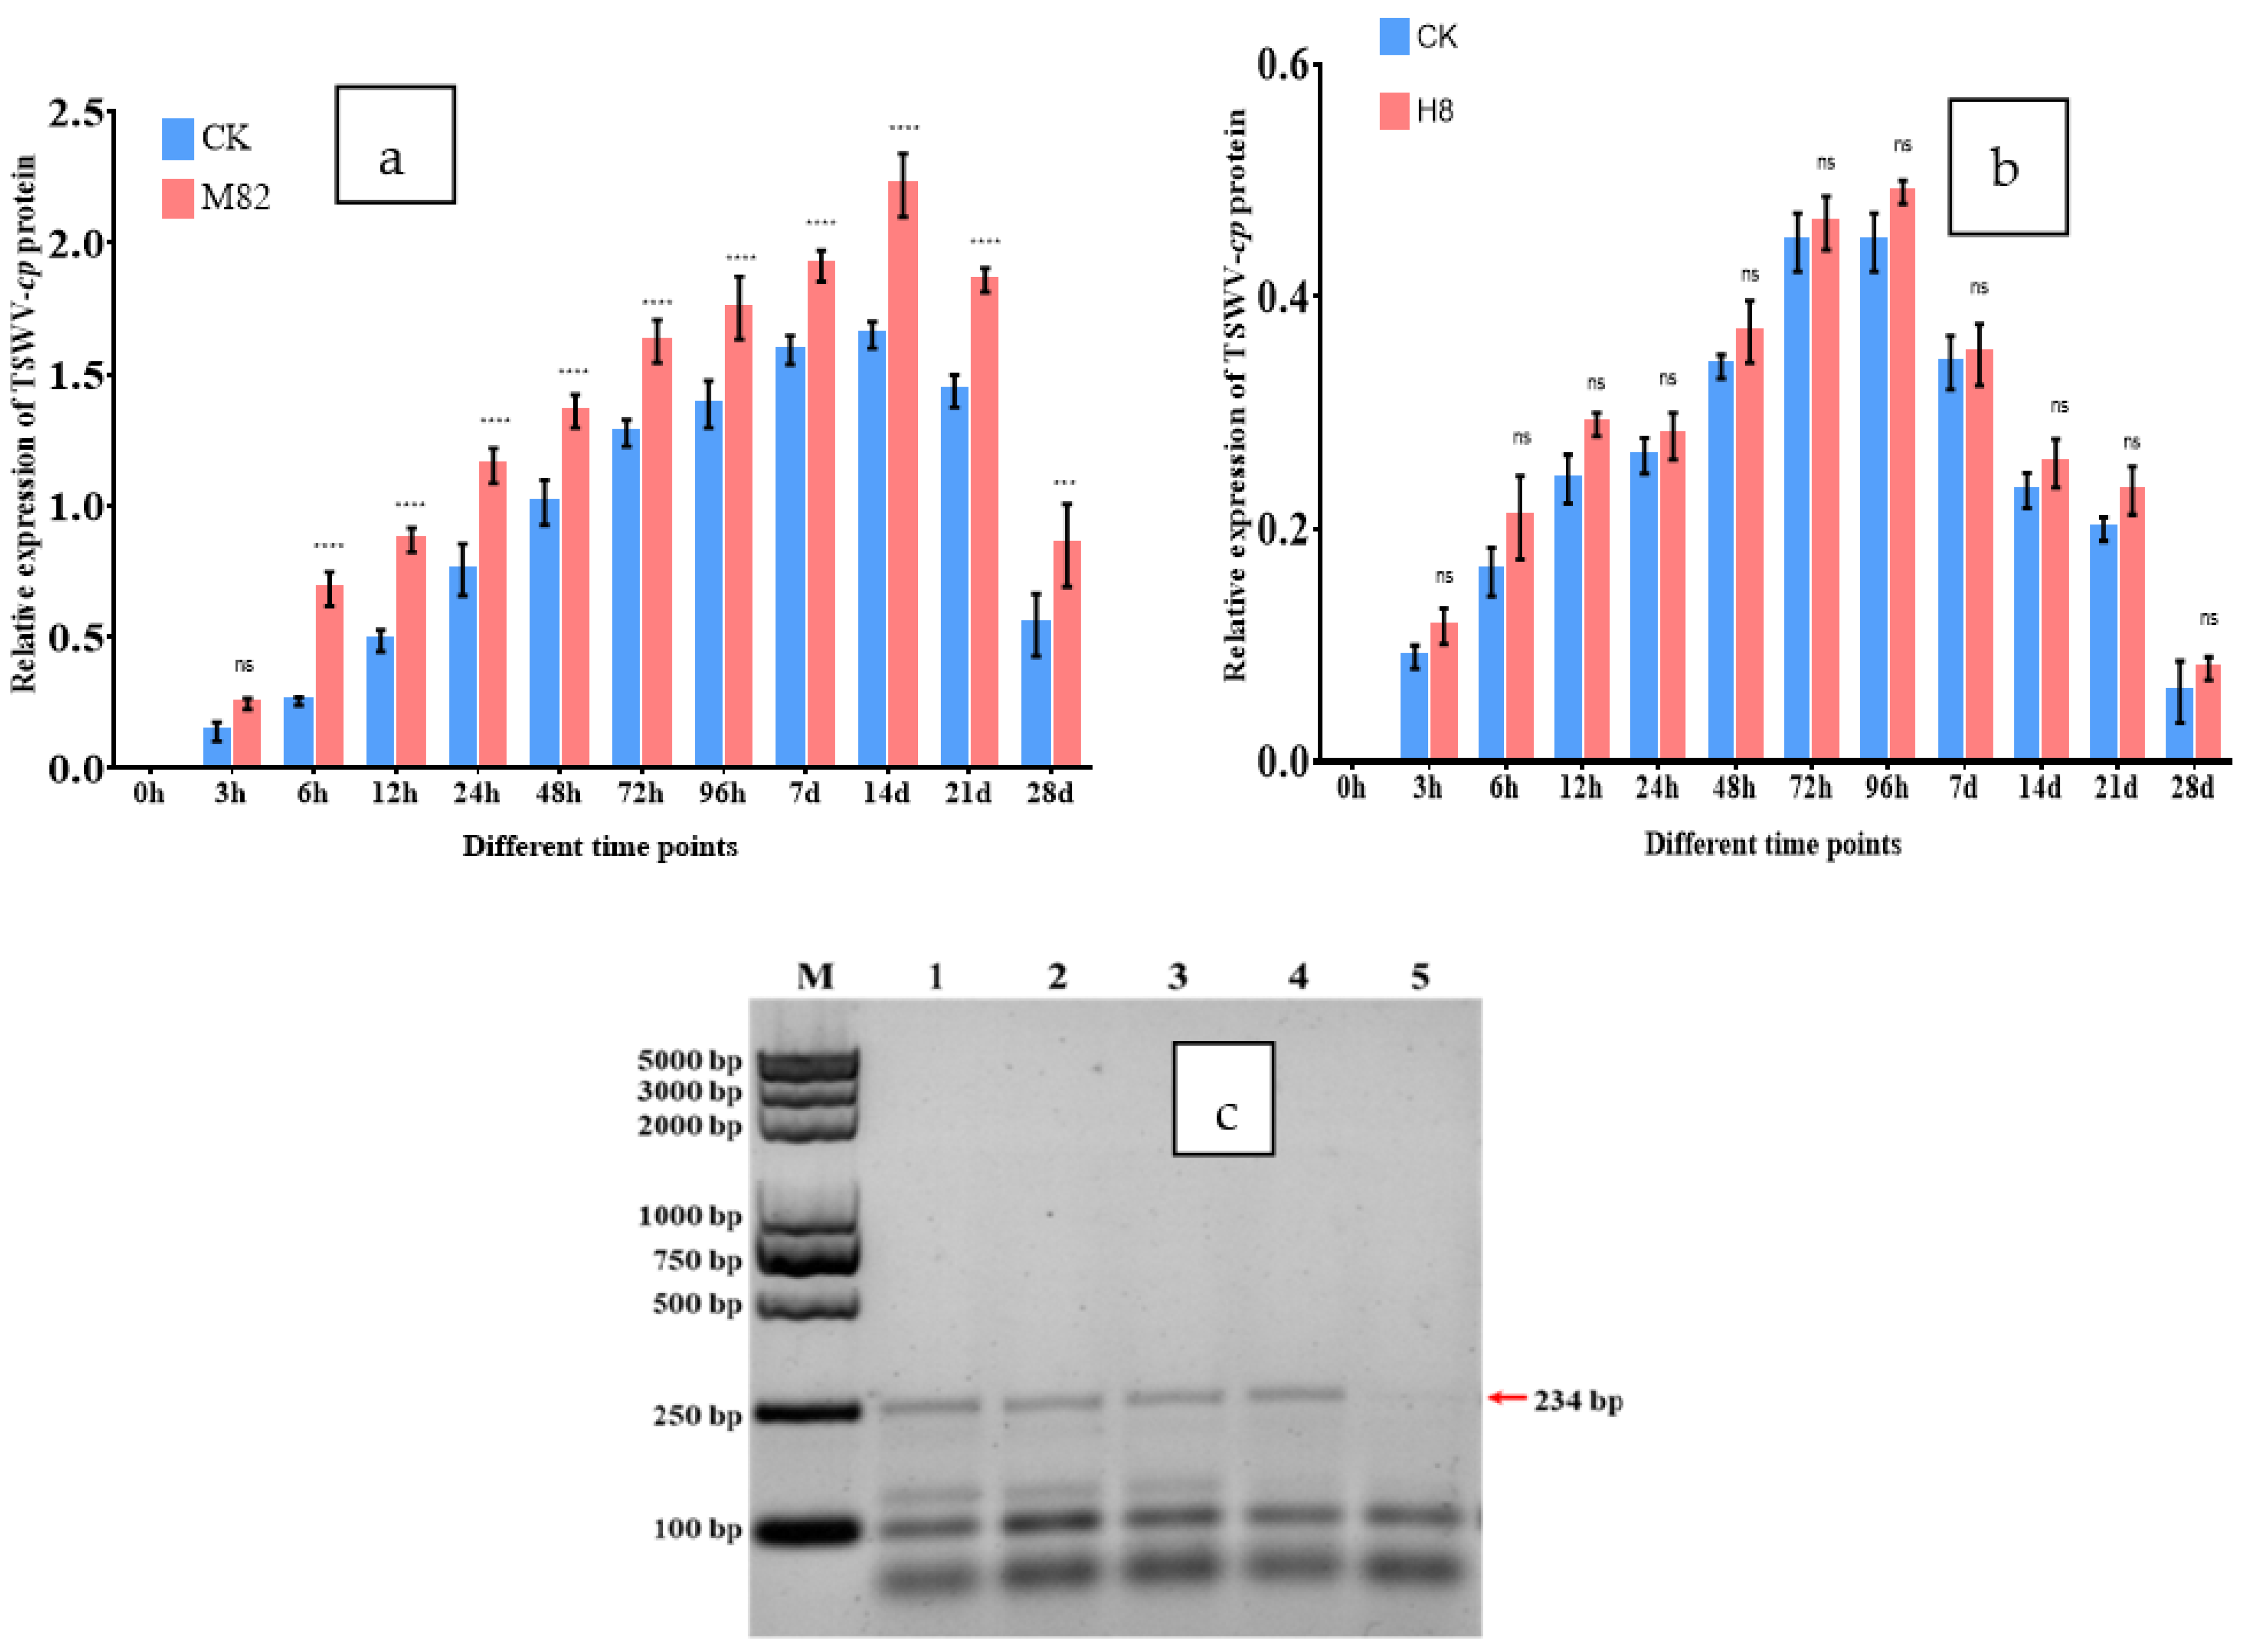
2.9. TSWV-cp Expression in M82 and H8 Plants
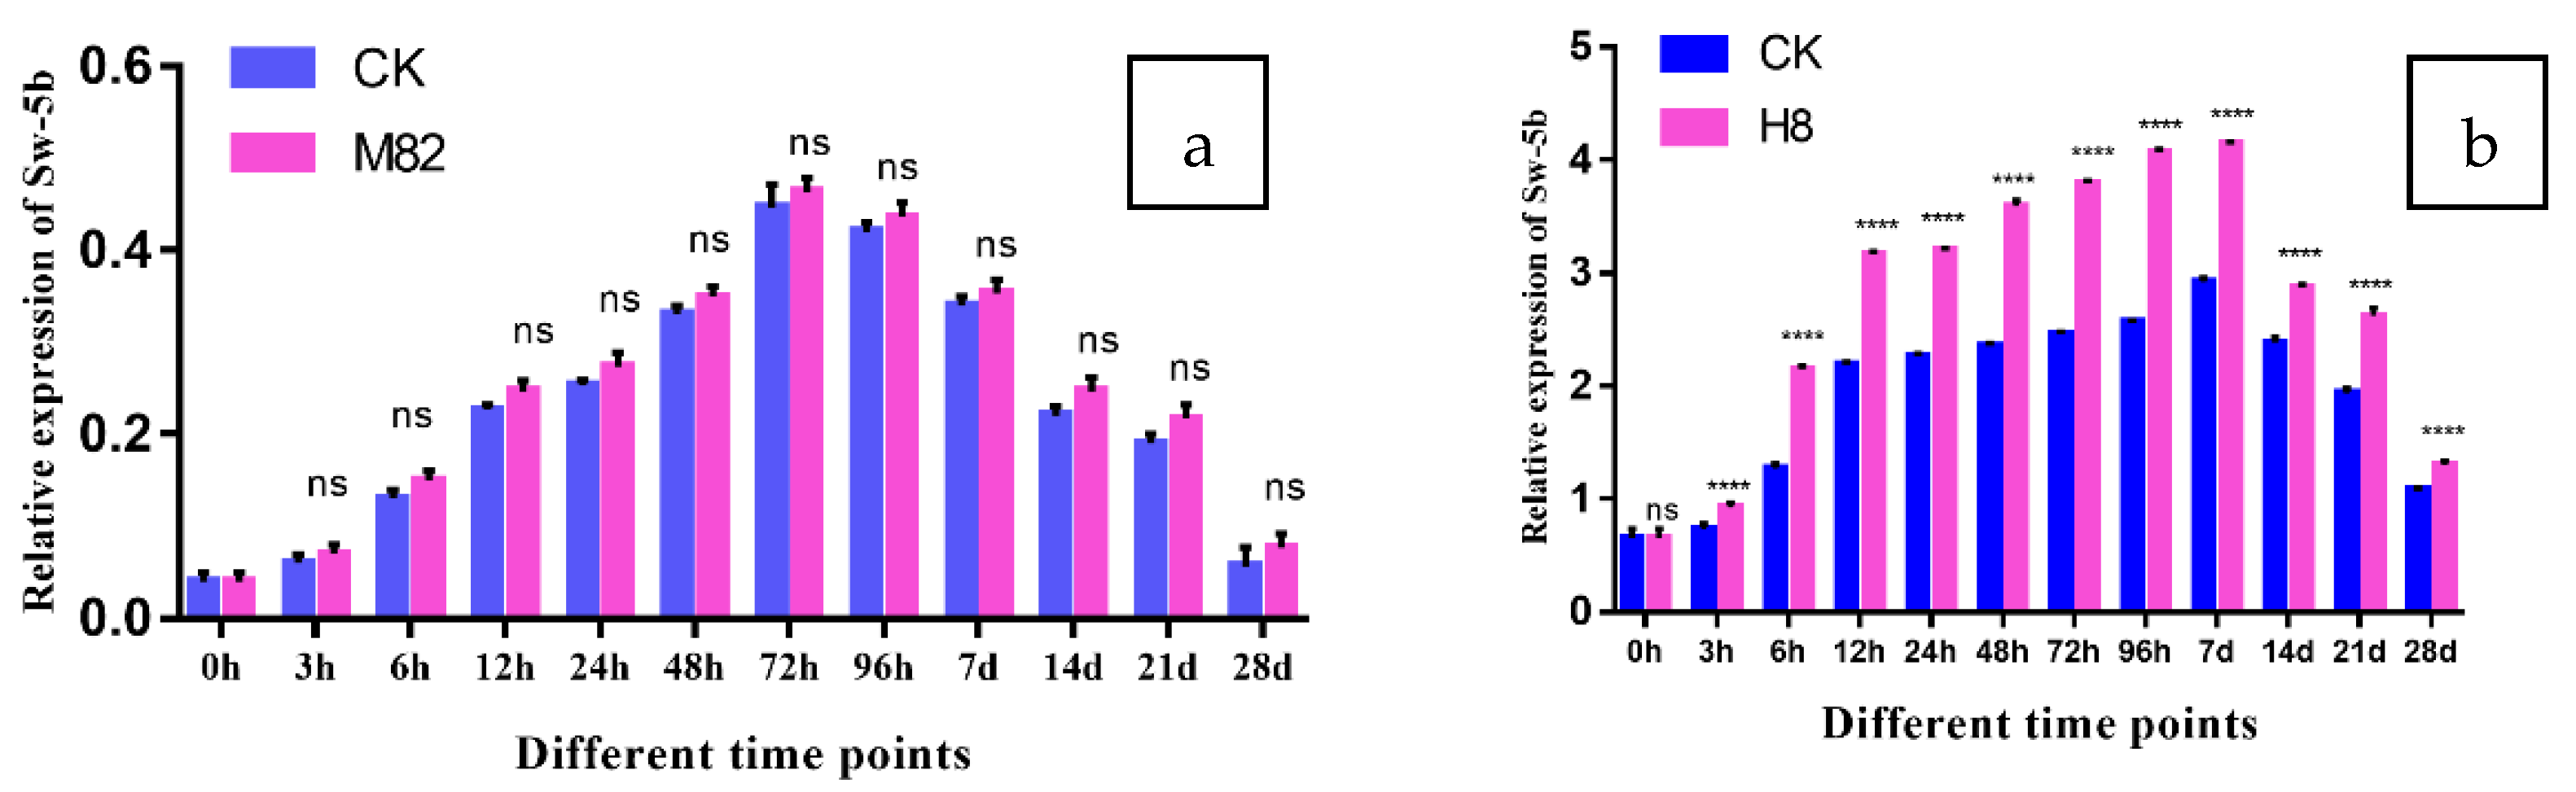
2.10. Expression of Sw-5b in M82 and H8 Plants
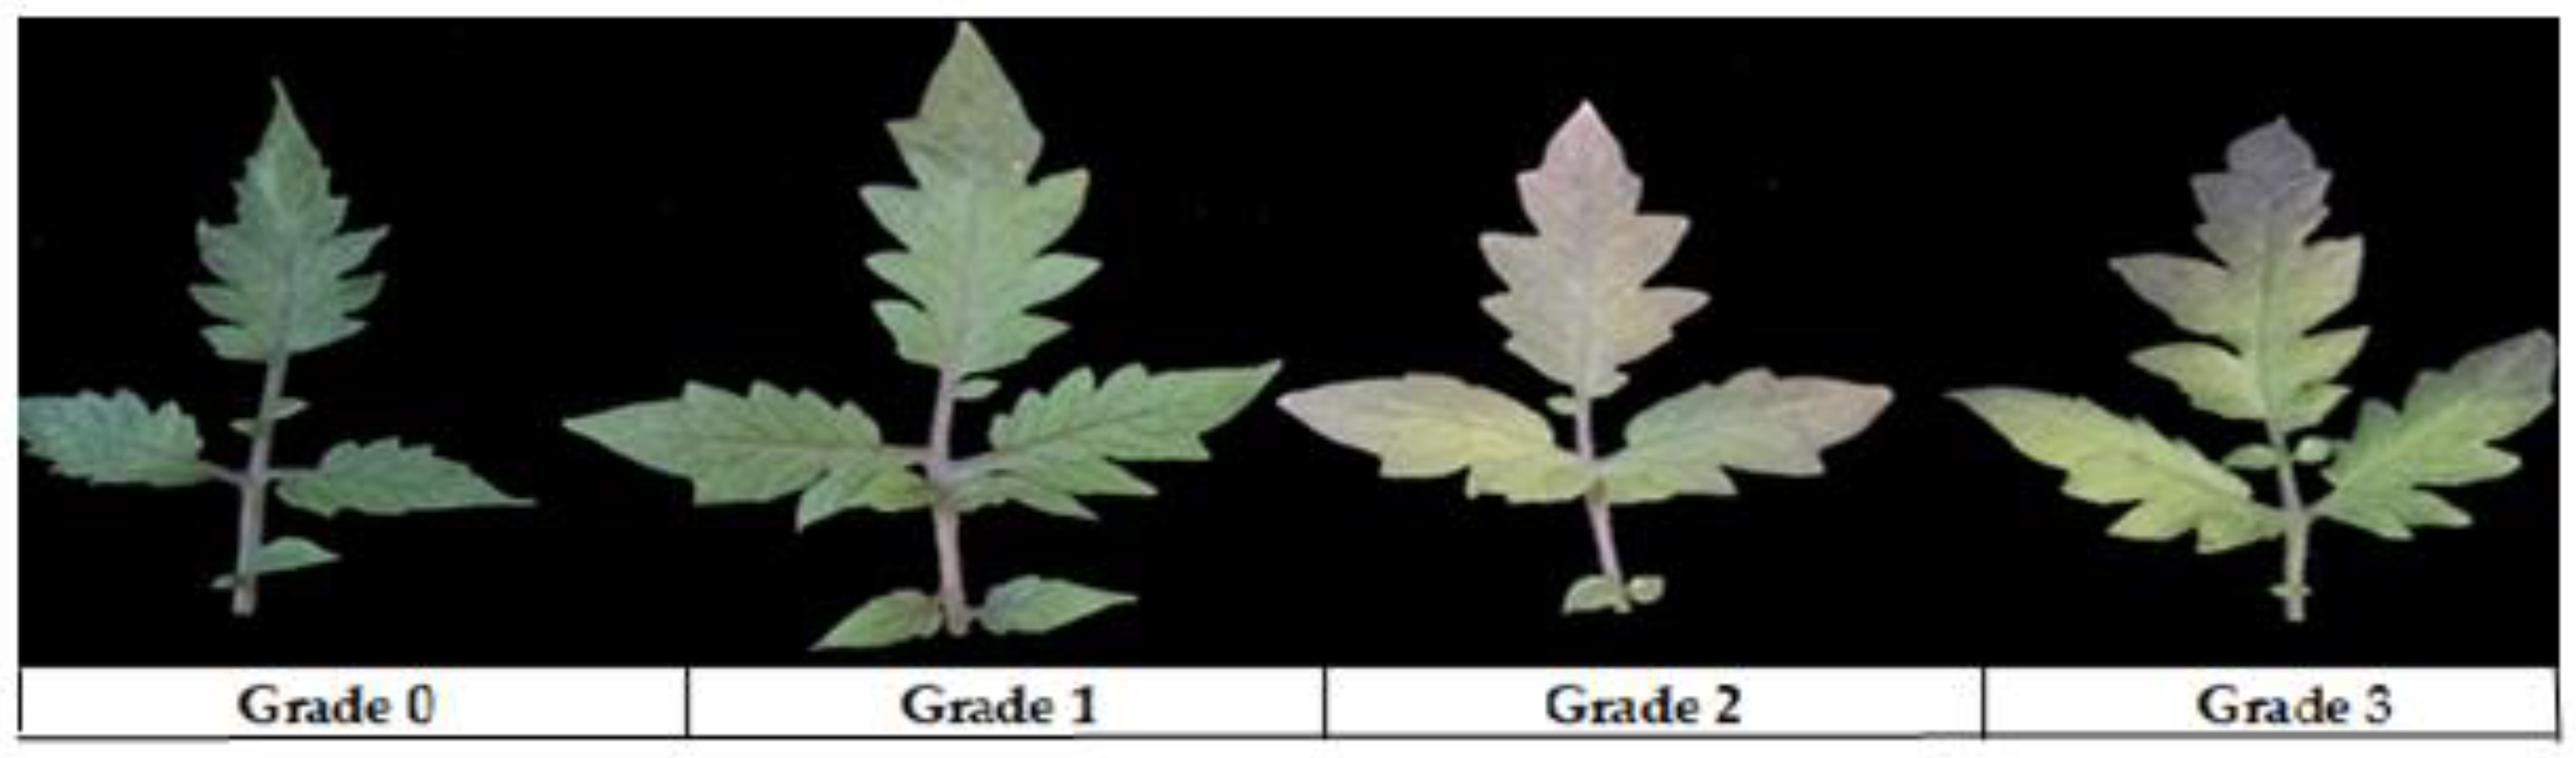
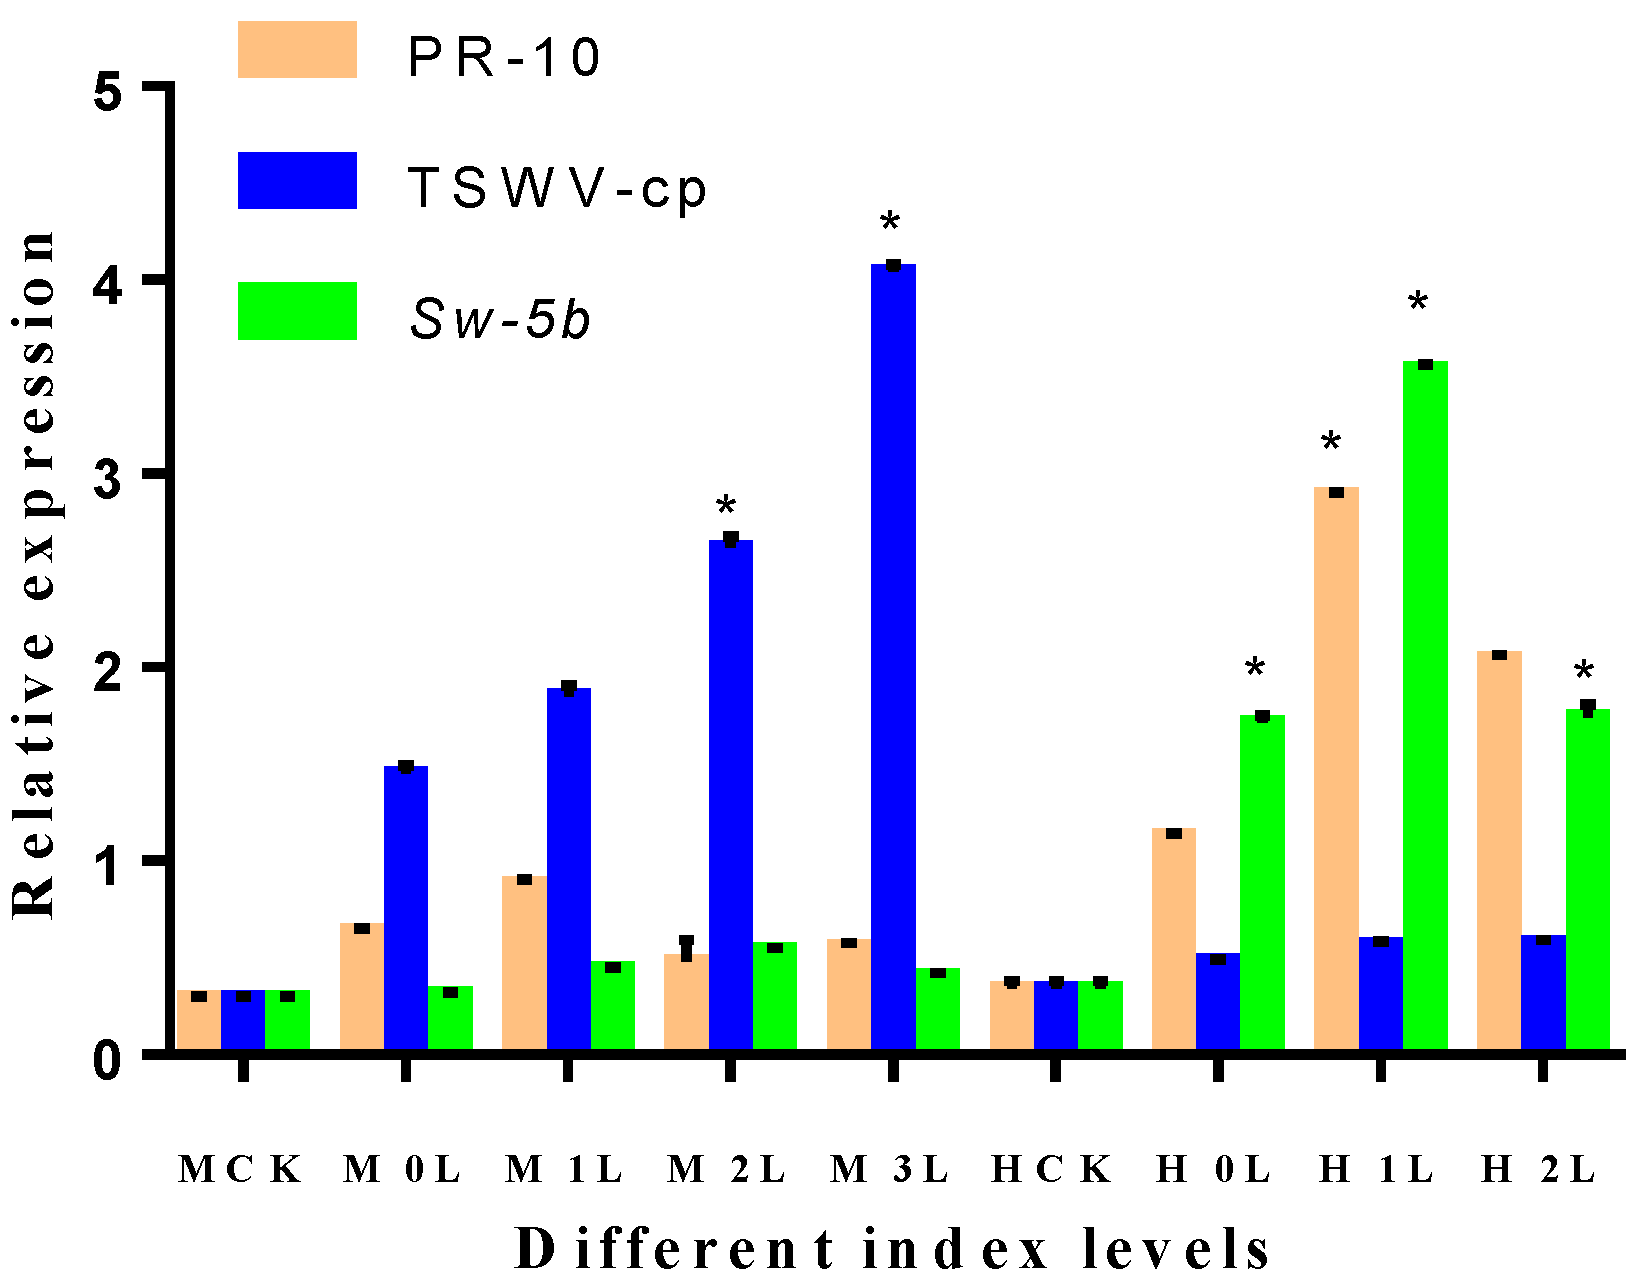
2.11. Expression of Different Index Levels of Leaves in M82 and H8 Plants
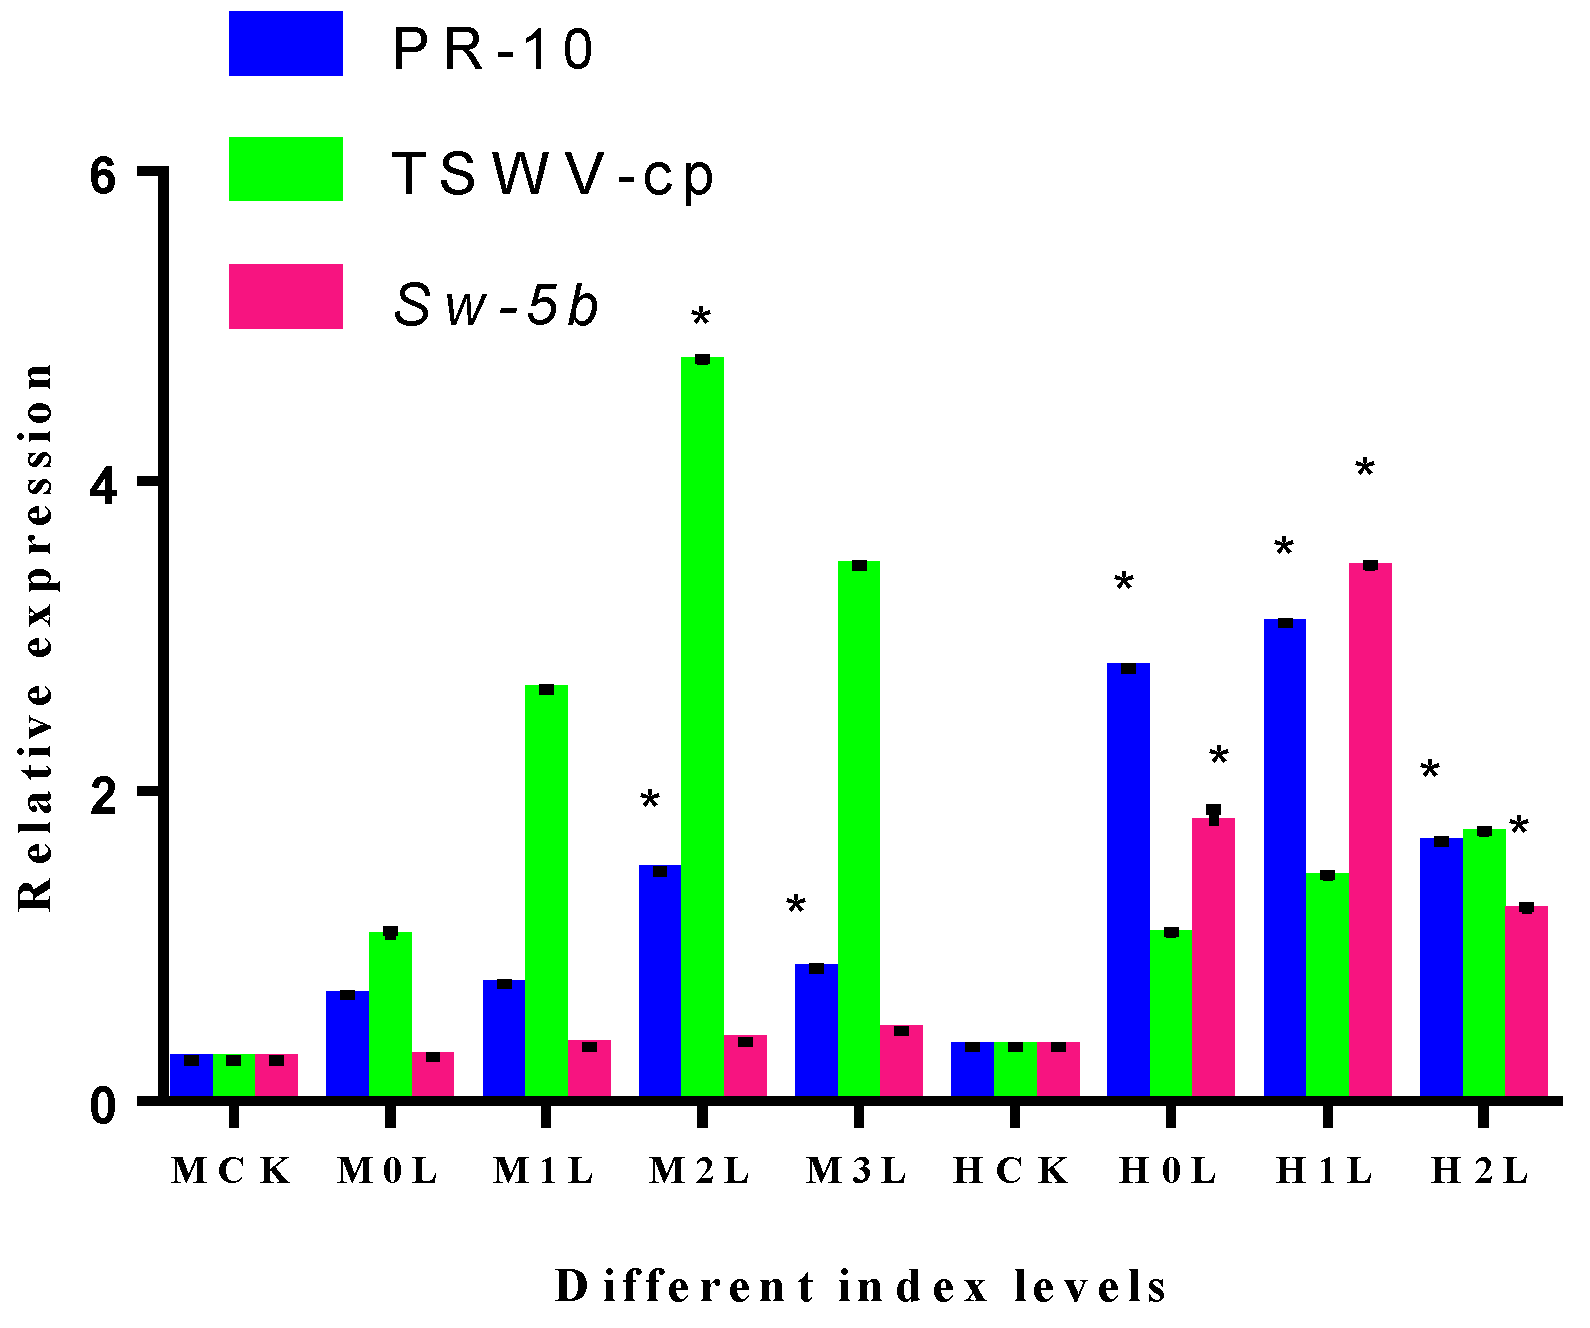
2.12. Expression of Different Index Levels of the Tomato Plants Root
2.13. Correlation between PR-10 and Sw-5b Gene Expression after TSWV Inoculation
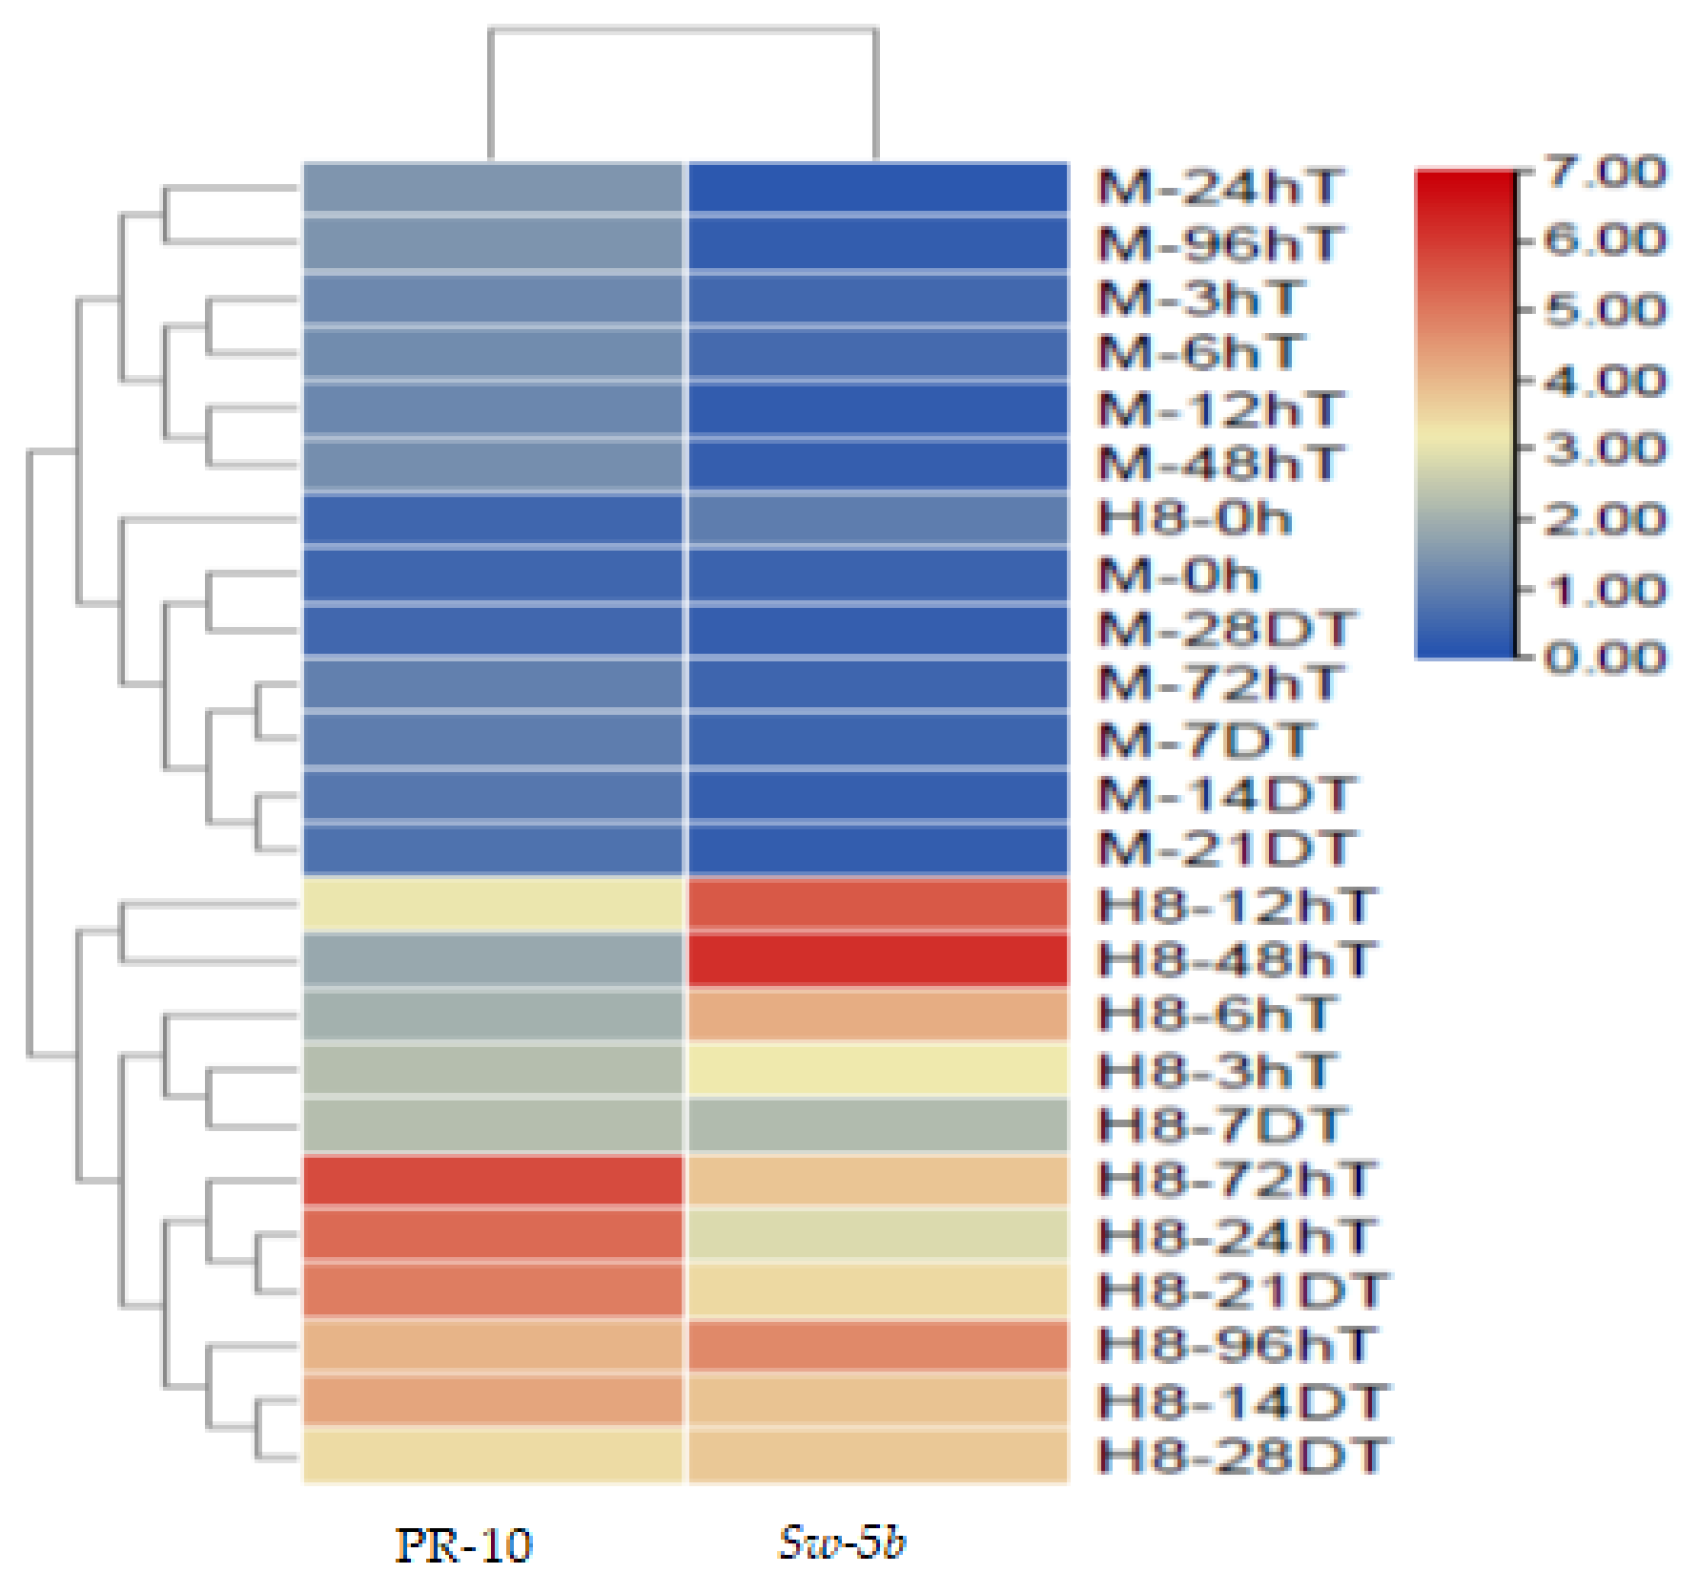
2.14. Heat Map of PR-10 Protein and Sw-5b Gene Expression at Different Time Points
3. Discussion
4. Materials and Methods
4.1. Materials
4.2. Methods
4.2.1. Identification and Sequence Analysis
4.2.2. Phylogenetic Analysis
4.2.3. Gene Structure, Conserved Motifs, and Chromosome Mapping Analysis
4.2.4. GO Analysis
4.2.5. Three-Dimensional Structure of the PR-10 Protein
4.2.6. Transcriptomic Analysis
4.2.7. TSWV Virus Solution Stock Preparation
4.2.8. Plant Materials and Growth Conditions
4.2.9. Virus Inoculation
4.2.10. Treatment and Sampling
4.2.11. Investigation of Incidence Rate and Disease Index
4.2.12. RNA Extraction and qRT-PCR
4.2.13. Statistical Analysis
5. Conclusions
Supplementary Materials
Author Contributions
Funding
Institutional Review Board Statement
Informed Consent Statement
Data Availability Statement
Acknowledgments
Conflicts of Interest
References
- Ali, S.; Mir, Z.A.; Tyagi, A.; Bhat, J.A.; Chandrashekar, N.; Papolu, P.K.; Rawat, S.; Grover, A. Identification and comparative analysis of Brassica juncea pathogenesis-related genes in response to hormonal, biotic and abiotic stresses. Acta Physiol. Plant. 2017, 39, 268. [Google Scholar] [CrossRef]
- Boccardo, N.A.; Segretin, M.E.; Hernandez, I.; Mirkin, F.G.; Chacón, O.; Lopez, Y.; Borrás-Hidalgo, O.; Bravo-Almonacid, F.F. Expression of pathogenesis-related proteins in transplastomic tobacco plants confers resistance to filamentous pathogens under field trials. Sci. Rep. 2019, 9, 2791. [Google Scholar] [CrossRef] [Green Version]
- Sinha, R.K.; Verma, S.S.; Rastogi, A. Role of Pathogen-Related Protein 10 (PR 10) under abiotic and biotic stresses in plants. Phyton 2020, 89, 167. [Google Scholar] [CrossRef]
- Jain, S.; Kumar, A. The pathogenesis related class 10 proteins in plant defense against biotic and abiotic stresses. Adv. Plants Agric. Res. 2015, 3, 00077. [Google Scholar] [CrossRef]
- Hanssen, I.M.; Lapidot, M.; Thomma, B.P. Emerging viral diseases of tomato crops. Mol. Plant Microbe Interact. 2010, 23, 539–548. [Google Scholar] [CrossRef] [PubMed] [Green Version]
- Sevik, M.A.; Arli-Sokmen, M. Estimation of the effect of Tomato spotted wilt virus (TSWV) infection on some yield components of tomato. Phytoparasitica 2012, 40, 87–93. [Google Scholar] [CrossRef]
- Newman, S.; Pottorff, L. Recognizing Tomato Problems; Colorado State University Libraries: Fort Collins, CO, USA, 2013. [Google Scholar]
- Padmanabhan, C.; Ma, Q.; Shekasteband, R.; Stewart, K.S.; Hutton, S.F.; Scott, J.W.; Fei, Z.; Ling, K.-S. Comprehensive transcriptome analysis and functional characterization of PR-5 for its involvement in tomato Sw-7 resistance to tomato spotted wilt tospovirus. Sci. Rep. 2019, 9, 7673. [Google Scholar] [CrossRef]
- Stevens, M.; Lamb, E.; Rhoads, D. Mapping the Sw-5 locus for tomato spotted wilt virus resistance in tomatoes using RAPD and RFLP analyses. Theor. Appl. Genet. 1995, 90, 451–456. [Google Scholar] [CrossRef] [PubMed]
- Spassova, M.I.; Prins, T.W.; Folkertsma, R.T.; Klein-Lankhorst, R.M.; Hille, J.; Goldbach, R.W.; Prins, M. The tomato gene Sw5 is a member of the coiled coil, nucleotide binding, leucine-rich repeat class of plant resistance genes and confers resistance to TSWV in tobacco. Mol. Breed. 2001, 7, 151–161. [Google Scholar] [CrossRef] [Green Version]
- De Oliveira, A.S.; Boiteux, L.S.; Kormelink, R.; Resende, R.O. The Sw-5 gene cluster: Tomato breeding and research toward orthotospovirus disease control. Front. Plant Sci. 2018, 9, 1055. [Google Scholar] [CrossRef]
- Roselló, S.; Díez, M.J.; Nuez, F. Genetics of tomato spotted wilt virus resistance coming from Lycopersicon peruvianum. Eur. J. Plant Pathol. 1998, 104, 499–509. [Google Scholar] [CrossRef]
- Kim, J.-H.; Kim, Y.-S.; Jang, S.-W.; Jeon, Y.-H. Complete genome sequence of Tomato spotted wilt virus from paprika in Korea. Int. J. Phytopathol. 2013, 2, 121–136. [Google Scholar] [CrossRef]
- Gupta, R.; Kwon, S.-Y.; Kim, S.T. An insight into the tomato spotted wilt virus (TSWV), tomato and thrips interaction. Plant Biotechnol. Rep. 2018, 12, 157–163. [Google Scholar] [CrossRef]
- Leventhal, S.S.; Wilson, D.; Feldmann, H.; Hawman, D.W. A Look into Bunyavirales Genomes: Functions of Non-Structural (NS) Proteins. Viruses 2021, 13, 314. [Google Scholar] [CrossRef]
- Hedil, M.; Kormelink, R. Viral RNA silencing suppression: The enigma of bunyavirus NSs proteins. Viruses 2016, 8, 208. [Google Scholar] [CrossRef] [Green Version]
- Guo, Y.; Liu, B.; Ding, Z.; Li, G.; Liu, M.; Zhu, D.; Sun, Y.; Dong, S.; Lou, Z. Distinct mechanism for the formation of the ribonucleoprotein complex of tomato spotted wilt virus. J. Virol. 2017, 91, 23. [Google Scholar] [CrossRef] [Green Version]
- Rybicki, E.P. A Top Ten list for economically important plant viruses. Arch. Virol. 2015, 160, 17–20. [Google Scholar] [CrossRef]
- Adams, M.J.; Lefkowitz, E.J.; King, A.M.; Harrach, B.; Harrison, R.L.; Knowles, N.J.; Kropinski, A.M.; Krupovic, M.; Kuhn, J.H.; Mushegian, A.R. Changes to taxonomy and the International Code of Virus Classification and Nomenclature ratified by the International Committee on Taxonomy of Viruses (2017). Arch. Virol. 2017, 162, 2505–2538. [Google Scholar] [CrossRef]
- Kerényi, Z.; Mérai, Z.; Hiripi, L.; Benkovics, A.; Gyula, P.; Lacomme, C.; Barta, E.; Nagy, F.; Silhavy, D. Inter-kingdom conservation of mechanism of nonsense-mediated mRNA decay. EMBO J. 2008, 27, 1585–1595. [Google Scholar] [CrossRef] [Green Version]
- Anfoka, G.H.; Abhary, M.; Stevens, M.R. Occurrence of Tomato spotted wilt virus (TSWV) in Jordan. EPPO Bull. 2006, 36, 517–522. [Google Scholar] [CrossRef]
- Swoboda, I.; Hoffmann-Sommergruber, K.; O’Ríordáin, G.; Scheiner, O.; Heberle-Bors, E.; Vicente, O. Bet v 1 proteins, the major birch pollen allergens and members of a family of conserved pathogenesis-related proteins, show ribonuclease activity in vitro. Physiol. Plant. 1996, 96, 433–438. [Google Scholar] [CrossRef]
- Hofius, D.; Tsitsigiannis, D.I.; Jones, J.D.; Mundy, J. Inducible Cell Death in Plant Immunity, Seminars in Cancer Biology, 2007; Elsevier: Amsterdam, The Netherlands, 2007; pp. 166–187. [Google Scholar]
- Hammond-Kosack, K.E.; Jones, J. Resistance gene-dependent plant defense responses. Plant Cell 1996, 8, 1773. [Google Scholar] [PubMed] [Green Version]
- Marković-Housley, Z.; Degano, M.; Lamba, D.; von Roepenack-Lahaye, E.; Clemens, S.; Susani, M.; Ferreira, F.; Scheiner, O.; Breiteneder, H. Crystal structure of a hypoallergenic isoform of the major birch pollen allergen Bet v 1 and its likely biological function as a plant steroid carrier. J. Mol. Biol. 2003, 325, 123–133. [Google Scholar] [CrossRef]
- Yu, H.; Zhang, Q.; Sun, P.; Song, C. Impact of droughts on winter wheat yield in different growth stages during 2001–2016 in Eastern China. Int. J. Disaster Risk Sci. 2018, 9, 376–391. [Google Scholar] [CrossRef] [Green Version]
- Takahashi, M.; Shigeto, J.; Izumi, S.; Yoshizato, K.; Morikawa, H. Nitration is exclusive to defense-related PR-1, PR-3 and PR-5 proteins in tobacco leaves. Plant Signal. Behav. 2016, 11, e1197464. [Google Scholar] [CrossRef] [Green Version]
- Tokuriki, N.; Tawfik, D.S. Stability effects of mutations and protein evolvability. Curr. Opin. Struct. Biol. 2009, 19, 596–604. [Google Scholar] [CrossRef]
- Ziadi, S.L.; Poupard, P.; Brisset, M.-N.; Paulin, J.-P.; Simoneau, P. Characterization in apple leaves of two subclasses of PR-10 transcripts inducible by acibenzolar-S-methyl, a functional analogue of salicylic acid. Physiol. Mol. Plant Pathol. 2001, 59, 33–43. [Google Scholar] [CrossRef]
- Olaya, C.; Fletcher, S.J.; Zhai, Y.; Peters, J.; Margaria, P.; Winter, S.; Mitter, N.; Pappu, H.R. The Tomato spotted wilt virus (TSWV) Genome is Differentially Targeted in TSWV-Infected Tomato (Solanum lycopersicum) with or without Sw-5 Gene. Viruses 2020, 12, 363. [Google Scholar] [CrossRef] [Green Version]
- Goldbach, R.; Bucher, E.; Prins, M. Resistance mechanisms to plant viruses: An overview. Virus Res. 2003, 92, 207–212. [Google Scholar] [CrossRef]
- De Oliveira, A.S.; Koolhaas, I.; Boiteux, L.S.; Caldararu, O.F.; Petrescu, A.J.; Oliveira Resende, R.; Kormelink, R. Cell death triggering and effector recognition by Sw-5 SD-CNL proteins from resistant and susceptible tomato isolines to Tomato spotted wilt virus. Mol. Plant Pathol. 2016, 17, 1442–1454. [Google Scholar] [CrossRef] [Green Version]
- Hallwass, M.; De Oliveira, A.S.; de Campos Dianese, E.; Lohuis, D.; Boiteux, L.S.; Inoue-Nagata, A.K.; Resende, R.O.; Kormelink, R. The T omato spotted wilt virus cell-to-cell movement protein (NSM) triggers a hypersensitive response in S w-5-containing resistant tomato lines and in N icotiana benthamiana transformed with the functional S w-5b resistance gene copy. Mol. Plant Pathol. 2014, 15, 871–880. [Google Scholar] [CrossRef] [PubMed]
- Hoffmann, K.; Qiu, W.; Moyer, J. Overcoming host-and pathogen-mediated resistance in tomato and tobacco maps to the M RNA of Tomato spotted wilt virus. Mol. Plant Microbe Interact. 2001, 14, 242–249. [Google Scholar] [CrossRef] [PubMed] [Green Version]
- Ramesh, S.V.; Williams, S.; Kappagantu, M.; Mitter, N.; Pappu, H.R. Transcriptome-wide identification of host genes targeted by tomato spotted wilt virus-derived small interfering RNAs. Virus Res. 2017, 238, 13–23. [Google Scholar] [CrossRef] [PubMed] [Green Version]
- Poltronieri, P.; Brutus, A.; Reca, I.B.; Francocci, F.; Cheng, X.; Stigliano, E. Engineering plant leucine rich repeat-receptors for enhanced pattern-triggered immunity (PTI) and effector-triggered immunity (ETI). In Applied Plant Biotechnology for Improving Resistance to Biotic Stress; Elsevier: Amsterdam, The Netherlands, 2020; pp. 1–31. [Google Scholar]
- Panigrahi, G.K.; Sahoo, A.; Satapathy, K.B. Insights to Plant Immunity: Defense Signaling to Epigenetics. Physiol. Mol. Plant Pathol. 2020, 101568. [Google Scholar] [CrossRef]
- Saile, S.C.; Jacob, P.; Castel, B.; Jubic, L.M.; Salas-Gonzalez, I.; Bäcker, M.; Jones, J.D.; Dangl, J.L.; El Kasmi, F. Two unequally redundant “helper” immune receptor families mediate Arabidopsis thaliana intracellular “sensor” immune receptor functions. PLoS Biol. 2020, 18, e3000783. [Google Scholar] [CrossRef]
- Zhu, M.; Jiang, L.; Bai, B.; Zhao, W.; Chen, X.; Li, J.; Liu, Y.; Chen, Z.; Wang, B.; Wang, C. The intracellular immune receptor Sw-5b confers broad-spectrum resistance to tospoviruses through recognition of a conserved 21-amino acid viral effector epitope. Plant Cell 2017, 29, 2214–2232. [Google Scholar] [CrossRef]
- Li, J.; Huang, H.; Zhu, M.; Huang, S.; Zhang, W.; Dinesh-Kumar, S.P.; Tao, X. A plant immune receptor adopts a two-step recognition mechanism to enhance viral effector perception. Mol. Plant 2019, 12, 248–262. [Google Scholar] [CrossRef] [Green Version]
- Klessig, D.F.; Choi, H.W.; Dempsey, D.M.A. Systemic acquired resistance and salicylic acid: Past, present, and future. Mol. Plant Microbe Interact. 2018, 31, 871–888. [Google Scholar] [CrossRef] [Green Version]
- Zheng, X.; Chen, Y.; Zhao, L.; Chen, Y.; Zheng, L.; Zheng, K.; Mu, Y.; Zhao, X.; Gao, Y.; Zhang, J. Tripartite interactions between jasmonic/salicylic acid pathways, western flower thrips, and thrips-transmitted tomato zonate spot virus infection in Capsicuum annuum. Arthropod Plant Interact. 2019, 13, 289–297. [Google Scholar] [CrossRef]
- Yang, L.; Li, B.; Zheng, X.-y.; Li, J.; Yang, M.; Dong, X.; He, G.; An, C.; Deng, X.W. Salicylic acid biosynthesis is enhanced and contributes to increased biotrophic pathogen resistance in Arabidopsis hybrids. Nat. Commun. 2015, 6, 7309. [Google Scholar] [CrossRef] [Green Version]
- Lee, H.J.; Kim, B.; Bae, C.; Kang, W.-H.; Kang, B.-C.; Yeam, I.; Oh, C.-S. Development of a single-nucleotide polymorphism marker for the Sw-5b gene conferring disease resistance to Tomato spotted wilt virus in tomato. Hortic. Sci. Technol. 2015, 33, 730–736. [Google Scholar] [CrossRef] [Green Version]
- Altschul, S.F.; Madden, T.L.; Schäffer, A.A.; Zhang, J.; Zhang, Z.; Miller, W.; Lipman, D.J. Gapped BLAST and PSI-BLAST: A new generation of protein database search programs. Nucleic Acids Res. 1997, 25, 3389–3402. [Google Scholar] [CrossRef] [PubMed] [Green Version]
- Kumar, S.; Stecher, G.; Li, M.; Knyaz, C.; Tamura, K. MEGA X: Molecular evolutionary genetics analysis across computing platforms. Mol. Biol. Evol. 2018, 35, 1547. [Google Scholar] [CrossRef] [PubMed]
- Mo, Y.; Bao, J.; Zhu, H.; Zhao, K. Advance in research on resistance breeding of tomato against Tomato spotted wilt virus. J. Yunnan Agric. Univ. 2016, 31, 733–737. [Google Scholar]
- Livak, K.J.; Schmittgen, T.D. Analysis of relative gene expression data using real-time quantitative PCR and the 2− ΔΔCT method. Methods 2001, 25, 402–408. [Google Scholar] [CrossRef] [PubMed]


| SL. No. | Chr | Start | END | Strand | Number of Amino Acids | CDS | Molecular Weight | pI | Instability Index | Aliphatic Index | GRAVY | Subcellular Localization |
|---|---|---|---|---|---|---|---|---|---|---|---|---|
| 1 | ch00 | 14,149,228 | 14,151,711 | reverse | 158 | 441 | 18,196.91 | 5.03 | 38.70 | 99.94 | −0.218 | Cytoplasmic |
| 2 | ch00 | 21,749,238 | 21,751,331 | forward | 210 | 633 | 24,401.45 | 5.15 | 43.03 | 86.62 | −0.417 | Cytoplasmic |
| 3 | ch01 | 9,342,757 | 9,343,038 | reverse | 93 | 282 | 11,233.13 | 7.65 | 50.57 | 90.11 | −0.134 | Cytoplasmic |
| 4 | ch01 | 80,454,898 | 80,456,153 | forward | 76 | 231 | 8763.32 | 6.71 | 30.32 | 86.97 | −0.051 | Cytoplasmic |
| 5 | ch03 | 66,611,609 | 66,612,183 | forward | 159 | 480 | 17,608.98 | 5.02 | 32.81 | 82.20 | −0.35 | Cytoplasmic |
| 6 | ch03 | 66,614,237 | 66,614,792 | forward | 159 | 480 | 17,636.95 | 4.90 | 34.90 | 79.12 | −0.401 | Cytoplasmic |
| 7 | ch04 | 455,936 | 457,664 | reverse | 147 | 444 | 16,774.40 | 6.29 | 35.91 | 86.19 | −0.334 | Cytoplasmic |
| 8 | ch04 | 737,430 | 738,426 | forward | 146 | 441 | 16,613.22 | 5.96 | 33.78 | 99.38 | −0.168 | Cytoplasmic |
| 9 | ch04 | 1,363,357 | 1,364,224 | forward | 95 | 288 | 10,838.61 | 9.64 | 21.65 | 109.58 | −0.226 | Cytoplasmic |
| 10 | ch04 | 1,429,473 | 1,430,430 | forward | 147 | 444 | 16,734.98 | 5.59 | 31.71 | 94.76 | −0.318 | Cytoplasmic |
| 11 | ch04 | 1,435,905 | 1,437,368 | forward | 146 | 441 | 16,583.08 | 6.03 | 25.97 | 98.01 | −0.2 | Cytoplasmic |
| 12 | ch04 | 1,456,588 | 1,458,908 | reverse | 147 | 444 | 16,595.16 | 5.96 | 42.21 | 106.05 | −0.162 | Cytoplasmic |
| 13 | ch04 | 1,466,509 | 1,468,357 | forward | 148 | 447 | 17,017.30 | 5.62 | 19.96 | 90.88 | −0.403 | Cytoplasmic |
| 14 | ch04 | 1,474,832 | 1,476,779 | forward | 147 | 444 | 16,824.05 | 5.63 | 17.31 | 88.10 | −0.407 | Cytoplasmic |
| 15 | ch04 | 1,496,628 | 1,497,874 | reverse | 147 | 444 | 16,770.01 | 5.72 | 35.06 | 87.41 | −0.365 | Cytoplasmic |
| 16 | ch04 | 1,505,284 | 1,506,417 | forward | 134 | 405 | 15,762.00 | 5.64 | 56.47 | 92.84 | −0.653 | Cytoplasmic |
| 17 | ch04 | 49,064,622 | 49,065,920 | reverse | 147 | 444 | 17,152.77 | 5.90 | 36.51 | 91.43 | −0.351 | Cytoplasmic |
| 18 | ch05 | 58,320,136 | 58,321,632 | reverse | 150 | 453 | 17,596.99 | 5.22 | 50.34 | 96.00 | −0.467 | Cytoplasmic |
| 19 | ch05 | 58,346,771 | 58,347,729 | reverse | 150 | 453 | 17,698.46 | 5.47 | 51.29 | 86.93 | −0.456 | Cytoplasmic |
| 20 | ch05 | 58,352,298 | 58,352,492 | reverse | 64 | 195 | 7600.66 | 5.18 | 43.07 | 83.75 | −0.502 | Cytoplasmic |
| 21 | ch05 | 58,352,813 | 58,353,016 | reverse | 67 | 204 | 7959.23 | 7.06 | 33.19 | 92.99 | −0.058 | Cytoplasmic |
| 22 | ch05 | 58,415,437 | 58,415,727 | reverse | 96 | 291 | 11,409.16 | 5.04 | 54.80 | 89.38 | −0.431 | Cytoplasmic |
| 23 | ch05 | 58,420,502 | 58,420,723 | reverse | 73 | 222 | 8461.61 | 7.93 | 30.44 | 77.26 | −0.458 | Cytoplasmic |
| 24 | ch05 | 64,304,632 | 64,306,501 | reverse | 162 | 489 | 18,181.90 | 4.78 | 37.17 | 89.63 | −0.188 | Cytoplasmic |
| 25 | ch06 | 1,757,744 | 1,758,229 | forward | 161 | 486 | 17,717.56 | 5.23 | 33.57 | 106.40 | 0.131 | Cytoplasmic |
| 26 | ch07 | 288,360 | 289,609 | reverse | 149 | 450 | 16,770.27 | 4.73 | 25.47 | 99.33 | −0.013 | Cytoplasmic |
| 27 | ch07 | 291,108 | 292,521 | forward | 158 | 477 | 17,981.36 | 5.23 | 37.64 | 87.47 | −0.285 | Cytoplasmic |
| 28 | ch07 | 3,683,904 | 3,685,158 | forward | 159 | 480 | 18,422.81 | 5.31 | 32.72 | 75.91 | −0.613 | Cytoplasmic |
| 29 | ch08 | 26,737,023 | 26,738,299 | reverse | 148 | 447 | 17,074.62 | 6.50 | 16.91 | 88.92 | −0.42 | Cytoplasmic |
| 30 | ch09 | 296,718 | 297,754 | reverse | 148 | 453 | 17,074.62 | 6.50 | 16.91 | 88.92 | −0.42 | Cytoplasmic |
| 31 | ch09 | 301,066 | 301,598 | reverse | 136 | 411 | 15,514.72 | 5.09 | 22.29 | 95.96 | −0.171 | Cytoplasmic |
| 32 | ch09 | 304,321 | 305,404 | reverse | 150 | 453 | 17,083.46 | 4.88 | 28.19 | 96.07 | −0.289 | Cytoplasmic |
| 33 | ch09 | 339,412 | 340,474 | forward | 151 | 456 | 17,425.73 | 5.10 | 40.68 | 94.77 | −0.438 | Cytoplasmic |
| 34 | ch09 | 6,149,317 | 6,151,058 | reverse | 150 | 453 | 17,100.71 | 5.57 | 25.66 | 92.87 | −0.223 | Cytoplasmic |
| 35 | ch09 | 6,153,756 | 6,154,061 | reverse | 101 | 306 | 11,770.43 | 8.44 | 34.15 | 73.27 | −0.716 | Cytoplasmic |
| 36 | ch09 | 6,176,738 | 6,177,747 | reverse | 152 | 459 | 17,414.09 | 5.47 | 24.29 | 88.29 | −0.266 | Cytoplasmic |
| 37 | ch09 | 6,195,377 | 6,197,648 | reverse | 74 | 225 | 8310.73 | 8.80 | 24.74 | 75.00 | −0.176 | Cytoplasmic |
| 38 | ch09 | 6,221,354 | 6,222,253 | reverse | 152 | 459 | 17,423.11 | 5.62 | 31.78 | 90.26 | −0.248 | Cytoplasmic |
| 39 | ch09 | 70,346,085 | 70,347,506 | reverse | 155 | 468 | 17,235.60 | 5.79 | 22.44 | 84.84 | −0.497 | Cytoplasmic |
| 40 | ch09 | 70,350,133 | 70,352,154 | reverse | 160 | 483 | 17,368.77 | 5.44 | 30.62 | 94.38 | −0.128 | Cytoplasmic |
| 41 | ch09 | 70,355,642 | 70,357,036 | reverse | 160 | 483 | 17,914.20 | 5.34 | 32.81 | 88.25 | −0.426 | Cytoplasmic |
| 42 | ch09 | 70,360,338 | 70,361,437 | forward | 155 | 468 | 17,352.86 | 5.67 | 27.16 | 86.06 | −0.389 | Cytoplasmic |
| 43 | ch10 | 2,466,093 | 2,467,665 | reverse | 149 | 450 | 17,272.9 | 8.74 | 25.91 | 72.01 | −0.606 | Cytoplasmic |
| 44 | ch10 | 43,660,724 | 43,661,266 | reverse | 146 | 441 | 16,685.34 | 6.37 | 13.79 | 85.48 | −0.305 | Cytoplasmic |
| 45 | ch12 | 65,664,355 | 65,665,560 | forward | 158 | 477 | 18,196.91 | 5.03 | 38.7 | 99.94 | −0.218 | Cytoplasmic |
| Molecular Functions | Biological Process | Cellular Component |
|---|---|---|
| Protein binding | Immune system process | Cytosol |
| Lipid binding 44.9% | Response to stress 41.4% | Nucleus |
| Lyase activity | Reproduction | Organelle |
| Ion binding | Anatomical structure development | Vacuole |
| Nuclease activity | Cellular nitrogen compound metabolic process | Cytoplasmic-membrane-bounded vesicle |
| Hydrolase activity | Signal transduction | Cytoplasm 17% |
| N/A 28.9% | Cell | |
| Intercellular | ||
| N/A |
| Post Inoculation of TSWV | CK Group | TR Group | ||
|---|---|---|---|---|
| cv. M82 (Sensitive) | cv. H8 (Resistant) | cv. M82 (Sensitive) | cv. H8 (Resistant) | |
| 14 days | 10.0% c 5.3 d | 3.33% c 0.0 e | 16.67% c 12.5 d | 10.0% c 3.0 f |
| 21 days | 26.67% b 46.66 b | 10.0% c 5.4 d | 36.67% b 52.3 b | 10.0% c 8.3 e |
| 28 days | 40.0% a 58.88 a | 26.66% b 14.0 c | 100% a 88.88 a | 33.33% c 18.33 c |
| Grade Series | TSWV Symptoms |
|---|---|
| 0 | Asymptomatic |
| 1 | Leaves are less obvious bronze (black) small spots |
| 2 | Bronze (black) necrosis spots spread in small area of leaves |
| 3 | Plant leaves on the film even into pieces, nearly 2/3 leaf area dry necrosis |
| 4 | Whole plant necrosis |
| Index | CK | 3 h | 6 h | 12 h | 24 h | 48 h | 72 h | 96 h | 7 D | 14 D | 21 D | 28 D |
|---|---|---|---|---|---|---|---|---|---|---|---|---|
| TR | 1.000 | |||||||||||
| 3 h | 0.495 | 1.000 | ||||||||||
| 6 h | 0.550 | 0.926 ** | 1.000 | |||||||||
| 12 h | 0.460 | 0.952 ** | 0.960 ** | 1.000 | ||||||||
| 24 h | 0.123 | 0.692 ** | 0.489 | 0.606 ** | 1.000 | |||||||
| 48 h | 0.516 | 0.850 ** | 0.959 ** | 0.923 ** | 0.341 | 1.000 | ||||||
| 72 h | 0.154 | 0.764 ** | 0.590 ** | 0.713 ** | 0.975 ** | 0.456 | 1.000 | |||||
| 96 h | 0.363 | 0.869 ** | 0.853 ** | 0.902 ** | 0.785 ** | 0.820 ** | 0.841 ** | 1.000 | ||||
| 7 D | 0.314 | 0.839 ** | 0.847 ** | 0.820 ** | 0.527 | 0.822 ** | 0.602 ** | 0.777 ** | 1.000 | |||
| 14 D | 0.322 | 0.821 ** | 0.799 ** | 0.752 ** | 0.480 | 0.717 ** | 0.565 | 0.636 ** | 0.926 ** | 1.000 | ||
| 21 D | 0.200 | 0.616 ** | 0.651 ** | 0.659 ** | 0.479 | 0.720 ** | 0.545 | 0.782 ** | 0.799 ** | 0.672 * | 1.000 | |
| 28 D | 0.323 | 0.581 ** | 0.718 ** | 0.675 ** | 0.374 | 0.772 ** | 0.447 | 0.777 ** | 0.715 ** | 0.587 * | 0.923 ** | 1.000 |
Publisher’s Note: MDPI stays neutral with regard to jurisdictional claims in published maps and institutional affiliations. |
© 2022 by the authors. Licensee MDPI, Basel, Switzerland. This article is an open access article distributed under the terms and conditions of the Creative Commons Attribution (CC BY) license (https://creativecommons.org/licenses/by/4.0/).
Share and Cite
Islam, M.M.; Qi, S.; Zhang, S.; Amin, B.; Yadav, V.; El-Sappah, A.H.; Zhang, F.; Liang, Y. Genome-Wide Identification and Functions against Tomato Spotted Wilt Tospovirus of PR-10 in Solanum lycopersicum. Int. J. Mol. Sci. 2022, 23, 1502. https://doi.org/10.3390/ijms23031502
Islam MM, Qi S, Zhang S, Amin B, Yadav V, El-Sappah AH, Zhang F, Liang Y. Genome-Wide Identification and Functions against Tomato Spotted Wilt Tospovirus of PR-10 in Solanum lycopersicum. International Journal of Molecular Sciences. 2022; 23(3):1502. https://doi.org/10.3390/ijms23031502
Chicago/Turabian StyleIslam, Md. Monirul, Shiming Qi, Shijie Zhang, Bakht Amin, Vivek Yadav, Ahmed H. El-Sappah, Fei Zhang, and Yan Liang. 2022. "Genome-Wide Identification and Functions against Tomato Spotted Wilt Tospovirus of PR-10 in Solanum lycopersicum" International Journal of Molecular Sciences 23, no. 3: 1502. https://doi.org/10.3390/ijms23031502