Article

Shikimate Kinase Plays Important Roles in Anthocyanin Synthesis in Petunia

Guangdong Key Laboratory for Innovative Development and Utilization of Forest Plant Germplasm, College of Forestry and Landscape Architecture, South China Agricultural University, Guangzhou 510642, China
*
Authors to whom correspondence should be addressed.
Int. J. Mol. Sci. 2022, 23(24), 15964; https://doi.org/10.3390/ijms232415964
Submission received: 2 November 2022 / Revised: 4 December 2022 / Accepted: 13 December 2022 / Published: 15 December 2022
(This article belongs to the Special Issue Advances in Research for Ornamental Plants Breeding)

Abstract

:
In plants, the shikimate pathway is responsible for the production of aromatic amino acids L-tryptophan, L-phenylalanine, and L-tyrosine. L-Phenylalanine is the upstream substrate of flavonoid and anthocyanin synthesis. Shikimate kinase (SK) catalyzes the phosphorylation of the C3 hydroxyl group of shikimate to produce 3-phosphate shikimate (S3P), the fifth step of the shikimate pathway. However, whether SK participates in flavonoid and anthocyanin synthesis is unknown. This study characterized the single-copy PhSK gene in the petunia (Petunia hybrida) genome. PhSK was localized in chloroplasts. PhSK showed a high transcription level in corollas, especially in the coloring stage of flower buds. Suppression of PhSK changed flower color and shape, reduced the content of anthocyanins, and changed the flavonoid metabolome profile in petunia. Surprisingly, PhSK silencing caused a reduction in the shikimate, a substrate of PhSK. Further qPCR analysis showed that PhSK silencing resulted in a reduction in the mRNA level of PhDHQ/SDH, which encodes the protein catalyzing the third and fourth steps of the shikimate pathway, showing a feedback regulation mechanism of gene expression in the shikimate pathway.

1. Introduction

In plants, the shikimate pathway provides carbon skeletons for the aromatic amino acids (AAAs) L-tryptophan, l-phenylalanine, and Ltyrosine, which can be turned into an array of aromatic secondary metabolites, such as flavonoids, alkaloids, and lignins, and is a bridge between carbohydrate metabolism and protein metabolism [1,2]. It uses erythrose-4-phosphate (E4P) and phosphoenolpyruvate (PEP), the intermediate products of the pentose phosphate pathway and glycolysis pathway, to synthesize chorismate under the catalysis of six key enzymes through seven steps of catalytic reaction [2,3,4]. Genes involved in this pathway have been identified and isolated in microorganisms, fungi, and plants. The six key enzymes are as follows: 3-deoxy-D-arabino-heptulosonate 7-phosphate synthase (DAHPS), 3-dehydroquinate synthase (DHQS), 3-dehydroquinate dehydratase (DHQ)–shikimate dehydrogenase (SDH), shikimate kinase (SK), 5-enolpyruvylshikimate 3-phosphate synthase (EPSPS), and chorismate synthase (CS) (Figure S1) [5].
In plants, several studies have reported the function of some genes of the shikimate pathway. Injury, pathogen invasion, and environmental stress could increase the expression of DAHPS in plants, and its overexpression could enhance the resistance of plants to the environment [6,7,8,9]. In Arabidopsis thaliana, DHQS expression was not well correlated to phenylpropanoid production [10]. Silencing of NtDHQ/SHD-1 caused growth inhibition and a reduction in AAAs in tobacco [11]. EPSPS, as the target enzyme of herbicides, has been well studied in Arabidopsis [12], Lolium perenne [13], and tobacco [14]. The first cloned plant CS gene came from Euglena gracilis (Schaller et al., 1991), and petunia (Petunia hybrida) PhCS silencing resulted in growth inhibition, flower deformity, and whitening [15].
In Escherichia coli, SK has two isozymes, AroL and AroK. AroL is common in prokaryotes [16,17,18,19]. However, in yeast and fungi, SK is a domain of the multifunctional enzyme AROM, which catalyzes DAHP to generate EPSP directly [20,21]. Among higher plants, the LeSK gene of tomato (Lycopersicon esculentum) was isolated first in 1992. The nitrogen end of the LeSK protein contained a chloroplast transport peptide. Its amino acid sequence is very similar to that of the bacterial SK protein, and LeSK had catalytic activity in the process of plant tissue culture. Synthesized LeSK is transported to chloroplast and processed to be an active mature protein [22]. The rice (Oryza sativa) genome contains three SK genes, OsSK1, OsSK2, and OsSK3, and three OsSKs were all localized in the chloroplast [23]. Arabidopsis genome had two SK genes, AtSK1 and AtSK2 [24]. The same as ATP-driven enzymes, the activity of SK isolated from spinach (Spinacia oleracea) was regulated by the energy level of cells [25]. SK is necessary for the biosynthesis of EPSP with shikimate as the substrate because it is the only known enzyme that is capable of phosphorylating the C3 hydroxyl group of shikimate to produce 3-phosphate shikimate (S3P) [8].
Anthocyanins are flavonoid pigments and play important roles in reproduction and protection against various abiotic and biotic stresses [26]. Anthocyanins are primarily generated in the cytoplasm and endoplasmic reticulum before being transferred to vacuoles for storage and accumulation [27,28]. Phenylalanine is the upstream substrate of anthocyanin synthesis (Figure S1). Under the catalysis of three key enzymes, phenylalanine is converted to 4-coumarinyl-CoA, the precursor of anthocyanin synthesis [29]. However, whether SK participates in flavonoid and anthocyanin synthesis is unknown.
In this study, a single-copy PhSK was characterized in the petunia genome, and PhSK was localized in chloroplasts. Among the examined organs, PhSK had the highest expression in corollas. Suppression of PhSK changed flower color and shape, reduced the content of anthocyanins, and changed the flavonoid metabolome profile in petunia. In addition, PhSK silencing caused a reduction in the shikimate, a substrate of PhSK.

2. Results

2.1. Isolation and Sequence Analyses of PhSK

We used cDNA sequences of AtSK1 (accession no. NM_201778.3) and AtSK2 (accession no. NM_202986.2) from Arabidopsis as the query in BLAST and searched the Petunia axillaris draft genome sequence v1.6.2 (https://solgenomics.net/organism/Petunia_axillaris/genome, accessed on 1 November 2022), and only one petunia SK, PhSK, was recovered. We further searched several previously published petunia transcriptomes [30,31,32], and still, only one PhSK was recovered. The same full-length PhSK cDNA sequence was obtained from petunia ‘Ultra’. PhSK encodes a putative 283-amino-acid protein with a predicted molecular weight of 31.9 kDa.
Eight mRNA sequences of SKs from five plant species, petunia PhSK (Peaxi162Scf00359g00118.1), Solanum lycopersicum SlSK (Solyc04g051860.3.1, https://solgenomics.net/organism/Solanum_lycopersicoides/genome, accessed on 1 November 2022), Arabidopsis AtSK1 and AtSK2, Oryza sativa OsSK1 (NM_001401978.1), OsSK2 (XP_015641676.1) and OsSK3 (XP_015636368.1), and Vitis vinifera VvSK (NM_001281087.1), were obtained. The CDS size of the eight SKs was similar, ranging from 852 bp to 927 bp. As shown in Figure S2, the size of nuclear gene sequences of the eight SKs ranged from 2178 bp to 7371 bp, among which AtSK2 was the smallest and SlSK is the largest. The number of introns in eight SKs varied from 7 to 9 (Figure S2).
Multiple sequence alignments of the SKs of petunia, Nicotiana tabacum, S. lycopersicum, Arabidopsis, O. sativa, and E. coli are shown in Figure S3. The SK amino acid sequences in the plant showed high similarity. The deduced amino acid sequence of PhSK had 85.7%, 89.0%, 67.3%, 64.1%, 57.6%, 55.9%, 64.7%, 30.7%, and 32.7% identities with NtSK (NP_001312965.1), SlSK (NP_001234112.1), AtSK1 (NP_001077936.1), AtSK2 (NP_195664.2), OsSK1 (XP_015626759.1), OsSK2 (XP_015641676.1), OsSK3 (XP_015636368.1), AroL (WP_000193393.1), and AroK (WP_000818618.1), respectively. In addition, the N-terminal and C-terminal regions of these SKs showed low similarity, while the middle region showed high similarity.
As a member of the nucleoside monophosphate kinase (NMP) family, PhSK is characterized by its Walker A-motif, Walker B-motif, LID domain, and shikimate-binding domain, as shown in Figure S3. The 111th to 118th amino acids of PhSK are Walker A-motif, which has the conserved sequence G-X-X-G-X-G-K-T/S for forming the P-ring to bind the β-Phosphate group of nucleotides. The 178th to 183rd amino acids of PhSK are Walker B-motif, which has the consensus sequences V-X-A/S-T-G-G for binding nucleotides. The 214th to 229th amino acids of PhSK are the LID domain of SK-binding ATP. The 135th to 164th amino acids of PhSK are the shikimate-binding domain, which binds shikimate [33,34,35].
To elucidate the evolutionary relationship among SK proteins in plants, a phylogenetic tree was constructed from SK amino acid sequences of E. coli and 12 species of plants using the TBtools software. The phylogenetic analysis showed that plant SKs belong to a small family, generally including one to three members (Figure S4).

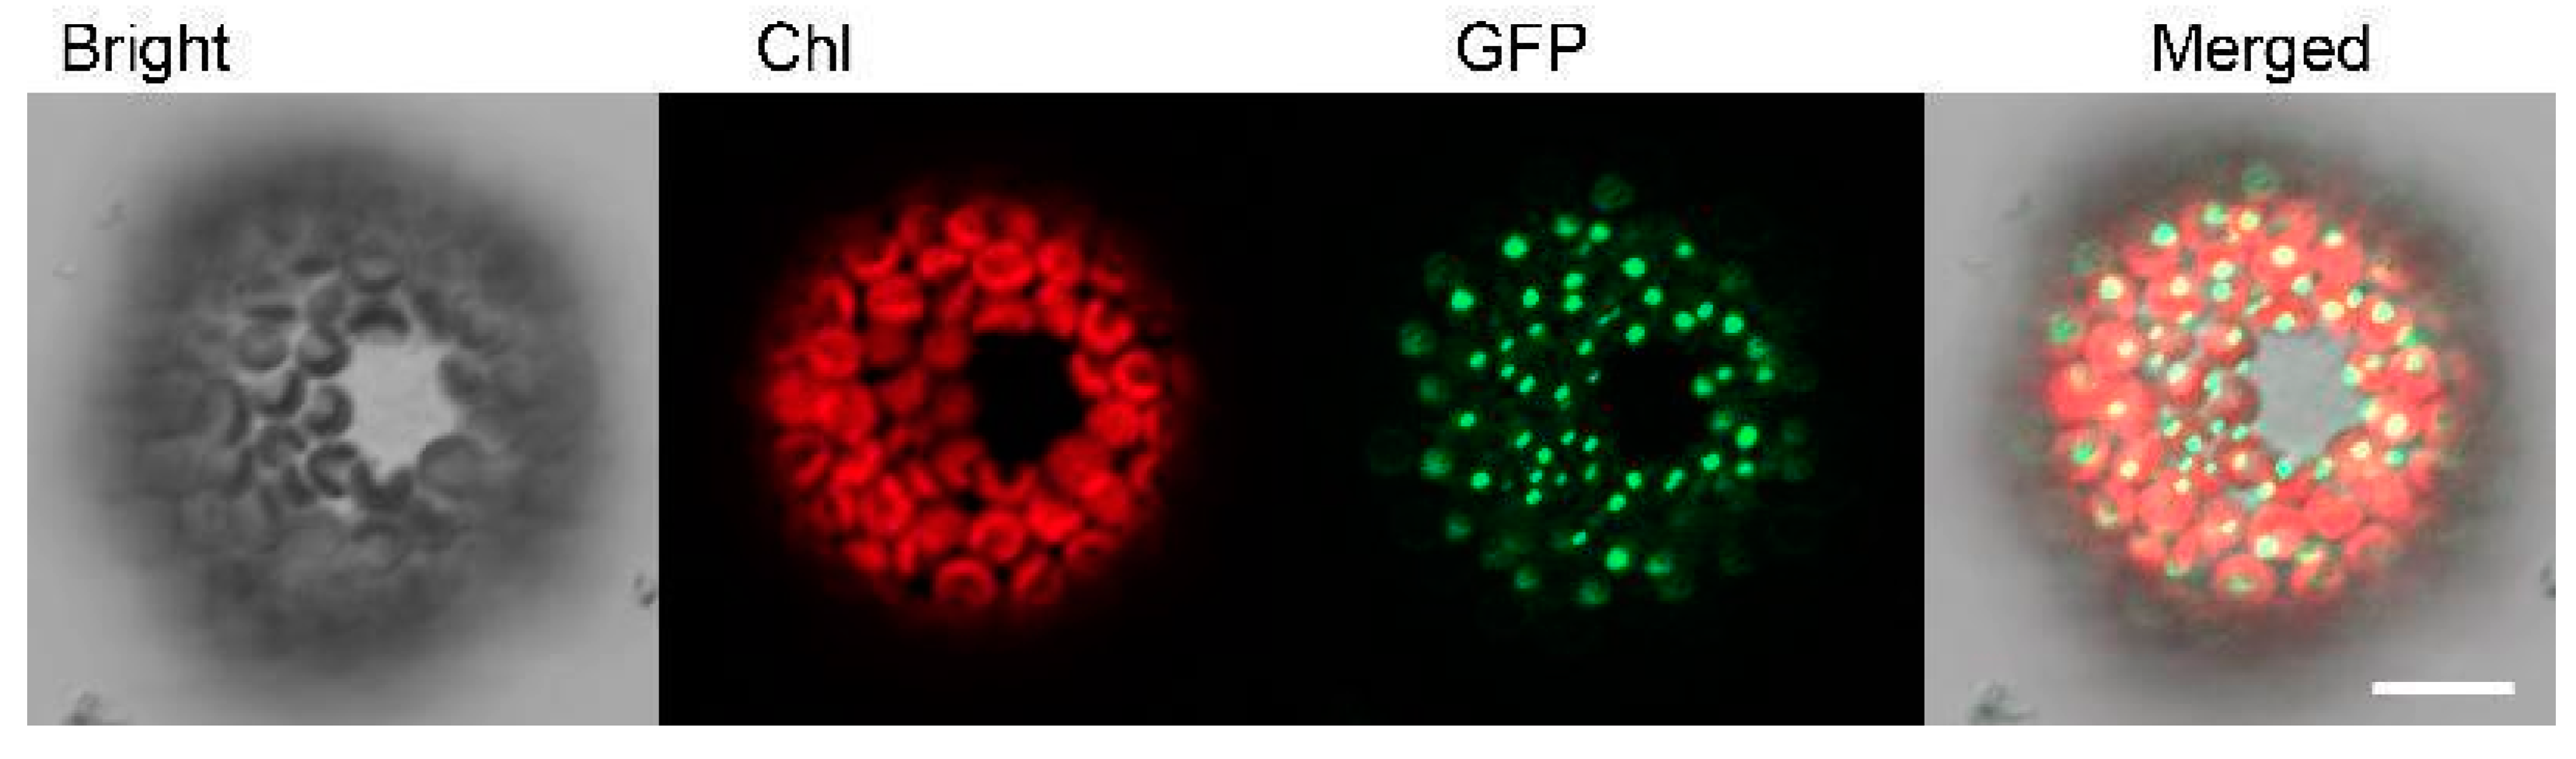
2.2. PhSK Protein Localization in Chloroplasts

In order to determine the subcellular localization of PhSK in plant cells, green fluorescent protein (GFP) was fused to the full-length C-terminal of PhSK to create a pSAT-PhSK-GFP vector, which was then transferred to petunia leaf protoplasts. Fluorescent signals were only detected in chloroplasts by confocal microscopy after incubation for 16–24 h. The results showed that PhSK protein was localized in chloroplasts (Figure 1).

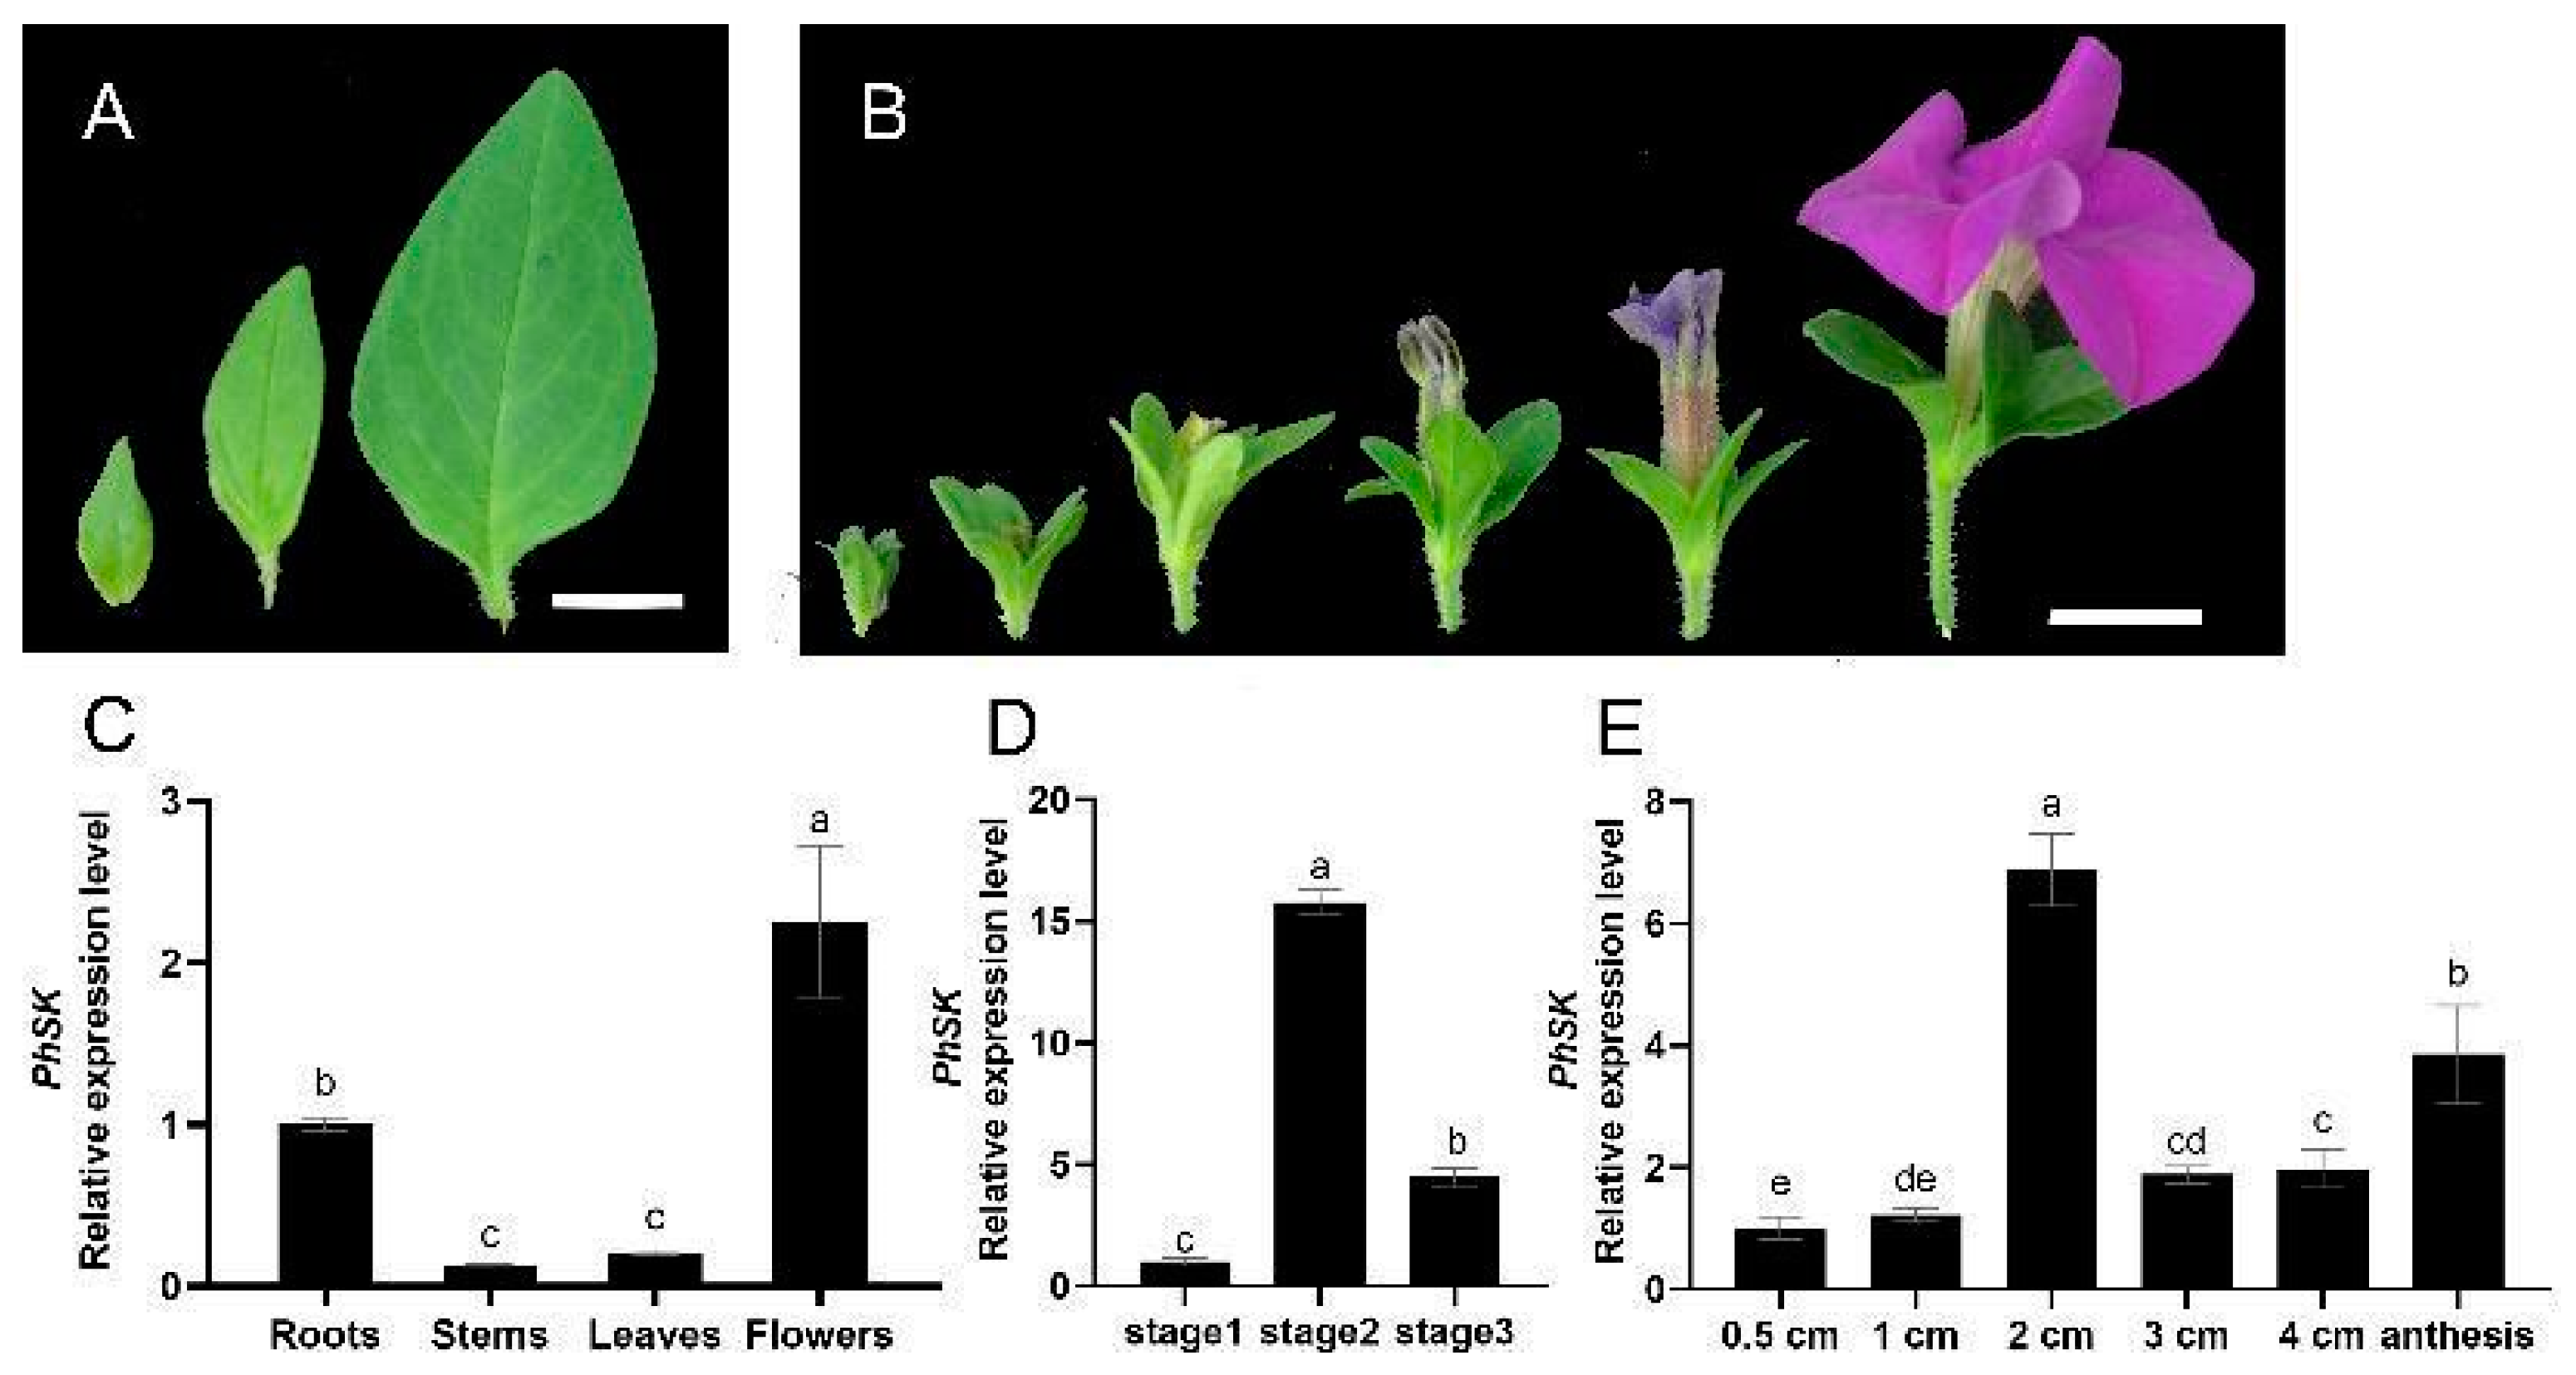
2.3. PhSK Expression

The expression of PhSK in different plant organs and in different stages of flower or leaf development was examined by quantitative RT-PCR (qPCR). The transcription level of PhSK was the highest in corollas and the lowest in stems. During leaf growth, the expression of PhSK first increased and then decreased. When the flower bud length was 2 cm, PhSK expression reached the peak, then decreased, and then increased again during flower development (Figure 2).

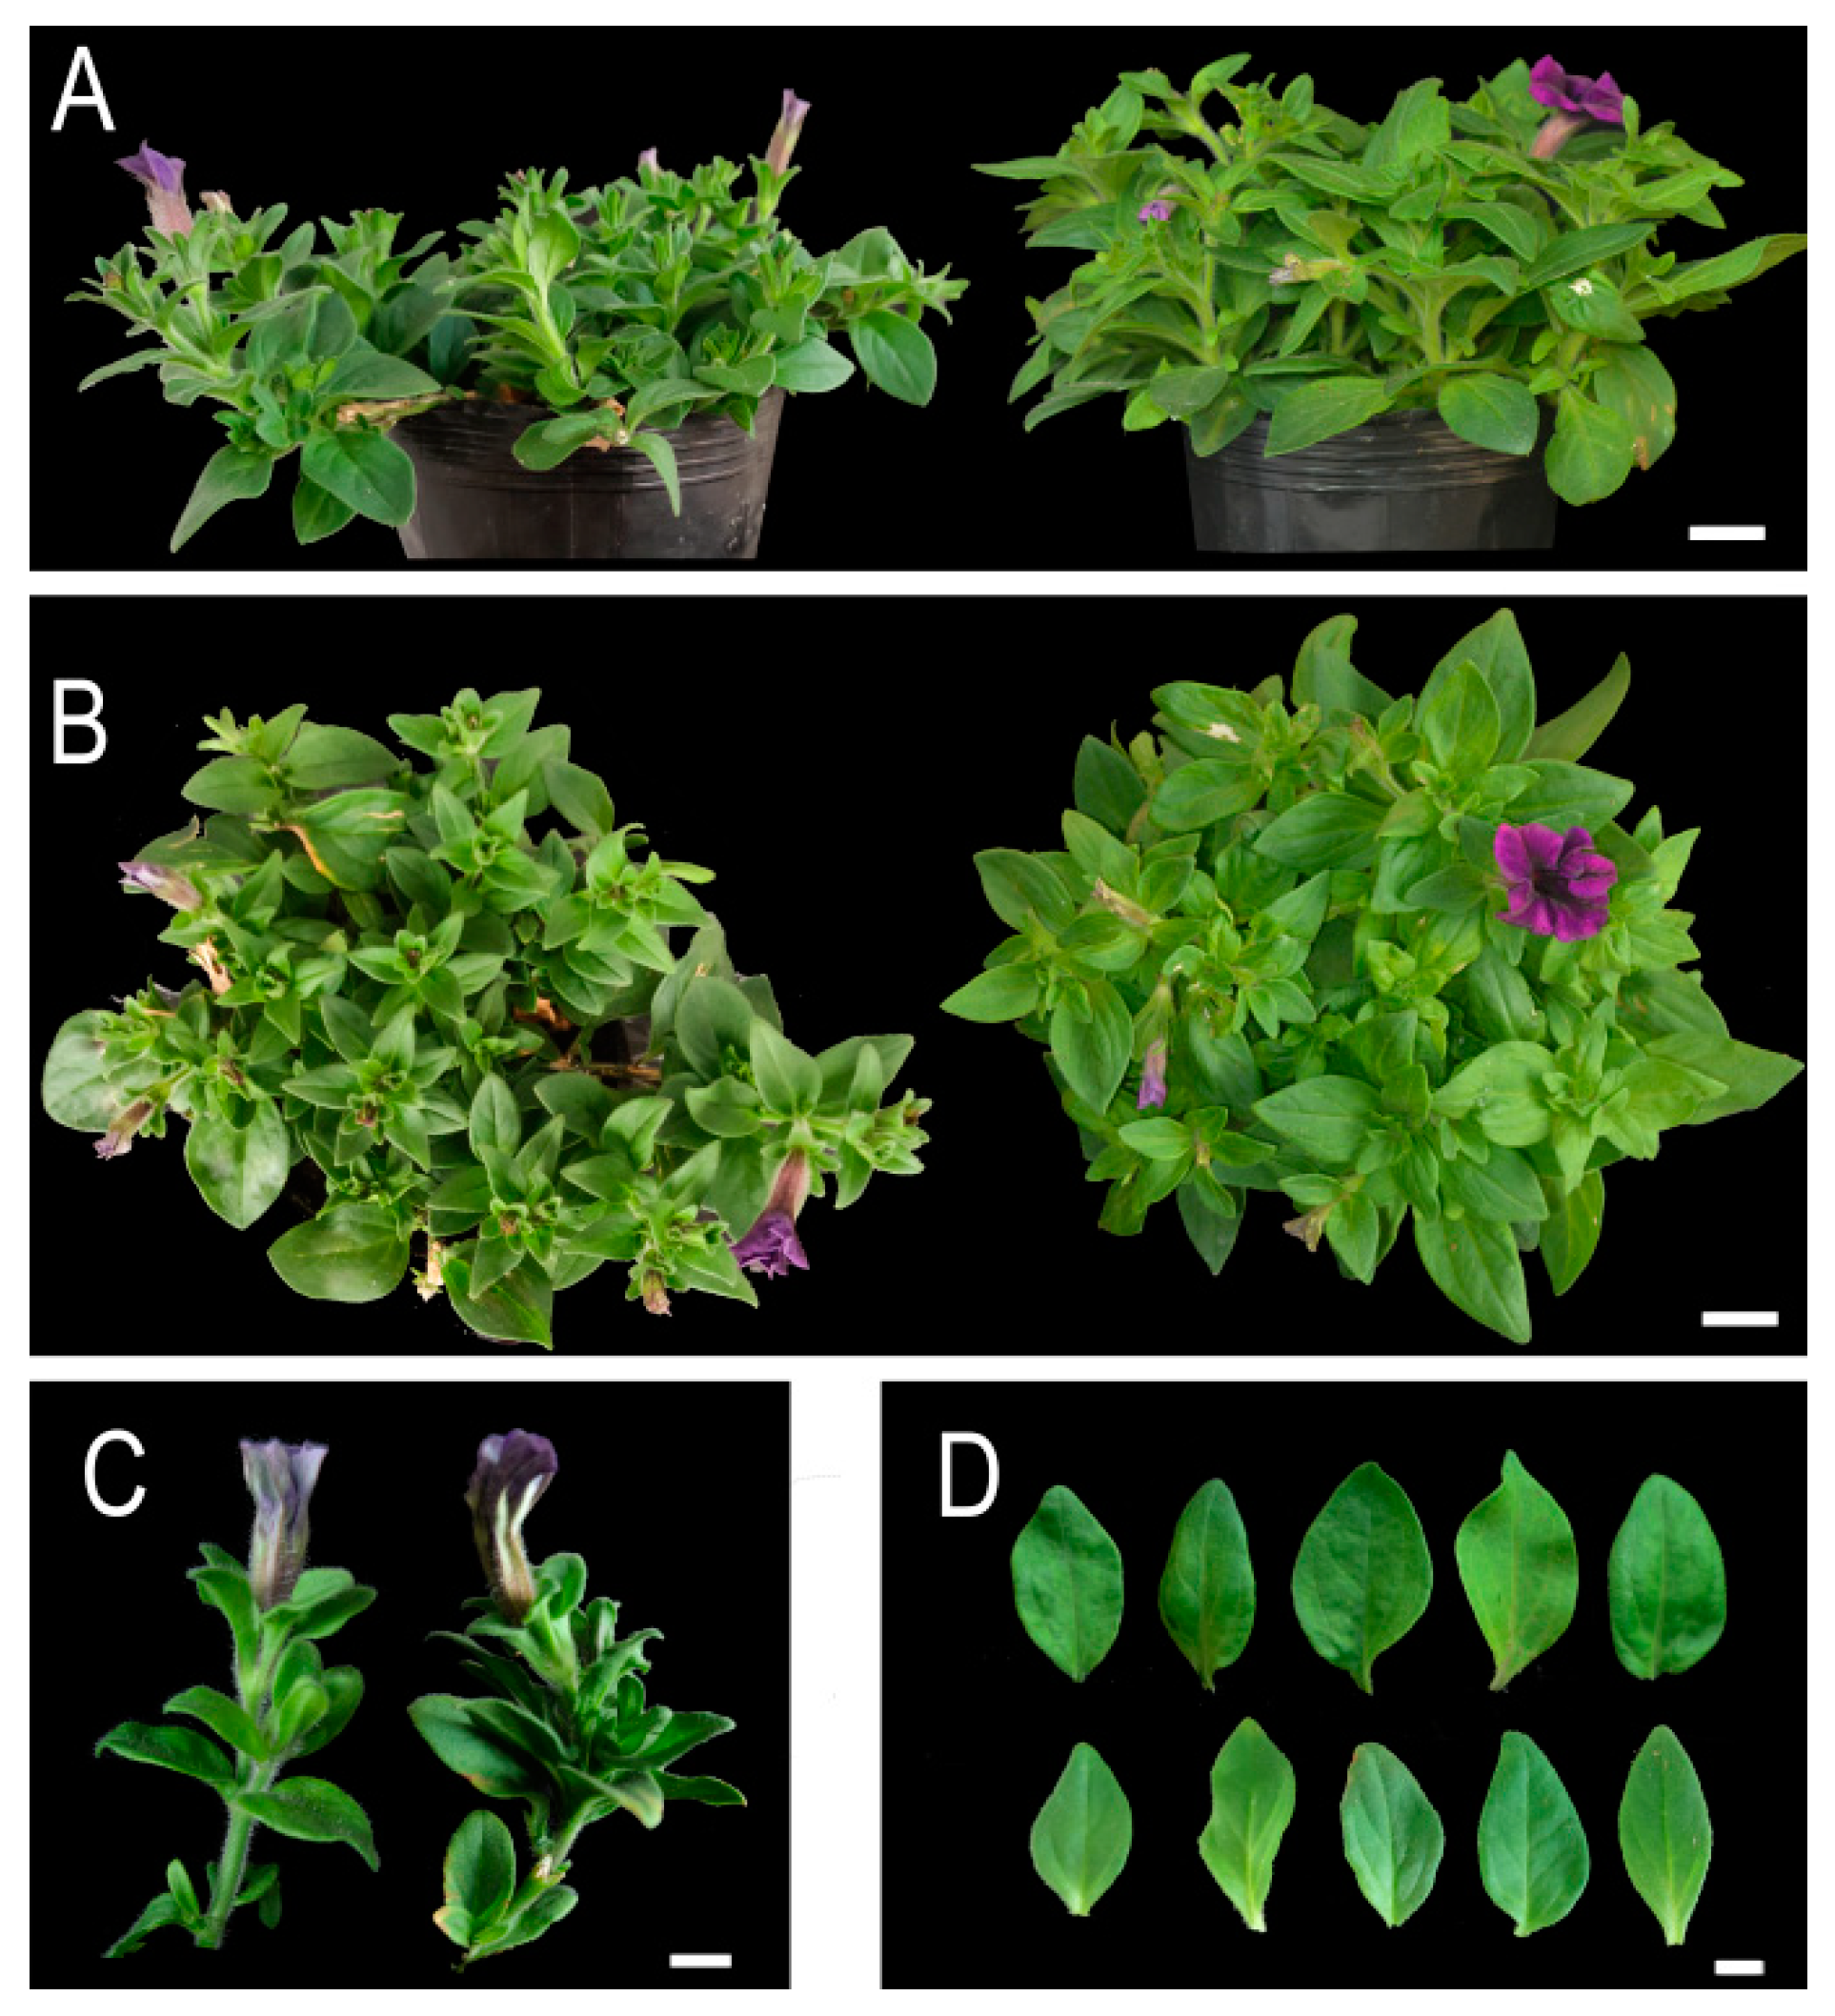
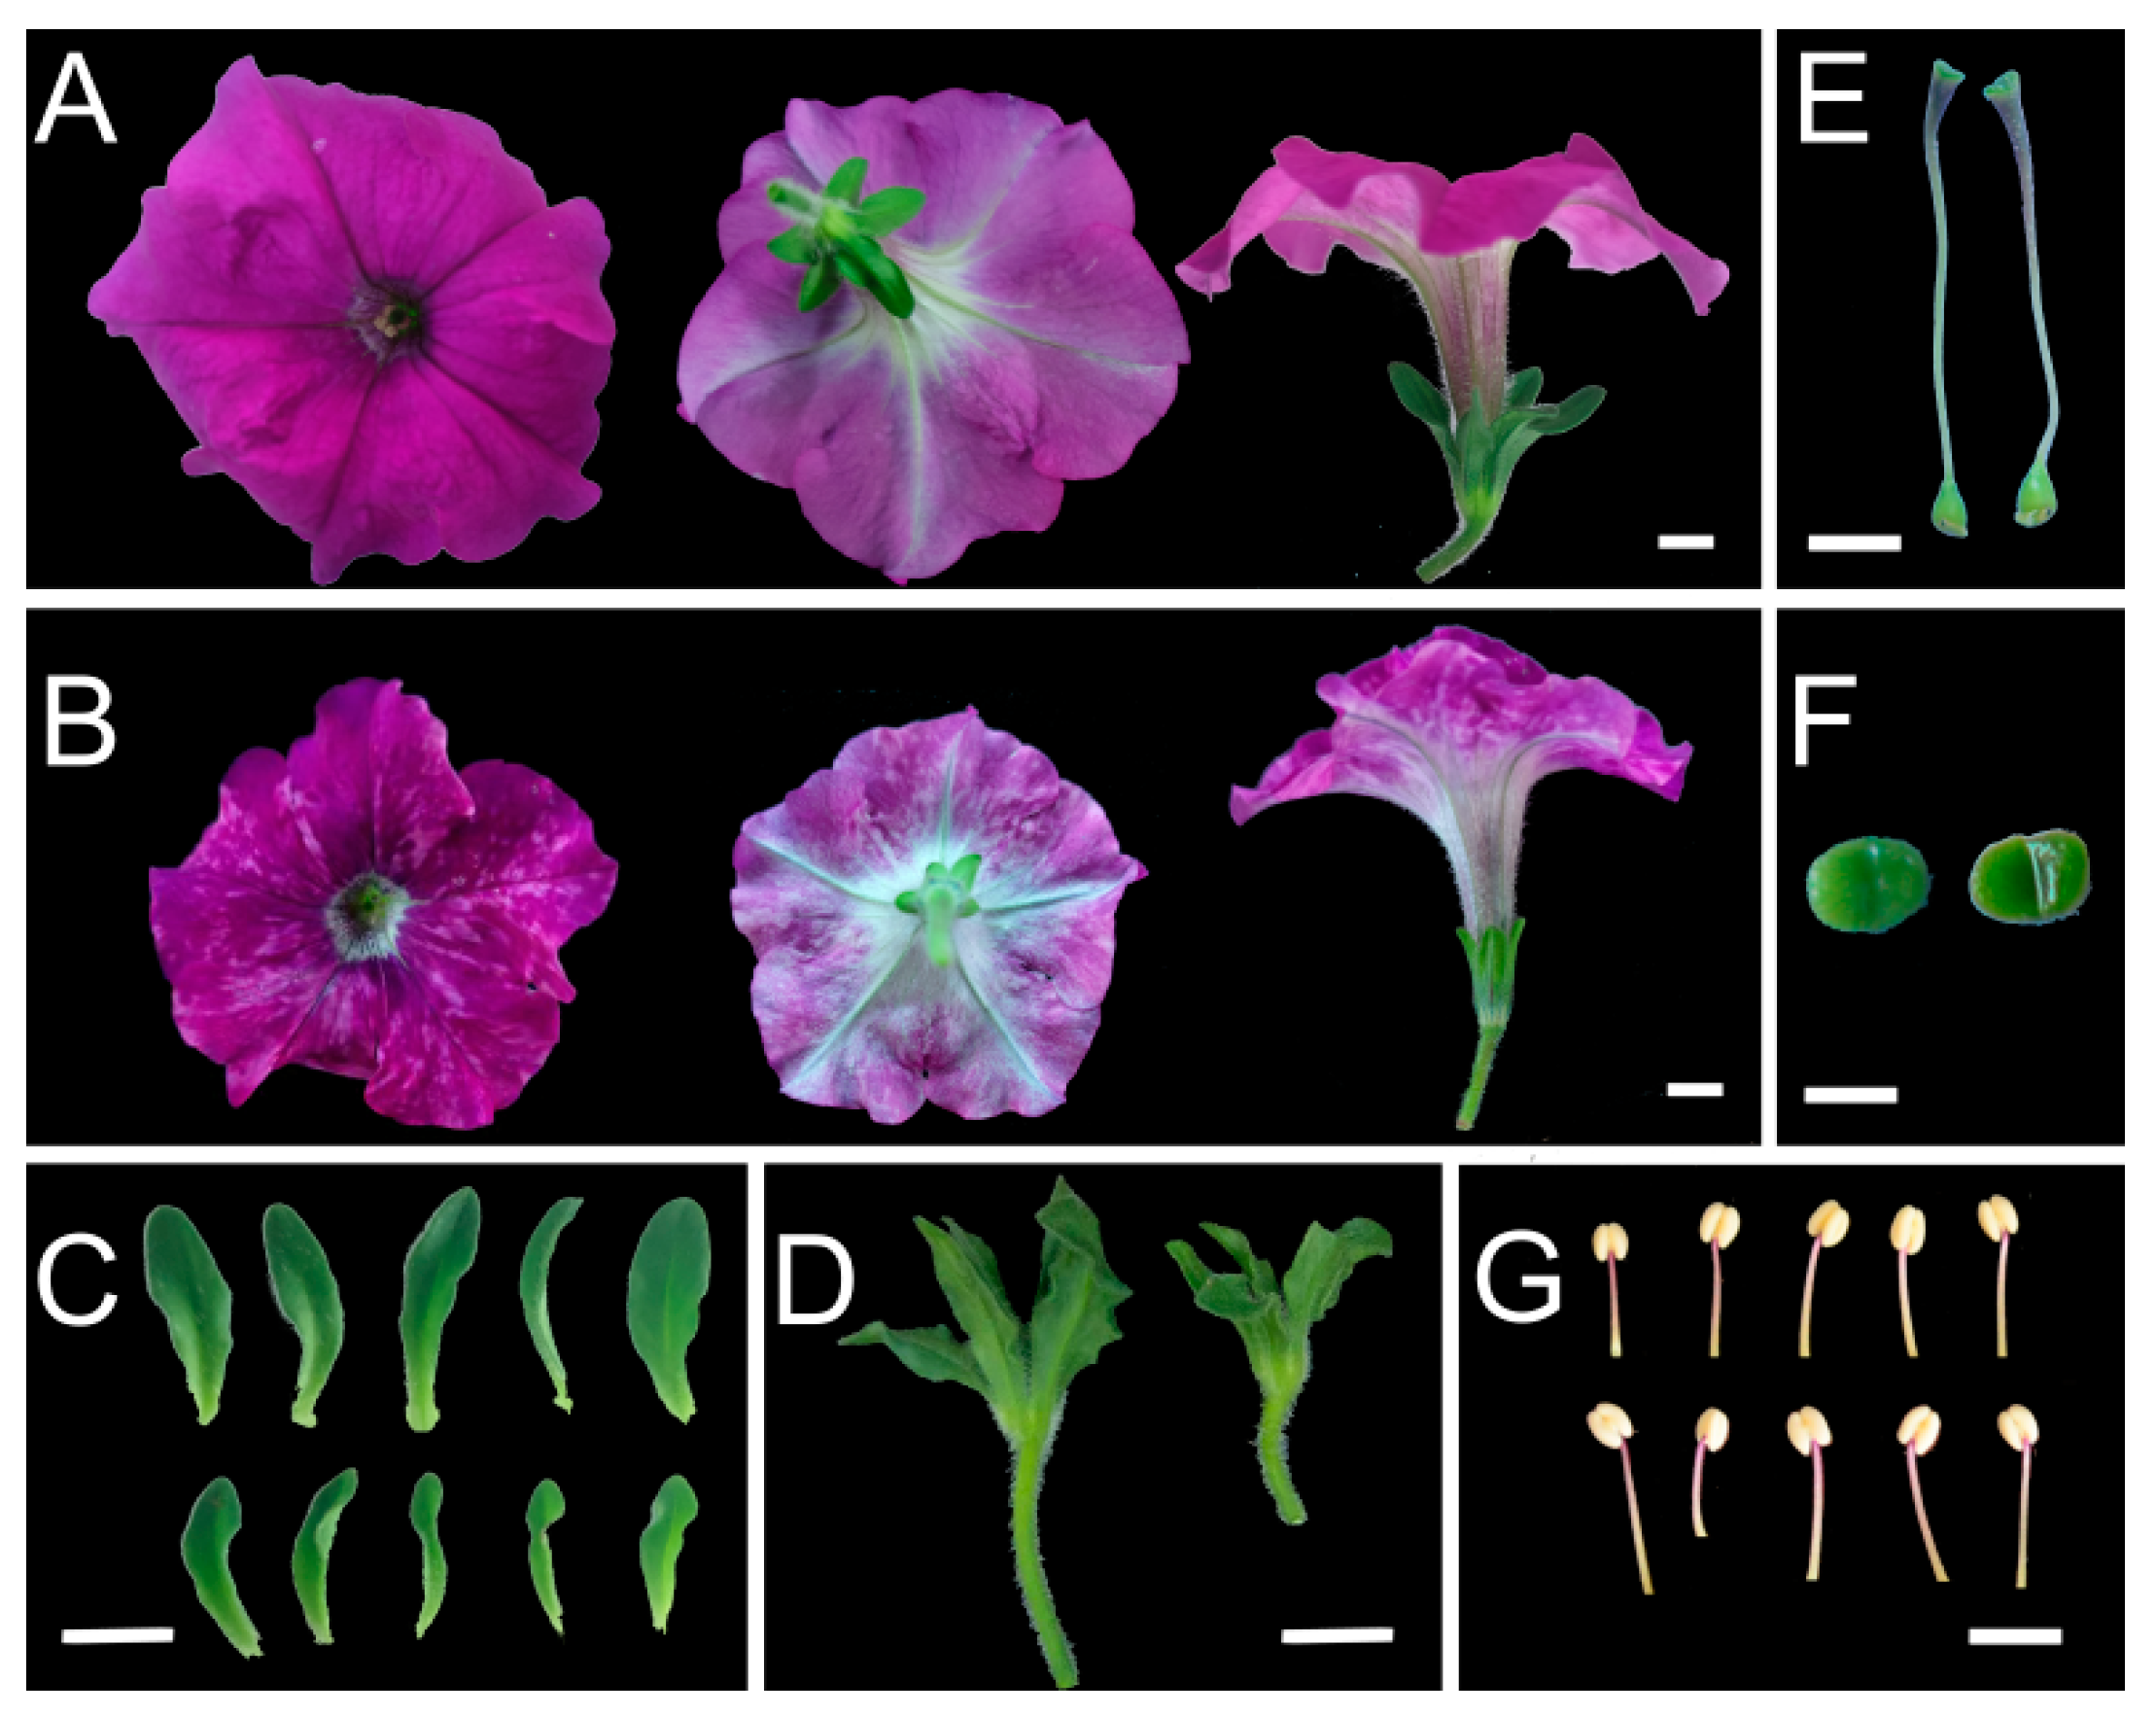
2.4. Phenotype of PhSK-Silenced Petunia Plants

To study the function of PhSK, the pTRV2-PhSK vector was constructed for PhSK silencing. The pTRV2-GFP vector containing a 717-bp fragment of the GFP served as the control. A total of 25 to 30 petunia seedlings were used for infection.
One month later, pTRV2-PhSK-treated plants showed shorter stem internode lengths compared with the control plants (Figure 3A–D), while pTRV2-PhSK-treated leaves did not show visible change.
PhSK silencing resulted in shorter pedicels and sepals, and the diameter of the corolla tubes in PhSK-silenced plants was significantly shortened compared with the control, while their length remained unchanged (Table 1; Figure 4A,B). The diameter of the corollas of PhSK-silenced plants was 85.6% of that of the control. The color of PhSK-silenced corollas was lighter compared with the control. In PhSK-silenced plants, the adaxial plane of corollas exhibited light speckles, and the abaxial plane of the corollas was light in color. The number of light hairs on the abaxial plane of the corollas of PhSK-silenced plants increased, making the abaxial plane of the corollas have a velvety texture and luster (Figure 4A,B). The anthocyanin content of PhSK-silenced corollas was significantly reduced compared with the control (Figure 5A).
pTRV2-PhSK treatment significantly reduced the PhSK mRNA level in corolla, which was only 66.7% of the control (Figure S5). We further examined SK activities and found that PhSK silencing dramatically decreased the activities of SK in corollas compared with the control (Figure 5B).

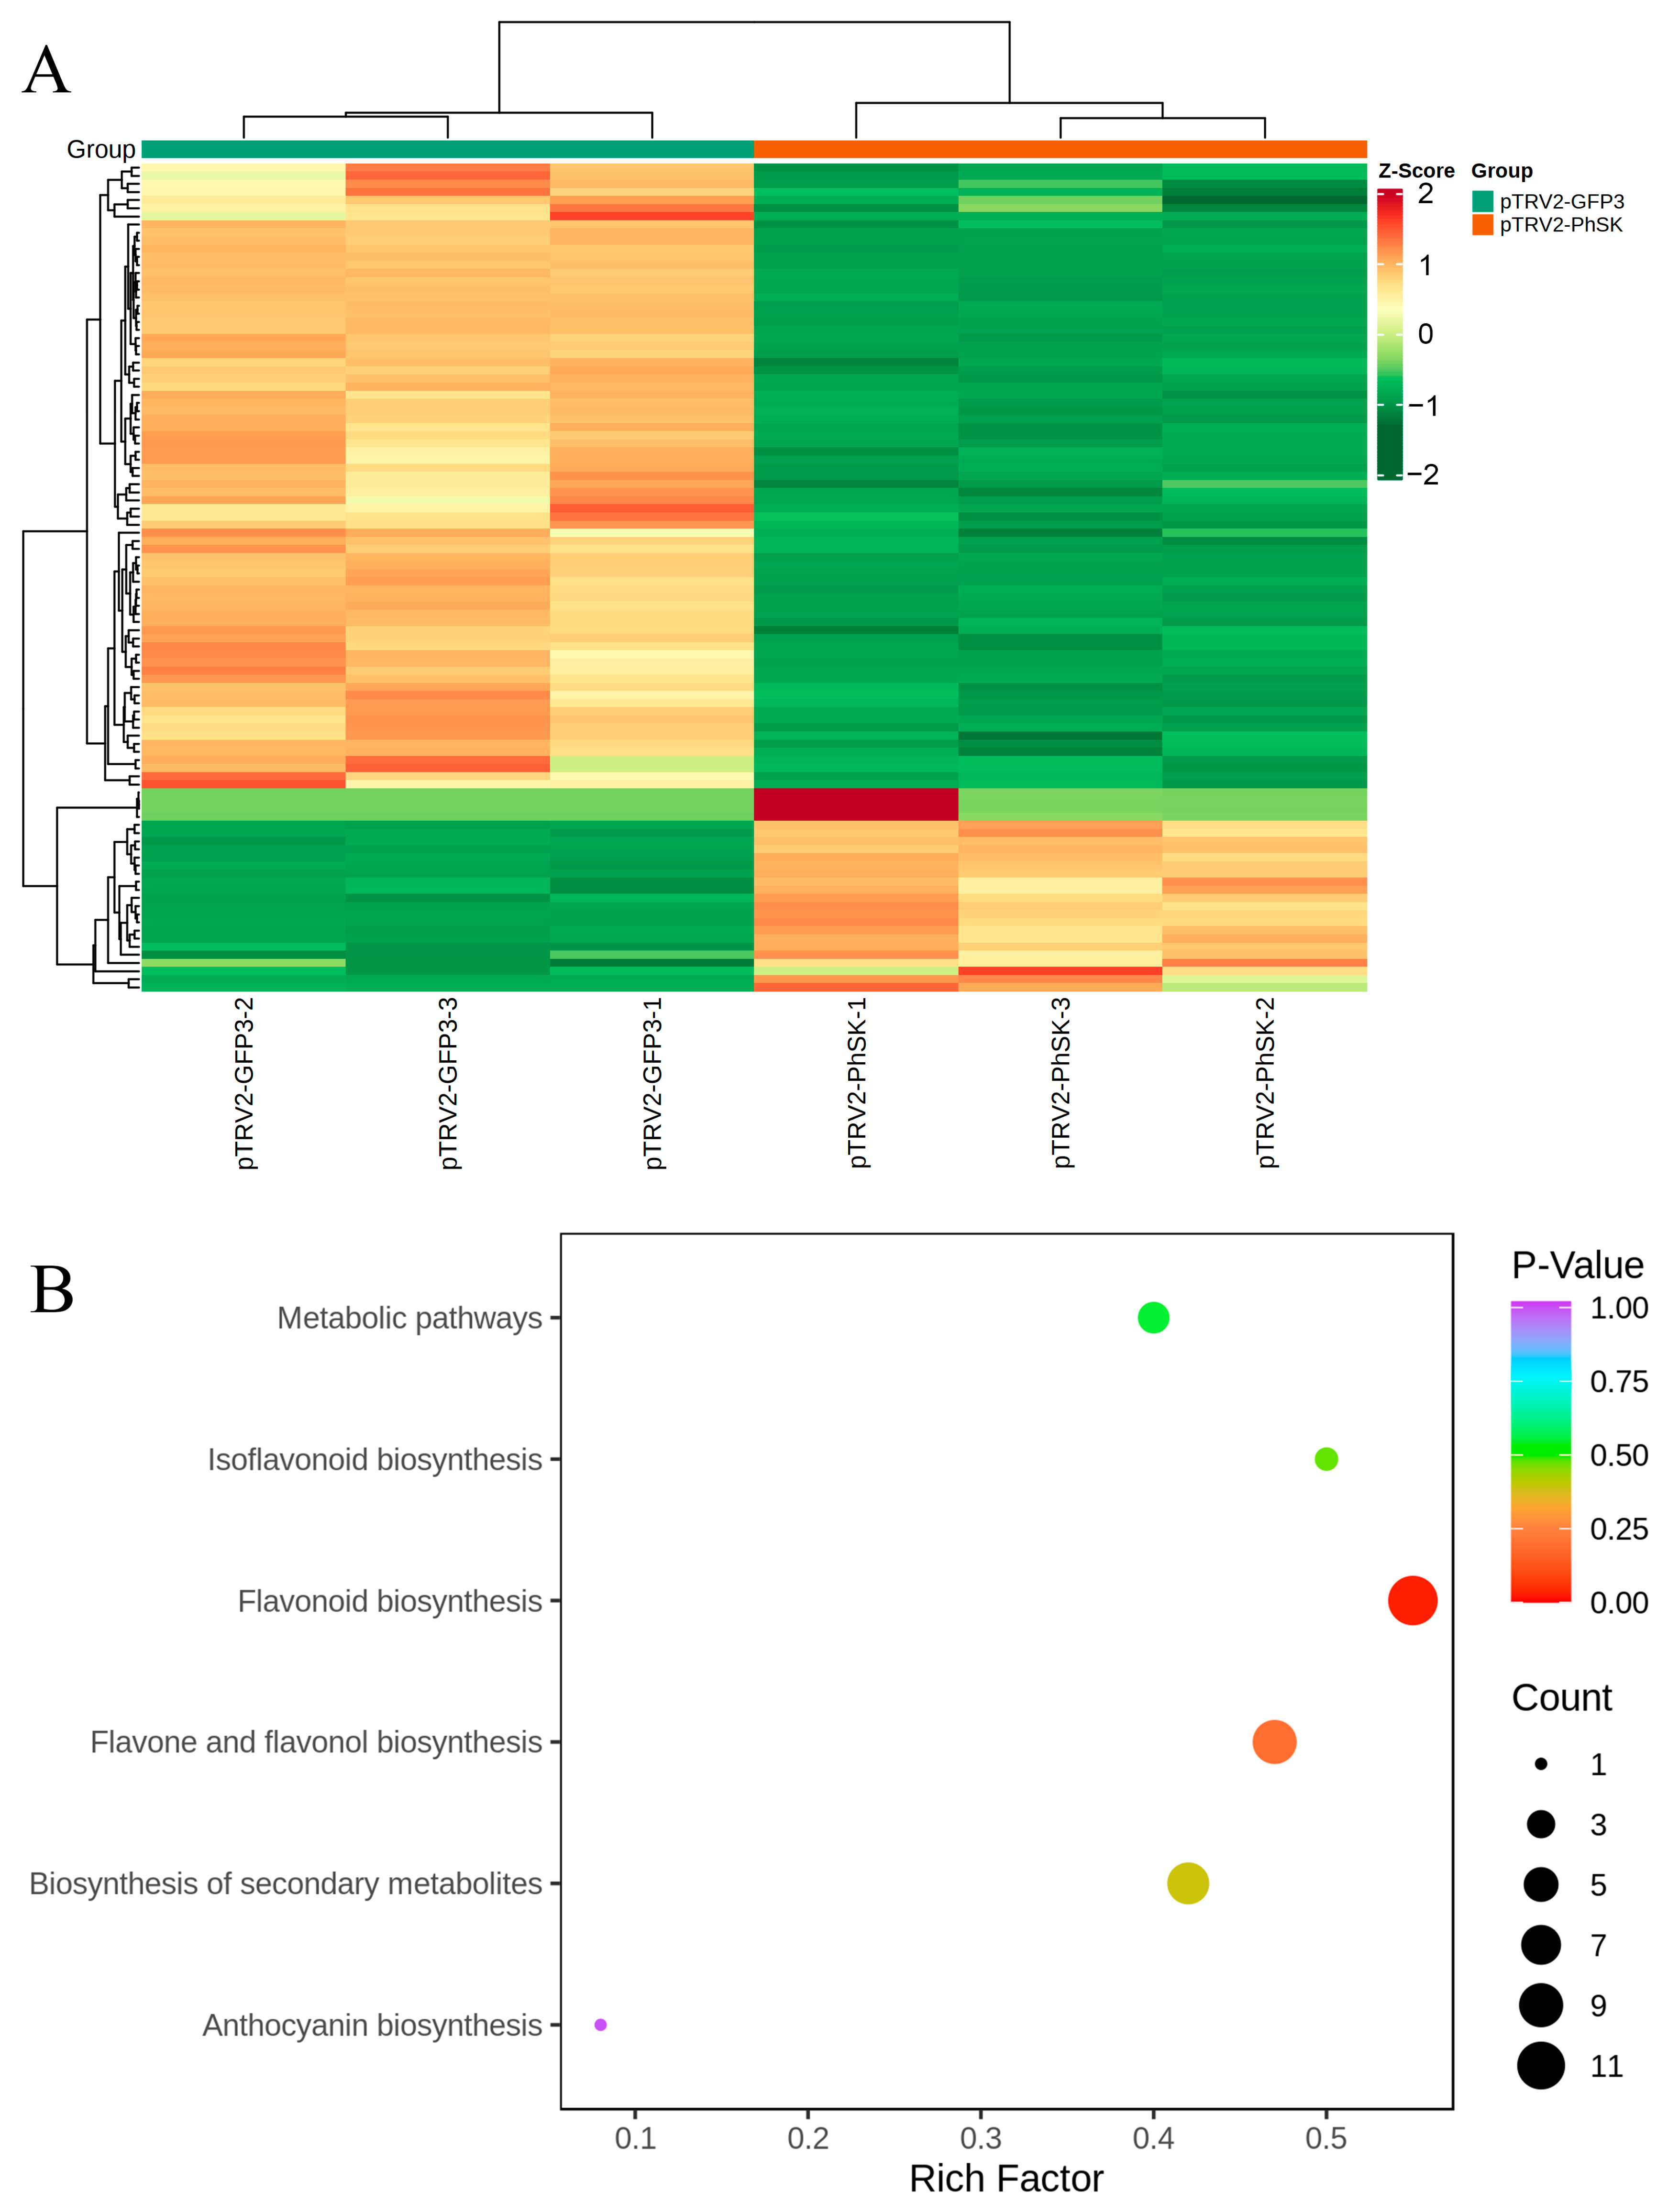
2.5. Changes in the Corolla Flavonoid Metabolome Profile Induced by PhSK Silencing

To further analyze the effects of PhSK silencing on the content of the flavonoid metabolites, a widely targeted metabolomics analysis of corollas was performed with UPLC and tandem MS. To ensure that the samples were taken from PhSK-silenced corollas, the lighter portion of the corolla was collected and verified by qPCR assays. The metabolites in the samples were analyzed quantitatively and qualitatively by MS based on the KEGG database (https://www.genome.jp/kegg/pathway.html, accessed on 1 November 2022), MWDB database (Metware Biotechnology Co., Wuhan, China), and MRM. A total of 298 flavonoid metabolites and 5 tannins were identified (Supplemental Data File S1).
In order to screen the differential metabolites, the criteria used for the screening included a fold change value ≥ 2 or ≤0.5 and a VIP value ≥ 1. In this study, 102 metabolites were significantly changed with a high level of repeatability (Figure 6A, Figures S6 and S7; Supplemental Data File S2). A KEGG database was used to categorize all differential metabolites. The differential metabolites in PhSK-silenced corollas were mainly enriched in isoflavonoid biosynthesis, flavonoid biosynthesis, flavone and flavonol biosynthesis, biosynthesis of secondary metabolites, and anthocyanins biosynthesis (Figure 6B; Supplemental Data File S3).
A total of 99 flavonoid metabolites changed significantly, of which 22 were upregulated and 77 were downregulated (Figure 6A; Supplemental Data File S2). The top ten downregulated metabolites were Rhamnetin, Chrysoeriol-7-O-(6″-acetyl)glucoside, Kaempferol-3-O-arabinoside, Oroxin A, Genistein-7-O-galactoside-rhamnose, Epigallocatechin, Eupatilin-7-O-glucoside, Kaempferol, Quercetin-3-O-(6″-p-Coumaroyl)glucoside, and Quercetin-3-O-(6″-p-Coumaroyl)galactoside. The top ten upregulated metabolites were Limocitrin-3-O-galactoside, Petunidin-3-O-(6″-O-feruloyl)rutinoside-5-O-glucoside, Quercetin-3-O-(6″-acetyl)glucosyl-(1→3)-Galactoside, Isorhamnetin-7-O-glucoside, Rhamnetin-3-O-Glucoside, 6-Methoxykaempferol-3-O-glucoside, Isorhamnetin-3-O-Glucoside, Pinocembrin, Tricin-7-O-(6″-O-malonyl)glucoside, and Isorhamnetin-3-O-(6″-acetylglucoside) (Supplemental Data Table S4).
In addition, 44 anthocyanin metabolites were detected. A total of 6 anthocyanin metabolites were downregulated, and only one, Petunidin-3-O-(6″-O-feruloyl)rutinoside-5-O-glucoside, was upregulated with a fold change of 2.02 (Table 2). The 6 downregulated anthocyanins included Cyanidin-3-O-(2′′-O-glucosyl)rutinoside, Cyanidin-3-O-(6″-O-malonyl)sophoroside-5-O-glucoside, Cyanidin-3,3′-di-O-glucoside-7-O-(6″-O-caffeoyl)glucoside, Cyanidin-3-O-glucoside, Cyanidin-3-O-sophoroside-5-O-glucoside, Delphinidin-3-O-rutinoside-7-O-glucoside, and Petunidin-3-O-(6″-O-feruloyl)rutinoside-5-O-glucoside (Table 2, Supplemental Data File S5).
In addition, two-thirds (22/33) of flavones (Supplemental Data File S6), all three differential isoflavones (Supplemental Data File S7), most (34/41) flavonols (Supplemental Data File S8), two-thirds (2/3) of flavanonols (Supplemental Data File S9), and three-quarters (6/8) of flavanones (Supplemental Data File S10) were significantly downregulated in PhSK-silenced plants compared with the control. These results showed that PhSK silencing could reduce the total content of flavonoids.

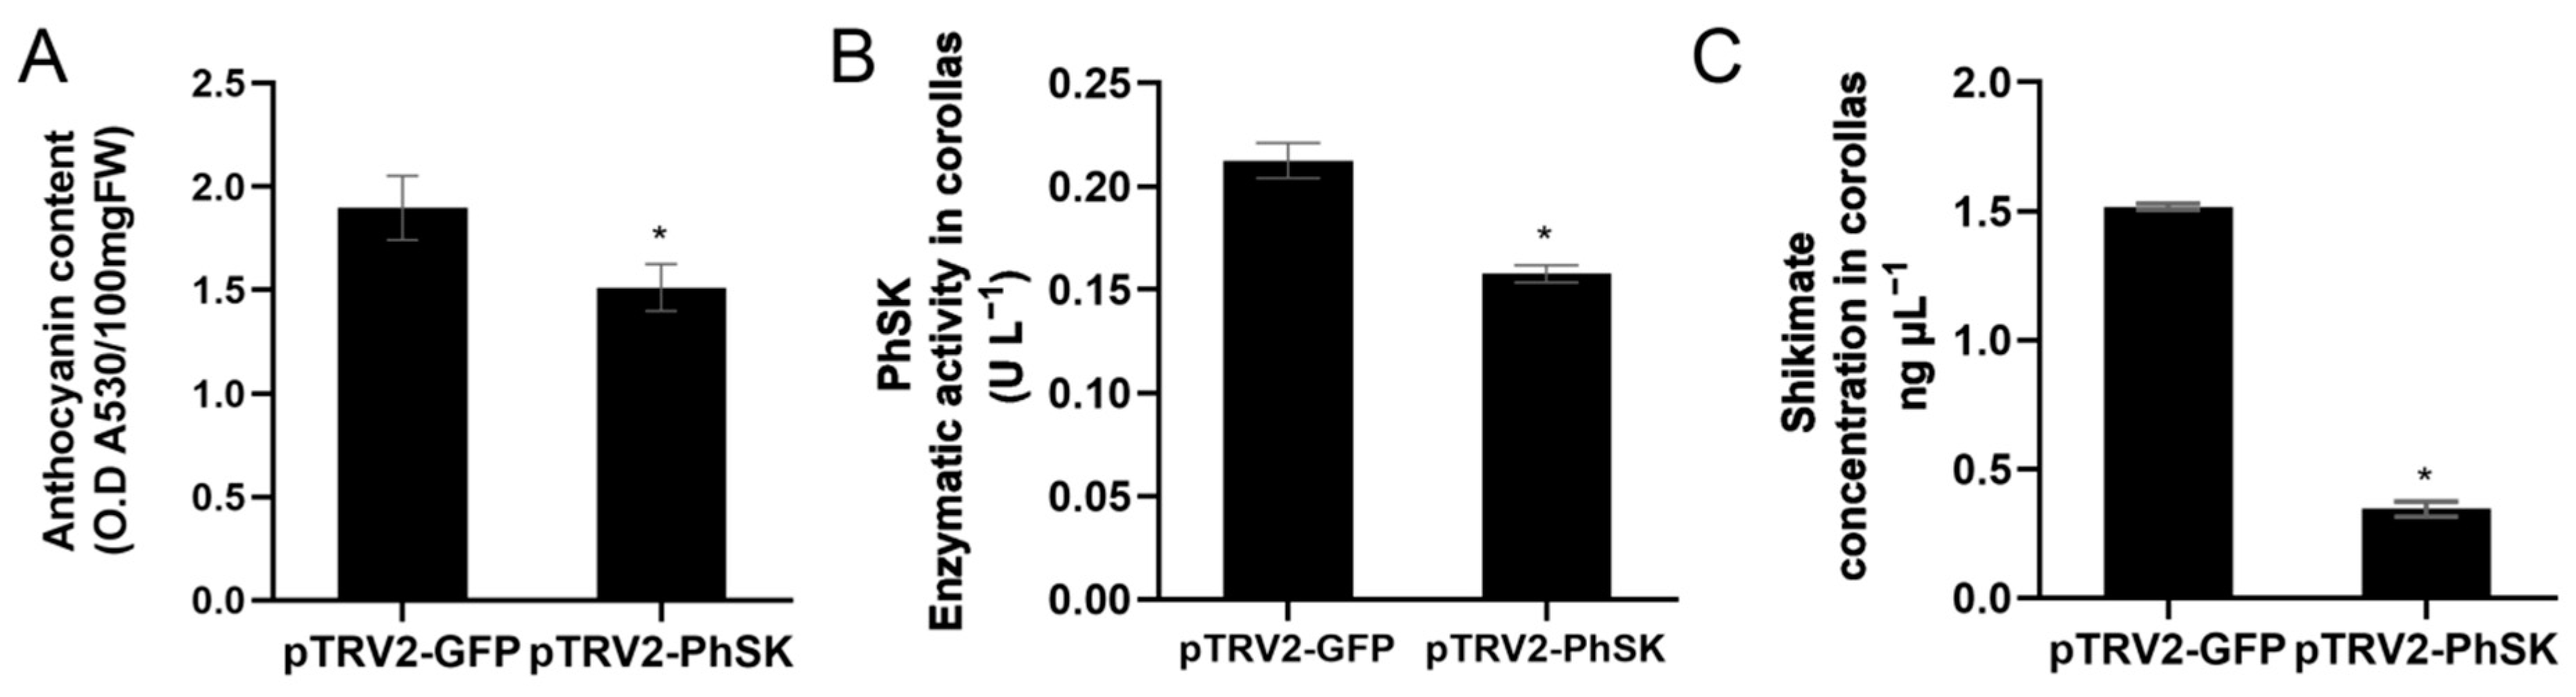
2.6. PhSK Silencing Reduces the Shikimate Content in Corollas

Shikimate serves as a substrate of PhSK, and we measured the content of shikimate in corollas. As shown in Figure 5C, unexpectedly, the content of shikimate in PhSK-silenced corollas was significantly decreased compared with the control.

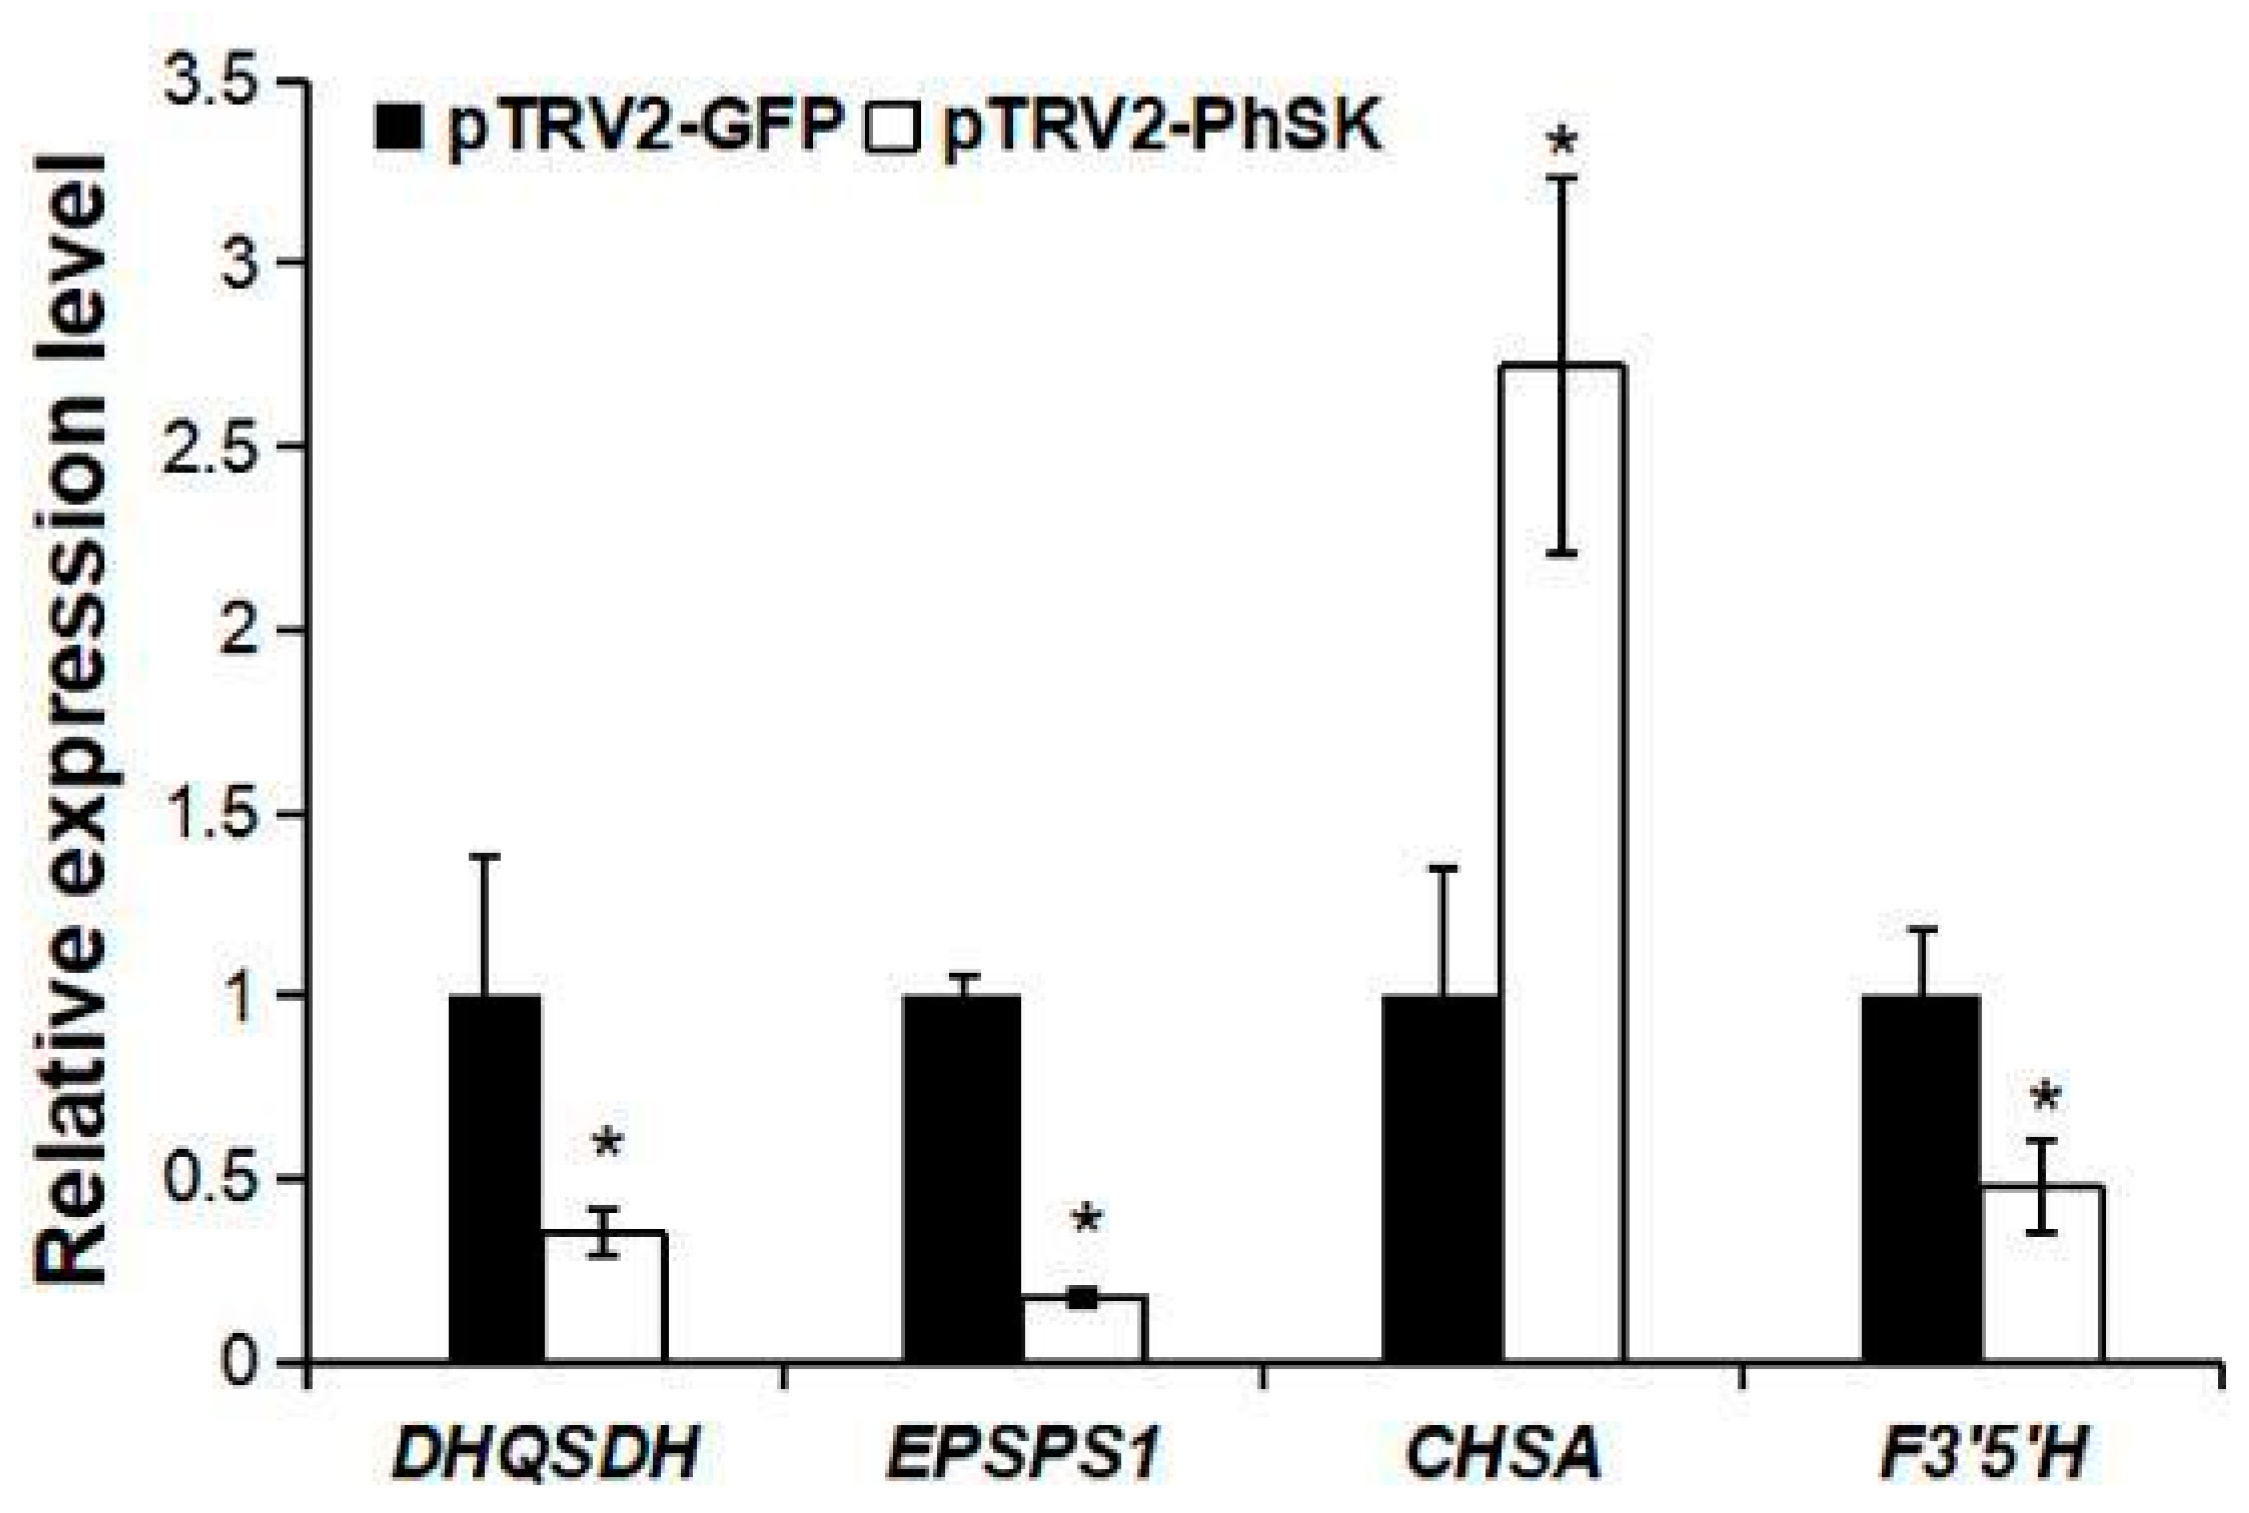
2.7. Effect of PhSK Silencing on the Expression of Some Structural Genes of the Shikimate Pathway and Anthocyanin Synthesis Pathway

The effects of PhSK silencing on the transcript levels of PhDHQ/SDH (Peaxi162Scf01067g00113.1), PhEPSPS1 (Peaxi162Scf00959g00022.1), PhCHSA (Peaxi162Scf00047g01225.1), and PhF3′5′H (Peaxi162Scf00150g00218.1) in corollas were analyzed by qPCR. The results showed that PhSK silencing significantly increased the mRNA level of PhCHSA and significantly decreased the mRNA levels of PhDHQ/SDH, PhEPSPS1, and PhF3′5′H (Figure 7).

3. Discussion

Generally, SK is a small gene family in many plants, and there are two and three SK members in Arabidopsis and rice genomes, respectively. In this study, there was only one PhSK member in the petunia genome. PhSK exhibited 67.3% and 57.6% identity with AtSK1 and OsSK1, respectively, indicating that the amino acid sequences of SK are conserved in higher plants. In addition, there are four conservative domains in the middle of PhSK, and these domains are the most important functional domains of SK [33,34,35].
It has been demonstrated that the AAA synthesis pathway mostly occurs in plastids, but some of the intermediates in this pathway (e.g., shikimate and chorismate) are exported to the cytosol and are used as precursors for the synthesis of proteins and other compounds (e.g., phenylpropanoids, indole compounds, and alkaloids) [8]. In tobacco, the DHQ/SDH family includes two members, NtDHQ/SDH1 and NtDHQ/SDH2. The NtDHQ/SDH1-YFP signal was confined to the plastids, whereas NtDHQ/SDH-2 was localized in the cytosol [11]. A chloroplast import assay and the presence of the cTP sequence (ChloroP1.1) indicated that petunia PhEPSPS1 and PhCM1 were plastid-localized proteins [36], while PhCM2 was not localized in chloroplasts [37]. Petunia PhCS was localized in peroxisomes and chloroplasts [15]. S. lycopersicum prephenate aminotransferase (SlPAT) was localized in chloroplasts [38]. Three petunia ADTs were localized in plastids [39]. Shikimate was exported from the plastids and conjugated with p-coumaroyl-coenzyme A (CoA) with the function of hydroxycinnamoyl-CoA shikimate hydroxycinnamoyl transferase in the cytosol, thereby generating p-coumaroyl shikimate [40]. In this study, SK was exclusively localized in plastids, so the phosphorylation of shikimate only occurs in the plastid in petunia.
SK is an upstream gene of the AAA synthesis pathway in plants, and AAAs play an important role in plant growth and development [8]. Antisense RNA-mediated DAHPS silencing blocked shikimate biosynthesis in the plastids of potato cells and resulted in delayed growth, reduced stem length and width, and reduced stem lignin content in potato plants [41]. RNAi suppression of NtDHQ/SDH delayed plant growth in tobacco [11]. In our previous study, suppression of petunia PhCS, catalyzing the last step of the shikimate pathway, led to a dwarf phenotype, small flower, and yellow deformed leaves [15]. These studies indicate that a general restriction of the shikimate pathway could block the development of vegetative organs. However, in this study, PhSK silencing only caused a shortened length of the internodes in petunia, showing only a slight effect on the growth and development of vegetative organs. The reason for the shortened internode length and small flower may be that PhSK silencing led to the decrease in the content of lignin, the downstream metabolite of the AAA synthesis pathway [8]. Lignin is essential for the maintenance of structural integrity, stem elongation, and the formation of leaves and flowers [42]. PhSK silencing did not result in severe phenotypic changes in vegetative organs as PhCS silencing did [15], and it is possible that PhCS plays a more important role in vegetative organ development than PhSK. PhCS is localized in chloroplasts and in peroxisomes [15], which is different from PhSK. In addition, it cannot be ruled out that PhSK silencing may lead to changes in secondary metabolites of vegetative organs.
In this study, PhSK silencing significantly reduced the content of anthocyanins and changed the flavonoid metabolome profile, indicating that PhSK plays an important role in the synthesis of flavonoids, including anthocyanins. Similarly, petunia PhCS silencing resulted in abnormal flower development and a reduction in the total anthocyanin content [15].
In this study, PhSK silencing resulted in significant downregulation of the expression of its upstream gene PhDHQ/SDH and its downstream gene PhEPSPS1, indicating a feedback regulation mechanism of gene expression in the shikimate pathway. The downregulation of PhDHQ/SDH expression could explain the reason for the decrease in shikimate in PhSK-silenced plants. In addition, the mRNA level of PhCHSA was significantly upregulated, indicating that PhCHSA mRNA level may be regulated by the feedback of anthocyanin synthesis. Similarly, PhCS silencing slightly increased the expression of PhEPSPS1, PhCM1, and PhCHSJ, indicating the existence of feedback regulation of the expression of these genes by anthocyanins or other products of the shikimate pathway [15]. In previous AAA synthesis pathway studies, N. silvestris CM1 was activated by tryptophan but inhibited by phenylalanine and tyrosine in a feedback mechanism [43]. In addition, the feedback-resistant forms of anthranilate synthase have been reported in potato, N. otophora, N. tabacum, and Arabidopsis [44,45].

4. Materials and Methods

The Sanli Horticultural Company of Guangzhou provided the petunia ‘Ultra’ seeds, and the seedlings were cultivated in a greenhouse (23 ± 2 °C, 60% relative humidity, and 14 h light/10 h dark cycle) [46]. The leaves, stems, and roots were harvested when the plants were about 25 cm tall in the vegetative stage. The flowers were collected at anthesis (corollas 90° reflexed) and were placed in water immediately. Each 0.2 g sample was wrapped with foil, immediately placed in liquid nitrogen, and kept at −80 °C until used [47]. Unless otherwise stated, three biological replicates from independent collection and extraction of tissues were used in all studies.

4.1. RNA Extraction, RT-PCR, and Cloning of the Petunia PhSK Gene

According to the manufacturer’s instructions, total RNA was extracted from the roots, stems, leaves, and corollas with an R4151B-HiPure Plant RNA Kit B (R4151B, Magen, China). Following the instructions, petunia mRNA was reverse-transcribed with an HiScript III 1st Strand cDNA Synthesis Kit (+gDNA wiper) (R312-01/02, Vazyme, China). With specific primers (Table S1) based on the petunia genome’s sequences (https://solgenomics.net/organism/Petunia_axillaris/genome, accessed on 1 November 2022), full-length PhSK (Peaxi162Scf00359g00118.1) cDNAs were isolated.

4.2. Sequence Analysis

Multiple sequence alignments were created with the DNAMAN (version 5.2.2, Lynnon Biosoft, San Ramon, CA, USA) software, and a phylogenetic tree was created with TBtools (version 1.098765) software [48]. The BLAST network server of the National Center for Biotechnology Information (NCBI) (https://www.ncbi.nlm.nih.gov/, accessed on 1 November 2022) was used to identify nucleotides and translated amino acids. With the accession from related studies and the results of BLAST on NCBI and Solgenomics, different SK nuclear gene and coding sequence (CDS) sequences from different species were obtained. The nuclear gene sequences were used for analyzing the gene structure of SKs on the GSDS2.0 website (http://gsds.gao-lab.org/index.php, accessed on 1 November 2022).

4.3. Subcellular Localization

Subcellular localization analysis was carried out according to the previously reported protocol [49]. The GFP gene-containing pSAT-1403TZ vector (https://www.ncbi.nlm.nih.gov/nucleotide/56553541, accessed on 1 November 2022) was utilized to create the PhSK-GFP construct. (Tzfira et al. 2005). A full-length PCR amplification of the PhSK CDS sequence was performed, and the PCR products were cloned into the pSAT-1403TZ vector, which utilizes the CaMV 35S promoter to drive GFP fusions. The results of each recombinant vector were identified by PCR and confirmed by sequencing analysis. The sequences of the primers are described in Supplemental Table S1.
As previously mentioned, ethylene glycol was used to separate and prepare petunia leaf protoplasts [50]. After being incubated in the dark for 24 h, the protoplasts were visualized by the Zeiss (http://www.zeiss.com, accessed on 1 November 2022) LSM710 microscope. Excitation/emission wavelengths for GFP and chlorophyll were 488/535 nm and 488/637 nm, respectively.

4.4. Quantitative Real-Time PCR Assays

Quantitative real-time PCR (qPCR) was performed according to the previous methods [51]. The primers used for qPCR are shown in Table S2. According to the instructions, 1 μL of cDNA, 10 μL of Taq Pro Universal SYBR qPCR Master Mix (Q712, Vazyme, China), 0.4 μL of forward primer, 0.4 μL of reverse primer, and 8.2 μL of sterile water were mixed to prepare each 20 μL reaction. The samples were subjected to the following thermal cycling procedures: a DNA predenaturation stage lasting 30 s at 95 °C, an amplification stage taking 40 cycles of 10 s at 95 °C and 30 s at 60 °C, and the final stage lasting 15 s at 95 °C, 60 s at 60 °C, and 15 s at 95 °C to create a melting curve. The assays employed 3 different cDNAs from the same time point that were generated from 3 different RNAs, and each study was performed in triplicate. To confirm their identities, the amplicons underwent electrophoresis analysis and sequencing. The quantification was constructed using Pfaffl’s threshold cycle (Ct) value analysis [51]. It was executed following the Minimum Information for Publication of Quantitative Real-Time PCR Experiments guidelines when conducting the analyses (Bustin et al., 2009; Tan et al., 2014). For the quantification of cDNA abundance, cyclophilin (CYP) (no. EST883944) was chosen as the internal reference gene [52]. The data in the study are a representation of the relative expression values determined by CYP. Supplemental Table S2 provides information on the sequences of each primer used in the qPCR analysis. Each treatment’s three biological duplicates were analyzed.

4.5. Agroinoculation of pTRV2 Vectors

To create the pTRV2-PhSK vector, specific primers (Table S3) were used for the amplification of the 254-bp sequence of the 3′ regions of PhSK by PCR. The pTRV2-GFP vector containing a 717-bp fragment of the GFP was previously constructed as the control [15]. We performed BLAST searches of the Petunia axillaris draft genome sequence v1.6.2 using the inserted GFP sequence as the query, and no gene or fragment had homology with GFP. As previously mentioned, pTRV1 and pTRV2-GFP or pTRV2-PhSK vectors were transferred to the Agrobacterium tumefaciens GV3101 strain [47,53,54]. Cultivated in the liquid YEP medium [55] with 50 mg L−1 of kanamycin and 200 μM of acetosyringone, the A. tumefaciens cells were grown at 28 °C for 8–10 h. Then, A. tumefaciens cells were collected and resuspended to an OD600 of 2–3 in the inoculation buffer containing 200 M acetosyringone, 10 mM MES, and 10 mM MgCl2 (pH 5.5). A. tumefaciens carrying pTRV1 was diluted 1:1 with A. tumefaciens carrying pTRV2-GFP or pTRV-PhSK after 1 h of incubation at 28 °C. After the apical meristems were removed, the wound surface of 4-week-old petunia plants was subsequently treated with roughly 300 μL of this mixture. Each vector was used to inoculate 25 to 30 plants.

4.6. Assays of SK Activity

A total of 0.1 g of fresh corolla used for the SK activity assay was collected. The fresh corolla was ground with 9 mL of PBS basic (pH 7.2–7.4 and 0.01 mol L−1). After centrifuging the mixture at 4000 rpm for 30 min, the supernatant was stored for the following analysis. The activity of SK was analyzed with the Shikimate Kinase Activity Kit (Jingkang, Shanghai, China). Standard curves were established using the following standard concentrations: 0 U L−1, 7.5 U L−1, 15 U L−1, 30 U L−1, 60 U L−1, and 120 U L−1. Prepared samples were put into an ELISA plate containing an HRP-labeled reagent after being diluted five times. The plate was then kept at 37 °C for 60 min. The dish was carefully washed with detergent to ensure that there was no liquid residue. After adding a chromogenic agent to the ELISA plate, it was kept in the dark for 15 min. After adding the termination solution, Varioskan LUX (Thermo Scientific, Waltham, MA, USA) was used to spectrophotometrically measure the absorbance of the extracts at 450 nm. Three biological replicates were analyzed for each treatment. The precise instructions are provided by Shikimate Kinase Kit (Jingkang, Shanghai, China).

4.7. Anthocyanin Extraction and Measurement

A total of 0.2 g of petunia corollas was used to extract anthocyanins as previously reported [56,57]. Petunia corollas were ground into a powder with liquid nitrogen. The powder was transferred into a 50 mL centrifuge tube with 30 mL acidic methanol containing 1% HCl (v/v). The mixture was kept at 4 °C for 2 h in the dark. After centrifuging at 10,500 rpm for 10 min, the supernatant was used for measuring the absorption values. The absorption values of the extract were measured at A530 and A657 to calculate the anthocyanin concentration using the formula A530 − 0.25A657, which eliminates the influence of chlorophyll. Three biological replicates were analyzed for each treatment.

4.8. Widely Targeted Metabolomics Analysis

The corollas of petunia were harvested, freeze-dried, and powdered. A total of 0.1 g of powder was soaked overnight at 4 °C in 1.0 mL of 70% aqueous methanol. After centrifuging the extract at 10,000× g for 10 min, the supernatant was filtered through a 0.22 m pore size microporous membrane for liquid chromatography–tandem mass spectrometry (LC-MS/MS) analysis.
The metabolites were analyzed using ultra-performance liquid chromatography (UPLC) (Shim-pack UFLC SHIMADZU CBM30A, http://www.shimadzu.com.cn/, accessed on 1 November 2022) and MS/MS (AB SCIEX 6500 QTRAP) under the following conditions outlined by Li and Song [58]: column, water ACQUITY UPLC HSS T3 C18 1.8 μm, 2.1 mm × 100 mm; mobile phase, the aqueous phase was ultrapure water (0.04% acetic acid), and the organic phase was acetonitrile (0.04% acetic acid); water/acetonitrile gradient, 95:5 V/V for 0 min, 5:95 V/V for 11.0 min, 5:95 V/V for 12.0 min, 95:5 V/V for 12.1 min, and 95:5 V/V for 15.0 min; flow rate, 0.4 mL/min; column temperature, 40 °C; and injection volume, 2 μL. The electrospray ionization (ESI) temperature was 500 °C, the MS voltage was 5500 V, the curtain gas (CUR) was 25 psi, and the collision-induced dissociation (CAD) parameter was set to high. Each ion pair was scanned for detection in triple quadrupole mode (QQQ) using the optimal decompression potential (DP) and collision energy (CE) [59].

4.9. Qualitative and Quantitative Determination of Metabolites

The metabolites of the samples were analyzed qualitatively and quantitatively by MS utilizing the self-built MetWare database (MWDB) (MetWare Company, Wuhan, China) (http://www.metware.cn/, accessed on 1 November 2022) and multiple reaction monitoring (MRM) [59]. The isotope and repeated signals were eliminated during the qualitative analysis of the material using secondary spectral data. Utilizing MRM with QQQ MS, the metabolites were quantified. Before screening the precursor ions of the target substance, the ions matching compounds with various molecular weights were removed. Additionally, the precursor ions were broken down into fragment ions in the collision cell, and then the characteristic fragment ions were chosen using QQQ filtering. The quantitative results are more precise and repeatable as a result of these processes. The resulting mass spectrum peaks of the metabolites underwent peak area integration; moreover, the mass spectral peaks of the metabolites from different samples were integrated [59].

4.10. Shikimate Measurement

Samples were prepared according to the methods of the SK activity assays above. The content of shikimate was measured using the Plant Shikimate Kit (Coibo Bio, Shanghai, China). Standard curves were established using the following standard concentrations: 0 ng/mL, 2.5 ng mL−1, 5 ng mL−1, 10 ng mL−1, 20 ng mL−1, and 40 ng mL−1. Prepared samples were put into an ELISA plate with an HRP-labeled reagent after being diluted five times. The plate was then kept at 37 °C for 60 min. The detergent cleansed the dish carefully to make sure that no liquid was left. After adding a chromogenic agent to the ELISA plate, it was kept in the dark for 15 min. After adding the termination solution, Varioskan LUX (Thermo Scientific, Waltham, MA, USA) was used to spectrophotometrically measure the absorbance of the extracts at 450 nm. Three biological replicates were analyzed for each treatment. The precise instructions are provided by Shikimate Kit (Jingkang, Shanghai, China).

4.11. Statistical Analyses

One-way analysis of variance (ANOVA) and Duncan’s multiple range test (DMRT) with at least three replicates were used to statistically analyze the data. p values under 0.05 were regarded as significant.

5. Conclusions

There is only one PhSK member in the petunia genome, and PhSK is localized in chloroplasts. This study provides genetic evidence that PhSK plays an important role in the synthesis of flavonoid and anthocyanin metabolites.

Supplementary Materials

The following supporting information can be downloaded at: https://www.mdpi.com/article/10.3390/ijms232415964/s1.

Author Contributions

J.L. and Y.Y. planned and designed the research. J.Y., S.Z., Y.L. and J.G. performed the experiments, conducted the fieldwork, and analyzed the data. J.Y. and Y.Y. wrote the manuscript. All authors have read and agreed to the published version of the manuscript.

Funding

This research was funded by the National Natural Science Foundation of China (31770737, 32271939, and 31870692) and the National Key Research and Development Plan (2018YFD1000407).

Institutional Review Board Statement

Not applicable.

Informed Consent Statement

Not applicable.

Data Availability Statement

Not applicable.

Acknowledgments

We thank MetWare Ltd. Co. (Wuhan, China) for the metabolome service.

Conflicts of Interest

The authors declare no conflict of interest.

References

  1. Roberts, F.; Roberts, C.; Johnson, J.J.; Kylek, D.E.; Krell, T.; Coggins, J.R.; Coombs, G.H.; Milhousk, W.K.; Tzipori, S.; Ferguson, D.J.P.; et al. Evidence for the shikimate pathway in apicomplexan parasites. Nature 1998, 393, 801–805. [Google Scholar] [CrossRef] [PubMed]
  2. Bentley, R.; Haslam, E. The shikimate pathway—A metabolic tree with many branche. Crit. Rev. Biochem. Mol. Biol. 1990, 25, 307–384. [Google Scholar] [CrossRef] [PubMed]
  3. Herrmann, K.M. The shikimate pathway: Early steps in the biosynthesis of aromatic compounds. Plant Cell 1995, 7, 907–919. [Google Scholar] [CrossRef] [PubMed]
  4. Herrmann, K.M.; Weaver, L.M. The shikimate pathway. Annu. Rev. Plant Physiol. Plant Mol. Biol. 1999, 50, 473–503. [Google Scholar] [CrossRef]
  5. Tzin, V.; Gad, G. New insights into the shikimate and aromatic amino acids biosynthesis pathways in plants. Mol. Plant 2010, 3, 956–972. [Google Scholar] [CrossRef]
  6. Keith, B.; Dong, X.; Ausubel, F.M.; Fink, G.R. Differential induction of 3-deoxy-D-arabino-heptulosonate 7-phosphate synthase genes in Arabidopsis thaliana by wounding and pathogenic attack. Proc. Natl. Acad. Sci. USA 1991, 88, 8821–8825. [Google Scholar] [CrossRef] [Green Version]
  7. Görlach, J.; Rawsecke, H.; Rentsch, D.; Regenass, M.; Roy, P.; Zala, M.; Keel, C.; Boller, T.; Amrhein, N.; Schmid, J. Temporally distinct accumulation of transcripts encoding enzymes of the prechorismate pathway in elicitor-treated, cultured tomato cells. Proc. Natl. Acad. Sci. USA 1995, 92, 3166–3170. [Google Scholar] [CrossRef] [Green Version]
  8. Maeda, H.; Dudareva, N. The shikimate pathway and aromatic amino Acid biosynthesis in plants. Annu. Rev. Plant Biol. 2012, 63, 73–105. [Google Scholar] [CrossRef]
  9. Cao, M.; Li, Y.; An, Z.; Cheng, H.; Hu, Y.; Huang, H. Effects of overexpression of HbDAHPS on stress tolerance in Arabidopsis thaliana. Mol. Plant Breed. 2016, 14, 1107–1114. [Google Scholar] [CrossRef]
  10. Hamberger, B.; Ehlting, J.; Barbazuk, W.B.; Douglas, C.J. Comparative genomics of the shikimate pathway in Arabidopsis, Populus trichocarpa and Oryza sativa: Shikimate pathway gene family structure and identification of candidates for missing links in phenylalanine biosynthesis. Recent Adv. Phytochem. 2006, 40, 85–113. [Google Scholar] [CrossRef]
  11. Li, D.; Hofius, D.; Hajirezaei, M.; Fernie, A.R.; Börnke, F.; Sonnewald, U. Functional analysis of the essential bifunctional tobacco enzyme 3-dehydroquinate dehydratase/shikimate dehydrogenase in transgenic tobacco plants. J. Exp. Bot. 2007, 58, 2053–2067. [Google Scholar] [CrossRef] [Green Version]
  12. Henstrand, J.M.; McCue, K.F.; Brink, K.; Handa, A.K.; Herrmann, K.M.; Conn, E.E. Light and fungal elicitor Induce 3-Deoxy-d-arabino-heptulosonate 7-Phosphate synthase mRNA in suspension cultured cells of parsley (Petroselinum crispum L.). Plant Physiol. 1992, 98, 761–763. [Google Scholar] [CrossRef] [PubMed] [Green Version]
  13. Salas, R.A.; Scott, R.C.; Dayan, F.E.; Burgos, N.R. EPSPS gene amplification in glyphosate-resistant Italian ryegrass (Lolium perenne ssp. multiflorum) from Arkansas. J. Agric. Food Chem. 2012, 68, 1223–1230. [Google Scholar] [CrossRef]
  14. Huang, L.; Jiang, X.; Li, B.; Li, Y.; Zhang, X. Transformation of EPSP synthetase gene from Allium macrostemon bunge into tobacco and improvement of resistance in transgenic plants to glyphosate. Acta Agron. Sin. 2009, 35, 855–860. [Google Scholar] [CrossRef]
  15. Zhong, S.; Chen, Z.; Han, J.; Zhao, H.; Liu, J.; Yu, Y. Suppression of chorismate synthase, which is localized in chloroplasts and peroxisomes, results in abnormal flower development and anthocyanin reduction in petunia. Sci. Rep. 2020, 10, 10846. [Google Scholar] [CrossRef]
  16. Oliveira, J.S.; Pinto, C.A.; Basso, L.A.; Santo, D.S. Cloning and overexpression in soluble form of functional shikimate kinase and 5-enolpyruvylshikimate 3-phosphate synthase enzymes from Mycobacterium tuberculosis. Protein Expr. Purif. 2001, 22, 430–435. [Google Scholar] [CrossRef] [Green Version]
  17. Whipp, M.J.; Pittard, A.J. A reassessment of the relationship between aroK- and aroL-encoded shikimate kinase enzymes of Escherichia coli. J. Bacteriol. 1995, 177, 1627–1629. [Google Scholar] [CrossRef] [Green Version]
  18. Minton, N.P.; Whitehead, P.J.; Atkinson, T.; Gilbert, H.J. Nucleotide sequence of an Erwinia chrysanthemi gene encoding shikimate kinase. Nucleic Acids Res. 1989, 17, 1769. [Google Scholar] [CrossRef]
  19. Defeyter, R.C.; PIittard, J. Purification and properties of shikimate kinase II from Escherichia coli K-12. J. Bacteriol. 1986, 165, 331–333. [Google Scholar] [CrossRef] [Green Version]
  20. Duncan, K.; Edwards, R.M.; Coggins, J.R. The Saccharomyces cerevisiae ARO1 gene. An example of the co-ordinate regulation of five enzymes on a single biosynthetic pathway. FEBS Lett. 1988, 241, 83–88. [Google Scholar] [CrossRef]
  21. Kinghorn, J.R.; Hawkins, A.R. Cloning and expression in Escherichia coli K-12 of the biosynthetic dehydroquinase function of the arom cluster gene from the eucaryote, Aspergillus nidulans. Mol. Genet. Genomics 1982, 186, 145–152. [Google Scholar] [CrossRef] [PubMed]
  22. Schmid, J.; Schaller, A.; Leibinger, U.; Boll, W.; Amrhein, N. The in-vitro synthesized tomato shikimate kinase precursor is enzymatically active and is imported and processed to the mature enzyme by chloroplasts. Plant J. 1992, 2, 375–383. [Google Scholar] [CrossRef] [PubMed]
  23. Koji, K.; Takuya, K.; Mitsuru, A.; Yasuko, I.; Kyo, W.; Yuzuru, T. Identification of three shikimate kinase genes in rice: Characterization of their differential expression during panicle development and of the enzymatic activities of the encoded proteins. Planta 2005, 222, 438–447. [Google Scholar] [CrossRef]
  24. Fucile, G.; Falconer, S.; Christendat, D. Evolutionary diversification of plant shikimate kinase gene duplicates. PLoS Genet. 2008, 4, e1000292. [Google Scholar] [CrossRef] [PubMed] [Green Version]
  25. Schmidt, C.L.; Danneel, H.J.; Schultz, G.; Buchanan, B.B. Shikimate kinase from spinach chloroplasts: Purification, characterization, and regulatory function in aromatic amino Acid biosynthesis. Plant Physiol. 1990, 93, 758–766. [Google Scholar] [CrossRef] [PubMed] [Green Version]
  26. Mattioli, R.; Francioso, A.; Mosca, L.; Silva, P. Anthocyanins: A comprehensive review of their chemical properties and health effects on cardiovascular and neurodegenerative diseases. Molecules 2020, 25, 3809. [Google Scholar] [CrossRef] [PubMed]
  27. Li, Z.; Alfenito, M.; Rea, P.A.; Walbot, V.; Dixon, R.A. Vacuolar uptake of the phytoalexin medicarpin by the glutathione conjugate pump. Phytochemistry 1997, 45, 689–693. [Google Scholar] [CrossRef]
  28. Klein, M.; Weissenböck, G.; Dufaud, A.; Gaillard, C.; Kreuz, K.; Martinoia, E. Different energization mechanisms drive the vacuolar uptake of a flavonoidglucoside and a herbicide glucoside. J. Biol. Chem. 1996, 271, 29666–29671. [Google Scholar] [CrossRef] [Green Version]
  29. Tohge, T.; Watanabe, M.; Hoefgen, R.; Fernie, A.R. Shikimate and phenylalanine biosynthesis in the green lineage. Front. Plant Sci. 2013, 4, 62. [Google Scholar] [CrossRef] [Green Version]
  30. Guo, J.; Liu, J.; Wei, Q.; Wang, R.; Yang, W.; Ma, Y.; Chen, G.; Yu, Y. Proteomes and Ubiquitylomes Analysis Reveals the Involvement of Ubiquitination in Protein Degradation in Petunias. Plant Physiol. 2017, 173, 668–687. [Google Scholar] [CrossRef]
  31. Zhao, H.; Zhong, S.; Sang, L.; Zhang, X.; Chen, Z.; Wei, Q.; Chen, G.; Liu, J.; Yu, Y. Corrigendum: PaACL silencing accelerates flower senescence and changes proteome to maintain metabolic homeostasis in Petunia hybrida. J. Exp. Bot. 2020, 71, 5113. [Google Scholar] [CrossRef] [PubMed]
  32. Yang, W.; Meng, J.; Liu, J.; Ding, B.; Tan, T.; Wei, Q.; Yu, Y. The N1-Methyladenosine Methylome of Petunia mRNA. Plant Physiol. 2020, 183, 1710–1724. [Google Scholar] [CrossRef] [PubMed]
  33. Walker, J.E.; Saraste, M.; Runswick, M.J.; Gay, N.J. Distantly related sequences in the alpha- and beta-subunits of ATP synthase, myosin, kinases and other ATP-requiring enzymes and a common nucleotide binding fold. EMBO J. 1982, 1, 945–951. [Google Scholar] [CrossRef]
  34. Krell, T.; Coggins, J.R.; Lapthorn, A.J. The three-dimensional structure of shikimate kinase. J. Mol. Biol. 1998, 278, 983–997. [Google Scholar] [CrossRef]
  35. Gu, Y.; Reshetnikova, L.; Li, Y.; Wu, Y.; Yan, H.; Singh, S.; Ji, X. Crystal structure of shikimate kinase from Mycobacterium tuberculosis reveals the dynamic role of the LID domain in catalysis. J. Mol. Biol. 2002, 319, 779–789. [Google Scholar] [CrossRef] [PubMed]
  36. Della-Cioppa, G.; Bauer, S.C.; Klein, B.K.; Shah, D.M.; Fraley, R.T.; Kishore, G.M. Translocation of the precursor of 5-enolpyruvylshikimate-3-phosphate synthase into chloroplasts of higher plants in vitro. Proc. Natl. Acad. Sci. USA 1986, 83, 6873–6877. [Google Scholar] [CrossRef] [Green Version]
  37. Colquhoun, T.A.; Schimmel, B.C.; Kim, J.Y.; Reinhardt, D.; Cline, K.; Clark, D.G. A petunia chorismate mutase specialized for the production of floral volatiles. Plant J. 2010, 61, 145–155. [Google Scholar] [CrossRef] [Green Version]
  38. Dal Cin, V.; Tieman, D.M.; Tohge, T.; McQuinn, R.; de Vos, R.C.; Osorio, S.; Schmelz, E.A.; Taylor, M.G.; Smits-Kroon, M.T.; Schuurink, R.C.; et al. Identification of genes in the phenylalanine metabolic pathway by ectopic expression of a MYB transcription factor in tomato fruit. Plant Cell 2011, 23, 2738–2753. [Google Scholar] [CrossRef]
  39. Maeda, H.; Shasany, A.K.; Schnepp, J.; Orlova, I.; Taguchi, G.; Cooper, B.R.; Rhodes, D.; Pichersky, E.; Dudareva, N. RNAi suppression of Arogenate Dehydratase1 reveals that phenylalanine is synthesized predominantly via the arogenate pathway in petunia petals. Plant Cell 2010, 22, 832–849. [Google Scholar] [CrossRef] [Green Version]
  40. Hoffmann, L.; Maury, S.; Martz, F.; Geoffroy, P.; Legrand, M. Purification, cloning, and properties of an acyltransferase controlling shikimate and quinate ester intermediates in phenylpropanoid metabolism. J. Biol. Chem. 2003, 278, 95–103. [Google Scholar] [CrossRef]
  41. Jones, J.D.; Henstrand, J.M.; Handa, A.K.; Herrmann, K.M.; Weller, S.C. Impaired wound induction of 3-deoxy-D-arabino-heptulosonate-7-phosphate (DAHP) synthase and altered stem development in transgenic potato plants expressing a DAHP synthase antisense construct. Plant Physiol. 1995, 108, 1413–1421. [Google Scholar] [CrossRef] [PubMed] [Green Version]
  42. Lewis, N.G.; Yamamoto, E. Lignin: Occurrence, biogenesis and biodegradation. Annu. Rev. Plant Physiol. Plant Mol. Biol. 1990, 41, 455–496. [Google Scholar] [CrossRef] [PubMed]
  43. Goers, S.K.; Jensen, R.A. The differential allosteric regulation of two chorismate-mutase isoenzymes of Nicotiana silvestris. Planta 1984, 162, 117–124. [Google Scholar] [CrossRef] [PubMed]
  44. Schmid, J.; Amrhein, N. Molecular organization of the shikimate pathway in higher plants. Phytochemistry 1995, 39, 737–749. [Google Scholar] [CrossRef]
  45. Swinney, D.C.; Mak, A.Y.; Barnett, J.; Ramesha, C.S. Differential allosteric regulation of prostaglandin H synthase 1 and 2 by arachidonic acid. J. Biol. Chem. 1997, 272, 12393–12398. [Google Scholar] [CrossRef] [PubMed] [Green Version]
  46. Tan, Y.; Liu, J.; Huang, F.; Guan, J.; Zhong, S.; Tang, N.; Zhao, J.; Yang, W.; Yu, Y. PhGRL2 protein, interacting with PhACO1, is Involved in flower senescence in the petunia. Mol. Plant 2014, 7, 1384–1387. [Google Scholar] [CrossRef] [PubMed] [Green Version]
  47. Yang, W.; Liu, J.; Tan, Y.; Zhong, S.; Tang, N.; Chen, G.; Yu, Y. Functional characterization of PhGR and PhGRL1 during flower senescence in the petunia. Plant Cell Rep. 2015, 34, 1561–1568. [Google Scholar] [CrossRef]
  48. Chen, C.; Chen, H.; Zhang, Y.; Thomas, H.R.; Frank, M.H.; He, Y.; Xia, R. TBtools: An Integrative Toolkit Developed for Interactive Analyses of Big Biological Data. Mol. Plant. 2020, 13, 1194–1202. [Google Scholar] [CrossRef]
  49. Liu, J.; Li, J.; Wang, H.; Fu, Z.; Liu, J.; Yu, Y. Identification and expression analysis of ERF transcription factor genes in petunia during flower senescence and in response to hormone treatments. J. Exp. Bot. 2011, 62, 825–840. [Google Scholar] [CrossRef]
  50. Locatelli, F.; Vannini, C.; Magnani, E.; Coraggio, I.; Bracale, M. Efficiency of transient transformation in tobacco protoplasts is independent of plasmid amount. Plant Cell Rep. 2003, 21, 865–871. [Google Scholar] [CrossRef]
  51. Pfaffl, M.W. A new mathematical model for relative quantification in real-time RT-PCR. Nucleic Acids Res. 2001, 29, E45. [Google Scholar] [CrossRef]
  52. Mallona, I.; Lischewski, S.; Weiss, J.; Hause, B.; Egea-Cortines, M. Validation of reference genes for quantitative real-time PCR during leaf and flower development in Petunia hybrida. BMC Plant Biol. 2010, 10, 4. [Google Scholar] [CrossRef] [PubMed] [Green Version]
  53. Broderick, S.R.; Jones, M.L. An optimized protocol to increase virus-induced gene silencing efficiency and minimize viral symptoms in petunia. Plant Mol. Biol. Rep. 2014, 32, 219–233. [Google Scholar] [CrossRef] [PubMed] [Green Version]
  54. Spitzer-Rimon, B.; Farhi, M.; Albo, B.; Cna’Ani, A.; Zvi, M.M.B.; Masci, T.; Edelbaum, O.; Yu, Y.; Shklarman, E.; Ovadis, M.; et al. The R2R3-MYB-like regulatory factor EOBI, acting downstream of EOBII, regulates scent production by activating ODO1 and structural scent-related genes in petunia. Plant Cell 2012, 24, 5089–5105. [Google Scholar] [CrossRef] [PubMed] [Green Version]
  55. Sambrook, J.; Maniatis, T.; Fritsch, E. Molecular Cloning: A Laboratory Manual; Cold Spring Harbor Laboratories: Cold Spring Harbor, NY, USA, 1989. [Google Scholar]
  56. Ai, T.N.; Naing, A.H.; Arun, M. Sucrose-induced anthocyanin accumulation in vegetative tissue of Petunia plants requires anthocyanin regulatory transcription factors. Plant Sci. 2016, 252, 144–150. [Google Scholar] [CrossRef] [PubMed]
  57. Mehrtens, F.; Kranz, H.; Bednarek, P.; Weisshaar, B. The Arabidopsis transcription factor MYB12 is a flavonol-specific regulator of phenylpropanoid biosynthesis. Plant Physiol. 2005, 138, 1083–1096. [Google Scholar] [CrossRef] [PubMed] [Green Version]
  58. Li, Q.; Song, J. Analysis of widely targeted metabolites of the euhalophyte Suaeda salsa under saline conditions provides new insights into salt tolerance and nutritional value in halophytic species. BMC Plant Biol. 2019, 19, 388. [Google Scholar] [CrossRef] [PubMed] [Green Version]
  59. Chen, W.; Gong, L.; Guo, Z.; Wang, W.; Zhang, H.; Liu, X.; Yu, S.; Xiong, L.; Luo, J. A novel Integrated method for large-scale detection, Identification, and quantification of widely targeted metabolites: Application in the study of rice metabolomics. Mol. Plant 2013, 6, 1769–1780. [Google Scholar] [CrossRef]
Figure 1. Subcellular location of PhSK. PhSK C-terminal GFP fusion proteins were transiently expressed in petunia protoplasts and visualized by confocal microscopy. Chl, chlorophyll. Scale bars: 5 μm. Images were processed by Zen 2010 (version 6.0, Carl Zeiss Microscopy GmbH, Germany) software.
Ijms 23 15964 g001
Figure 2. Expression patterns of PhSK determined by quantitative real-time PCR. (A) Three developmental stages of petunia leaves: stage 1 (young leaves, 1.0 cm), stage 2 (growth leaves, 2.5 cm), and stage 3 (mature leaves, 4.0 cm). (B) Six stages of petunia flower buds: 0.5 cm, 1 cm, 2 cm, 3 cm, 4 cm, and anthesis. (CE) Expression of PhSK in leaves, corollas, roots, and stems (C), in leaves in three stages (D), and in corollas during flower development (E). (A) Bar = 1 cm, (B) bar = 2 cm. Letters a–e mean significant differences between data sets. The datas with same letter mean non-significance. The datas with different letters mean significant differences.
Ijms 23 15964 g002
Figure 3. Plant phenotype of PhSK-silenced petunia vegetative organs. (A) Four-week-old control plant (left) and PhSK-silenced plant (right). (B) The vertical view of the 4-week-old control plant (left) and PhSK-silenced plant (right). (C) Internodes of the control plant (left) and PhSK-silenced plant (right). (D) Leaves of the control plant (top) and PhSK-silenced plant (bottom). (A,B) Bar = 2 cm, (C,D) bar = 1 cm.
Ijms 23 15964 g003
Figure 4. Effect of PhSK silencing on flowers. (A,B) Top view, back view, and side view of control flower (A) and PhSK-silenced flower (B). (C) Calyces of the control plants (top) and PhSK-silenced plants (bottom). (D) Sepals of the control plants (left) and PhSK-silenced plants (right). (E) Pistils of the control plants (left) and PhSK-silenced plants (right). (F) Stigmas of the control plants (left) and PhSK-silenced plants (right). (G) Stamens of the control plants (top) and PhSK-silenced plants (bottom). (AD) Bar = 1 cm, (E) bar = 0.5 cm, (F,G) bar = 0.2 cm.
Ijms 23 15964 g004
Figure 5. Effects of pTRV2-PhSK treatment on the anthocyanin content (A), enzymatic activity of SK (B), and shikimate content (C). The data are presented as the means ± SDs (n = 3). The statistical analysis was performed using the one-way analysis of variance (ANOVA) followed by Duncan’s multiple range test (DMRT) with three biological replicates. * indicates significant differences at the p ≤ 0.05 level.
Ijms 23 15964 g005
Figure 6. Changes in the corolla flavonoid metabolome profile induced by PhSK silencing. (A) Heat map of the differential metabolites in PhSK-silenced compared with control petunia corollas. Green indicates a decrease in differentially expressed metabolites, and red indicates an increase in differentially expressed metabolites. (B) KEGG enrichment analysis of the differentially abundant metabolites in PhSK-silenced and control petunia corollas. Data were processed by ggplot2 (version 3.3.0, https://CRAN.R-project.org/package=ggplot2, accessed on 1 November 2022) software.
Ijms 23 15964 g006
Figure 7. Effects of pTRV2-PhSK treatment on the expression of PhDHQSDH, PhEPSPS1, PhCHSA, and PhF3′5′H in corollas. Cyclophilin (CYP, accession no. EST883944) was used as the internal reference gene for the quantification of cDNA abundance. The data are presented as the means ± SDs (n = 3). The statistical analysis was performed using the one-way analysis of variance (ANOVA) followed by Duncan’s multiple range test (DMRT) with three biological replicates. * indicates significant differences at the p ≤ 0.05 level.
Ijms 23 15964 g007
Table 1. Effects of PhSK silencing on petunia plant growth.
pTRV2-GFPpTRV2-PhSKpTRV2-PhSK/
pTRV2-GFP (%)
Length of pedicels (cm)2.71 ± 0.671.58 ± 0.47 *58.30
Length of sepals (cm)2.05 ± 0.201.69 ± 0.20 *82.43
Width of sepals (cm)0.58 ± 0.090.56 ± 0.1696.55
Length–width ratio of sepals (cm)26.57 ± 2.8835.11 ± 4.49 *132.14
Circumference of corolla tube (cm)2.24 ± 0.191.85 ± 0.25 *82.59
Length of corolla tube (cm)3.12 ± 0.093.23 ± 0.27103.53
Diameter of corollas (cm)6.73 ± 0.375.76 ± 0.59 *85.59
Length of internodes (cm)2.61 ± 0.551.52 ± 0.37 *58.24
Data are the means ± SEs from 15 to 20 samples. Statistical analysis was performed using Student’s t-test with 15 to 20 replicates. * indicates significant differences at the p ≤ 0.05 level.
Table 2. Seven anthocyanins changed significantly in PhSK-silenced and control petunia corollas.
CompoundsVIPFold ChangeType
Cyanidin-3-O-(2″-O-glucosyl)rutinoside1.090.46down
Cyanidin-3-O-(6″-O-malonyl)sophoroside-5-O-glucoside1.040.47down
Cyanidin-3,3′-di-O-glucoside-7-O-(6″-O-caffeoyl)glucoside1.140.48down
Cyanidin-3-O-glucoside (Kuromanin)1.090.48down
Cyanidin-3-O-sophoroside-5-O-glucoside1.120.48down
Delphinidin-3-O-rutinoside-7-O-glucoside1.140.49down
Petunidin-3-O-(6″-O-feruloyl)rutinoside-5-O-glucoside1.092.02up
The criteria used for this screening included a fold change value ≥ 2 or ≤0.5 and a VIP value ≥ 1.
Publisher’s Note: MDPI stays neutral with regard to jurisdictional claims in published maps and institutional affiliations.

