
Cardio-Vascular Interaction Evaluated by Speckle-Tracking Echocardiography and Cardio-Ankle Vascular Index in Hypertensive Patients
 ,
,
Abstract
:1. Introduction
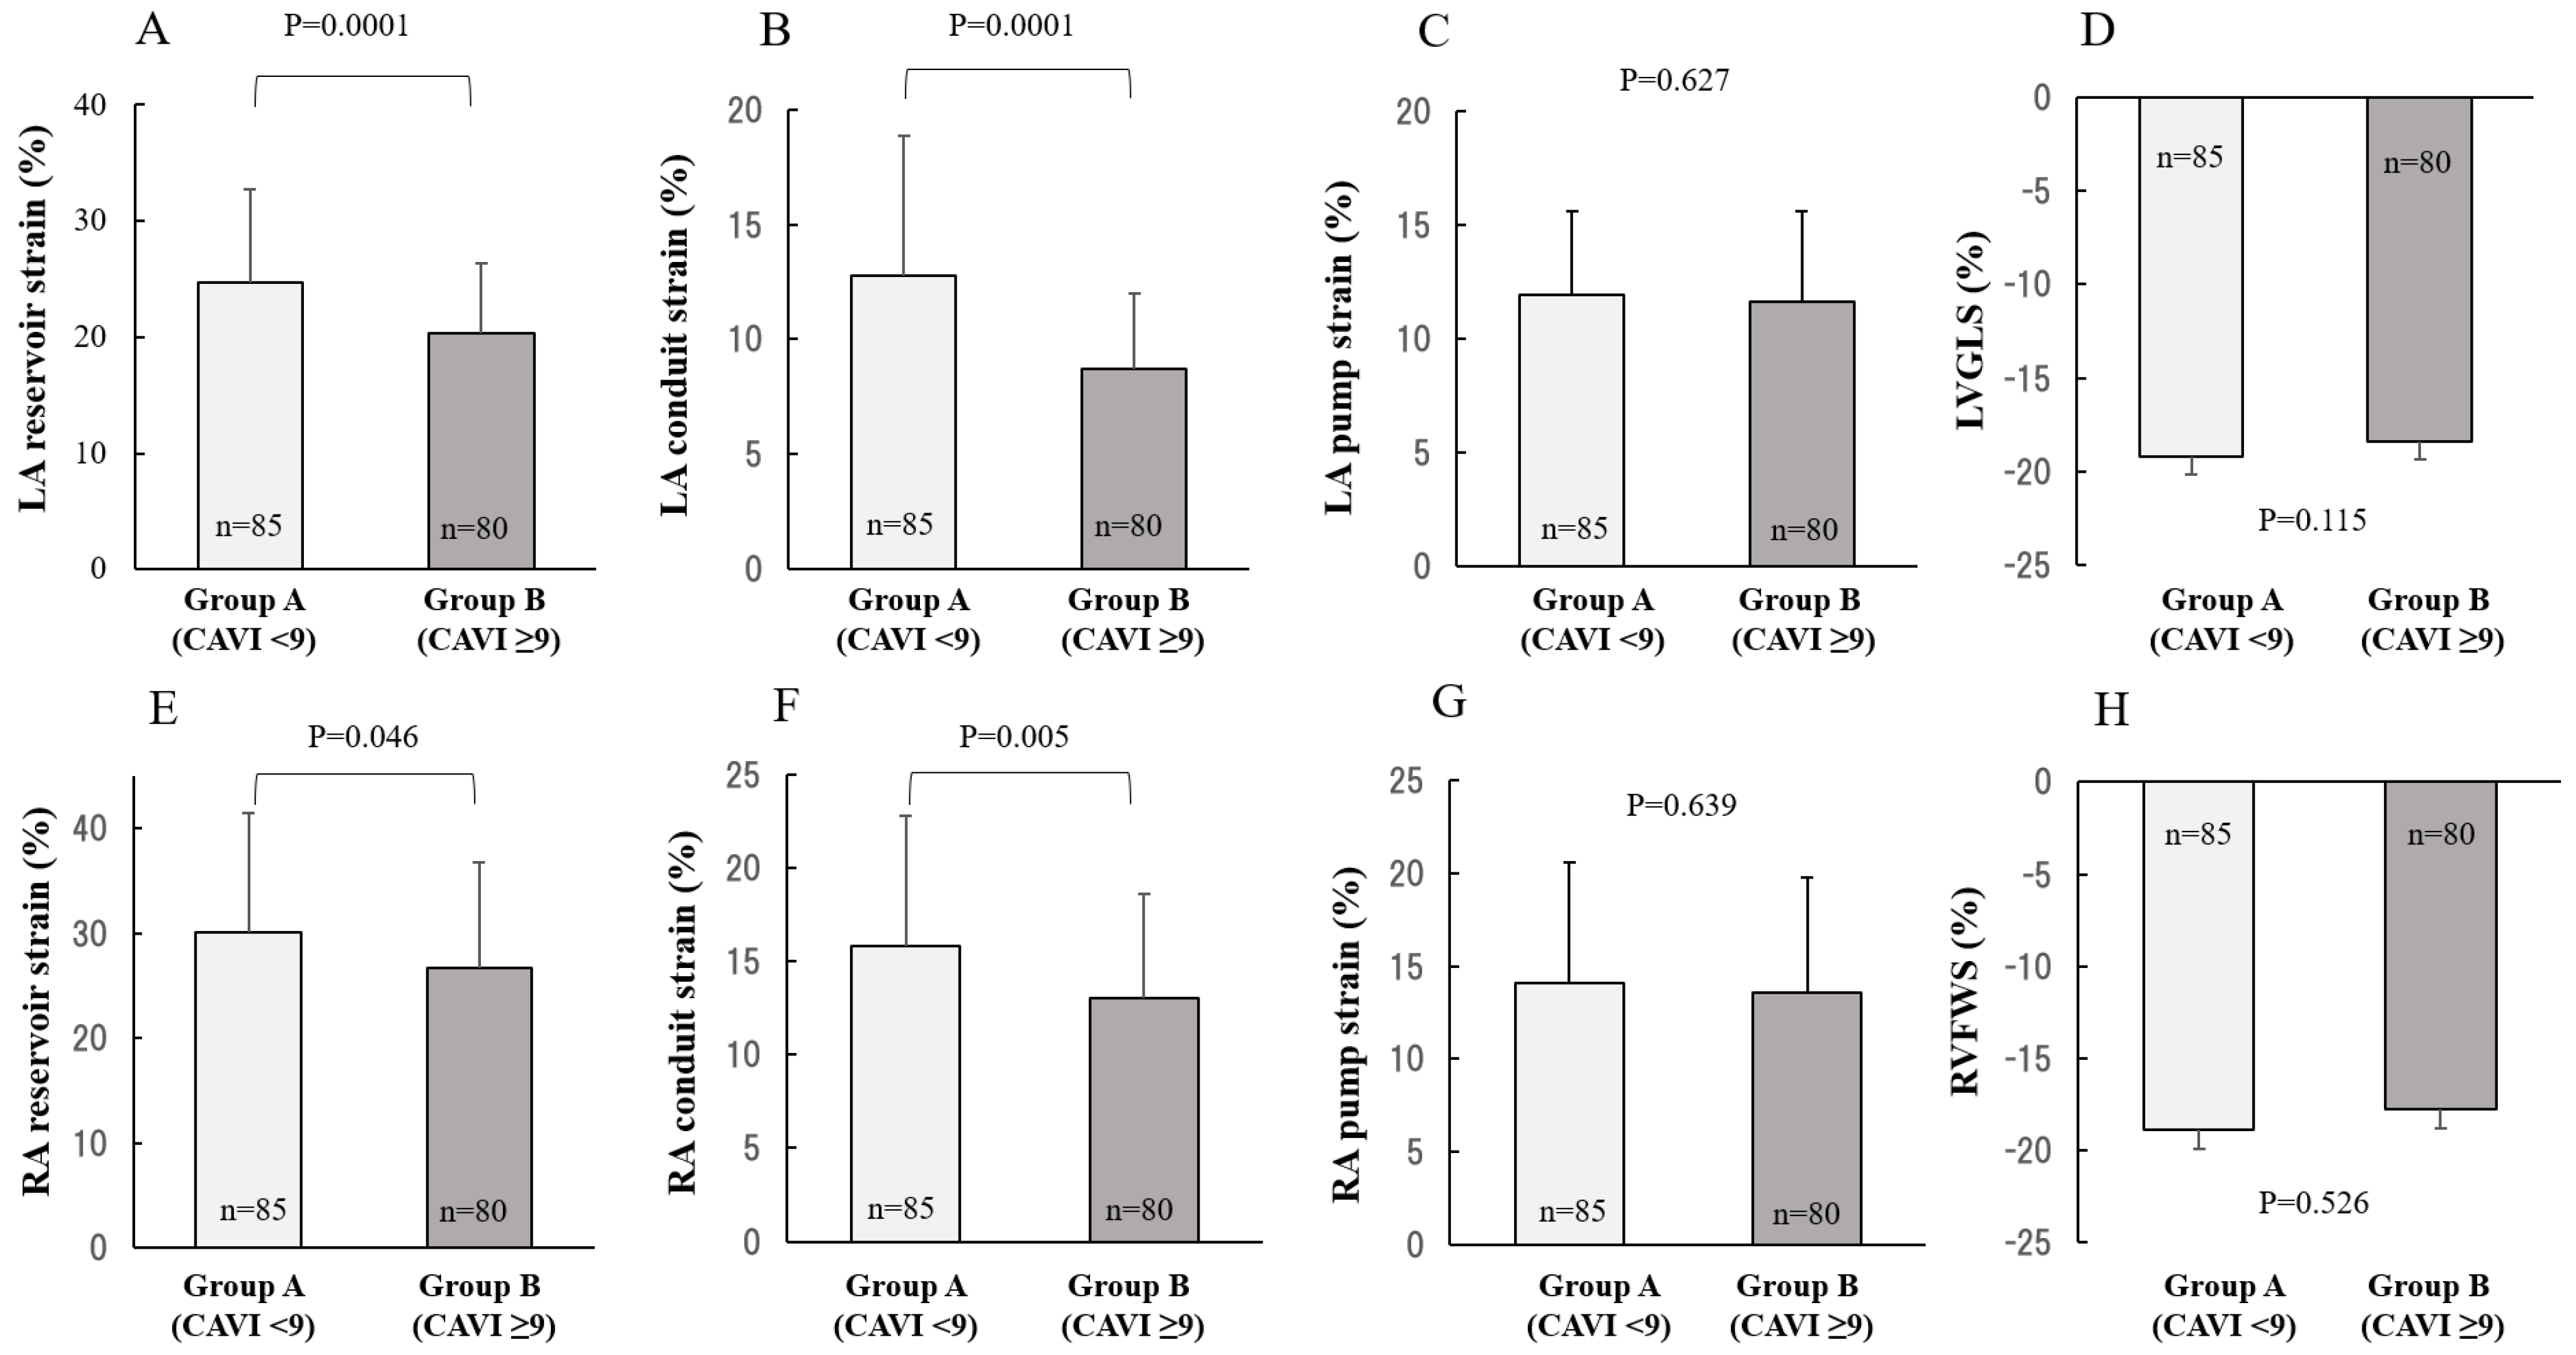
2. Results
2.1. Characteristics of the Study Population
2.2. Comparison between CAVI and 2DSTE
3. Discussion
Study Limitations
4. Materials and Methods
4.1. Study Patients
4.2. Measurement of the Cardio-Ankle Vascular Index
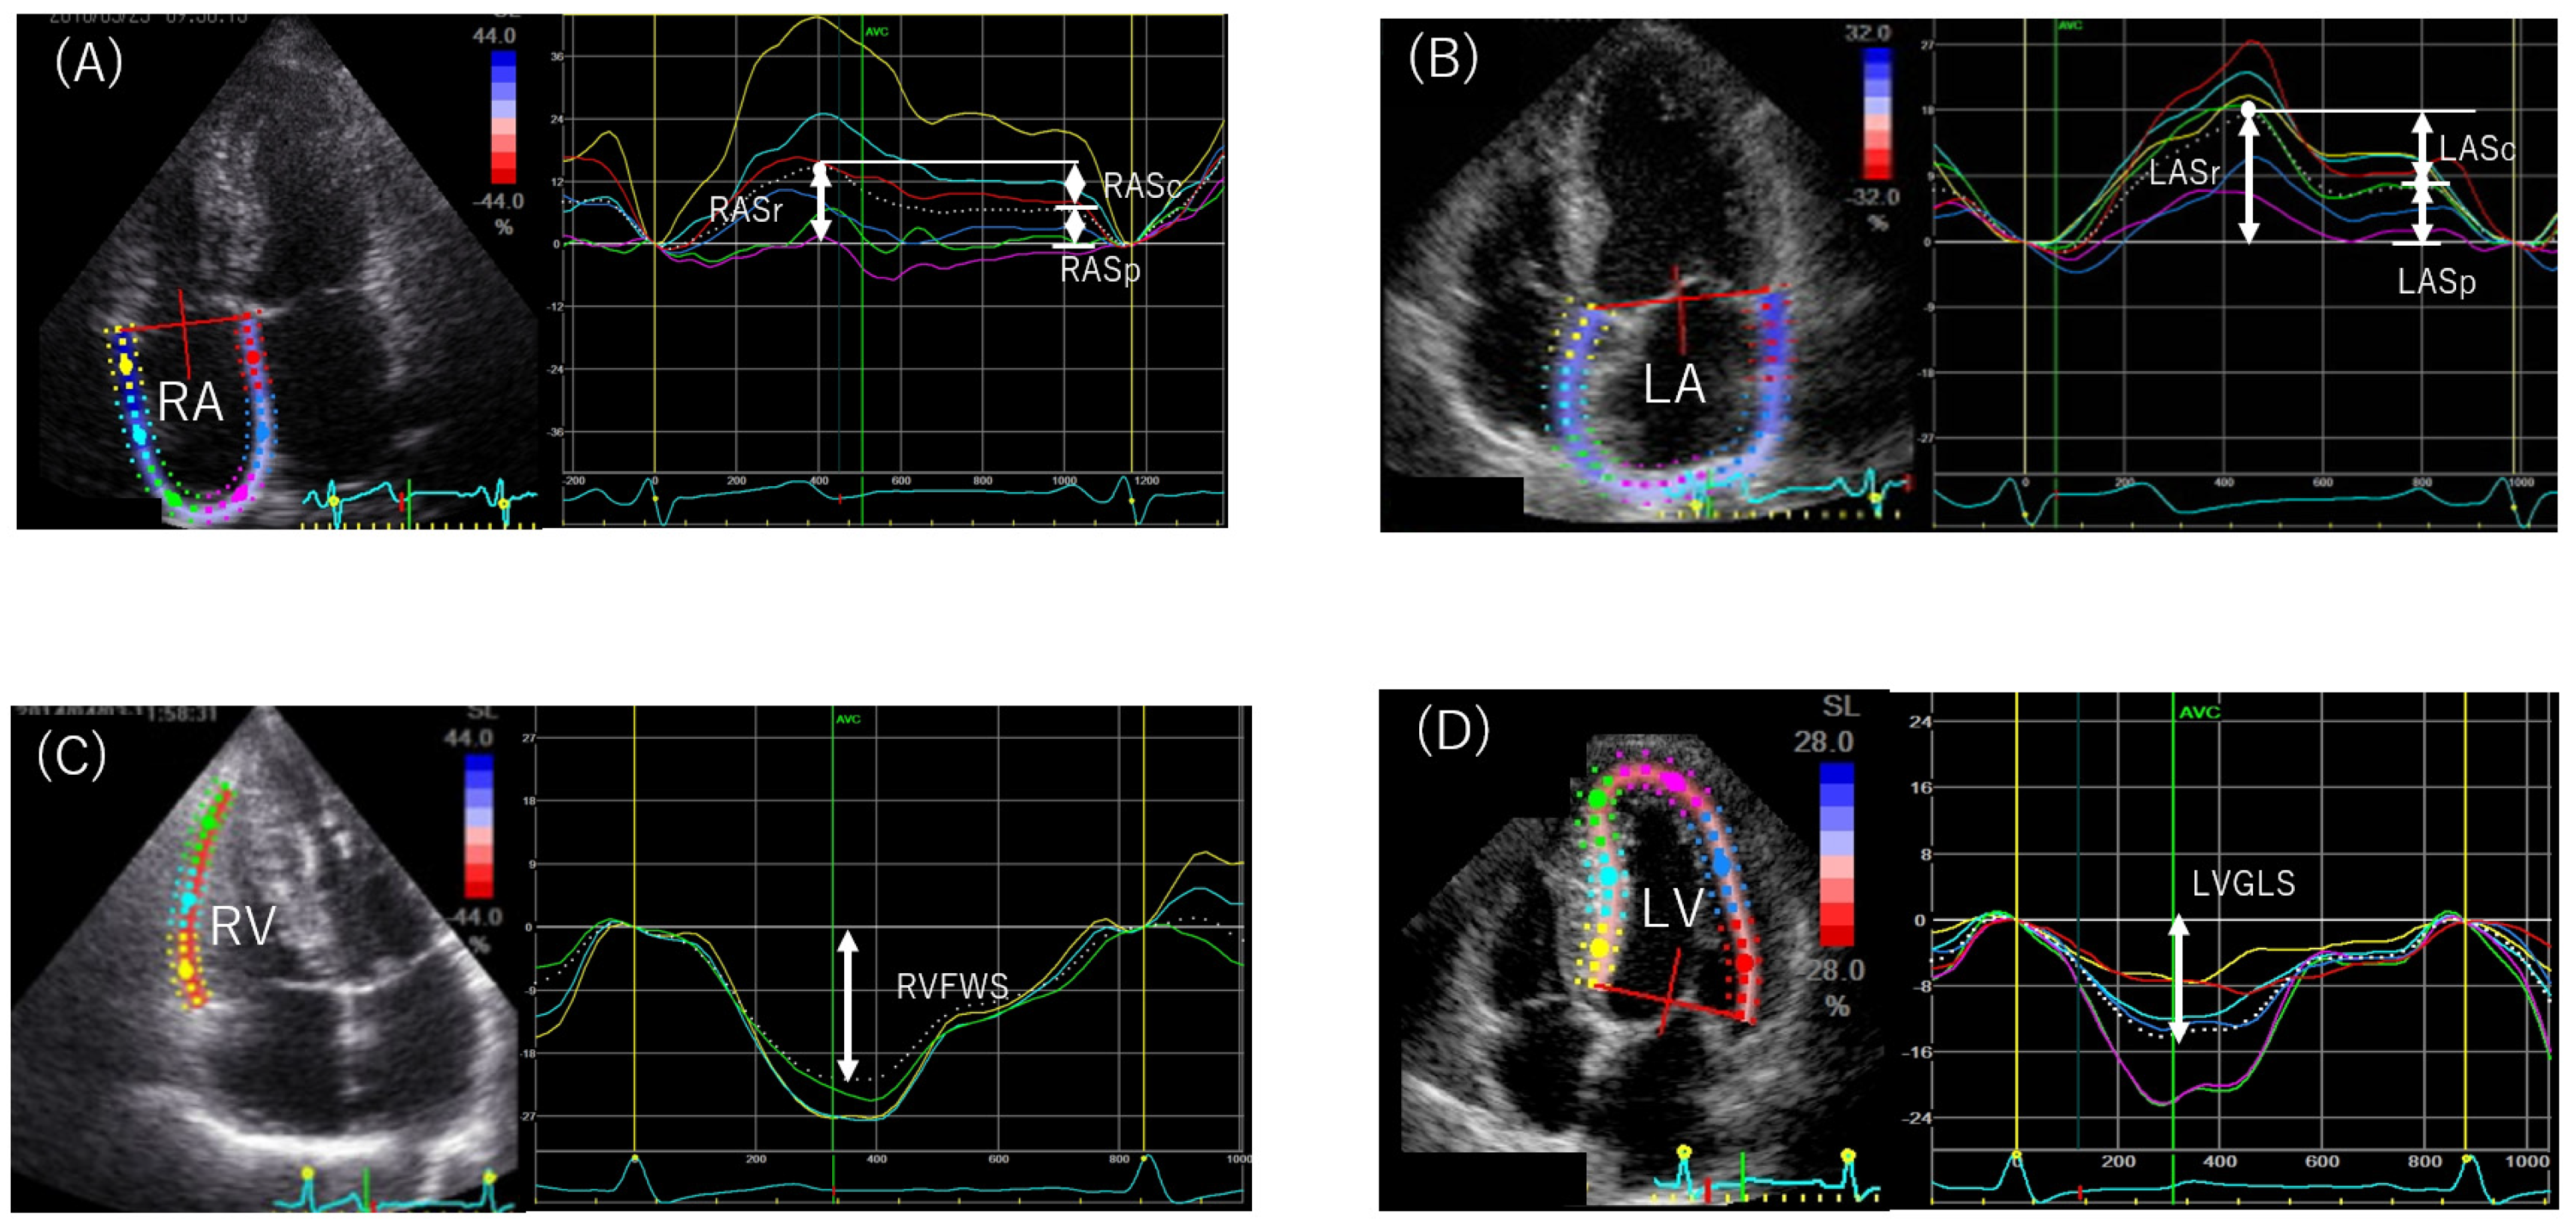
4.3. Echocardiographic Examination
4.3.1. Two-Dimensional Echocardiography
4.3.2. Speckle-Tracking Echocardiography
4.4. Statistical Analysis
5. Conclusions
Author Contributions
Funding
Informed Consent Statement
Data Availability Statement
Acknowledgments
Conflicts of Interest
References
- Dzau, V.J.; Antman, E.M.; Black, H.R.; Hayes, D.L.; Manson, J.E.; Plutzky, J.; Popma, J.J.; Stevenson, W. The Cardiovascular Disease Continuum Validated: Clinical Evidence of Improved Patient Outcomes. Circulation 2006, 114, 2850–2870. [Google Scholar] [CrossRef] [PubMed]
- Chen, G.; McAlister, F.A.; Walker, R.L.; Hemmelgarn, B.R.; Campbell, N.R. Cardiovascular outcomes in Framingham participants with diabetes the importance of blood pressure. Hypertension 2011, 57, 891–897. [Google Scholar] [CrossRef] [PubMed] [Green Version]
- Shirai, K.; Utino, J.; Otsuka, K.; Takata, M. A noble blood pressure-independent arterial wall stiffness parameter; cardio-ankle vascular index (CAVI). J. Atheroscler. Thromb. 2006, 13, 101–107. [Google Scholar] [CrossRef] [PubMed] [Green Version]
- Shirai, K.; Song, M.; Suzuki, J.; Kurosu, T.; Oyama, T.; Nagayama, D.; Miyashita, Y.; Yamamura, S.; Takahashi, M. Contradictory Effects of β1- and α1-Aderenergic Receptor Blockers on Cardio-Ankle Vascular Stiffness Index (CAVI). J. Atheroscler. Thromb. 2011, 18, 49–55. [Google Scholar] [CrossRef] [PubMed] [Green Version]
- Miyoshi, T.; Ito, H.; Shirai, K.; Horinaka, S.; Higaki, J.; Yamamura, S.; Saiki, A.; Takahashi, M.; Masaki, M.; Okura, T.; et al. Predictive Value of the Cardio-Ankle Vascular Index for Cardiovascular Events in Patients at Cardiovascular Risk. J. Am. Heart Assoc. 2021, 10, e020103. [Google Scholar] [CrossRef] [PubMed]
- Mondillo, S.; Cameli, M.; Caputo, M.L.; Lisi, M.; Palmerini, E.; Padeletti, M.; Ballo, P. Early Detection of Left Atrial Strain Abnormalities by Speckle-Tracking in Hypertensive and Diabetic Patients with Normal Left Atrial Size. J. Am. Soc. Echocardiogr. 2011, 24, 898–908. [Google Scholar] [CrossRef]
- Mizuguchi, Y.; Oishi, Y.; Tanaka, H.; Miyoshi, H.; Ishimoto, T.; Nagase, N.; Oki, T. Arterial Stiffness Is Associated With Left Ventricular Diastolic Function in Patients With Cardiovascular Risk Factors: Early Detection With the Use of Cardio-Ankle Vascular Index and Ultrasonic Strain Imaging. J. Card. Fail. 2007, 13, 744–751. [Google Scholar] [CrossRef]
- Tabata, T.; Shimizu, K.; Morinaga, Y.; Tanji, N.; Yoshida, R.; Iwakawa, M.; Kiyokawa, H.; Takada, N. The Relationship Between Cardio-Ankle Vascular Index and Left Atrial Phasic Function in Hypertensive Patients with Preserved Ejection Fraction. Front. Med. Technol. 2021, 3, 48. [Google Scholar] [CrossRef] [PubMed]
- Hayashi, K.; Yamamoto, T.; Takahara, A.; Shirai, K. Clinical assessment of arterial stiffness with cardio-ankle vascular index: Theory and applications. J. Hypertens. 2015, 33, 1742–1757. [Google Scholar] [CrossRef] [PubMed]
- Laurent, S.; Cockcroft, J.; Van Bortel, L.; Boutouyrie, P.; Giannattasio, C.; Hayoz, D.; Pannier, B.; Vlachopoulos, C.; Wilkinson, I.; Struijker-Boudier, H. Expert consensus document on arterial stiffness: Methodological issues and clinical applications. Eur. Heart J. 2006, 27, 2588–2605. [Google Scholar] [CrossRef]
- Mitchell, G.F.; Hwang, S.-J.; Vasan, R.S.; Larson, M.; Pencina, M.J.; Hamburg, N.; Vita, J.; Levy, D.; Benjamin, E. Arterial Stiffness and Cardiovascular Events. Circulation 2010, 121, 505–511. [Google Scholar] [CrossRef] [PubMed] [Green Version]
- Hayashi, K.; Handa, H.; Nagasawa, S.; Okumura, A.; Moritake, K. Stiffness and elastic behavior of human intracranial and extracranial arteries. J. Biomech. 1980, 13, 175–184. [Google Scholar] [CrossRef]
- Shimizu, K.; Tabata, T.; Sasaki, T. The Relationship Between Various Left Ventricular Geometries and the Cardio Ankle Vascular Index. JCVM 2020, 8, 1–11. [Google Scholar] [CrossRef]
- Shimizu, K.; Tabata, T.; Kiyokawa, H.; Morinaga, Y.; Sato, S.; Mikamo, H.; Nakagami, T.; Iiduka, T.; Shirai, K.; Noro, M. A Case Demonstrating the Cardio-Vascular Interaction by a New Cardio-Ankle Vascular Index During the Treatment of Concentric. Hypertrophy 2019, 10, 54–58. [Google Scholar] [CrossRef]
- Yoshida, Y.; Nakanishi, K.; Daimon, M.; Ishiwata, J.; Sawada, N.; Hirokawa, M.; Kaneko, H.; Nakao, T.; Mizuno, Y.; Morita, H.; et al. Association of arterial stiffness with left atrial structure and phasic function: A community-based cohort study. J. Hypertens. 2020, 38, 1140–1148. [Google Scholar] [CrossRef]
- Nakamura, K.; Takagi, T.; Kogame, N.; Hashimoto, H.; Asami, M.; Toyoda, Y.; Enomoto, Y.; Hara, H.; Noro, M.; Sugi, K.; et al. The Association of Cardio-Ankle Vascular Index (CAVI) with Biatrial Remodeling in Atrial Fibrillation. J. Atheroscler. Thromb. 2021, 28, 590–603. [Google Scholar] [CrossRef]
- Tatebe, S.; Sugimura, K.; Aoki, T.; Miura, M.; Nochioka, K.; Yaoita, N.; Suzuki, H.; Sato, H.; Yamamoto, S.; Satoh, K.; et al. Multiple Beneficial Effects of Balloon Pulmonary Angioplasty in Patients With Chronic Thromboembolic Pulmonary Hypertension. Circ. J. 2016, 80, 980–988. [Google Scholar] [CrossRef] [PubMed] [Green Version]
- Radchenko, G.; Zhyvylo, I.; Titov, E.; Sirenko, Y.M. Systemic Arterial Stiffness in New Diagnosed Idiopathic Pulmonary Arterial Hypertension Patients. Vasc. Health Risk Manag. 2020, 16, 29–39. [Google Scholar] [CrossRef] [PubMed] [Green Version]
- Radchenko, G.D.; Sirenko, Y.M. Prognostic Significance of Systemic Arterial Stiffness Evaluated by Cardio-Ankle Vascular Index in Patients with Idiopathic Pulmonary Hypertension. Vasc. Health Risk Manag. 2021, 17, 77–93. [Google Scholar] [CrossRef] [PubMed]
- Papa, S.; Miotti, C.; Manzi, G.; Scoccia, G.; Luongo, F.; Toto, F.; Malerba, C.; Cedrone, N.; Canuti, E.; Caputo, A.; et al. Peripheral Arterial Stiffness in Acute Pulmonary Embolism and Pulmonary Hypertension at Short-Term Follow-Up. J. Clin. Med. 2021, 10, 3008. [Google Scholar] [CrossRef] [PubMed]
- Sato, S.; Shimizu, K.; Ito, T.; Tsubono, M.; Ogawa, A.; Sasaki, T.; Takahashi, M.; Noro, M.; Shirai, K. Increased Arterial Stiffness in Chronic Thromboembolic Pulmonary Hypertension Was Improved with Riociguat and Balloon Pulmonary Angioplasty: A Case Report. Int. Med. Case Rep. J. 2021, 14, 191–197. [Google Scholar] [CrossRef] [PubMed]
- Miyashita, Y.; Saiki, A.; Endo, K.; Ban, N.; Yamaguchi, T.; Kawana, H.; Nagayama, D.; Ohira, M.; Oyama, T.; Shirai, K. Effects of Olmesartan, an Angiotensin II Receptor Blocker, and Amlodipine, a Calcium Channel Blocker, on Cardio-Ankle Vascular Index (CAVI) in Type 2 Diabetic Patients with Hypertension. J. Atheroscler. Thromb. 2009, 16, 621–626. [Google Scholar] [CrossRef] [PubMed] [Green Version]
- Shibata, T.; Tsutsumi, J.; Hasegawa, J.; Sato, N.; Murashima, E.; Mori, C.; Hongo, K.; Yoshimura, M. Effects of Add-on Therapy Consisting of a Selective Mineralocorticoid Receptor Blocker on Arterial Stiffness in Patients with Uncontrolled Hypertension. Intern. Med. 2015, 54, 1583–1589. [Google Scholar] [CrossRef] [PubMed] [Green Version]
- Miyashita, Y.; Endo, K.; Saiki, A.; Ban, N.; Yamaguchi, T.; Kawana, H.; Nagayama, D.; Ohira, M.; Oyama, T.; Shirai, K. Effects of Pitavastatin, a 3-Hydroxy-3-Methylglutaryl Coenzyme A Reductase Inhibitor, on Cardio-Ankle Vascular Index in Type 2 Diabetic Patients. J. Atheroscler. Thromb. 2009, 16, 539–545. [Google Scholar] [CrossRef] [PubMed] [Green Version]
- Kato, M.; Kumagai, T.; Naito, R.; Maeno, K.; Kasagi, S.; Kawana, F.; Ishiwata, S.; Narui, K.; Kasai, T. Change in cardio-ankle vascular index by long-term continuous positive airway pressure therapy for obstructive sleep apnea. J. Cardiol. 2011, 58, 74–82. [Google Scholar] [CrossRef] [Green Version]
- Shimizu, K.; Yamamoto, T.; Shirai, K. Arterial stiffness, as monitored by cardio–ankle vascular index, is affected by obstructive sleep apnea, blood glucose control, and body weight—A case with 8 years follow up. Int. Med. Case Rep. J. 2016, 9, 231–235. [Google Scholar] [CrossRef] [Green Version]
- Nagayama, D.; Saiki, A.; Endo, K.; Yamaguchi, T.; Ban, N.; Kawana, H.; Ohira, M.; Oyama, T.; Miyashita, Y.; Shirai, K. Improvement of cardio-ankle vascular index by glimepiride in type 2 diabetic patients. Int. J. Clin. Pract. 2010, 64, 1796–1801. [Google Scholar] [CrossRef] [PubMed]
- Ohira, M.; Yamaguchi, T.; Saiki, A.; Ban, N.; Kawana, H.; Nagumo, A.; Murano, T.; Shirai, K.; Tatsuno, I. Pioglitazone improves the cardio-ankle vascular index in patients with type 2 diabetes mellitus treated with metformin. Diabetes, Metab. Syndr. Obesity: Targets Ther. 2014, 7, 313–319. [Google Scholar] [CrossRef] [Green Version]
- Nagayama, D.; Endo, K.; Ohira, M.; Yamaguchi, T.; Ban, N.; Kawana, H.; Nagumo, A.; Saiki, A.; Oyama, T.; Miyashita, Y.; et al. Effects of body weight reduction on cardio-ankle vascular index (CAVI). Obes. Res. Clin. Pract. 2013, 7, e139–e145. [Google Scholar] [CrossRef]
- Noike, H.; Nakamura, K.; Sugiyama, Y.; Iizuka, T.; Shimizu, K.; Takahashi, M.; Hirano, K.; Suzuki, M.; Mikamo, H.; Nakagami, T.; et al. Changes in Cardio-Ankle Vascular Index in Smoking Cessation. J. Atheroscler. Thromb. 2010, 17, 517–525. [Google Scholar] [CrossRef]
- Sato, S.; Takahashi, M.; Mikamo, H.; Kawazoe, M.; Iizuka, T.; Shimizu, K.; Noro, M.; Shirai, K. Effect of nicorandil administration on cardiac burden and cardio-ankle vascular index after coronary intervention. Heart Vessel. 2020, 35, 1664–1671. [Google Scholar] [CrossRef] [PubMed]
- Willens, H.J.; Fertel, D.P.; Qin, J.; Labrador, E.; Lowery, M.H. Effects of age and pulmonary arterial hypertension on the different phases of right atrial function. Int. J. Cardiovasc. Imaging 2008, 24, 703–710. [Google Scholar] [CrossRef] [PubMed]
- Tadic, M.; Cuspidi, C.; Kocijancic, V.; Celic, V.; Vukomanovic, V. Does Left Ventricular Geometric Patterns Impact Right Atrial Phasic Function? Findings from the Hypertensive Population. Echocardiography 2016, 33, 1186–1194. [Google Scholar] [CrossRef]
- von Roeder, M.; Kowallick, J.T.; Rommel, K.-P.; Blazek, S.; Besler, C.; Fengler, K.; Lotz, J.; Hasenfuß, G.; Lücke, C.; Gutberlet, M.; et al. Right atrial–right ventricular coupling in heart failure with preserved ejection fraction. Clin. Res. Cardiol. 2019, 109, 54–66. [Google Scholar] [CrossRef]
- Schuster, A.; Backhaus, S.J.; Stiermaier, T.; Navarra, J.-L.; Uhlig, J.; Rommel, K.-P.; Koschalka, A.; Kowallick, J.T.; Bigalke, B.; Kutty, S.; et al. Impact of Right Atrial Physiology on Heart Failure and Adverse Events after Myocardial Infarction. J. Clin. Med. 2020, 9, 210. [Google Scholar] [CrossRef] [PubMed] [Green Version]
- Singh, A.; Addetia, K.; Maffessanti, F.; Mor-Avi, V.; Lang, R.M. LA strain for categorization of LV diastolic dysfunction. JACC Cardiovasc. Imaging 2017, 10, 735–743. [Google Scholar] [CrossRef] [PubMed]
- Namekata, T.; Suzuki, K.; Ishizuka, N.; Shirai, K. Establishing baseline criteria of cardio-ankle vascular index as a new indicator of arteriosclerosis: A cross-sectional study. BMC Cardiovasc. Disord. 2011, 11, 51. [Google Scholar] [CrossRef] [PubMed] [Green Version]
- Saiki, A.; Ohira, M.; Yamaguchi, T.; Nagayama, D.; Shimizu, N.; Shirai, K.; Tatsuno, I. New Horizons of Arterial Stiffness Developed Using Cardio-Ankle Vascular Index (CAVI). J. Atheroscler. Thromb. 2020, 27, 732–748. [Google Scholar] [CrossRef]
- Wright, L.M.; Dwyer, N.; Wahi, S.; Marwick, T.H. Association with right atrial strain with right atrial pressure: An invasive validation study. Int. J. Cardiovasc. Imaging 2018, 34, 1541–1548. [Google Scholar] [CrossRef]
- Tanaka, A.; Tomiyama, H.; Maruhashi, T.; Matsuzawa, Y.; Miyoshi, T.; Kabutoya, T.; Kario, K.; Sugiyama, S.; Munakata, M.; Ito, H.; et al. Physiological Diagnostic Criteria for Vascular Failure. Hypertension 2018, 72, 1060–1071. [Google Scholar] [CrossRef]
- Lang, R.M.; Badano, L.P.; Mor-Avi, V.; Afilalo, J.; Armstrong, A.; Ernande, L.; Flachskampf, F.A.; Foster, E.; Goldstein, S.A.; Kuznetsova, T.; et al. Recommendations for Cardiac Chamber Quantification by Echocardiography in Adults: An Update from the American Society of Echocardiography and the European Association of Cardiovascular Imaging. J. Am. Soc. Echocardiogr. 2015, 28, 1–39.e14. [Google Scholar] [CrossRef] [PubMed] [Green Version]
- Badano, L.P.; Kolias, T.J.; Muraru, D.; Abraham, T.P.; Aurigemma, G.; Edvardsen, T.; D’Hooge, J.; Donal, E.; Fraser, A.G.; Marwick, T.; et al. Standardization of left atrial, right ventricular, and right atrial deformation imaging using two-dimensional speckle tracking echocardiography: A consensus document of the EACVI/ASE/Industry Task Force to standardize deformation imaging. Eur. Heart J. Cardiovasc. Imaging 2018, 19, 591–600. [Google Scholar] [CrossRef] [PubMed]
- Sareban, M.; Winkert, K.; Sperlich, B.; Berger, M.M.; Niebauer, J.; Steinacker, J.M.; Treff, G. Speckle tracking-derived bi-atrial strain before and after eleven weeks of training in elite rowers. Sci. Rep. 2018, 8, 14300. [Google Scholar] [CrossRef] [Green Version]
- Fukuda, Y.; Tanaka, H.; Sugiyama, D.; Ryo, K.; Onishi, T.; Fukuya, H.; Nogami, M.; Ohno, Y.; Emoto, N.; Kawai, H.; et al. Utility of Right Ventricular Free Wall Speckle-Tracking Strain for Evaluation of Right Ventricular Performance in Patients with Pulmonary Hypertension. J. Am. Soc. Echocardiogr. 2011, 24, 1101–1108. [Google Scholar] [CrossRef]
- Faul, F.; Erdfelder, E.; Lang, A.-G.; Buchner, A. G*Power 3: A flexible statistical power analysis program for the social, behavioral, and biomedical sciences. Behav. Res. Methods 2007, 39, 175–191. [Google Scholar] [CrossRef] [PubMed]


| Clinical Parameter | All Subjects (N = 165) | Group A (N = 85) | Group B (N = 80) | p Value |
|---|---|---|---|---|
| age (years) | 69.0 (59.5, 75.0) | 64.0 (53.5, 72.5) | 72.0 (66.0, 76.0) | 0.0001 |
| male, n (%) | 119 (72) | 61 (72) | 58 (73) | 0.916 |
| BMI (kg/m2) | 23.4 (21.2, 25.7) | 23.6 (21.0, 25.9) | 23.4 (21.9, 25.1) | 0.872 |
| heart rate (beats/min) | 67.0 (59.0, 87.0) | 68.0 (60.0, 78.0) | 67.0 (58.3, 77.0) | 0.393 |
| SBP (mmHg) | 135.0 (123.0, 144.0) | 131.0 (119.5, 142.5) | 138.0 (127.0, 144.0) | 0.09 |
| DBP (mmHg) | 81.0 (74.0, 87.0) | 82.0 (74.0, 88.5) | 81.0 (74.5, 85.0) | 0.658 |
| BP Category | ||||
| normal, n (%) | 31 (19) | 21 (25) | 10 (13) | 0.045 |
| elevated, n (%) | 29 (18) | 16 (19) | 13 (16) | 0.664 |
| stage1 HT, n (%) | 38 (23) | 22 (26) | 16 (20) | 0.370 |
| stage2 HT, n (%) | 67 (41) | 26 (31) | 41 (51) | 0.010 |
| diabetes mellitus, n (%) | 65 (39) | 24 (28) | 41 (51) | 0.002 |
| hyperlipidemia, n (%) | 102 (62) | 48 (56) | 54 (68) | 0.145 |
| CAD, n (%) | 34 (21) | 11 (13) | 23 (29) | 0.012 |
| CVD, n (%) | 15 (9) | 10 (12) | 5 (6) | 0.218 |
| creatinine (mg/dL) | 0.80 (0.65, 0.93) | 0.79 (0.64, 0.90) | 0.80 (0.65, 0.96) | 0.462 |
| HbA1c (%) | 6.0 (5.7, 7.0) | 5.9 (5.6, 6.7) | 6.2 (5.8, 7.3) | 0.051 |
| BNP (pg/dL) | 21.2 (11.0, 49.8) | 18.0 (10.0, 31.0) | 30.0 (13.9, 58.8) | 0.003 |
| CAVI | 8.9 (8.2, 9.7) | 8.2 (7.6, 8.7) | 9.7 (9.3, 10.2) | 0.0001 |
| medications | ||||
| diuretics, n (%) | 12 (7) | 7 (8) | 5 (6) | 0.624 |
| α-blocker, n (%) | 2 (1) | 1 (1) | 1 (1) | 0.966 |
| β-blocker, n (%) | 24 (15) | 9 (11) | 15 (9) | 0.137 |
| ACE/ARB, n (%) | 50 (30) | 23 (27) | 27 (34) | 0.35 |
| calcium blocker, n (%) | 67 (41) | 33 (39) | 34 (43) | 0.631 |
| Traditional Echocardiographic Parameters | All Subjects (N = 165) | Group A (N = 85) | Group B (N = 80) | p Value |
|---|---|---|---|---|
| LV end-diastolic diameter (mm) | 42.4 ± 5.1 | 42.4 ± 5.1 | 41.4 ± 5.1 | 0.188 |
| LV end-systolic diameter (mm) | 25.0 (22.0, 28.0) | 25.0 (22.0, 28.0) | 25.0 (22.0, 28.0) | 0.898 |
| LV ejection fraction (%) | 68.0 (66.0, 70.0) | 68.0 (66.0, 69.0) | 67.0 (65.0, 71.0) | 0.516 |
| LV stroke volume (mL) | 55.3 ± 15.8 | 56.8 ± 16.0 | 53.8 ± 15.6 | 0.223 |
| LV mass index (g/m2) | 73.0 (57.0, 91.5) | 67.0 (55.0, 82.5) | 75.0 (61.3, 64.8) | 0.081 |
| RWT | 0.51 (0.45, 0.58) | 0.50 (0.43, 0.57) | 0.54 (0.46, 0.60) | 0.476 |
| E wave (cm/s) | 61.0 (49.5, 72.0) | 66.0 (51.0, 74.0) | 57.5 (48.0, 68.0) | 0.045 |
| A wave (cm/s) | 79.0 (61.5, 93.0) | 73.0 (57.0, 92.0) | 82.0 (69.0, 93.0) | 0.116 |
| E/A ratio | 0.76 (0.61, 0.95) | 0.81 (0.66, 1.07) | 0.71 (0.60, 0.86) | 0.003 |
| e’ (cm/s) | 5.5 (4.5, 7.0) | 6.1 (4.7, 7.7) | 5.2 (4.3, 6.3) | 0.002 |
| E/e’ ratio | 10.6 (8.4, 14.0) | 10.5 (7.9, 13.7) | 11.4 (8.8, 14.3) | 0.220 |
| TAPSE (mm) | 19.5 ± 4.7 | 20.2 ± 4.3 | 18.8 ± 5.0 | 0.047 |
| RVFAC | 44.4 ± 8.7 | 45.6 ± 8.5 | 43.1 ± 8.8 | 0.072 |
| LAVI (mL/m2) | 25.6 (20.5, 32.0) | 27.0 (21.0, 32.0) | 25.0 (20.0, 32.0) | 0.585 |
| RAVI (mL/m2) | 14.0 (12.0, 18.0) | 15.0 (12.5, 18.0) | 14.0 (12.0, 17.8) | 0.487 |
| Independent Variable | Standard Coefficient | t Value | p Value |
|---|---|---|---|
| CAVI | −0.375 | −5.418 | 0.0001 |
| SBP | −0.193 | −2.791 | 0.006 |
| LVGLS | −0.191 | −2.772 | 0.006 |
| Independent Variable | Standard Coefficient | t Value | p Value |
|---|---|---|---|
| RVFWS | 0.318 | 4.324 | 0.0001 |
| CAVI | −0.156 | −2.113 | 0.036 |
| E/e’ | −0.146 | −2.018 | 0.045 |
Publisher’s Note: MDPI stays neutral with regard to jurisdictional claims in published maps and institutional affiliations. |
© 2022 by the authors. Licensee MDPI, Basel, Switzerland. This article is an open access article distributed under the terms and conditions of the Creative Commons Attribution (CC BY) license (https://creativecommons.org/licenses/by/4.0/).
Share and Cite
Tabata, T.; Sato, S.; Ohno, R.; Iwakawa, M.; Kiyokawa, H.; Morinaga, Y.; Tanji, N.; Kinoshita, T.; Shimizu, K. Cardio-Vascular Interaction Evaluated by Speckle-Tracking Echocardiography and Cardio-Ankle Vascular Index in Hypertensive Patients. Int. J. Mol. Sci. 2022, 23, 14469. https://doi.org/10.3390/ijms232214469
Tabata T, Sato S, Ohno R, Iwakawa M, Kiyokawa H, Morinaga Y, Tanji N, Kinoshita T, Shimizu K. Cardio-Vascular Interaction Evaluated by Speckle-Tracking Echocardiography and Cardio-Ankle Vascular Index in Hypertensive Patients. International Journal of Molecular Sciences. 2022; 23(22):14469. https://doi.org/10.3390/ijms232214469
Chicago/Turabian StyleTabata, Tsuyoshi, Shuji Sato, Ruiko Ohno, Masahiro Iwakawa, Hajime Kiyokawa, Yukihiro Morinaga, Naoaki Tanji, Toshio Kinoshita, and Kazuhiro Shimizu. 2022. "Cardio-Vascular Interaction Evaluated by Speckle-Tracking Echocardiography and Cardio-Ankle Vascular Index in Hypertensive Patients" International Journal of Molecular Sciences 23, no. 22: 14469. https://doi.org/10.3390/ijms232214469