

Identification of Selective BRD9 Inhibitor via Integrated Computational Approach
 , ,
, ,
Abstract
:1. Introduction
2. Results and Discussion
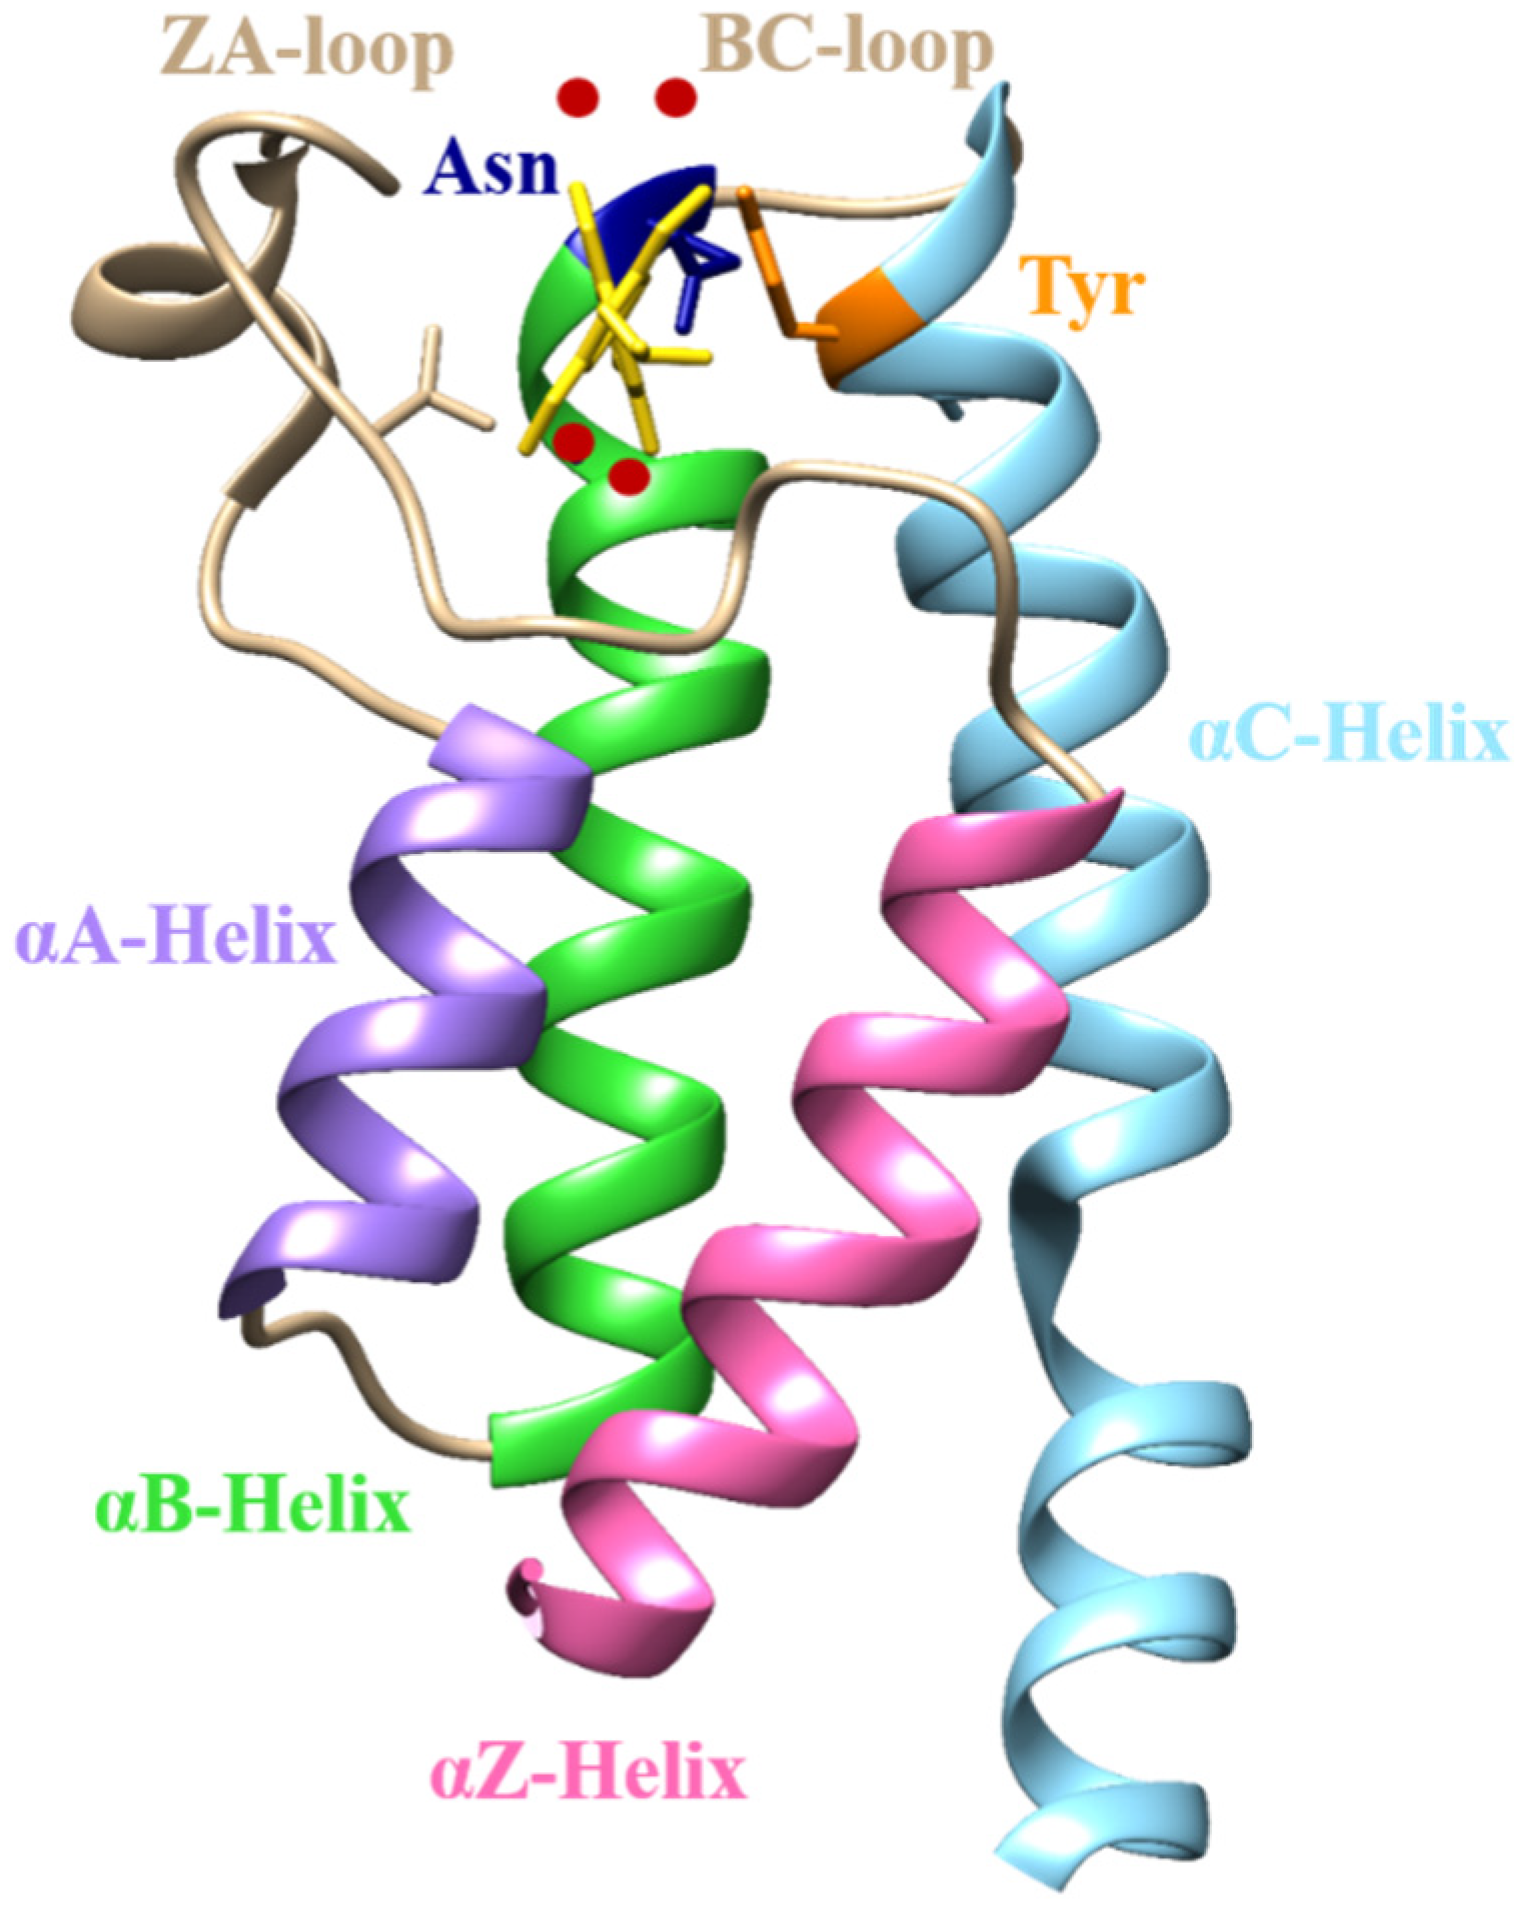
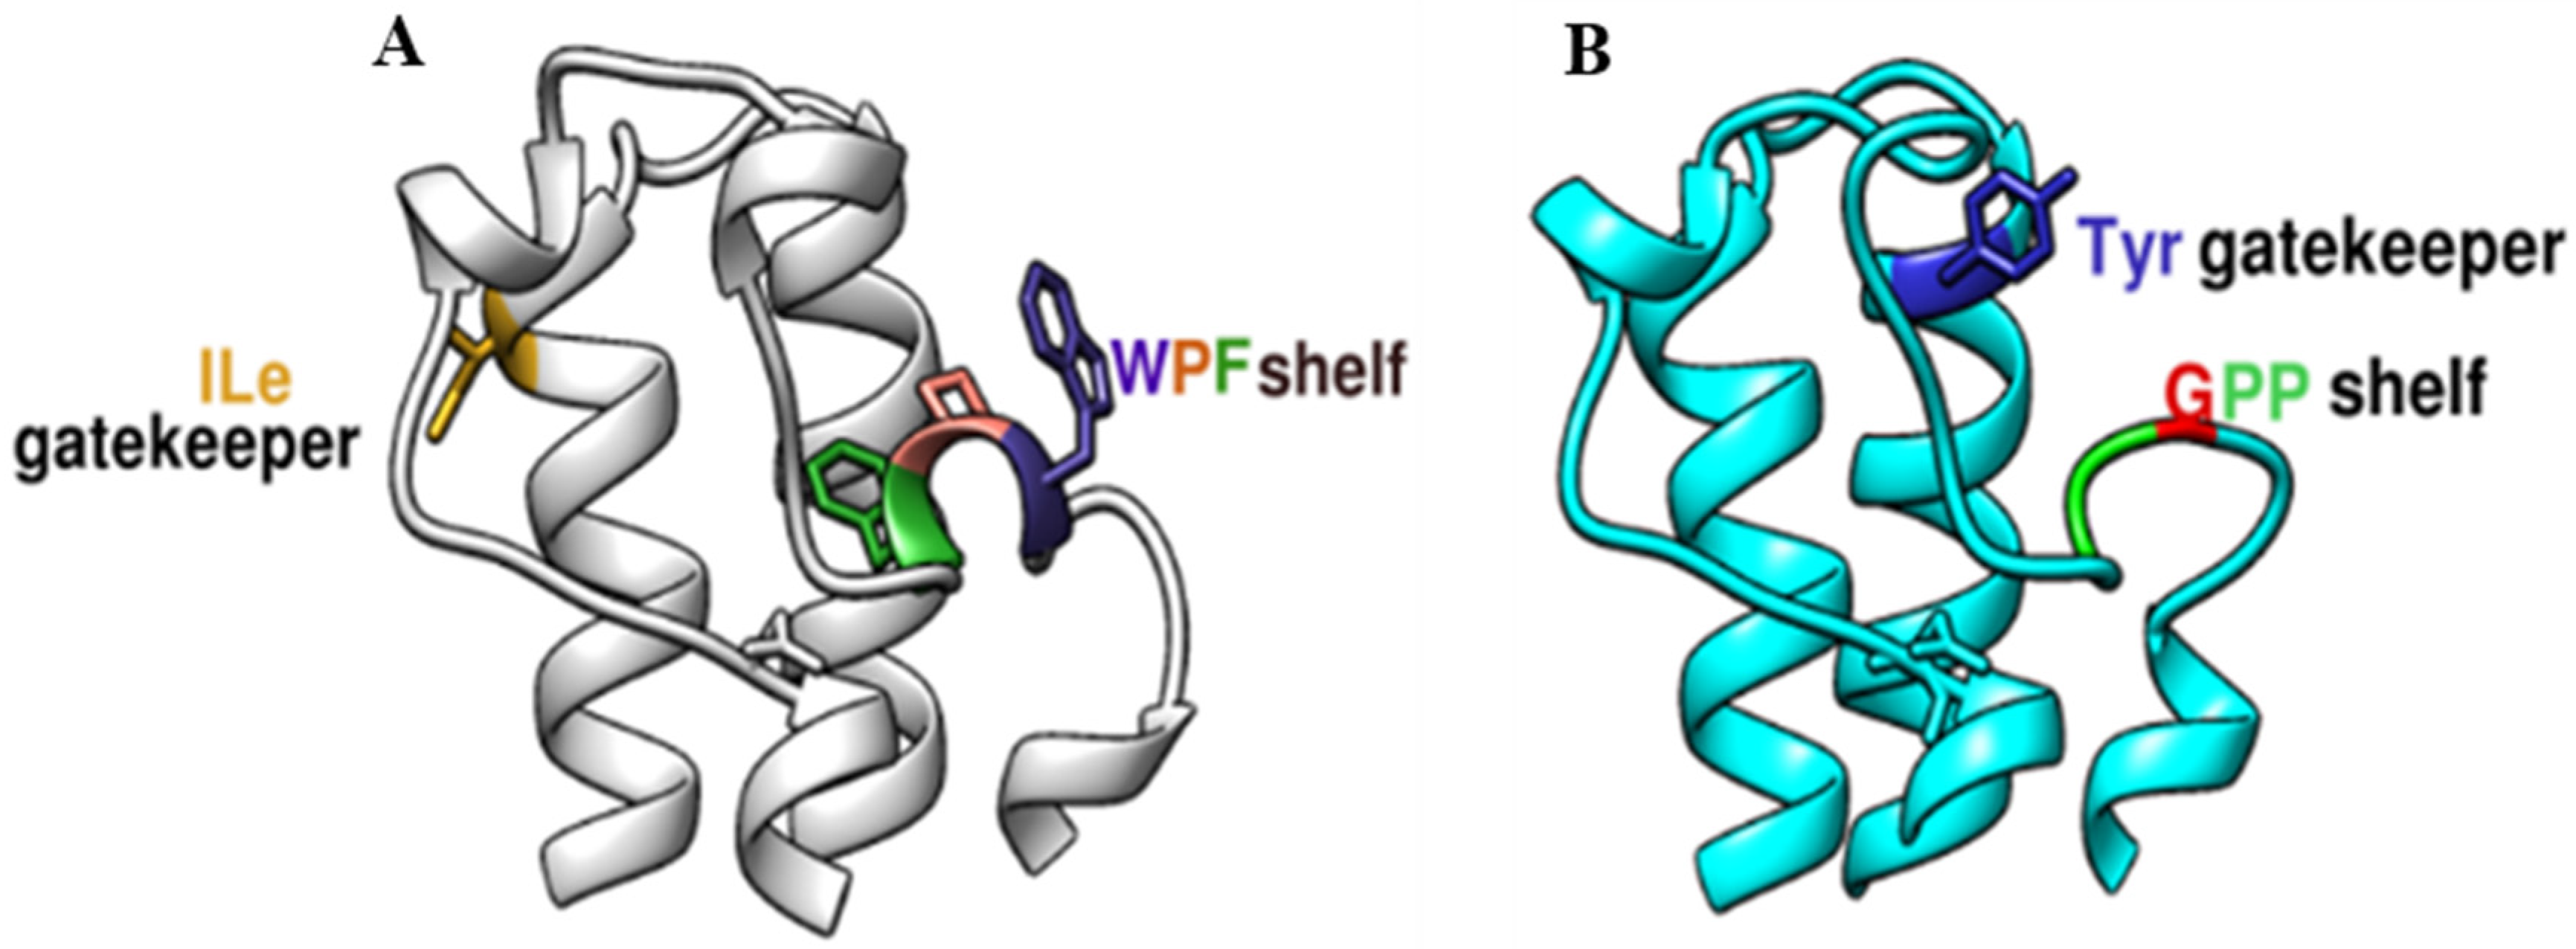
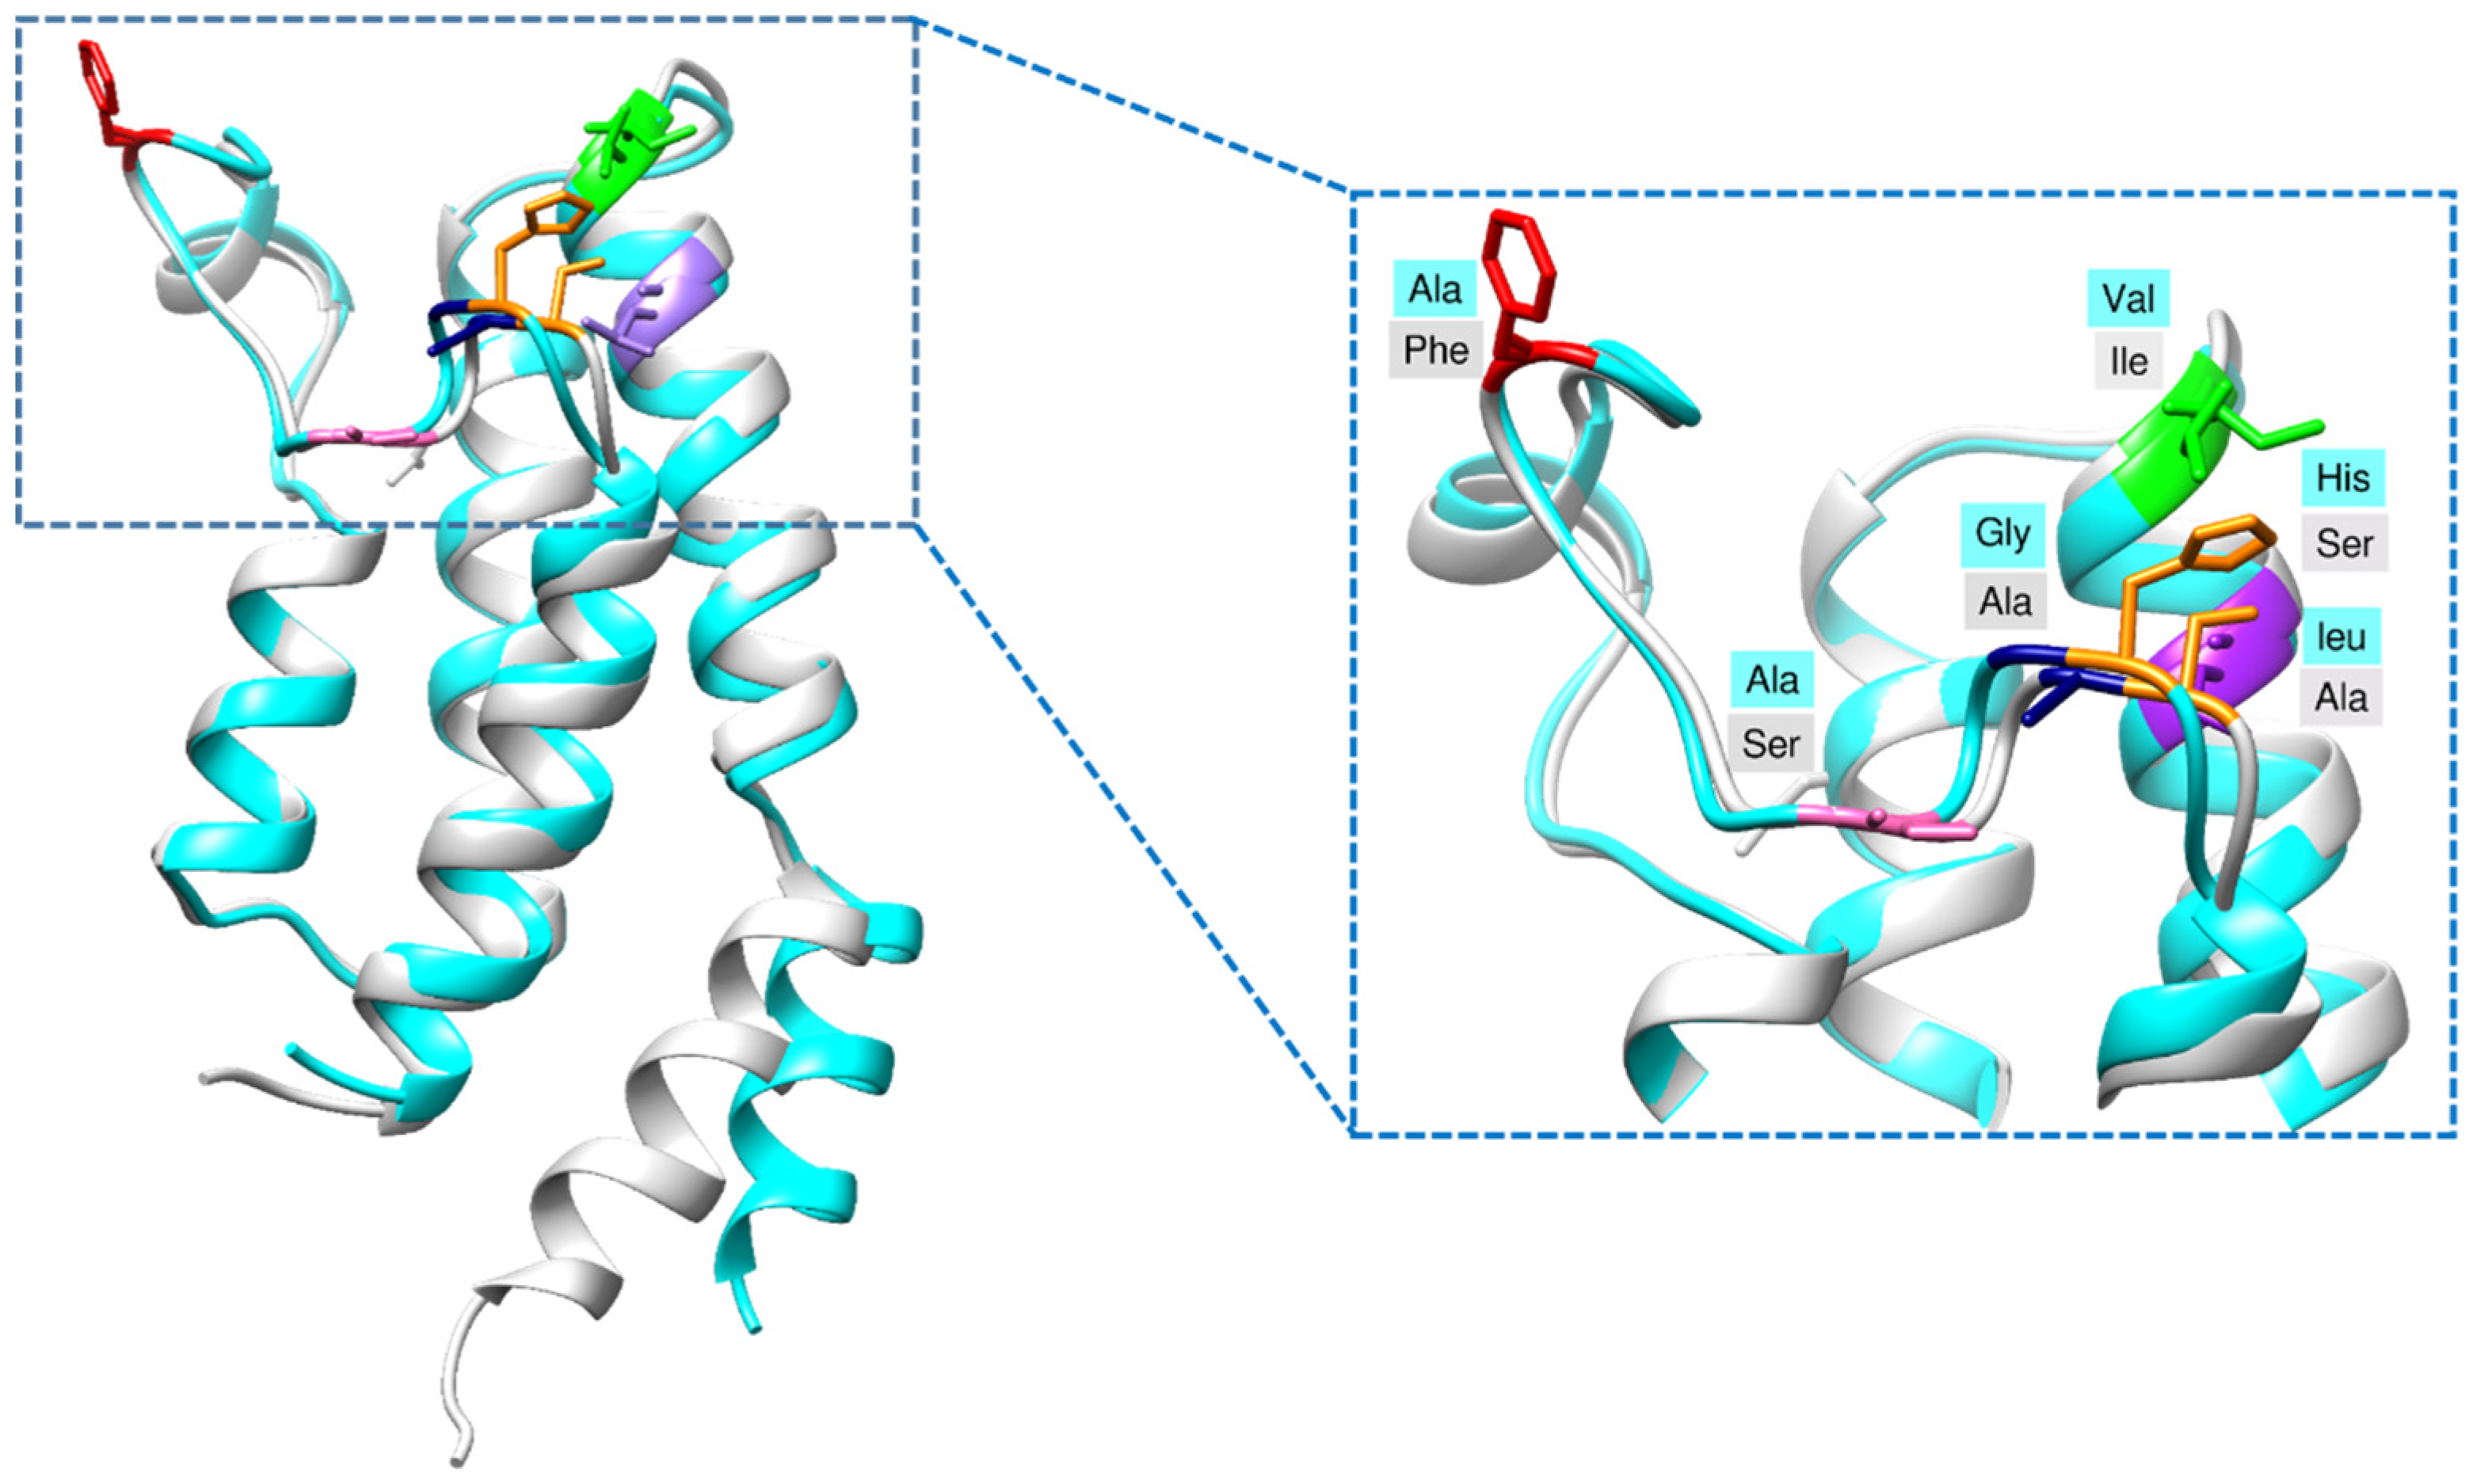
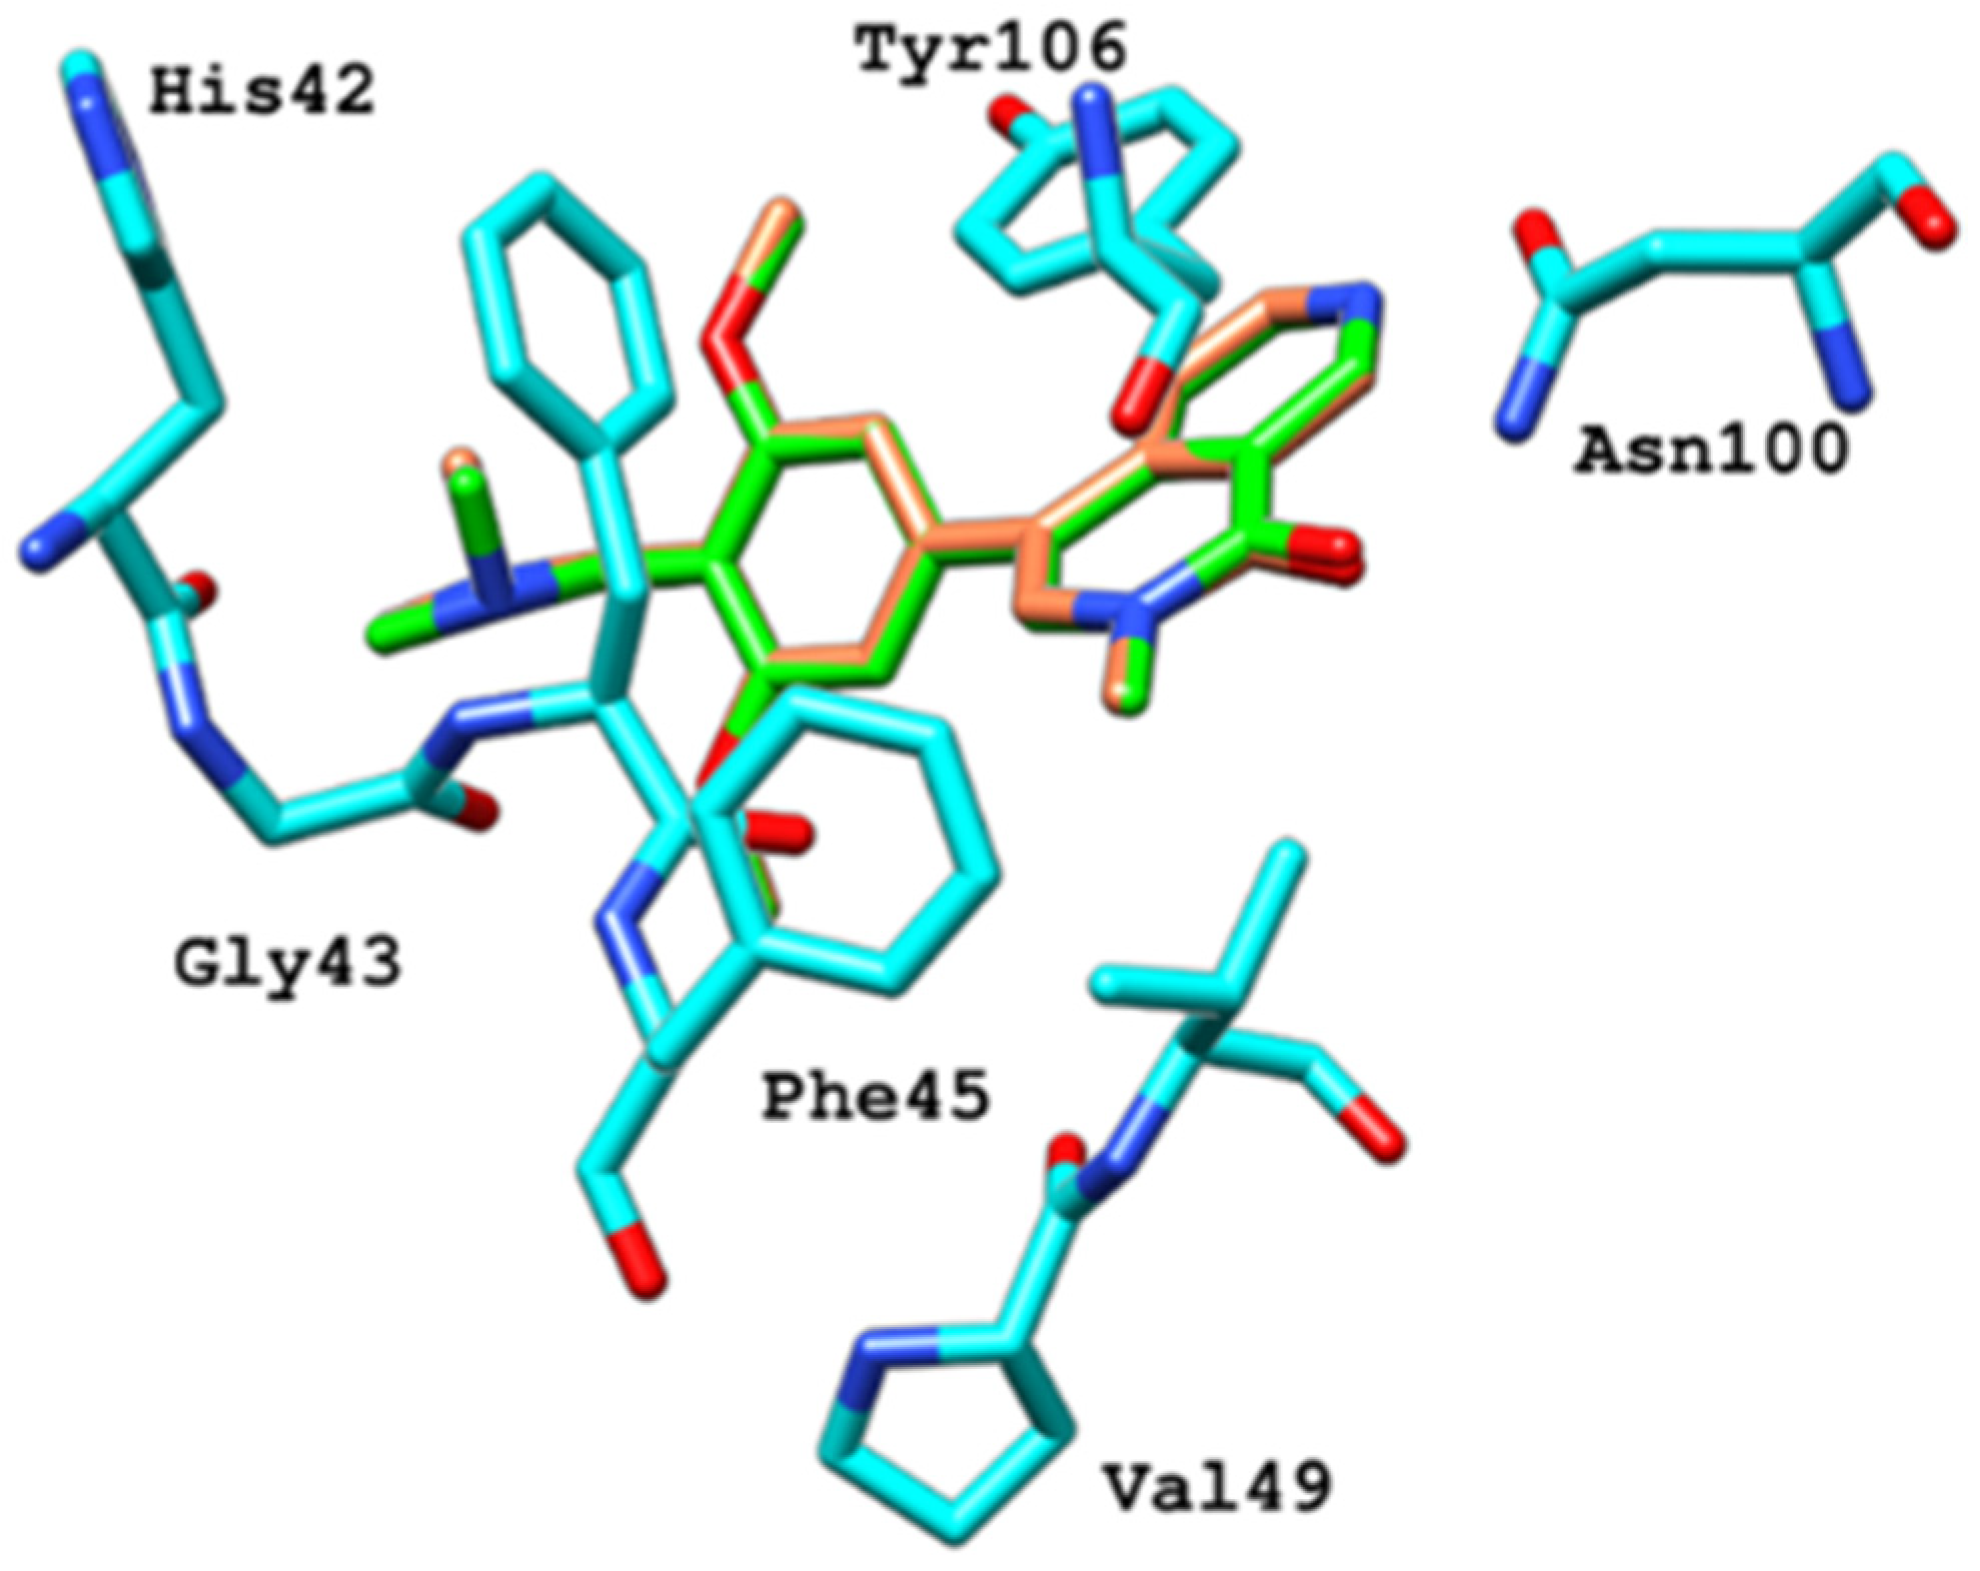
2.1. Structural Characterization
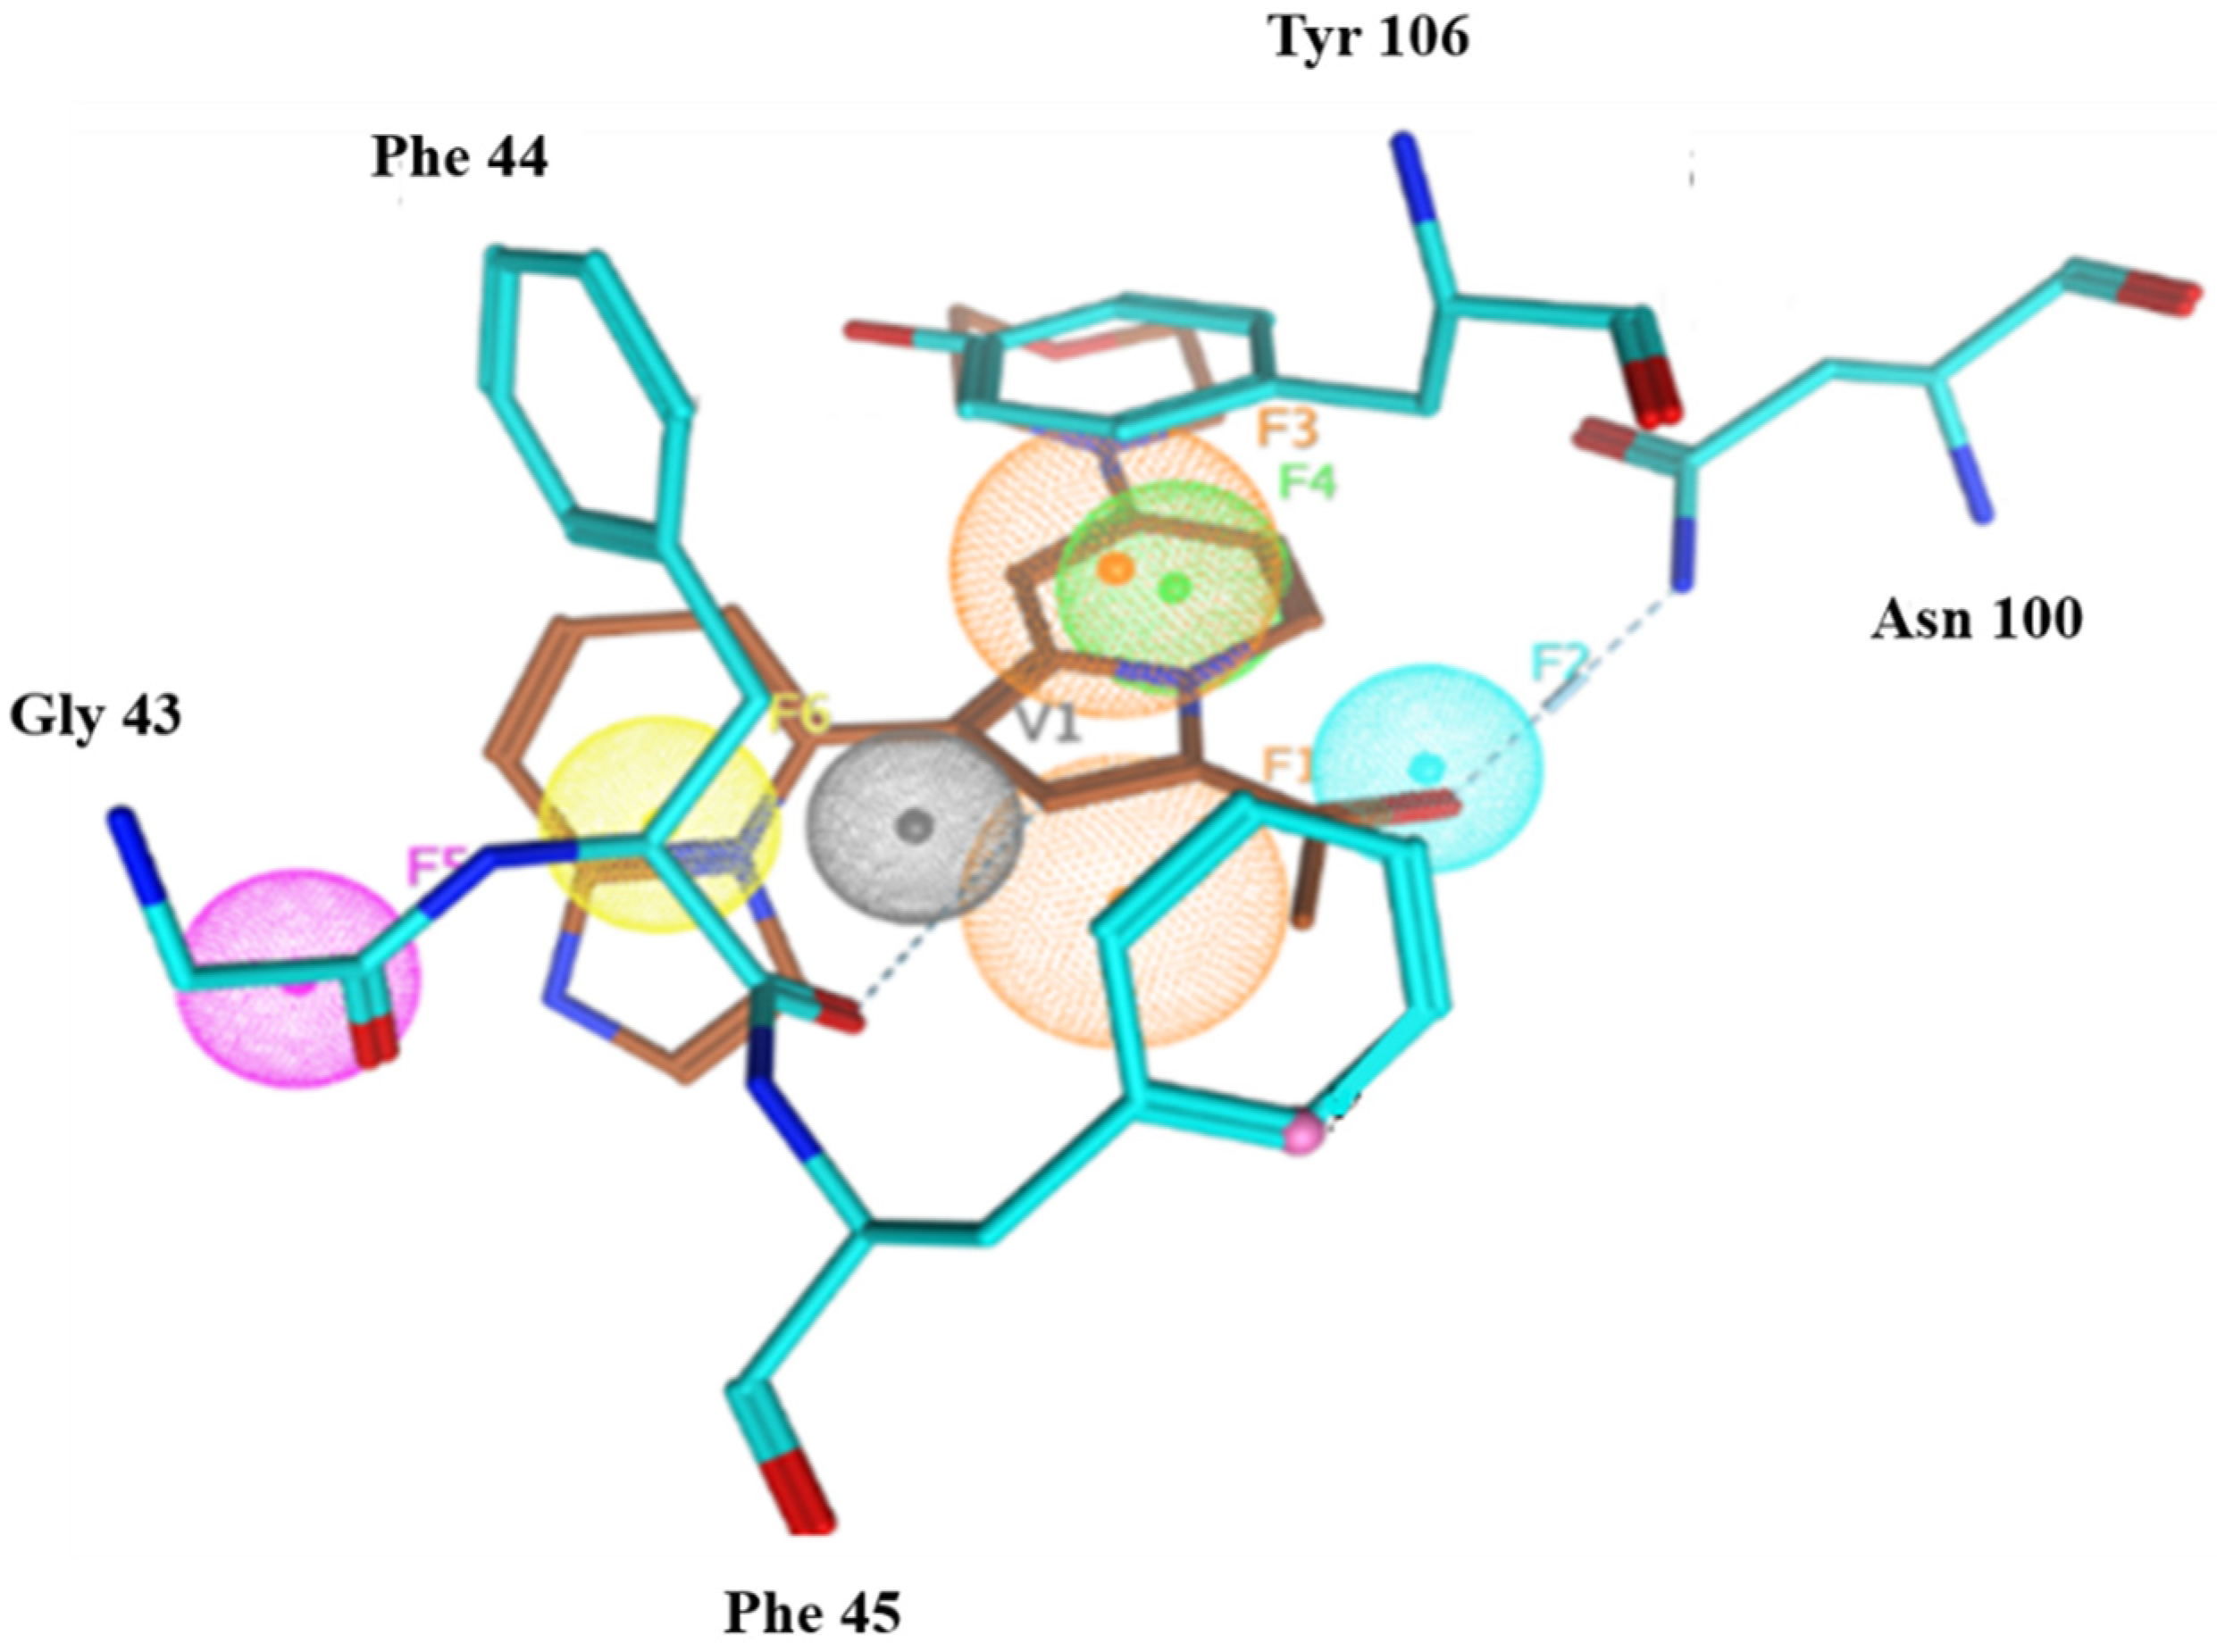
2.2. Pharmacophore Modeling
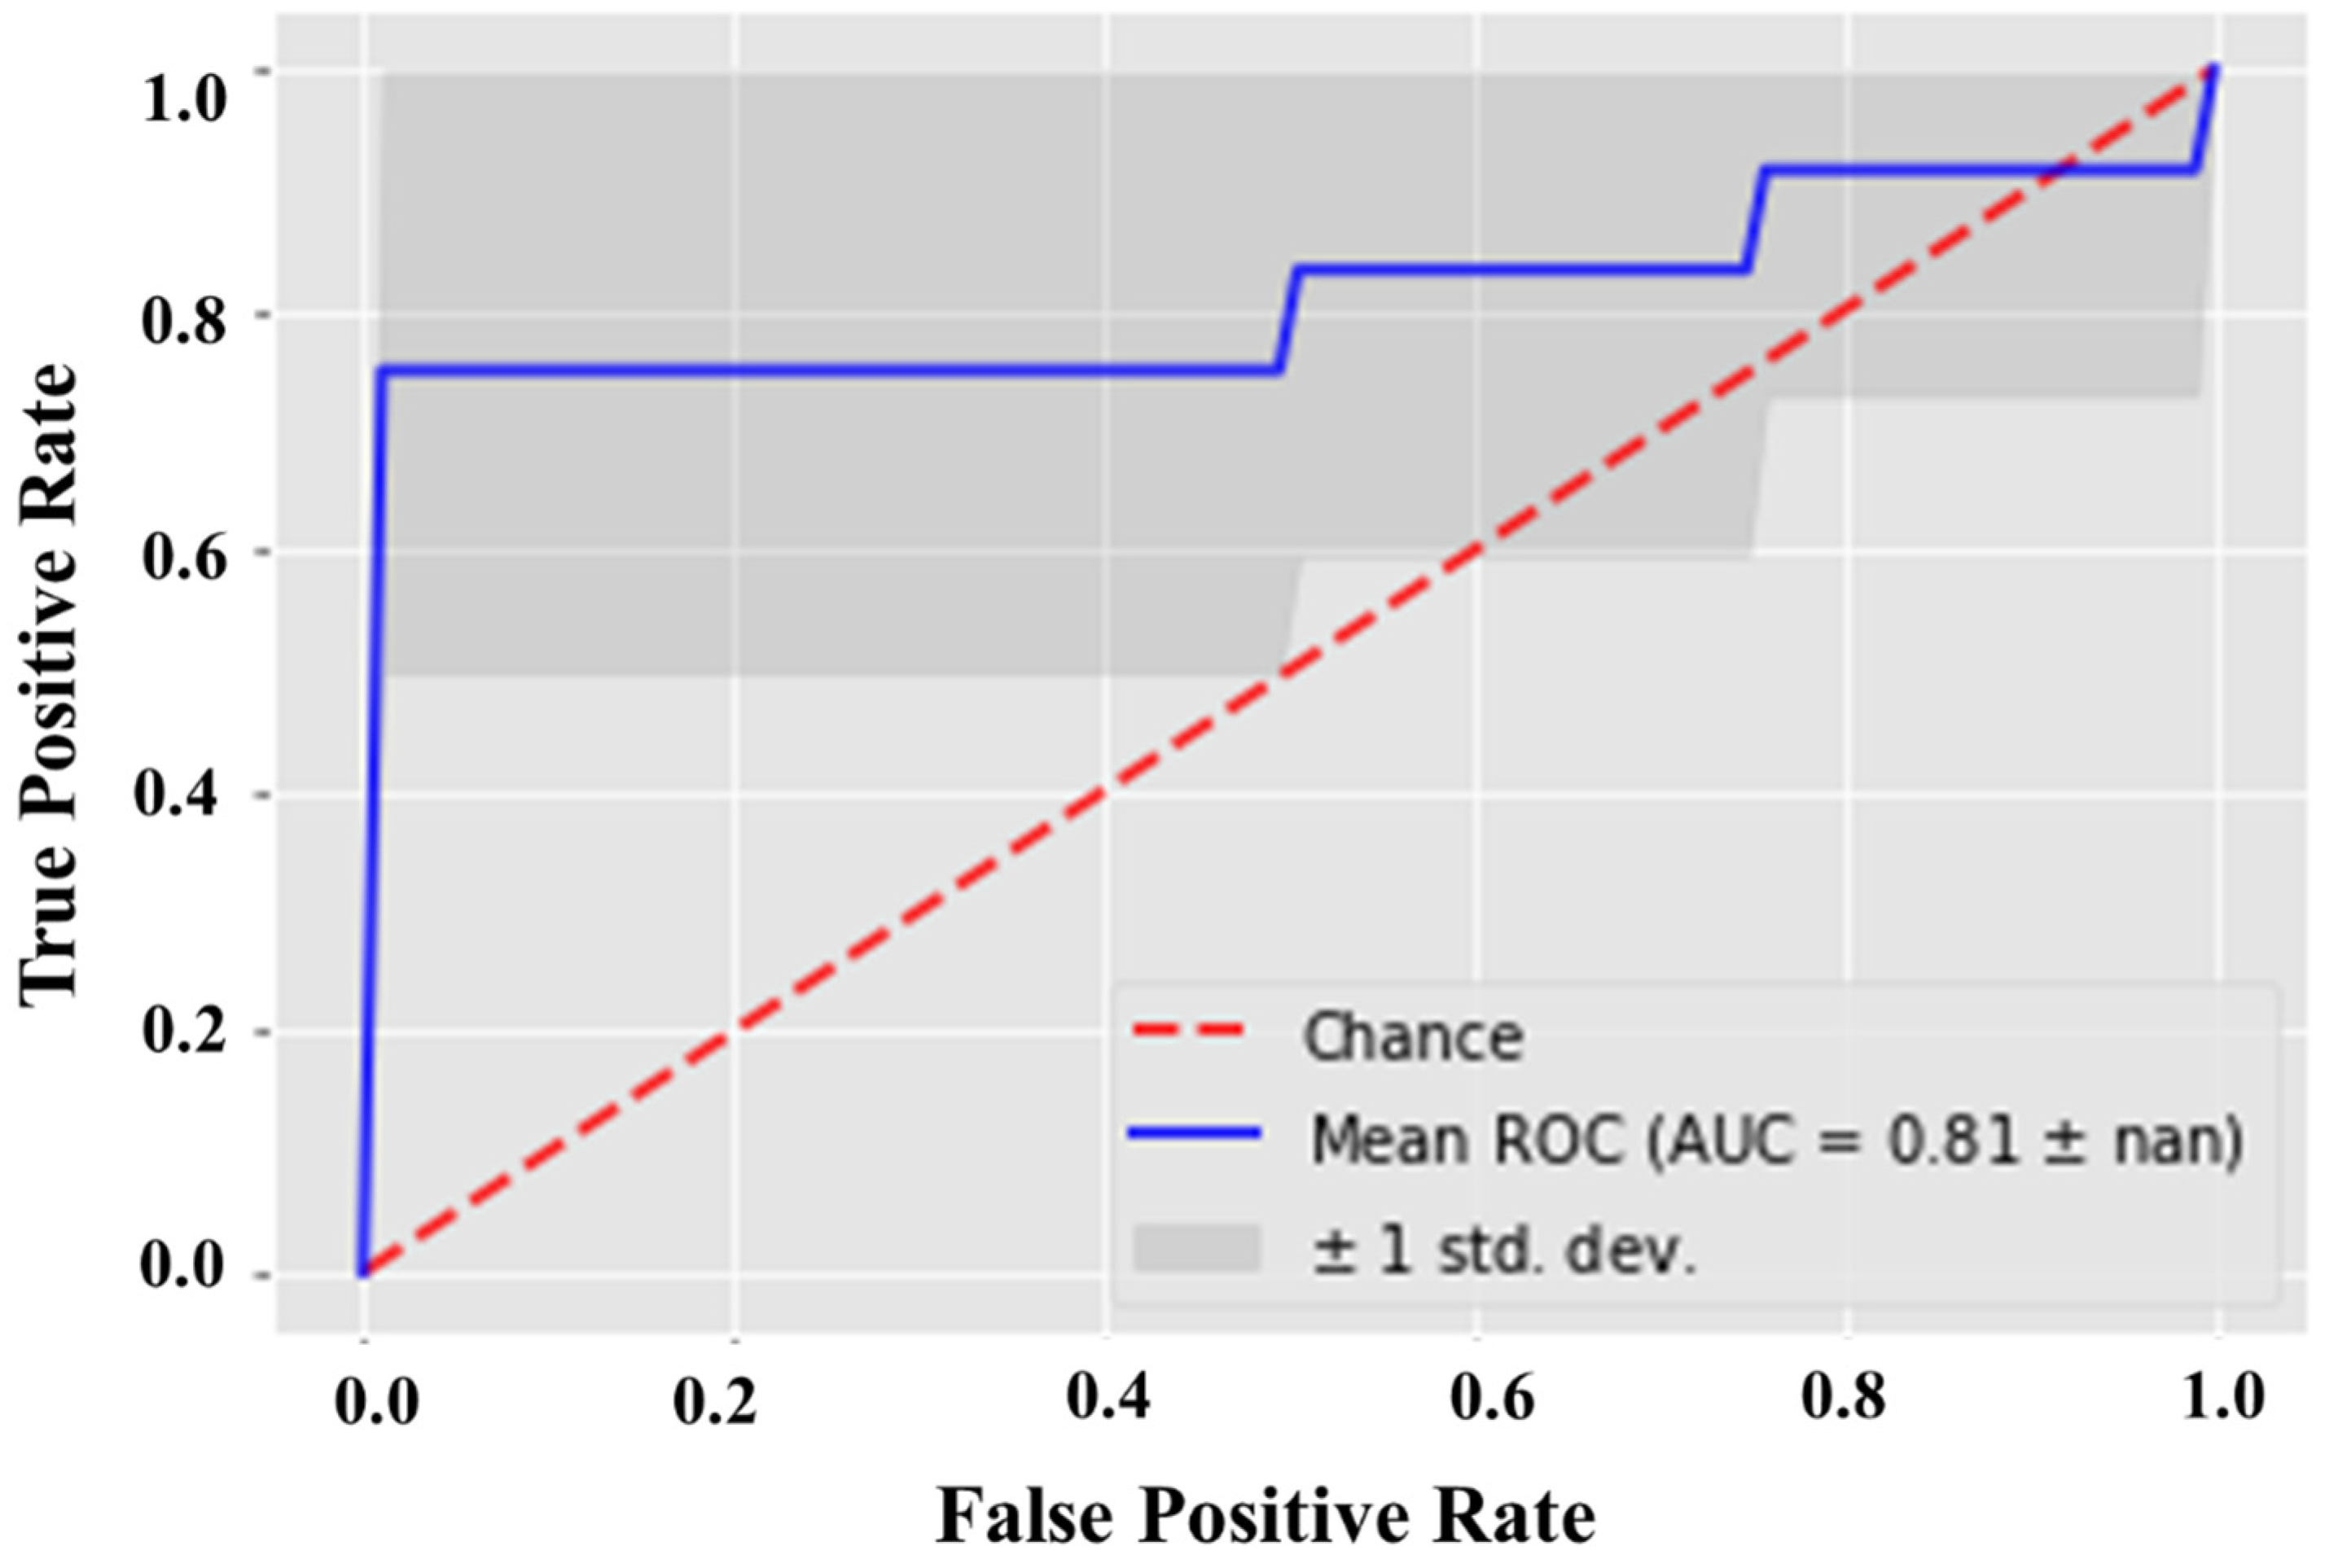
2.3. Statistical Validation
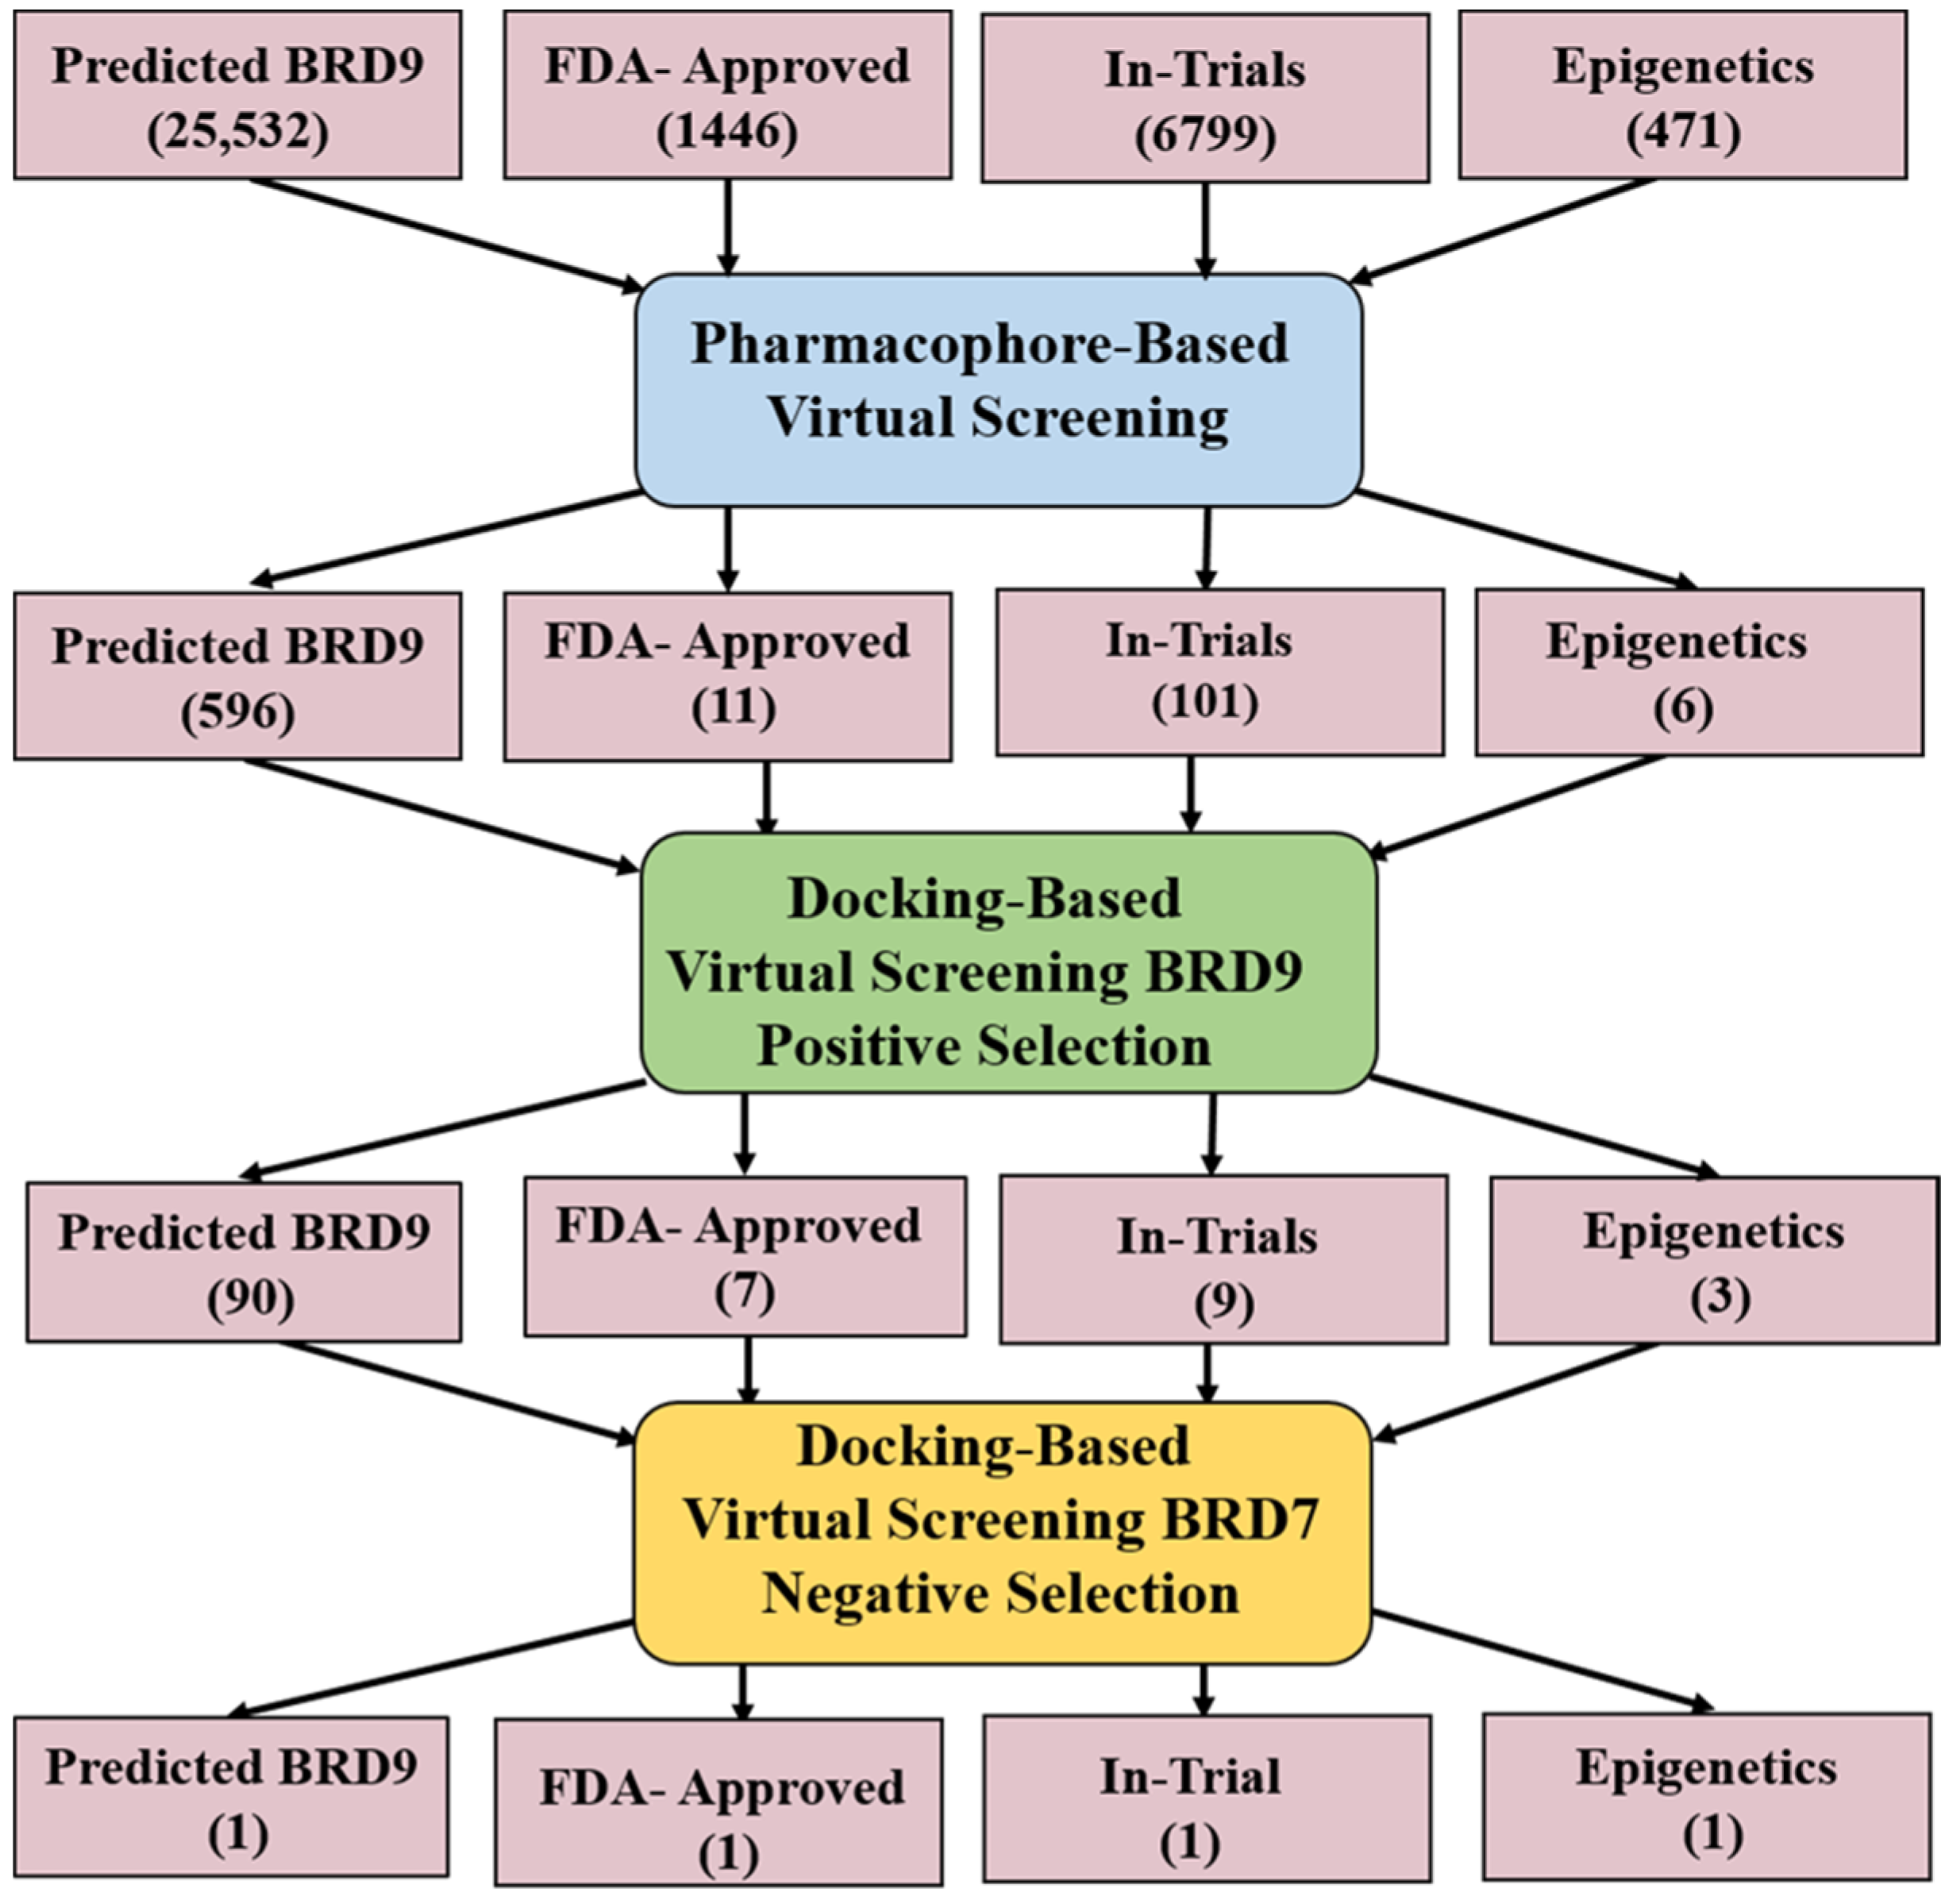
2.4. Pharmacophore-Based Virtual Screening
2.5. Docking-Based Virtual Screening
2.6. Molecular Dynamic (MD) Simulation
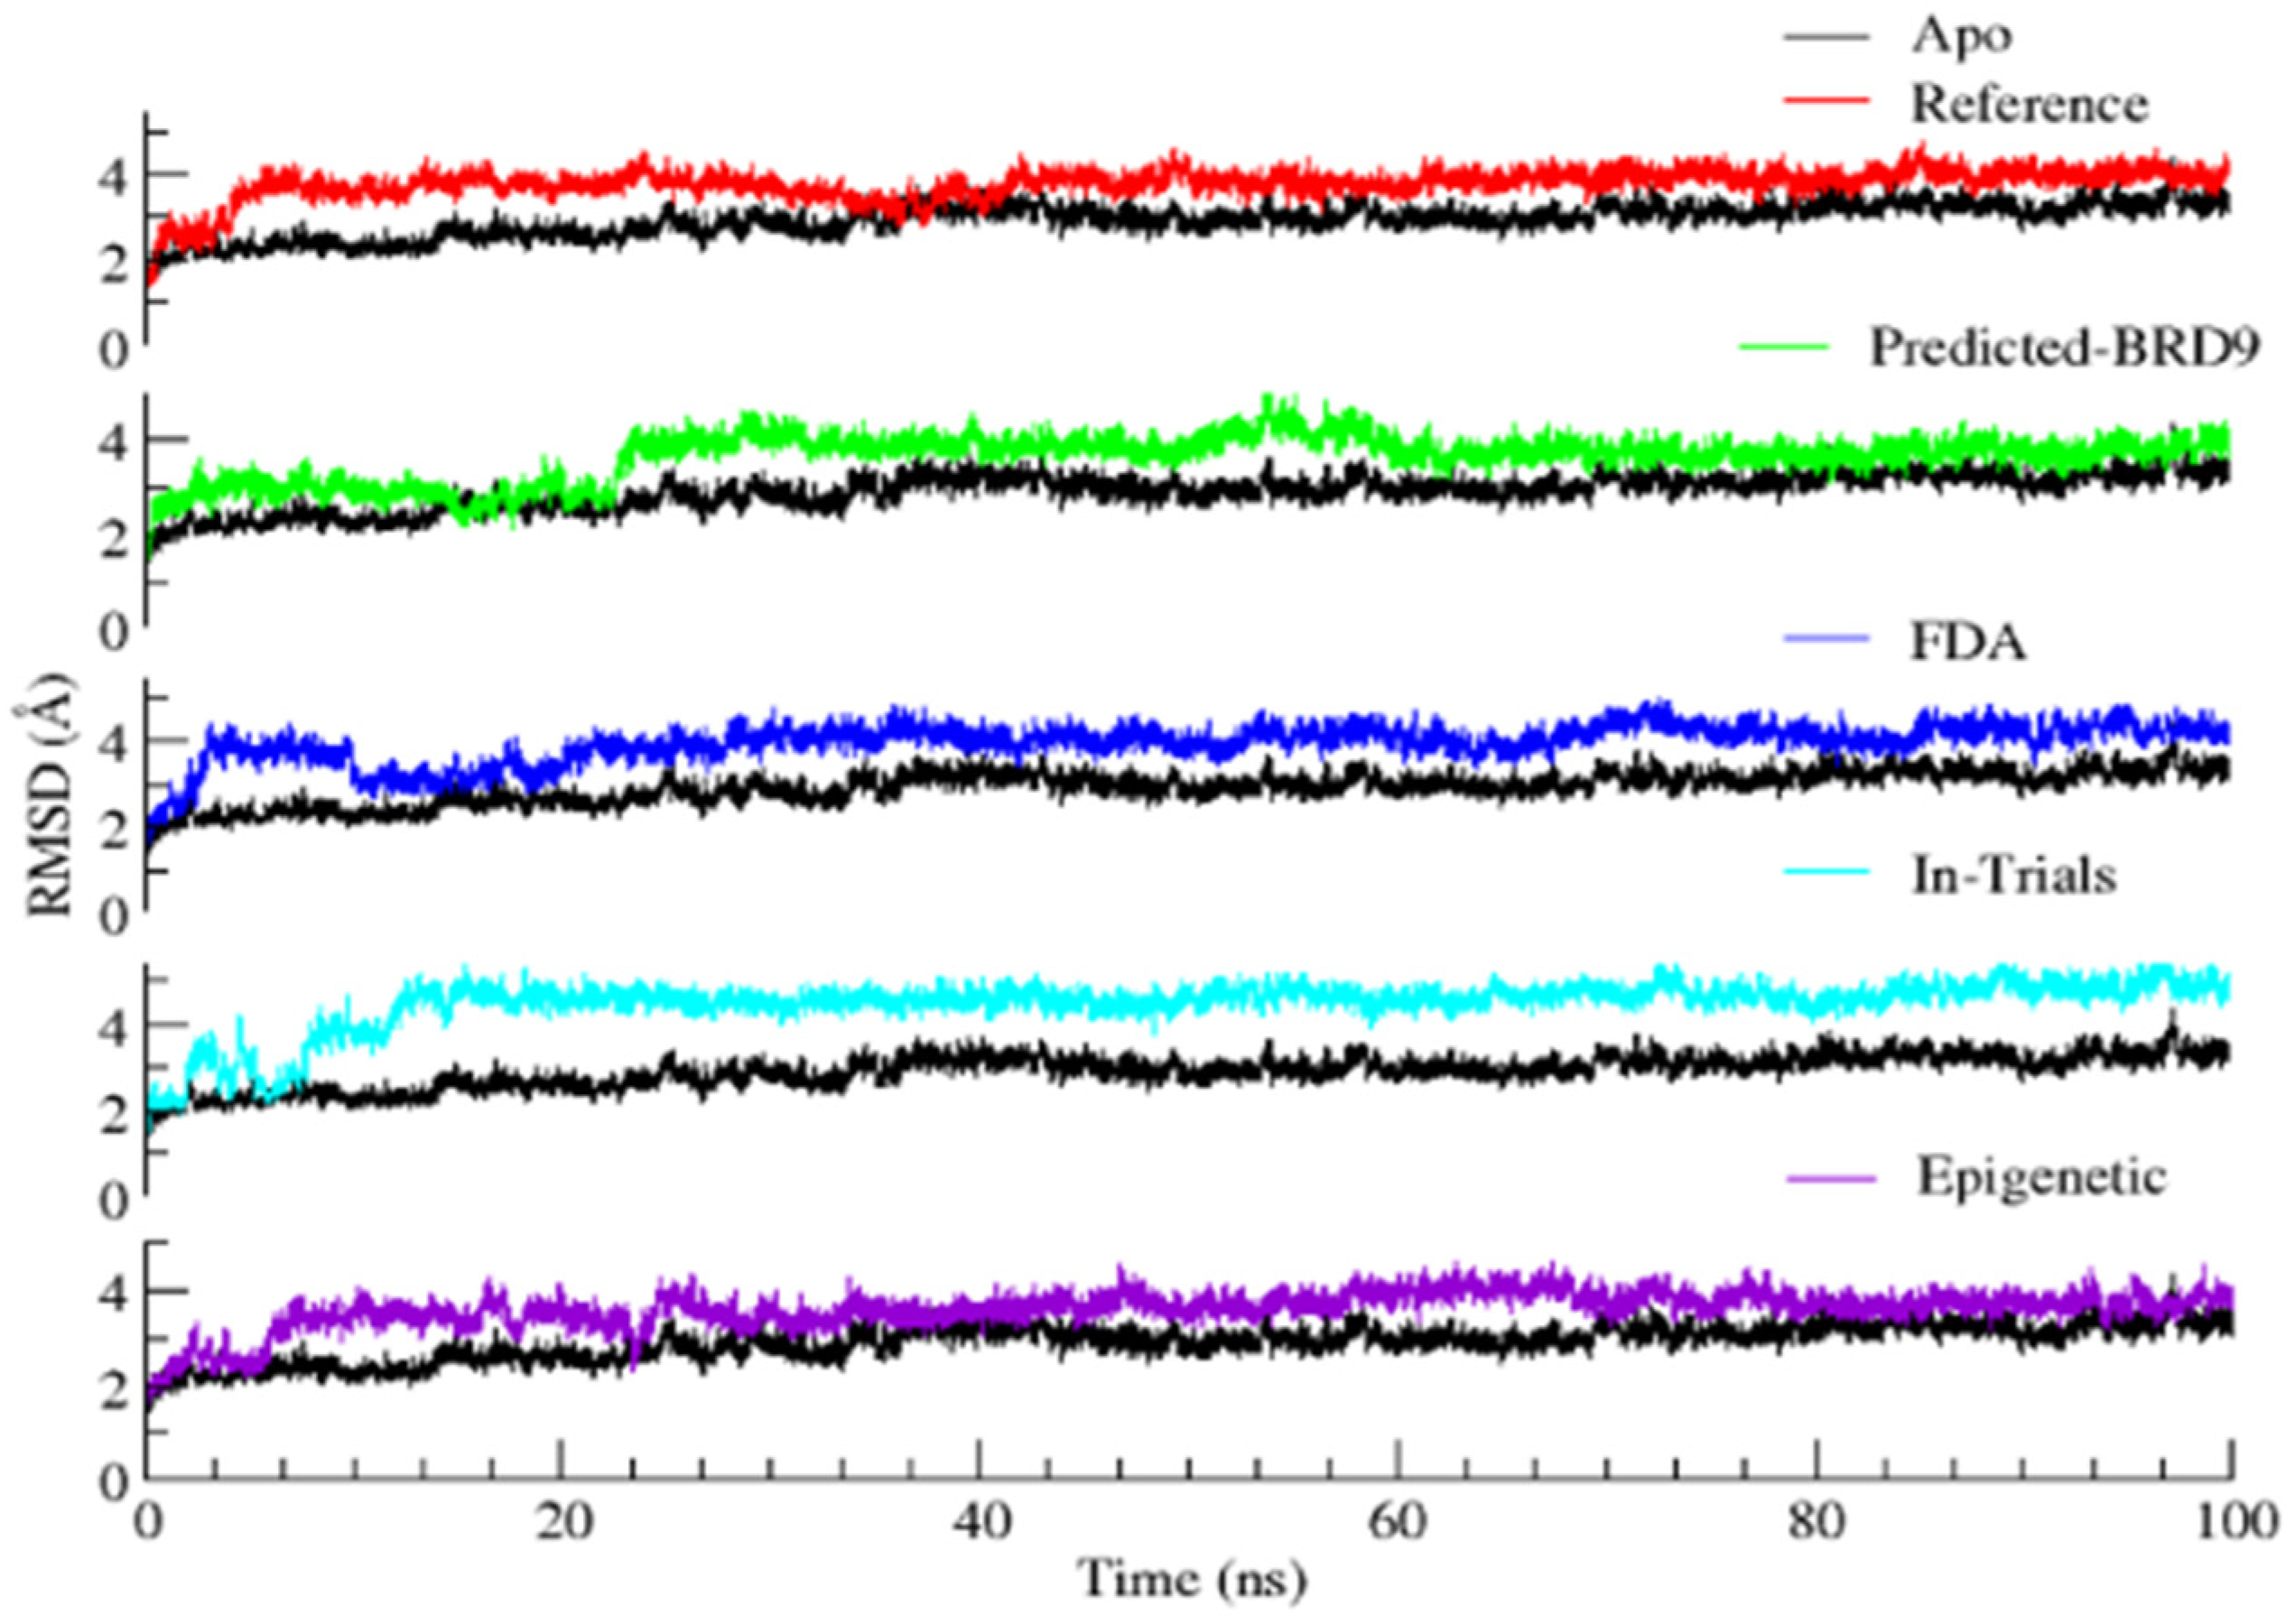
2.6.1. Root Mean Square Deviation (RMSD)
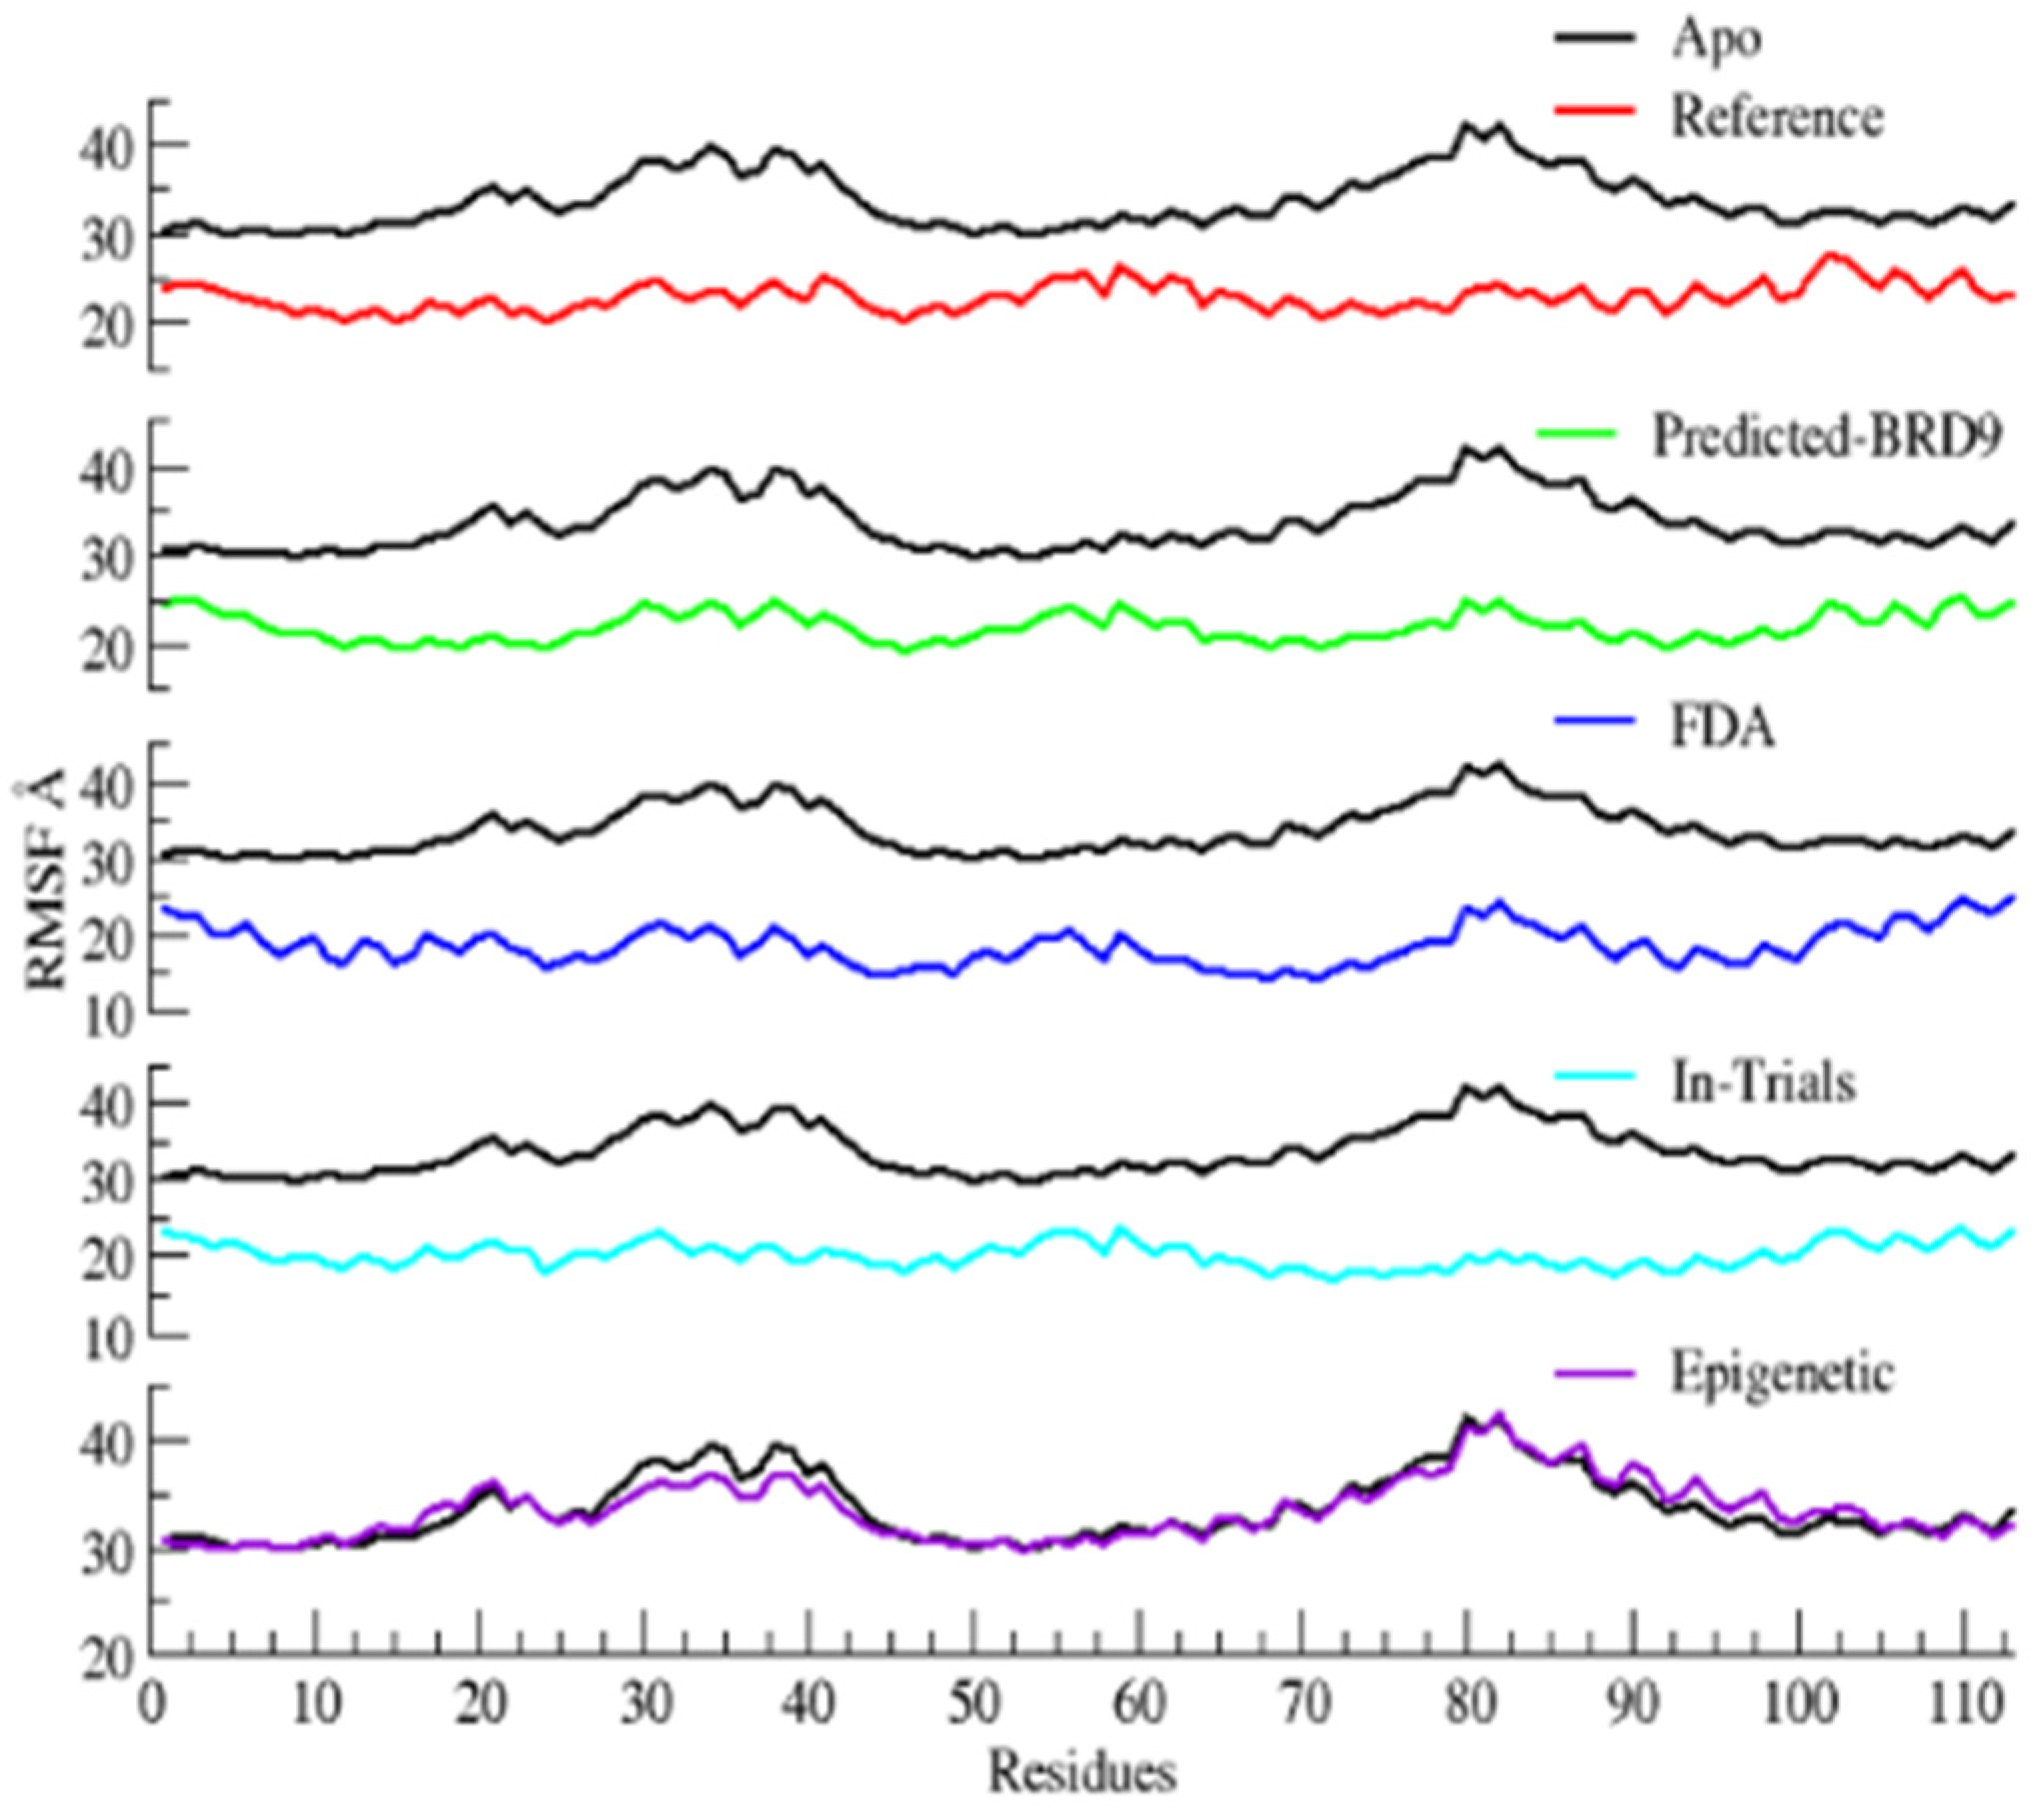
2.6.2. Root Mean Square Fluctuations
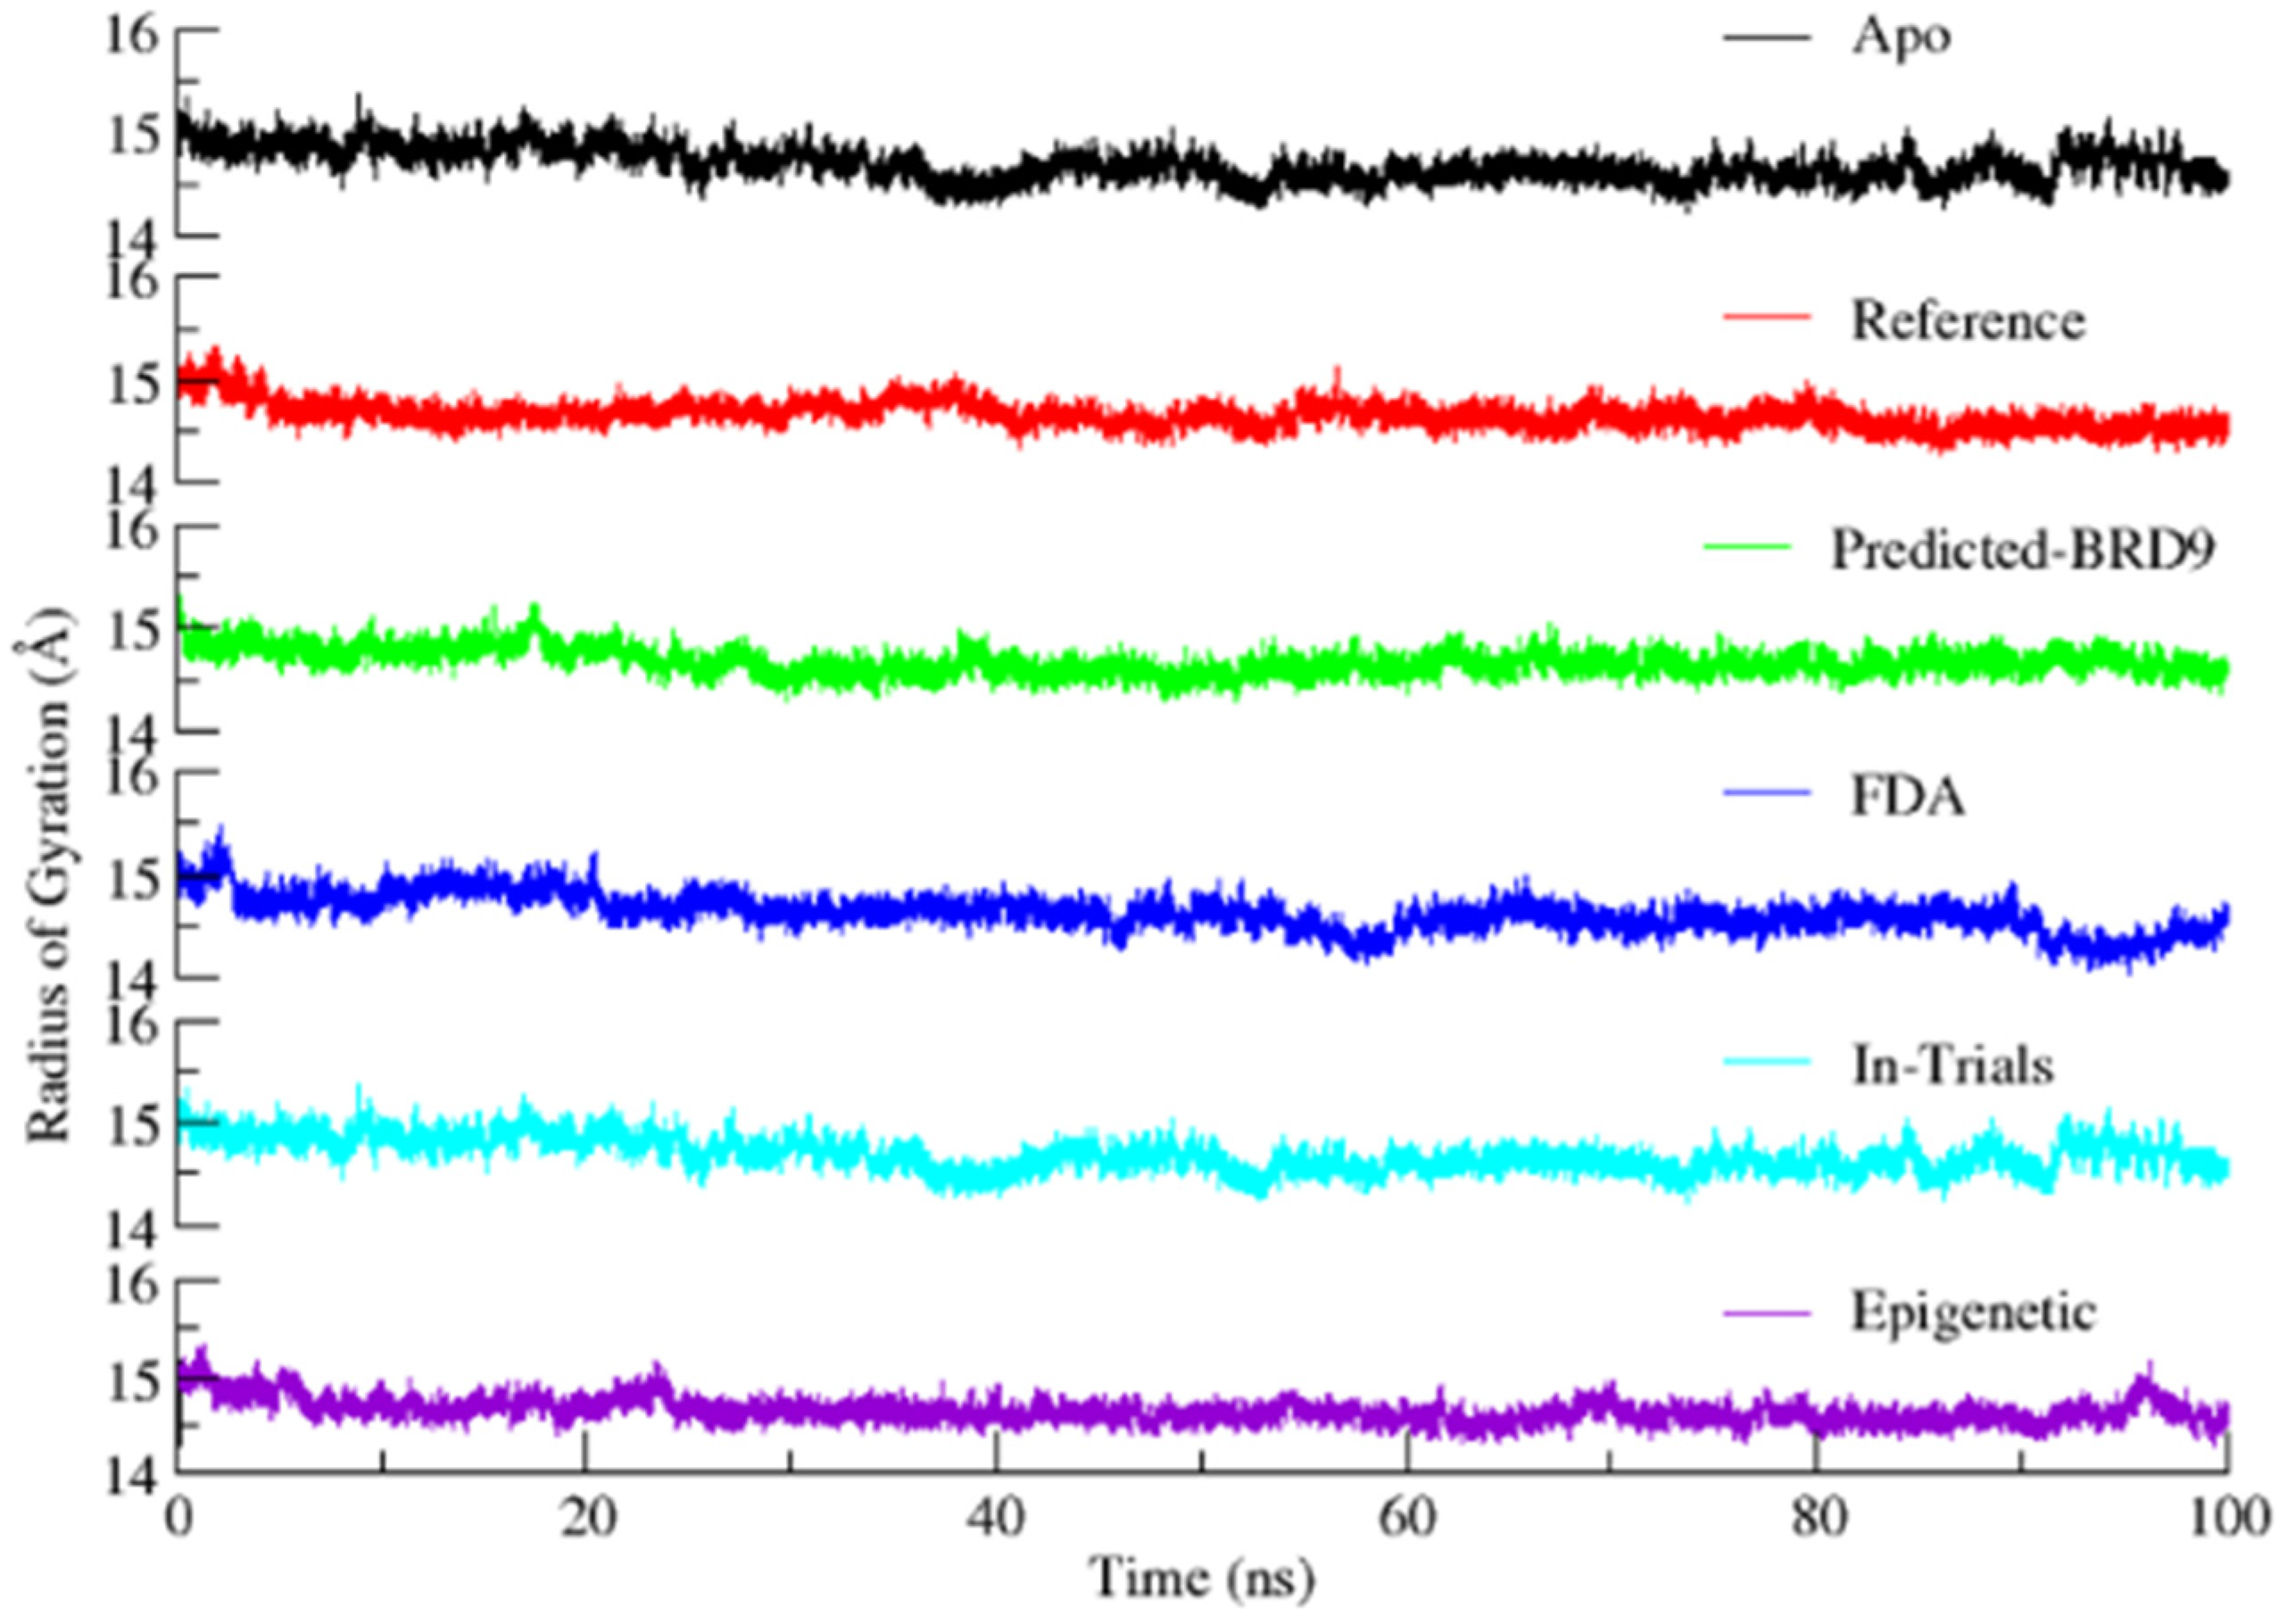
2.6.3. Radius of Gyration
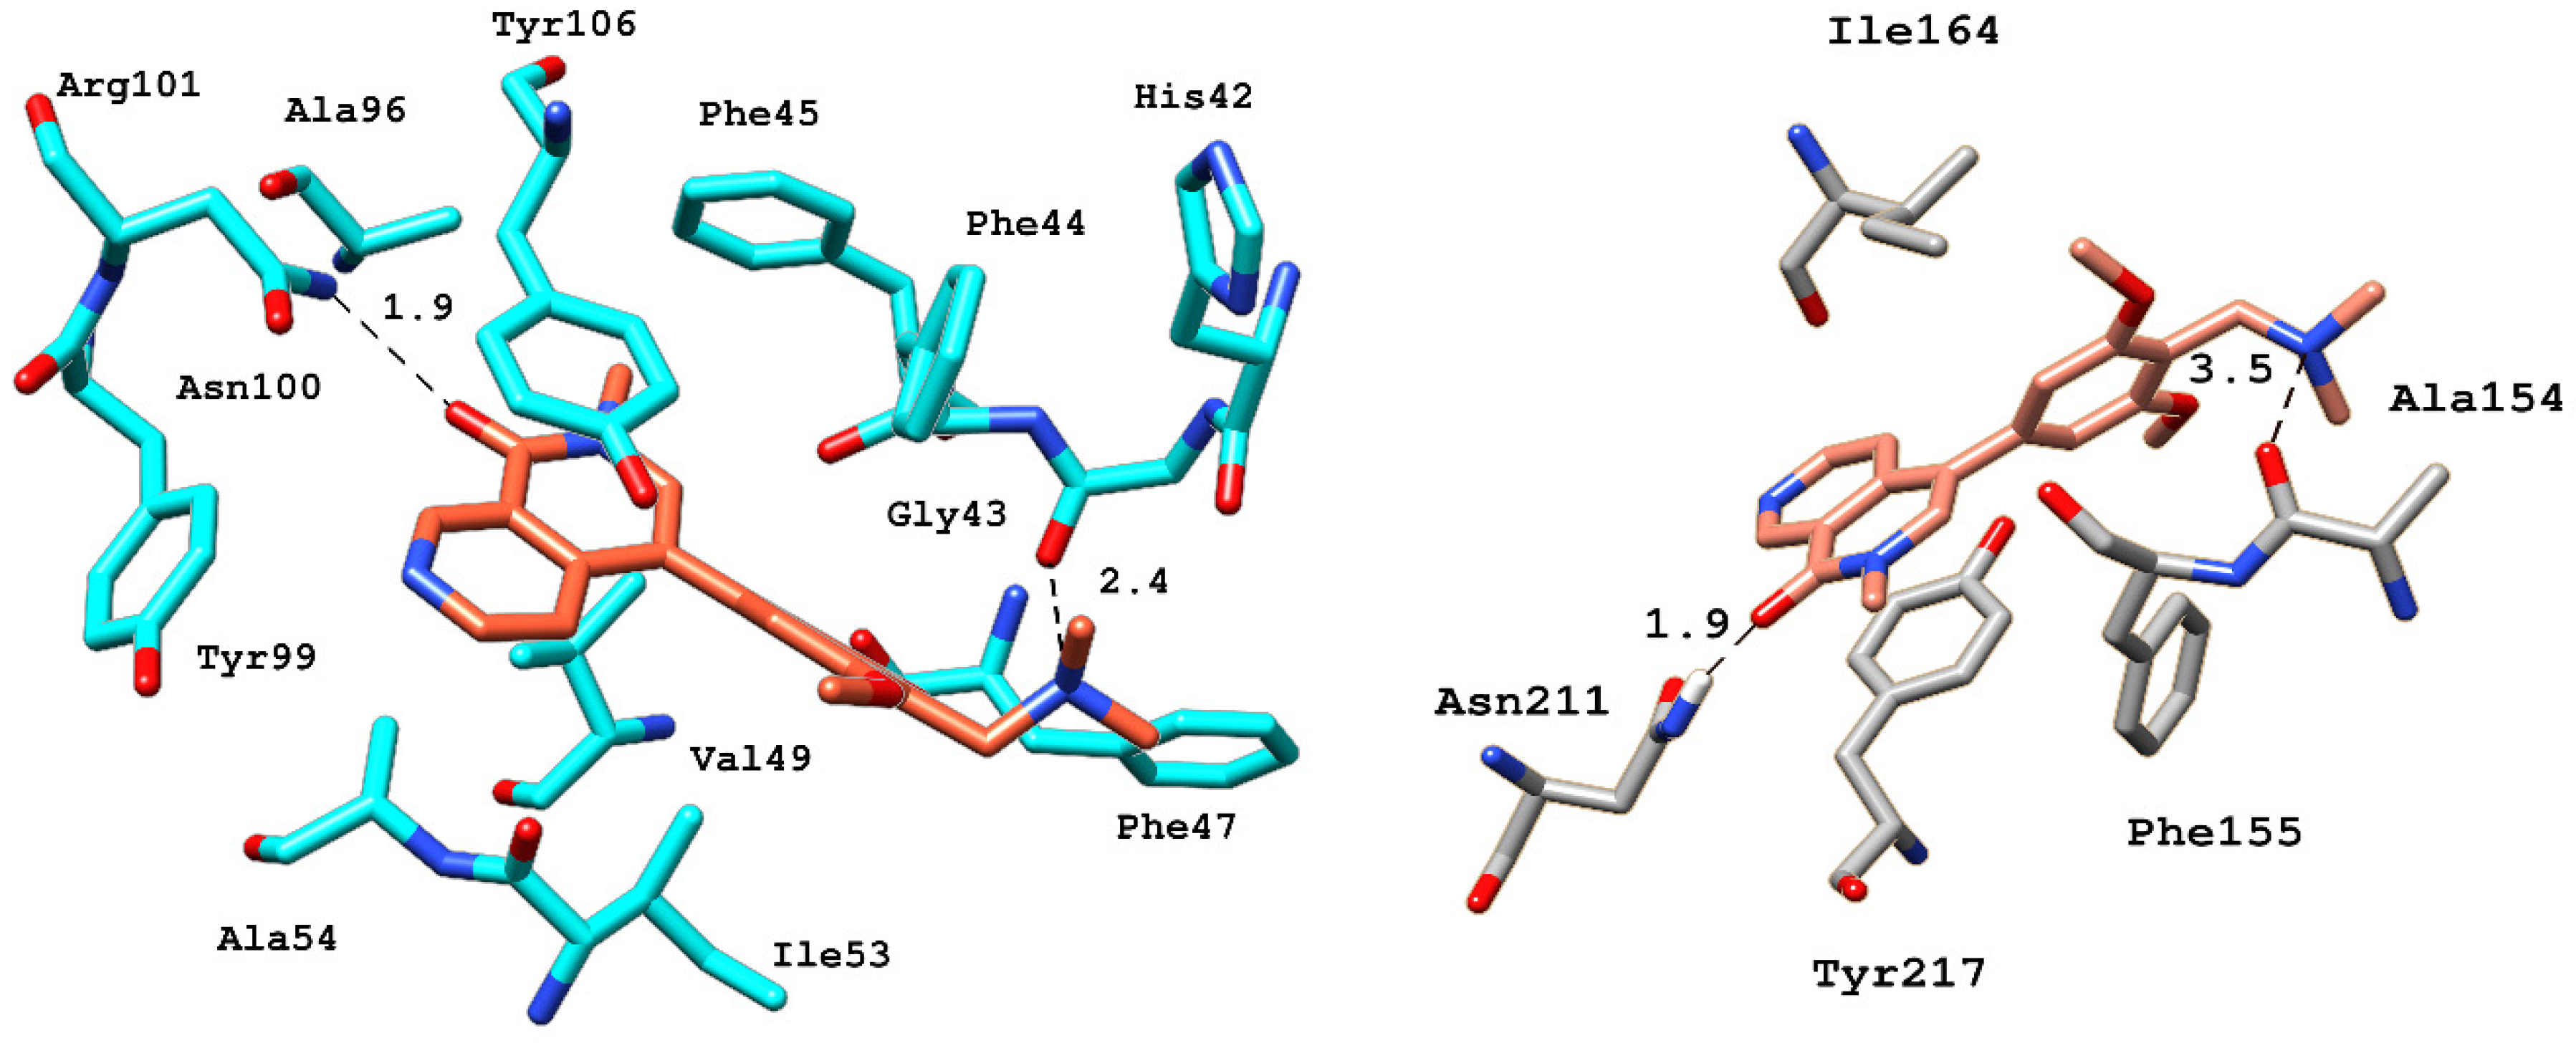
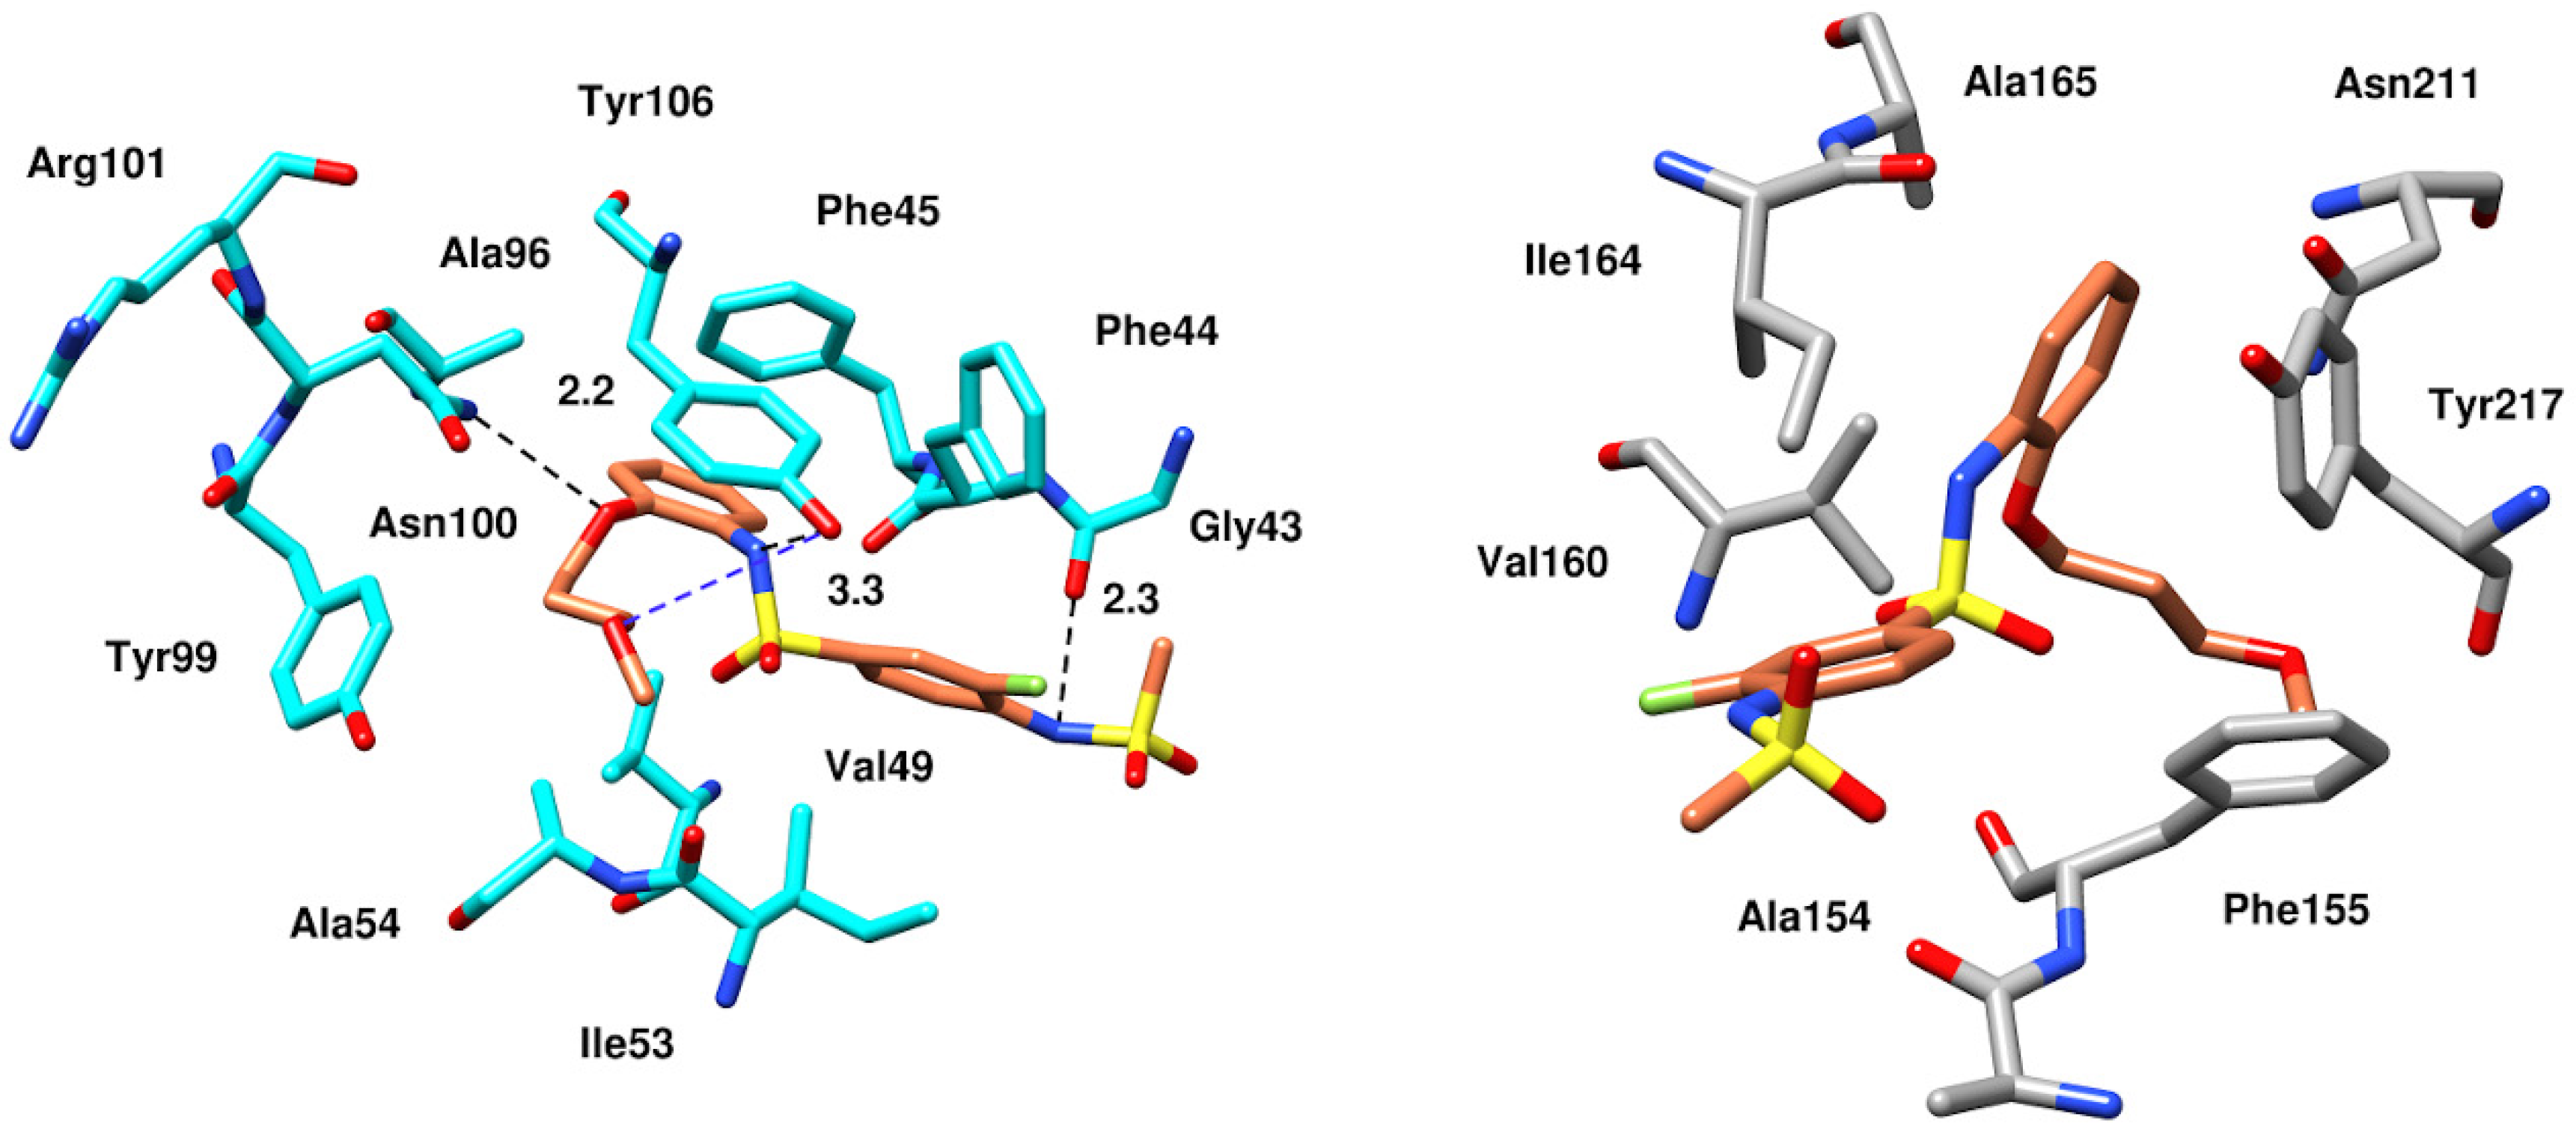
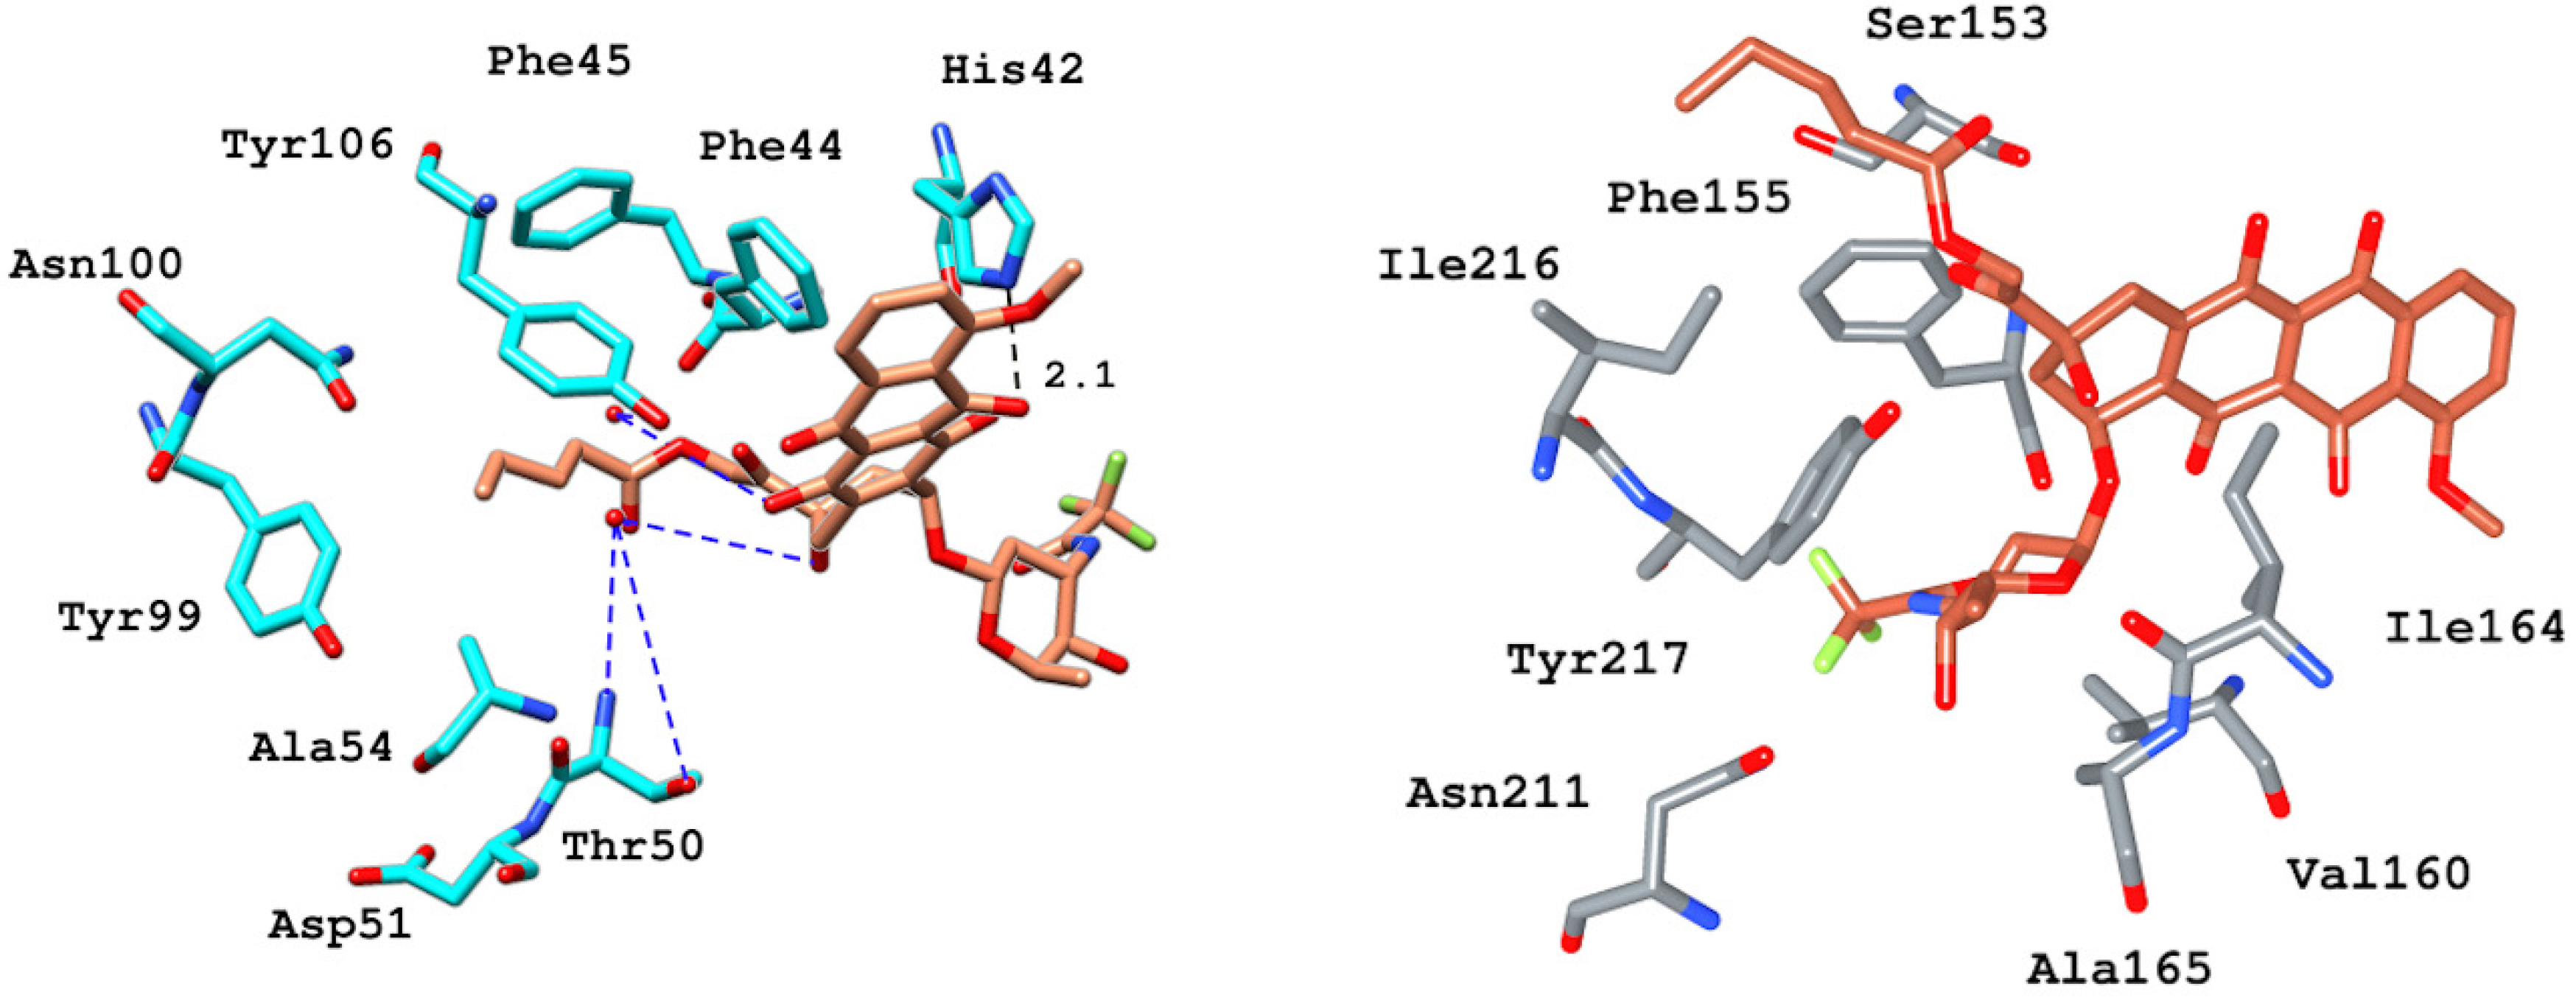
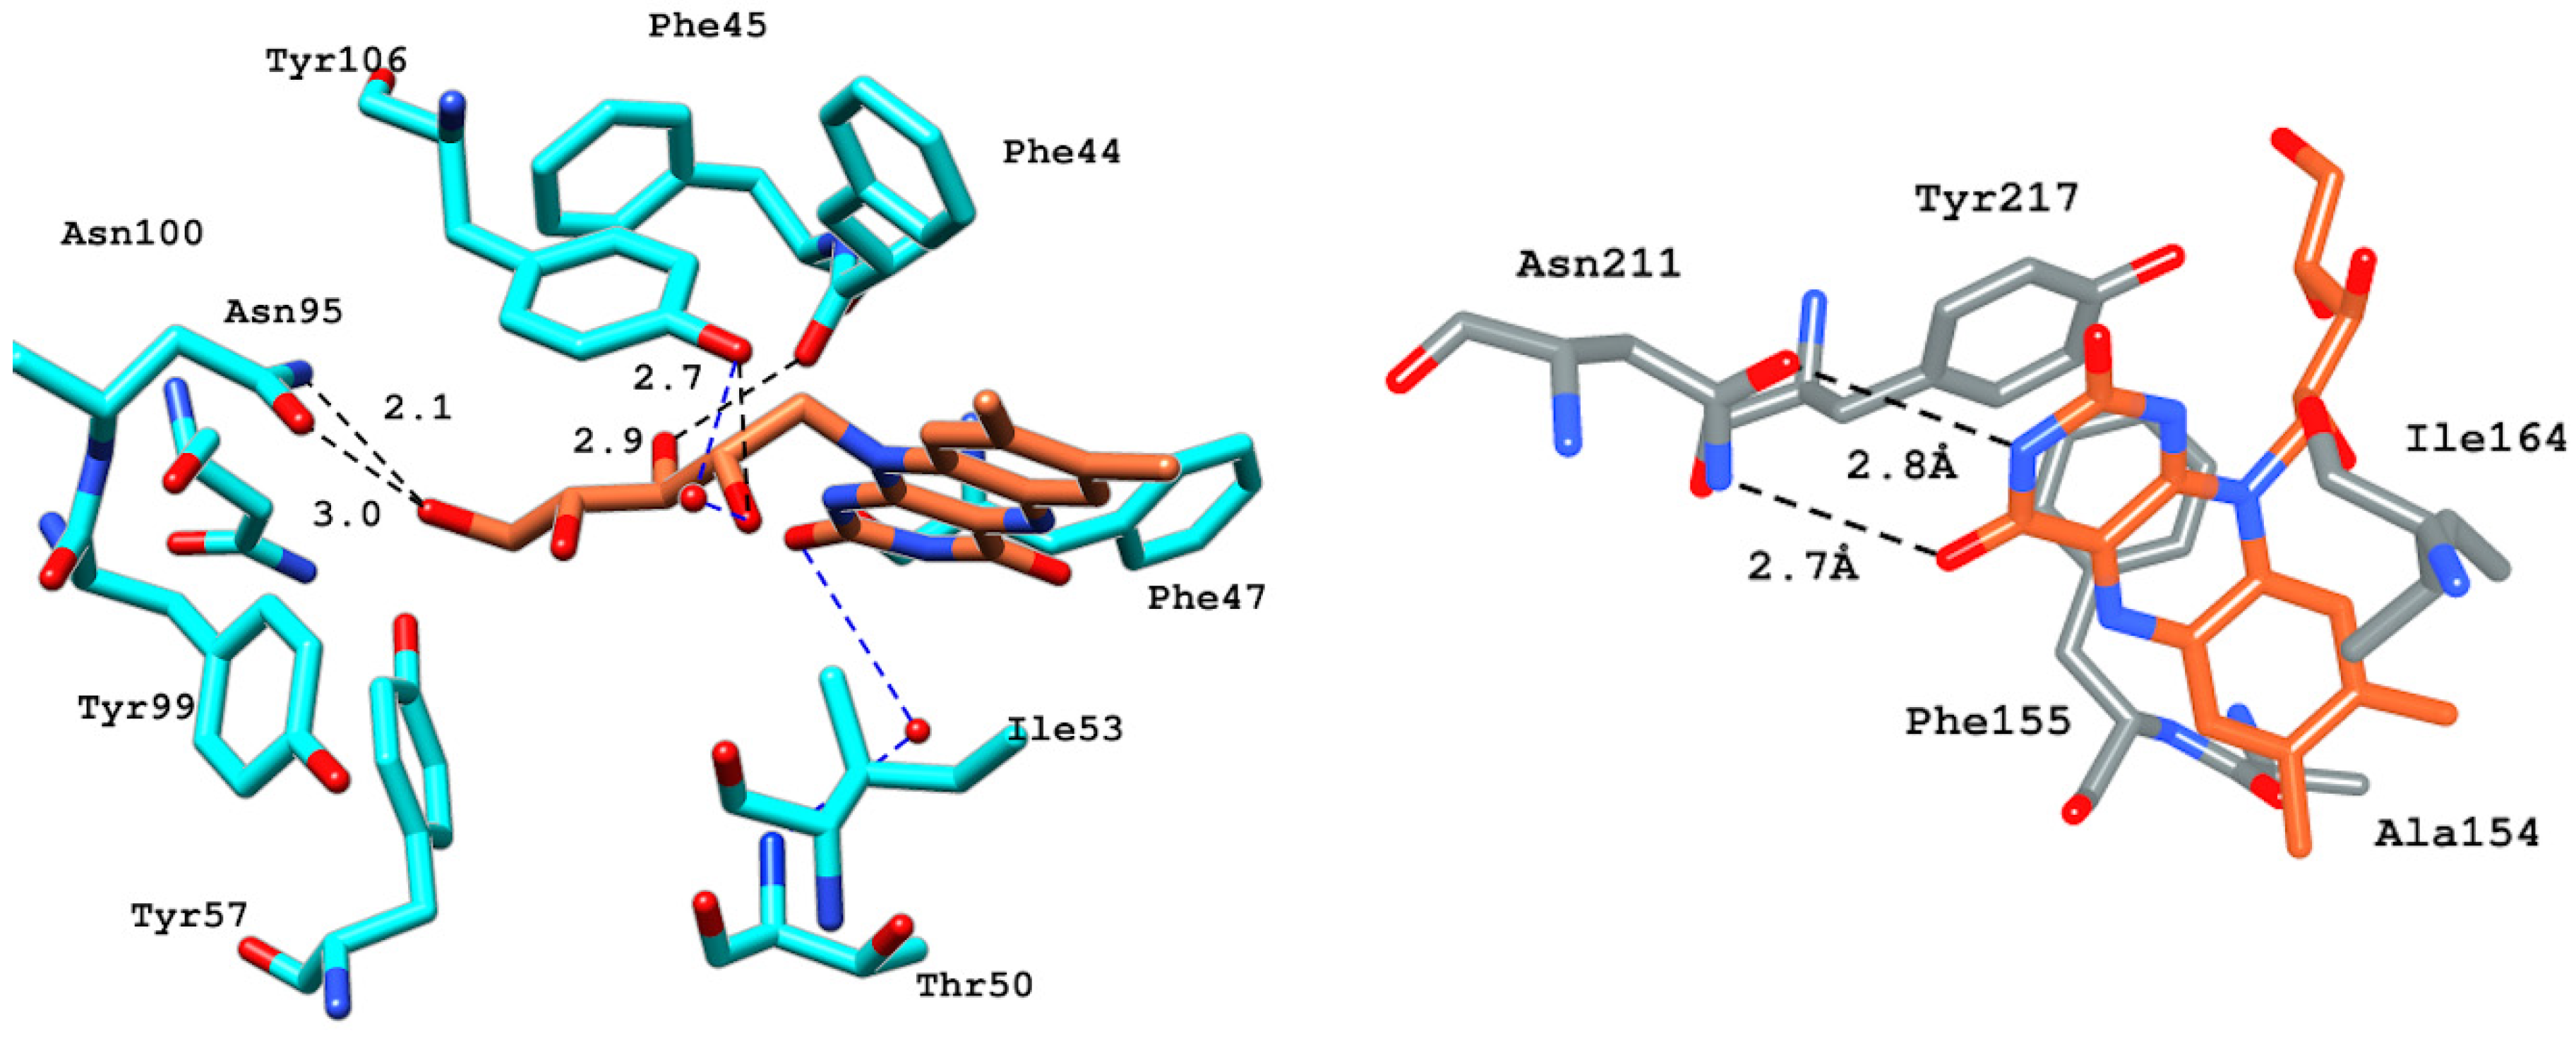
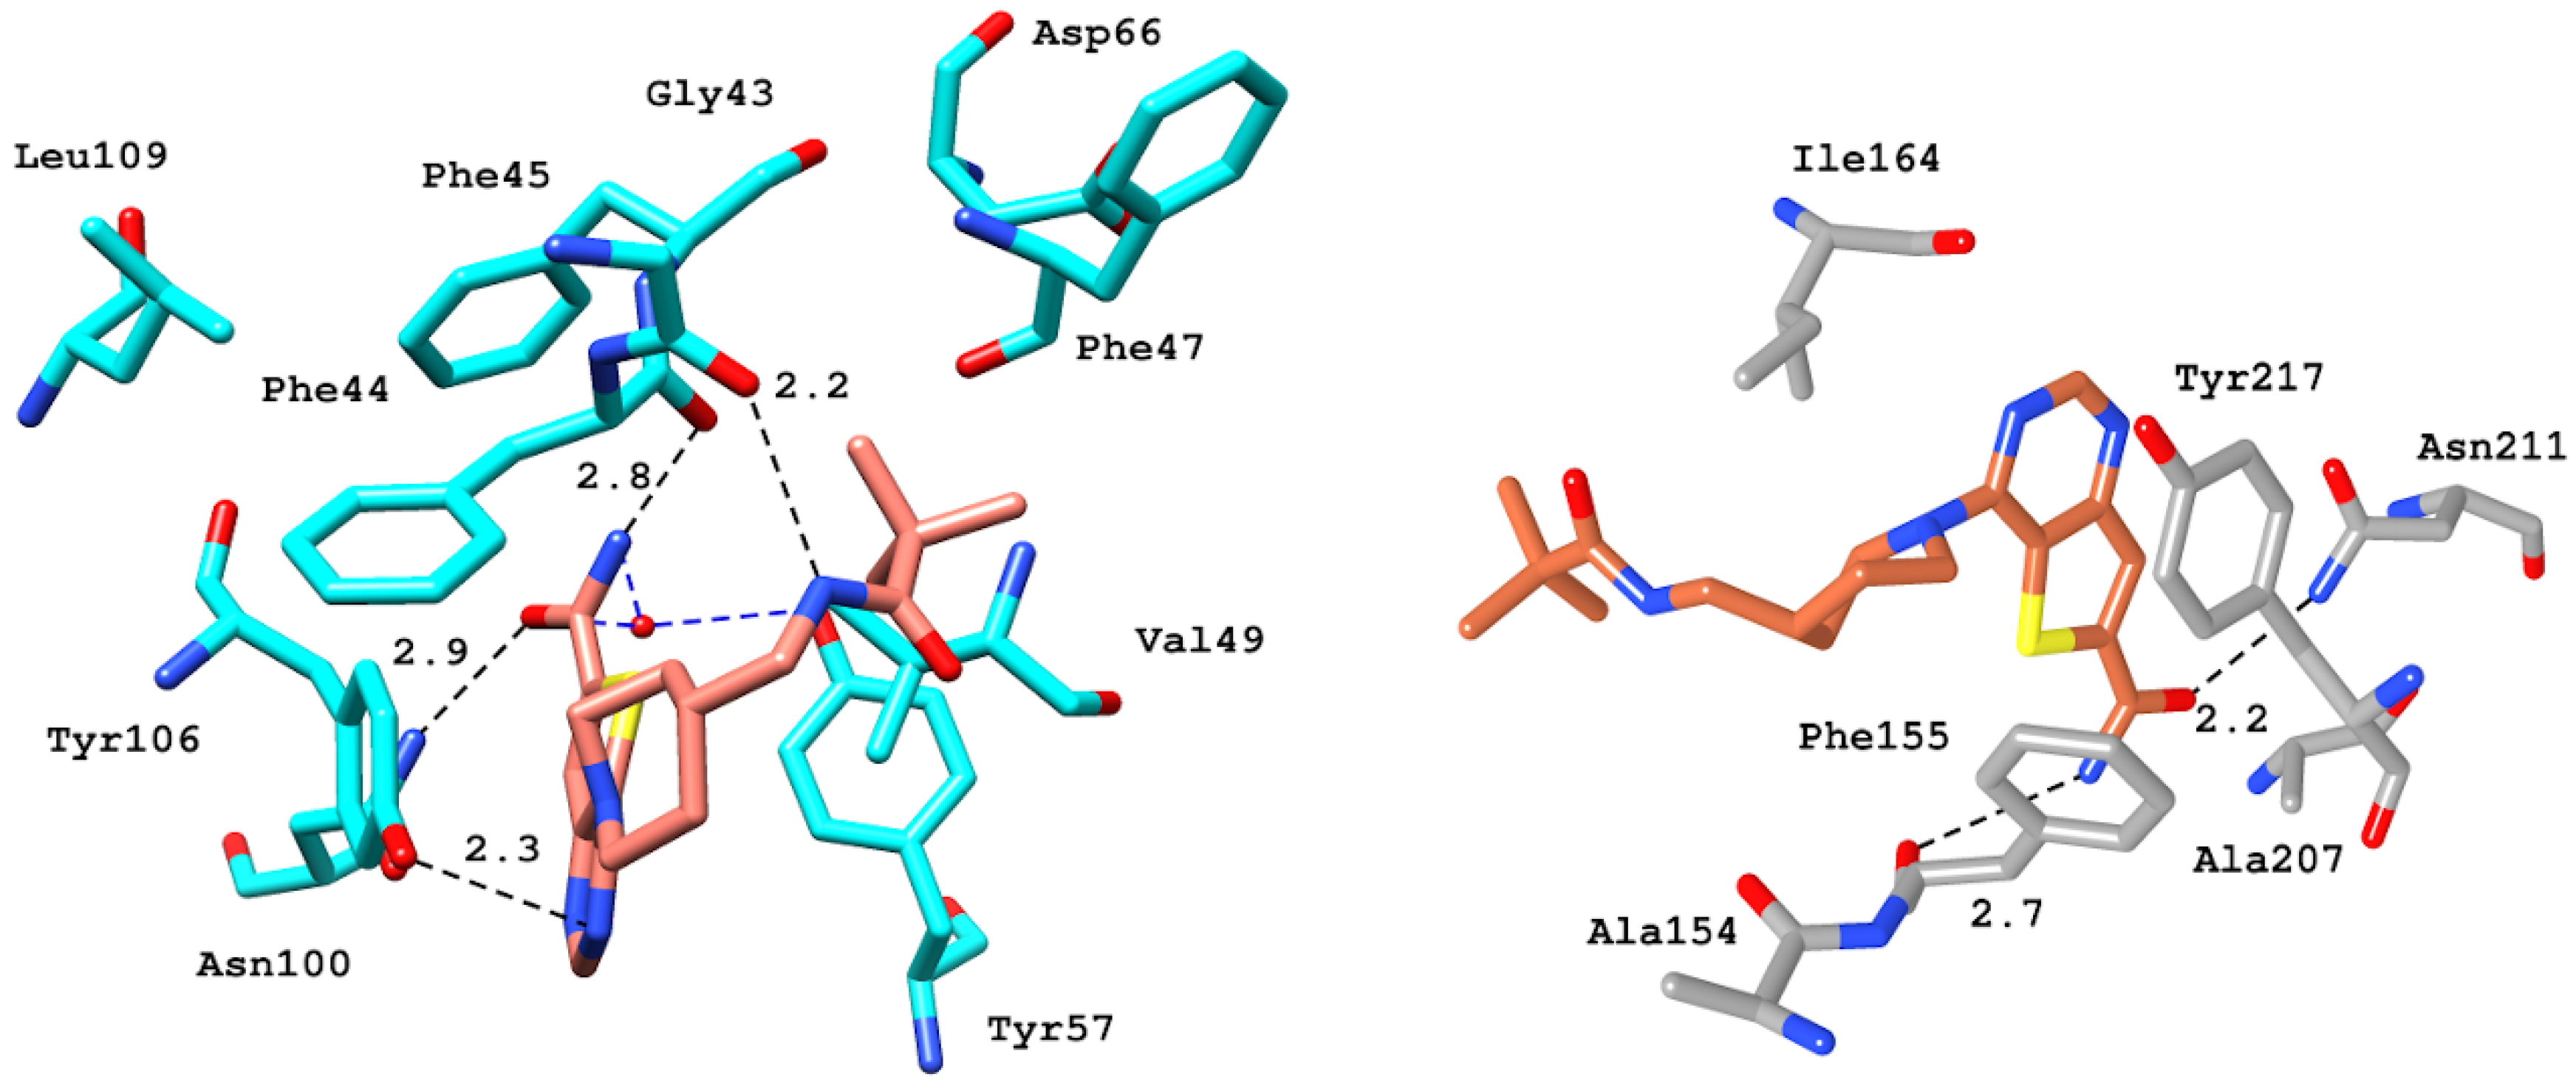
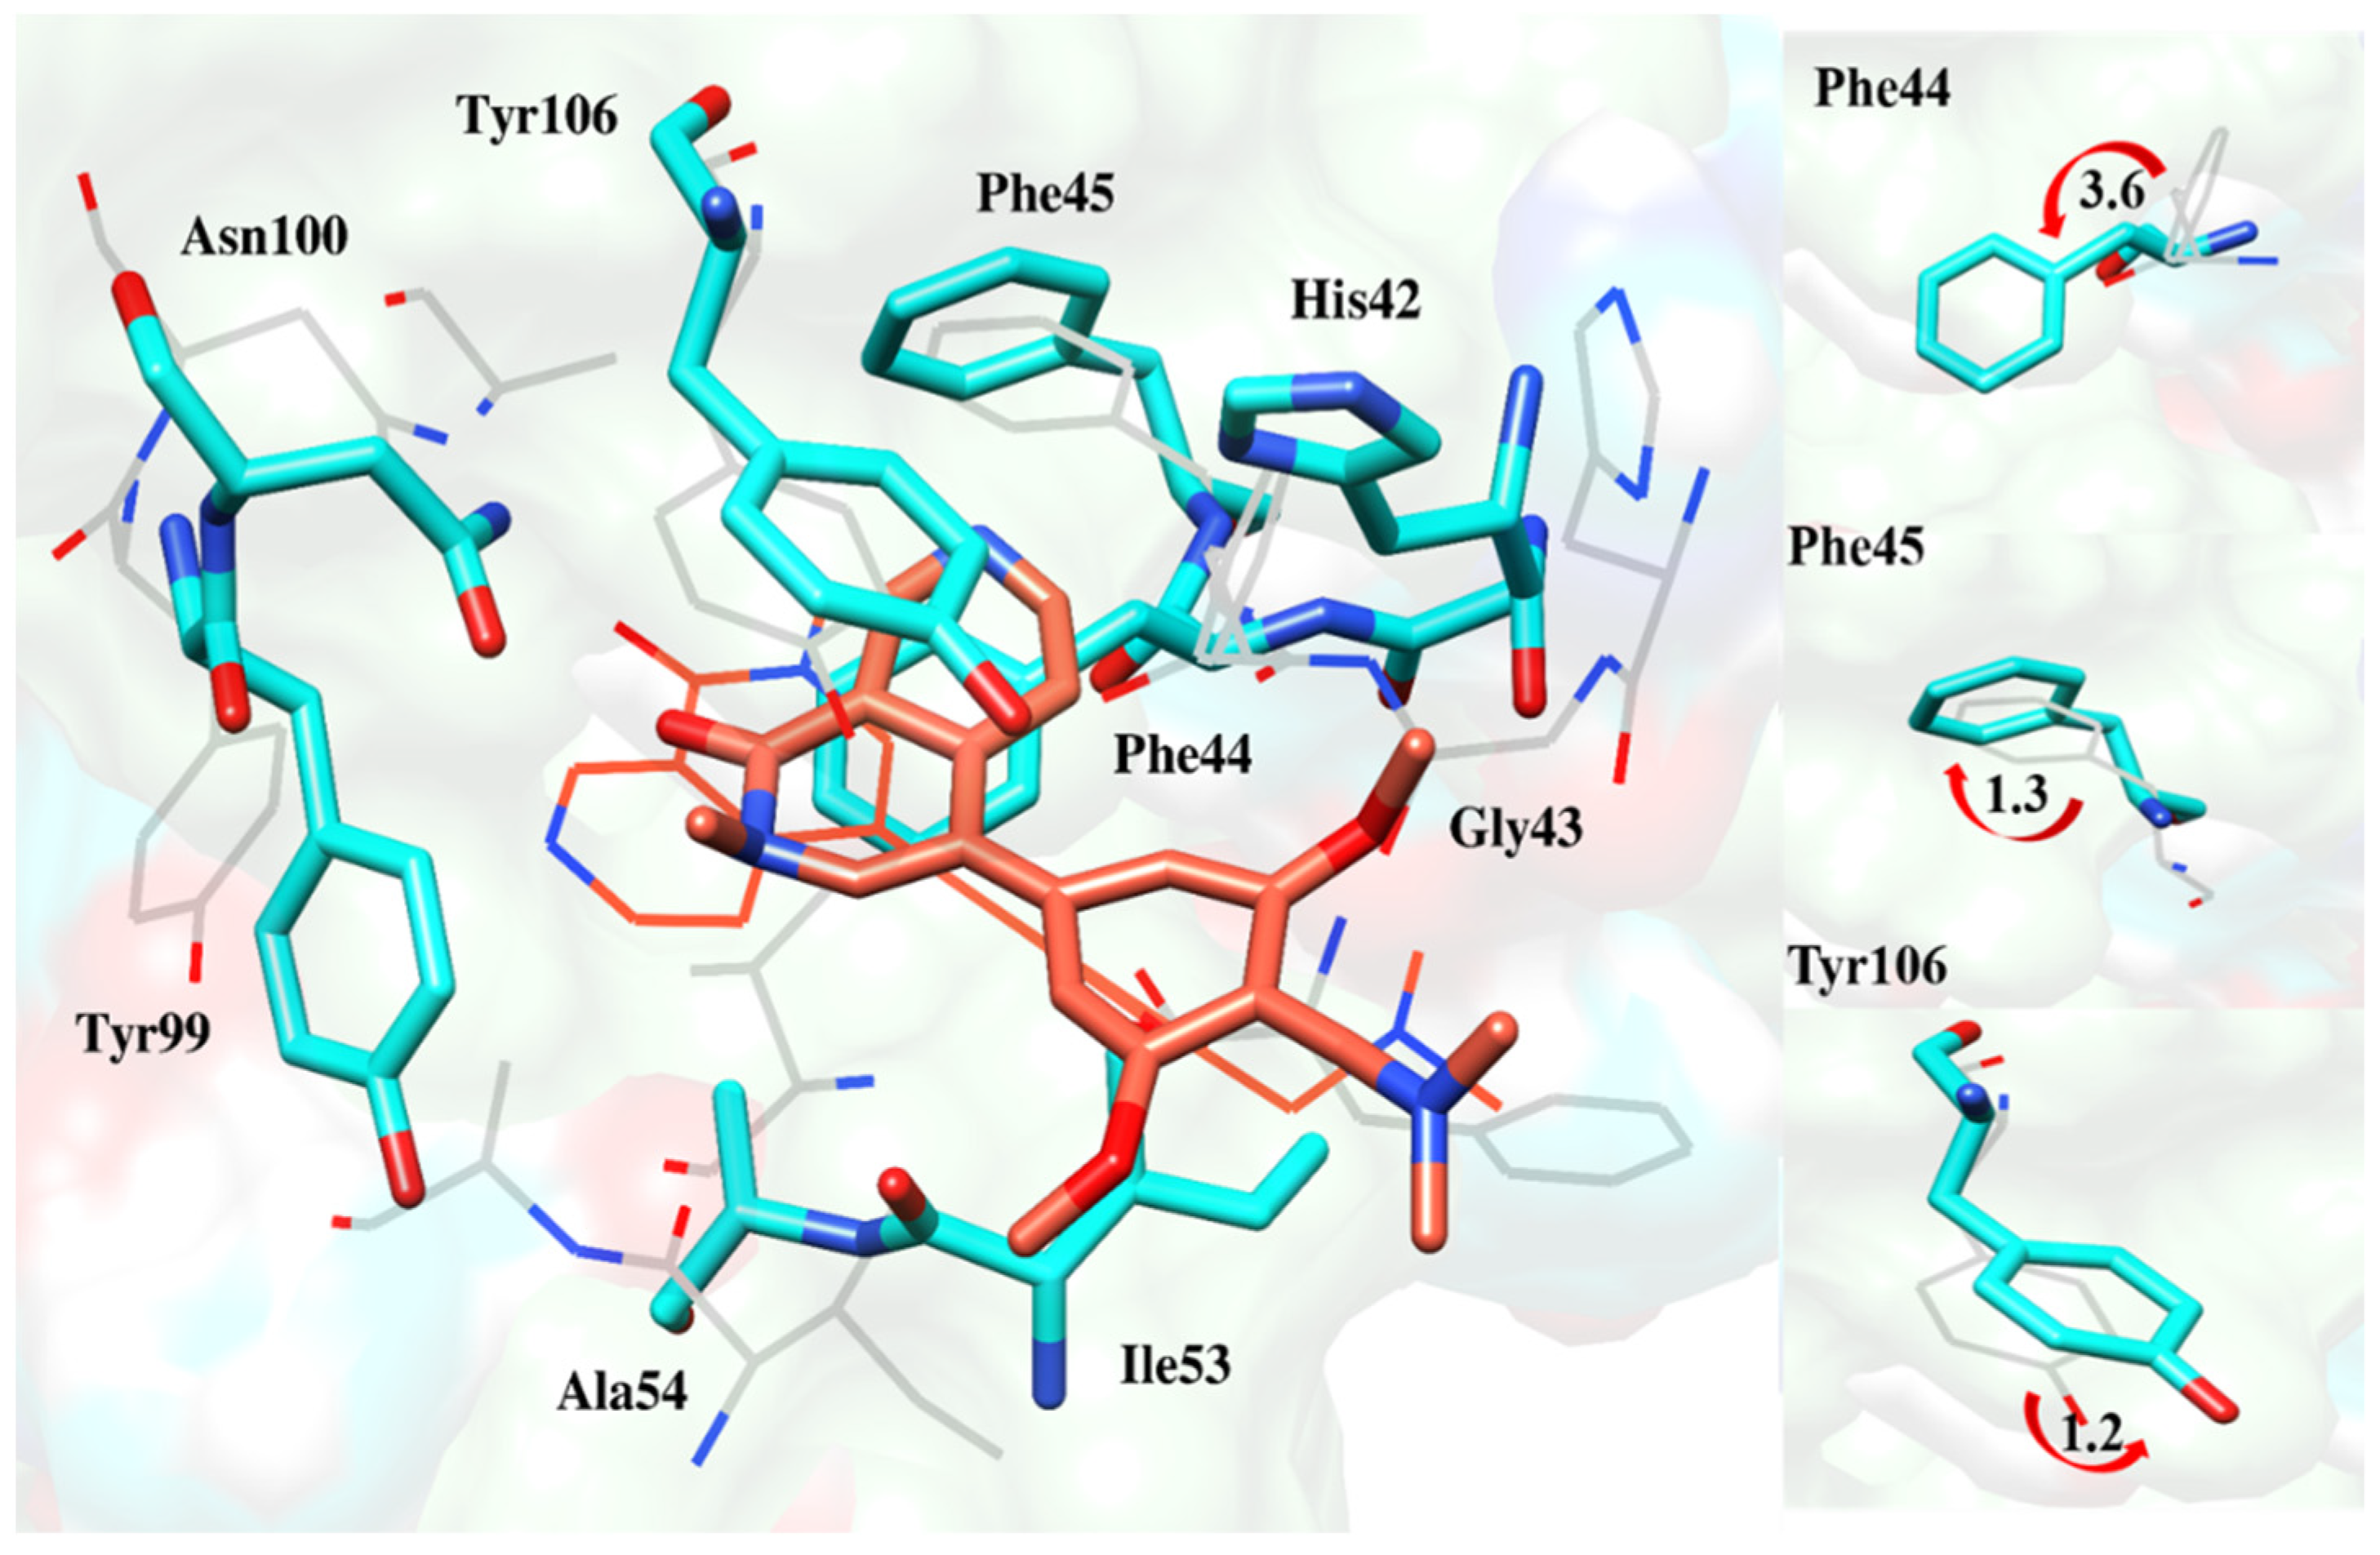
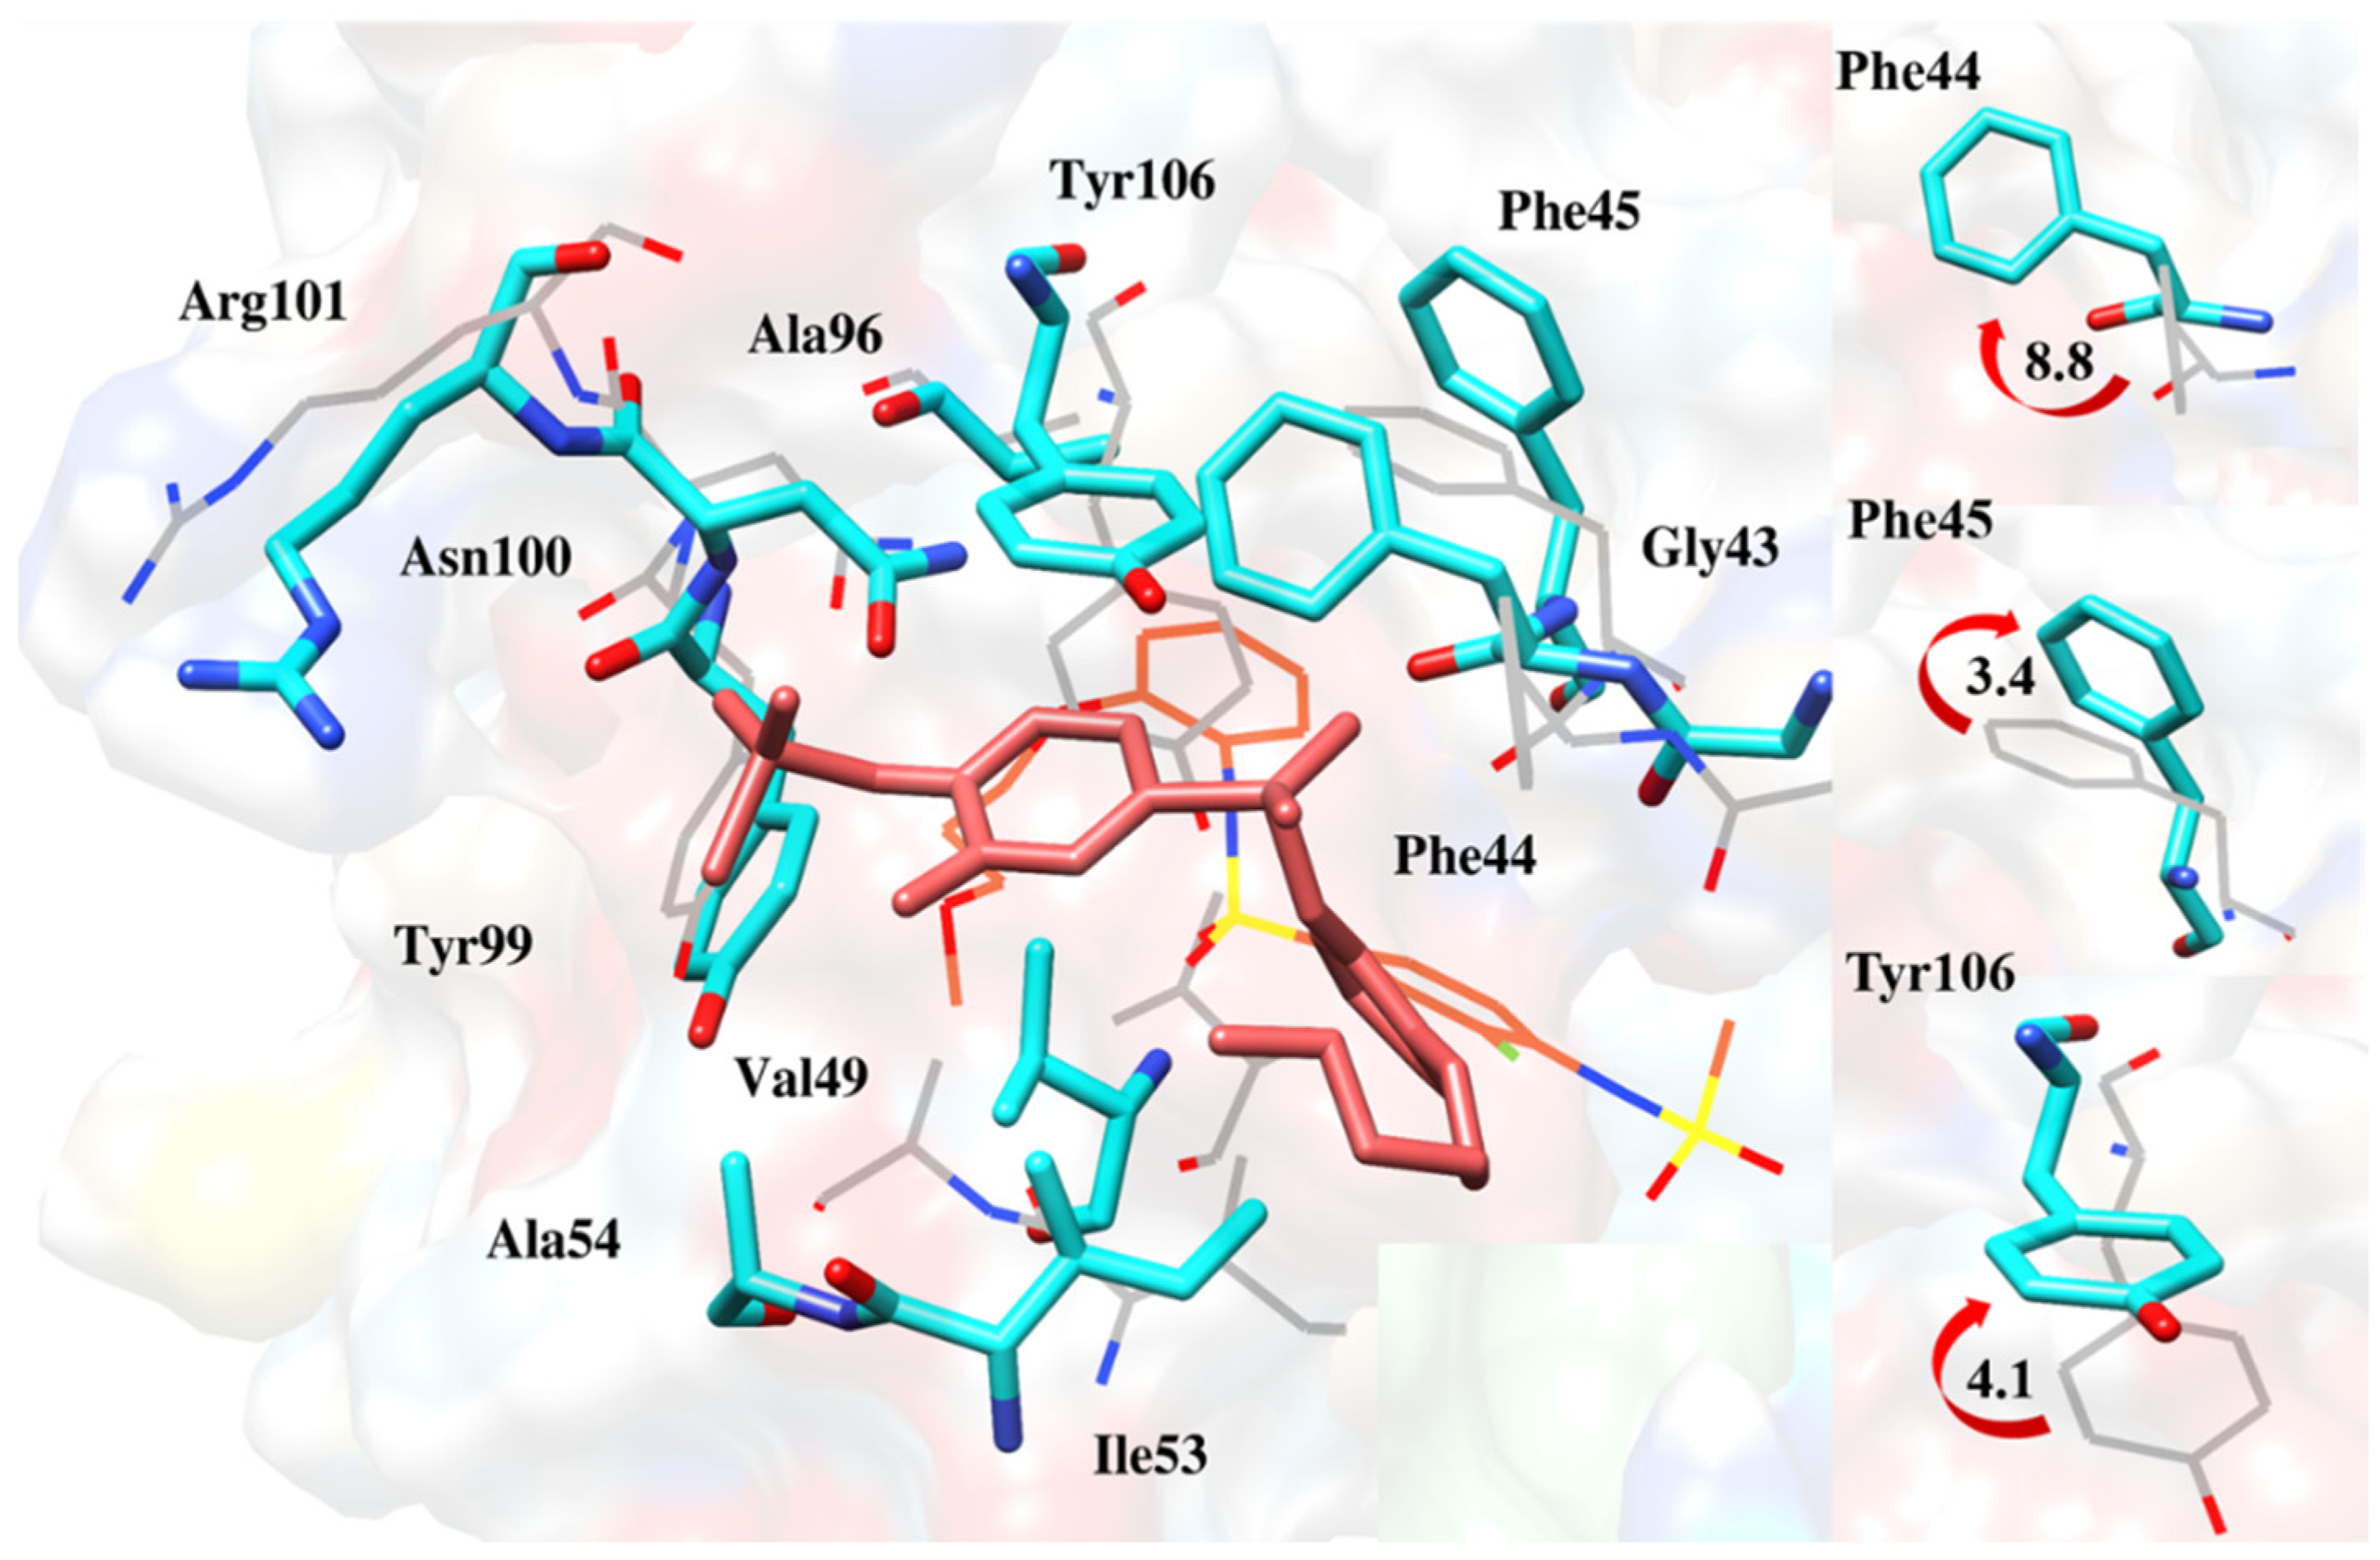
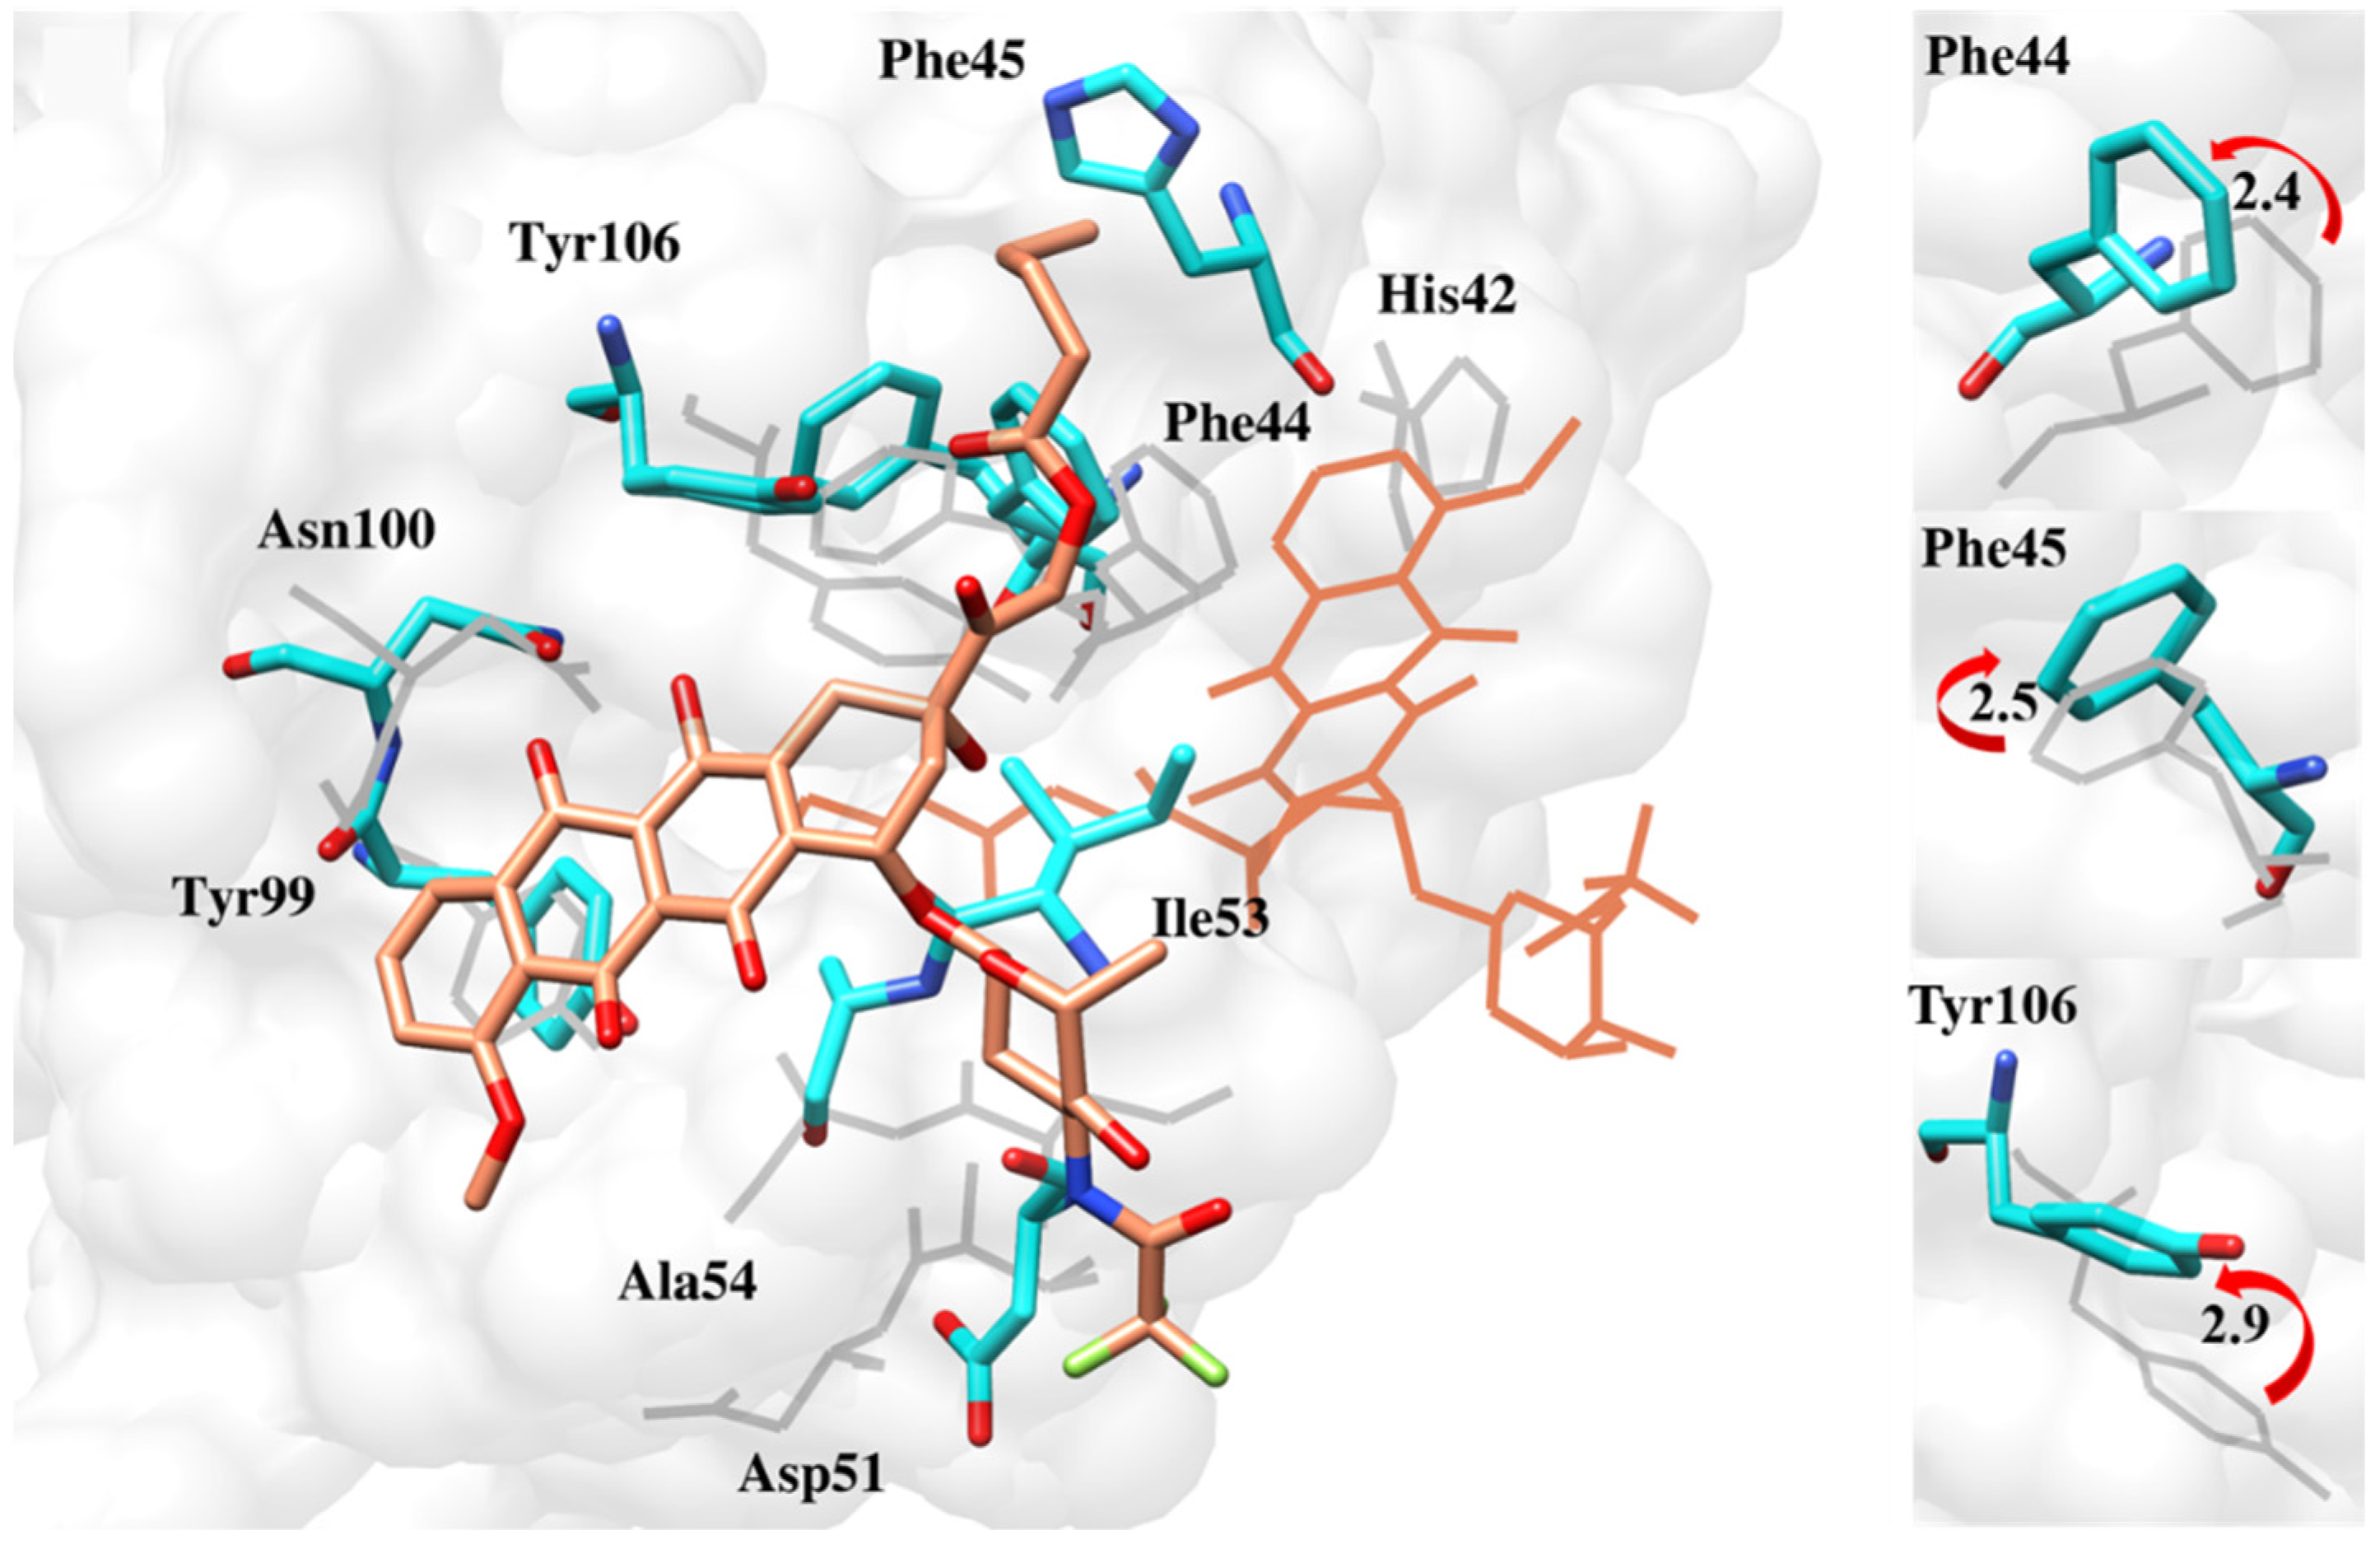
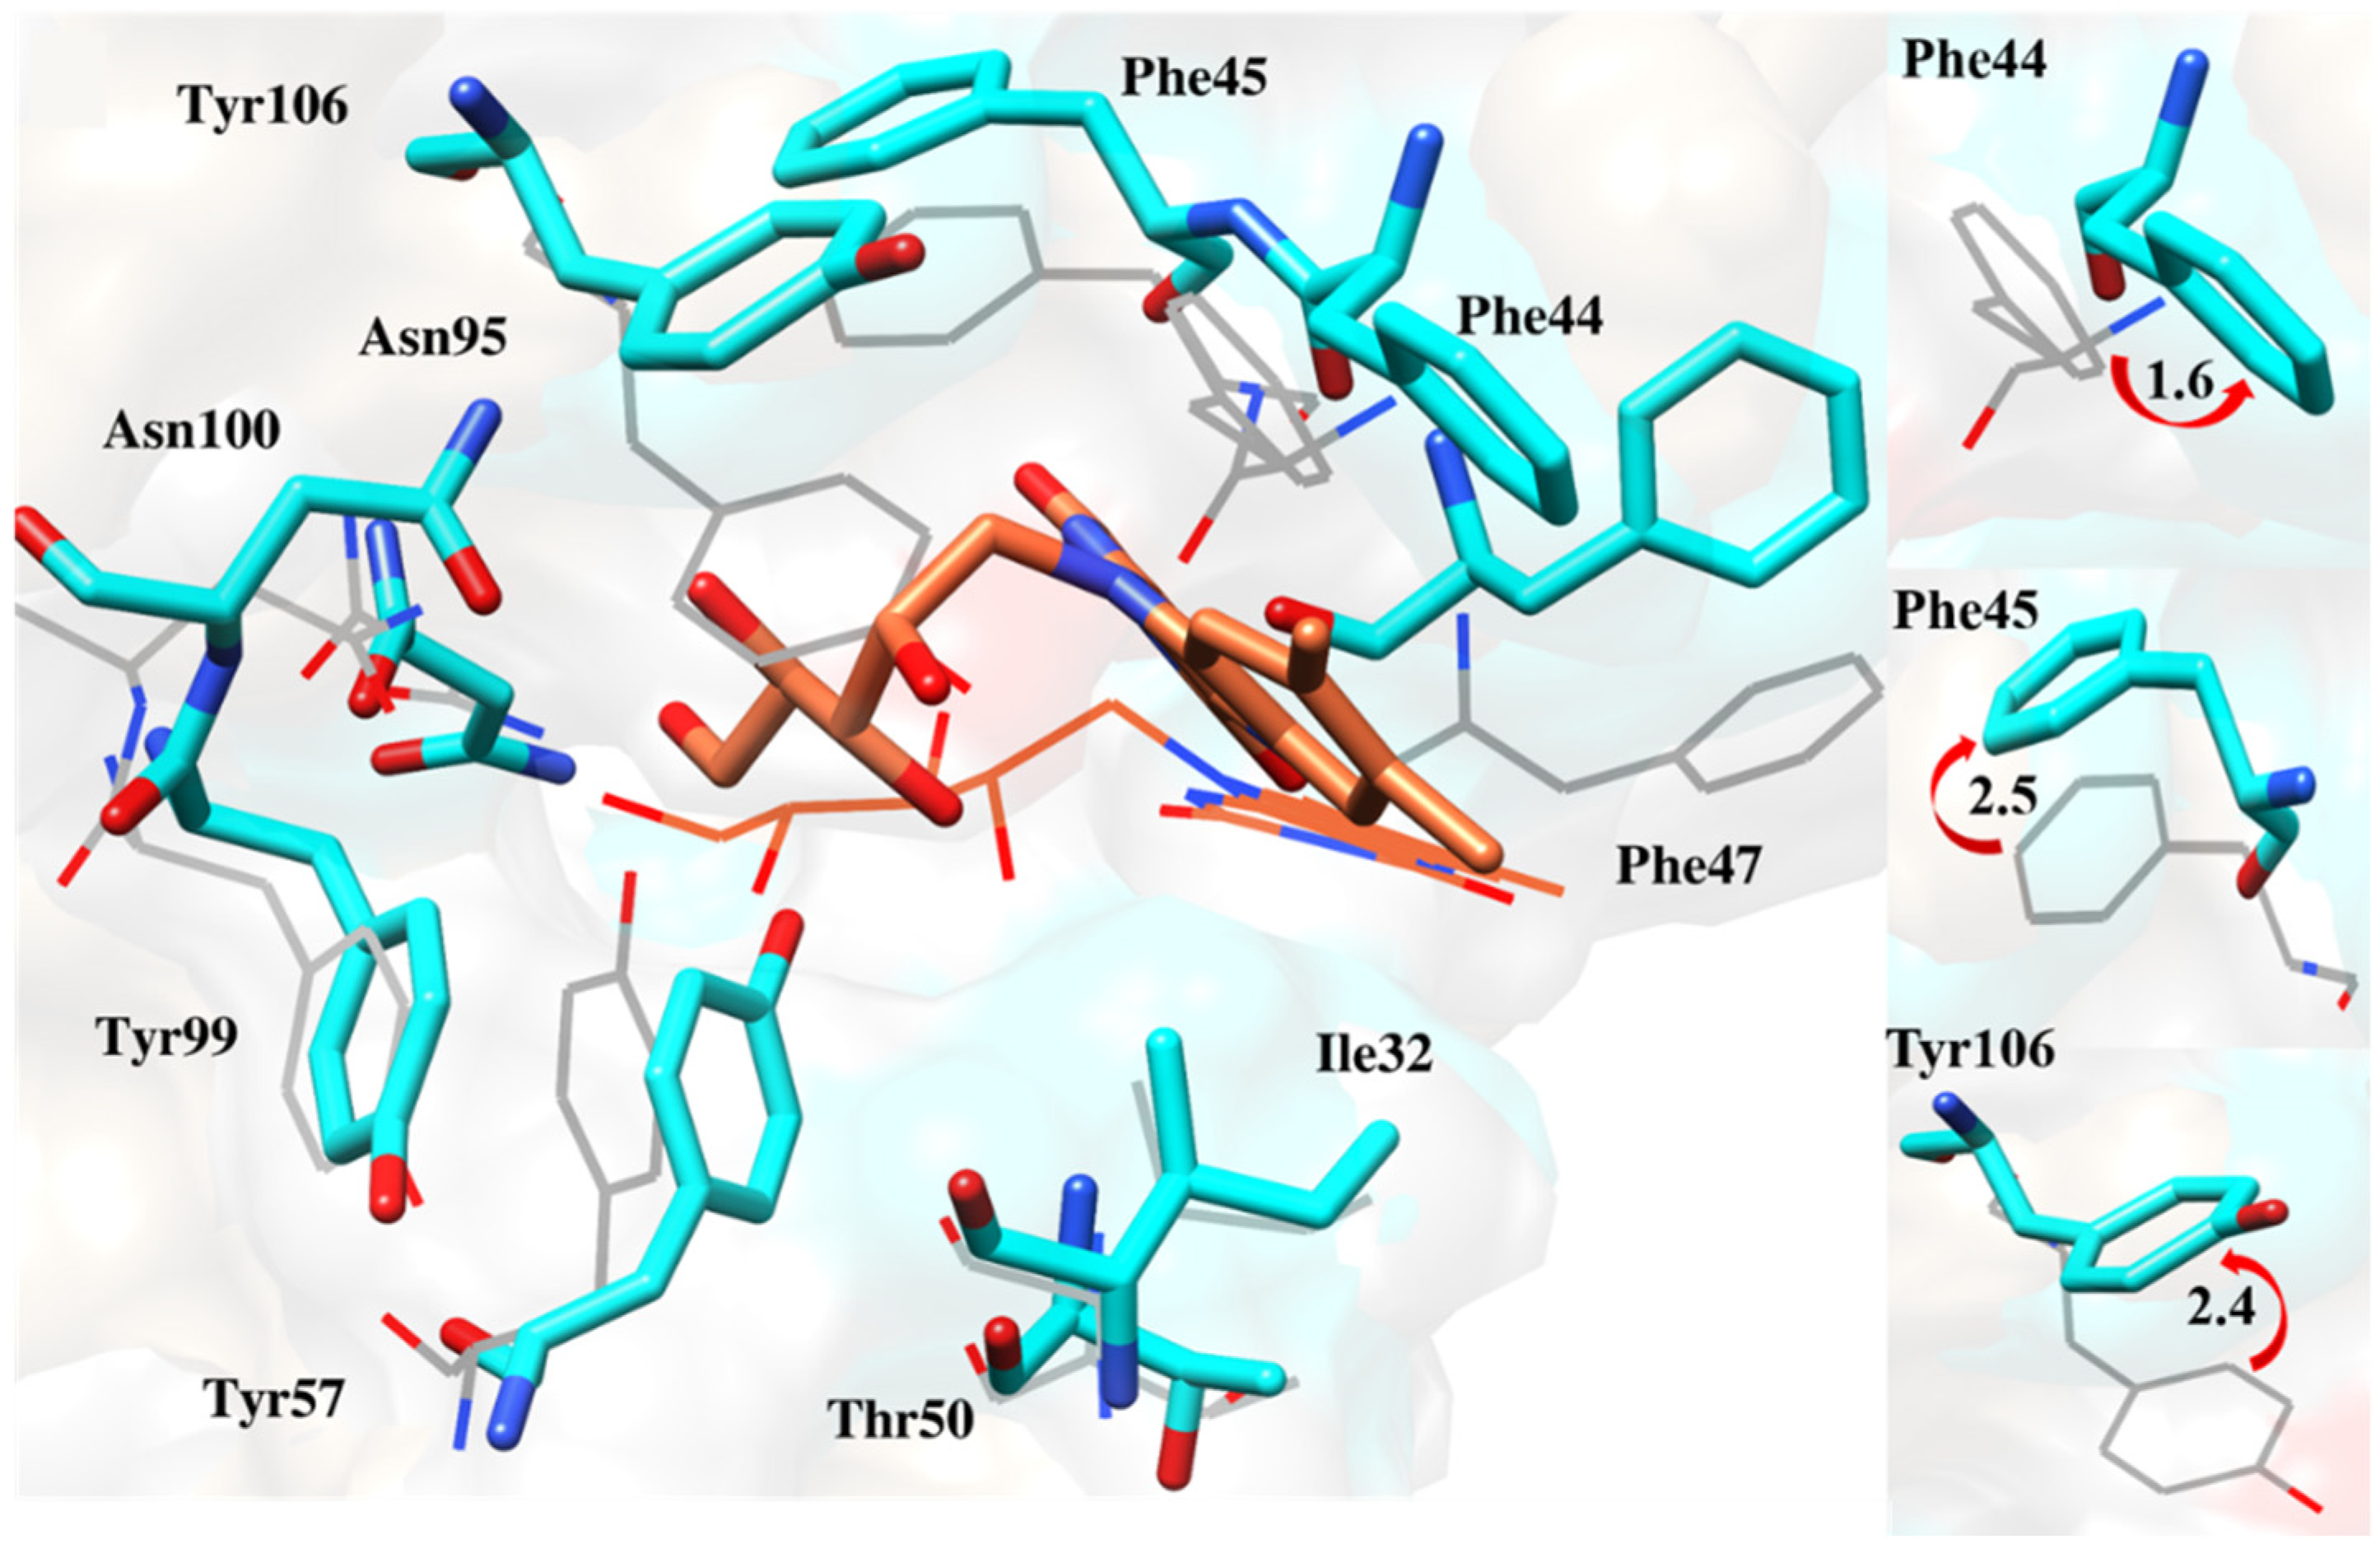
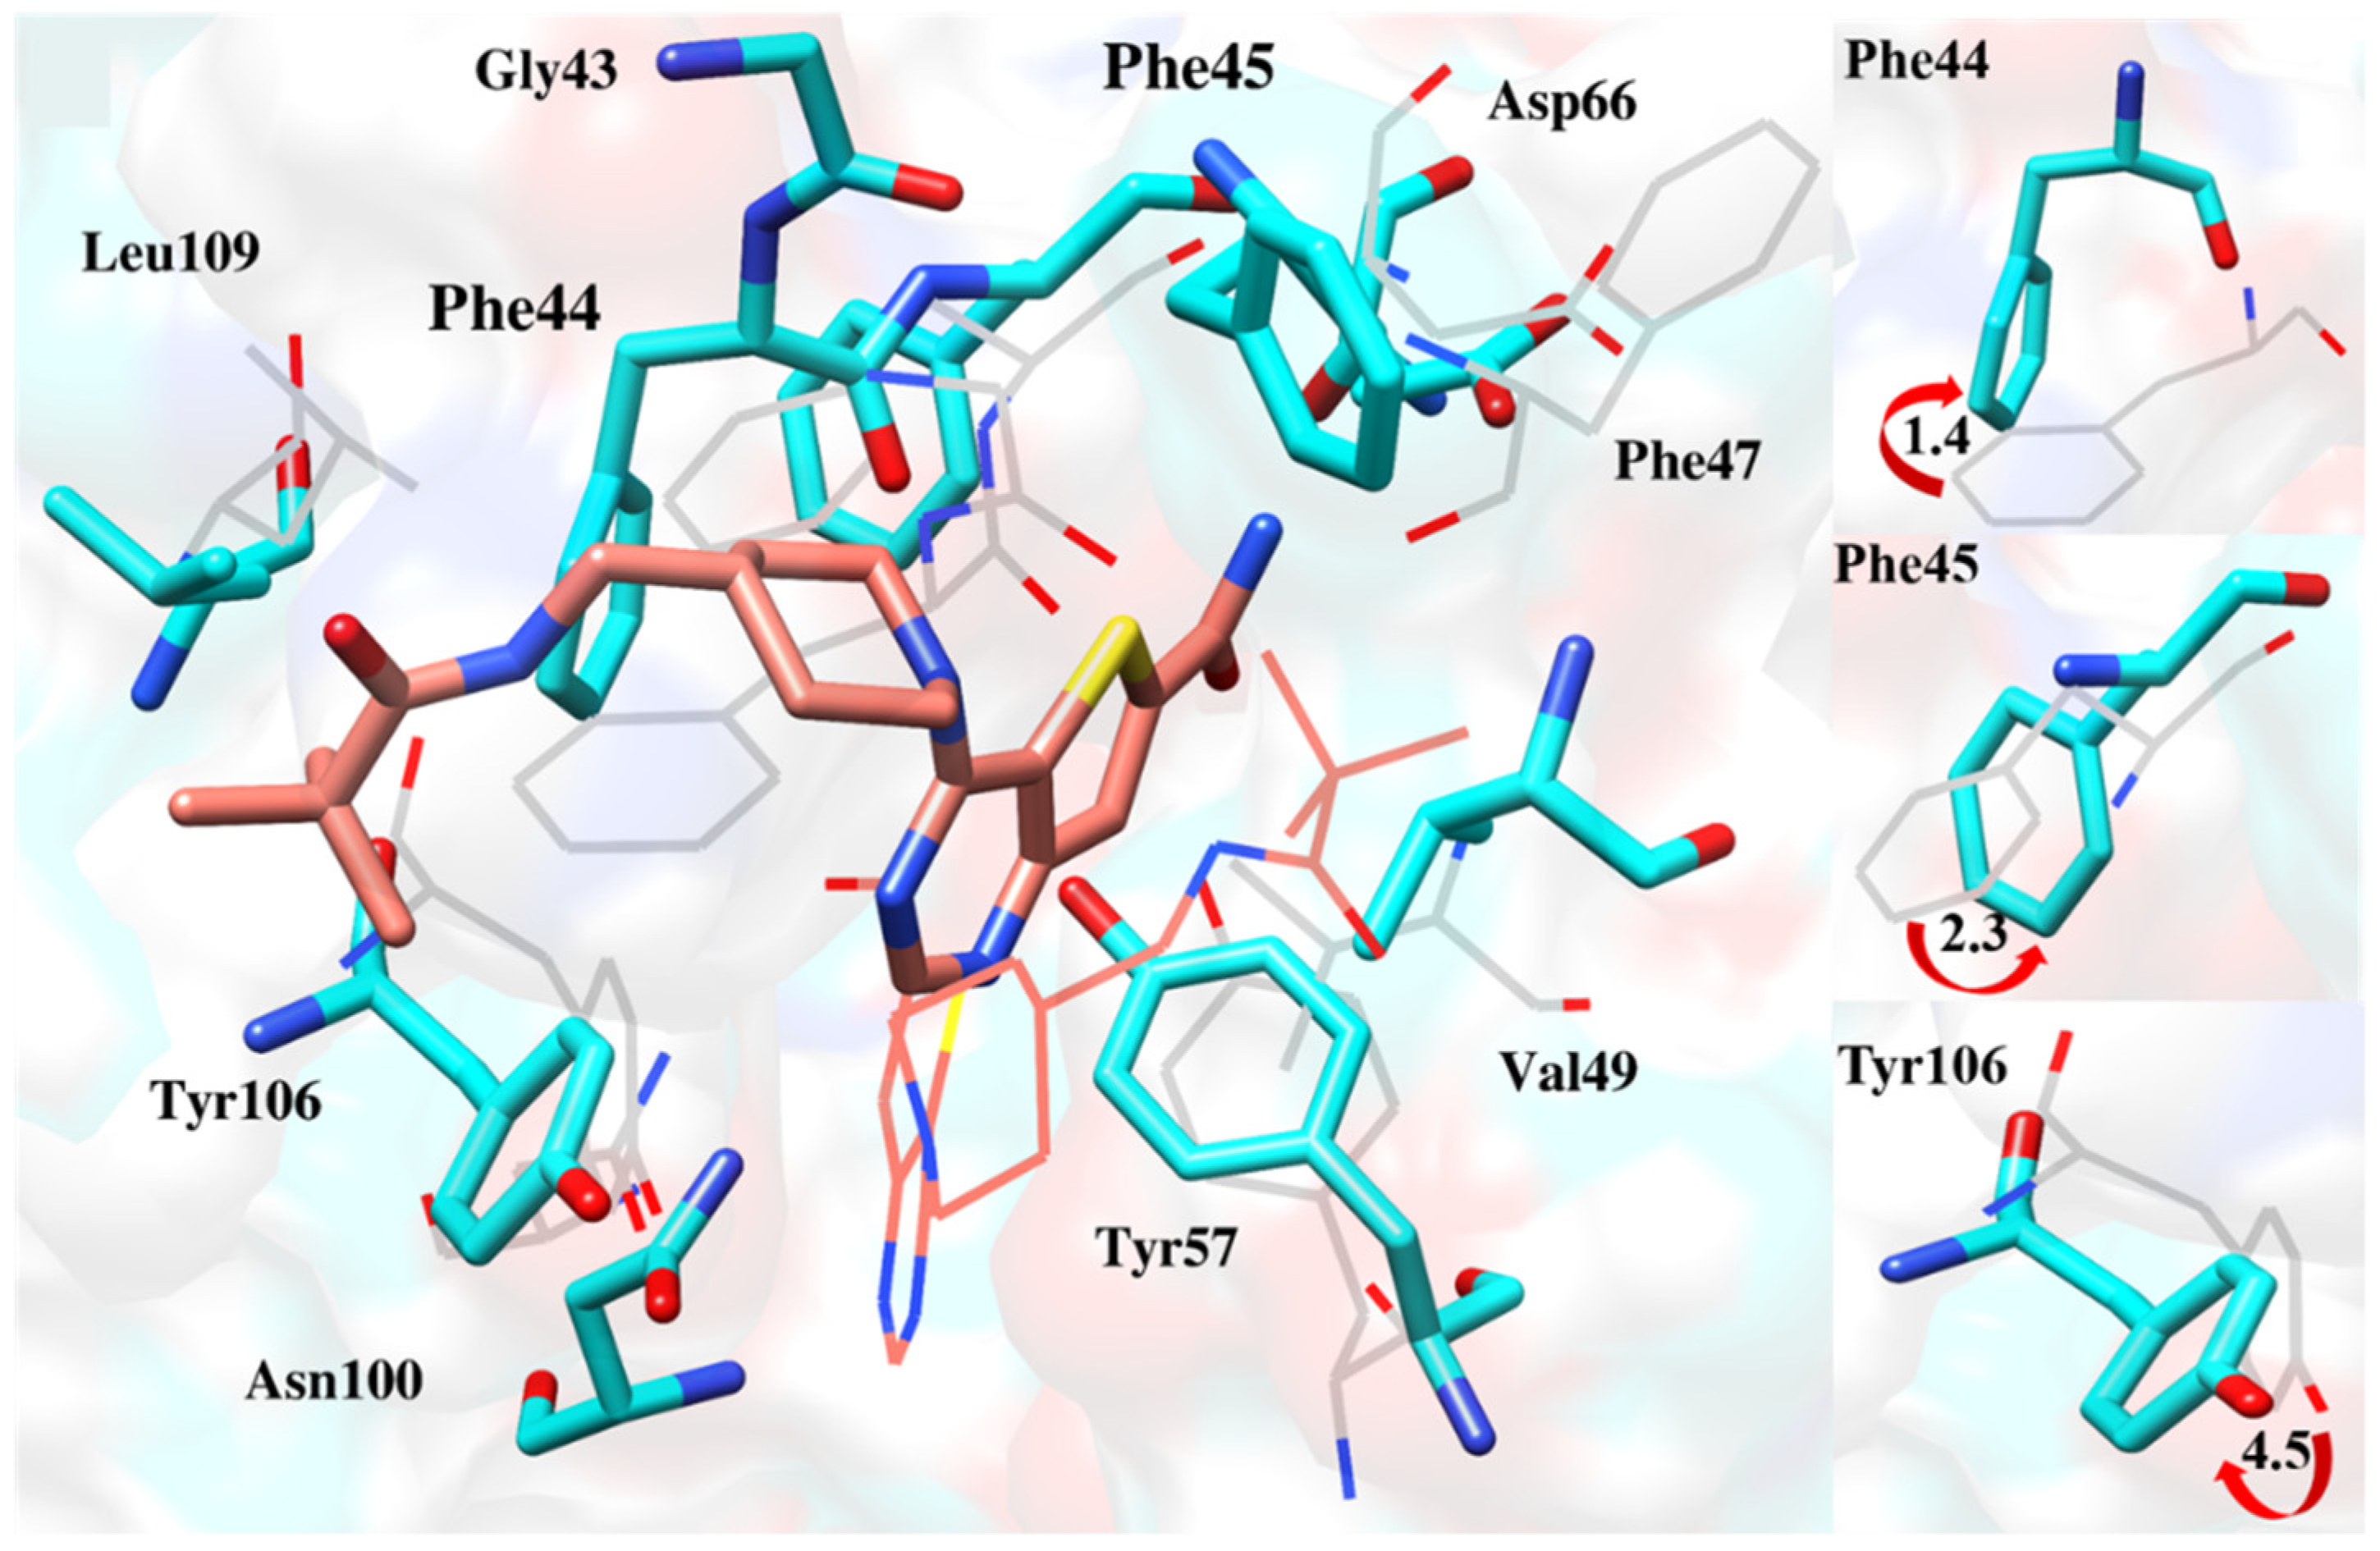
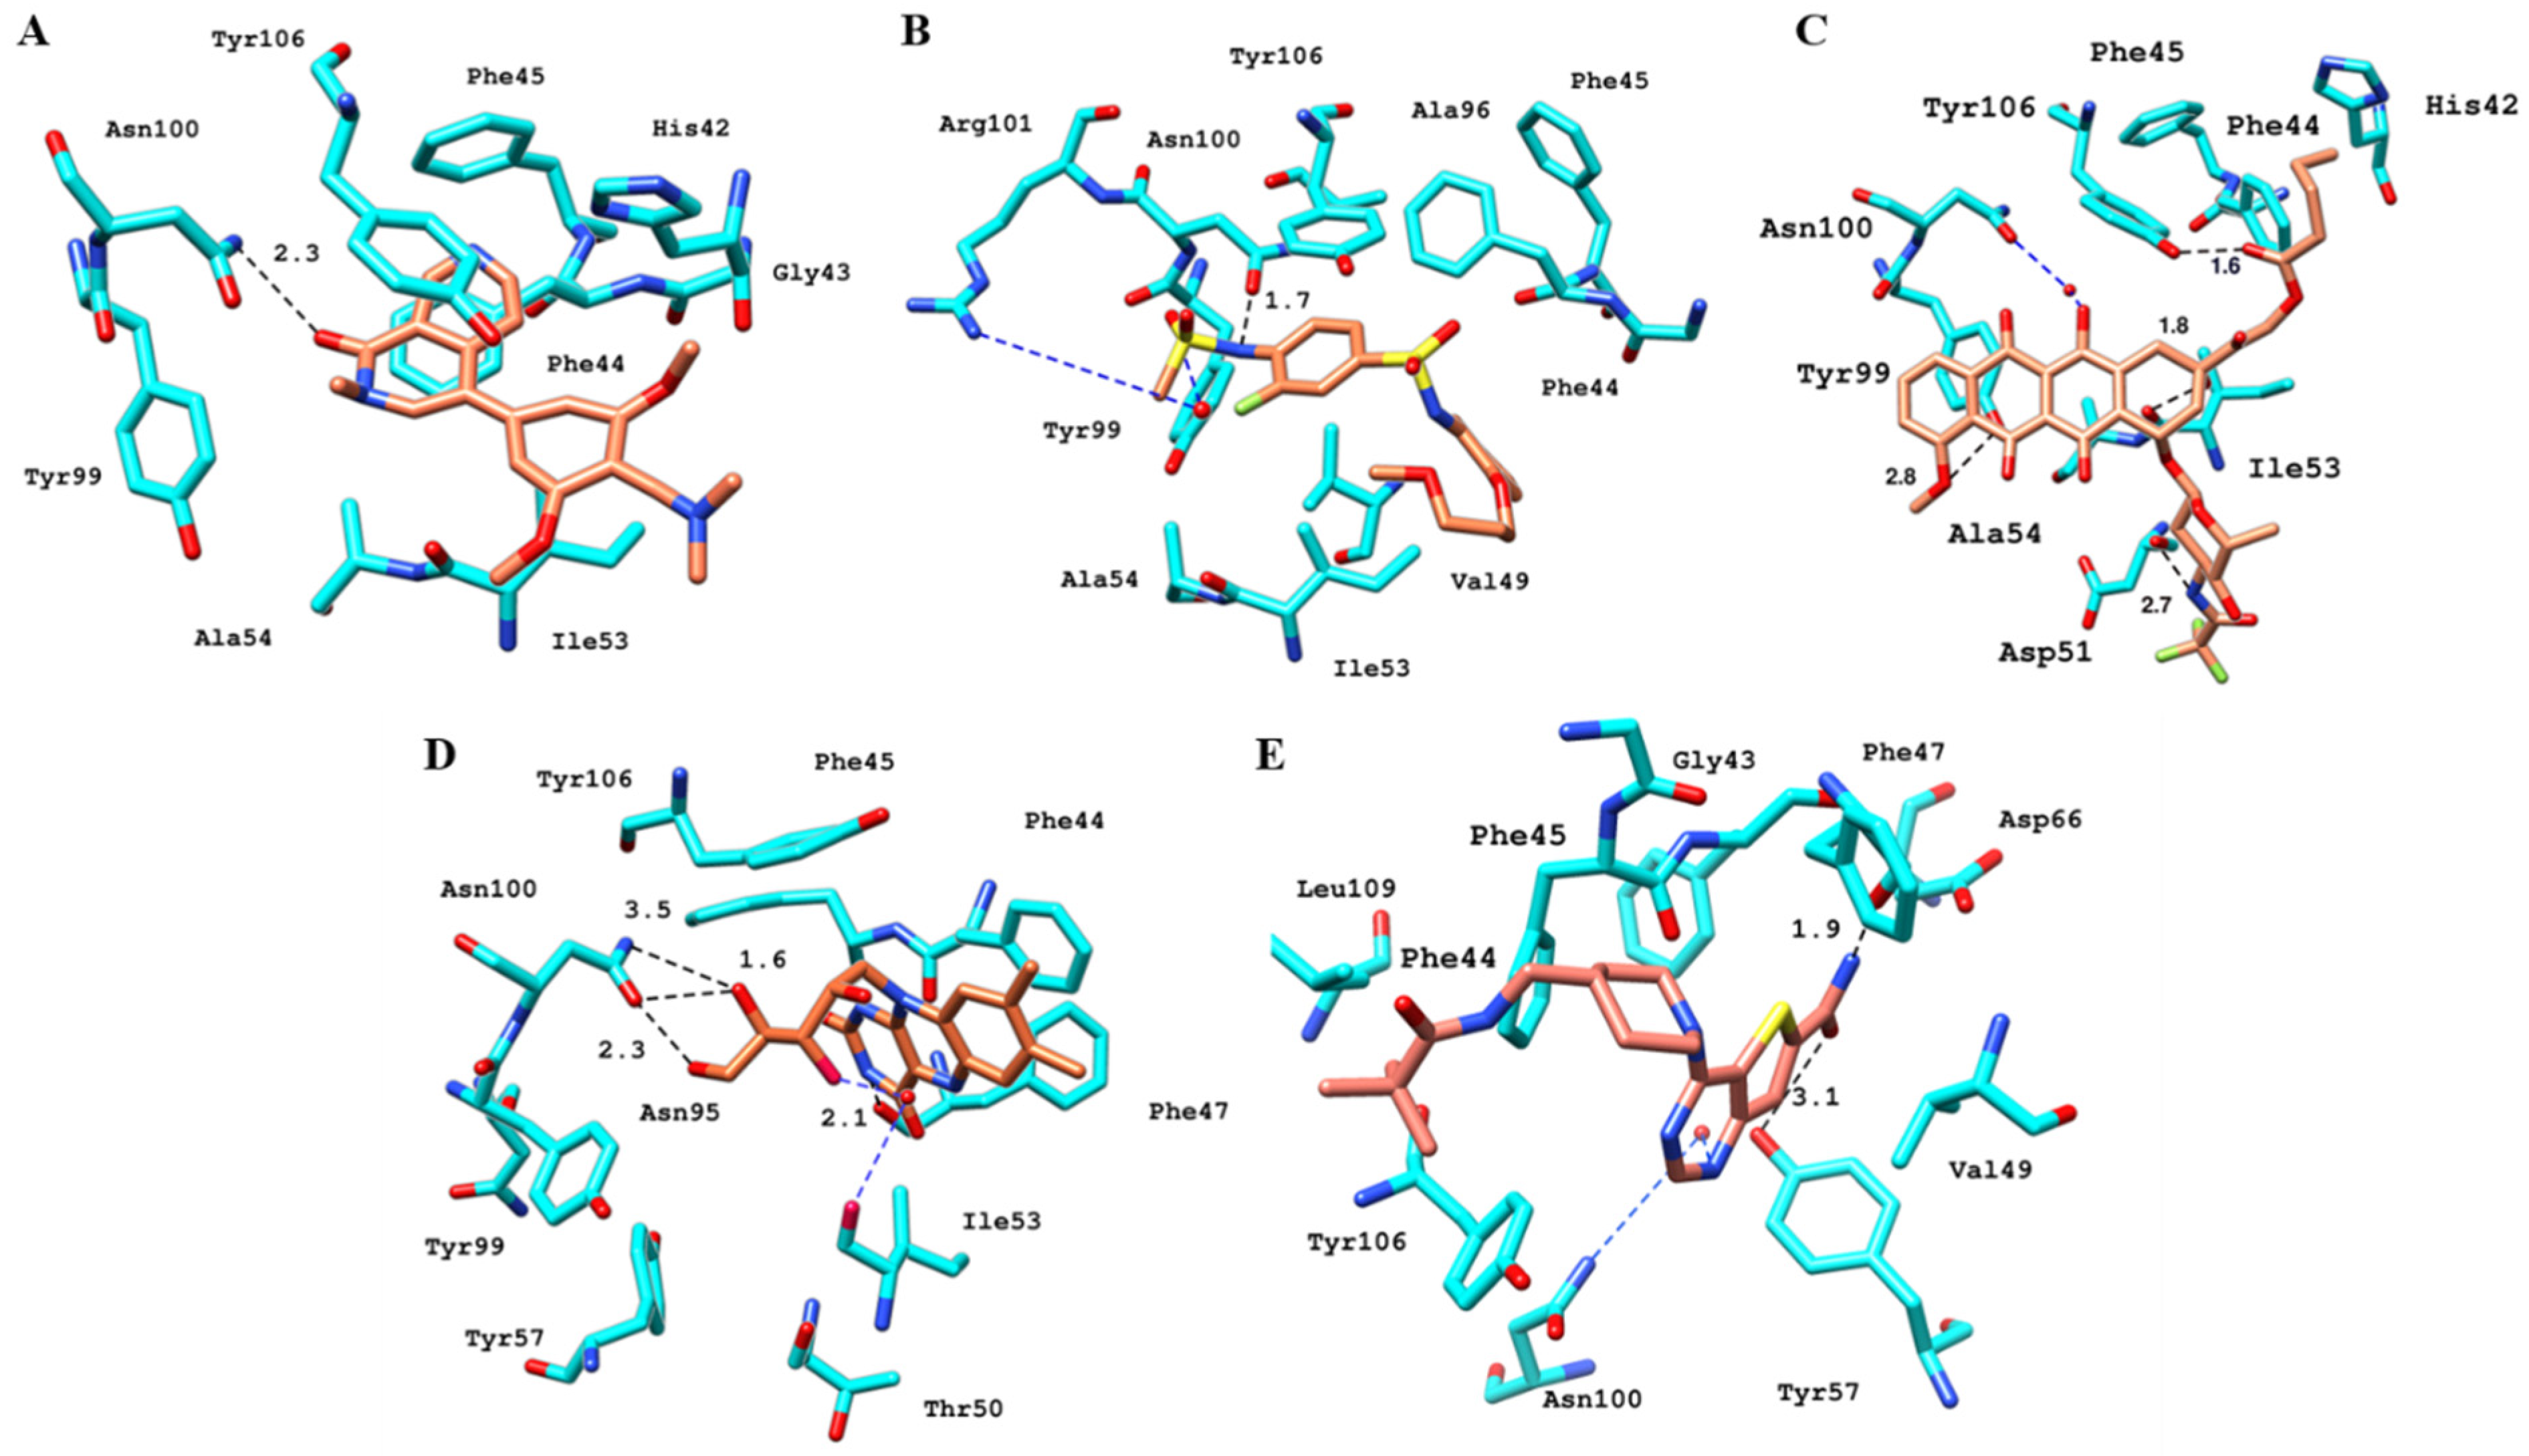
2.6.4. Interaction Pattern of Ligand–Protein Complexes
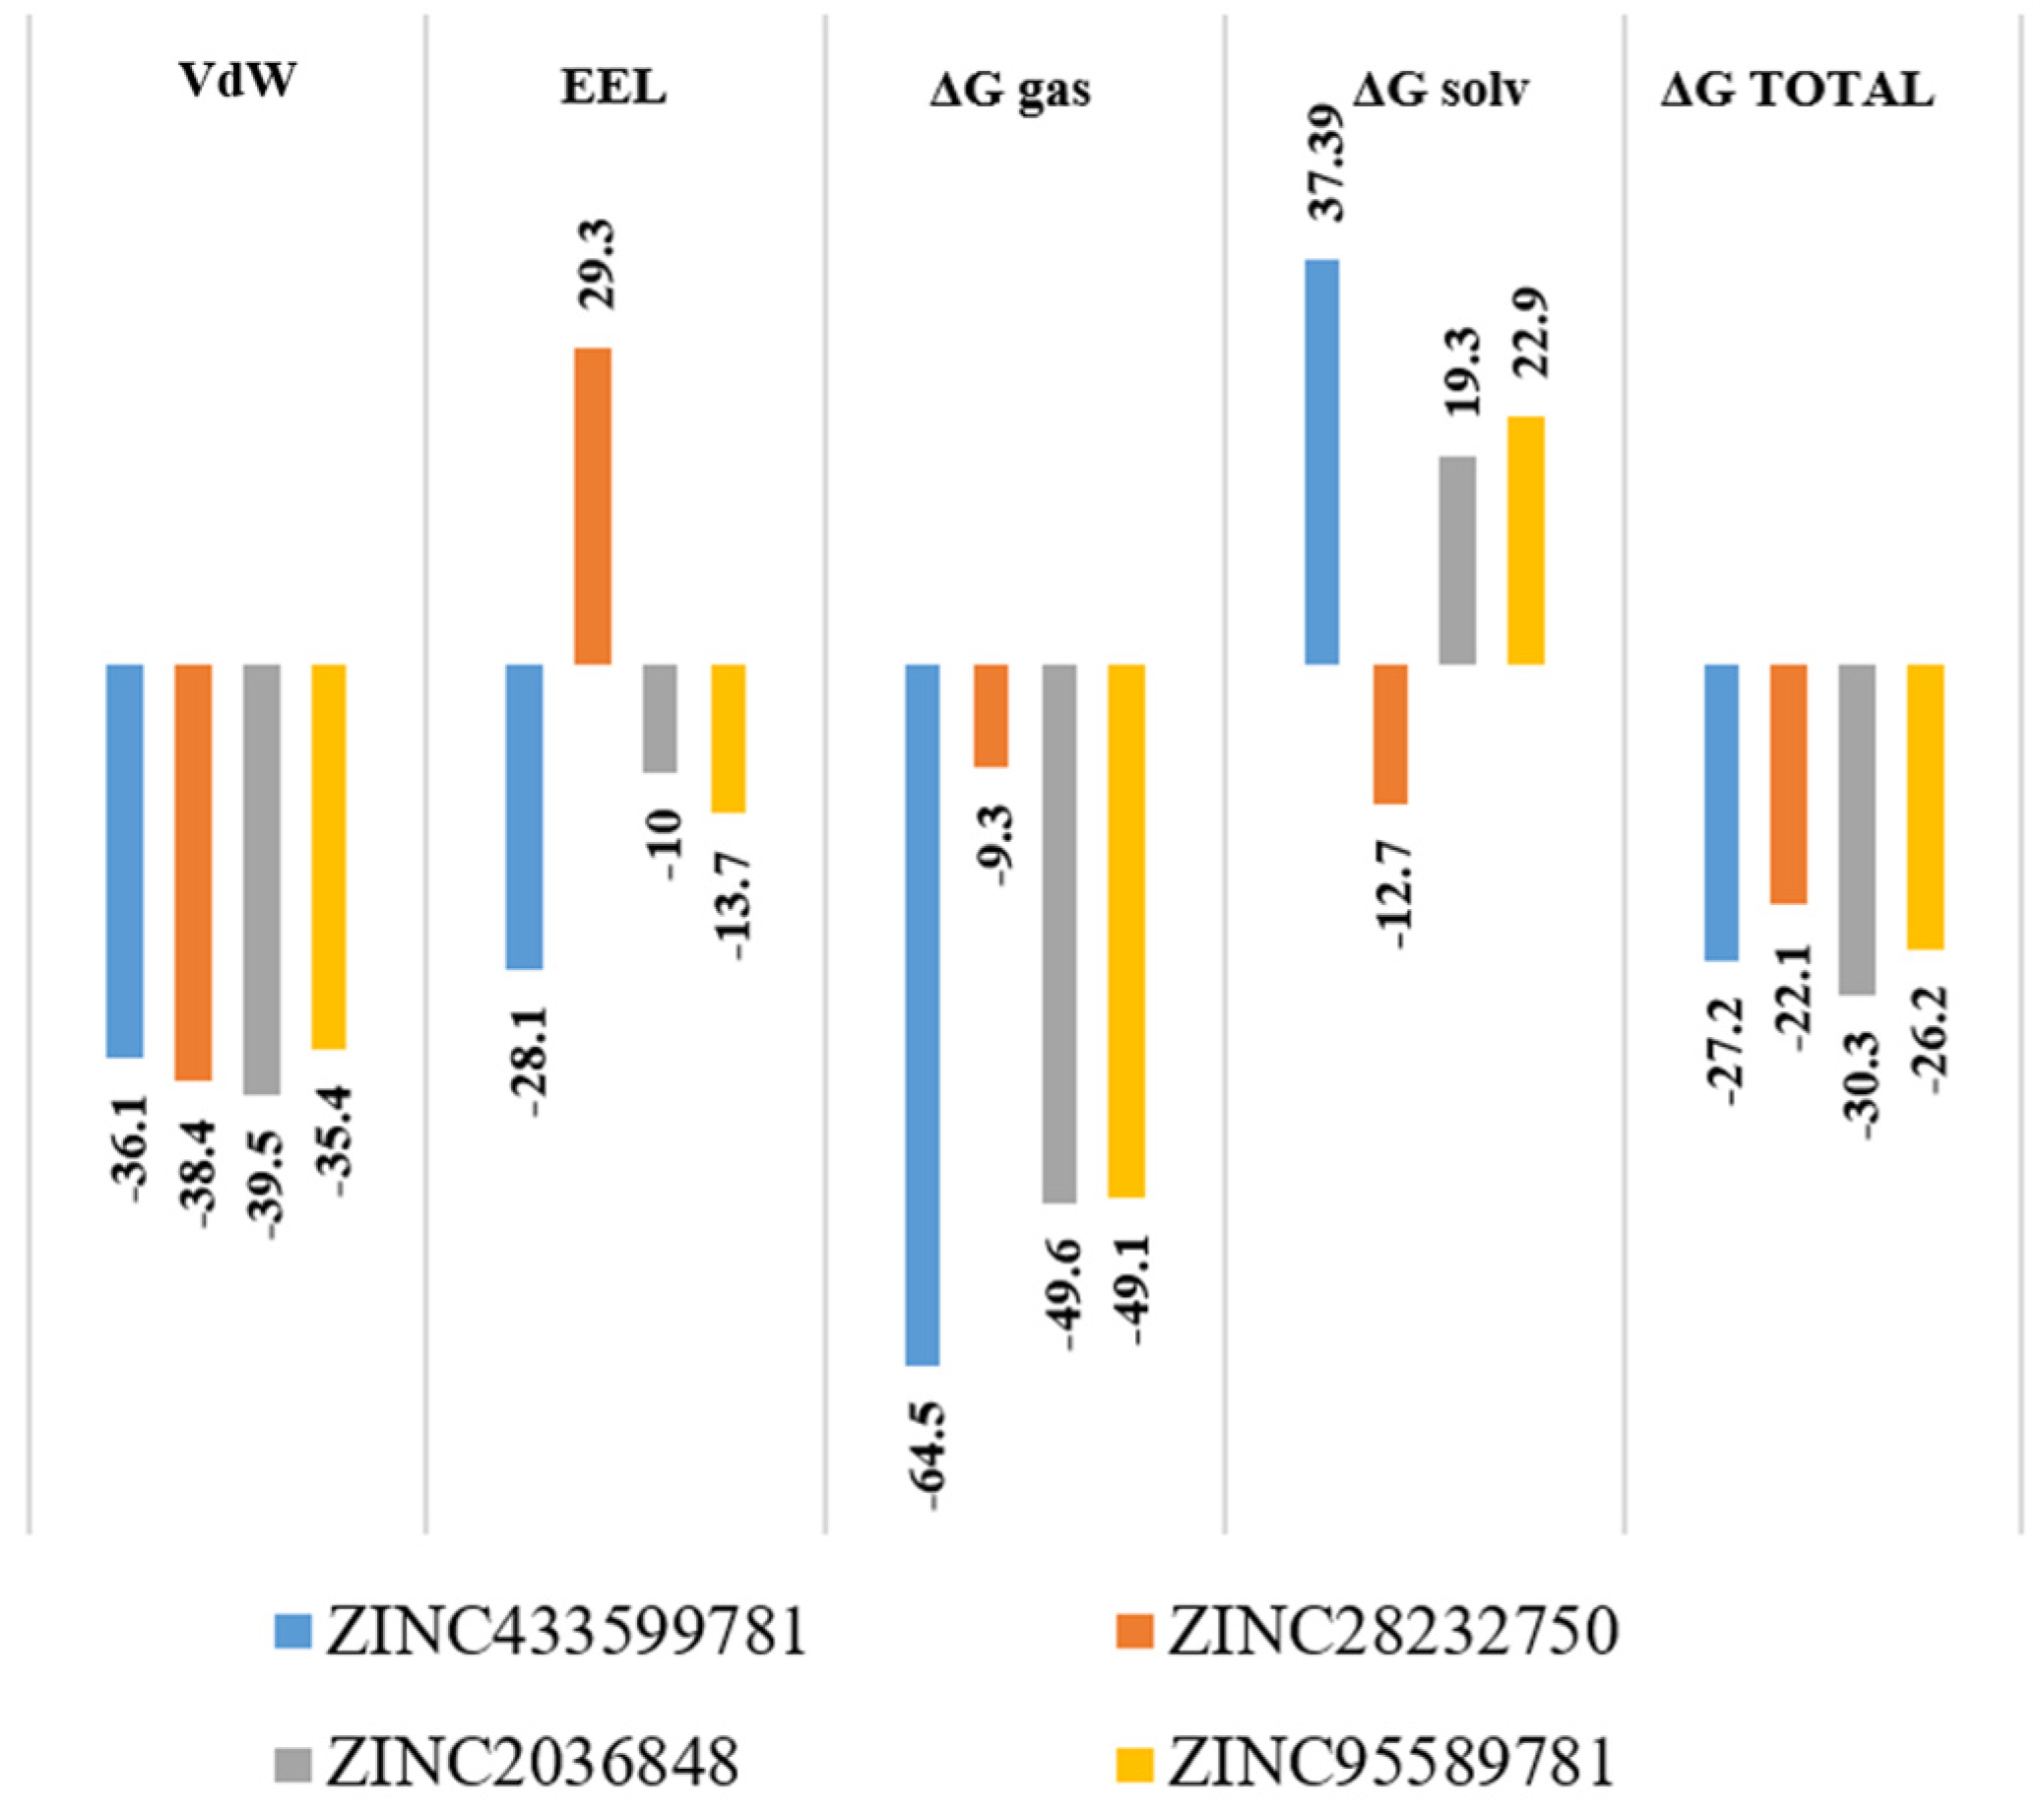
2.7. Molecular Mechanics/Generalized Born Surface Area
2.8. Pharmacokinetics Analysis
3. Materials and Methods
3.1. Protein Preparation
3.2. Pharmacophore-Based Virtual Screening
3.2.1. Dataset Preparation
- Test Set: Actives (IC50 < 500 nM) and inactives (IC50 > 500 nM) of BRD9, and actives of BRD4 (Supplementary Information Figures S1, S2, and S3, respectively).
- Screening dataset: Four subsets; Predicted BRD9, FDA-approved, In-trial, and Epigenetic were downloaded from ZINC database.
- Decoys: The ZINC database was used to extract the decoy dataset, which contains compounds that share the same physical properties as BRD9 actives but differ in topology. The final decoy database was composed of 12, 991 entries.
3.2.2. Pharmacophore Modeling
3.2.3. Statistical Validation
3.2.4. Virtual Screening
3.3. Docking Simulation
3.3.1. Benchmarking of Docking Software
3.3.2. Docking-Based Virtual Screening
3.3.3. Post Docking Assessment
3.4. Molecular Dynamic Simulation
3.5. Molecular Mechanics/Generalized Born Surface Area
3.6. Pharmacokinetic Properties Analysis
4. Conclusions
Supplementary Materials
Author Contributions
Funding
Institutional Review Board Statement
Informed Consent Statement
Data Availability Statement
Acknowledgments
Conflicts of Interest
References
- Albini, S.; Zakharova, V.; Ait-Si-Ali, S. Histone Modifications. Epigenetics and Regeneration; Elsevier: Amsterdam, The Netherlands, 2019; pp. 47–72. [Google Scholar]
- Josling, G.A.; Selvarajah, S.A.; Petter, M.; Duffy, M.F. The role of bromodomain proteins in regulating gene expression. Genes 2012, 3, 320–343. [Google Scholar] [CrossRef] [PubMed] [Green Version]
- Karve, T.M.; Cheema, A.K. Small changes huge impact: The role of protein posttranslational modifications in cellular homeostasis and disease. J. Amino Acids 2011, 2011, 207691. [Google Scholar] [CrossRef] [PubMed] [Green Version]
- Lee, C.Y.; Grant, P.A. Role of Histone Acetylation and Acetyltransferases in Gene Regulation. In Toxicoepigenetics; Elsevier: Amsterdam, The Netherlands, 2019; pp. 3–30. [Google Scholar]
- Filippakopoulos, P.; Knapp, S. The bromodomain interaction module. FEBS Lett. 2012, 586, 2692–2704. [Google Scholar] [CrossRef] [PubMed]
- Sima, X.; He, J.; Peng, J.; Xu, Y.; Zhang, F.; Deng, L. The genetic alteration spectrum of the SWI/SNF complex: The oncogenic roles of BRD9 and ACTL6A. PLoS ONE 2019, 14, e0222305. [Google Scholar]
- Cleary, S.P.; Jeck, W.R.; Zhao, X.; Chen, K.; Selitsky, S.R.; Savich, G.L.; Tan, T.X.; Wu, M.C.; Getz, G.; Lawrence, M.S.; et al. Identification of driver genes in hepatocellular carcinoma by exome sequencing. Hepatology 2013, 58, 1693–1702. [Google Scholar] [CrossRef] [Green Version]
- Yang, C.; Xu, W.; Gong, J.; Liu, Z.; Cui, D. Novel somatic alterations underlie Chinese papillary thyroid carcinoma. Cancer Biomark. 2020, 27, 445–460. [Google Scholar] [CrossRef]
- Ashcroft, F.M.; Rorsman, P. Diabetes mellitus and the beta cell: The last ten years. Cell 2012, 148, 1160–1171. [Google Scholar] [CrossRef] [Green Version]
- Donath, M.Y.; Dalmas, E.; Sauter, N.S.; Boni-Schnetzler, M. Inflammation in obesity and diabetes: Islet dysfunction and therapeutic opportunity. Cell Metab. 2013, 17, 860–872. [Google Scholar] [CrossRef] [Green Version]
- Clark, P.G.; Vieira, L.C.; Tallant, C.; Fedorov, O.; Singleton, D.C.; Rogers, C.M.; Monteiro, O.P.; Bennett, J.M.; Baronio, R.; Müller, S.; et al. LP99: Discovery and Synthesis of the First Selective BRD7/9 Bromodomain Inhibitor. Angew. Chem. 2015, 127, 6315–6319. [Google Scholar] [CrossRef] [Green Version]
- Martin, L.J.; Koegl, M.; Bader, G.; Cockcroft, X.L.; Fedorov, O.; Fiegen, D.; Gerstberger, T.; Hofmann, M.H.; Hohmann, A.F.; Kessler, D.; et al. Structure-Based Design of an in Vivo Active Selective BRD9 Inhibitor. J. Med. Chem. 2016, 59, 4462–4475. [Google Scholar] [CrossRef]
- Theodoulou, N.H.; Bamborough, P.; Bannister, A.J.; Becher, I.; Bit, R.A.; Che, K.H.; Chung, C.W.; Dittmann, A.; Drewes, G.; Drewry, D.H.; et al. Discovery of I-BRD9, a Selective Cell Active Chemical Probe for Bromodomain Containing Protein 9 Inhibition. J. Med. Chem. 2016, 59, 1425–1439. [Google Scholar] [CrossRef] [PubMed]
- Hay, D.A.; Rogers, C.M.; Fedorov, O.; Tallant, C.; Martin, S.; Monteiro, O.P.; Müller, S.; Knapp, S.; Schofield, C.J.; Brennan, P.E. Design and synthesis of potent and selective inhibitors of BRD7 and BRD9 bromodomains. MedChemComm 2015, 6, 1381–1386. [Google Scholar] [CrossRef] [Green Version]
- Korb, E.; Herre, M.; Zucker-Scharff, I.; Darnell, R.B.; Allis, C.D. BET protein Brd4 activates transcription in neurons and BET inhibitor Jq1 blocks memory in mice. Nat. Neurosci. 2015, 18, 1464–1473. [Google Scholar] [CrossRef] [PubMed]
- Filippakopoulos, P.; Knapp, S. Targeting bromodomains: Epigenetic readers of lysine acetylation. Nat. Rev. Drug Discov. 2014, 13, 337–356. [Google Scholar] [CrossRef]
- Pettersen, E.F.; Goddard, T.D.; Huang, C.C.; Couch, G.S.; Greenblatt, D.M.; Meng, E.C.; Ferrin, T.E. UCSF Chimera—A visualization system for exploratory research and analysis. J. Comput. Chem. 2004, 25, 1605–1612. [Google Scholar] [CrossRef] [Green Version]
- Romero, F.A.; Taylor, A.M.; Crawford, T.D.; Tsui, V.; Cote, A.; Magnuson, S. Disrupting Acetyl-Lysine Recognition: Progress in the Development of Bromodomain Inhibitors. J. Med. Chem. 2016, 59, 1271–1298. [Google Scholar] [CrossRef]
- Flynn, E.M.; Huang, O.W.; Poy, F.; Oppikofer, M.; Bellon, S.F.; Tang, Y.; Cochran, A.G. A Subset of Human Bromodomains Recognizes Butyryllysine and Crotonyllysine Histone Peptide Modifications. Structure 2015, 23, 1801–1814. [Google Scholar] [CrossRef] [Green Version]
- Moustakim, M.; Clark, P.G.K.; Hay, D.A.; Dixon, D.J.; Brennan, P.E. Chemical probes and inhibitors of bromodomains outside the BET family. Medchemcomm 2016, 7, 2246–2264. [Google Scholar] [CrossRef] [Green Version]
- Karim, R.M.; Chan, A.; Zhu, J.Y.; Schonbrunn, E. Structural Basis of Inhibitor Selectivity in the BRD7/9 Subfamily of Bromodomains. J. Med. Chem. 2020, 63, 3227–3237. [Google Scholar] [CrossRef]
- Labute, P. Molecular Operating Environment; Chemical Computing Group. Inc.: Montreal, QC, Canada, 2008. [Google Scholar]
- Cereto-Massagué, A.; Ojeda, M.J.; Valls, C.; Mulero, M.; Garcia-Vallvé, S.; Pujadas, G. Molecular fingerprint similarity search in virtual screening. Methods 2015, 71, 58–63. [Google Scholar] [CrossRef]
- Uesawa, Y.; Sakagami, H.; Ikezoe, N.; Takao, K.; Kagaya, H.; Sugita, Y. Quantitative structure–cytotoxicity relationship of aurones. J. Anticancer Res. 2017, 37, 6169–6176. [Google Scholar]
- Wang, Y.; Yang, S.H.; Zhong, K.; Jiang, T.; Zhang, M.; Kwan, H.Y.; Su, T. Network pharmacology-based strategy for the investigation of the anti-obesity effects of an ethanolic extract of Zanthoxylum bungeanum Maxim. Front. Pharmacol. 2020, 11, 1645. [Google Scholar] [CrossRef] [PubMed]
- Halgren, T.A. Merck molecular force field. I. Basis, form, scope, parameterization, and performance of MMFF94. J. Comput. Chem. 1996, 17, 490–519. [Google Scholar] [CrossRef]
- Thangapandian, S.; John, S.; Lee, Y.; Kim, S.; Lee, K.W. Dynamic structure-based pharmacophore model development: A new and effective addition in the histone deacetylase 8 (HDAC8) inhibitor discovery. Int. J. Mol. Sci. 2011, 12, 9440–9462. [Google Scholar] [CrossRef]
- Bisht, N.; Singh, B. Role of computer aided drug design in drug development and drug discovery. Int. J. Pharm. Sci. Res. 2018, 9, 1405–1415. [Google Scholar]
- Naz, S.; Farooq, U.; Khan, S.; Sarwar, R.; Mabkhot, Y.N.; Saeed, M.; Alsayari, A.; Muhsinah, A.B.; Ul-Haq, Z. Pharmacophore model-based virtual screening, docking, biological evaluation and molecular dynamics simulations for inhibitors discovery against alpha-tryptophan synthase from Mycobacterium tuberculosis. J. Biomol. Struct. Dyn. 2021, 39, 610–620. [Google Scholar] [CrossRef]
- Pascual, R.; Almansa, C.; Plata-Salaman, C.; Vela, J.M. A New Pharmacophore Model for the Design of Sigma-1 Ligands Validated on a Large Experimental Dataset. Front. Pharmacol. 2019, 10, 519. [Google Scholar] [CrossRef]
- Fawcett, T. An introduction to ROC analysis. Pattern Recognit. Lett. 2006, 27, 861–874. [Google Scholar] [CrossRef]
- Corbeil, C.R.; Williams, C.I.; Labute, P. Variability in docking success rates due to dataset preparation. J. Comput. Aided Mol. Des. 2012, 26, 775–786. [Google Scholar] [CrossRef] [Green Version]
- Hevener, K.E.; Zhao, W.; Ball, D.M.; Babaoglu, K.; Qi, J.; White, S.W.; Lee, R.E. Validation of molecular docking programs for virtual screening against dihydropteroate synthase. J. Chem. Inf. Model. 2009, 49, 444–460. [Google Scholar] [CrossRef]
- Clark, P.G.; Dixon, D.J.; Brennan, P.E. Development of chemical probes for the bromodomains of BRD7 and BRD9. Drug Discov. Today Technol. 2016, 19, 73–80. [Google Scholar] [CrossRef] [PubMed]
- Lee, T.S.; Cerutti, D.S.; Mermelstein, D.; Lin, C.; LeGrand, S.; Giese, T.J.; Roitberg, A.; Case, D.A.; Walker, R.C.; York, D.M. GPU-Accelerated Molecular Dynamics and Free Energy Methods in Amber18: Performance Enhancements and New Features. J. Chem. Inf. Model. 2018, 58, 2043–2050. [Google Scholar] [CrossRef]
- Case, D.; Darden, T.; Cheatham, T.; Simmerling, C.; Wang, J.; Duke, R.; Luo, R.; Merz, K.; Pearlman, D.; Crowley, M.; et al. Amber 9; University of California: San Francisco, CA, USA, 2006. [Google Scholar]
- Maier, J.A.; Martinez, C.; Kasavajhala, K.; Wickstrom, L.; Hauser, K.E.; Simmerling, C. ff14SB: Improving the Accuracy of Protein Side Chain and Backbone Parameters from ff99SB. J. Chem. Theory Comput. 2015, 11, 3696–3713. [Google Scholar] [CrossRef] [PubMed]
- Wang, J.; Wolf, R.M.; Caldwell, J.W.; Kollman, P.A.; Case, D.A. Development and testing of a general amber force field. J. Comput. Chem. 2004, 25, 1157–1174. [Google Scholar] [CrossRef]
- Jorgensen, W.L.; Chandrasekhar, J.; Madura, J.D.; Impey, R.W.; Klein, M.L. Comparison of simple potential functions for simulating liquid water. J. Chem. Phys. 1983, 79, 926–935. [Google Scholar] [CrossRef]
- Fletcher, R.; Powell, M.J.D. A Rapidly Convergent Descent Method for Minimization. Comput. J. 1963, 6, 163–168. [Google Scholar] [CrossRef] [Green Version]
- Song, L.F.; Lee, T.S.; Zhu, C.; York, D.M.; Merz, K.M., Jr. Using AMBER18 for Relative Free Energy Calculations. J. Chem. Inf. Model. 2019, 59, 3128–3135. [Google Scholar] [CrossRef]
- Darden, T.; York, D.; Pedersen, L. Particle mesh Ewald: AnN·log(N) method for Ewald sums in large systems. J. Chem. Phys. 1993, 98, 10089–10092. [Google Scholar] [CrossRef] [Green Version]
- Ryckaert, J.-P.; Ciccotti, G.; Berendsen, H.J.C. Numerical integration of the cartesian equations of motion of a system with constraints: Molecular dynamics of n-alkanes. J. Comput. Phys. 1977, 23, 327–341. [Google Scholar]
- Roe, D.R.; Cheatham, T.E., 3rd. PTRAJ and CPPTRAJ: Software for Processing and Analysis of Molecular Dynamics Trajectory Data. J. Chem. Theory Comput. 2013, 9, 3084–3095. [Google Scholar] [CrossRef]
- Humphrey, W.; Dalke, A.; Schulten, K. VMD: Visual molecular dynamics. J. Mol. Graph. 1996, 14, 27–28, 33–38. [Google Scholar] [CrossRef]
- Niinivehmas, S.P.; Virtanen, S.I.; Lehtonen, J.V.; Postila, P.A.; Pentikainen, O.T. Comparison of virtual high-throughput screening methods for the identification of phosphodiesterase-5 inhibitors. J. Chem. Inf. Model. 2011, 51, 1353–1363. [Google Scholar] [CrossRef] [PubMed]
- Rastelli, G.; Del Rio, A.; Degliesposti, G.; Sgobba, M. Fast and accurate predictions of binding free energies using MM-PBSA and MM-GBSA. J. Comput. Chem. 2010, 31, 797–810. [Google Scholar] [CrossRef] [PubMed]
- Daina, A.; Michielin, O.; Zoete, V. SwissADME: A free web tool to evaluate pharmacokinetics, drug-likeness and medicinal chemistry friendliness of small molecules. Sci. Rep. 2017, 7, 42717. [Google Scholar] [CrossRef]


| Dataset | No. of Compounds | Hit Rate |
|---|---|---|
| Actives | 17 | 13 (76.4) |
| Inactives | 8 | 1 (12.5) |
| BRD4 Inhibitors | 25 | 0 (0.0) |
| Decoys | 12,991 | 154 (1.8) |
| Database | Total Compounds | Lead Compounds |
|---|---|---|
| Predicted-BRD9 Compounds | 25,532 | 596 |
| FDA approved Drugs | 1466 | 11 |
| In-Trials Compounds | 6799 | 101 |
| Epigenetic Compounds | 471 | 6 |
| S.no | Name | Score | Structure |
|---|---|---|---|
| 1 | ZINC433599781 | −7.3 |  |
| 2 | ZINC28232750 (Valstar) | −7.5 |  |
| 3 | ZINC2036848 (Riboflavin) | −7.1 |  |
| 4 | ZINC95589781 | −6.8 |  |
| Compound ID | ZINC433599781 | ZINC28232750 | ZINC2036848 | ZINC95589781 |
|---|---|---|---|---|
| MW (g/mol) | 423.4 | 723.6 | 376.6 | 375.4 |
| LogP0/w | 2.25 | 3.68 | 1.63 | 2.46 |
| Log (ESOL) | Soluble | Moderately Soluble | Very soluble | Soluble |
| GI absorption | Low | Low | Low | High |
| Bioavailability | 0.55 | 0.17 | 0.55 | 0.55 |
| BBB | No | No | No | No |
| H-bond acceptor | 7 | 16 | 8 | 4 |
| H-bond donor | 2 | 5 | 5 | 2 |
| Lipinski’s Rule of Five | Yes | Yes | Yes | Yes |
| PDB ID | Resolution | Cognate Ligand | IC50 (nM) |
|---|---|---|---|
| 4UIW | 1.7 Å | I-BRD9 | 50 |
| 5IGN | 1.7 Å | LP99 | 325 |
| 5EU1 | 1.6 Å | BI-7273 | 19 |
| 5E9V | 1.8 Å | Indolizine com28 | 68 |
Publisher’s Note: MDPI stays neutral with regard to jurisdictional claims in published maps and institutional affiliations. |
© 2022 by the authors. Licensee MDPI, Basel, Switzerland. This article is an open access article distributed under the terms and conditions of the Creative Commons Attribution (CC BY) license (https://creativecommons.org/licenses/by/4.0/).
Share and Cite
Ali, M.M.; Ashraf, S.; Nure-e-Alam, M.; Qureshi, U.; Khan, K.M.; Ul-Haq, Z. Identification of Selective BRD9 Inhibitor via Integrated Computational Approach. Int. J. Mol. Sci. 2022, 23, 13513. https://doi.org/10.3390/ijms232113513
Ali MM, Ashraf S, Nure-e-Alam M, Qureshi U, Khan KM, Ul-Haq Z. Identification of Selective BRD9 Inhibitor via Integrated Computational Approach. International Journal of Molecular Sciences. 2022; 23(21):13513. https://doi.org/10.3390/ijms232113513
Chicago/Turabian StyleAli, Maria Mushtaq, Sajda Ashraf, Mohammad Nure-e-Alam, Urooj Qureshi, Khalid Mohammed Khan, and Zaheer Ul-Haq. 2022. "Identification of Selective BRD9 Inhibitor via Integrated Computational Approach" International Journal of Molecular Sciences 23, no. 21: 13513. https://doi.org/10.3390/ijms232113513