
Brain Effects of SC-Nanophytosomes on a Rotenone-Induced Rat Model of Parkinson’s Disease—A Proof of Concept for a Mitochondria-Targeted Therapy

 , , and
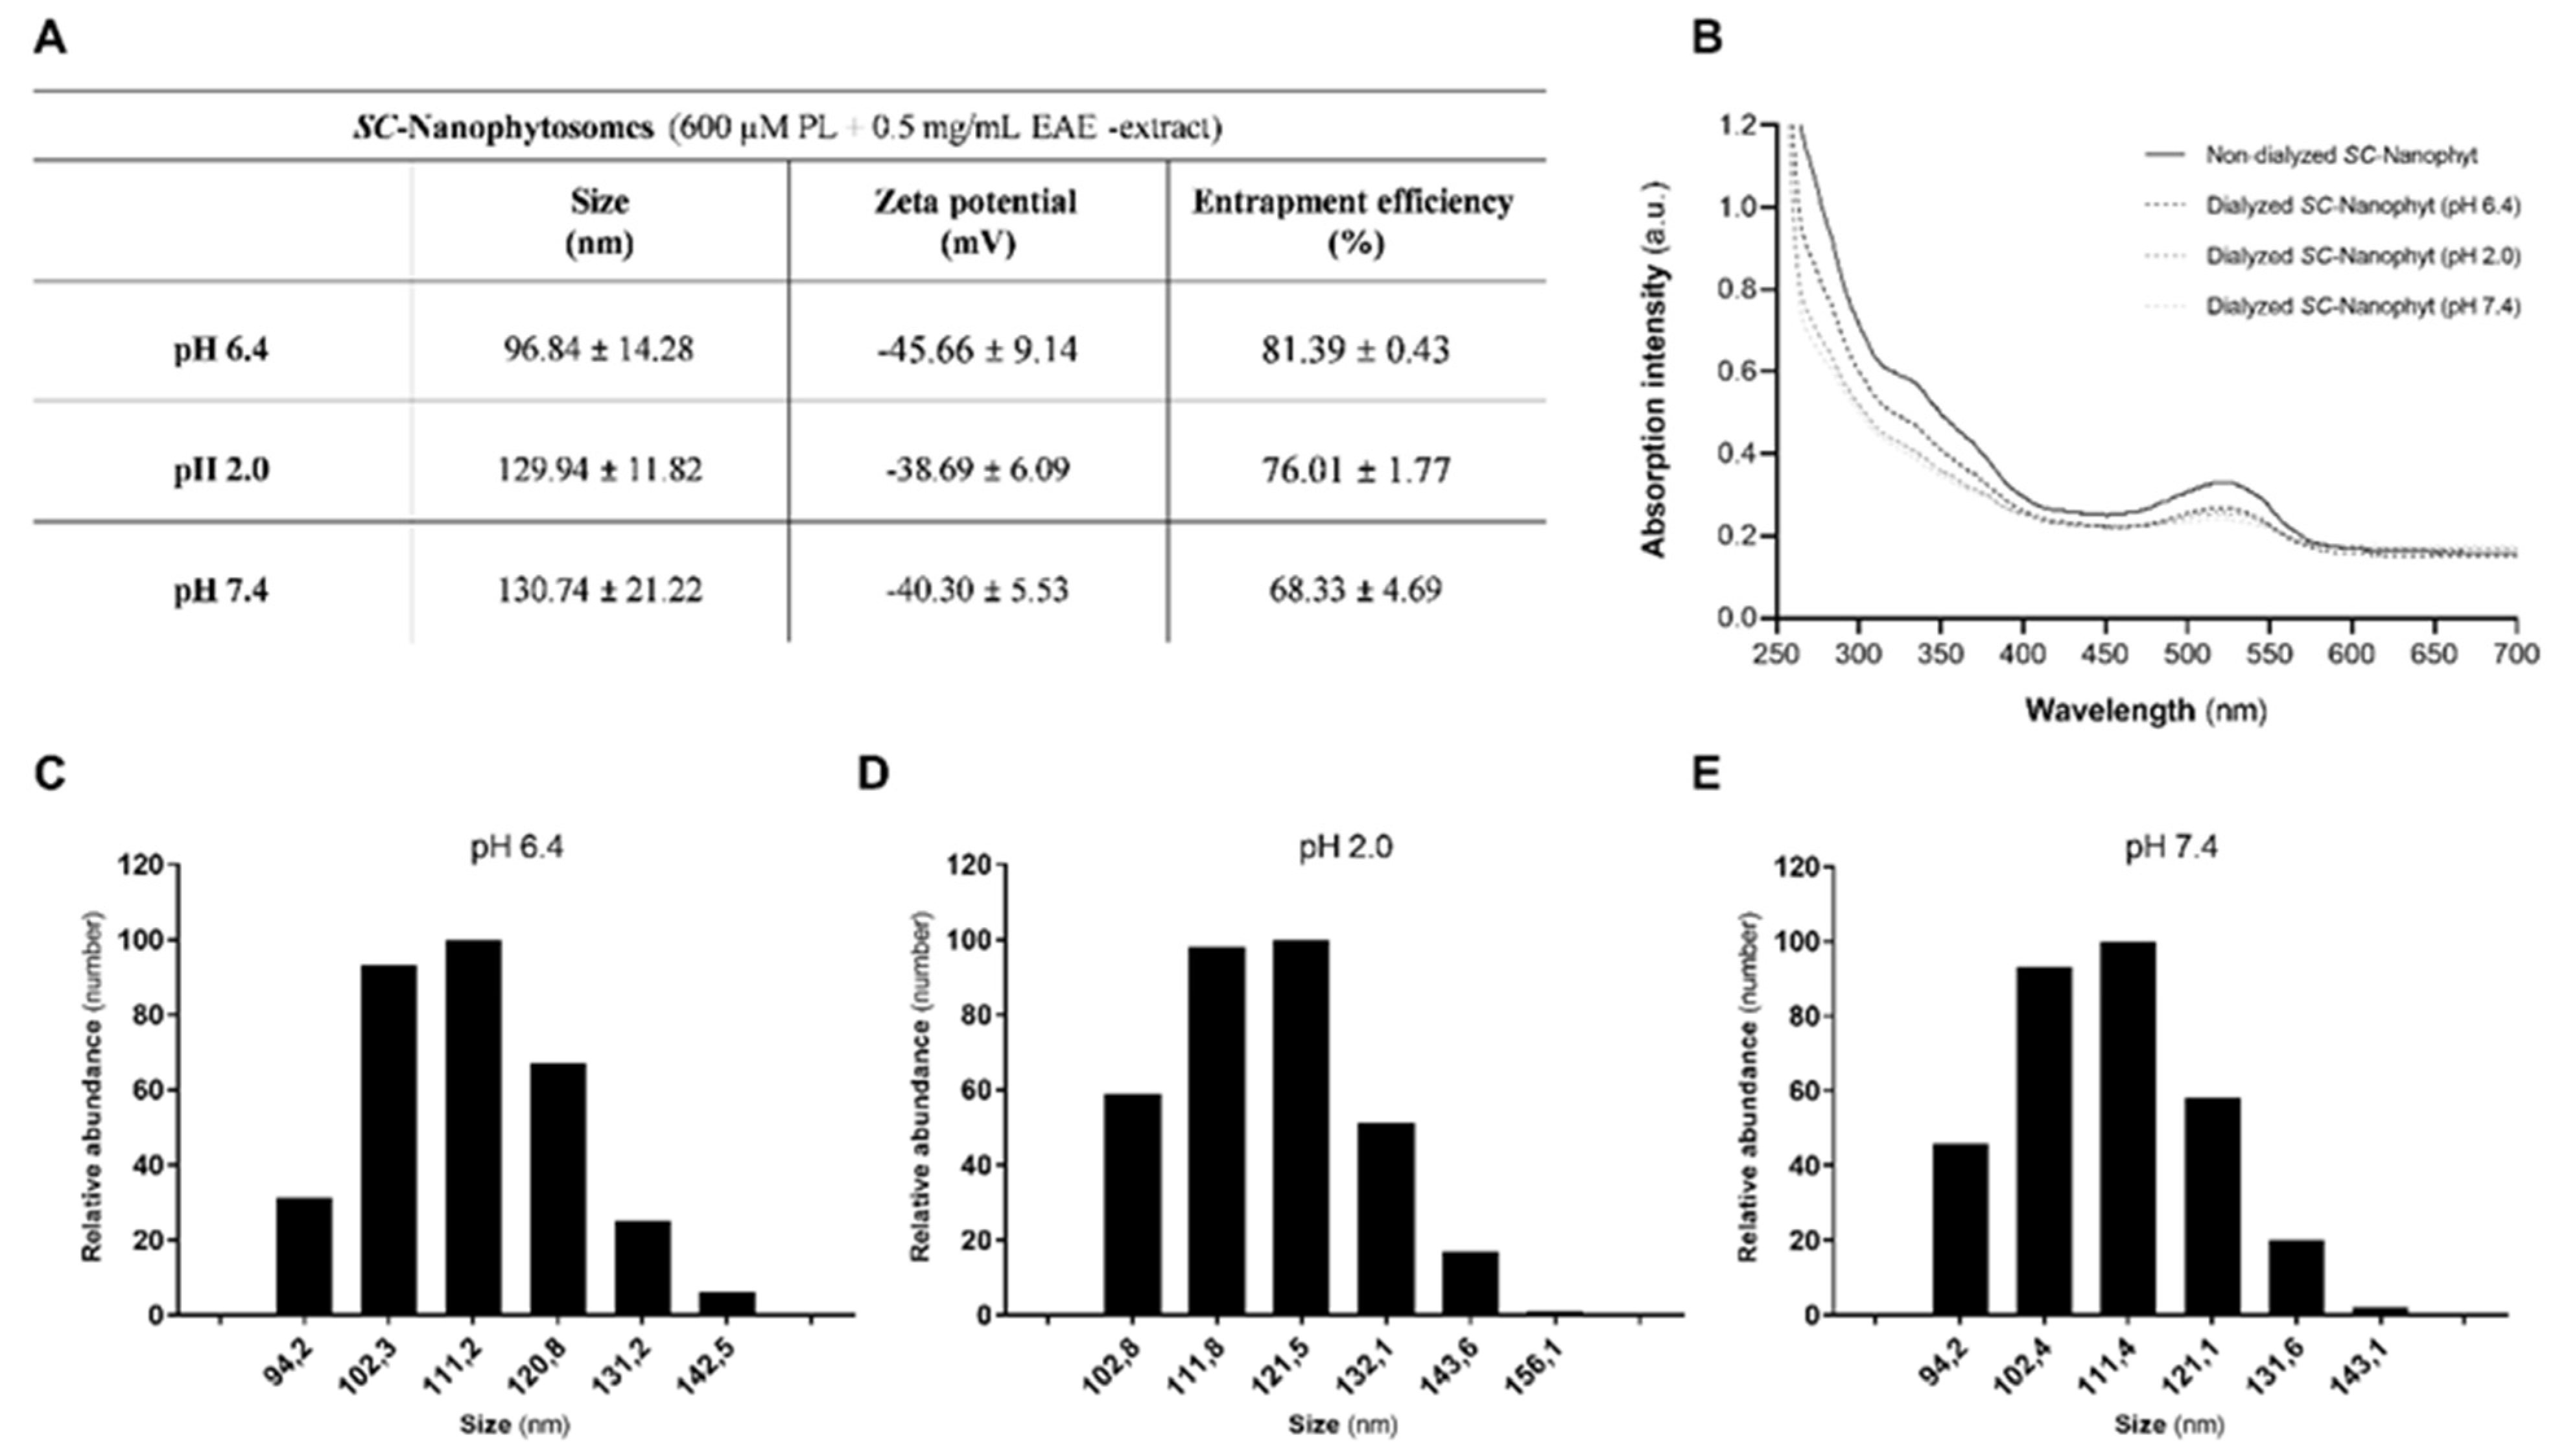
Abstract
:1. Introduction
2. Results and Discussion
2.1. SC-Nanophytosomes Formulation Stability under pH Changes That Mimic the Gastrointestinal Tract Environments
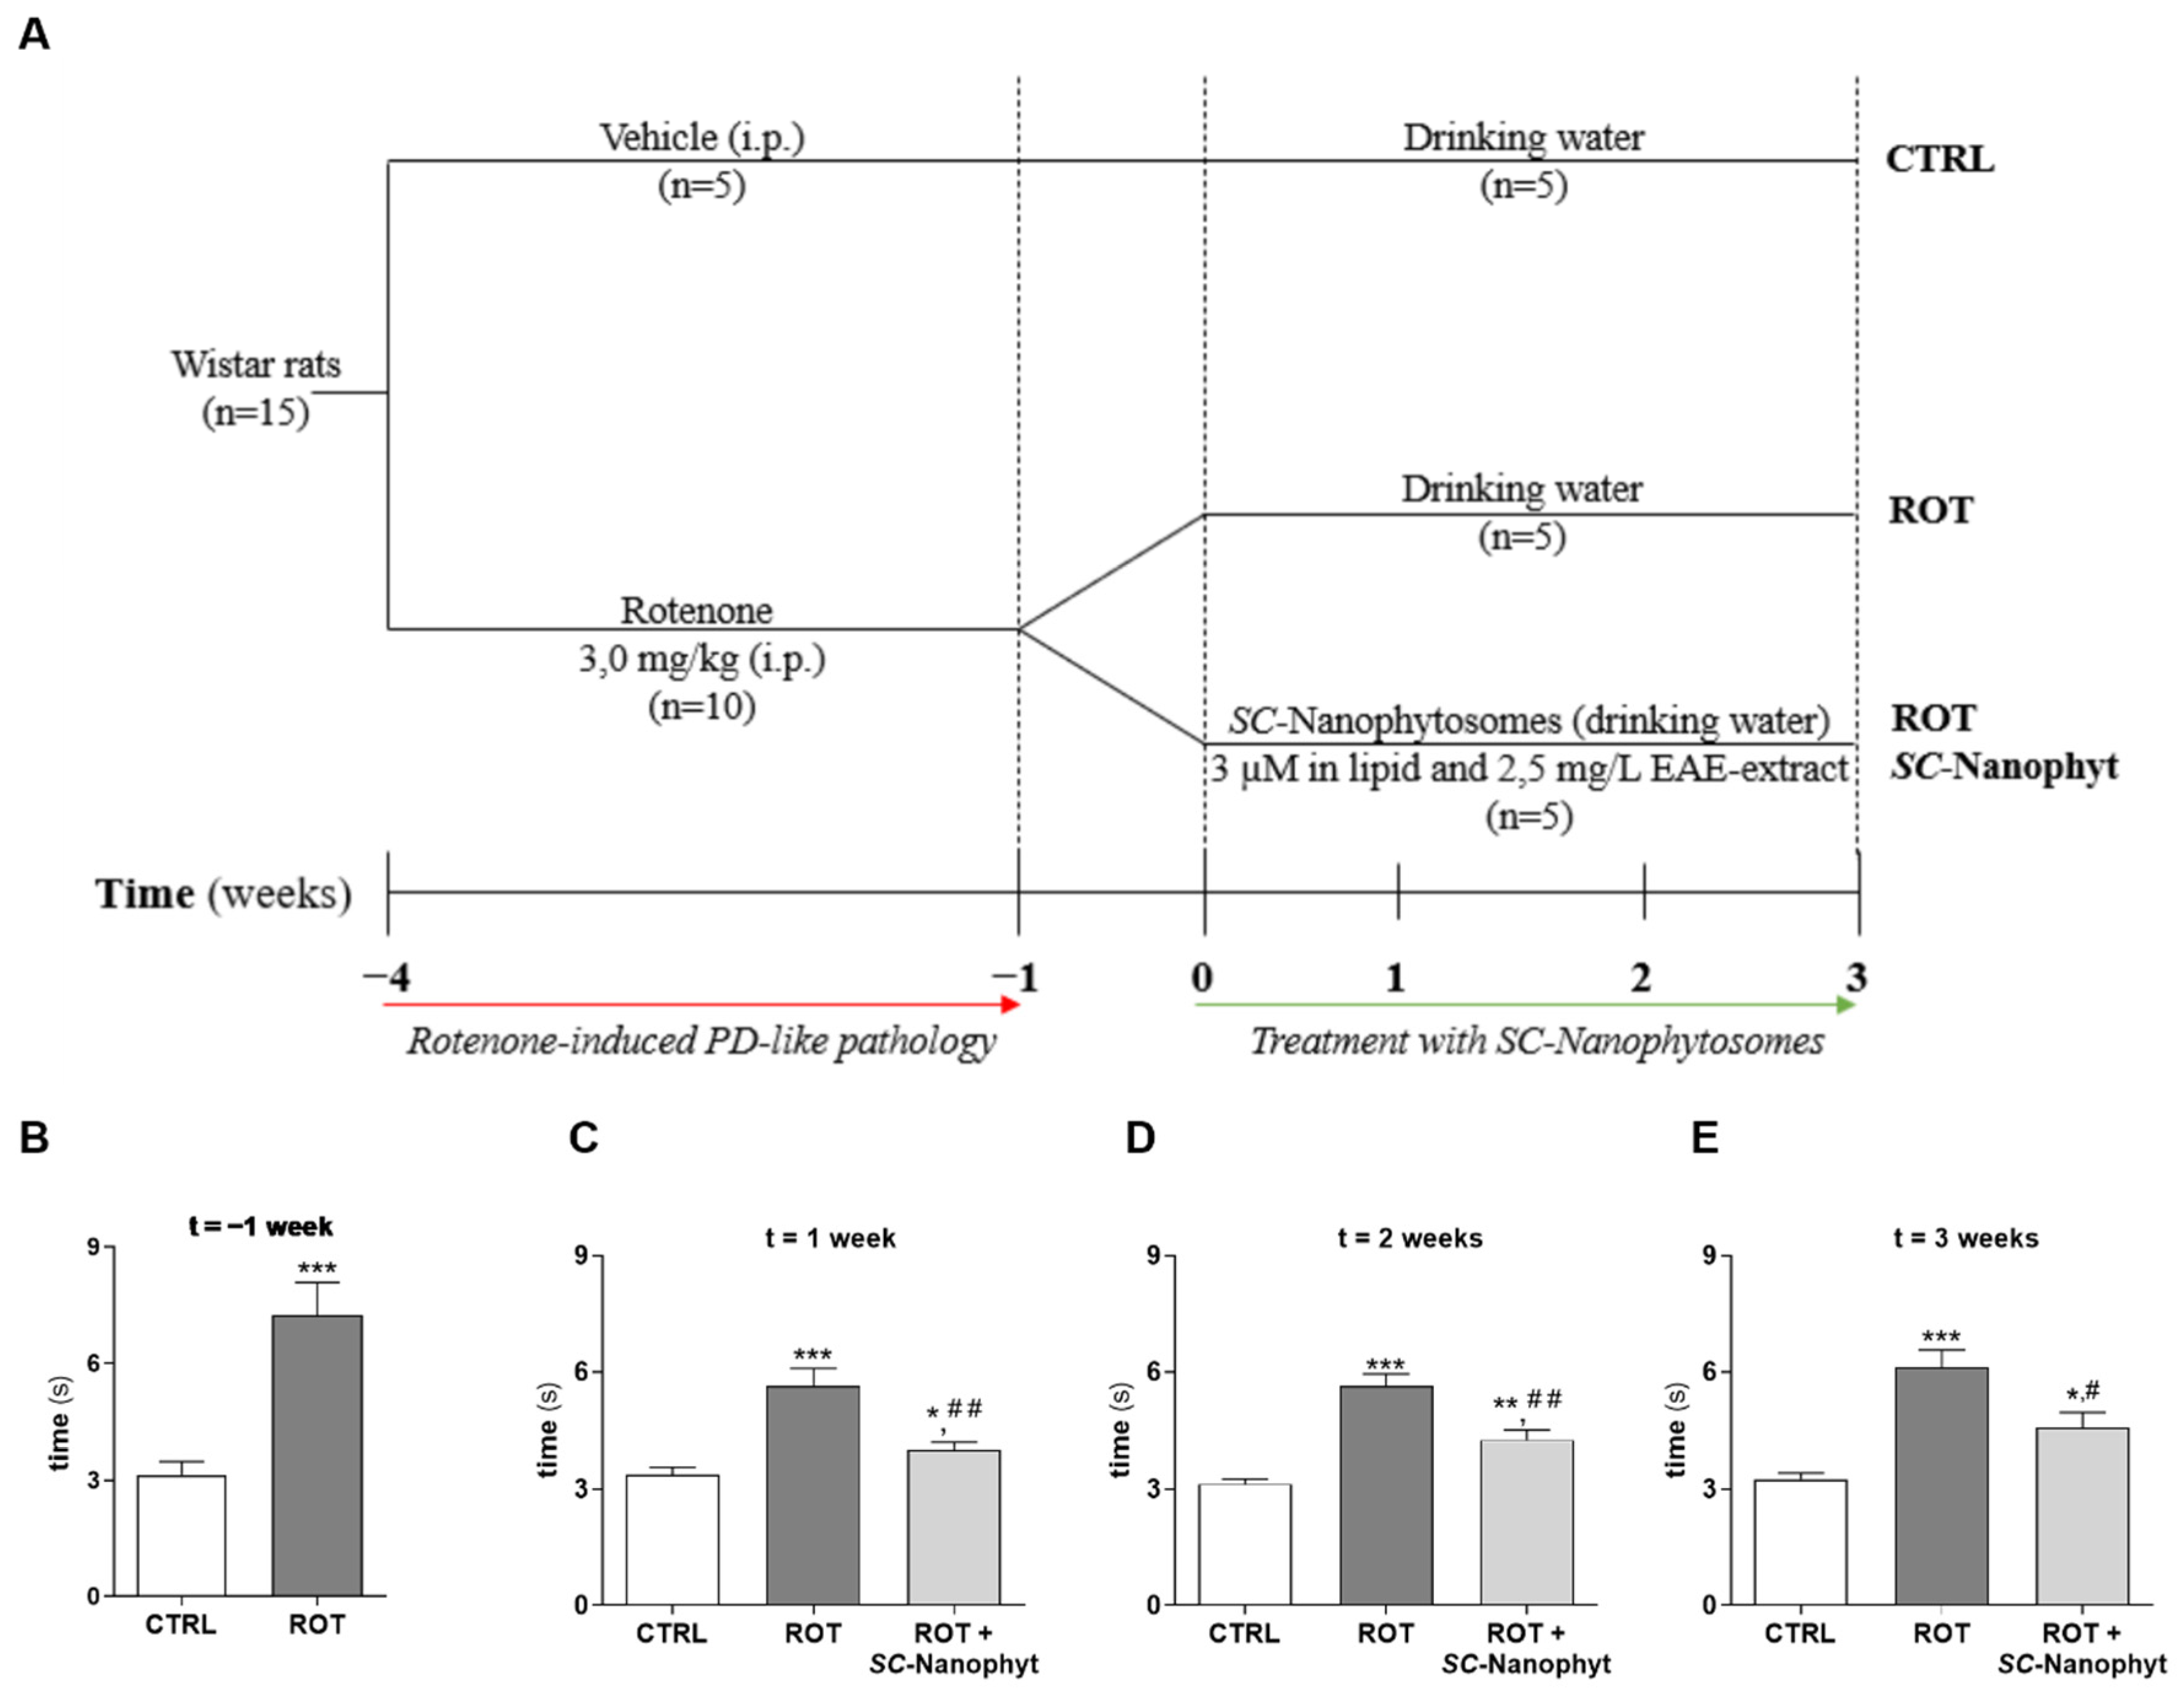
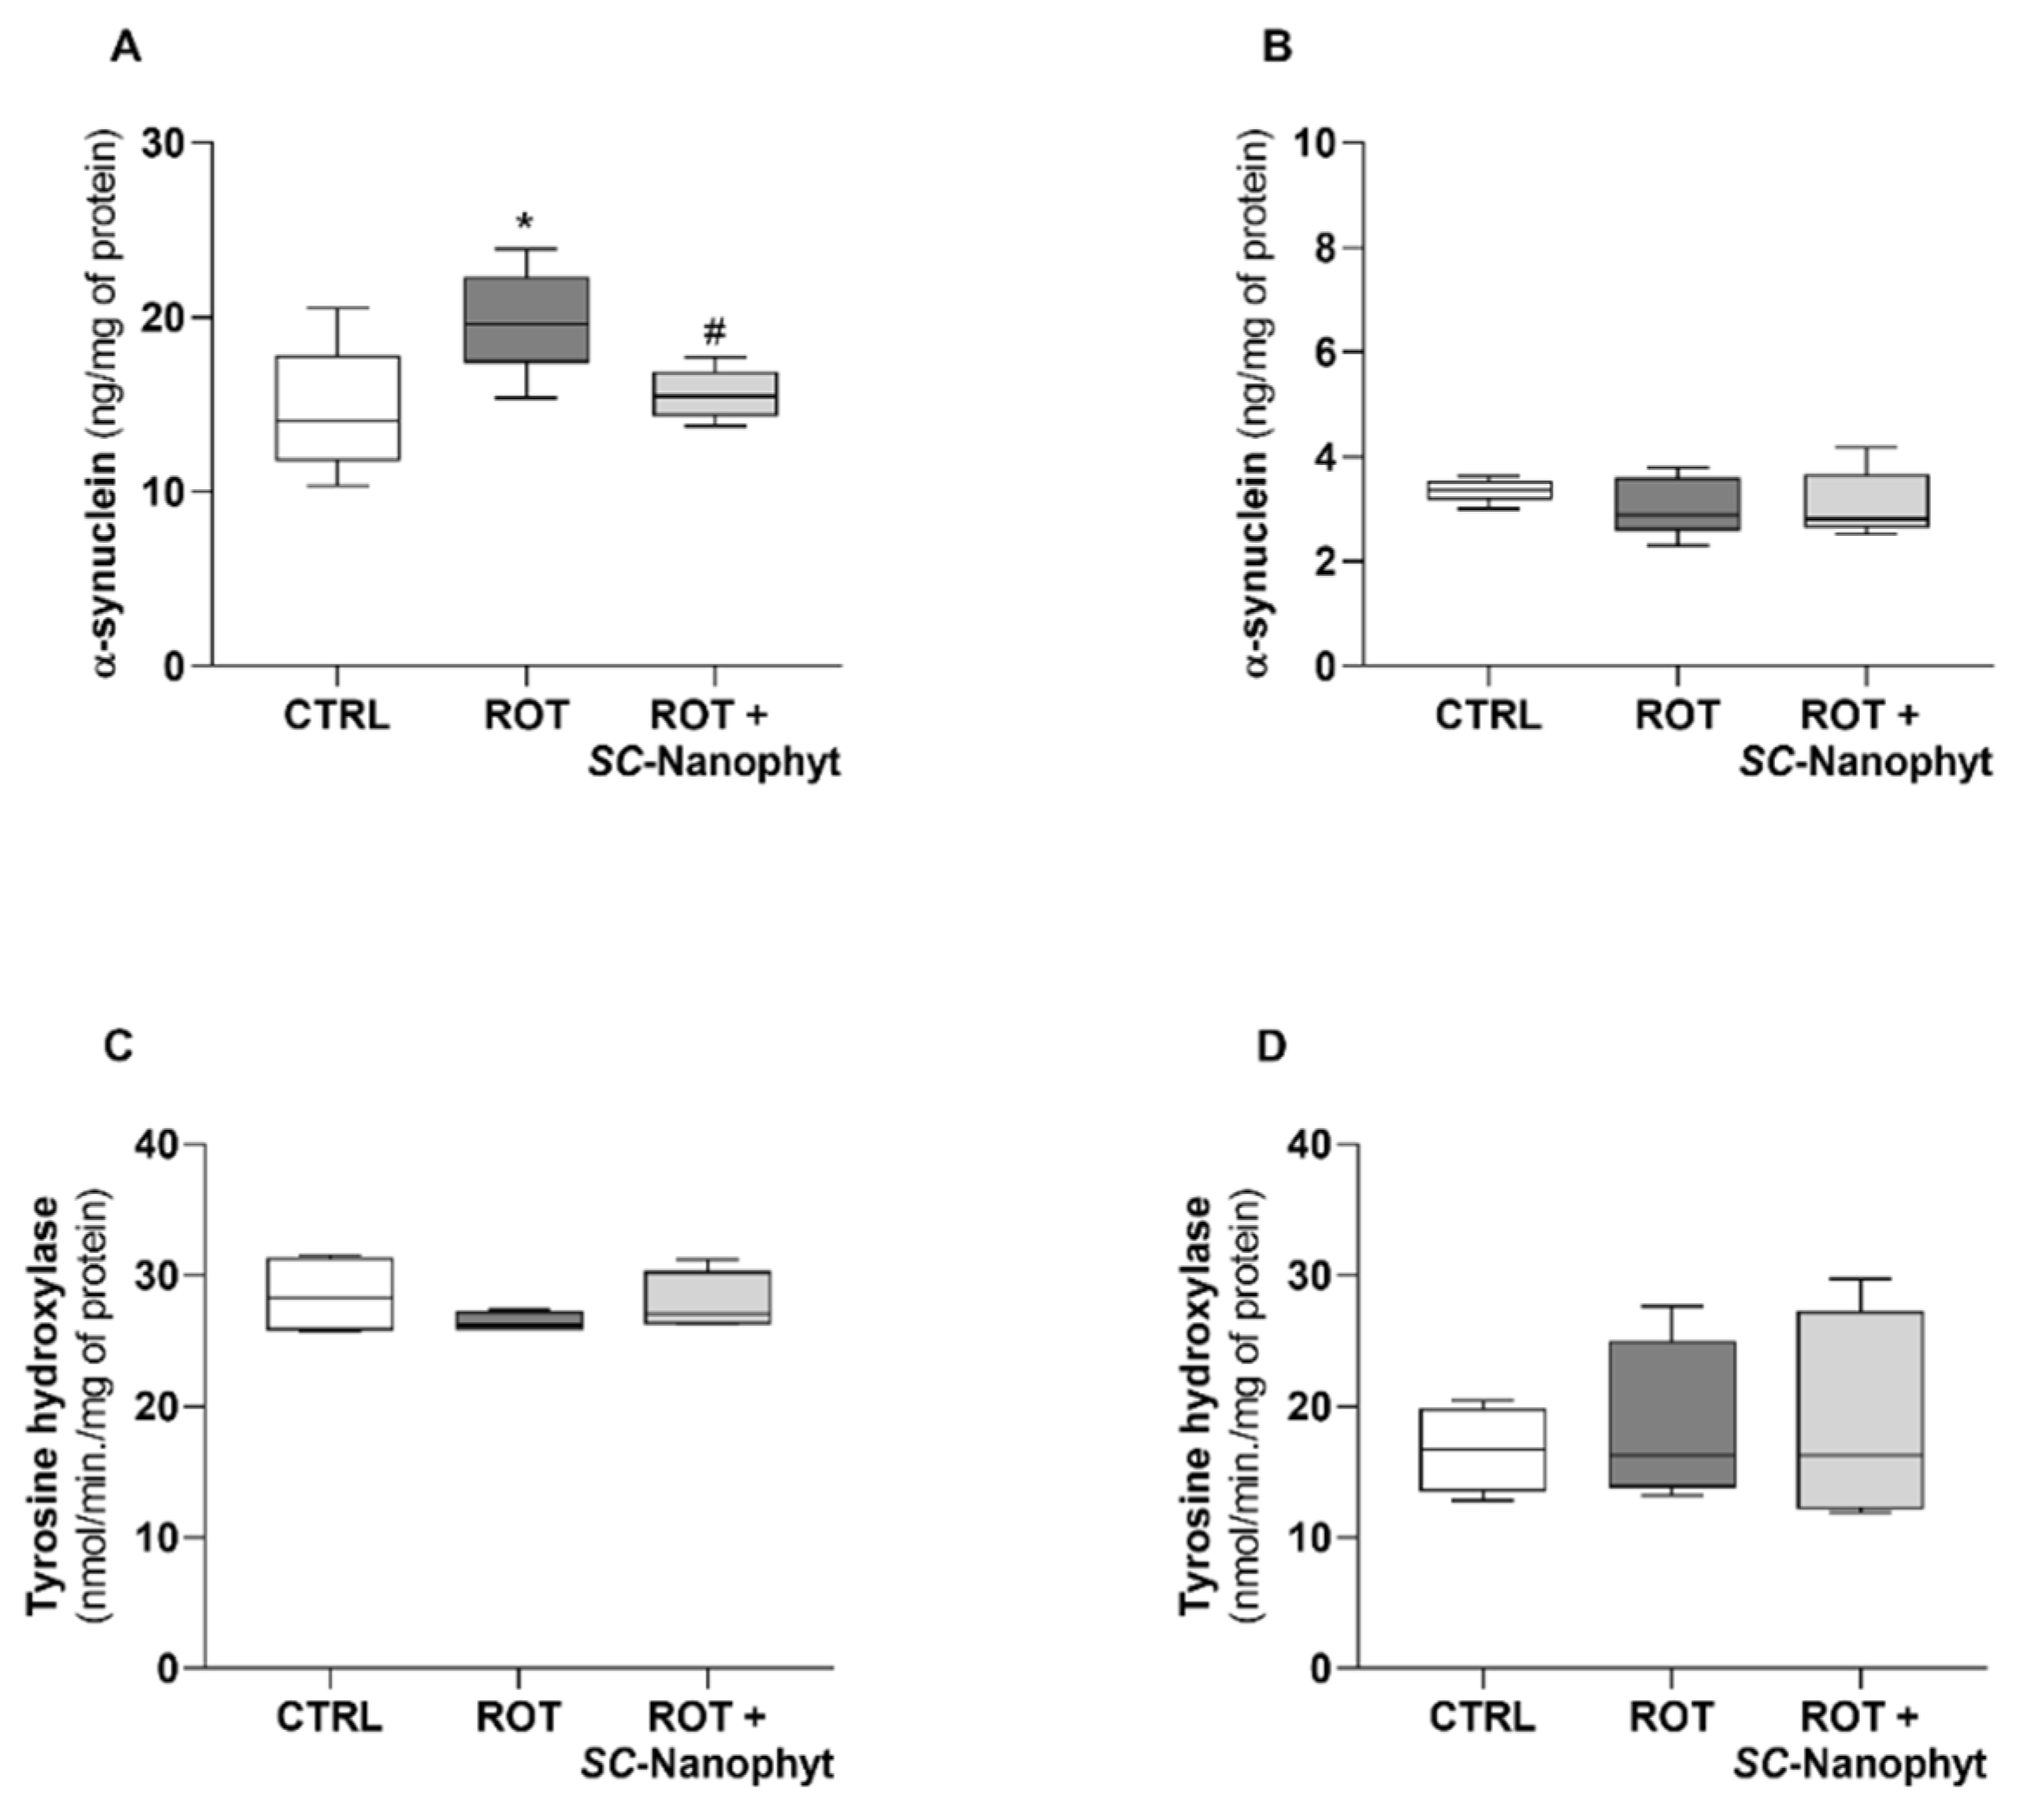
2.2. Effects of SC-Nanophytosomes on Rotenone-Induced Parkinson’s Disease Animal Model—Behavior Benefits and α-Synuclein Outcomes
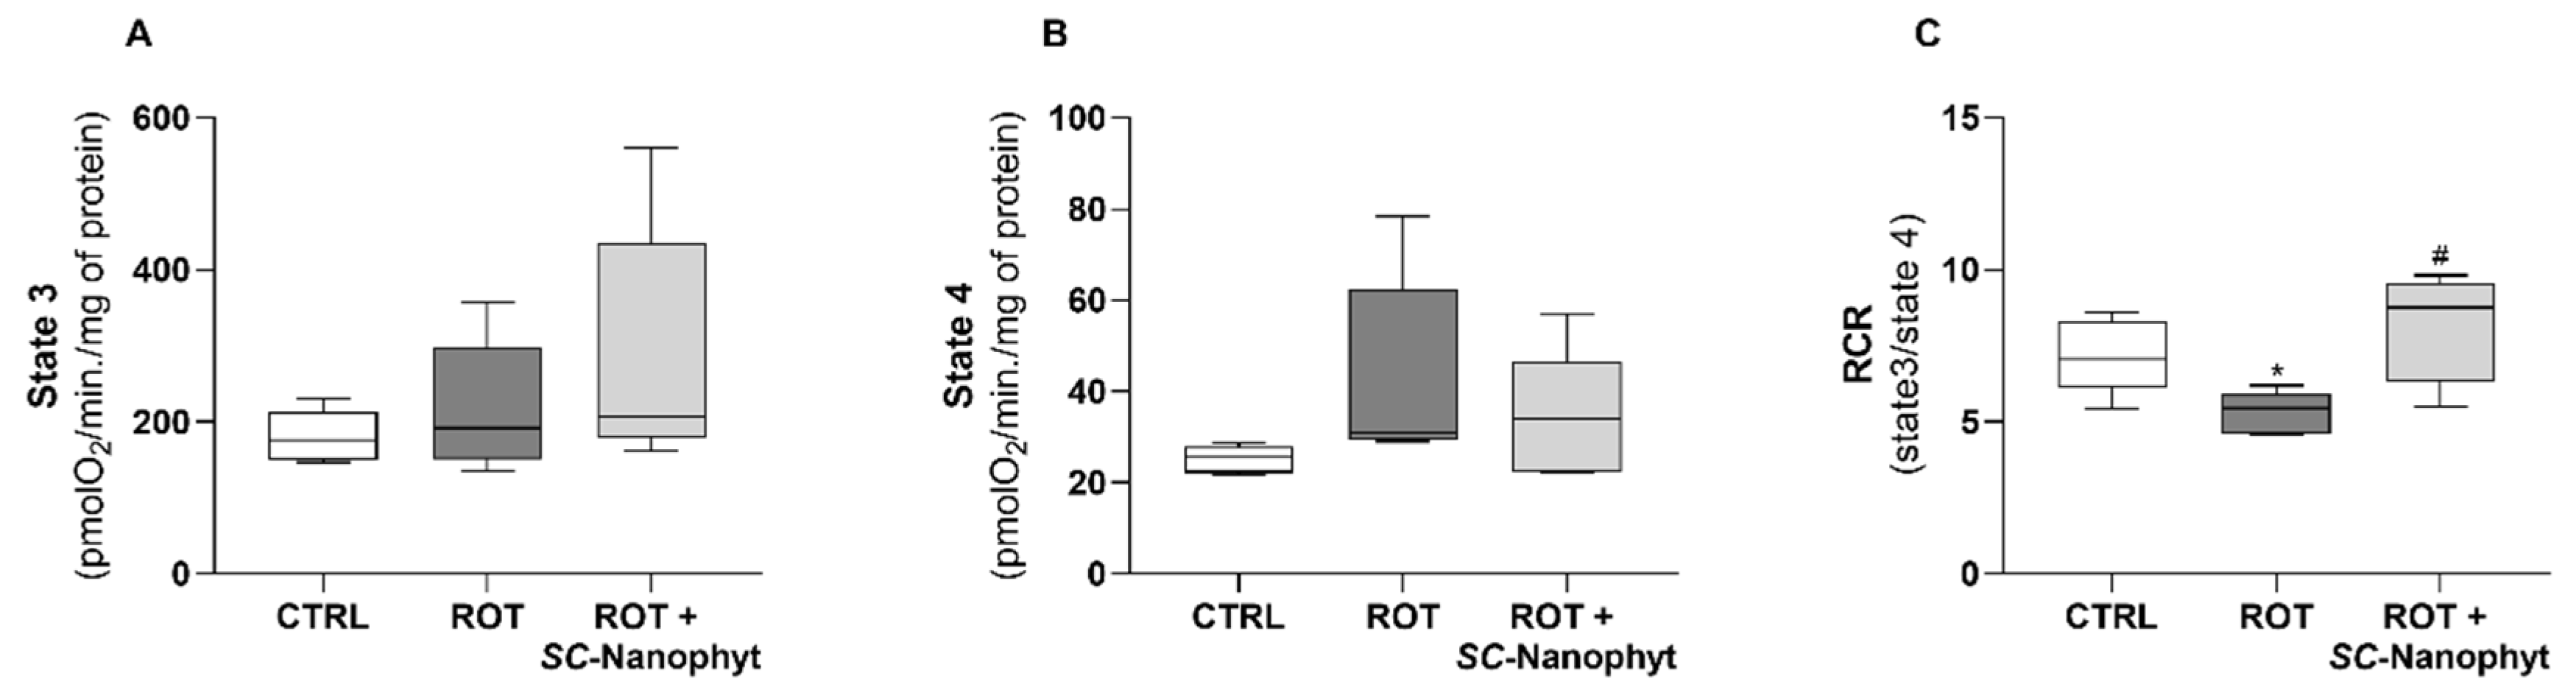
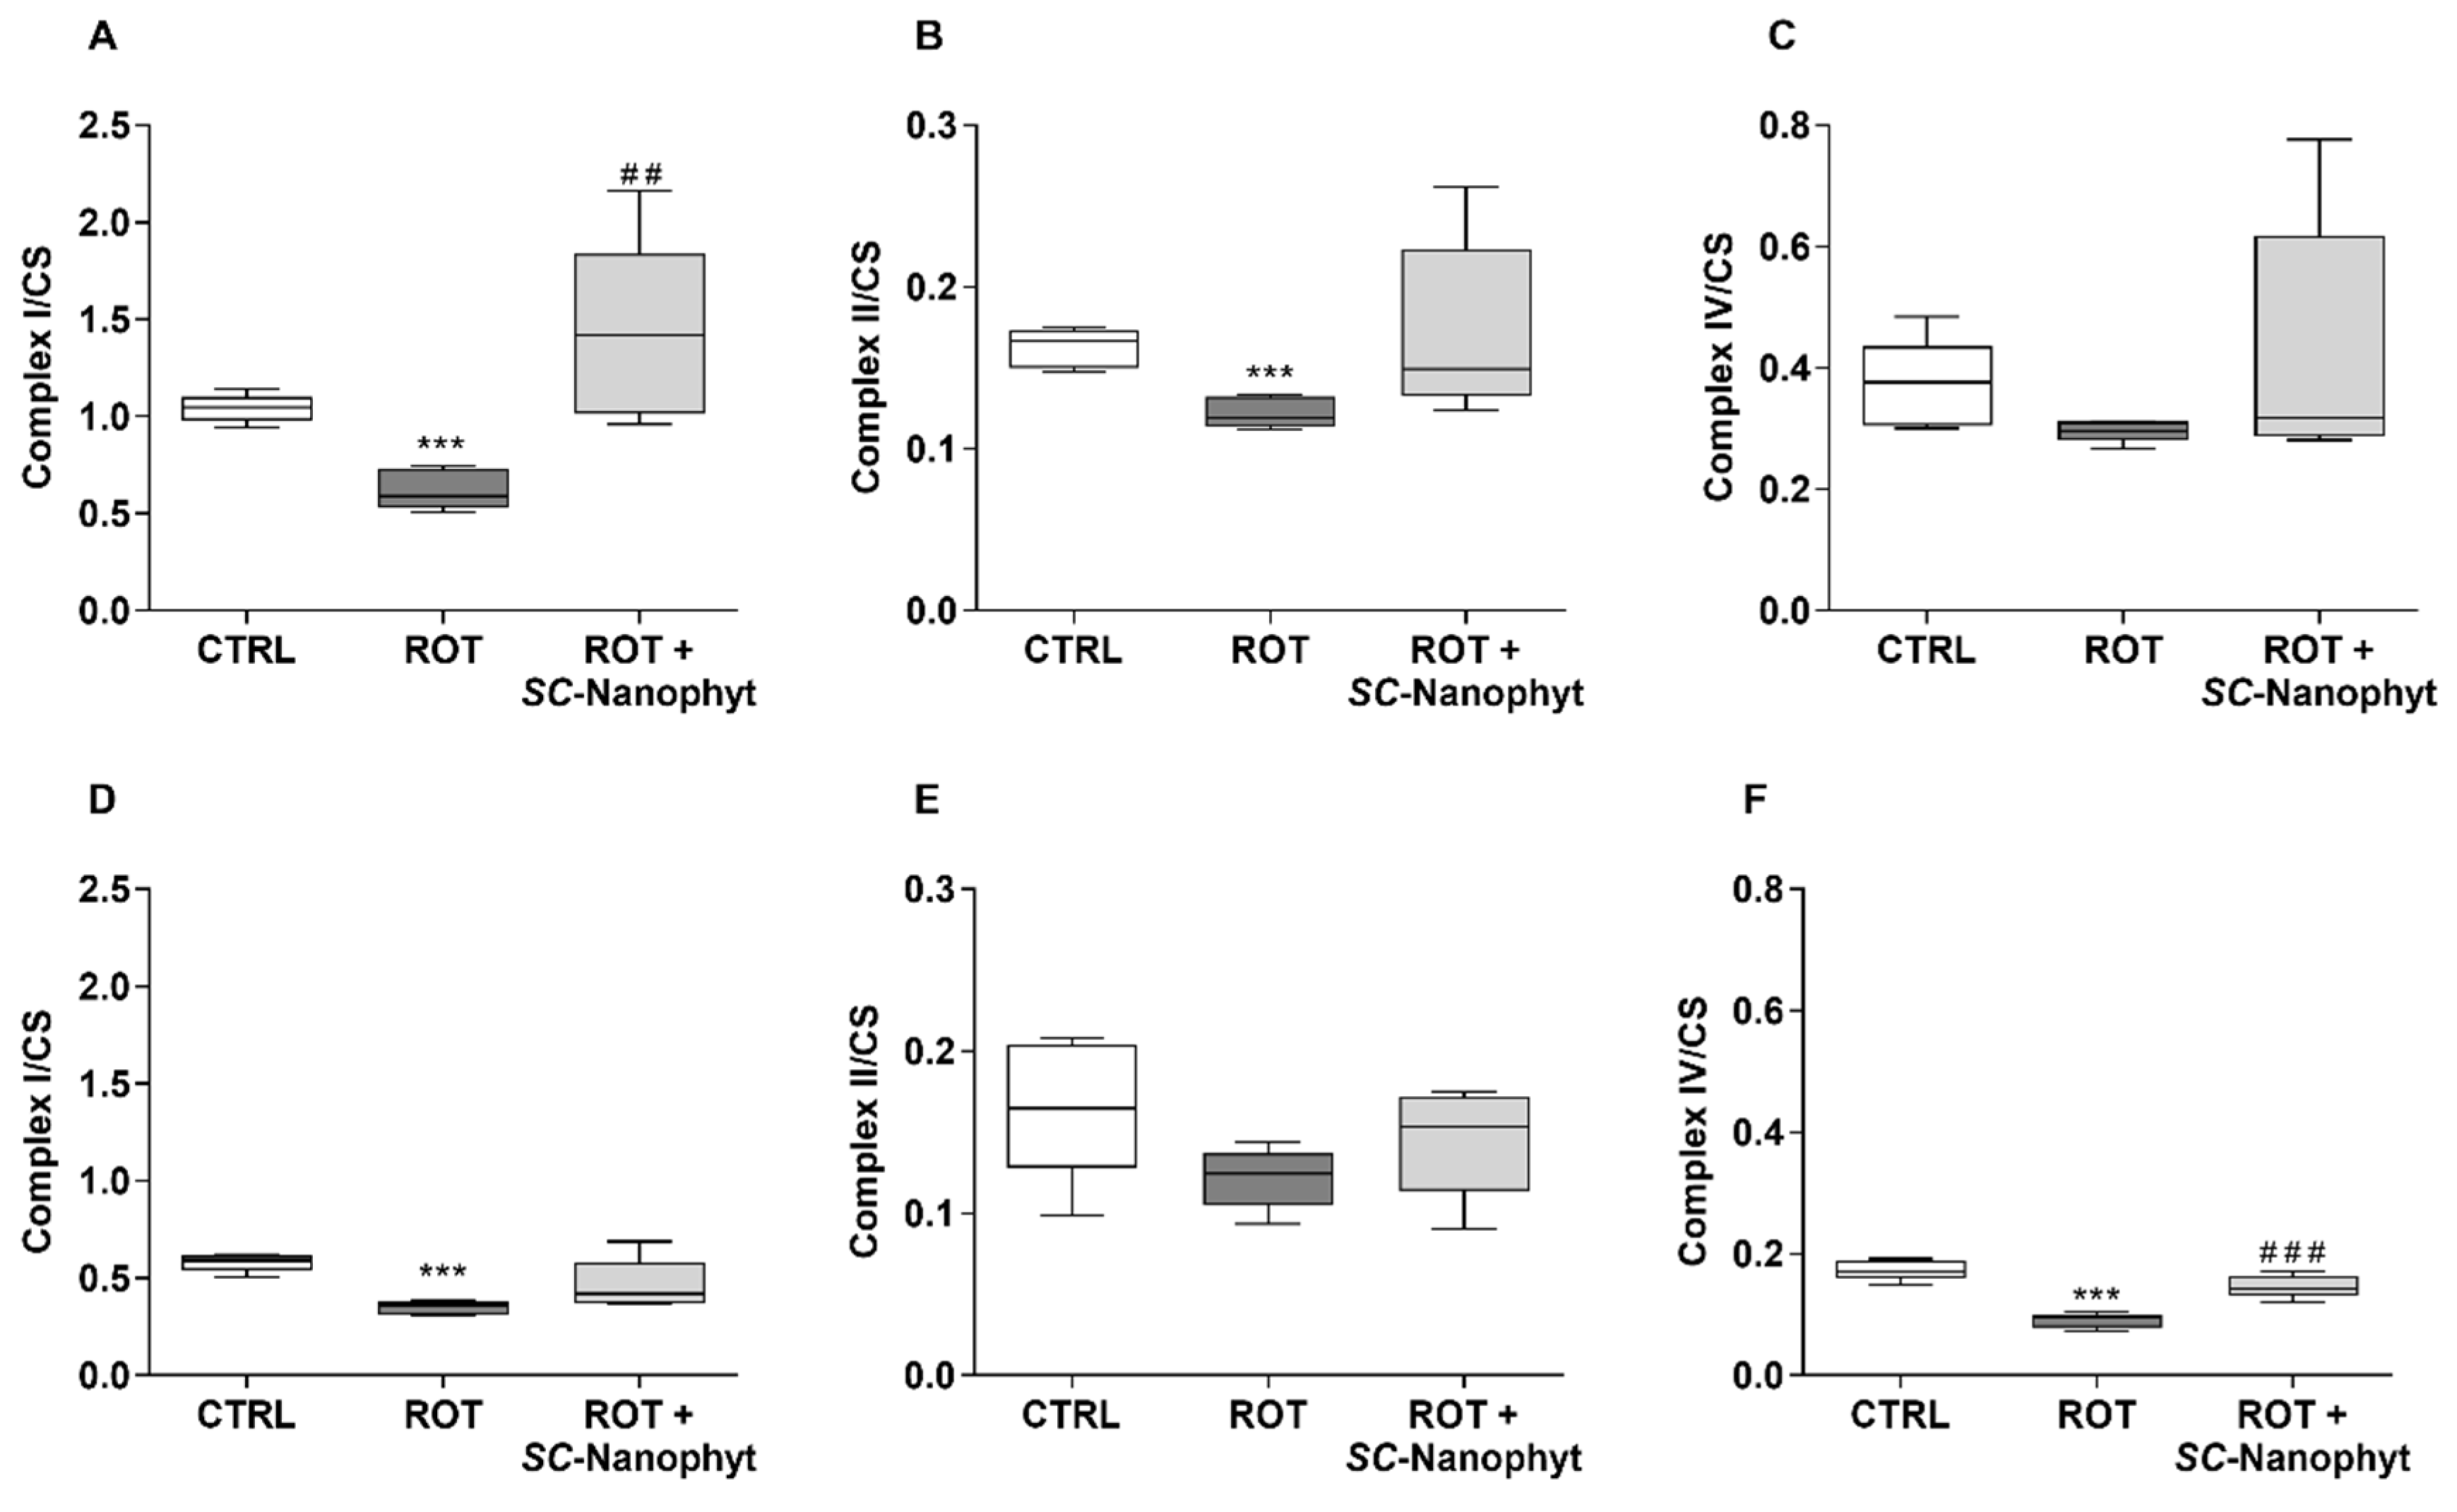
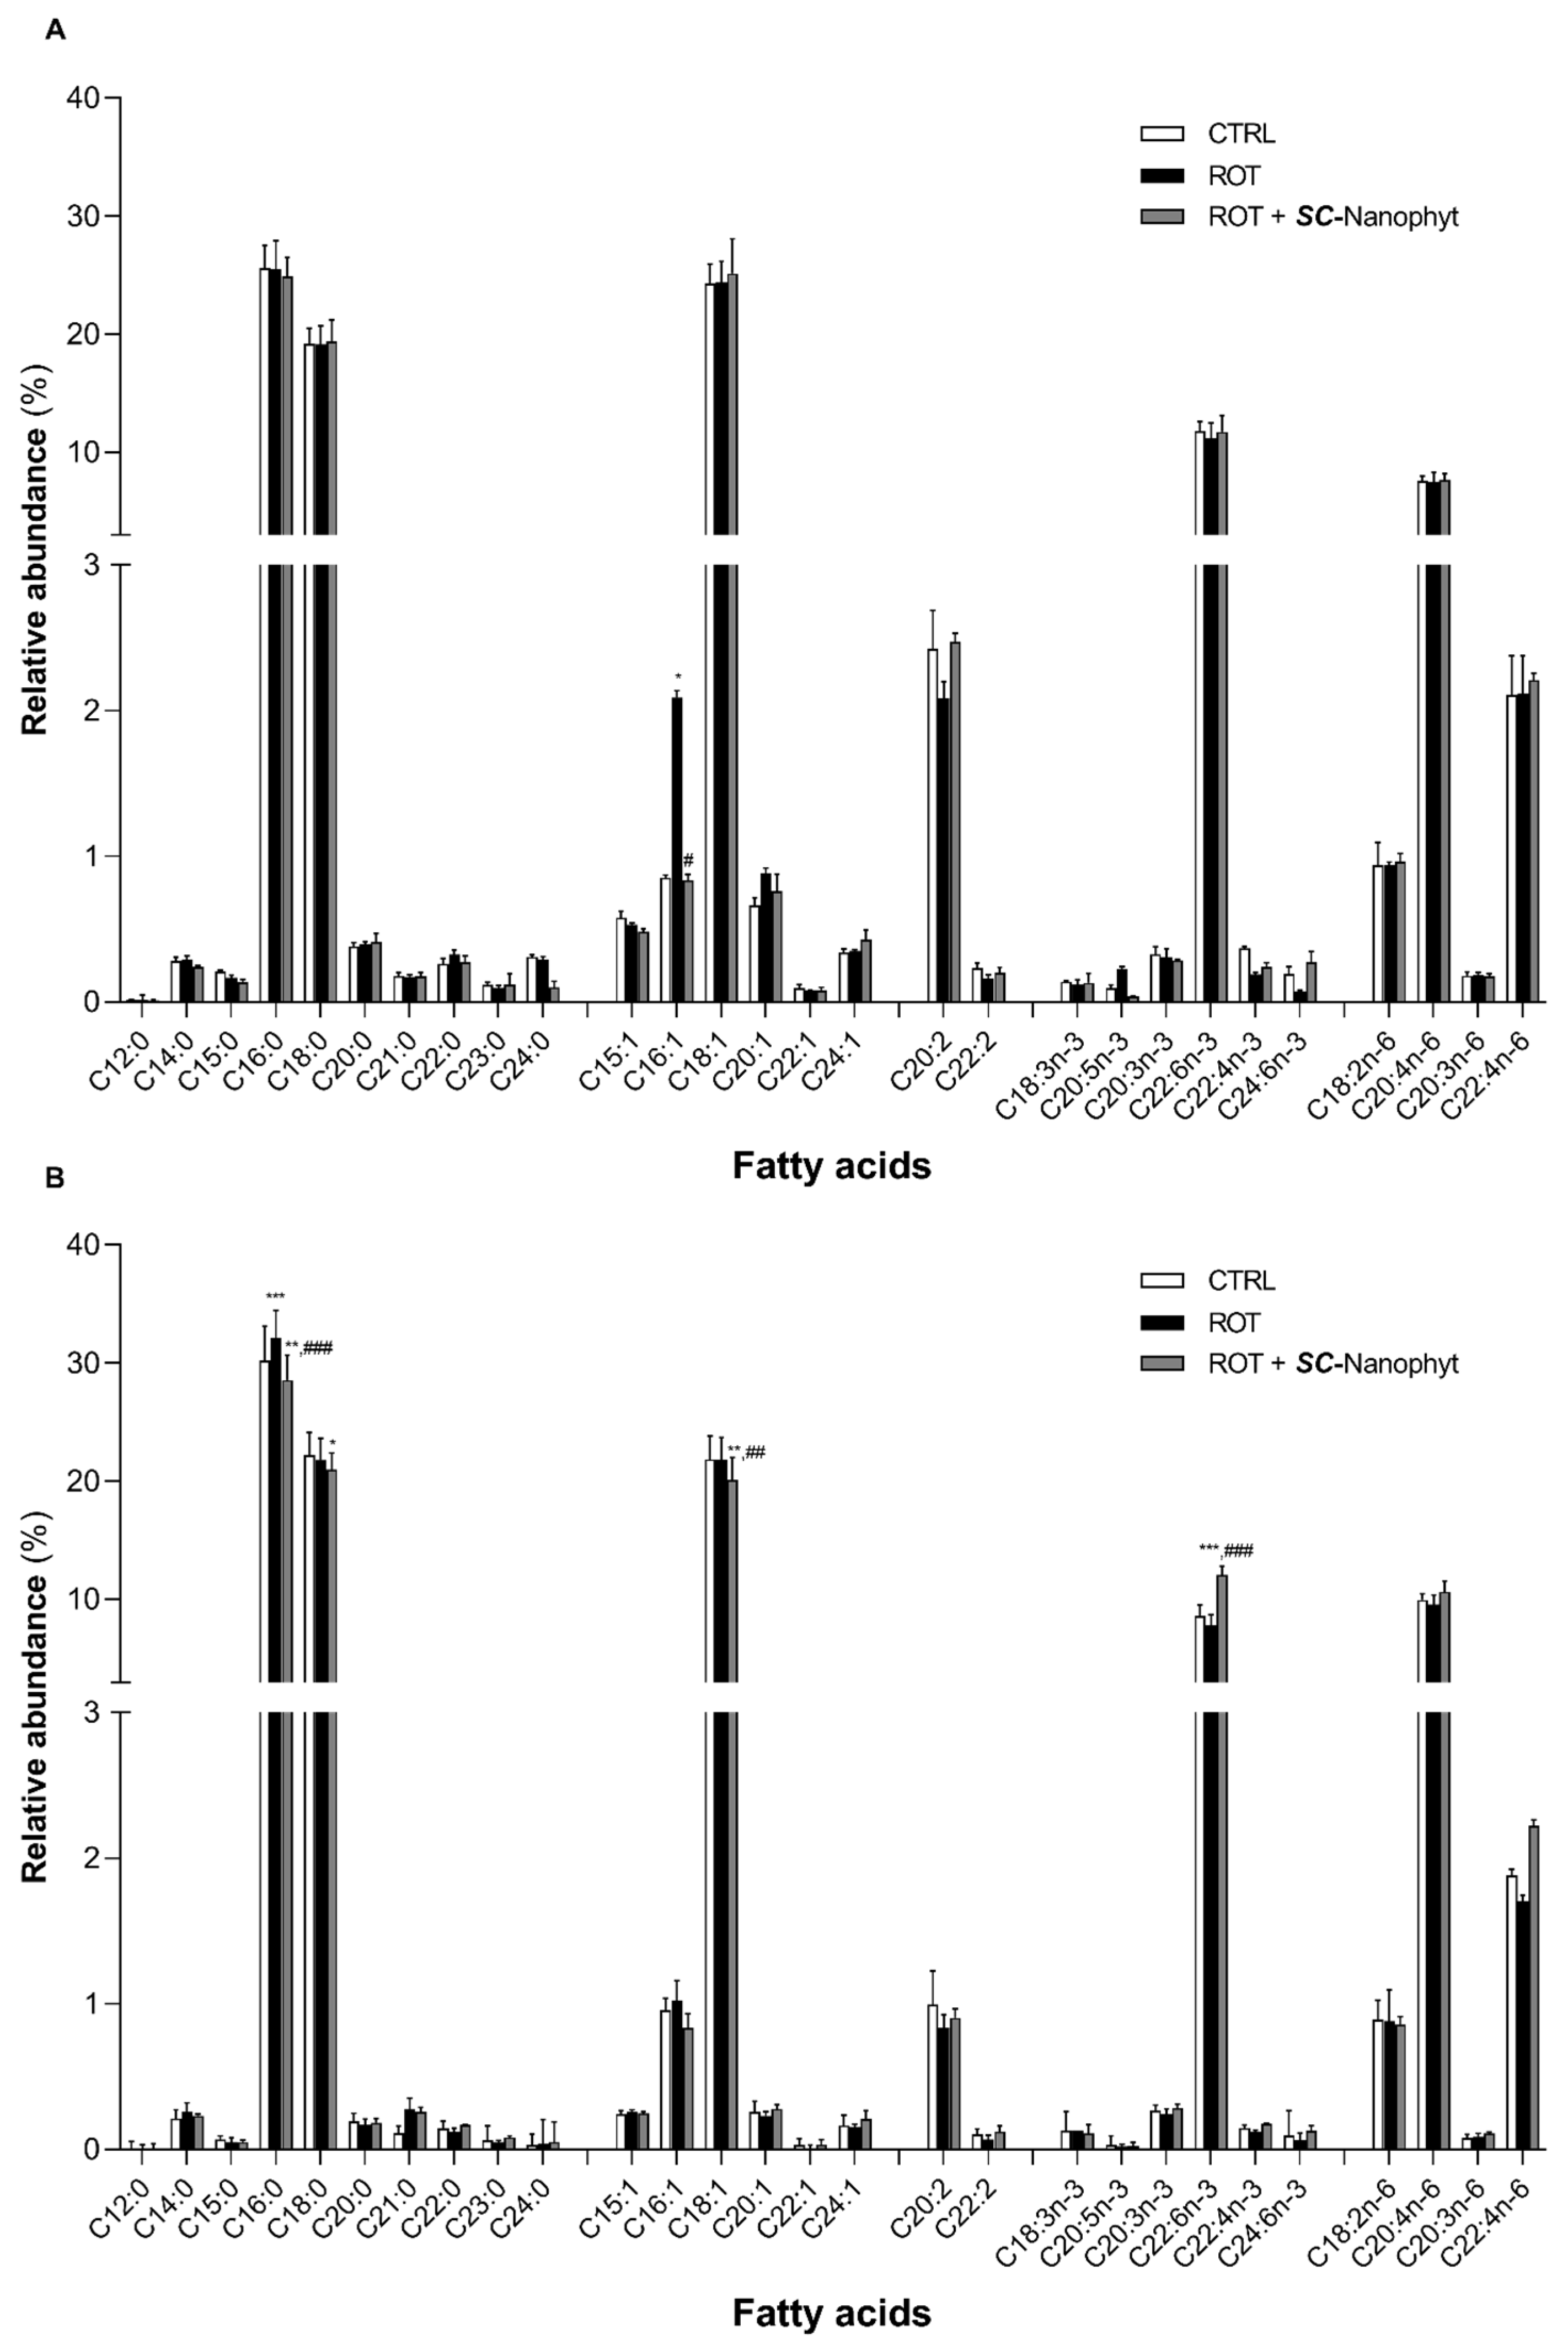
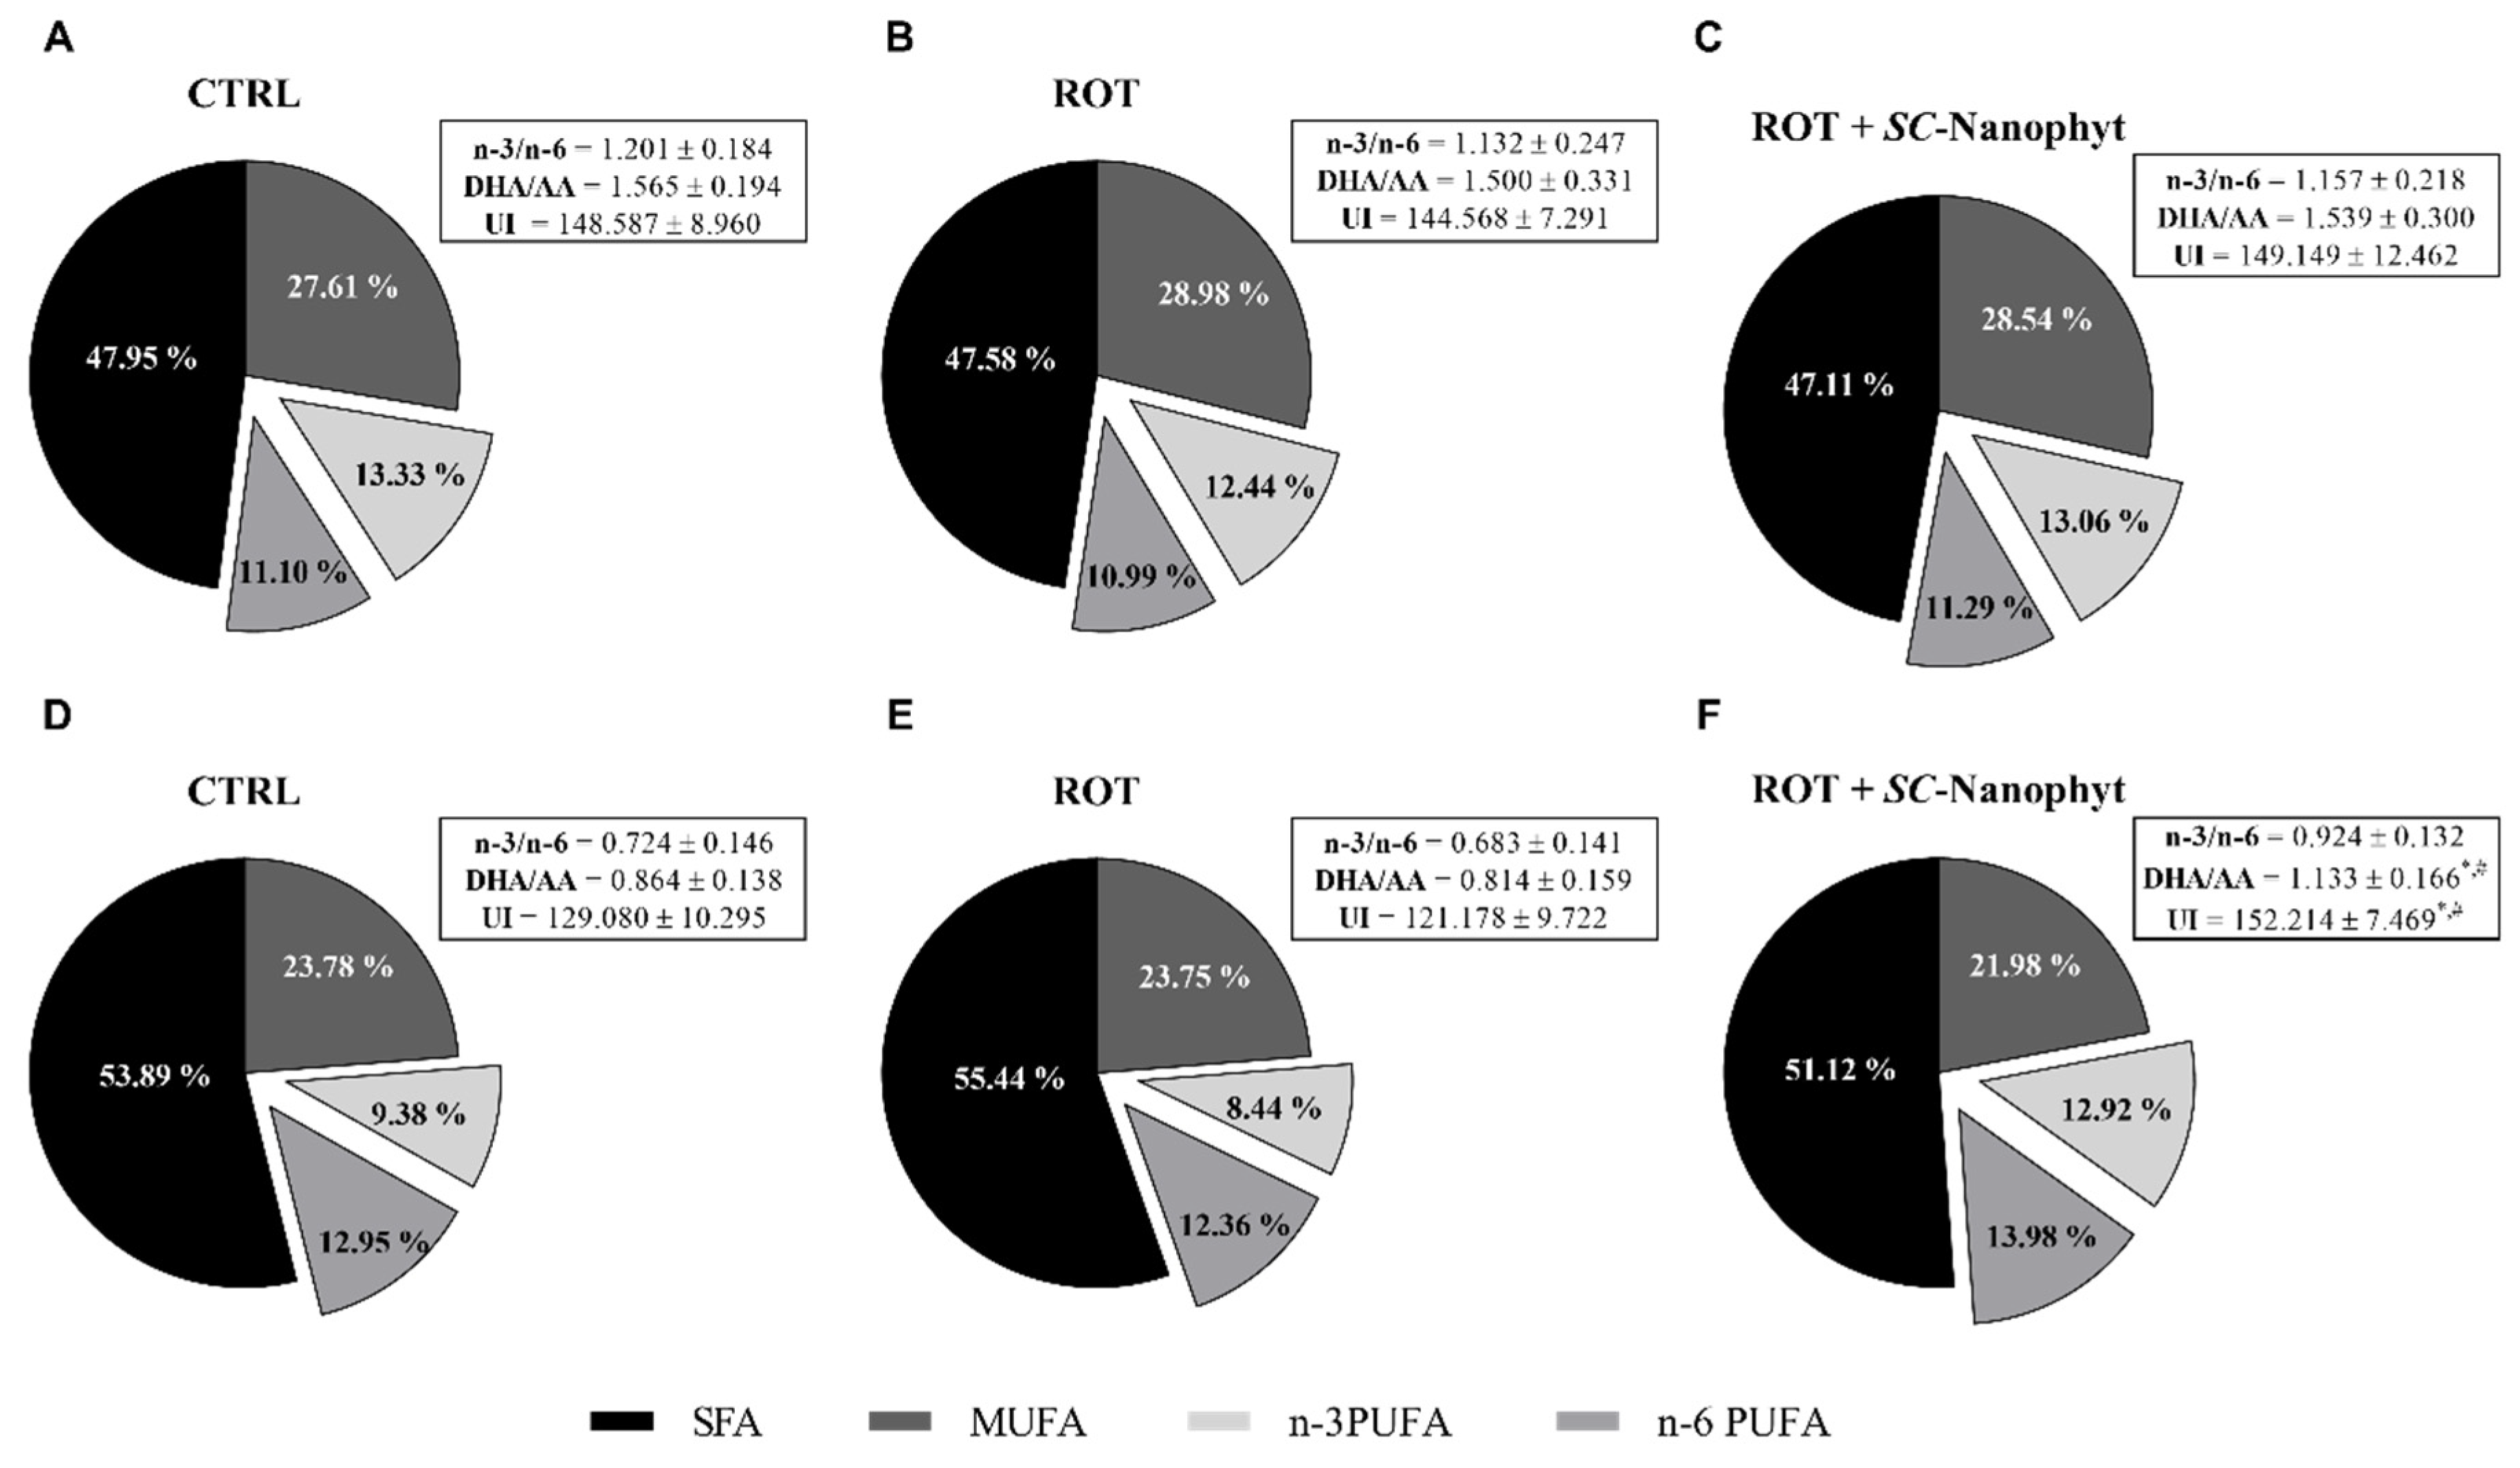
2.3. Effects on Brain Mitochondria
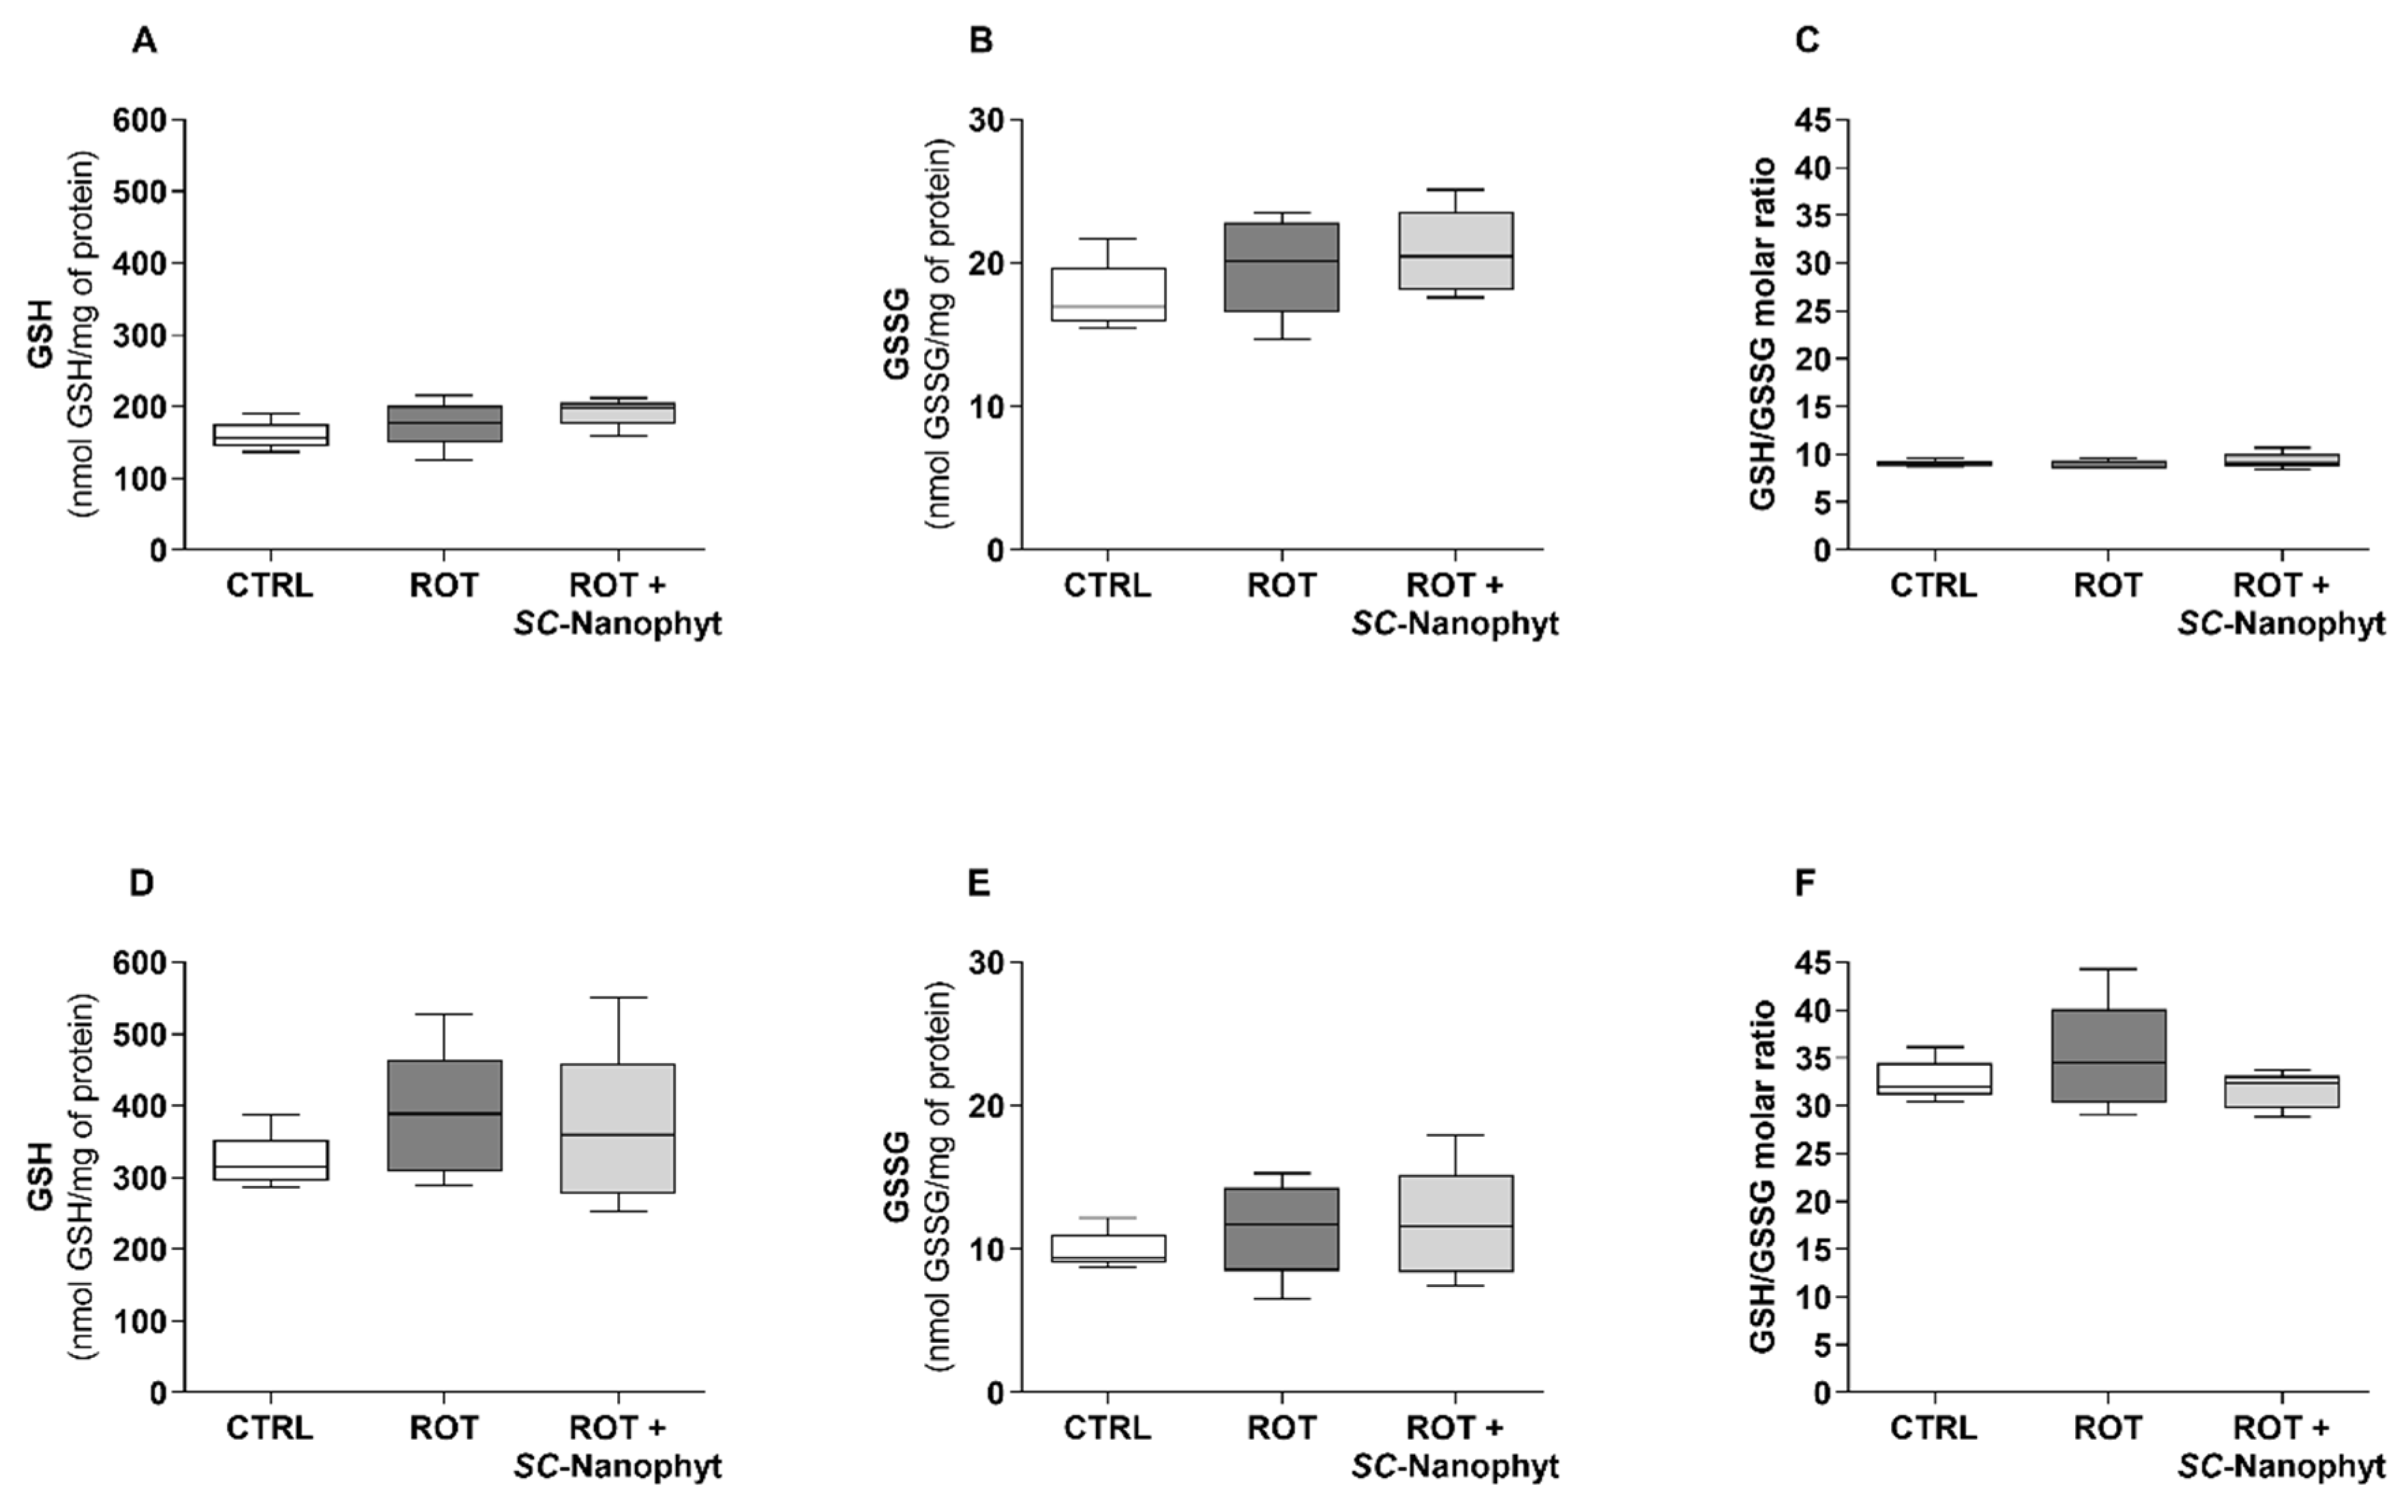
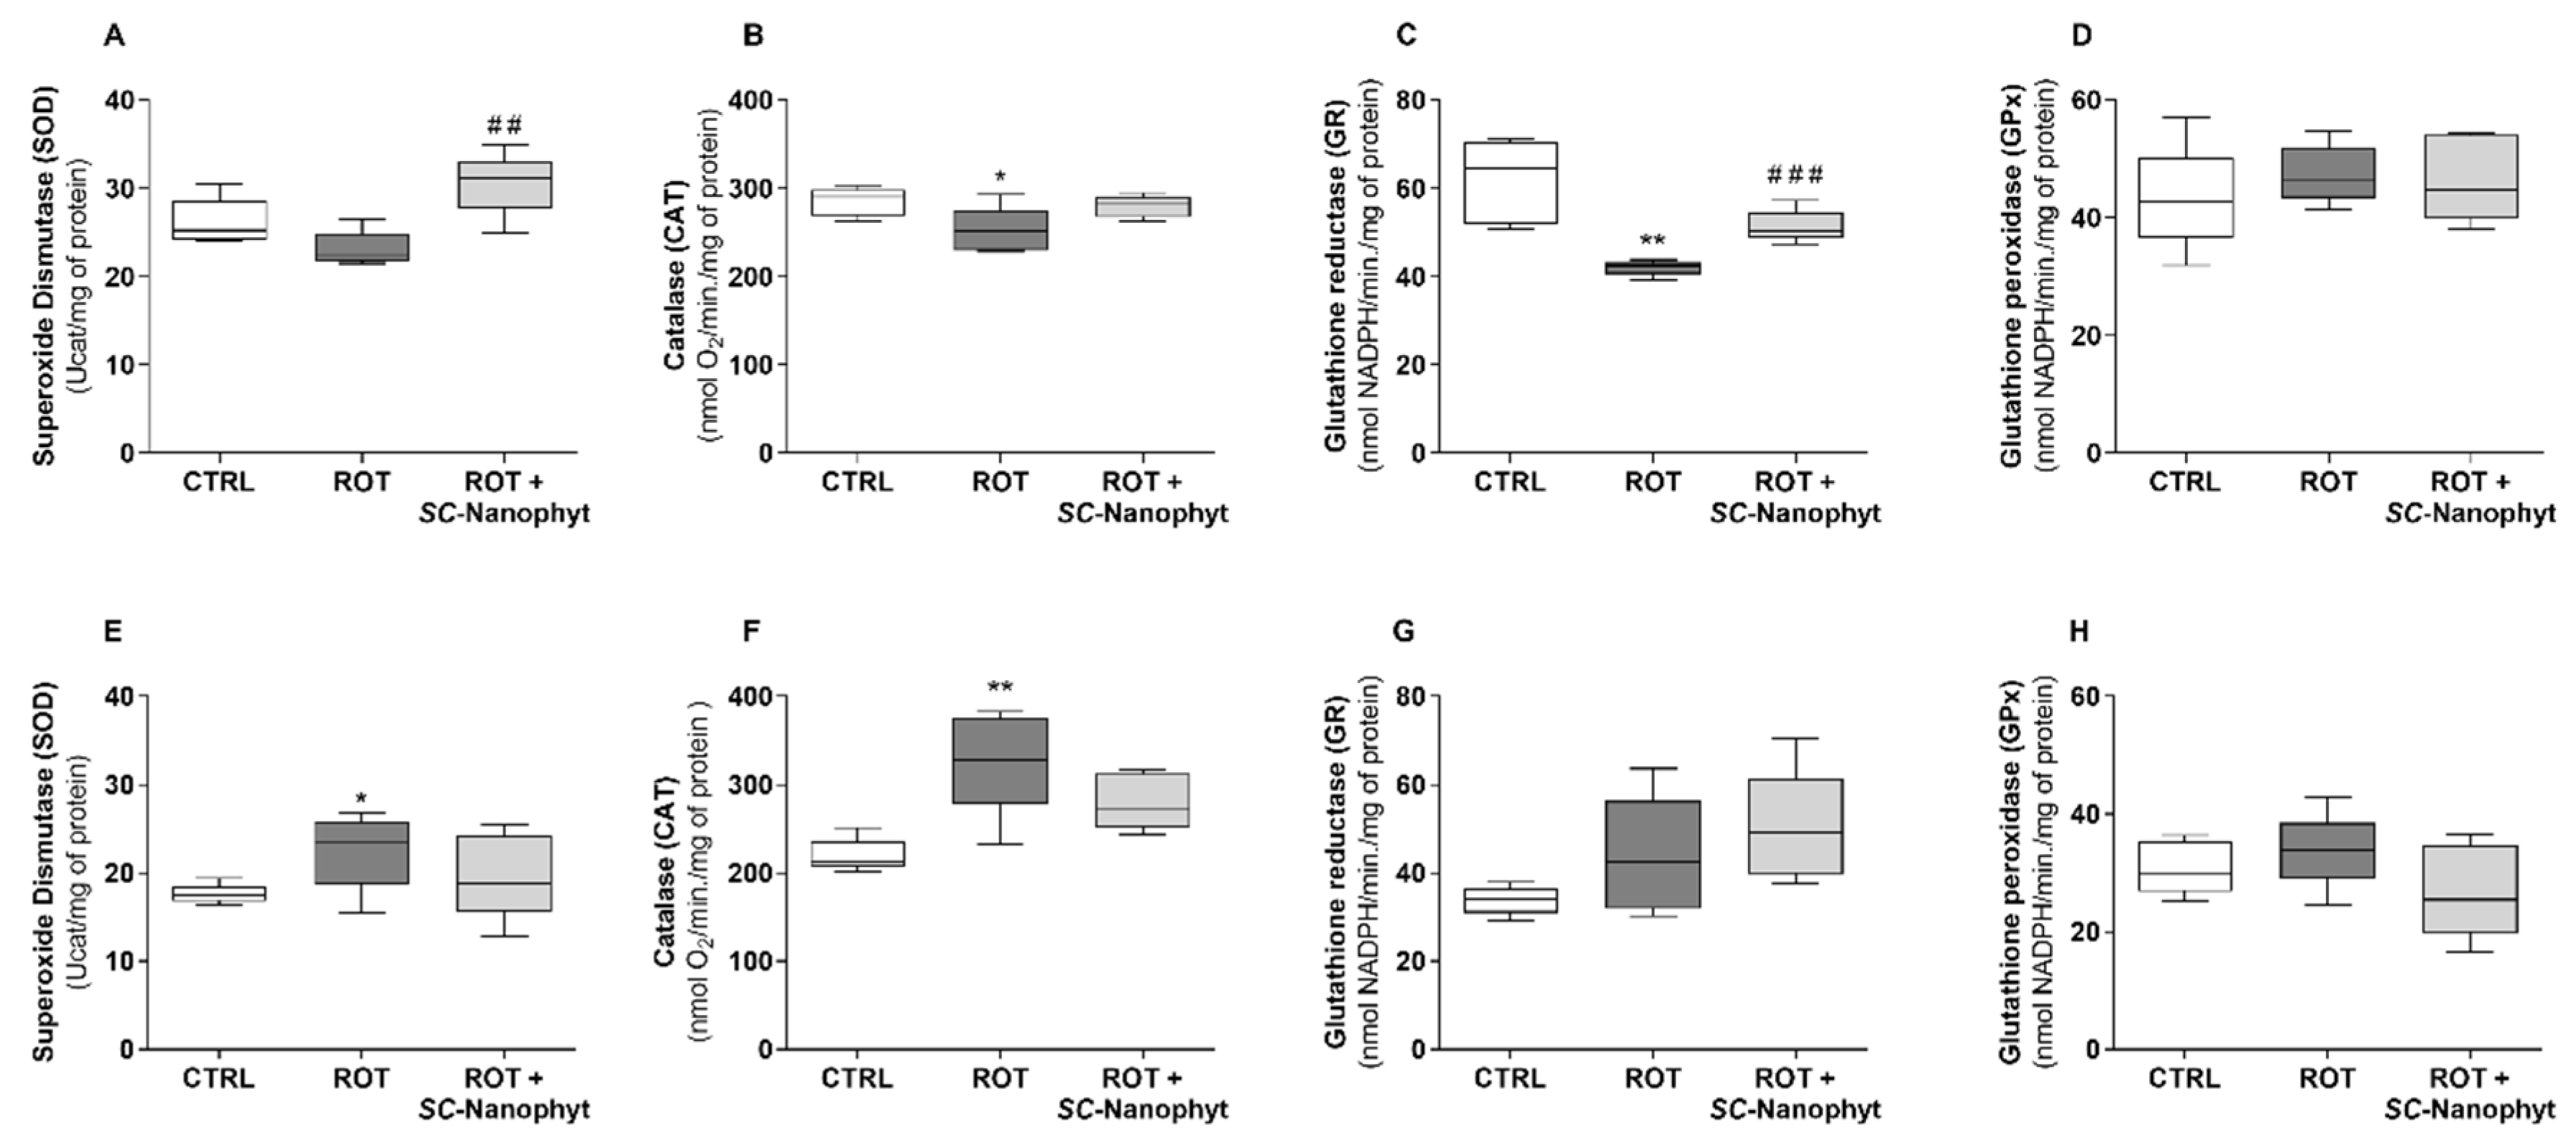
2.4. Effects on the Brain Redox State
3. Material and Methods
3.1. SC-Nanophytosomes Building Blocks—Codium Tomentosum Polar Membrane Lipids and Elderberry Anthocyanins-Enriched Extract
3.2. SC-Nanophytosomes Formulation Preparation and Characterization under Conditions That Mimic the Gastrointestinal Tract
3.3. Rotenone-Induced Rat Model of Parkinson’s Disease and Treatment with SC-Nanophytosomes
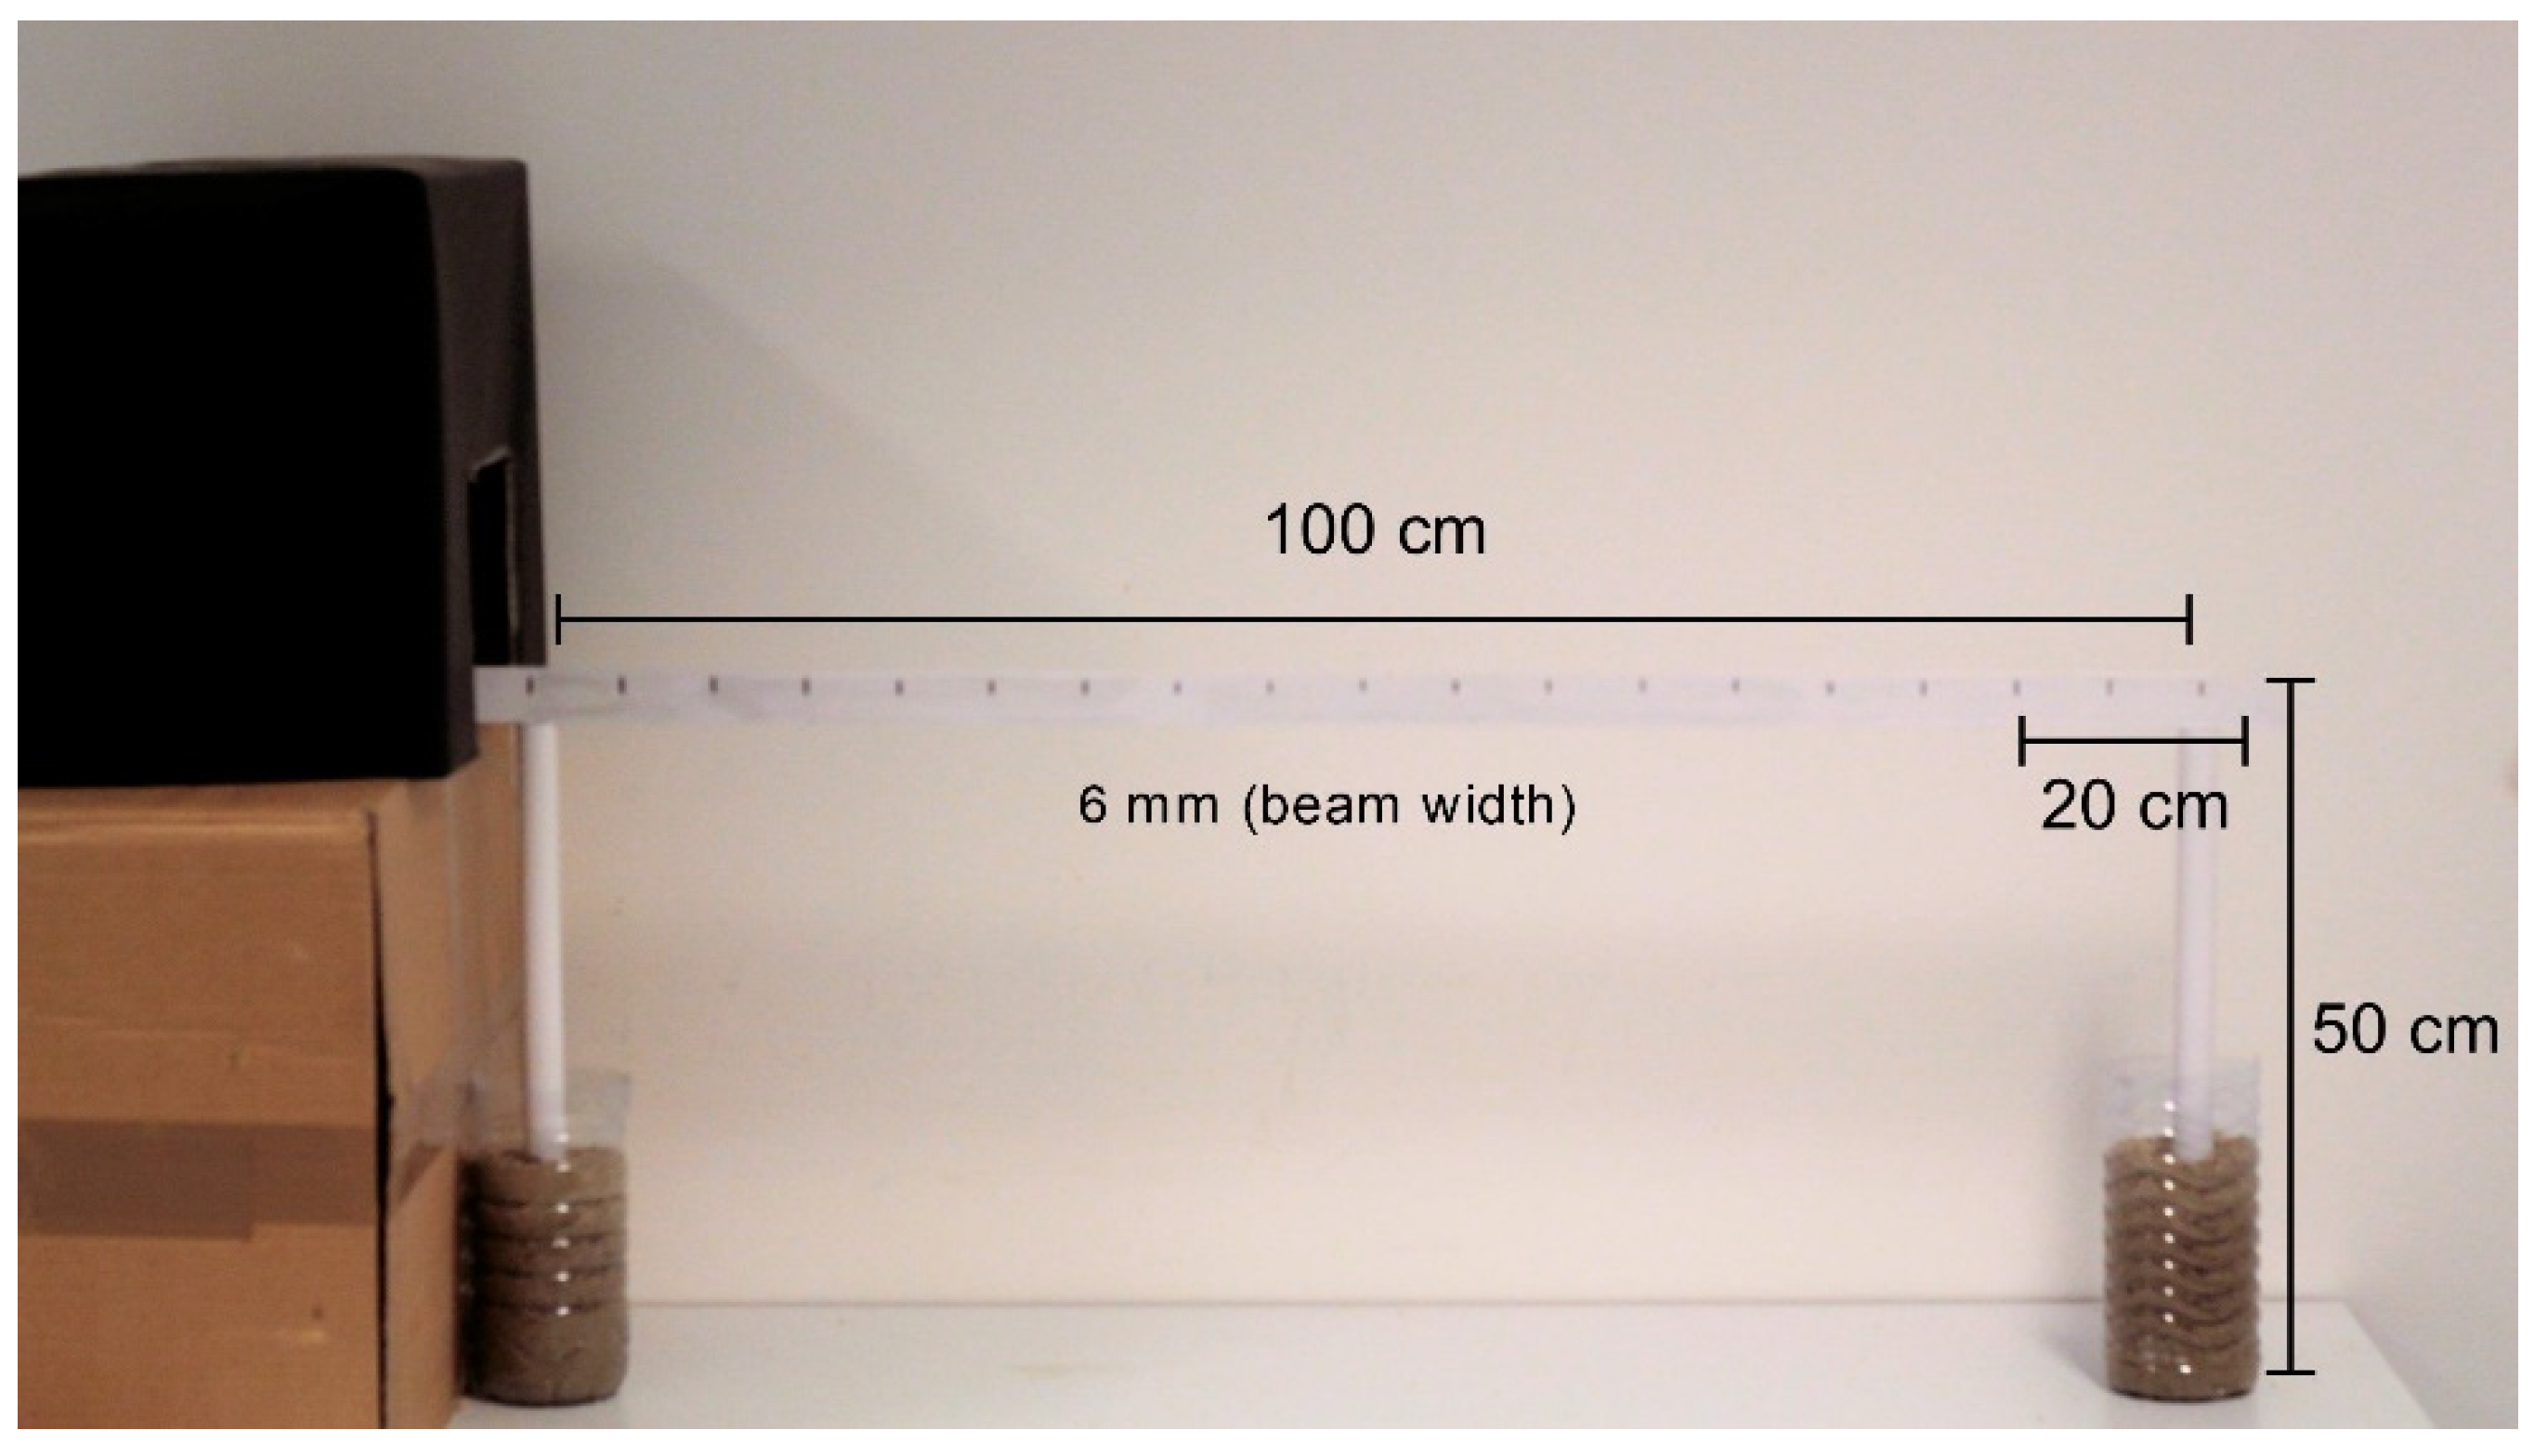
3.4. Beam Walking Test
3.5. Ex Vivo Studies: Samples Collection
3.6. Rat α-Synuclein (SNCA) Enzyme-Linked Immunosorbent Assay (ELISA)
3.7. Tyrosine Hydroxylase Activity
3.8. Assessment of the Mitochondrial Respiratory Function
3.9. Mitochondrial Respiratory Chain Complex Activities
3.10. Determination of Brain Enzymatic and Nonenzymatic Antioxidant Defenses
3.11. Lipid Extraction and Phospholipid Quantification
3.12. Preparation and Analysis of Esters Derivate of Fatty Acids
3.13. Data and Statistical Analysis
4. Conclusions
Supplementary Materials
Author Contributions
Funding
Institutional Review Board Statement
Informed Consent Statement
Acknowledgments
Conflicts of Interest
References
- Huang, M.L.; Chiang, S.; Kalinowski, D.S.; Bae, D.H.; Sahni, S.; Richardson, D.R. The Role of the Antioxidant Response in Mitochondrial Dysfunction in Degenerative Diseases: Cross-Talk between Antioxidant Defense, Autophagy, and Apoptosis. Oxid. Med. Cell Longev. 2019, 2019, 6392763. [Google Scholar] [CrossRef] [PubMed] [Green Version]
- Jagaran, K.; Singh, M. Nanomedicine for neurodegenerative disorders: Focus on Alzheimer’s and Parkinson’s diseases. Int. J. Mol. Sci. 2021, 22, 9082. [Google Scholar] [CrossRef] [PubMed]
- Lord, L.D.; Expert, P.; Huckins, J.F.; Turkheimer, F.E. Cerebral Energy Metabolism and the Brain’s Functional Network Architecture: An Integrative Review. J. Cereb. Blood Flow Metab. 2013, 33, 1347–1354. [Google Scholar] [CrossRef] [PubMed] [Green Version]
- DeTure, M.A.; Dickson, D.W. The neuropathological diagnosis of Alzheimer’s disease. Mol. Neurodegener. 2019, 14, 32. [Google Scholar] [CrossRef] [PubMed] [Green Version]
- Balestrino, R.; Schapira, A.H.V. Parkinson disease. Eur. J. Neurol. 2019, 27, 27–42. [Google Scholar] [CrossRef] [PubMed]
- Rani, L.; Mondal, A.C. Emerging concepts of mitochondrial dysfunction in Parkinson’s disease progression: Pathogenic and therapeutic implications. Mitochondrion 2020, 50, 25–34. [Google Scholar] [CrossRef]
- Winklhofer, K.F.; Haass, C. Mitochondrial dysfunction in Parkinson’s disease. Biochim. Biophys. Acta 2010, 1802, 29–44. [Google Scholar] [CrossRef]
- Golpich, M.; Amini, E.; Mohamed, Z.; Ali, R.A.; Ibrahim, N.M.; Ahmadiani, A. Mitochondrial Dysfunction and Biogenesis in Neurodegenerative diseases: Pathogenesis and Treatment. CNS Neurosci. Ther. 2017, 23, 5–22. [Google Scholar] [CrossRef] [PubMed]
- Monteiro-Cardoso, V.F.; Oliveira, M.M.; Melo, T.; Domingues, M.R.; Moreira, P.I.; Ferreiro, E.; Peixoto, F.; Videira, R.A. Cardiolipin profile changes are associated to the early synaptic mitochondrial dysfunction in Alzheimer’s disease. J. Alzheimers Dis. 2015, 43, 1375–1392. [Google Scholar] [CrossRef] [Green Version]
- Parker, W.D.; Parks, J.K.; Swerdlow, R.H. Complex I deficiency in Parkinson’s disease frontal cerebral cortex. Brain Res. 2008, 16, 215–218. [Google Scholar] [CrossRef]
- Picca, A.; Calvani, R.; Coelho-Junior, H.J.; Landi, F.; Bernabei, R.; Marzetti, E. Mitochondrial Dysfunction, Oxidative Stress, and Neuroinflammation: Intertwined Roads to Neurodegeneration. Antioxidants 2020, 9, 647. [Google Scholar] [CrossRef] [PubMed]
- Picca, A.; Guerra, F.; Calvani, R.; Romano, R.; Coelho-Júnior, H.J.; Bucci, C.; Marzetti, E. Mitochondrial Dysfunction, Protein Misfolding and Neuroinflammation in Parkinson’s Disease: Roads to Biomarker Discovery. Biomolecules 2021, 11, 1508. [Google Scholar] [CrossRef] [PubMed]
- Grazioli, S.; Pugin, J. Mitochondrial damage-associated molecular patterns: From inflammatory signaling to human diseases. Front. Immunol. 2018, 9, 832. [Google Scholar] [CrossRef] [PubMed] [Green Version]
- Argueti-Ostrovsky, S.; Alfahel, L.; Kahn, J.; Israelson, A. All Roads Lead to Rome: Different Molecular Players Converge to Common Toxic Pathways in Neurodegeneration. Cells 2021, 10, 2438. [Google Scholar] [CrossRef] [PubMed]
- Mendes, D.; Peixoto, F.; Oliveira, M.M.; Andrade, P.B.; Videira, R.A. Mitochondria research and neurodegenerative diseases: On the track to understanding the biological world of high complexity. Mitochondrion 2022, 65, 67–79. [Google Scholar] [CrossRef] [PubMed]
- Mendes, D.; Valentão, P.; Oliveira, M.M.; Andrade, P.B.; Videira, R.A. A nanophytosomes formulation based on elderberry anthocyanins and Codium lipids to mitigate mitochondrial dysfunctions. Biomed. Pharmacother. 2021, 143, 112157. [Google Scholar] [CrossRef]
- Neves, D.; Valentão, P.; Bernardo, J.; Oliveira, M.C.; Ferreira, J.M.G.; Pereira, D.M.; Andrade, P.B.; Videira, R.A. A new insight on elderberry anthocyanins bioactivity: Modulation of mitochondrial redox chain functionality and cell redox state. J. Funct. Foods 2019, 56, 145–155. [Google Scholar] [CrossRef]
- da Costa, E.; Melo, T.; Moreira, A.S.P.; Alves, E.; Domingues, P.; Calado, R.; Abreu, M.H.; Domingues, M.R. Decoding bioactive polar lipid profile of the macroalgae Codium tomentosum from a sustainable IMTA system using a lipidomic approach. Algal Res. 2015, 14, 388–397. [Google Scholar] [CrossRef]
- Betarbet, R.; Sherer, T.B.; MacKenzie, G.; Garcia-Osuna, M.; Panov, A.V.; Greenamyre, J.T. Chronic systemic pesticide exposure reproduces features of Parkinson’s disease. Nat. Neurosci. 2000, 12, 1301–1306. [Google Scholar] [CrossRef] [Green Version]
- Pingale, T.; Gupta, G.L. Classic and evolving animal models in Parkinson’s disease. Pharmacol. Biochem. Behav. 2020, 199, 173060. [Google Scholar] [CrossRef]
- Felber, A.E.; Dufresne, M.; Leroux, J. pH-sensitive vesicles, polymeric micelles, and nanospheres prepared with polycarboxylates. Adv. Drug Deliv. Rev. 2012, 64, 979–992. [Google Scholar] [CrossRef] [PubMed]
- Liu, L.; Yao, W.; Rao, Y.; Lu, X.; Gao, J. pH-Responsive carriers for oral drug delivery: Challenges and opportunities of current platforms. Drug Deliv. 2017, 24, 569–581. [Google Scholar] [CrossRef] [PubMed] [Green Version]
- Neves, D.; Andrade, P.B.; Videira, R.A.; de Freitas, V.; Cruz, L. Berry anthocyanin-based films in smart food packaging: A mini-review. Food Hydrocoll. 2022, 133, 107885. [Google Scholar] [CrossRef]
- Nicolson, G.L.; Ash, M.E. Membrane Lipid Replacement for chronic illnesses, aging and cancer using oral glycerolphospholipid formulations with fructooligosaccharides to restore phospholipid function in cellular membranes, organelles, cells and tissues. Biochim. Biophys. Acta Biomembr. 2017, 1859, 1704–1724. [Google Scholar] [CrossRef] [PubMed]
- Gilhotra, R.M.; Ikram, M.; Srivastava, S.; Gilhotra, N. A clinical perspective on mucoadhesive buccal drug delivery systems. J. Biomed. Res. 2014, 28, 81–97. [Google Scholar] [CrossRef] [Green Version]
- Wu, T.; Hallett, M. The cerebellum in Parkinson’s disease. Brain 2013, 136, 696–709. [Google Scholar] [CrossRef] [Green Version]
- Lefaucheur, J. Motor cerebral cortex dysfunction revealed by cortical excitability studies in Parkinson’s disease: Influence of antiparkinsonian treatment and cortical stimulation. Clin. Neurophysiol. 2005, 116, 244–253. [Google Scholar] [CrossRef]
- Lindenbach, D.; Bishop, C. Critical involvement of the motor cerebral cortex in the pathophysiology and treatment of Parkinson’s disease. Neurosci. Biobehav. Rev. 2013, 37, 2737–2750. [Google Scholar] [CrossRef] [Green Version]
- Vekrellis, K.; Xilouri, M.; Emmanouilidou, E.; Rideout, H.; Stefanis, L. Pathological roles of α-synuclein in neurological disorders. Lancet Neurol. 2011, 10, 1015–1025. [Google Scholar] [CrossRef]
- Cannon, J.R.; Tapias, V.; Na, H.M.; Honick, A.S.; Drolet, R.E.; Greenamyre, J.T. A highly reproducible rotenone model of Parkinson’s disease. Neurobiol. Dis. 2009, 34, 279–290. [Google Scholar] [CrossRef]
- Richter, F.; Hamann, M.; Richter, A. Chronic rotenone treatment induces behavioral effects but no pathological signs of parkinsonism in mice. J. Neurosci. Res. 2007, 85, 681–691. [Google Scholar] [CrossRef] [PubMed]
- Zhang, X.; Du, L.; Zhang, W.; Yang, Y.; Zhou, Q.; Du, G. Therapeutic effects of baicalein on rotenone-induced Parkinson’s disease through protecting mitochondrial function and biogenesis. Sci. Rep. 2017, 7, 9968. [Google Scholar] [CrossRef] [PubMed] [Green Version]
- Keane, P.C.; Kurzawa, M.; Blain, P.G.; Morris, C.M. Mitochondrial dysfunction in Parkinson’s disease. Park. Dis. 2011, 2011, 716871. [Google Scholar] [CrossRef] [PubMed] [Green Version]
- Schwerzmann, K.; Hoppeler, H.; Kayar, S.R.; Weibel, E.R. Oxidative capacity of muscle and mitochondria: Correlation of physiological, biochemical, and morphometric characteristics. Proc. Natl. Acad. Sci. USA 1989, 86, 1583–1587. [Google Scholar] [CrossRef] [PubMed] [Green Version]
- Melo, T.; Videira, R.A.; André, S.; Maciel, E.; Francisco, C.S.; Oliveira-Campos, A.M.; Rodrigues, L.M.; Domingues, M.R.M.; Peixoto, F.; Oliveira, M.M. Tacrine and its analogues impair mitochondrial function and bioenergetics: A lipidomic analysis in rat brain. J. Neurochem. 2012, 120, 998–1013. [Google Scholar] [CrossRef] [Green Version]
- Calder, P.C. Fatty acids and inflammation: The cutting edge between food and pharma. Eur. J. Pharmacol. 2011, 668, S50–S58. [Google Scholar] [CrossRef]
- Simopoulos, A.P. An Increase in the Omega-6/Omega-3 Fatty Acid Ratio Increases the Risk for Obesity. Nutrients 2016, 8, 128. [Google Scholar] [CrossRef] [Green Version]
- Simopoulos, A.P. Dietary omega-3 fatty acid deficiency and high fructose intake in the development of metabolic syndrome, brain metabolic abnormalities, and non-alcoholic fatty liver disease. Nutrients 2013, 5, 2901–2923. [Google Scholar] [CrossRef] [Green Version]
- Bousquet, M.; Saint-Pierre, M.; Julien, C.; Salem, N.; Cicchetti, F.; Calon, F. Beneficial effects of dietary omega-3 polyunsaturated fatty acid on toxin-induced neuronal degeneration in an animal model of Parkinson’s disease. FASEB J. 2008, 22, 1213–1225. [Google Scholar] [CrossRef]
- Bousquet, M.; Calon, F.; Cicchetti, F. Impact of ω-3 fatty acids in Parkinson’s disease. Ageing Res. Rev. 2011, 10, 453–463. [Google Scholar] [CrossRef]
- Dyall, S.C. Long-chain omega-3 fatty acids and the brain: A review of the independent and shared effects of EPA, DPA and DHA. Front. Aging Neurosci. 2015, 7, 52. [Google Scholar] [CrossRef] [PubMed] [Green Version]
- Ozkan, A.; Parlak, H.; Tanriover, G.; Dilmac, S.; Ulker, S.N.; Birsen, I.; Agar, A. The protective mechanism of docosahexaenoic acid in mouse model of Parkinson: The role of hemeoxygenase. Neurochem. Int. 2016, 101, 110–119. [Google Scholar] [CrossRef] [PubMed]
- Masella. R.; Di Benedetto, R.; Varì, R.; Filesi, C.; Giovannini, C. Novel mechanisms of natural antioxidant compounds in biological systems: Involvement of glutathione and glutathione-related enzymes. J. Nutr. Biochem. 2005, 16, 577–586. [Google Scholar] [CrossRef] [PubMed]
- Birben, E.; Sahiner, U.M.; Sackesen, C.; Erzurum, S.; Kalayci, O. Oxidative stress and antioxidant defense. World Allergy Organ. J. 2012, 5, 9–19. [Google Scholar] [CrossRef] [Green Version]
- Halliwell. B. Oxidative stress and neurodegeneration: Where are we now? J. Neurochem. 2006, 97, 1634–1658. [Google Scholar] [CrossRef] [PubMed]
- Bernardo, J.; Videira, R.A.; Valentão, P.; Veiga, F.; Andrade, P.B. Extraction of phospholipid-rich fractions from egg yolk and development of liposomes entrapping a dietary polyphenol with neuroactive potential. Food Chem. Toxicol. 2019, 133, 110749. [Google Scholar] [CrossRef]
- Nair, A.B.; Jacob, S. A simple practice guide for dose conversion between animals and human. J. Basic Clin. Pharm. 2016, 7, 27–31. [Google Scholar] [CrossRef] [Green Version]
- Luong, T.N.; Carlisle, H.J.; Southwell, A.; Patterson, P.H. Assessment of Motor Balance and Coordination in Mice using the Balance Beam. J. Vis. Exp. 2011, 49, e2376. [Google Scholar] [CrossRef] [Green Version]
- Mendes, D.; Oliveira, M.M.; Moreira, P.I.; Coutinho, J.; Nunes, F.M.; Pereira, D.M.; Valentão, P.; Andrade, P.B.; Videira, R.A. Beneficial effects of white wine polyphenols-enriched diet on Alzheimer’s disease-like pathology. J. Nutr. Biochem. 2018, 55, 165–177. [Google Scholar] [CrossRef]
- Vermeer, L.M.; Higgins, C.A.; Roman, D.L.; Doorn, J.A. Real-time monitoring of tyrosine hydroxylase activity using a plate reader assay. Anal. Biochem. 2013, 432, 11–15. [Google Scholar] [CrossRef]
- Gnaiger, E. Bioenergetics at low oxygen: Dependence of respiration and phosphorylation on oxygen and adenosine diphosphate supply. Respir. Physiol. 2001, 128, 277–297. [Google Scholar] [CrossRef]
- Bartlett, E.M.; Lewis, D.H. Spectrophotometric determination of phosphate esters in the presence and absence of orthophosphate. Anal. Biochem. 1970, 36, 159–167. [Google Scholar] [CrossRef]
- Peixoto, F.; Vicente, J.; Madeira, V.M.C. A comparative study of plant and animal mitochondria exposed to paraquat reveals that hydrogen peroxide is not related to the observed toxicity. Toxicol Vitr. 2004, 18, 733–739. [Google Scholar] [CrossRef] [PubMed] [Green Version]
- Konnova, E.A.; Swanberg, M. Chapter 5—Animal Models of Parkinson’s Disease. In Parkinson’s Disease: Pathogenesis and Clinical Aspects [Internet]; Stoker, T.B., Greenland, J.C., Eds.; Codon Publications: Brisbane, AU, Australia, 2018; pp. 83–106. [Google Scholar] [CrossRef]


Publisher’s Note: MDPI stays neutral with regard to jurisdictional claims in published maps and institutional affiliations. |
© 2022 by the authors. Licensee MDPI, Basel, Switzerland. This article is an open access article distributed under the terms and conditions of the Creative Commons Attribution (CC BY) license (https://creativecommons.org/licenses/by/4.0/).
Share and Cite
Mendes, D.; Peixoto, F.; Oliveira, M.M.; Andrade, P.B.; Videira, R.A. Brain Effects of SC-Nanophytosomes on a Rotenone-Induced Rat Model of Parkinson’s Disease—A Proof of Concept for a Mitochondria-Targeted Therapy. Int. J. Mol. Sci. 2022, 23, 12699. https://doi.org/10.3390/ijms232012699
Mendes D, Peixoto F, Oliveira MM, Andrade PB, Videira RA. Brain Effects of SC-Nanophytosomes on a Rotenone-Induced Rat Model of Parkinson’s Disease—A Proof of Concept for a Mitochondria-Targeted Therapy. International Journal of Molecular Sciences. 2022; 23(20):12699. https://doi.org/10.3390/ijms232012699
Chicago/Turabian StyleMendes, Daniela, Francisco Peixoto, Maria Manuel Oliveira, Paula Branquinho Andrade, and Romeu António Videira. 2022. "Brain Effects of SC-Nanophytosomes on a Rotenone-Induced Rat Model of Parkinson’s Disease—A Proof of Concept for a Mitochondria-Targeted Therapy" International Journal of Molecular Sciences 23, no. 20: 12699. https://doi.org/10.3390/ijms232012699