
ENet-6mA: Identification of 6mA Modification Sites in Plant Genomes Using ElasticNet and Neural Networks


Abstract
:1. Introduction
2. Results
3. Discussion
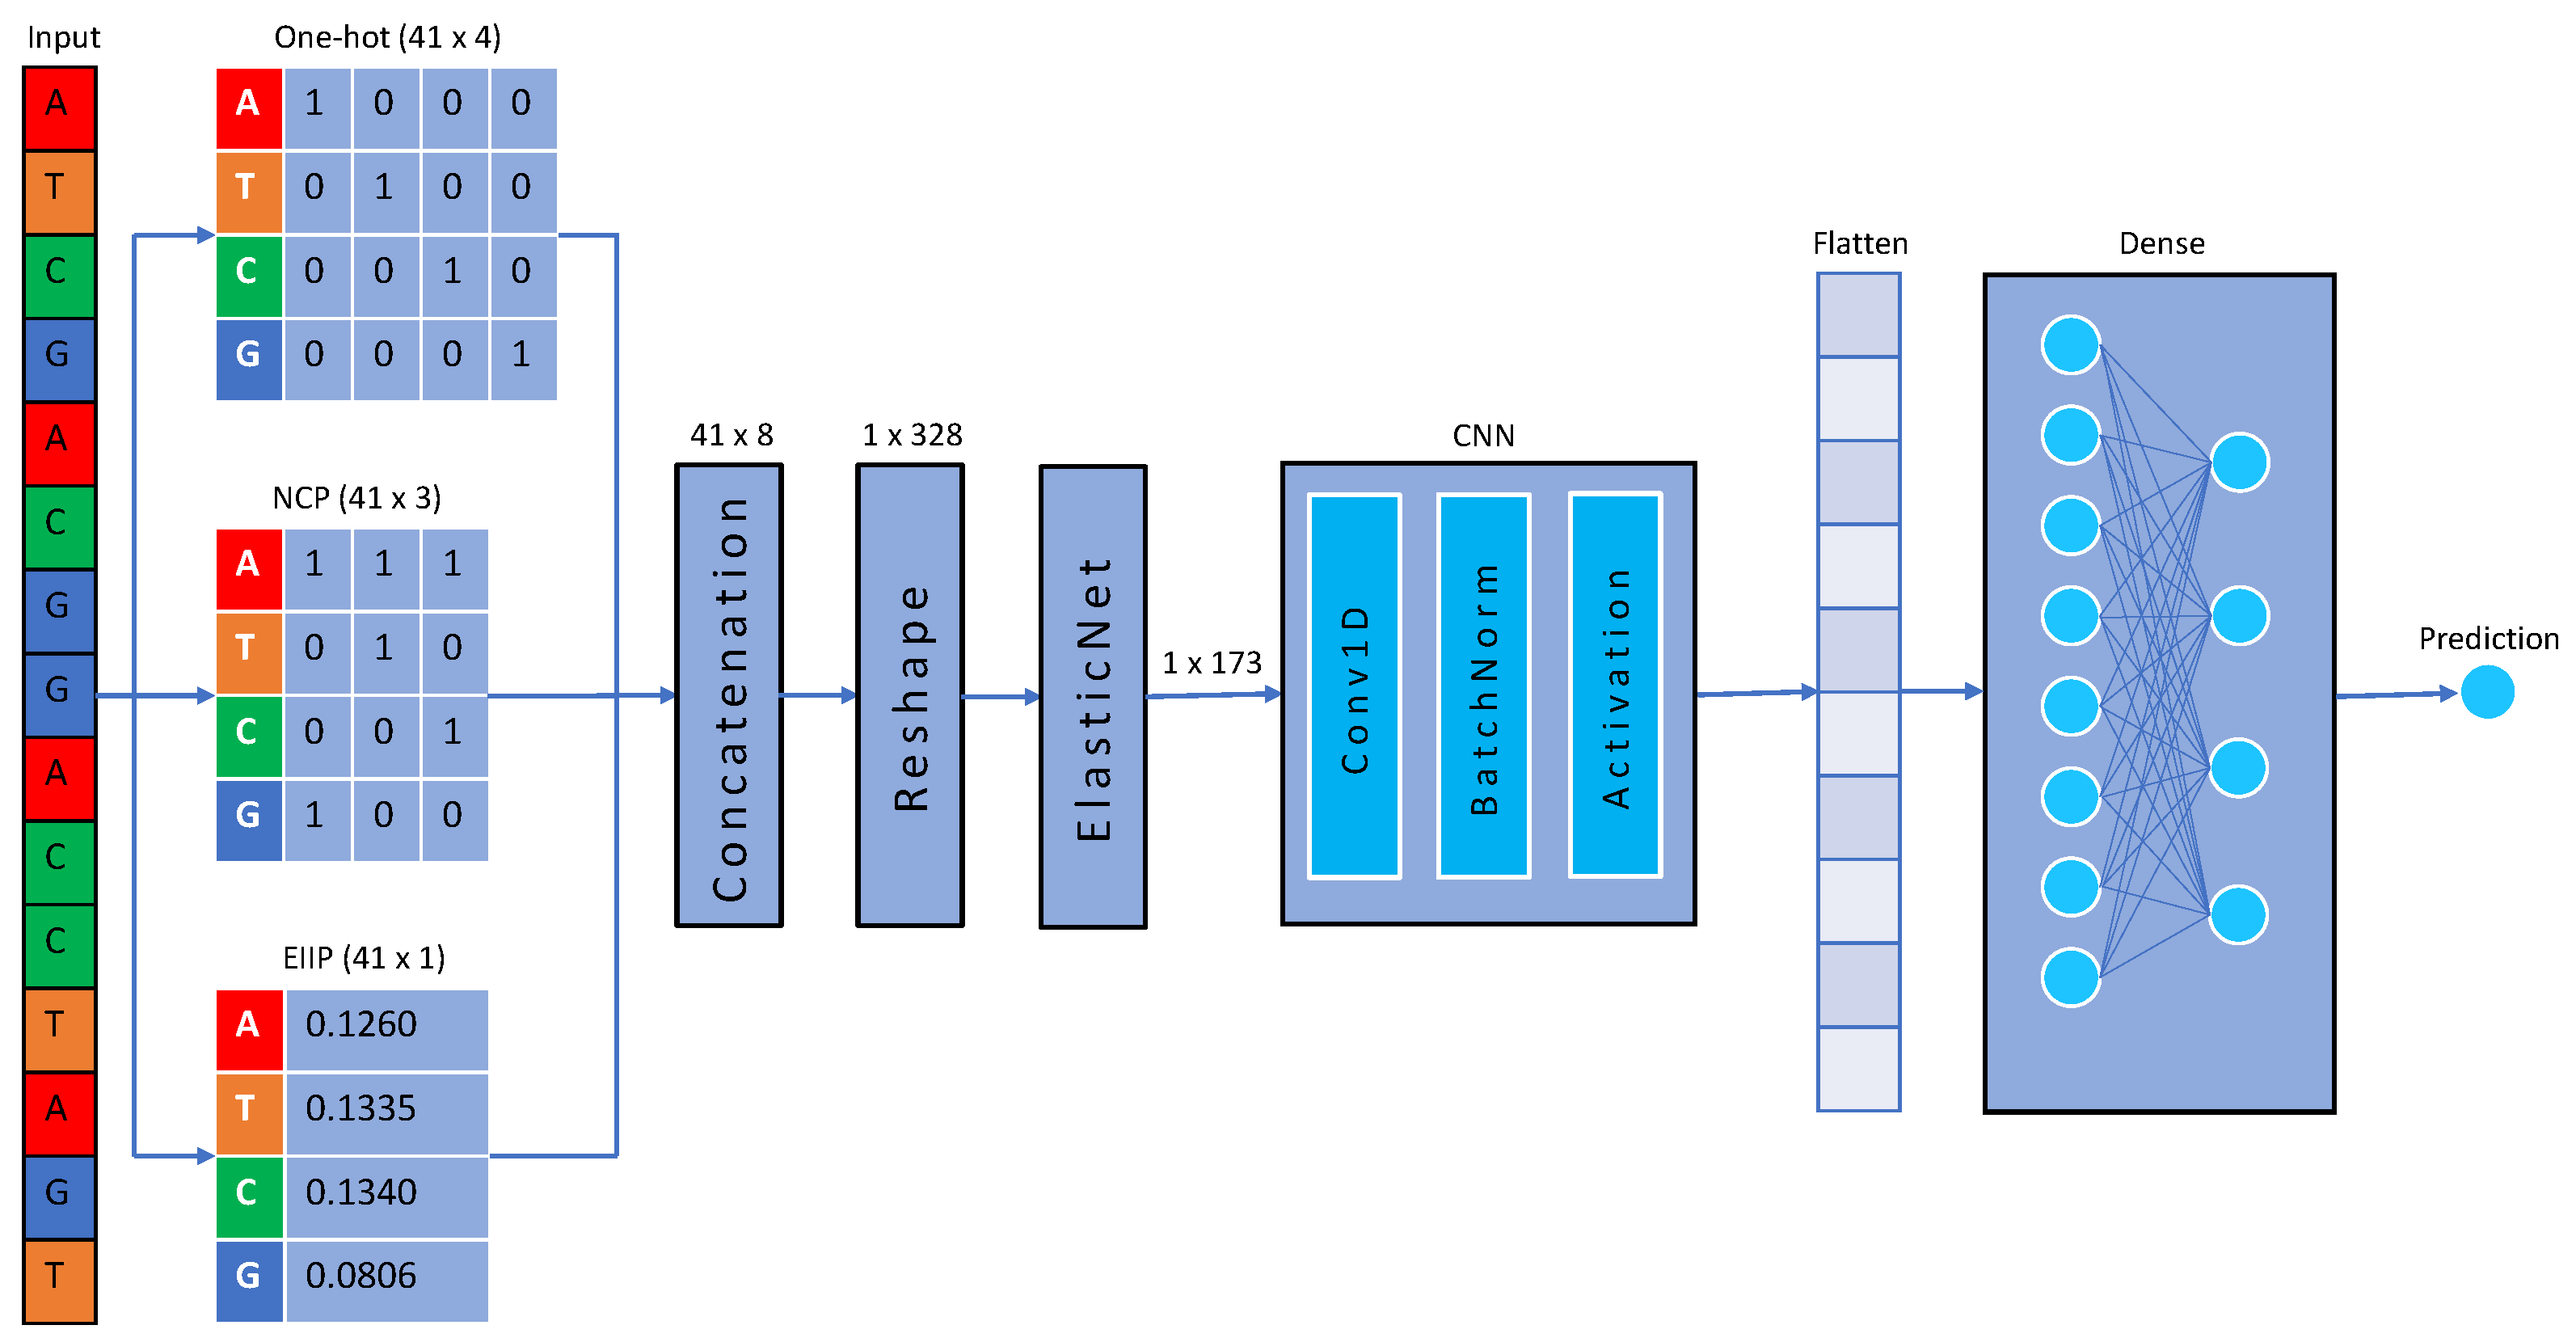
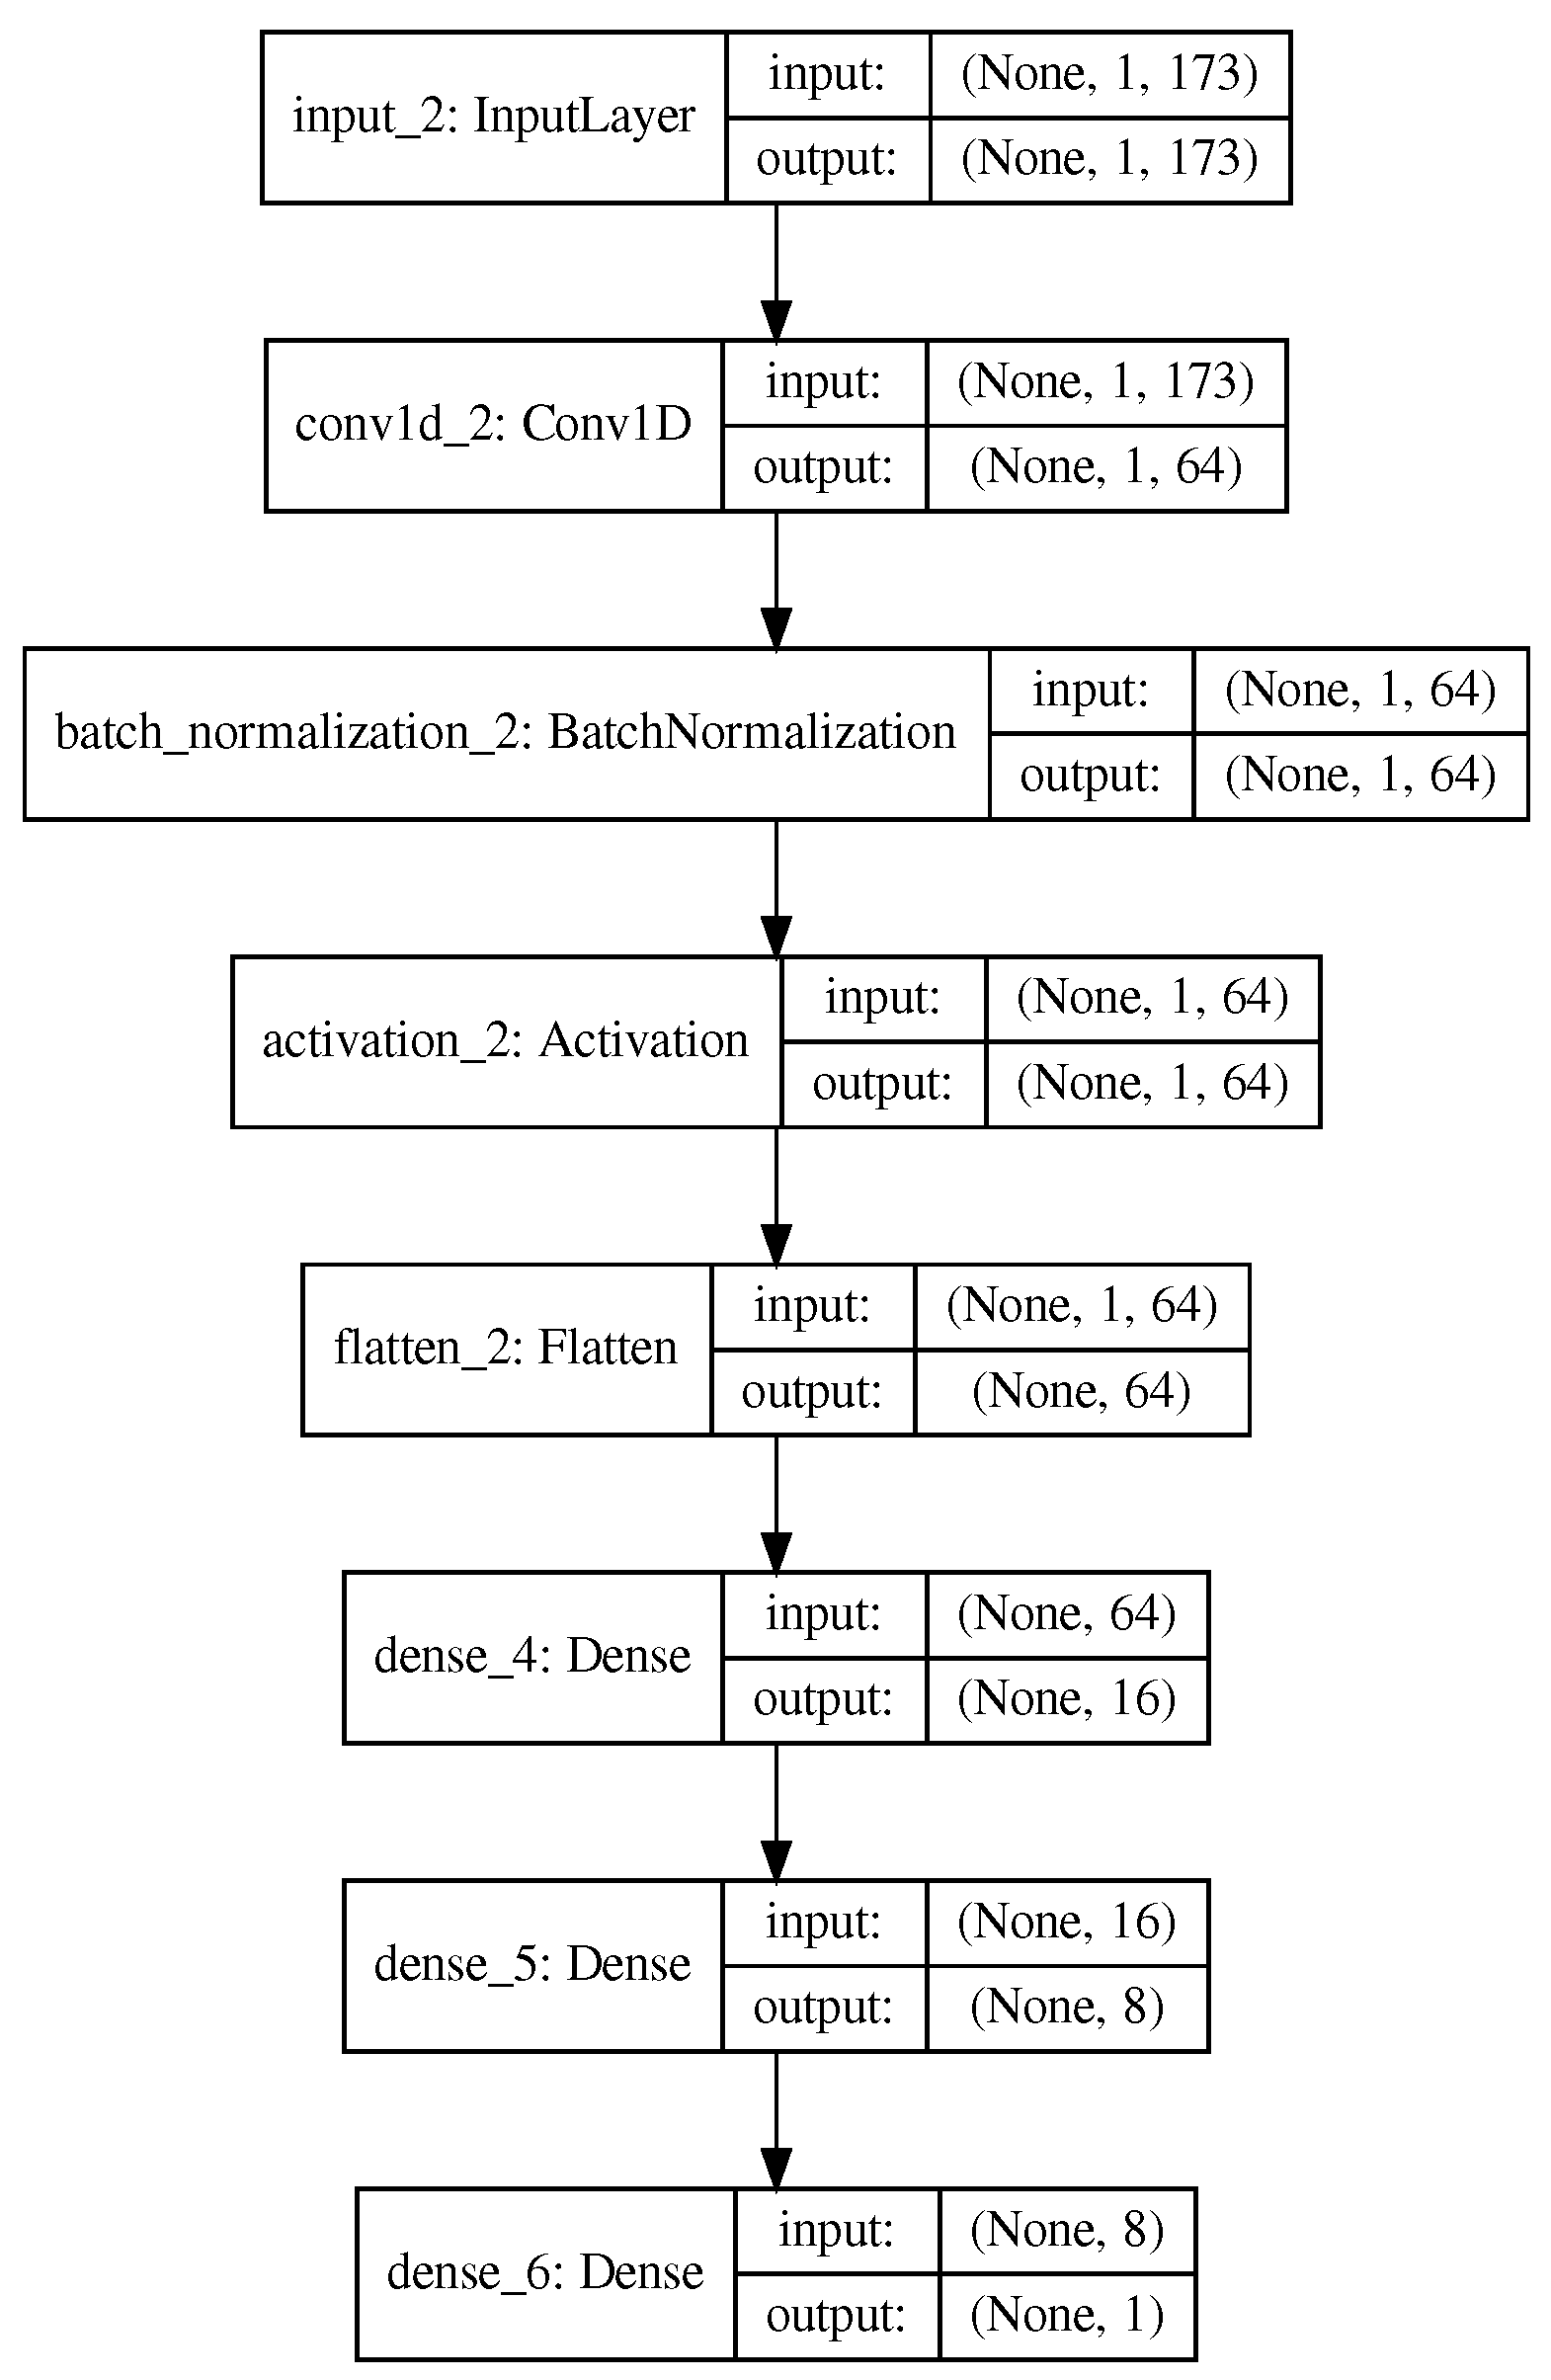
3.1. Proposed Methodology
3.2. Evaluation Metrics
4. Materials and Methods
4.1. Benchmark Dataset
4.2. Data Representation
4.3. One-Hot-Encoding
4.4. Nucleotide Chemical Properties
4.5. Electron–Ion Interaction Potential
4.6. Elastic Net
5. Conclusions
Author Contributions
Funding
Institutional Review Board Statement
Informed Consent Statement
Data Availability Statement
Conflicts of Interest
References
- Yu, H.; Dai, Z. SNNRice6mA: A deep learning method for predicting DNA N6-methyladenine sites in rice genome. Front. Genet. 2019, 10, 1071. [Google Scholar] [CrossRef] [Green Version]
- Abbas, Z.; Tayara, H.; Chong, K.T. Spinenet-6ma: A novel deep learning tool for predicting dna n6-methyladenine sites in genomes. IEEE Access 2020, 8, 201450–201457. [Google Scholar] [CrossRef]
- O’Brown, Z.K.; Greer, E.L. N6-methyladenine: A conserved and dynamic DNA mark. In DNA Methyltransferases-Role and Function; Springer: Cham, Switzerland, 2016; pp. 213–246. [Google Scholar]
- Rehman, M.U.; Chong, K.T. DNA6mA-MINT: DNA-6mA modification identification neural tool. Genes 2020, 11, 898. [Google Scholar] [CrossRef]
- Liu, B.; Weng, F.; Huang, D.S.; Chou, K.C. iRO-3wPseKNC: Identify DNA replication origins by three-window-based PseKNC. Bioinformatics 2018, 34, 3086–3093. [Google Scholar] [CrossRef] [PubMed] [Green Version]
- Abbas, Z.; Tayara, H.; Chong, K. ZayyuNet A unified deep learning model for the identification of epigenetic modifications using raw genomic sequences. IEEE/ACM Trans. Comput. Biol. Bioinform. 2021. early access. [Google Scholar] [CrossRef]
- Casadesús, J.; Low, D. Epigenetic gene regulation in the bacterial world. Microbiol. Mol. Biol. Rev. 2006, 70, 830–856. [Google Scholar] [CrossRef] [PubMed] [Green Version]
- Liang, Z.; Riaz, A.; Chachar, S.; Ding, Y.; Du, H.; Gu, X. Epigenetic modifications of mRNA and DNA in plants. Mol. Plant 2020, 13, 14–30. [Google Scholar] [CrossRef]
- Fu, Y.; Luo, G.Z.; Chen, K.; Deng, X.; Yu, M.; Han, D.; Hao, Z.; Liu, J.; Lu, X.; Doré, L.C.; et al. N6-methyldeoxyadenosine marks active transcription start sites in Chlamydomonas. Cell 2015, 161, 879–892. [Google Scholar] [CrossRef] [Green Version]
- Zhang, G.; Huang, H.; Liu, D.; Cheng, Y.; Liu, X.; Zhang, W.; Yin, R.; Zhang, D.; Zhang, P.; Liu, J.; et al. N6-methyladenine DNA modification in Drosophila. Cell 2015, 161, 893–906. [Google Scholar] [CrossRef] [Green Version]
- Greer, E.L.; Blanco, M.A.; Gu, L.; Sendinc, E.; Liu, J.; Aristizábal-Corrales, D.; Hsu, C.H.; Aravind, L.; He, C.; Shi, Y. DNA methylation on N6-adenine in C. elegans. Cell 2015, 161, 868–878. [Google Scholar] [CrossRef] [PubMed] [Green Version]
- Beh, L.Y.; Debelouchina, G.T.; Clay, D.M.; Thompson, R.E.; Lindblad, K.A.; Hutton, E.R.; Bracht, J.R.; Sebra, R.P.; Muir, T.W.; Landweber, L.F. Identification of a DNA N6-adenine methyltransferase complex and its impact on chromatin organization. Cell 2019, 177, 1781–1796. [Google Scholar] [CrossRef]
- Zhang, Q.; Liang, Z.; Cui, X.; Ji, C.; Li, Y.; Zhang, P.; Liu, J.; Riaz, A.; Yao, P.; Liu, M.; et al. N6-methyladenine DNA methylation in Japonica and Indica rice genomes and its association with gene expression, plant development, and stress responses. Mol. Plant 2018, 11, 1492–1508. [Google Scholar] [CrossRef] [PubMed] [Green Version]
- Liang, Z.; Shen, L.; Cui, X.; Bao, S.; Geng, Y.; Yu, G.; Liang, F.; Xie, S.; Lu, T.; Gu, X.; et al. DNA N6-adenine methylation in Arabidopsis thaliana. Dev. Cell 2018, 45, 406–416. [Google Scholar] [CrossRef] [Green Version]
- Wang, W.; Xu, L.; Hu, L.; Chong, J.; He, C.; Wang, D. Epigenetic DNA modification N 6-methyladenine causes site-specific RNA polymerase II transcriptional pausing. J. Am. Chem. Soc. 2017, 139, 14436–14442. [Google Scholar] [CrossRef]
- Mondo, S.J.; Dannebaum, R.O.; Kuo, R.C.; Louie, K.B.; Bewick, A.J.; LaButti, K.; Haridas, S.; Kuo, A.; Salamov, A.; Ahrendt, S.R.; et al. Widespread adenine N6-methylation of active genes in fungi. Nat. Genet. 2017, 49, 964–968. [Google Scholar] [CrossRef] [PubMed]
- Pomraning, K.R.; Smith, K.M.; Freitag, M. Genome-wide high throughput analysis of DNA methylation in eukaryotes. Methods 2009, 47, 142–150. [Google Scholar] [CrossRef] [PubMed]
- Krais, A.M.; Cornelius, M.G.; Schmeiser, H.H. Genomic N6-methyladenine determination by MEKC with LIF. Electrophoresis 2010, 31, 3548–3551. [Google Scholar] [CrossRef] [PubMed]
- Chen, W.; Lv, H.; Nie, F.; Lin, H. i6mA-Pred: Identifying DNA N6-methyladenine sites in the rice genome. Bioinformatics 2019, 35, 2796–2800. [Google Scholar] [CrossRef]
- Pian, C.; Zhang, G.; Li, F.; Fan, X. MM-6mAPred: Identifying DNA N6-methyladenine sites based on Markov model. Bioinformatics 2020, 36, 388–392. [Google Scholar] [CrossRef]
- Tahir, M.; Tayara, H.; Chong, K.T. iDNA6mA (5-step rule): Identification of DNA N6-methyladenine sites in the rice genome by intelligent computational model via Chou’s 5-step rule. Chemom. Intell. Lab. Syst. 2019, 189, 96–101. [Google Scholar] [CrossRef]
- Rahman, M. FastFeatGen: Faster Parallel Feature Extraction from Genome Sequences and Efficient Prediction of DNA N6-Methyladenine Sites. In Proceedings of the International Conference on Computational Advances in Bio and Medical Sciences, Miami, FL, USA, 15–17 November 2019; pp. 52–64. [Google Scholar]
- Wahab, A.; Ali, S.D.; Tayara, H.; Chong, K.T. iIM-CNN: Intelligent identifier of 6mA sites on different species by using convolution neural network. IEEE Access 2019, 7, 178577–178583. [Google Scholar] [CrossRef]
- Lv, H.; Dao, F.Y.; Guan, Z.X.; Zhang, D.; Tan, J.X.; Zhang, Y.; Chen, W.; Lin, H. iDNA6mA-Rice: A computational tool for detecting N6-methyladenine sites in rice. Front. Genet. 2019, 10, 793. [Google Scholar] [CrossRef]
- Raymond, O.; Gouzy, J.; Just, J.; Badouin, H.; Verdenaud, M.; Lemainque, A.; Vergne, P.; Moja, S.; Choisne, N.; Pont, C.; et al. The Rosa genome provides new insights into the domestication of modern roses. Nat. Genet. 2018, 50, 772–777. [Google Scholar] [CrossRef] [PubMed]
- Edger, P.P.; VanBuren, R.; Colle, M.; Poorten, T.J.; Wai, C.M.; Niederhuth, C.E.; Alger, E.I.; Ou, S.; Acharya, C.B.; Wang, J.; et al. Single-molecule sequencing and optical mapping yields an improved genome of woodland strawberry (Fragaria vesca) with chromosome-scale contiguity. Gigascience 2018, 7, gix124. [Google Scholar] [CrossRef] [Green Version]
- Saito, T.; Rehmsmeier, M. The precision-recall plot is more informative than the ROC plot when evaluating binary classifiers on imbalanced datasets. PLoS ONE 2015, 10, e0118432. [Google Scholar] [CrossRef] [PubMed] [Green Version]
- Nwankpa, C.; Ijomah, W.; Gachagan, A.; Marshall, S. Activation functions: Comparison of trends in practice and research for deep learning. arXiv 2018, arXiv:1811.03378. [Google Scholar]
- Rafferty, J.; Shellito, P.; Hyman, N.H.; Buie, W.D. Practice parameters for sigmoid diverticulitis. Dis. Colon Rectum 2006, 49, 939–944. [Google Scholar] [CrossRef]
- Abbas, Z.; Tayara, H.; Zou, Q.; Chong, K.T. TS-m6A-DL: Tissue-specific identification of N6-methyladenosine sites using a universal deep learning model. Comput. Struct. Biotechnol. J. 2021, 19, 4619–4625. [Google Scholar] [CrossRef]
- Shujaat, M.; Lee, S.B.; Tayara, H.; Chong, K.T. Cr-prom: A convolutional neural network-based model for the prediction of rice promoters. IEEE Access 2021, 9, 81485–81491. [Google Scholar] [CrossRef]
- Rehman, M.U.; Tayara, H.; Chong, K.T. DCNN-4mC: Densely connected neural network based N4-methylcytosine site prediction in multiple species. Comput. Struct. Biotechnol. J. 2021, 19, 6009–6019. [Google Scholar] [CrossRef]
- Chen, W.; Yang, H.; Feng, P.; Ding, H.; Lin, H. iDNA4mC: Identifying DNA N4-methylcytosine sites based on nucleotide chemical properties. Bioinformatics 2017, 33, 3518–3523. [Google Scholar] [CrossRef] [Green Version]
- Lalović, D.; Veljković, V. The global average DNA base composition of coding regions may be determined by the electron-ion interaction potential. Biosystems 1990, 23, 311–316. [Google Scholar] [CrossRef]
- Zou, H.; Hastie, T. Regularization and variable selection via the elastic net. J. R. Stat. Soc. Ser. B (Stat. Methodol.) 2005, 67, 301–320. [Google Scholar] [CrossRef] [Green Version]
- de Vos, F.; Koini, M.; Schouten, T.M.; Seiler, S.; van der Grond, J.; Lechner, A.; Schmidt, R.; de Rooij, M.; Rombouts, S.A. A comprehensive analysis of resting state fMRI measures to classify individual patients with Alzheimer’s disease. Neuroimage 2018, 167, 62–72. [Google Scholar] [CrossRef] [Green Version]
- de Vos, F.; Schouten, T.M.; Hafkemeijer, A.; Dopper, E.G.; van Swieten, J.C.; de Rooij, M.; van der Grond, J.; Rombouts, S.A. Combining multiple anatomical MRI measures improves Alzheimer’s disease classification. Hum. Brain Mapp. 2016, 37, 1920–1929. [Google Scholar] [CrossRef] [PubMed]
- Schouten, T.M.; Koini, M.; de Vos, F.; Seiler, S.; de Rooij, M.; Lechner, A.; Schmidt, R.; van den Heuvel, M.; van der Grond, J.; Rombouts, S.A. Individual classification of Alzheimer’s disease with diffusion magnetic resonance imaging. Neuroimage 2017, 152, 476–481. [Google Scholar] [CrossRef] [PubMed] [Green Version]


| Methods | Acc | Sn | Sp | MCC | AUC |
|---|---|---|---|---|---|
| SNNRice6mA | 0.9204 | 0.9433 | 0.8975 | 0.84 | 0.97 |
| DNA6mA-MINT | 0.9258 | 0.9012 | 0.9306 | 0.85 | 0.97 |
| SpineNet-6mA | 0.9431 | 0.9571 | 0.9292 | 0.88 | 0.98 |
| Proposed |
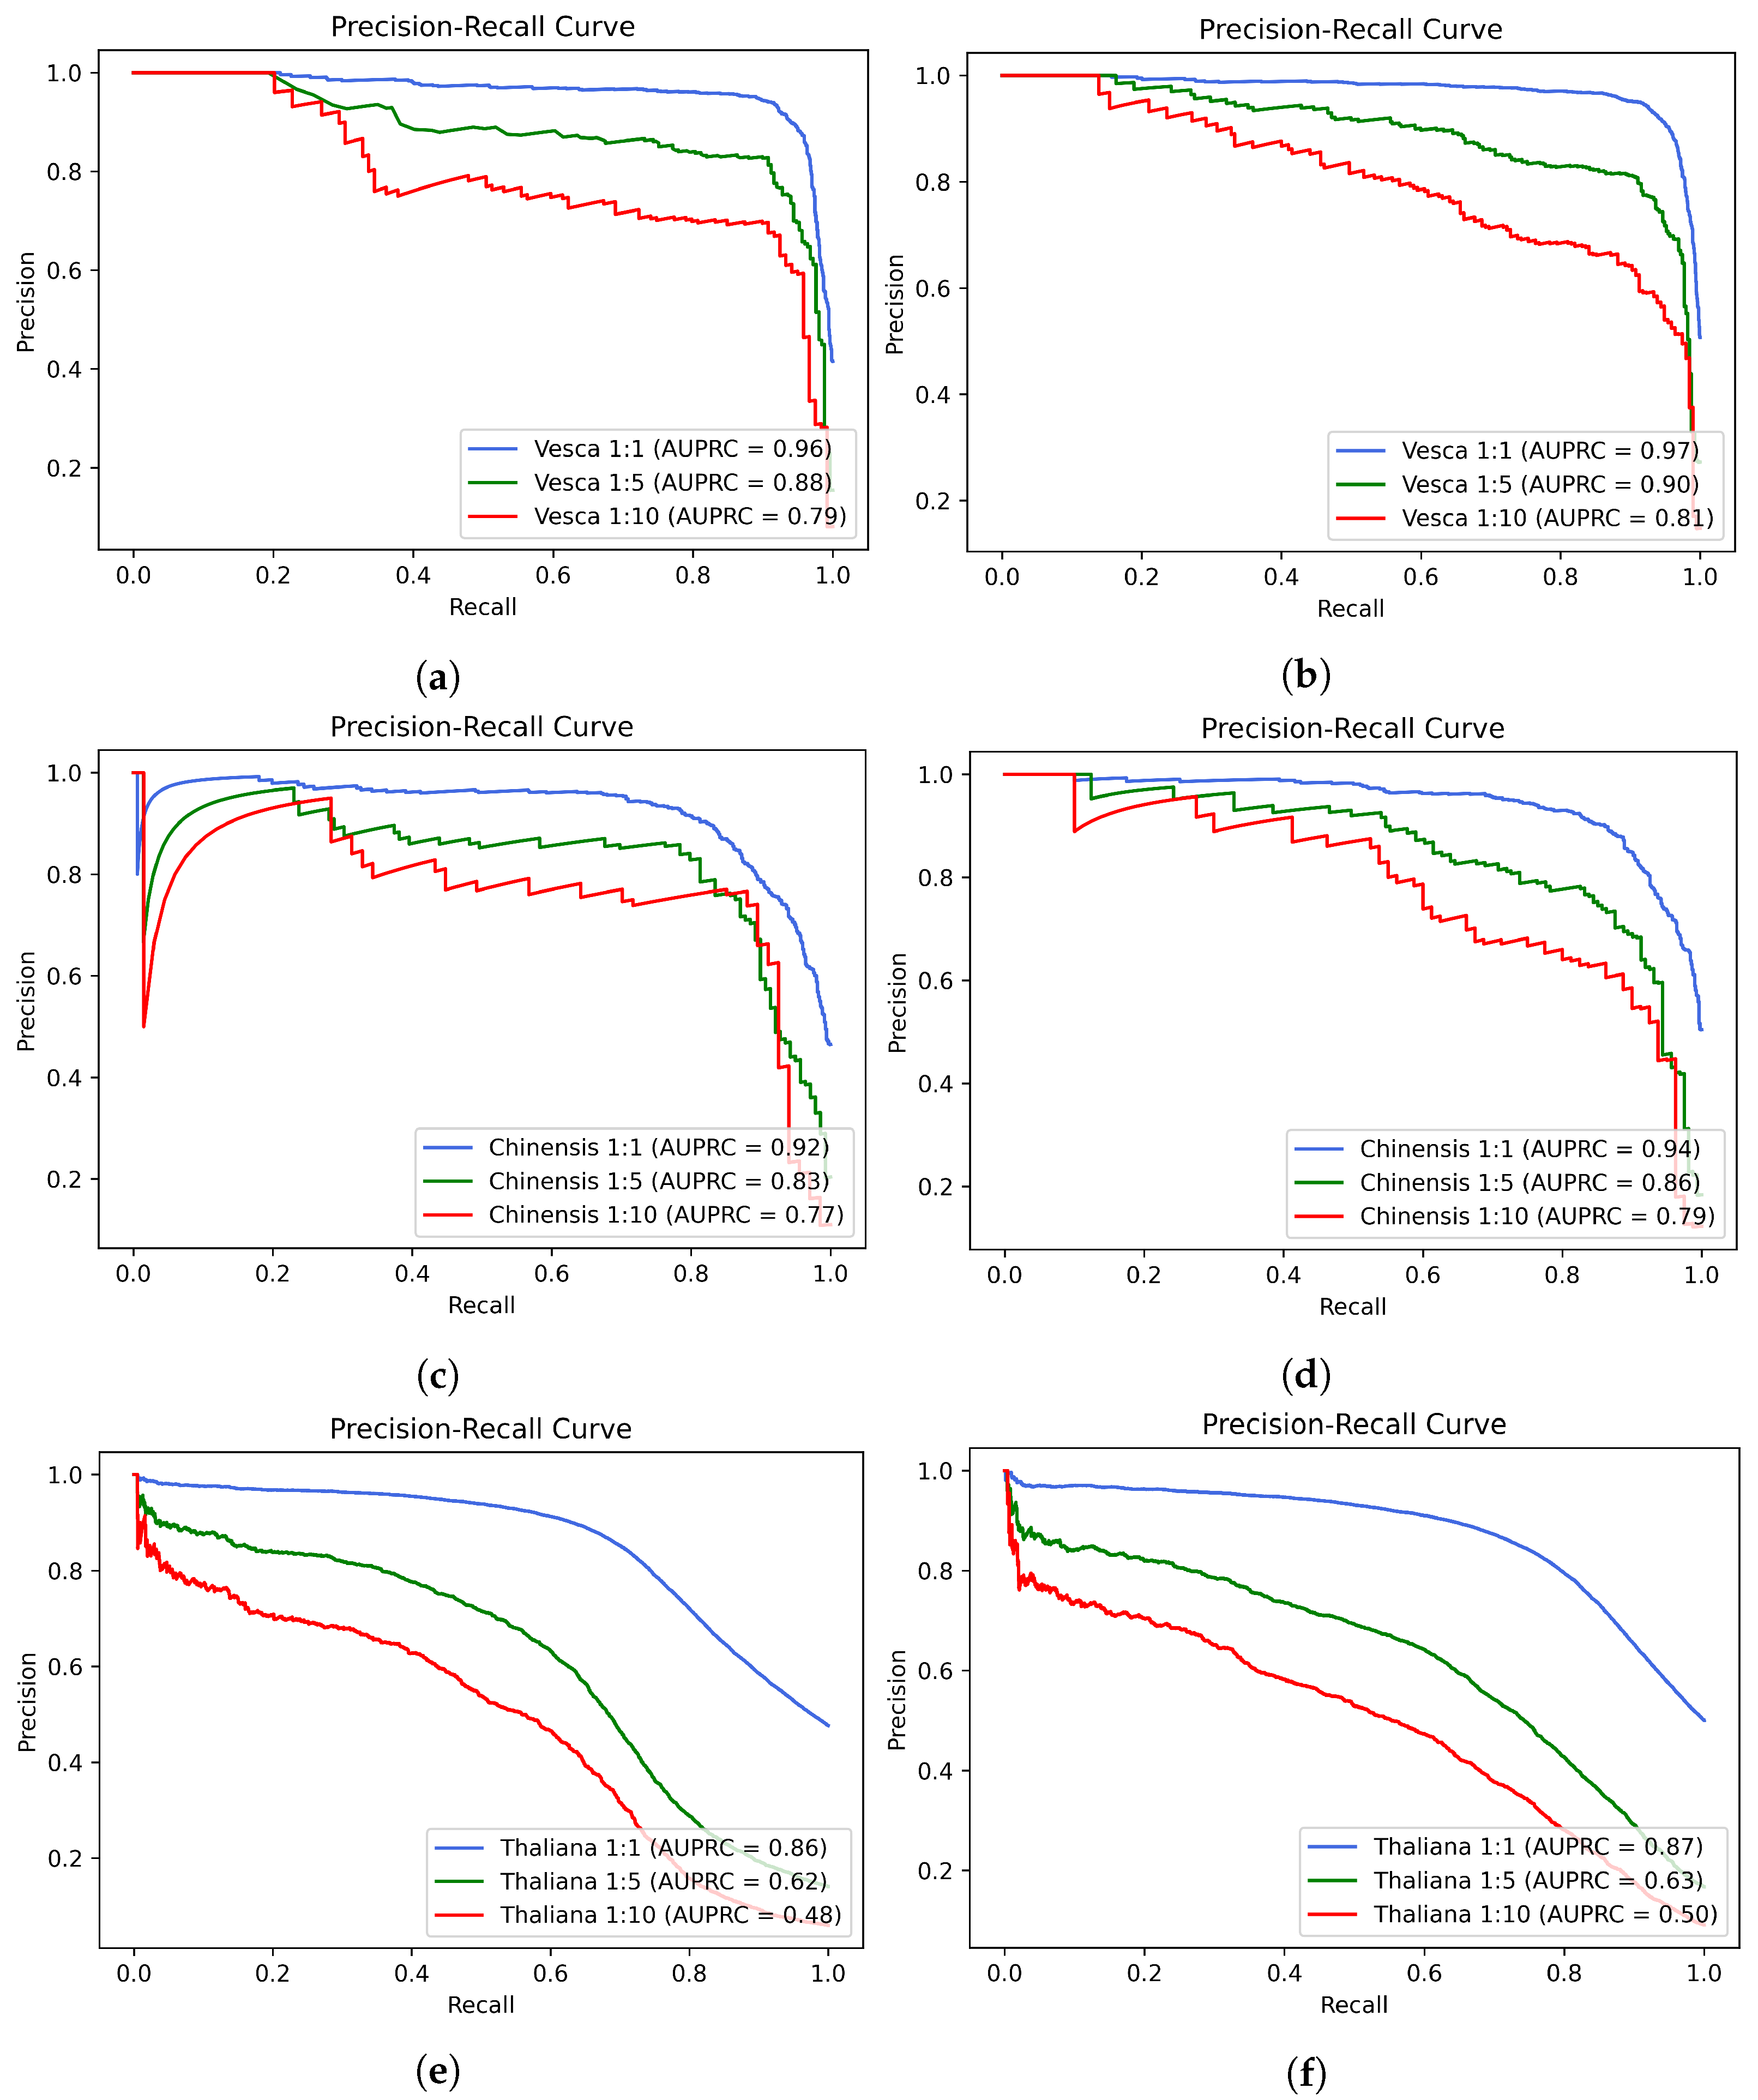
| Methods | R. chinensis | F. vesca | A. thaliana | |||
|---|---|---|---|---|---|---|
| Accuracy (%) | MCC | Accuracy (%) | MCC | Accuracy (%) | MCC | |
| SNNRice6mA-large | 81.13 | 0.62 | 87.84 | 0.75 | 77.6 | 0.57 |
| DNA6mA-MINT | 82.43 | 0.64 | 88.11 | 0.76 | 76.21 | 0.56 |
| SpineNet-6mA | 85.20 | 0.70 | 90.30 | 0.80 | 76.15 | 0.56 |
| Proposed | 87.75 | 0.75 | 93.20 | 0.86 | 79.14 | 0.60 |
| Dataset | Pos Samples | Neg Samples | Total | Family |
|---|---|---|---|---|
| Rice-Lv | 154,000 | 154,000 | 308,000 | rice |
| F. vesca | 1966 | 1966 | 3932 | rosaceae |
| R. chinensis | 813 | 813 | 1626 | rosaceae |
| A. thaliana | 31,873 | 31,873 | 63,746 | brassicaceae |
Publisher’s Note: MDPI stays neutral with regard to jurisdictional claims in published maps and institutional affiliations. |
© 2022 by the authors. Licensee MDPI, Basel, Switzerland. This article is an open access article distributed under the terms and conditions of the Creative Commons Attribution (CC BY) license (https://creativecommons.org/licenses/by/4.0/).
Share and Cite
Abbas, Z.; Tayara, H.; Chong, K.T. ENet-6mA: Identification of 6mA Modification Sites in Plant Genomes Using ElasticNet and Neural Networks. Int. J. Mol. Sci. 2022, 23, 8314. https://doi.org/10.3390/ijms23158314
Abbas Z, Tayara H, Chong KT. ENet-6mA: Identification of 6mA Modification Sites in Plant Genomes Using ElasticNet and Neural Networks. International Journal of Molecular Sciences. 2022; 23(15):8314. https://doi.org/10.3390/ijms23158314
Chicago/Turabian StyleAbbas, Zeeshan, Hilal Tayara, and Kil To Chong. 2022. "ENet-6mA: Identification of 6mA Modification Sites in Plant Genomes Using ElasticNet and Neural Networks" International Journal of Molecular Sciences 23, no. 15: 8314. https://doi.org/10.3390/ijms23158314