
Smad8 Is Increased in Duchenne Muscular Dystrophy and Suppresses miR-1, miR-133a, and miR-133b

 , and
, and 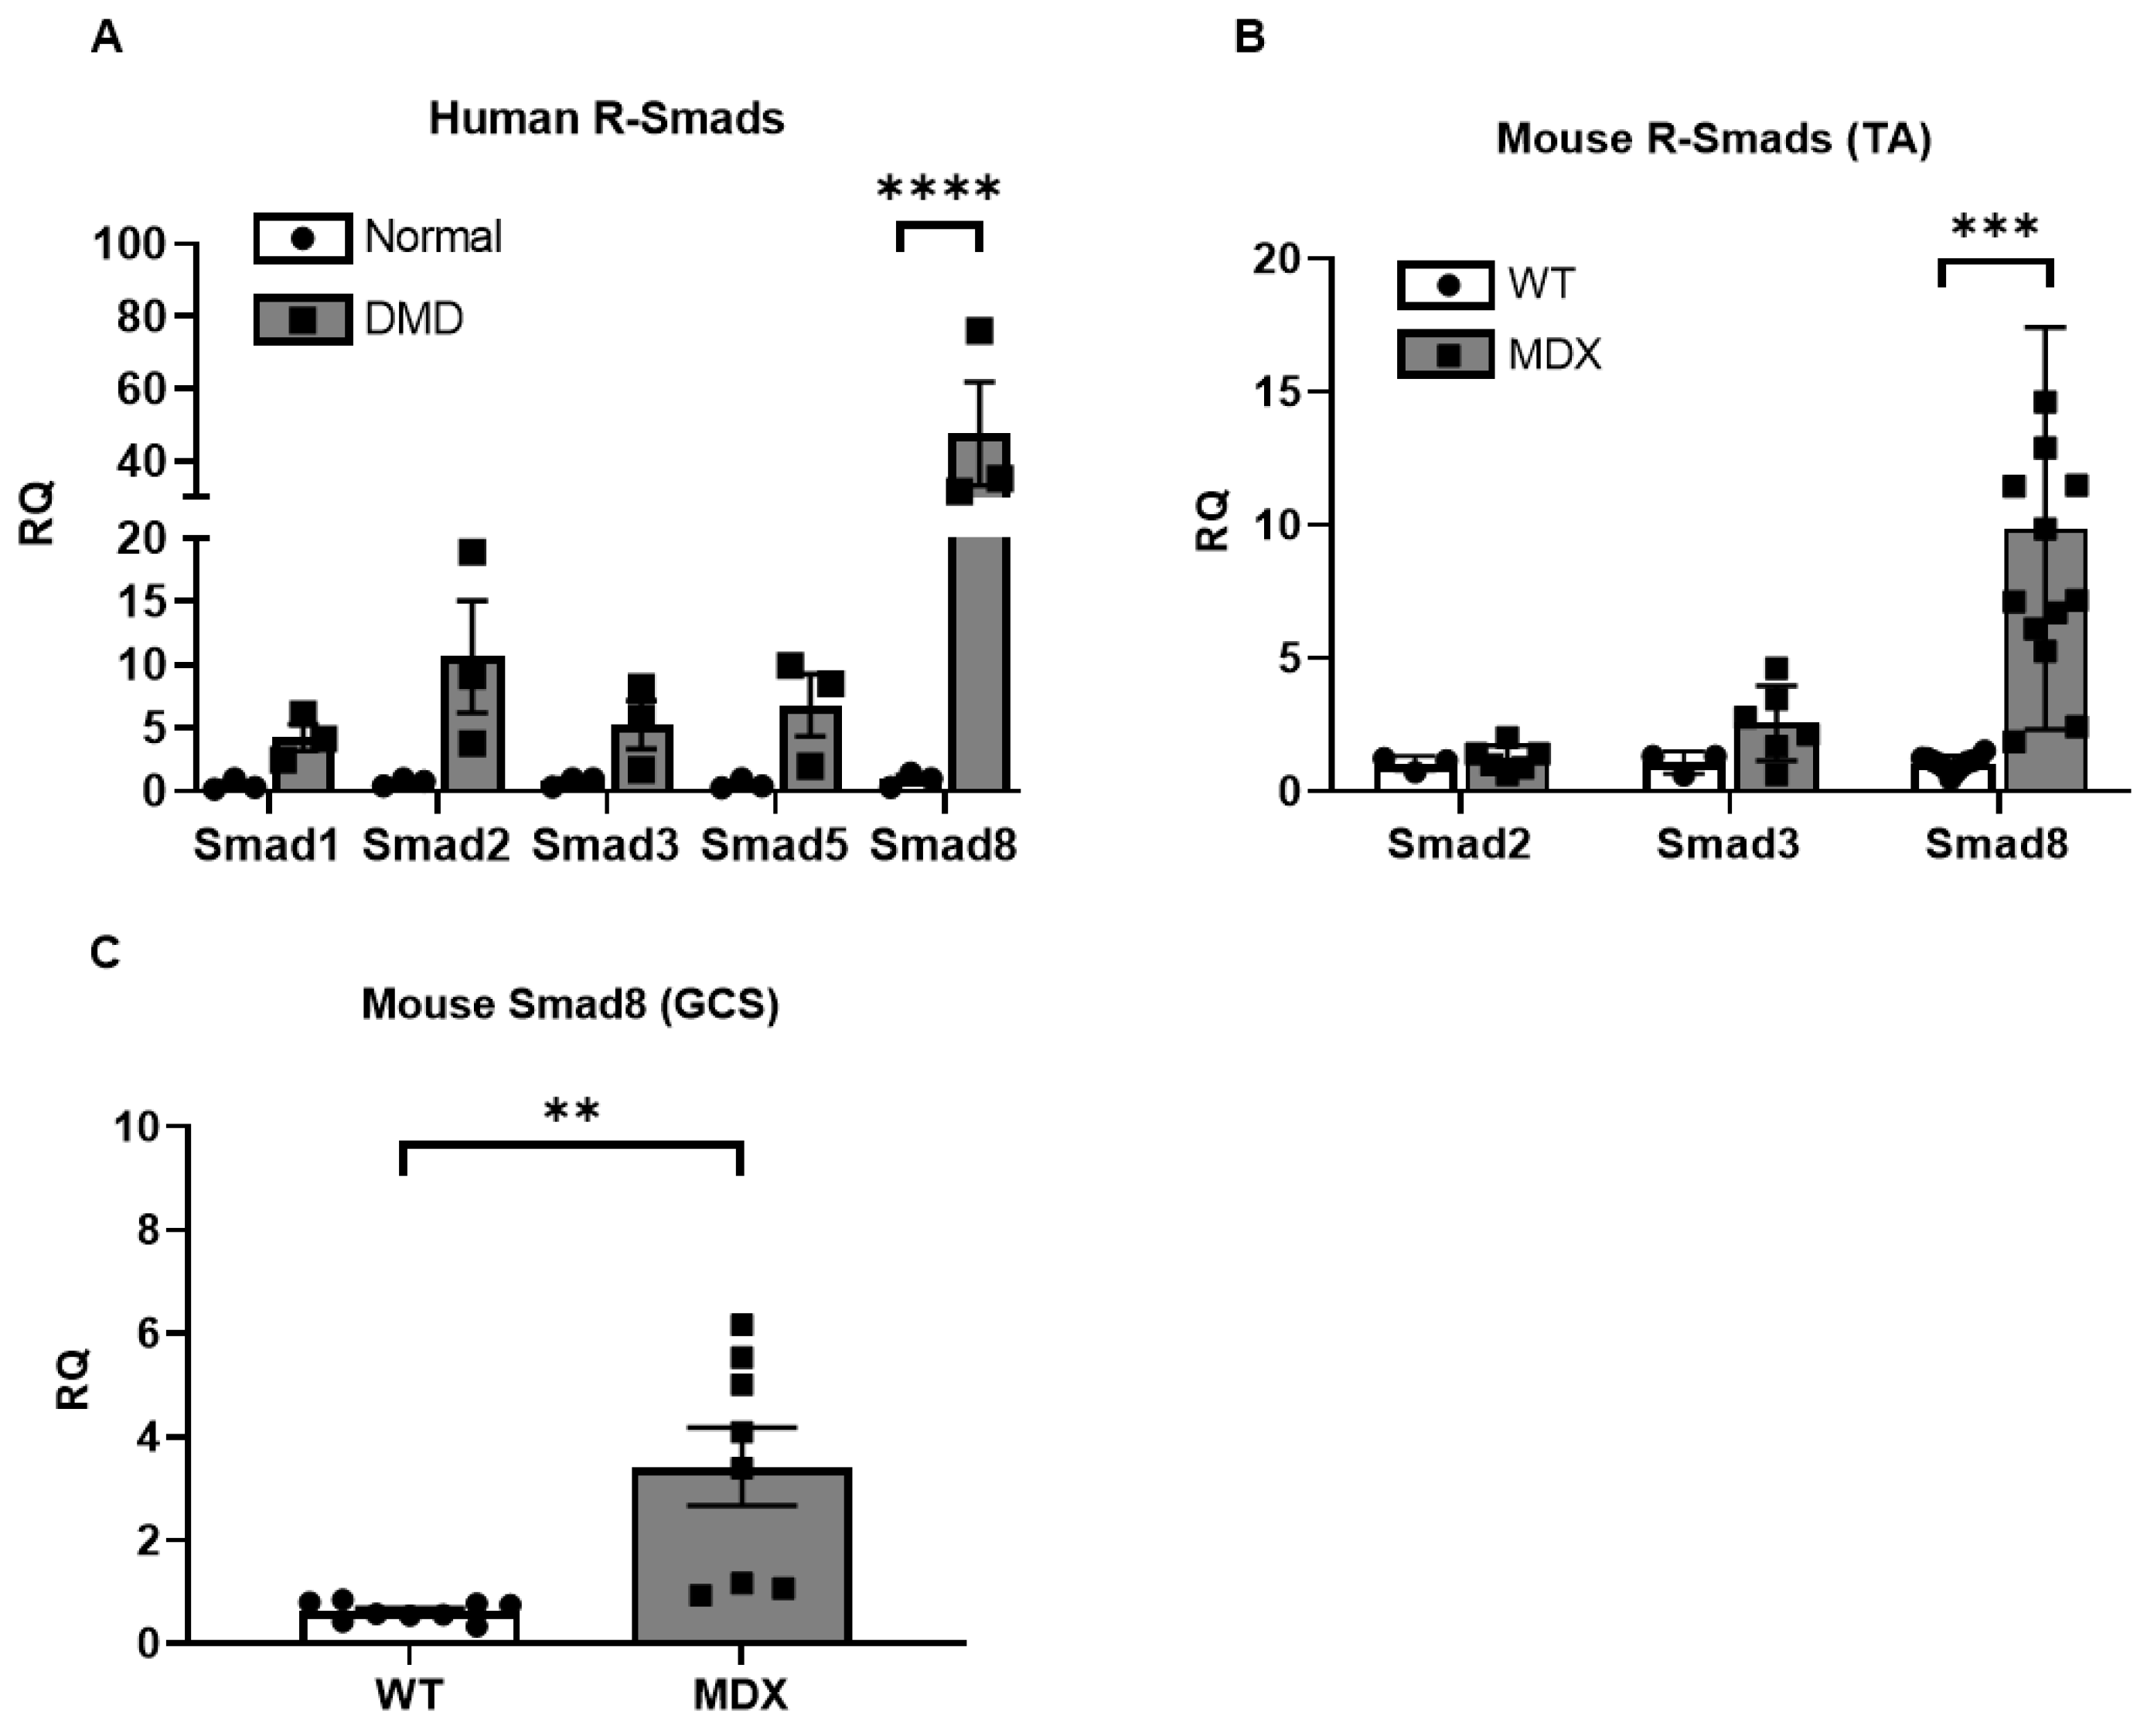
Abstract
:1. Introduction
2. Results
2.1. Smad8 Expression Is Increased in Human DMD and mdx5cv Skeletal Muscles
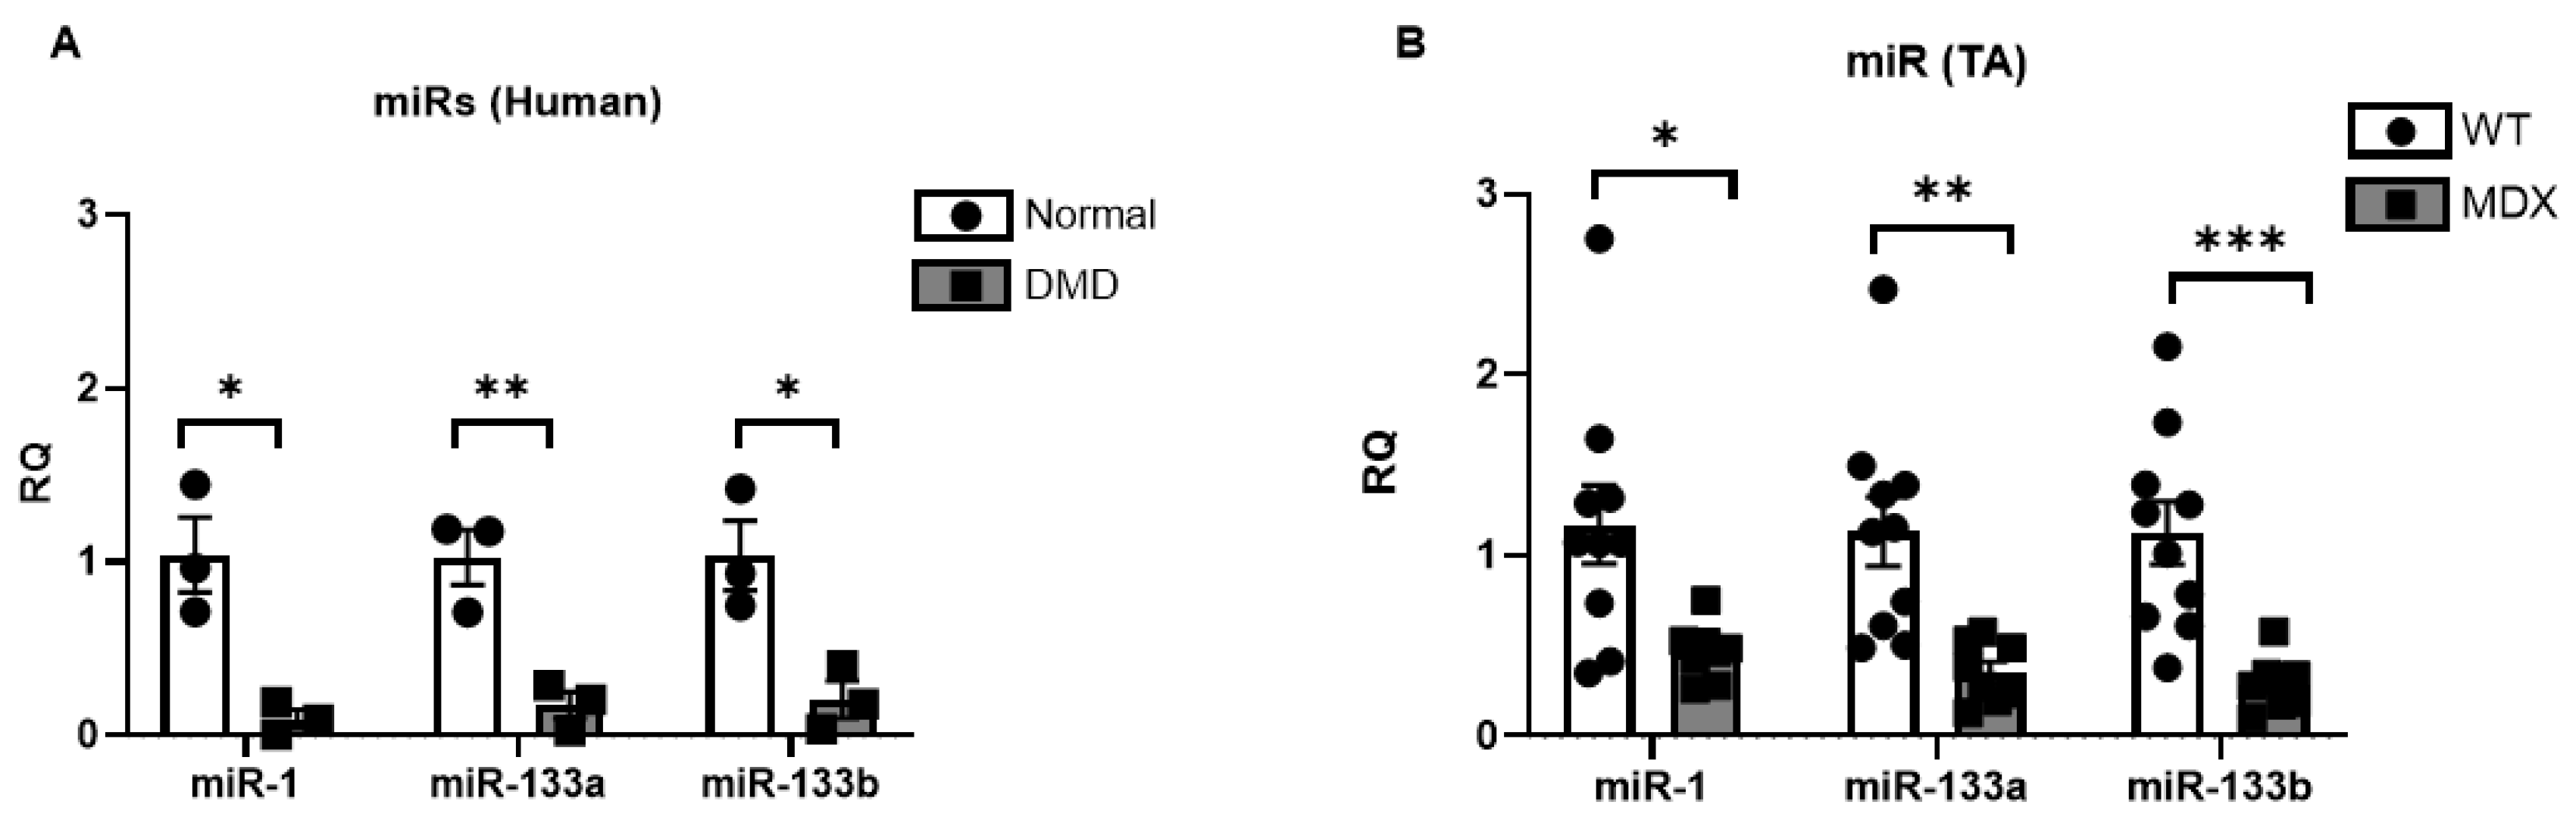
2.2. miR-1, miR-133a, and miR-133b Are Repressed in Human DMD and mdx5cv Skeletal Muscles
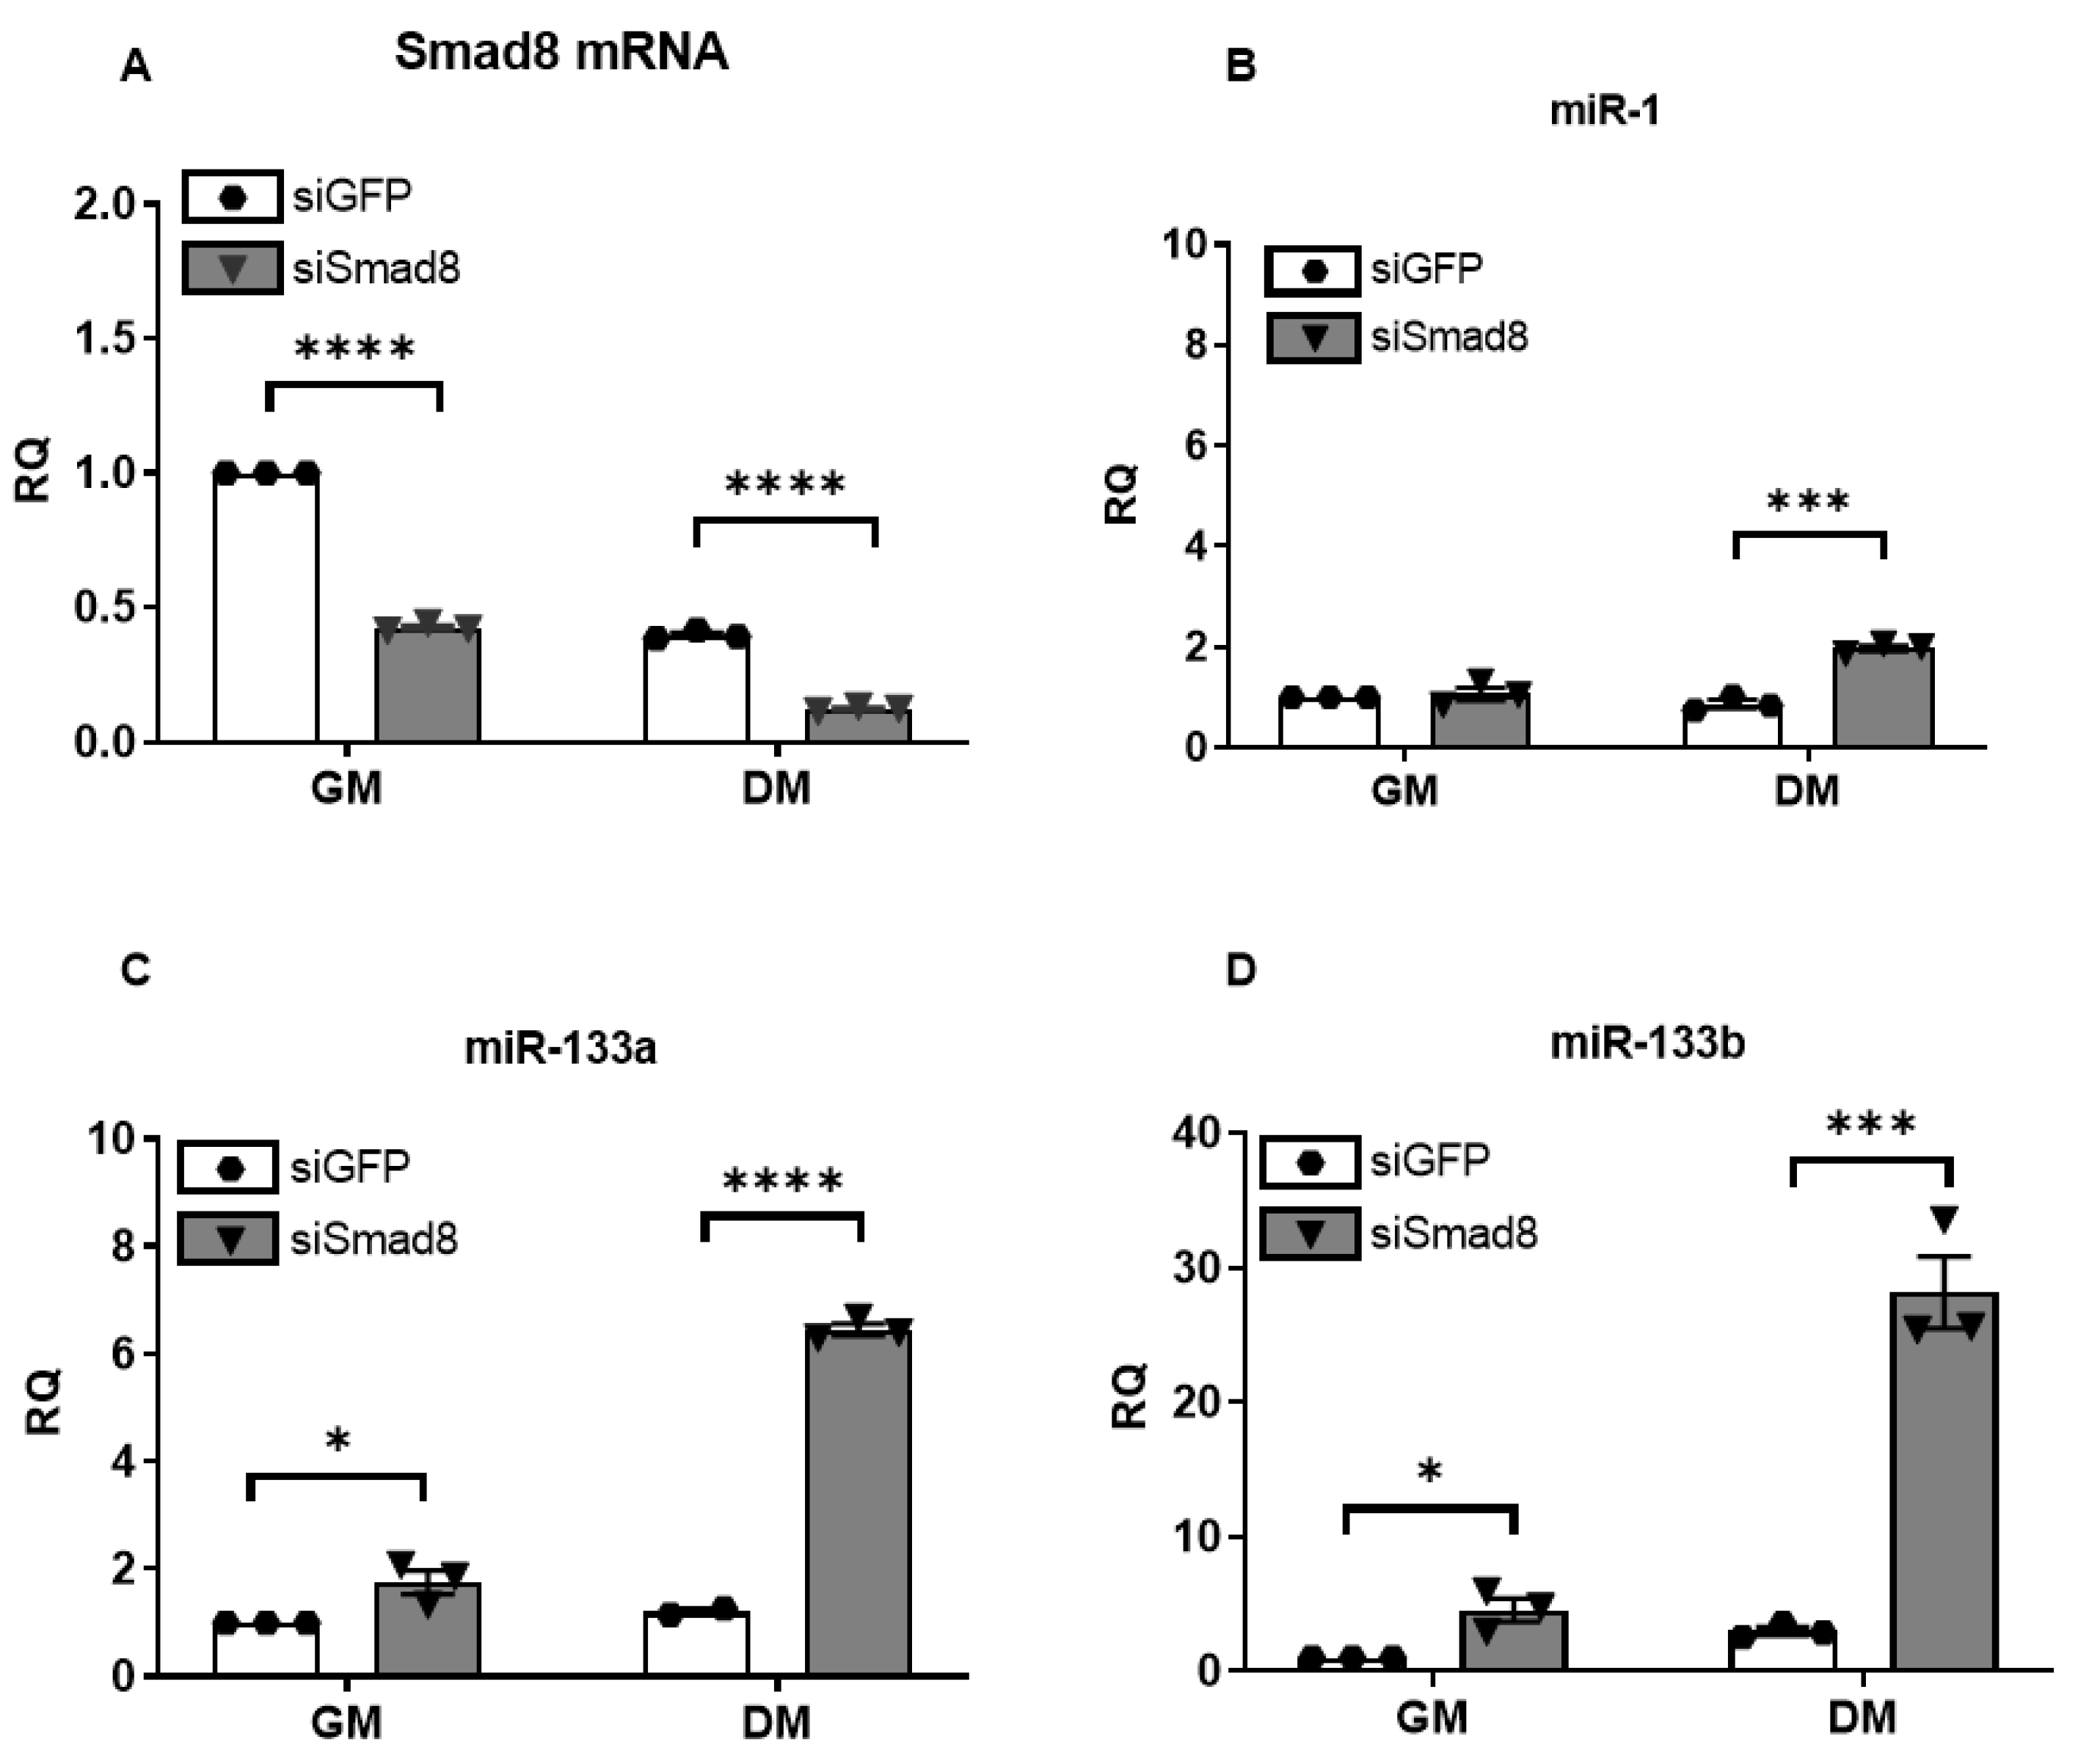
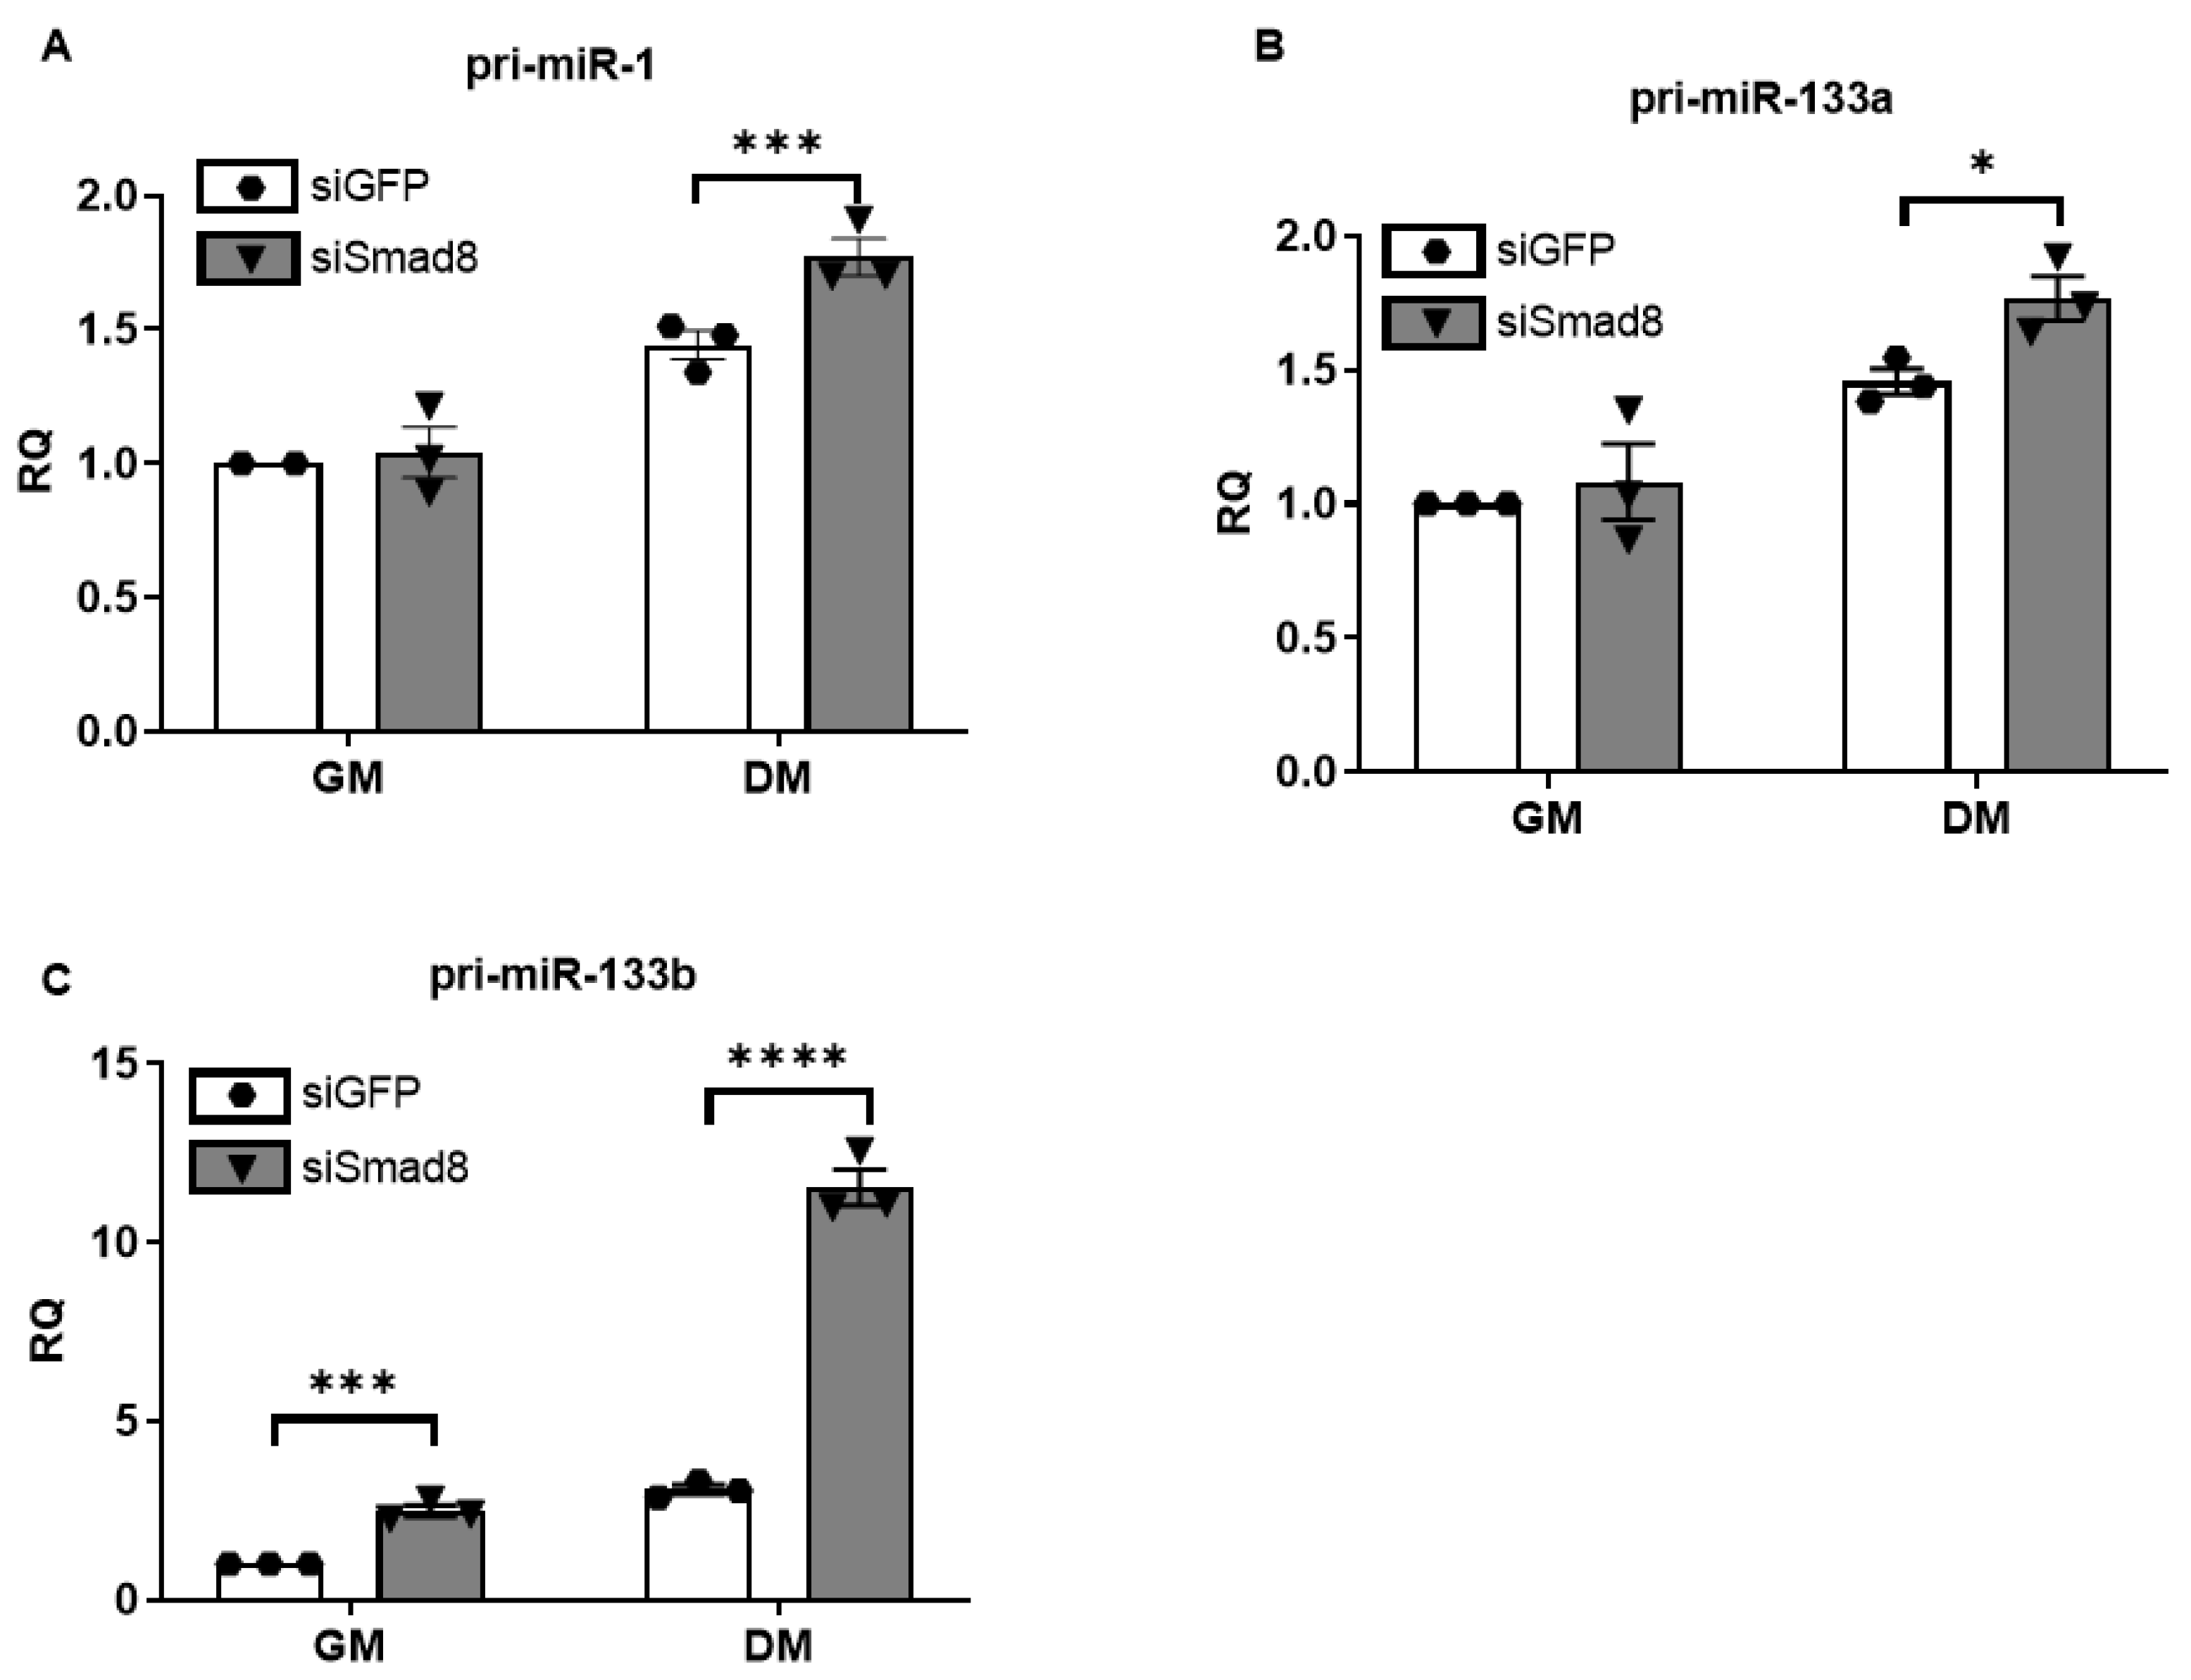
2.3. Silencing Smad8 Increases miR-1, miR-133a, and miR-133b
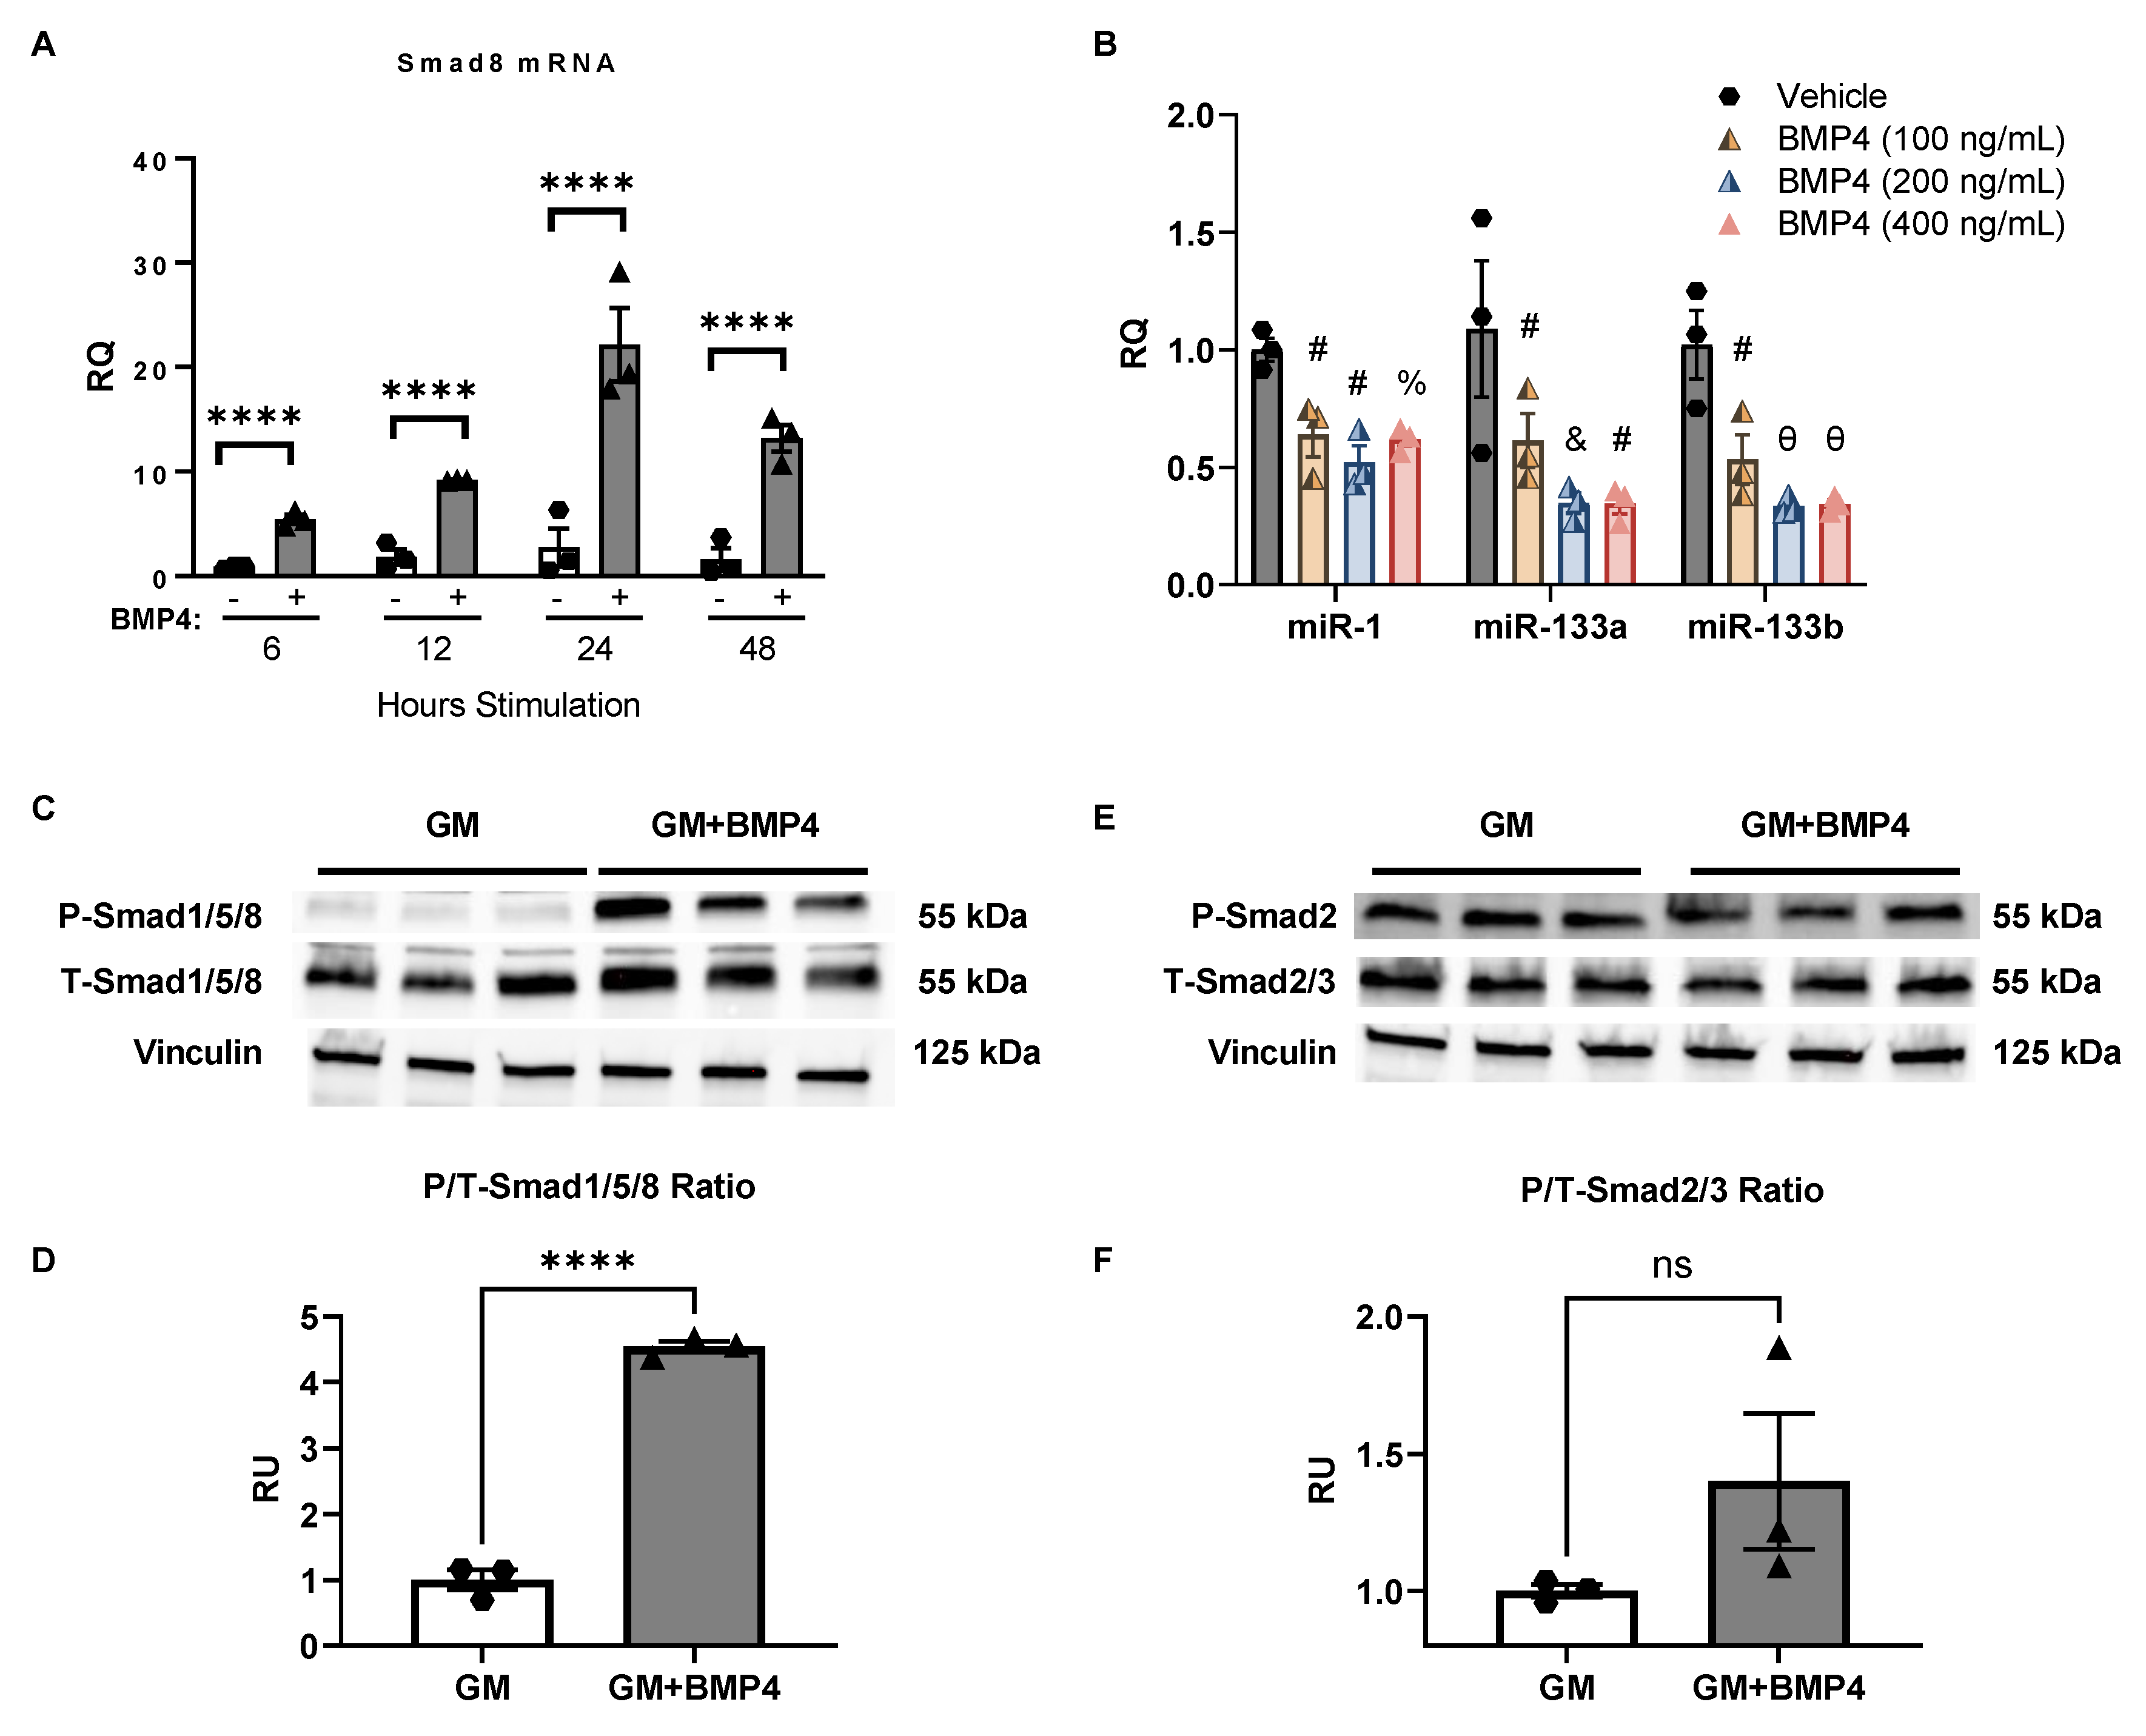
2.4. BMP4 Stimulation Induces Smad8 Expression in C2C12 Cells and Suppresses miR-1, miR-133a, and miR-133b
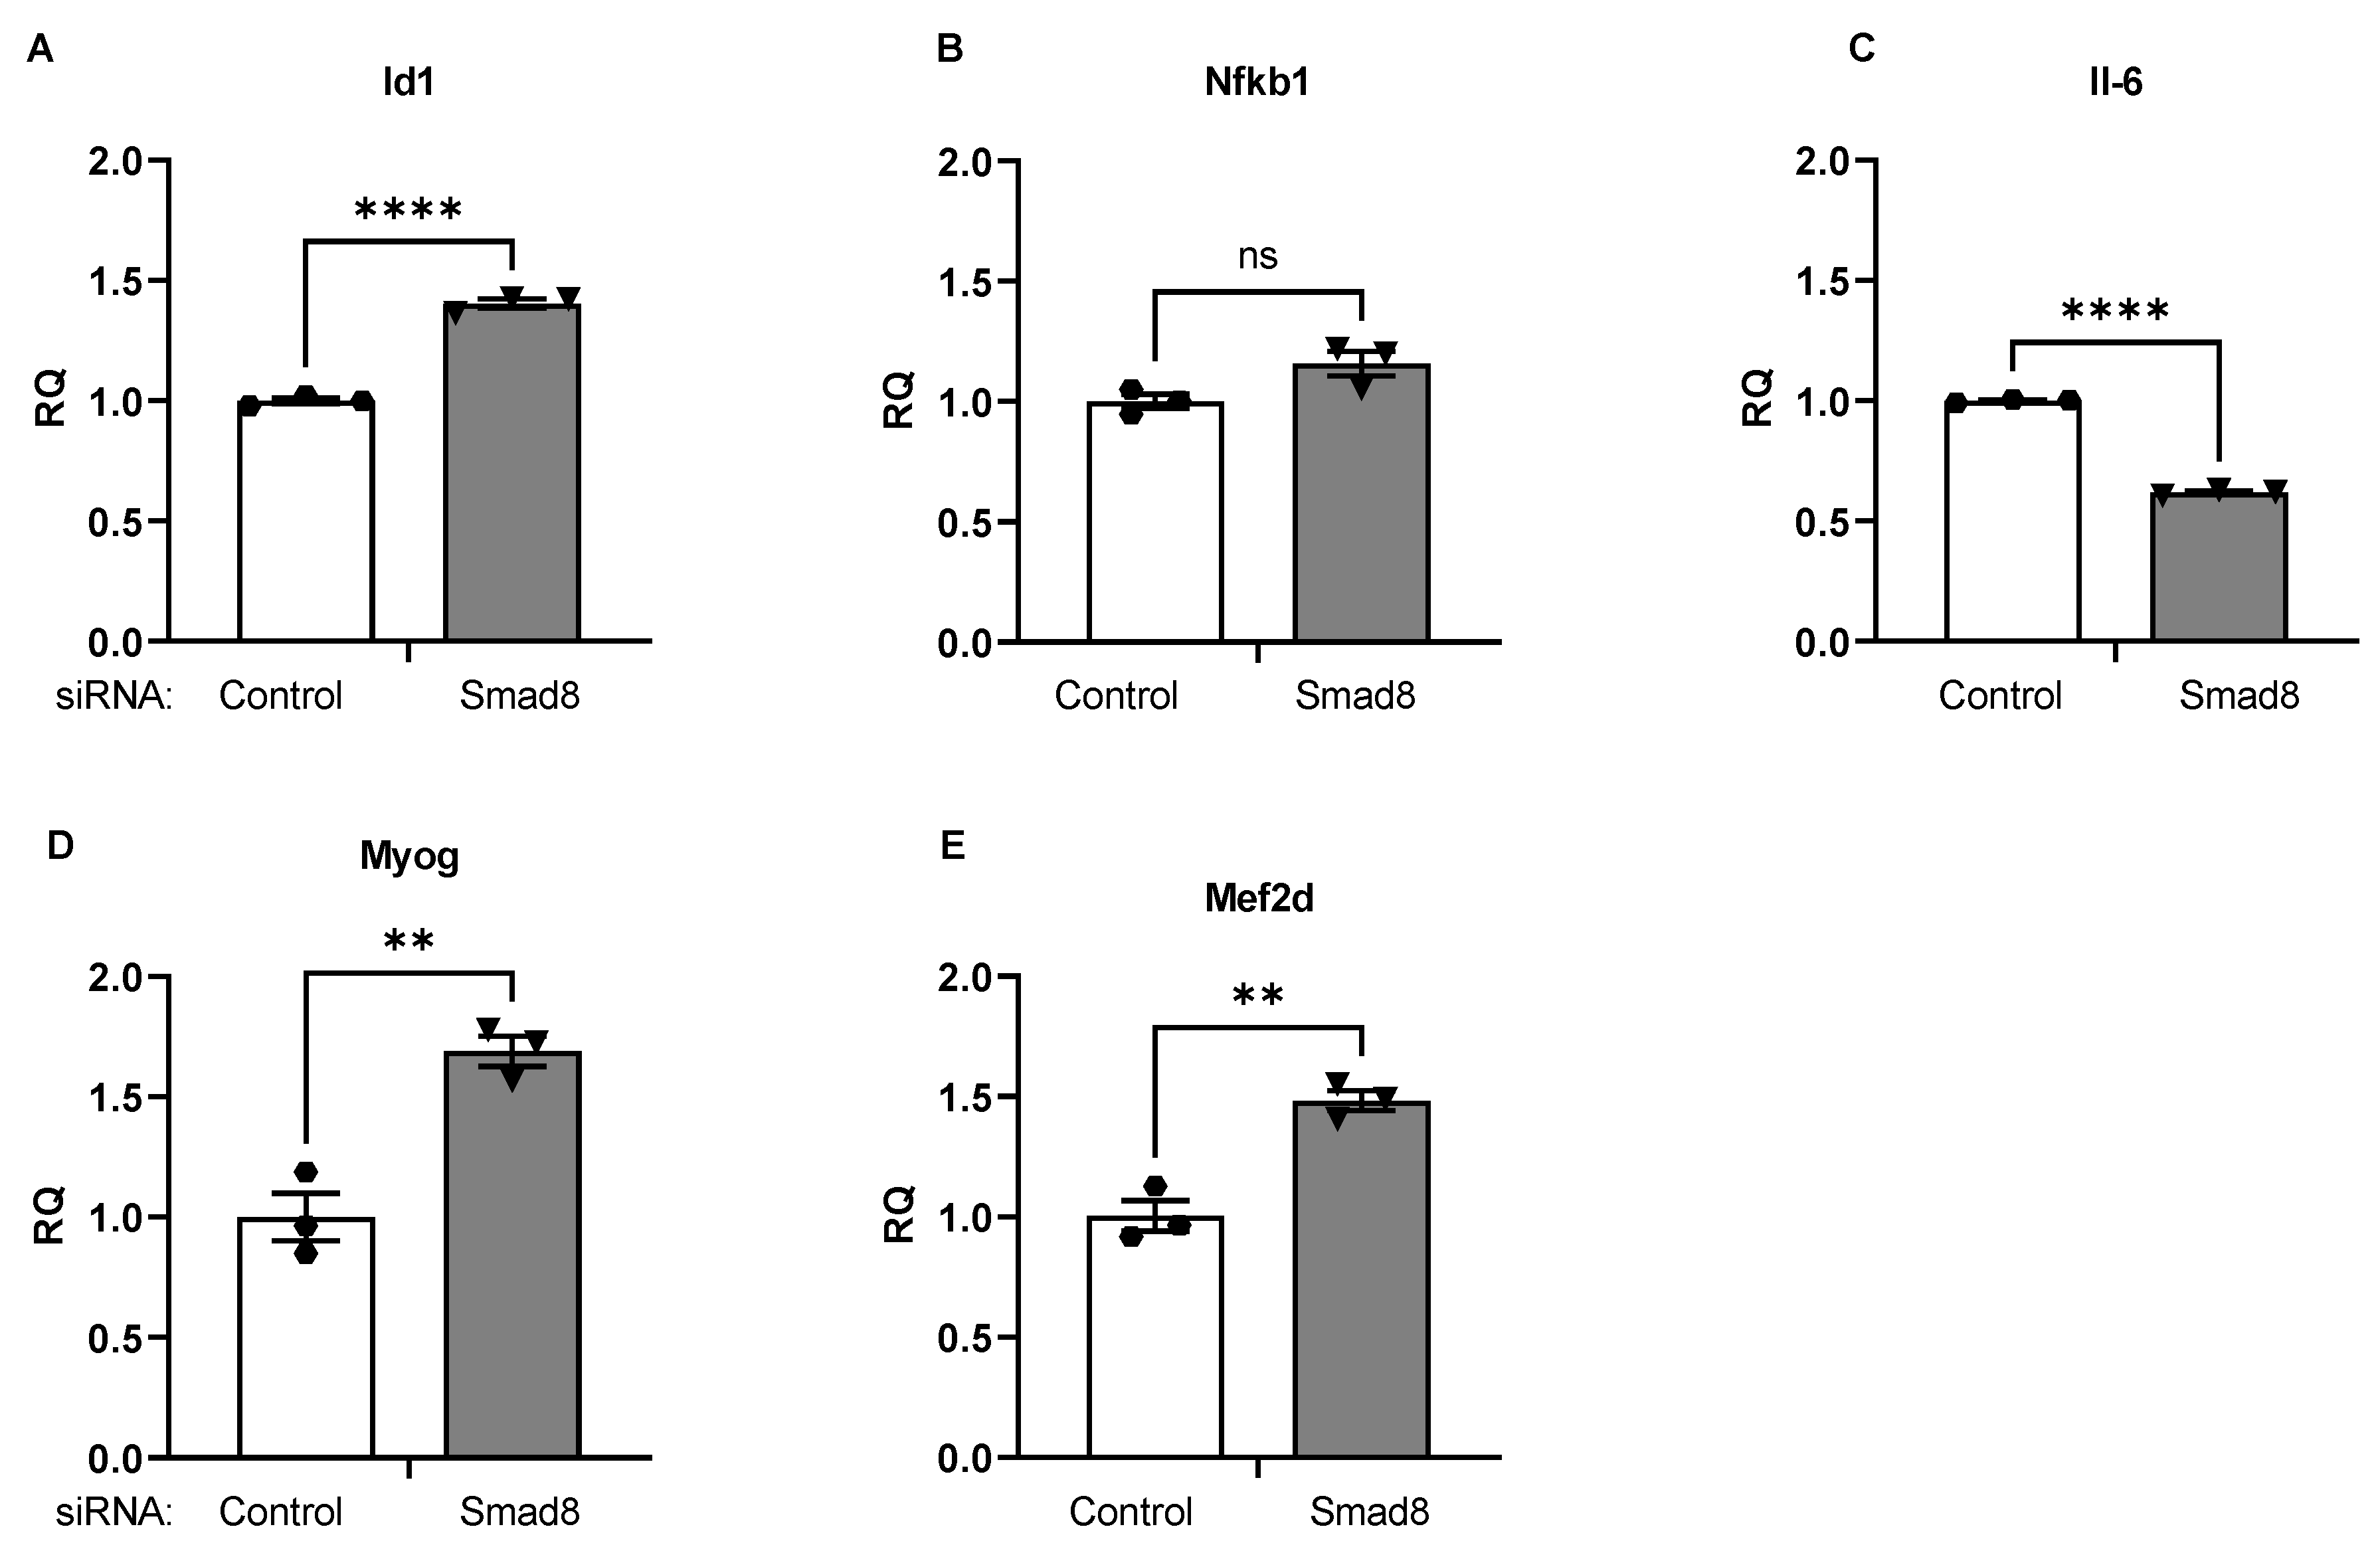
2.5. Smad8 Silencing in C2C12 Cells Alters Downstream mRNAs Linked to Dystrophic Signaling
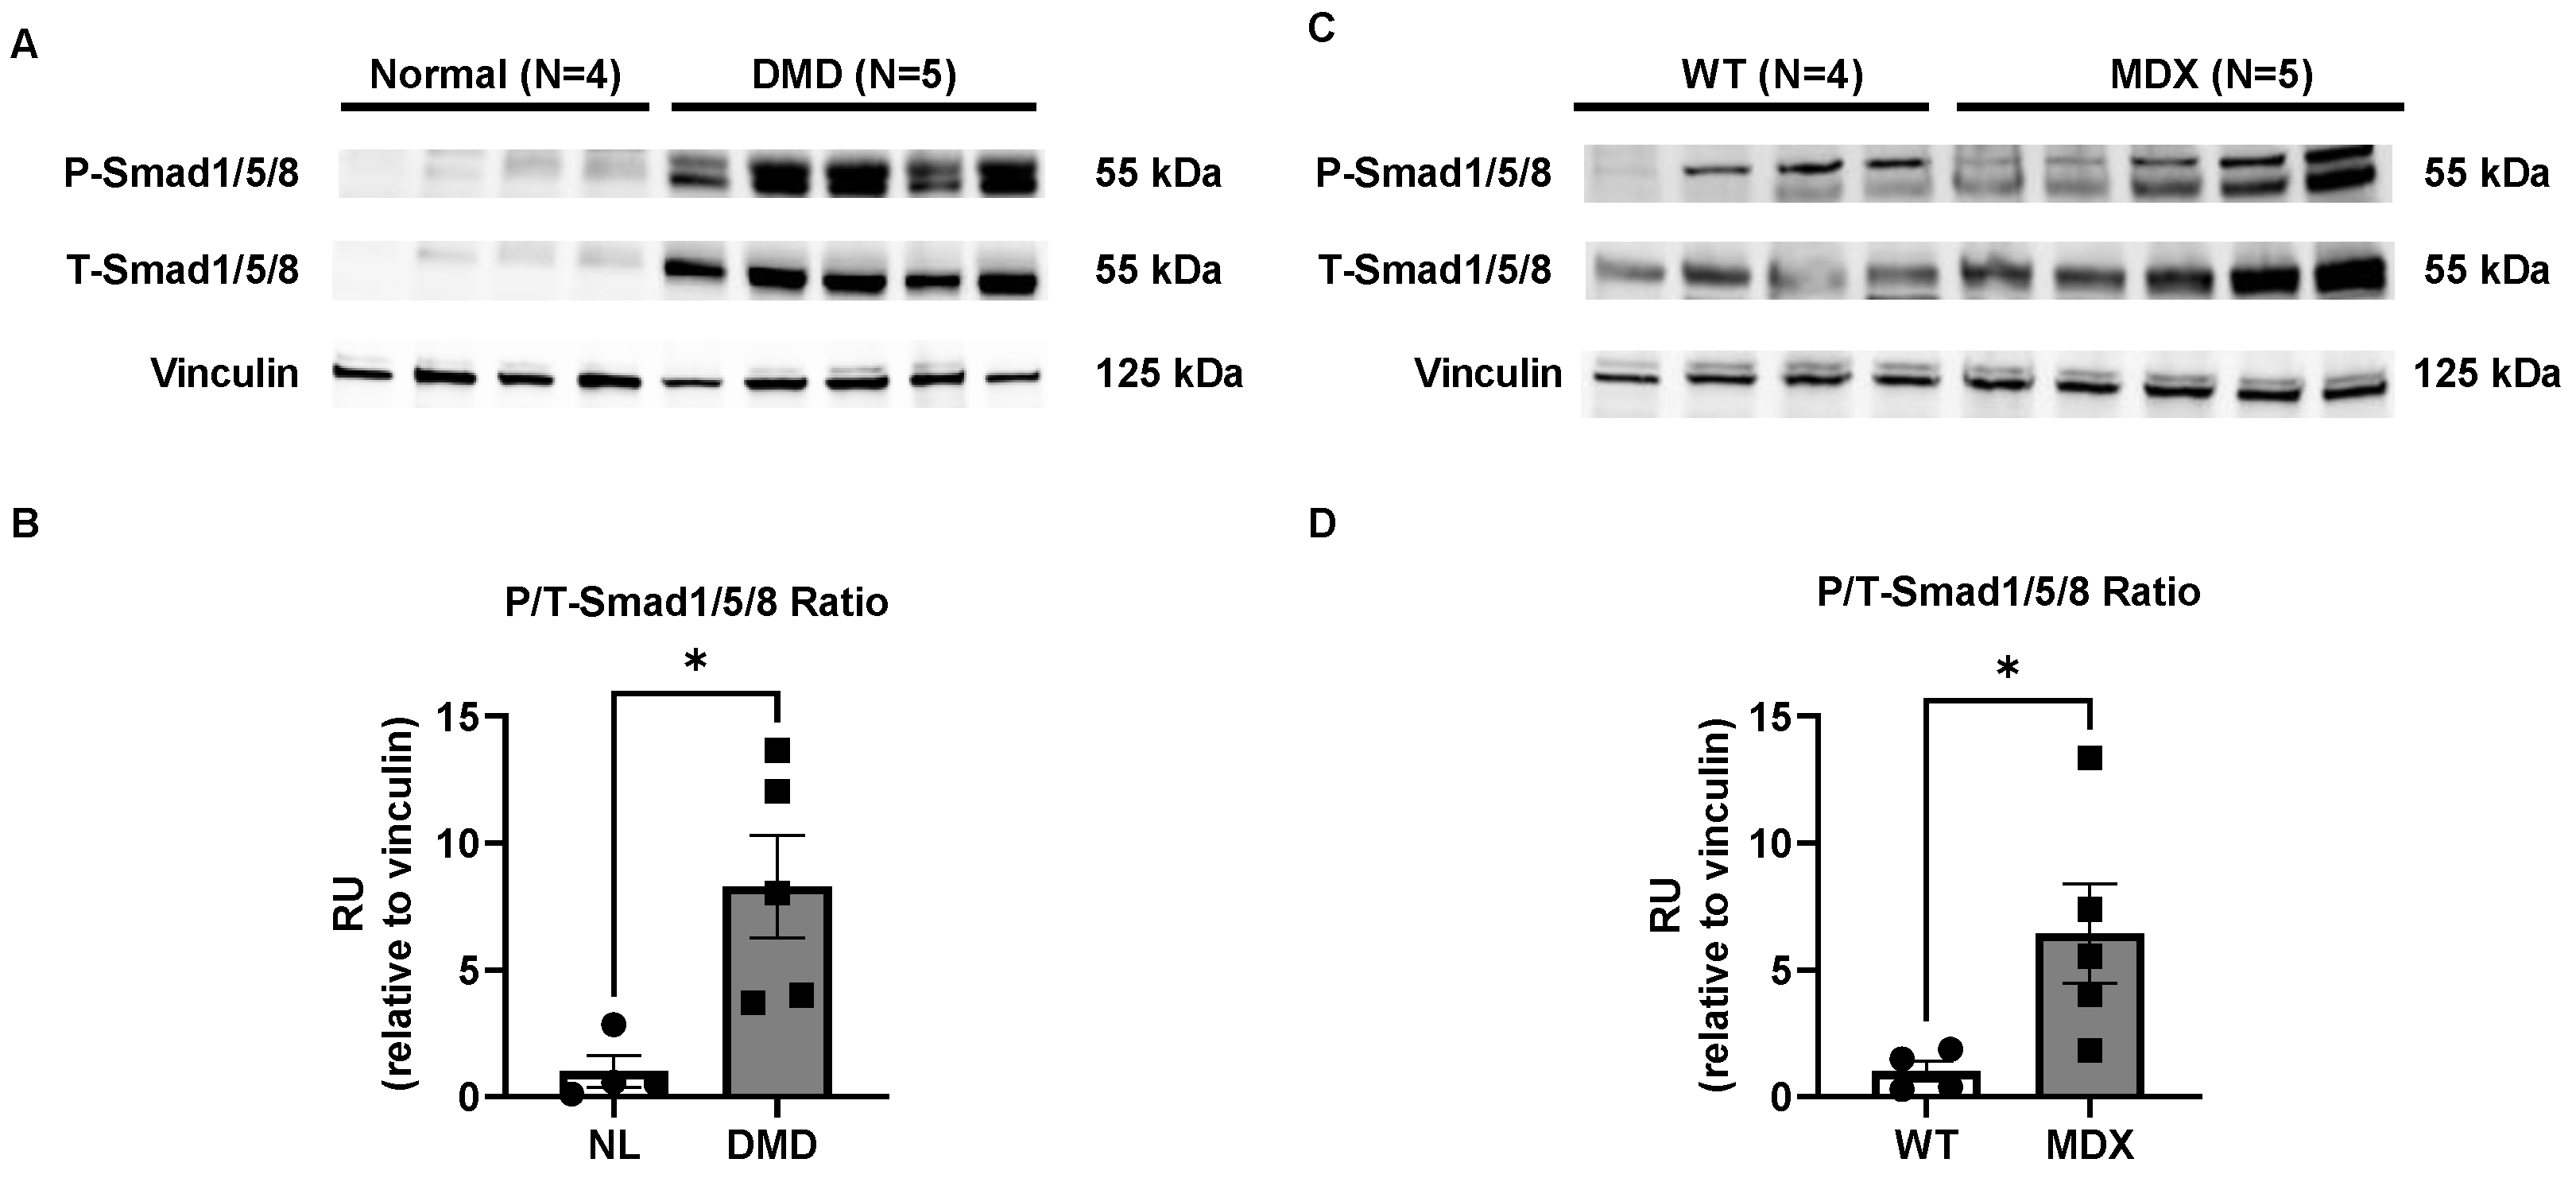
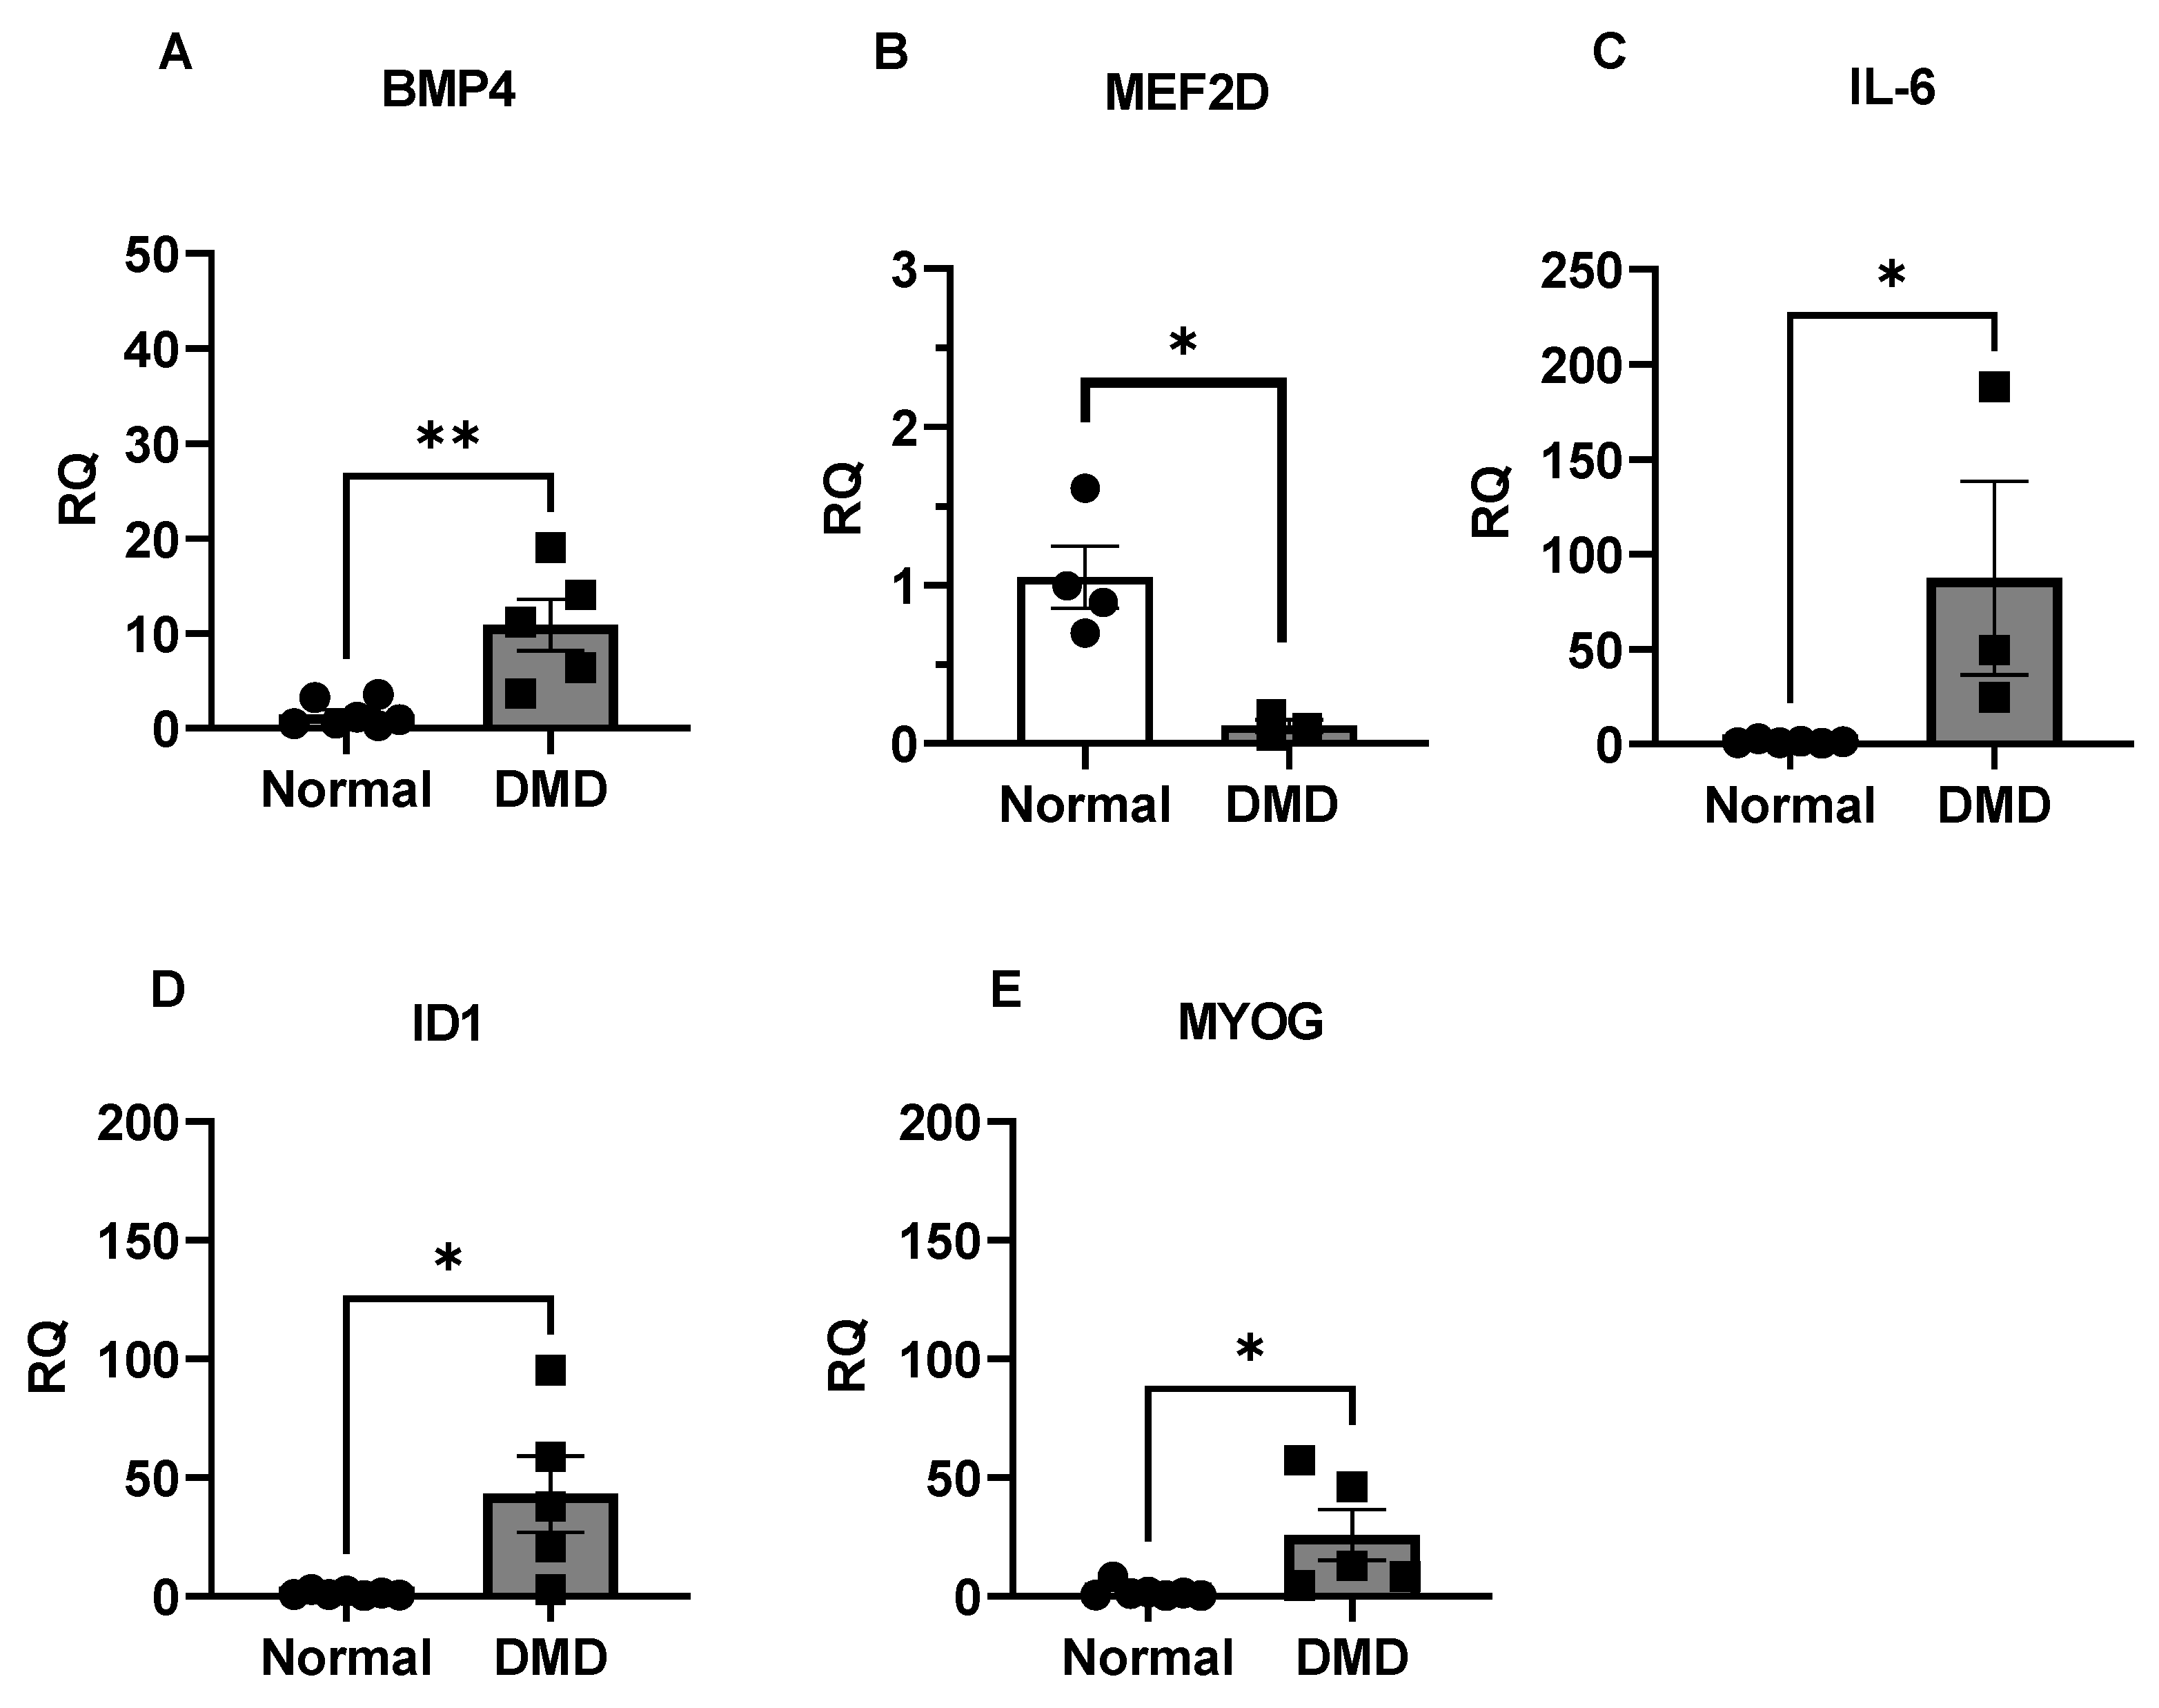
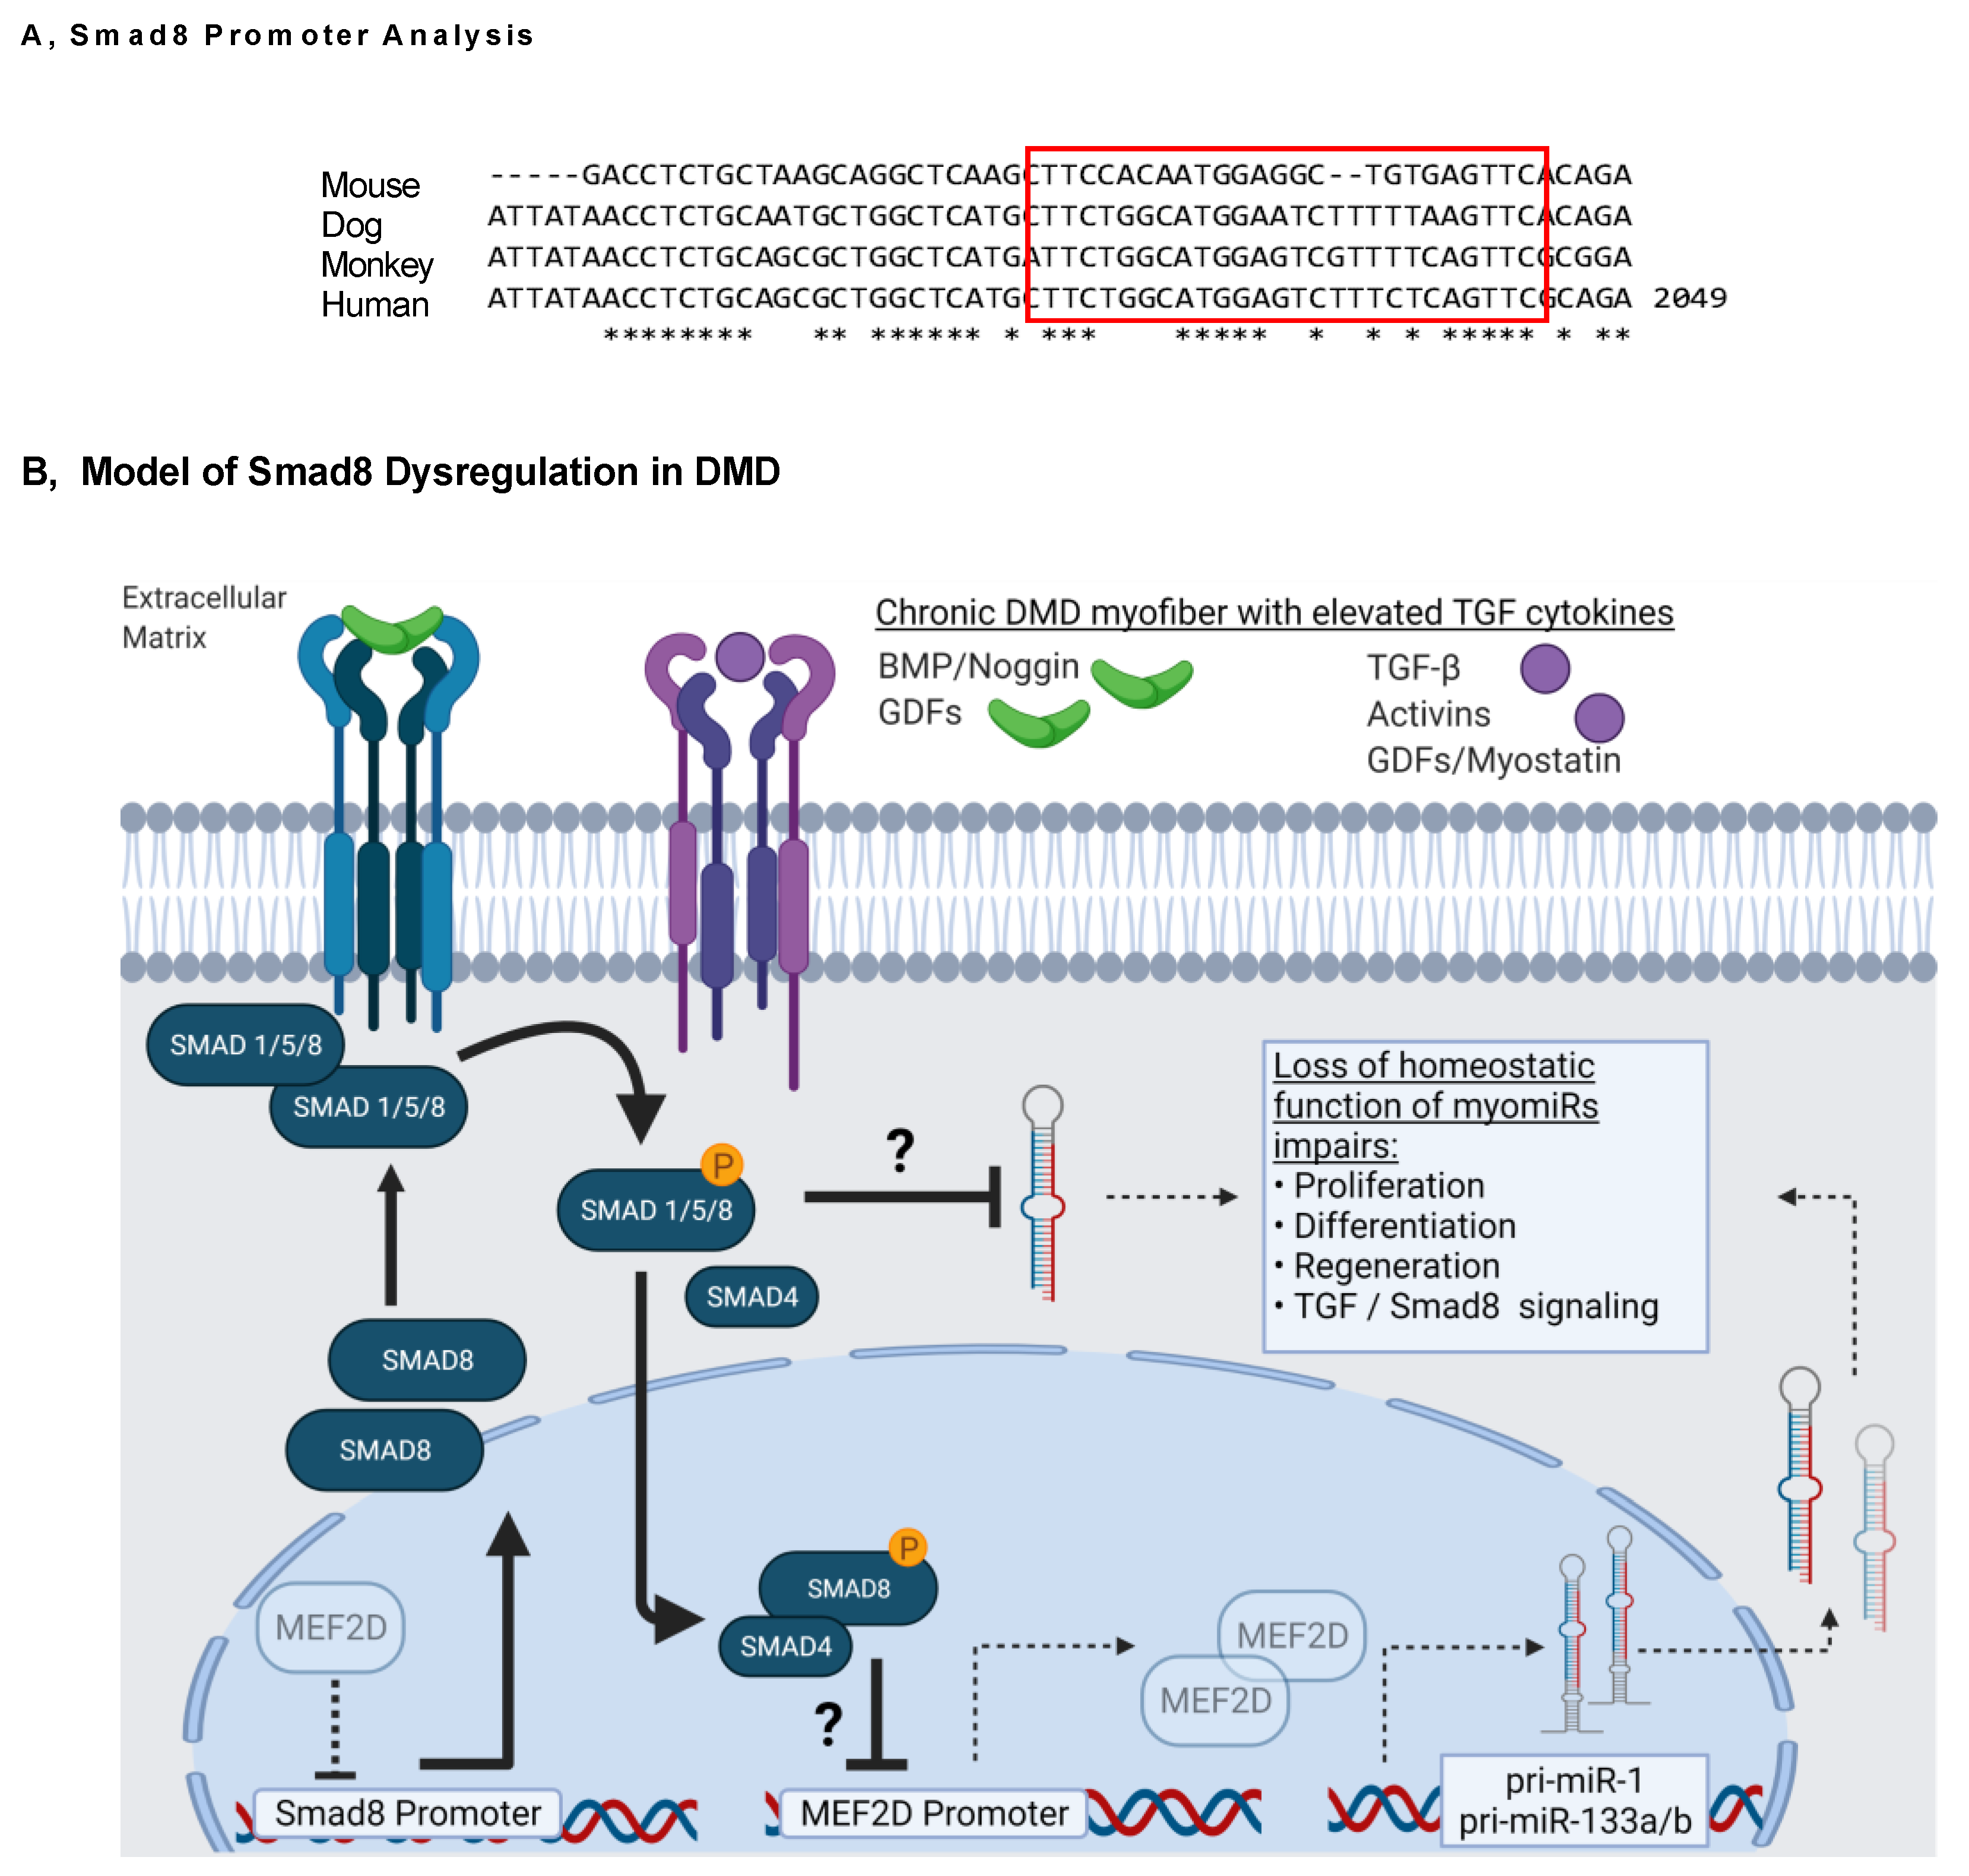
2.6. BMP4/Smad8 Pathway Is Upregulated in DMD Skeletal Muscle
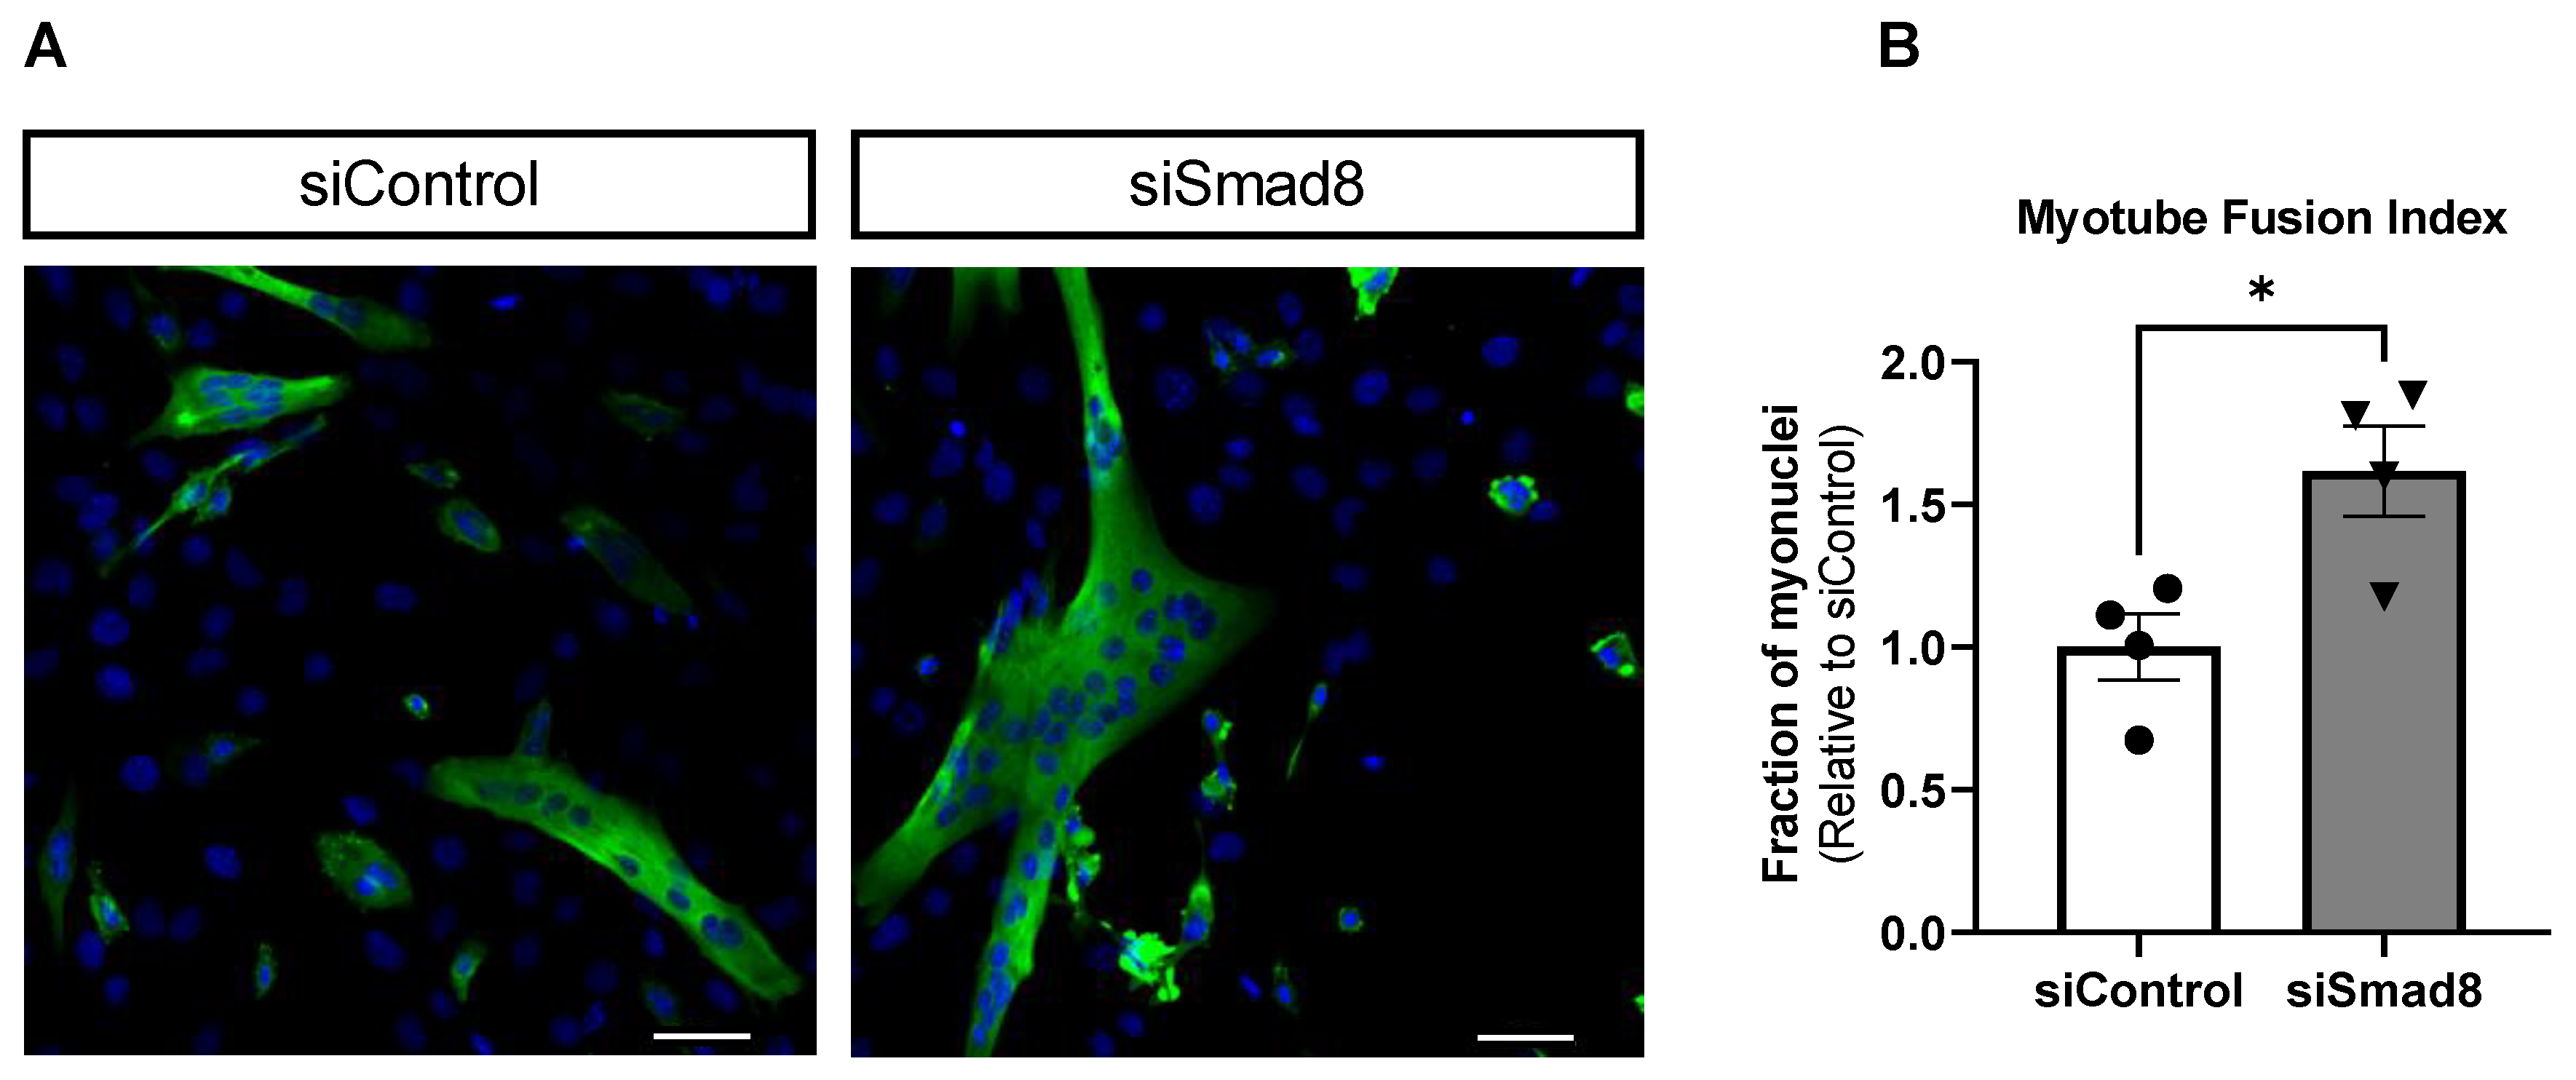
2.7. Smad8 Silencing in C2C12 Cells Promotes Myogenic Differentiation
3. Discussion
4. Methods
4.1. Human Muscle Samples
4.2. Mouse Muscle Samples
4.3. Cell Culture and Transfection
4.4. RNA Isolation and qPCR Analysis
4.5. Western Blot
4.6. Myotube Fusion Index and Immunocytofluorescence Imaging
4.7. Model and Statistics
5. Conclusions
Supplementary Materials
Author Contributions
Funding
Institutional Review Board Statement
Informed Consent Statement
Data Availability Statement
Acknowledgments
Conflicts of Interest
References
- Emery, A.E. Population frequencies of inherited neuromuscular diseases—A world survey. Neuromuscul. Disord. 1991, 1, 19–29. [Google Scholar] [CrossRef]
- Mah, J.K.; Korngut, L.; Dykeman, J.; Day, L.; Pringsheim, T.; Jette, N. A systematic review and meta-analysis on the epidemiology of Duchenne and Becker muscular dystrophy. Neuromuscul. Disord. 2014, 24, 482–491. [Google Scholar] [CrossRef] [PubMed]
- Mendell, J.R.; Lloyd-Puryear, M. Report of MDA muscle disease symposium on newborn screening for Duchenne muscular dystrophy. Muscle Nerve 2013, 48, 21–26. [Google Scholar] [CrossRef] [PubMed]
- Hoffman, E.P.; Brown, R.H., Jr.; Kunkel, L.M. Dystrophin: The protein product of the Duchenne muscular dystrophy locus. Cell 1987, 51, 919–928. [Google Scholar] [CrossRef]
- Petrof, B.J.; Shrager, J.B.; Stedman, H.H.; Kelly, A.M.; Sweeney, H.L. Dystrophin protects the sarcolemma from stresses developed during muscle contraction. Proc. Natl. Acad. Sci. USA 1993, 90, 3710–3714. [Google Scholar] [CrossRef] [Green Version]
- Ziemkiewicz, N.; Hilliard, G.; Pullen, N.A.; Garg, K. The Role of Innate and Adaptive Immune Cells in Skeletal Muscle Regeneration. Int. J. Mol. Sci. 2021, 22, 3265. [Google Scholar] [CrossRef]
- Rosenberg, A.S.; Puig, M.; Nagaraju, K.; Hoffman, E.P.; Villalta, S.A.; Rao, V.A.; Wakefield, L.M.; Woodcock, J. Immune-mediated pathology in Duchenne muscular dystrophy. Sci. Transl. Med. 2015, 7, 299rv294. [Google Scholar] [CrossRef] [Green Version]
- Fairclough, R.J.; Perkins, K.J.; Davies, K.E. Pharmacologically targeting the primary defect and downstream pathology in Duchenne muscular dystrophy. Curr. Gene Ther. 2012, 12, 206–244. [Google Scholar] [CrossRef]
- Tzavlaki, K.; Moustakas, A. TGF-beta Signaling. Biomolecules 2020, 10, 487. [Google Scholar] [CrossRef] [Green Version]
- Katakawa, Y.; Funaba, M.; Murakami, M. Smad8/9 Is Regulated Through the BMP Pathway. J. Cell Biochem. 2016, 117, 1788–1796. [Google Scholar] [CrossRef]
- Sartori, R.; Milan, G.; Patron, M.; Mammucari, C.; Blaauw, B.; Abraham, R.; Sandri, M. Smad2 and 3 transcription factors control muscle mass in adulthood. Am. J. Physiol. Cell Physiol. 2009, 296, C1248–C1257. [Google Scholar] [CrossRef] [Green Version]
- Mázala, D.A.; Novak, J.S.; Hogarth, M.W.; Nearing, M.; Adusumalli, P.; Tully, C.B.; Habib, N.F.; Gordish-Dressman, H.; Chen, Y.W.; Jaiswal, J.K.; et al. TGF-β-driven muscle degeneration and failed regeneration underlie disease onset in a DMD mouse model. JCI Insight 2020, 5, e135703. [Google Scholar] [CrossRef] [PubMed]
- Lokireddy, S.; Wijesoma, I.W.; Sze, S.K.; McFarlane, C.; Kambadur, R.; Sharma, M. Identification of atrogin-1-targeted proteins during the myostatin-induced skeletal muscle wasting. Am. J. Physiol. Cell Physiol. 2012, 303, C512–C529. [Google Scholar] [CrossRef] [PubMed] [Green Version]
- Liu, D.; Black, B.L.; Derynck, R. TGF-beta inhibits muscle differentiation through functional repression of myogenic transcription factors by Smad3. Genes Dev. 2001, 15, 2950–2966. [Google Scholar] [CrossRef] [PubMed] [Green Version]
- Sartori, R.; Schirwis, E.; Blaauw, B.; Bortolanza, S.; Zhao, J.; Enzo, E.; Stantzou, A.; Mouisel, E.; Toniolo, L.; Ferry, A.; et al. BMP signaling controls muscle mass. Nat. Genet. 2013, 45, 1309–1318. [Google Scholar] [CrossRef]
- Si, Y.; Kim, S.; Cui, X.; Zheng, L.; Oh, S.J.; Anderson, T.; AlSharabati, M.; Kazamel, M.; Volpicelli-Daley, L.; Bamman, M.M.; et al. Transforming Growth Factor Beta (TGF-beta) Is a Muscle Biomarker of Disease Progression in ALS and Correlates with Smad Expression. PLoS ONE 2015, 10, e0138425. [Google Scholar] [CrossRef]
- Delaney, K.; Kasprzycka, P.; Ciemerych, M.A.; Zimowska, M. The role of TGF-beta1 during skeletal muscle regeneration. Cell Biol. Int. 2017, 41, 706–715. [Google Scholar] [CrossRef] [Green Version]
- Chen, Y.W.; Nagaraju, K.; Bakay, M.; McIntyre, O.; Rawat, R.; Shi, R.; Hoffman, E.P. Early onset of inflammation and later involvement of TGFbeta in Duchenne muscular dystrophy. Neurology 2005, 65, 826–834. [Google Scholar] [CrossRef]
- Gosselin, L.E.; Williams, J.E.; Deering, M.; Brazeau, D.; Koury, S.; Martinez, D.A. Localization and early time course of TGF-beta 1 mRNA expression in dystrophic muscle. Muscle Nerve 2004, 30, 645–653. [Google Scholar] [CrossRef]
- Song, Y.; Yao, S.; Liu, Y.; Long, L.; Yang, H.; Li, Q.; Liang, J.; Li, X.; Lu, Y.; Zhu, H.; et al. Expression levels of TGF-β1 and CTGF are associated with the severity of Duchenne muscular dystrophy. Exp. Ther. Med. 2017, 13, 1209–1214. [Google Scholar] [CrossRef] [Green Version]
- Flanigan, K.M.; Ceco, E.; Lamar, K.M.; Kaminoh, Y.; Dunn, D.M.; Mendell, J.R.; King, W.M.; Pestronk, A.; Florence, J.M.; Mathews, K.D.; et al. LTBP4 genotype predicts age of ambulatory loss in Duchenne muscular dystrophy. Ann. Neurol. 2013, 73, 481–488. [Google Scholar] [CrossRef] [PubMed] [Green Version]
- Bernasconi, P.; Torchiana, E.; Confalonieri, P.; Brugnoni, R.; Barresi, R.; Mora, M.; Cornelio, F.; Morandi, L.; Mantegazza, R. Expression of transforming growth factor-beta 1 in dystrophic patient muscles correlates with fibrosis. Pathogenetic role of a fibrogenic cytokine. J. Clin. Investig. 1995, 96, 1137–1144. [Google Scholar] [CrossRef] [PubMed] [Green Version]
- Campbell, C.; McMillan, H.J.; Mah, J.K.; Tarnopolsky, M.; Selby, K.; McClure, T.; Wilson, D.M.; Sherman, M.L.; Escolar, D.; Attie, K.M. Myostatin inhibitor ACE-031 treatment of ambulatory boys with Duchenne muscular dystrophy: Results of a randomized, placebo-controlled clinical trial. Muscle Nerve 2017, 55, 458–464. [Google Scholar] [CrossRef] [PubMed]
- Sterrenburg, E.; van der Wees, C.G.; White, S.J.; Turk, R.; de Menezes, R.X.; van Ommen, G.J.; den Dunnen, J.T.; C’t Hoen, P.A. Gene expression profiling highlights defective myogenesis in DMD patients and a possible role for bone morphogenetic protein 4. Neurobiol. Dis. 2006, 23, 228–236. [Google Scholar] [CrossRef] [PubMed]
- Wozney, J.M.; Rosen, V.; Celeste, A.J.; Mitsock, L.M.; Whitters, M.J.; Kriz, R.W.; Hewick, R.M.; Wang, E.A. Novel regulators of bone formation: Molecular clones and activities. Science 1988, 242, 1528–1534. [Google Scholar] [CrossRef] [PubMed]
- Shi, S.; Hoogaars, W.M.; de Gorter, D.J.; van Heiningen, S.H.; Lin, H.Y.; Hong, C.C.; Kemaladewi, D.U.; Aartsma-Rus, A.; ten Dijke, P.; C’t Hoen, P.A. BMP antagonists enhance myogenic differentiation and ameliorate the dystrophic phenotype in a DMD mouse model. Neurobiol. Dis. 2011, 41, 353–360. [Google Scholar] [CrossRef] [PubMed] [Green Version]
- Eisenberg, I.; Eran, A.; Nishino, I.; Moggio, M.; Lamperti, C.; Amato, A.A.; Lidov, H.G.; Kang, P.B.; North, K.N.; Mitrani-Rosenbaum, S.; et al. Distinctive patterns of microRNA expression in primary muscular disorders. Proc. Natl. Acad. Sci. USA 2007, 104, 17016–17021. [Google Scholar] [CrossRef] [Green Version]
- Zaharieva, I.T.; Calissano, M.; Scoto, M.; Preston, M.; Cirak, S.; Feng, L.; Collins, J.; Kole, R.; Guglieri, M.; Straub, V.; et al. Dystromirs as serum biomarkers for monitoring the disease severity in Duchenne muscular Dystrophy. PLoS ONE 2013, 8, e80263. [Google Scholar] [CrossRef] [Green Version]
- Greco, S.; De Simone, M.; Colussi, C.; Zaccagnini, G.; Fasanaro, P.; Pescatori, M.; Cardani, R.; Perbellini, R.; Isaia, E.; Sale, P.; et al. Common micro-RNA signature in skeletal muscle damage and regeneration induced by Duchenne muscular dystrophy and acute ischemia. FASEB J. 2009, 23, 3335–3346. [Google Scholar] [CrossRef] [Green Version]
- Alexander, M.S.; Casar, J.C.; Motohashi, N.; Vieira, N.M.; Eisenberg, I.; Marshall, J.L.; Gasperini, M.J.; Lek, A.; Myers, J.A.; Estrella, E.A.; et al. MicroRNA-486-dependent modulation of DOCK3/PTEN/AKT signaling pathways improves muscular dystrophy-associated symptoms. J. Clin. Investig. 2014, 124, 2651–2667. [Google Scholar] [CrossRef]
- Taetzsch, T.; Shapiro, D.; Eldosougi, R.; Myers, T.; Settlage, R.E.; Valdez, G. The microRNA miR-133b functions to slow Duchenne muscular dystrophy pathogenesis. J. Physiol. 2021, 599, 171–192. [Google Scholar] [CrossRef] [PubMed]
- Guadagnin, E.; Mázala, D.; Chen, Y.-W. STAT3 in Skeletal Muscle Function and Disorders. Int. J. Mol. Sci. 2018, 19, 2265. [Google Scholar] [CrossRef] [PubMed] [Green Version]
- Si, Y.; Cui, X.; Crossman, D.K.; Hao, J.; Kazamel, M.; Kwon, Y.; King, P.H. Muscle microRNA signatures as biomarkers of disease progression in amyotrophic lateral sclerosis. Neurobiol. Dis. 2018, 114, 85–94. [Google Scholar] [CrossRef] [PubMed]
- Si, Y.; Cui, X.; Kim, S.; Wians, R.; Sorge, R.; Oh, S.J.; Kwan, T.; AlSharabati, M.; Lu, L.; Claussen, G.; et al. Smads as muscle biomarkers in amyotrophic lateral sclerosis. Ann. Clin. Transl. Neurol. 2014, 1, 778–787. [Google Scholar] [CrossRef] [PubMed]
- Madaro, L.; Passafaro, M.; Sala, D.; Etxaniz, U.; Lugarini, F.; Proietti, D.; Alfonsi, M.V.; Nicoletti, C.; Gatto, S.; De Bardi, M.; et al. Denervation-activated STAT3-IL-6 signalling in fibro-adipogenic progenitors promotes myofibres atrophy and fibrosis. Nat. Cell Biol. 2018, 20, 917–927. [Google Scholar] [CrossRef] [PubMed]
- Gonzalez, D.; Contreras, O.; Rebolledo, D.L.; Espinoza, J.P.; van Zundert, B.; Brandan, E. ALS skeletal muscle shows enhanced TGF-beta signaling, fibrosis and induction of fibro/adipogenic progenitor markers. PLoS ONE 2017, 12, e0177649. [Google Scholar] [CrossRef] [Green Version]
- Al-Sarraj, S.; King, A.; Cleveland, M.; Pradat, P.F.; Corse, A.; Rothstein, J.D.; Leigh, P.N.; Abila, B.; Bates, S.; Wurthner, J.; et al. Mitochondrial abnormalities and low grade inflammation are present in the skeletal muscle of a minority of patients with amyotrophic lateral sclerosis; an observational myopathology study. Acta Neuropathol. Commun. 2014, 2, 165. [Google Scholar] [CrossRef] [Green Version]
- Trias, E.; King, P.H.; Si, Y.; Kwon, Y.; Varela, V.; Ibarburu, S.; Kovacs, M.; Moura, I.C.; Beckman, J.S.; Hermine, O.; et al. Mast cells and neutrophils mediate peripheral motor pathway degeneration in ALS. JCI Insight 2018, 3, e123249. [Google Scholar] [CrossRef]
- Trias, E.; Kovacs, M.; King, P.H.; Si, Y.; Kwon, Y.; Varela, V.; Ibarburu, S.; Moura, I.C.; Hermine, O.; Beckman, J.S.; et al. Schwann cells orchestrate peripheral nerve inflammation through the expression of CSF1, IL-34, and SCF in amyotrophic lateral sclerosis. Glia 2020, 68, 1165–1181. [Google Scholar] [CrossRef]
- Furutani, Y.; Umemoto, T.; Murakami, M.; Matsui, T.; Funaba, M. Role of endogenous TGF-beta family in myogenic differentiation of C2C12 cells. J. Cell Biochem. 2011, 112, 614–624. [Google Scholar] [CrossRef] [Green Version]
- Xu, X.; Hong, P.; Wang, Z.; Tang, Z.; Li, K. MicroRNAs in Transforming Growth Factor-Beta Signaling Pathway Associated With Fibrosis Involving Different Systems of the Human Body. Front. Mol. Biosci. 2021, 8, 707461. [Google Scholar] [CrossRef] [PubMed]
- Tsukamoto, S.; Mizuta, T.; Fujimoto, M.; Ohte, S.; Osawa, K.; Miyamoto, A.; Yoneyama, K.; Murata, E.; Machiya, A.; Jimi, E.; et al. Smad9 is a new type of transcriptional regulator in bone morphogenetic protein signaling. Sci. Rep. 2014, 4, 7596. [Google Scholar] [CrossRef] [PubMed]
- Yang, J.; Li, X.; Li, Y.; Southwood, M.; Ye, L.; Long, L.; Al-Lamki, R.S.; Morrell, N.W. Id proteins are critical downstream effectors of BMP signaling in human pulmonary arterial smooth muscle cells. Am. J. Physiol. Lung Cell Mol. Physiol. 2013, 305, L312–L321. [Google Scholar] [CrossRef] [PubMed] [Green Version]
- Ogata, T.; Wozney, J.M.; Benezra, R.; Noda, M. Bone morphogenetic protein 2 transiently enhances expression of a gene, Id (inhibitor of differentiation), encoding a helix-loop-helix molecule in osteoblast-like cells. Proc. Natl. Acad. Sci. USA 1993, 90, 9219–9222. [Google Scholar] [CrossRef] [PubMed] [Green Version]
- Liu, N.; Williams, A.H.; Kim, Y.; McAnally, J.; Bezprozvannaya, S.; Sutherland, L.B.; Richardson, J.A.; Bassel-Duby, R.; Olson, E.N. An intragenic MEF2-dependent enhancer directs muscle-specific expression of microRNAs 1 and 133. Proc. Natl. Acad. Sci. USA 2007, 104, 20844–20849. [Google Scholar] [CrossRef] [Green Version]
- Massague, J.; Seoane, J.; Wotton, D. Smad transcription factors. Genes Dev. 2005, 19, 2783–2810. [Google Scholar] [CrossRef] [Green Version]
- Chen, J.F.; Mandel, E.M.; Thomson, J.M.; Wu, Q.; Callis, T.E.; Hammond, S.M.; Conlon, F.L.; Wang, D.Z. The role of microRNA-1 and microRNA-133 in skeletal muscle proliferation and differentiation. Nat. Genet. 2006, 38, 228–233. [Google Scholar] [CrossRef]
- McCarthy, J.J.; Esser, K.A. MicroRNA-1 and microRNA-133a expression are decreased during skeletal muscle hypertrophy. J. Appl. Physiol. 2007, 102, 306–313. [Google Scholar] [CrossRef]
- Clever, J.L.; Sakai, Y.; Wang, R.A.; Schneider, D.B. Inefficient skeletal muscle repair in inhibitor of differentiation knockout mice suggests a crucial role for BMP signaling during adult muscle regeneration. Am. J. Physiol. Cell Physiol. 2010, 298, C1087–C1099. [Google Scholar] [CrossRef] [Green Version]
- Nath, S.R.; Lieberman, M.L.; Yu, Z.; Marchioretti, C.; Jones, S.T.; Danby, E.C.E.; Van Pelt, K.M.; Sorarù, G.; Robins, D.M.; Bates, G.P.; et al. MEF2 impairment underlies skeletal muscle atrophy in polyglutamine disease. Acta Neuropathol. 2020, 140, 63–80. [Google Scholar] [CrossRef] [Green Version]
- Zhao, Y.; Samal, E.; Srivastava, D. Serum response factor regulates a muscle-specific microRNA that targets Hand2 during cardiogenesis. Nature 2005, 436, 214–220. [Google Scholar] [CrossRef]
- Pelosi, L.; Berardinelli, M.G.; Forcina, L.; Spelta, E.; Rizzuto, E.; Nicoletti, C.; Camilli, C.; Testa, E.; Catizone, A.; De Benedetti, F.; et al. Increased levels of interleukin-6 exacerbate the dystrophic phenotype in mdx mice. Hum. Mol. Genet. 2015, 24, 6041–6053. [Google Scholar] [CrossRef] [PubMed] [Green Version]
- Tripodi, L.; Villa, C.; Molinaro, D.; Torrente, Y.; Farini, A. The Immune System in Duchenne Muscular Dystrophy Pathogenesis. Biomedicines 2021, 9, 1447. [Google Scholar] [CrossRef] [PubMed]
- Blahna, M.T.; Hata, A. Smad-mediated regulation of microRNA biosynthesis. FEBS Lett. 2012, 586, 1906–1912. [Google Scholar] [CrossRef] [PubMed] [Green Version]
- Boettger, T.; Wüst, S.; Nolte, H.; Braun, T. The miR-206/133b cluster is dispensable for development, survival and regeneration of skeletal muscle. Skelet. Muscle 2014, 4, 23. [Google Scholar] [CrossRef] [Green Version]
- Trajkovski, M.; Ahmed, K.; Esau, C.C.; Stoffel, M. MyomiR-133 regulates brown fat differentiation through Prdm16. Nat. Cell Biol. 2012, 14, 1330–1335. [Google Scholar] [CrossRef]
- Zhu, S.; Goldschmidt-Clermont, P.J.; Dong, C. Transforming growth factor-beta-induced inhibition of myogenesis is mediated through Smad pathway and is modulated by microtubule dynamic stability. Circ. Res. 2004, 94, 617–625. [Google Scholar] [CrossRef]
- Brennan, T.J.; Edmondson, D.G.; Li, L.; Olson, E.N. Transforming growth factor beta represses the actions of myogenin through a mechanism independent of DNA binding. Proc. Natl. Acad. Sci. USA 1991, 88, 3822–3826. [Google Scholar] [CrossRef] [Green Version]
- Winbanks, C.E.; Chen, J.L.; Qian, H.; Liu, Y.; Bernardo, B.C.; Beyer, C.; Watt, K.I.; Thomson, R.E.; Connor, T.; Turner, B.J.; et al. The bone morphogenetic protein axis is a positive regulator of skeletal muscle mass. J. Cell Biol. 2013, 203, 345–357. [Google Scholar] [CrossRef] [Green Version]
- Livak, K.J.; Schmittgen, T.D. Analysis of relative gene expression data using real-time quantitative PCR and the 2(-Delta Delta C(T)) Method. Methods 2001, 25, 402–408. [Google Scholar] [CrossRef]


Publisher’s Note: MDPI stays neutral with regard to jurisdictional claims in published maps and institutional affiliations. |
© 2022 by the authors. Licensee MDPI, Basel, Switzerland. This article is an open access article distributed under the terms and conditions of the Creative Commons Attribution (CC BY) license (https://creativecommons.org/licenses/by/4.0/).
Share and Cite
Lopez, M.A.; Si, Y.; Hu, X.; Williams, V.; Qushair, F.; Carlyle, J.; Alesce, L.; Conklin, M.; Gilbert, S.; Bamman, M.M.; et al. Smad8 Is Increased in Duchenne Muscular Dystrophy and Suppresses miR-1, miR-133a, and miR-133b. Int. J. Mol. Sci. 2022, 23, 7515. https://doi.org/10.3390/ijms23147515
Lopez MA, Si Y, Hu X, Williams V, Qushair F, Carlyle J, Alesce L, Conklin M, Gilbert S, Bamman MM, et al. Smad8 Is Increased in Duchenne Muscular Dystrophy and Suppresses miR-1, miR-133a, and miR-133b. International Journal of Molecular Sciences. 2022; 23(14):7515. https://doi.org/10.3390/ijms23147515
Chicago/Turabian StyleLopez, Michael A., Ying Si, Xianzhen Hu, Valentyna Williams, Fuad Qushair, Jackson Carlyle, Lyndsy Alesce, Michael Conklin, Shawn Gilbert, Marcas M. Bamman, and et al. 2022. "Smad8 Is Increased in Duchenne Muscular Dystrophy and Suppresses miR-1, miR-133a, and miR-133b" International Journal of Molecular Sciences 23, no. 14: 7515. https://doi.org/10.3390/ijms23147515