
Synergistic Growth Inhibition of HT-29 Colon and MCF-7 Breast Cancer Cells with Simultaneous and Sequential Combinations of Antineoplastics and CNS Drugs


Abstract
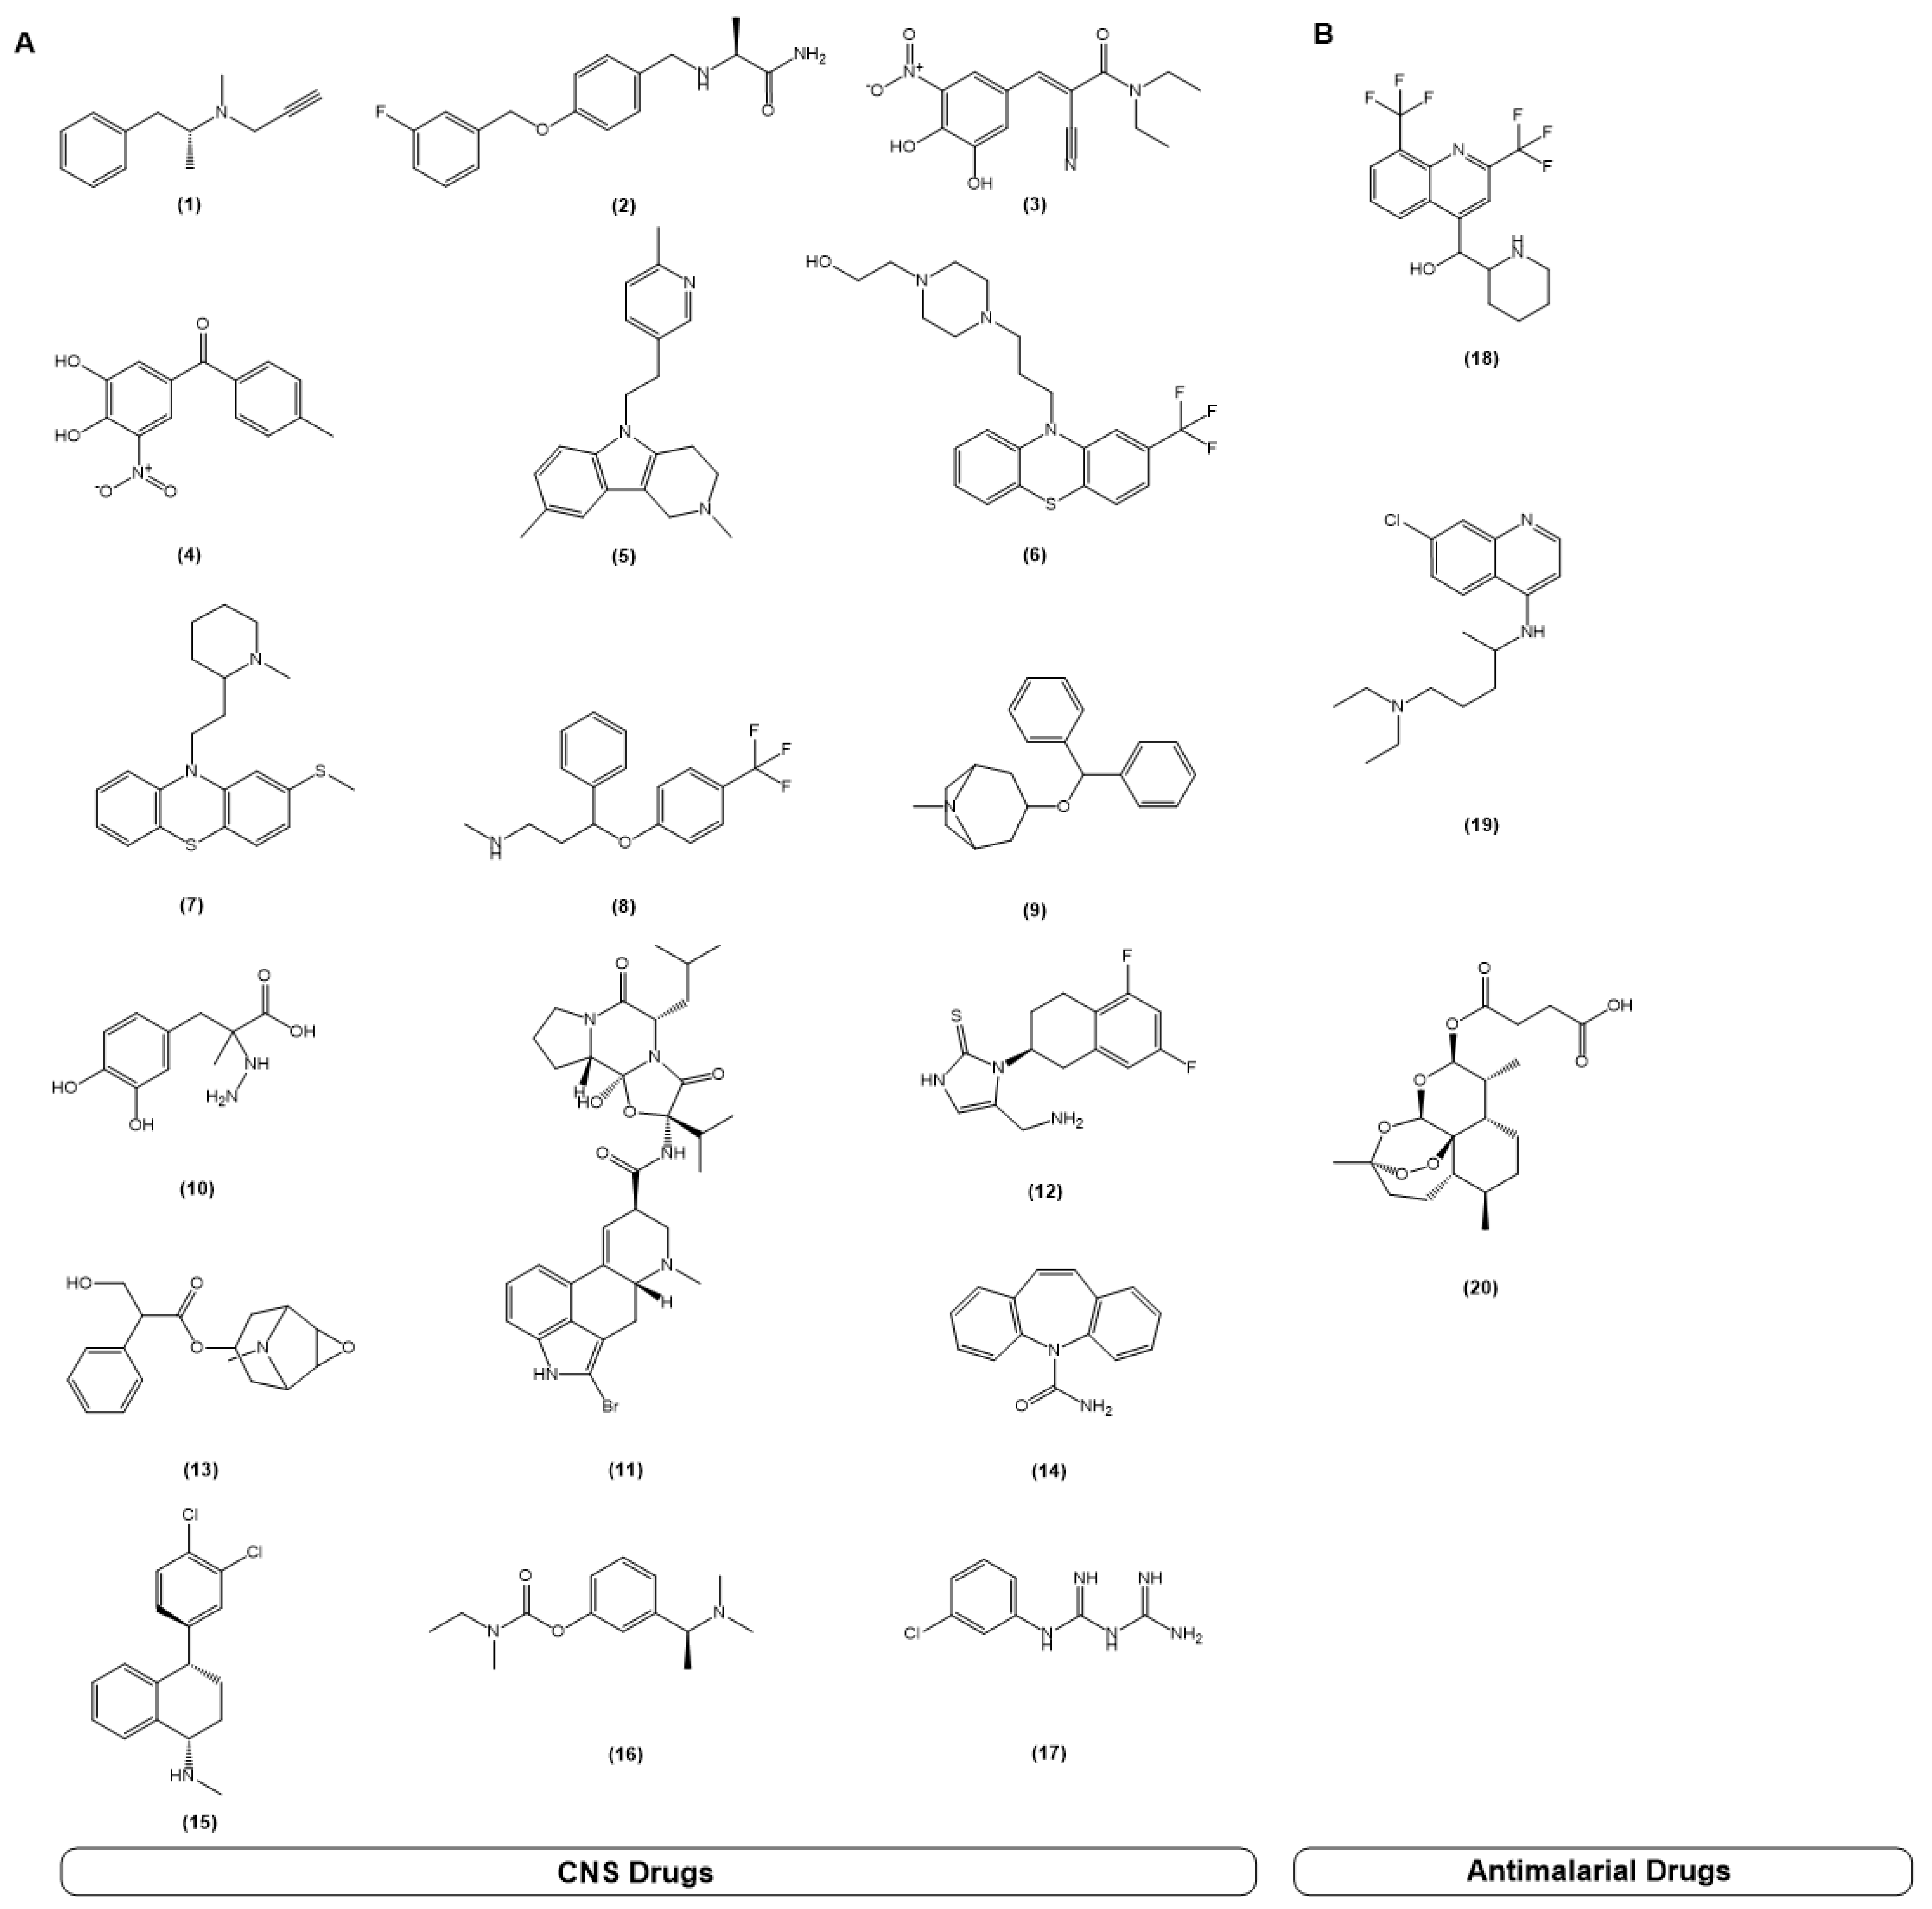
:1. Introduction
2. Results
2.1. HT-29 Colorectal Cancer Cells
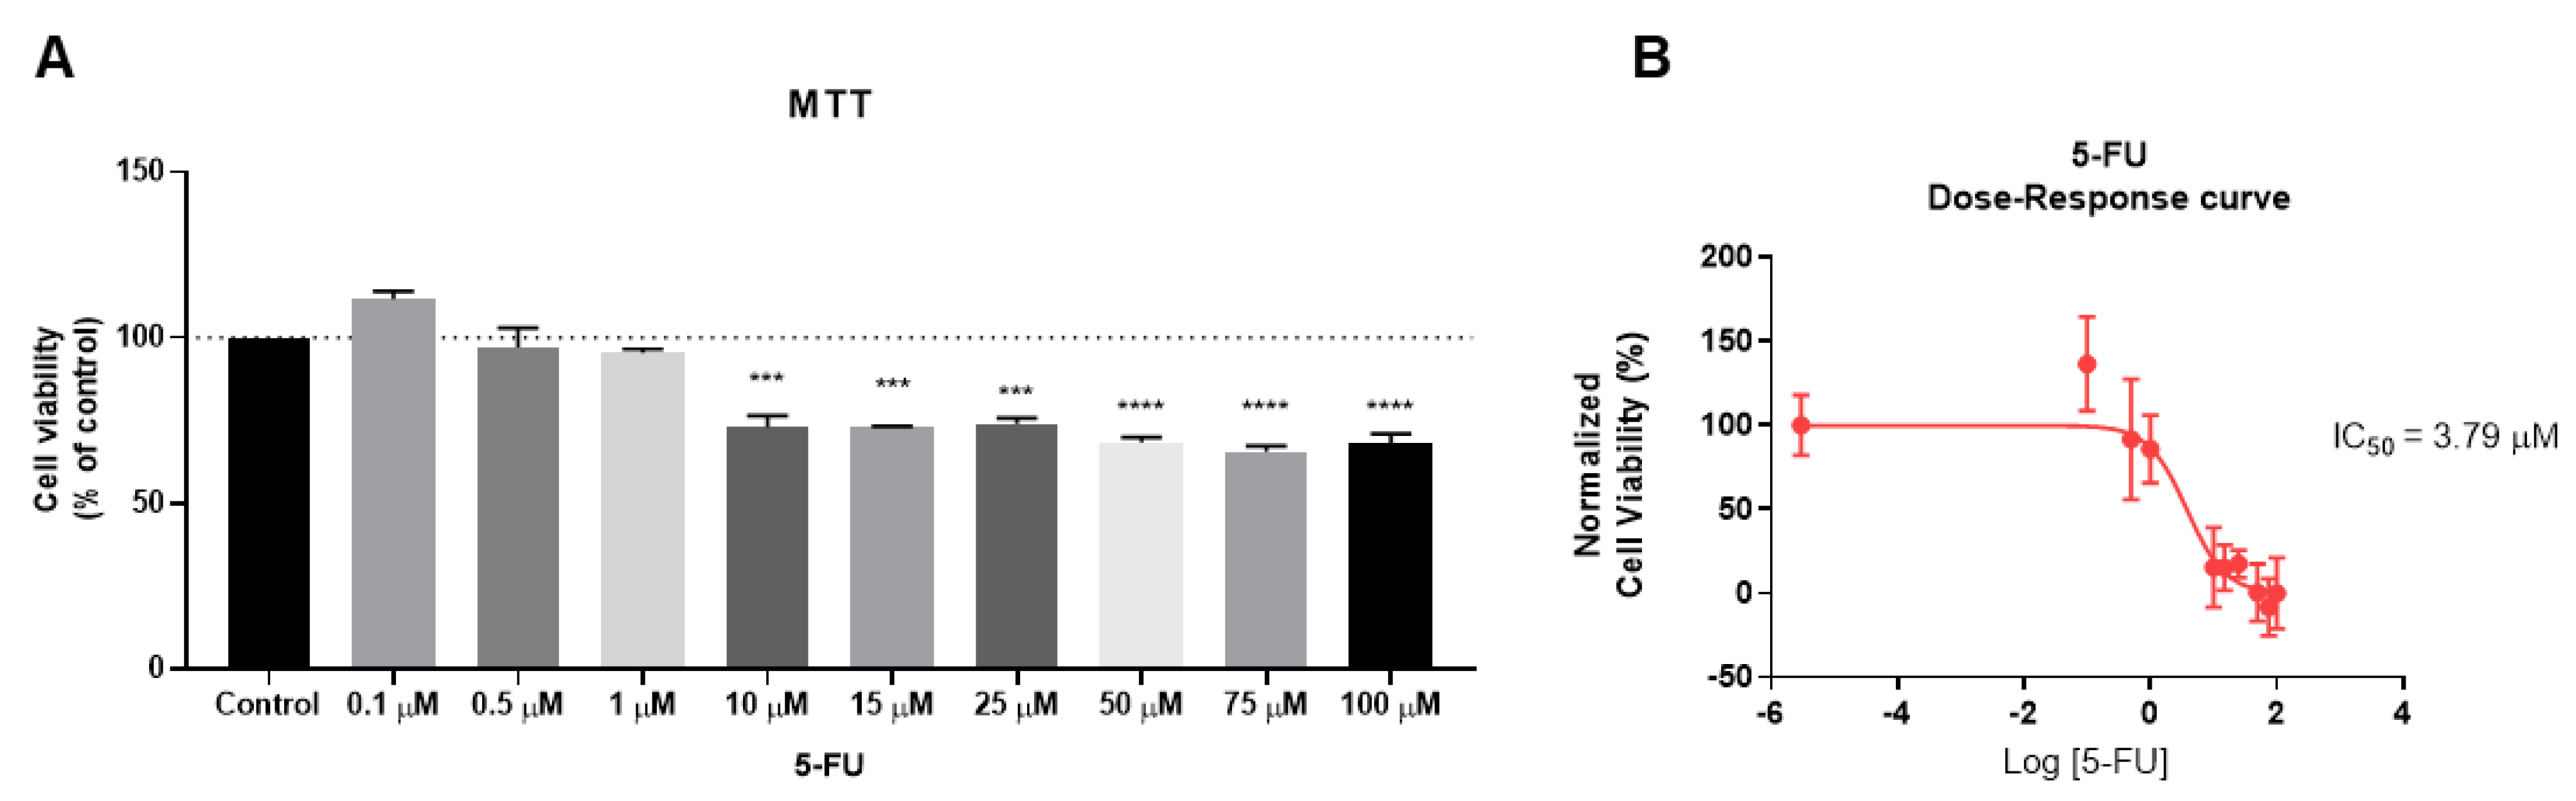
2.1.1. The Effect of 5-FU as the Single Agent on Cellular Viability
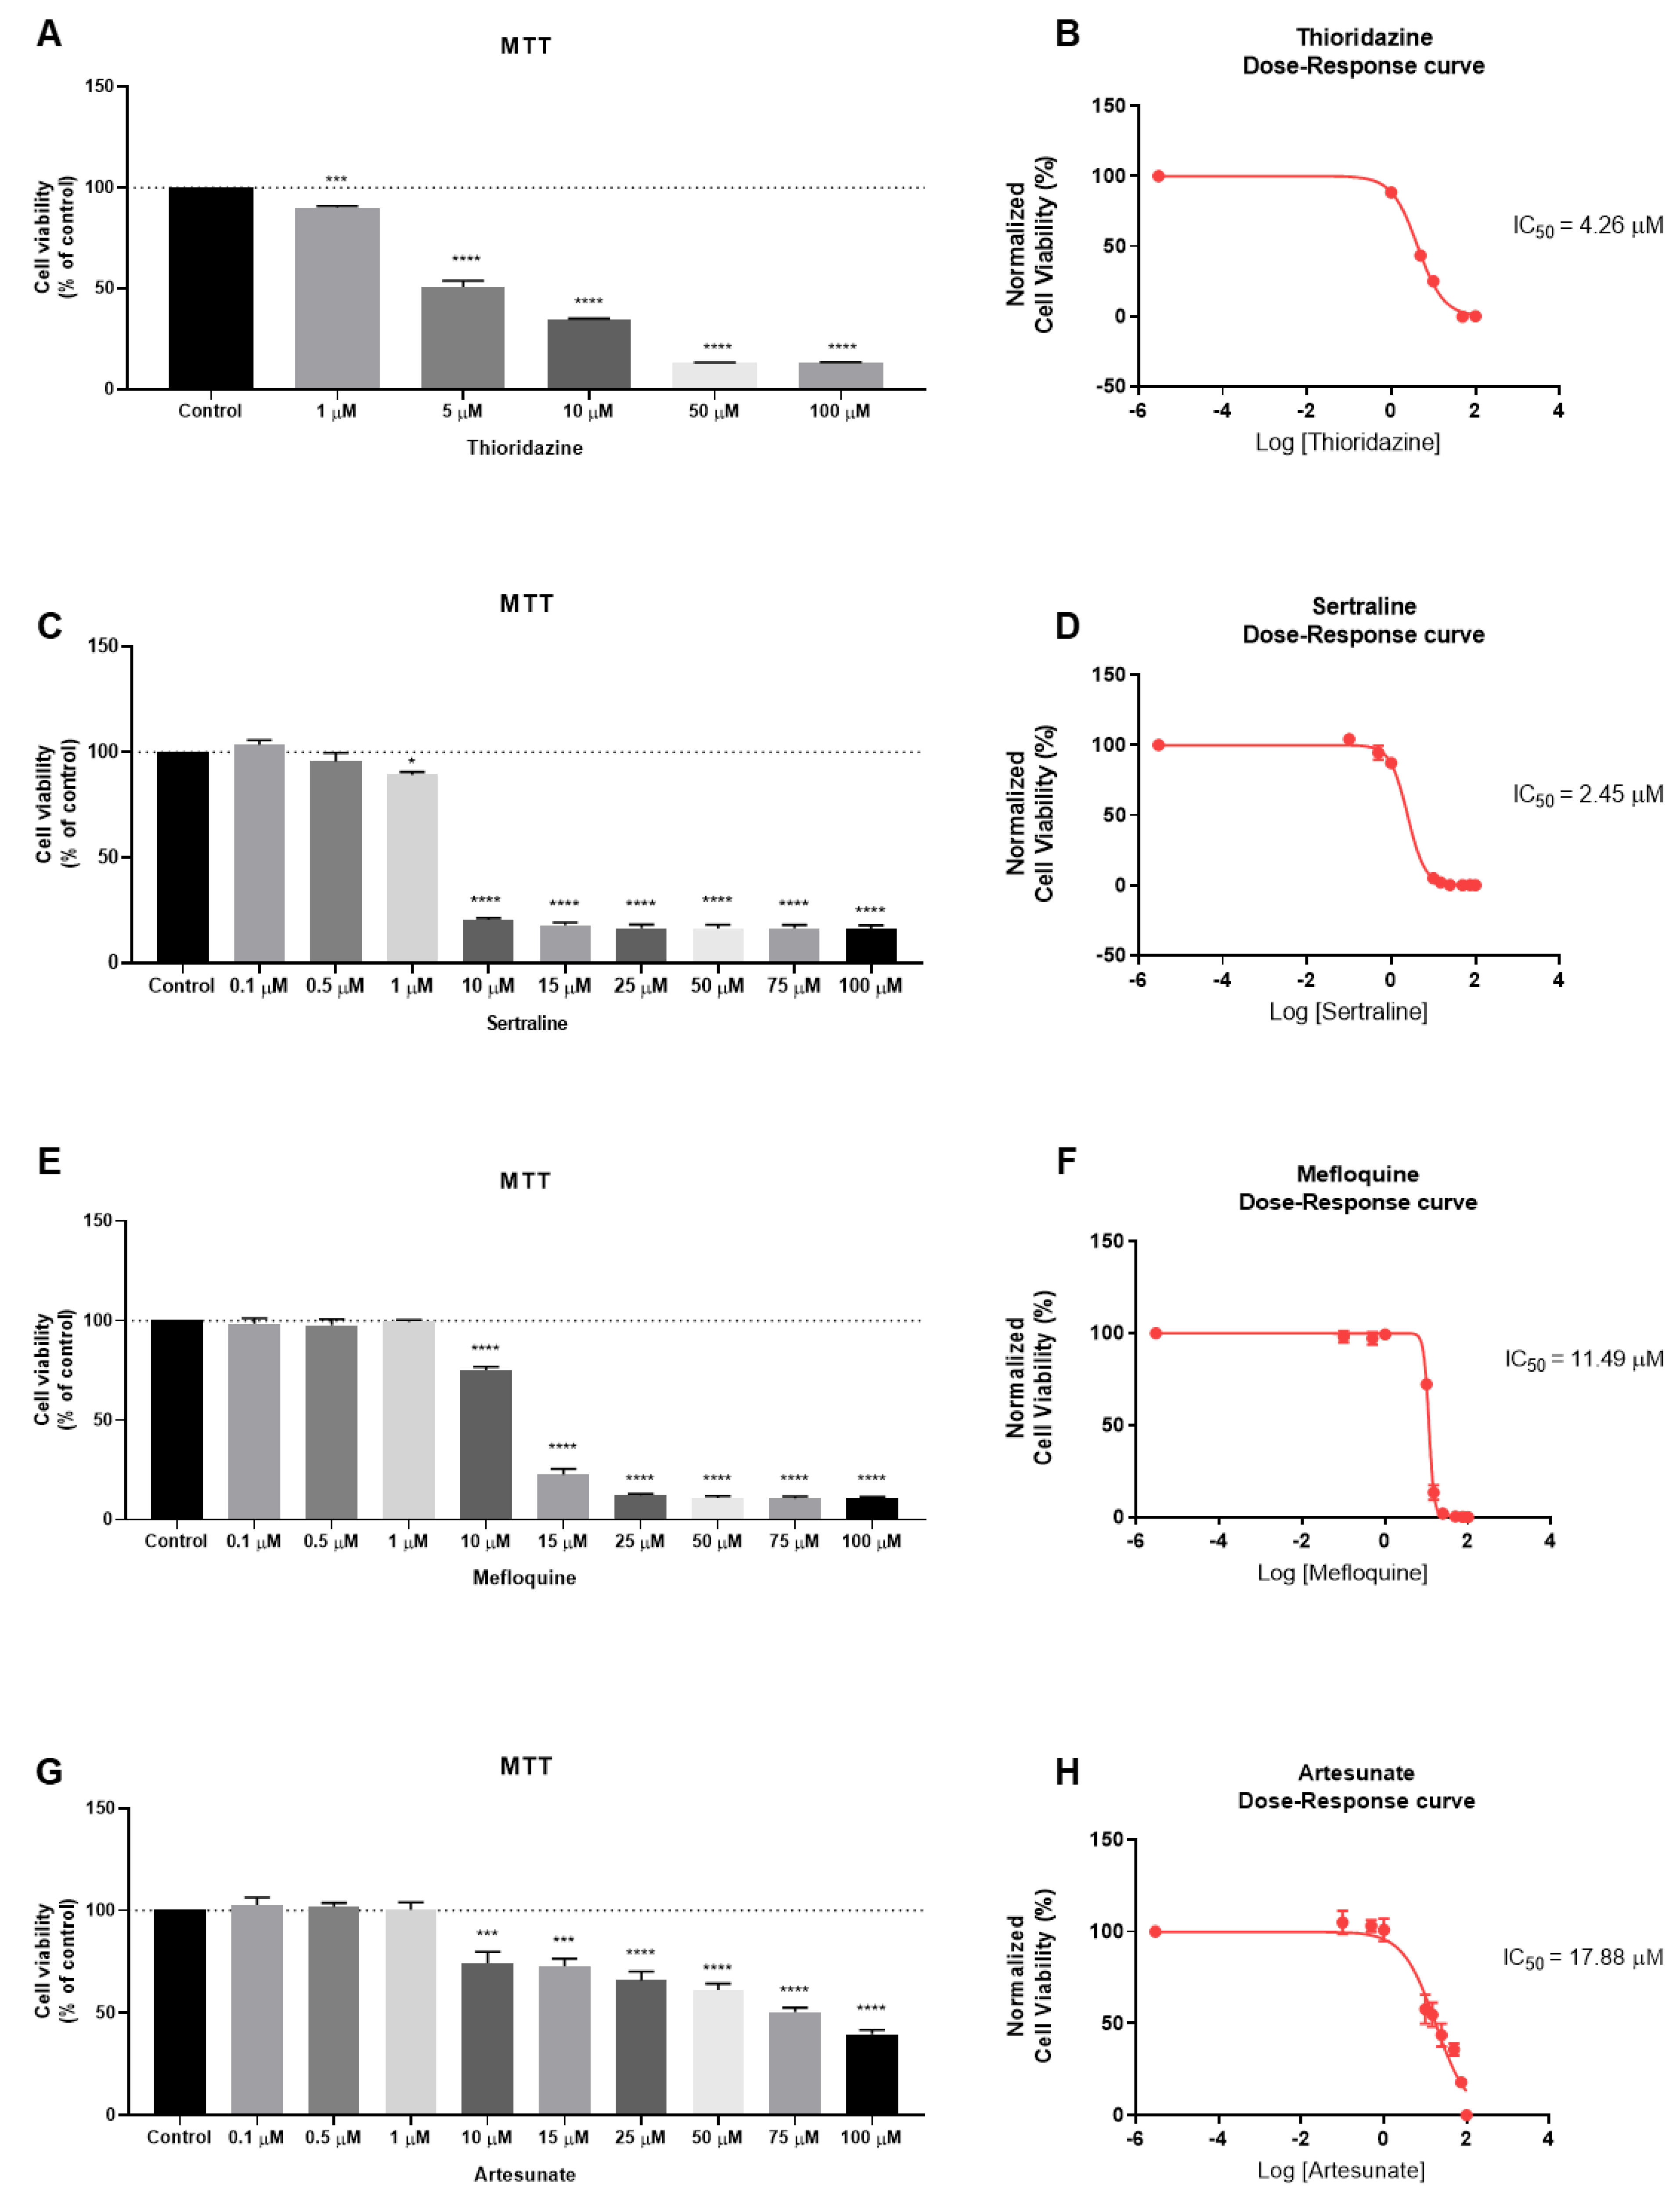
2.1.2. The Effect of CNS Drugs and Antimalarial Drugs as Single Agents on Cellular Viability
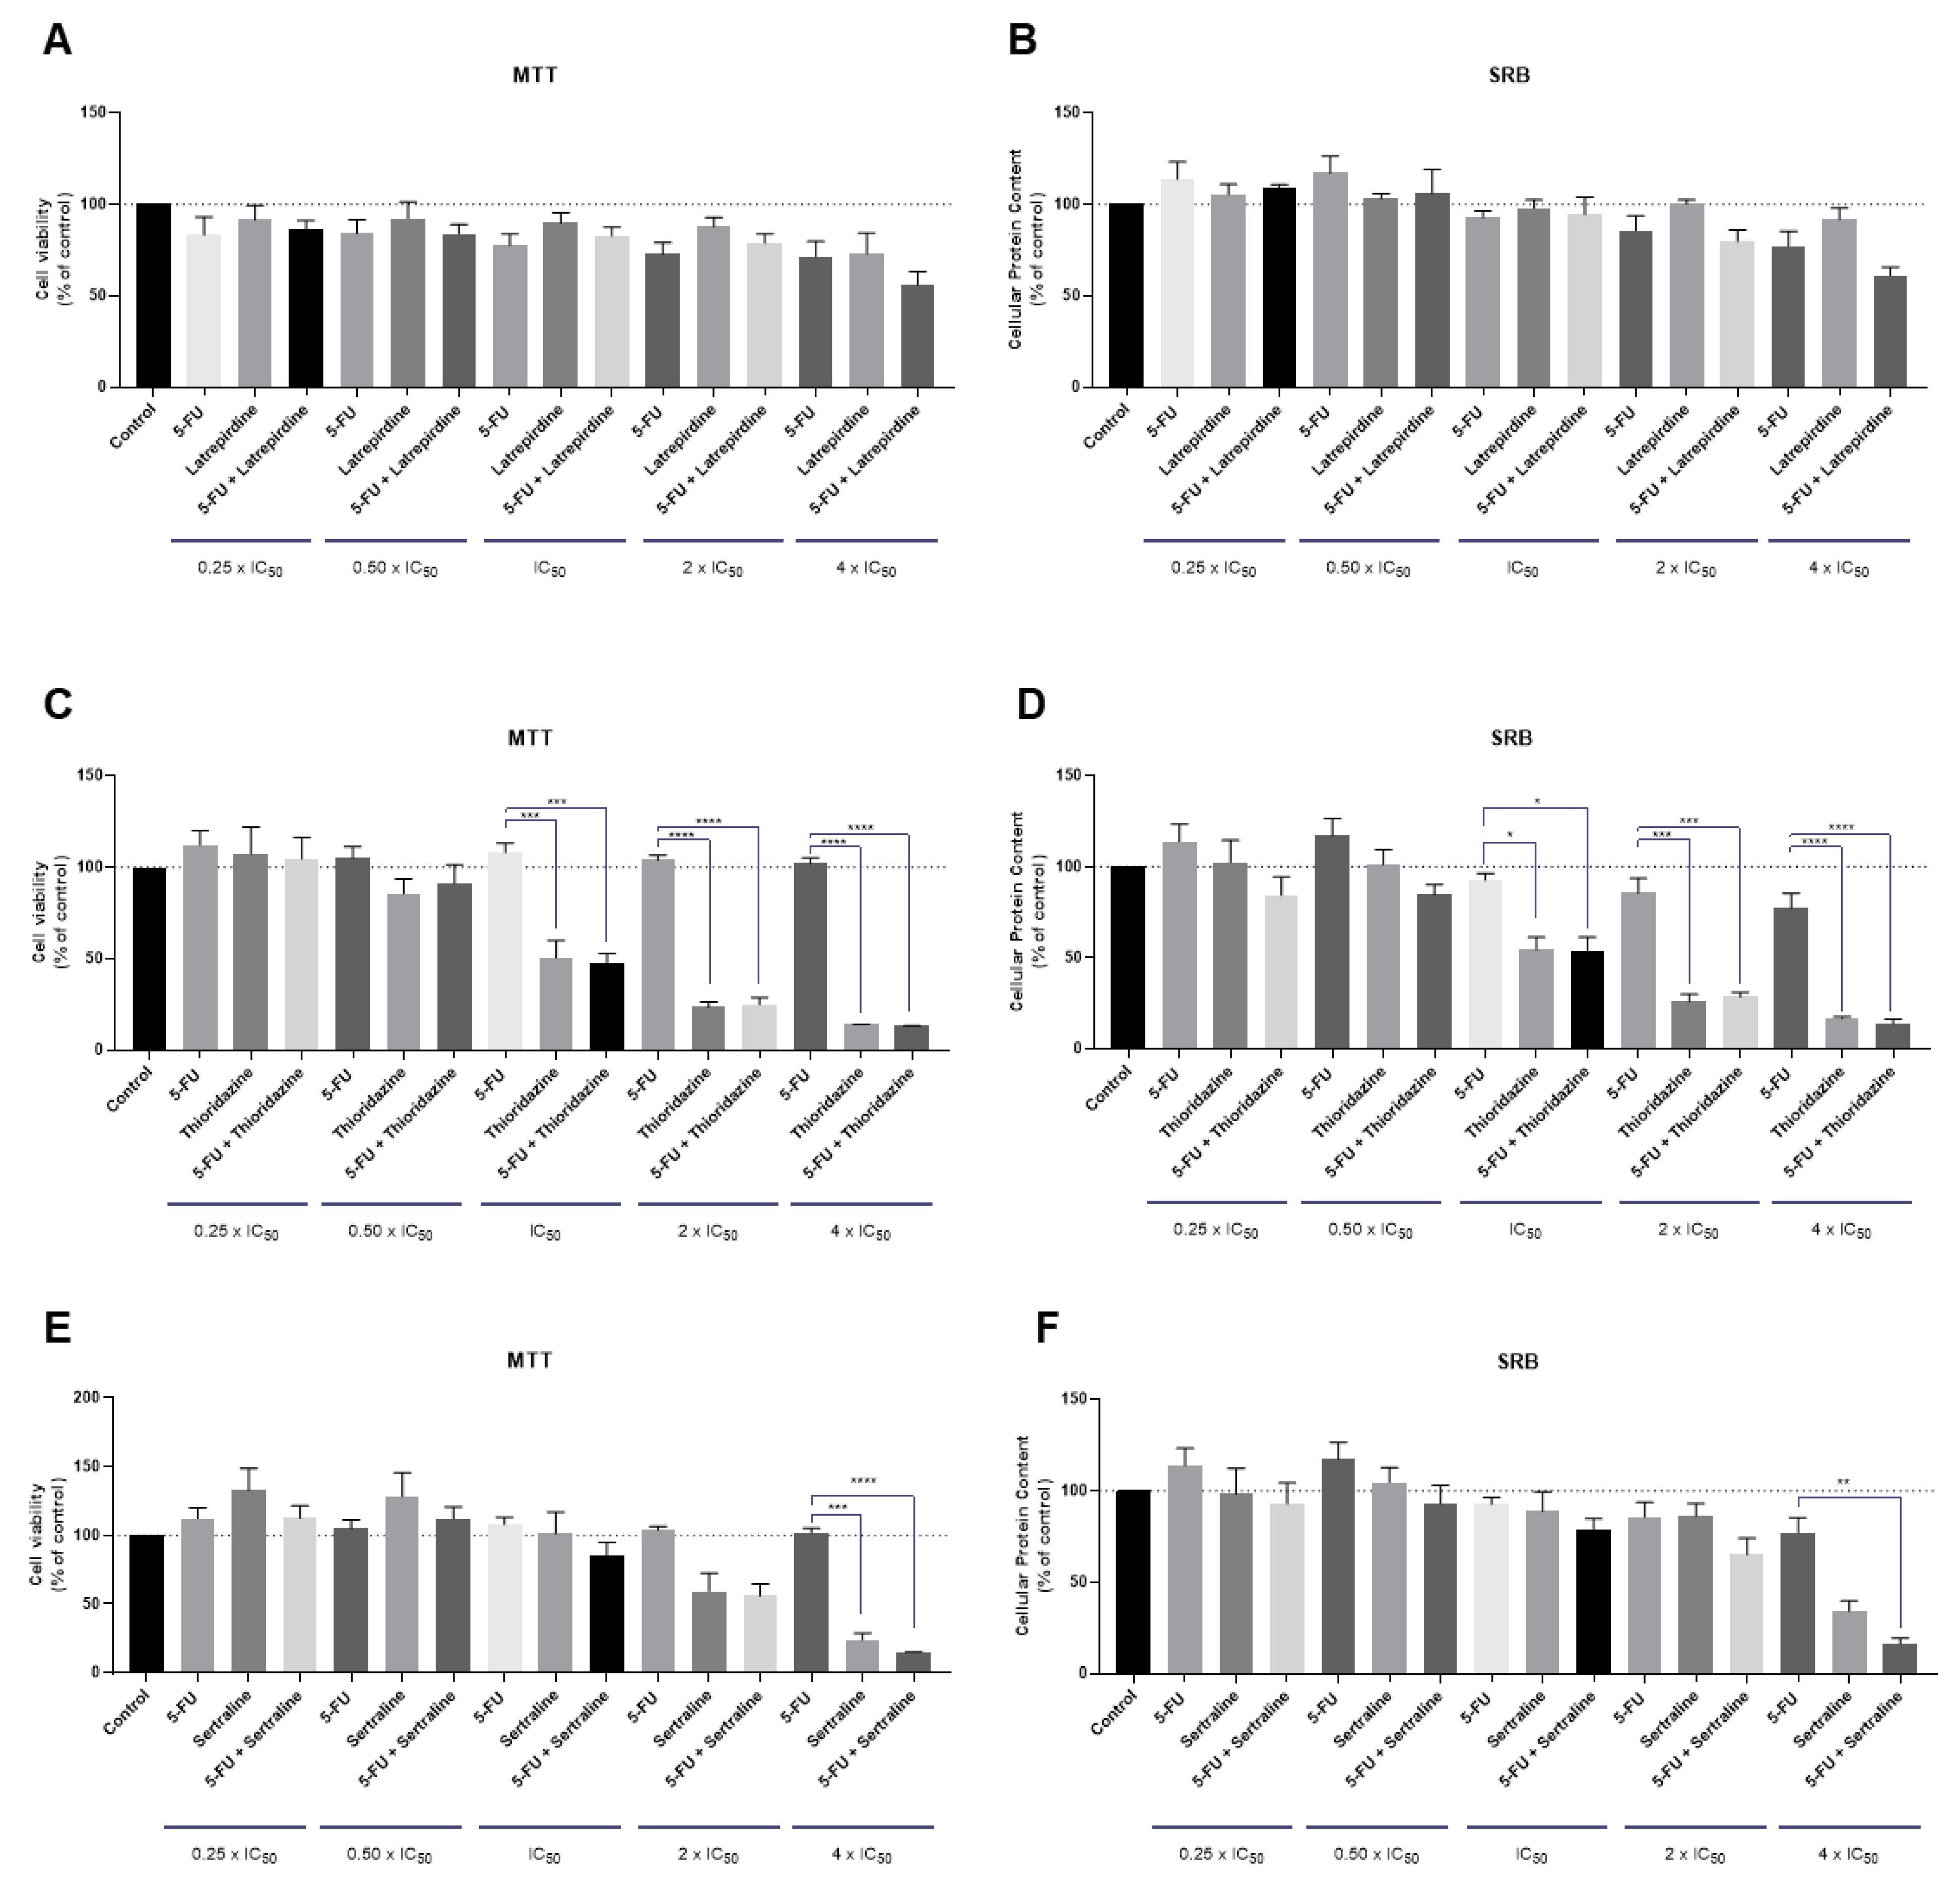
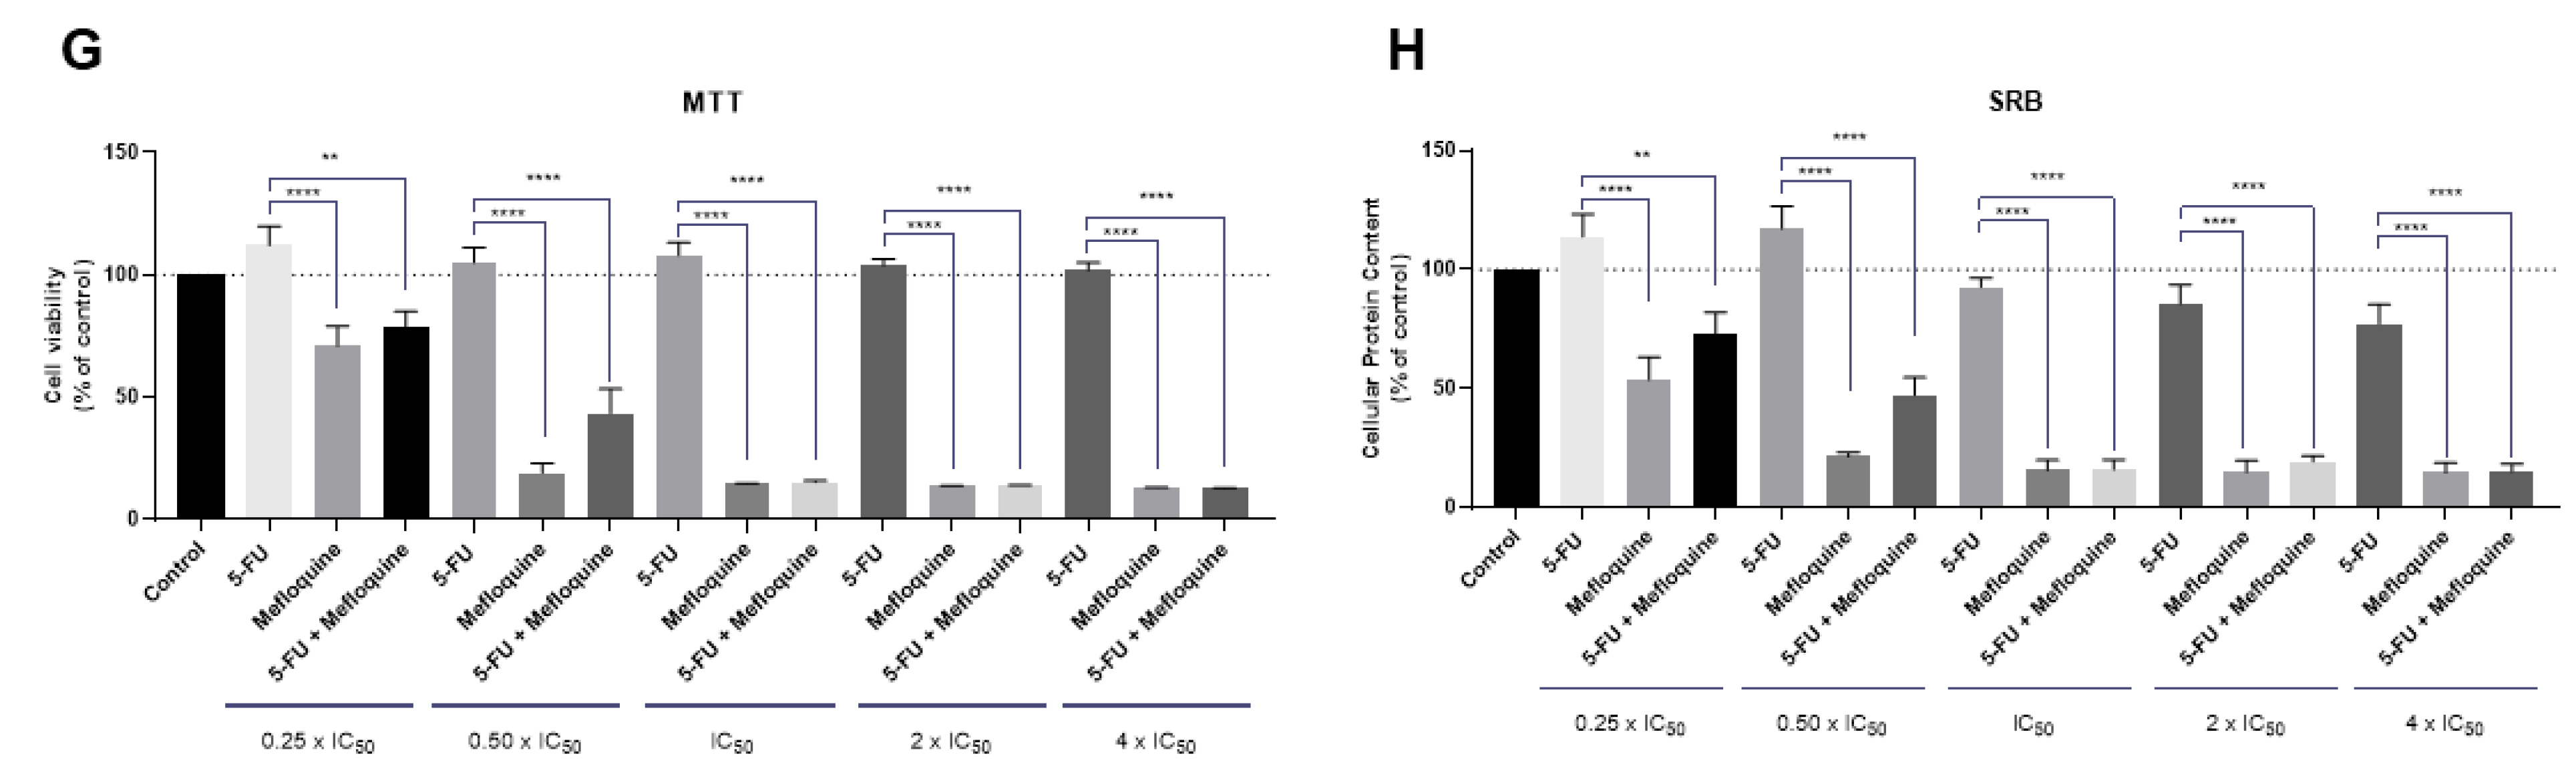
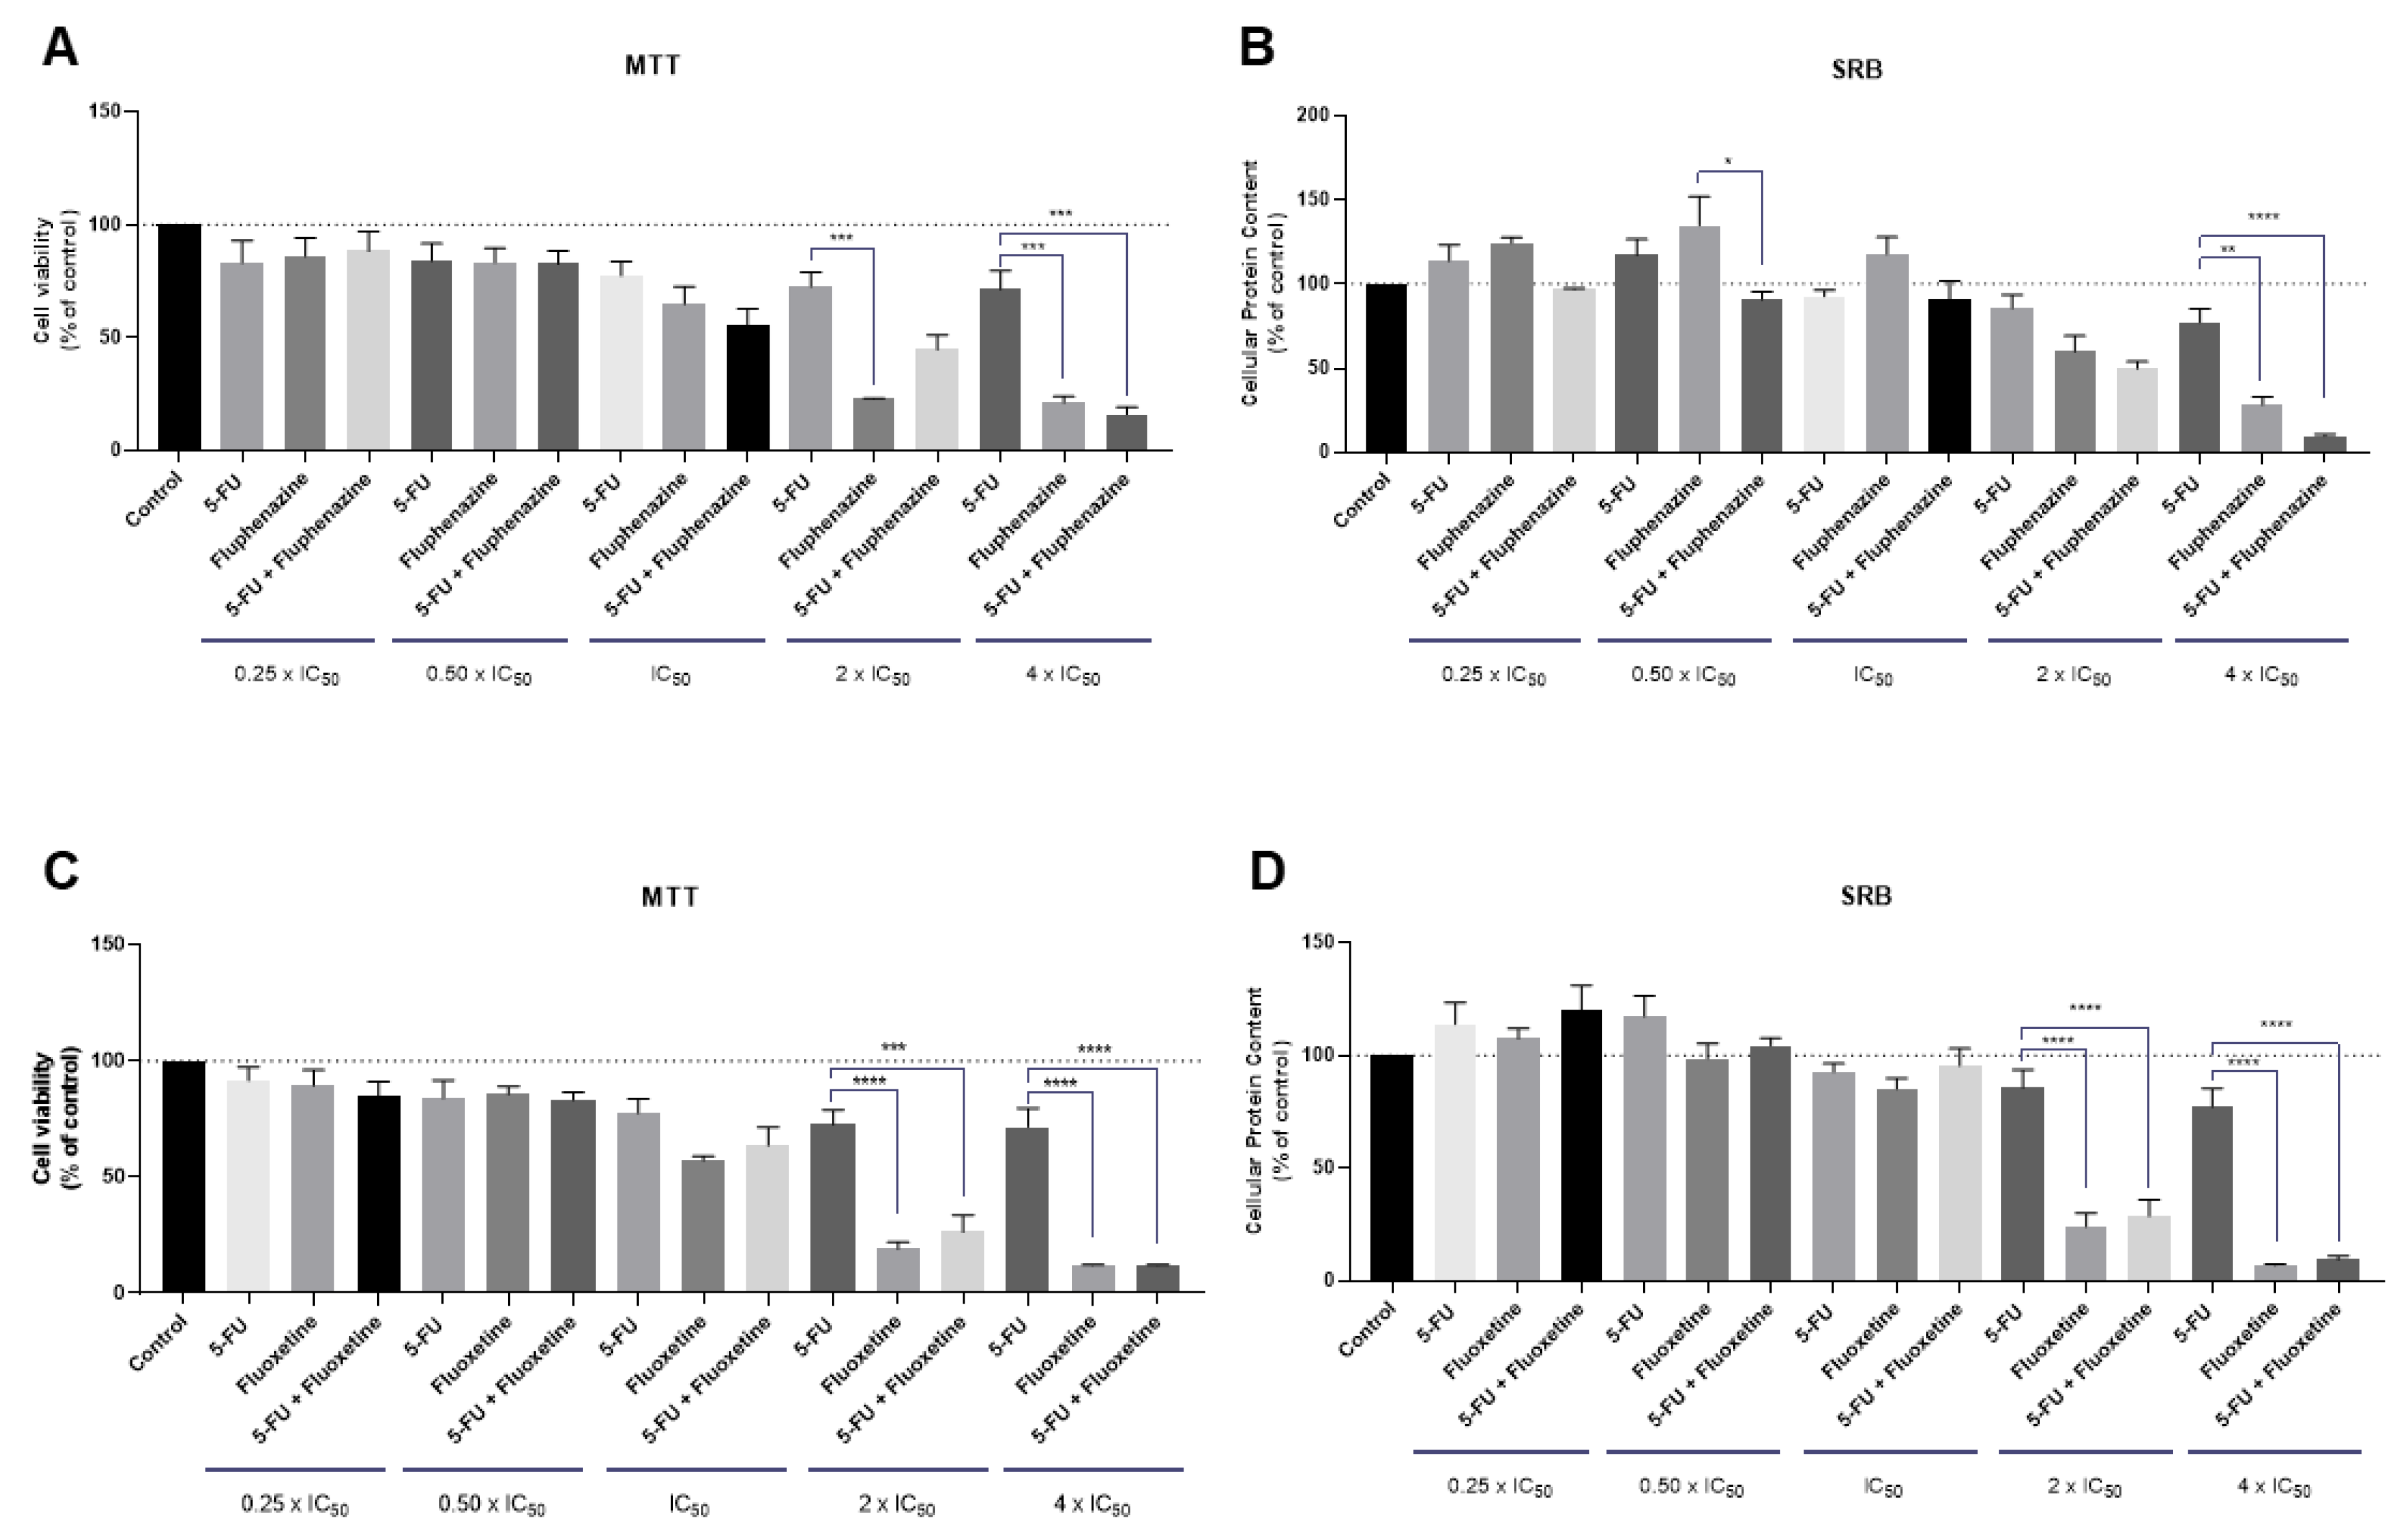
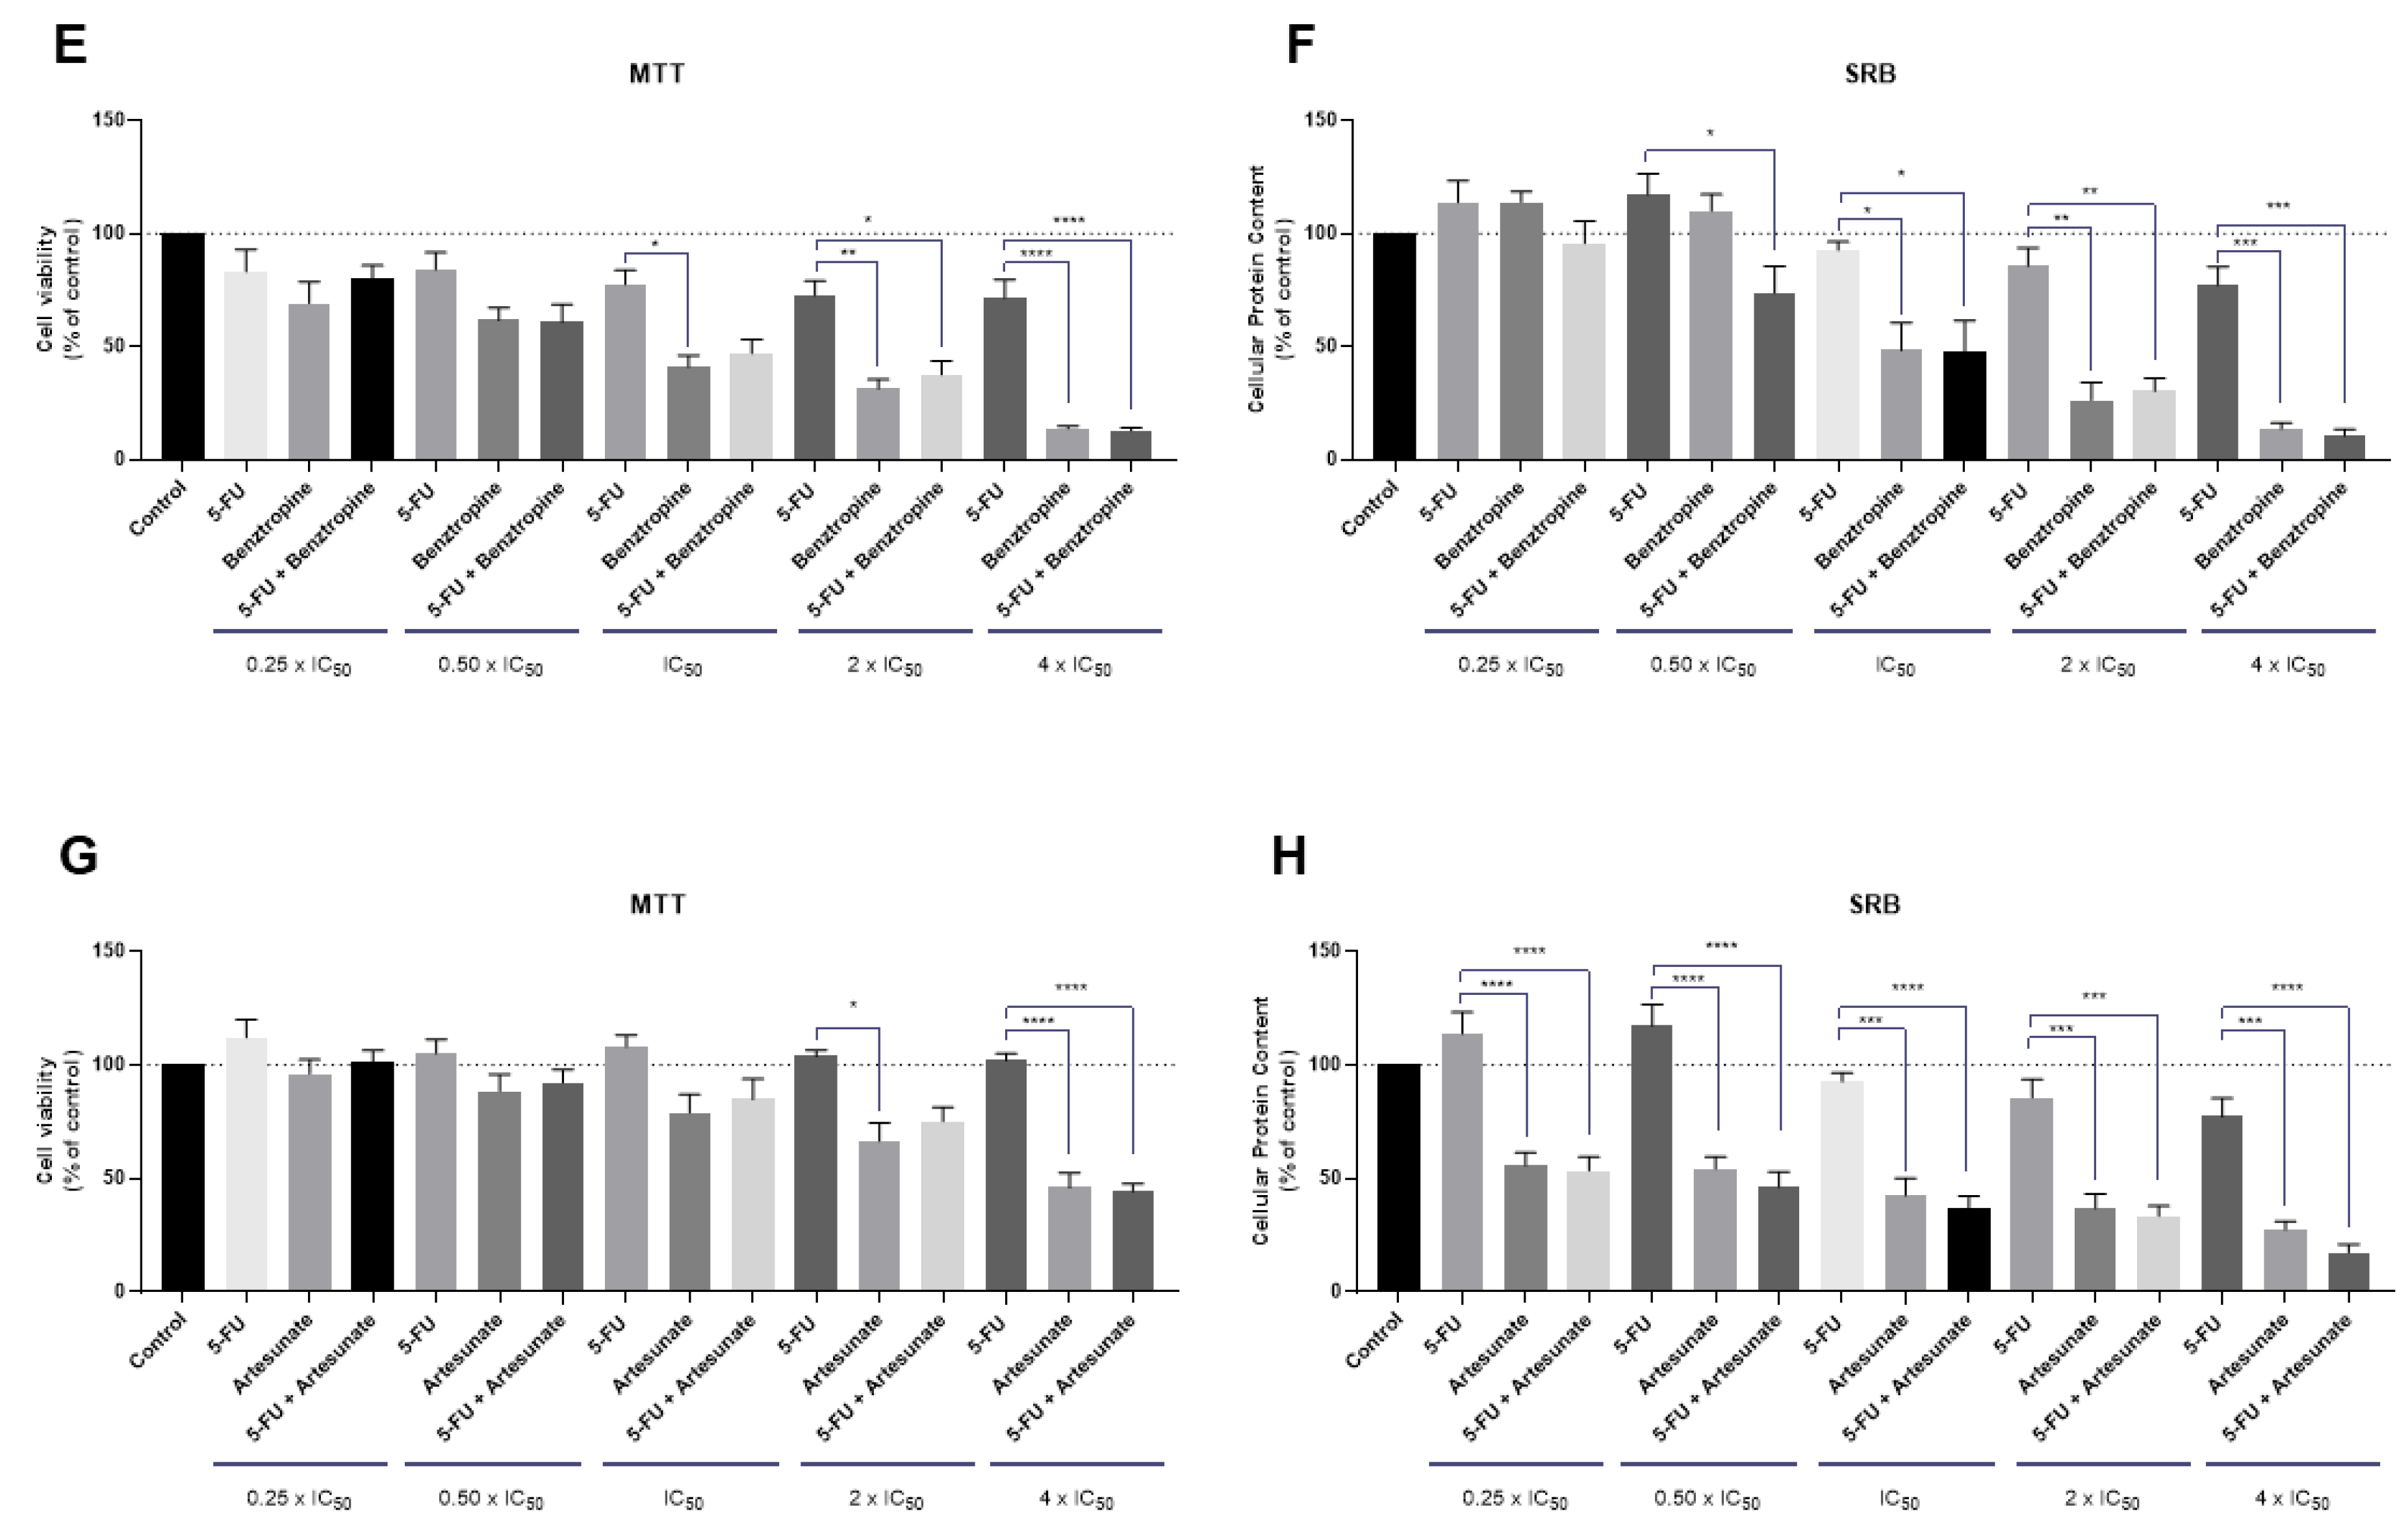
2.1.3. The Effect of Various Combinations of 5-FU and Different CNS Agents and Antimalarial Drugs
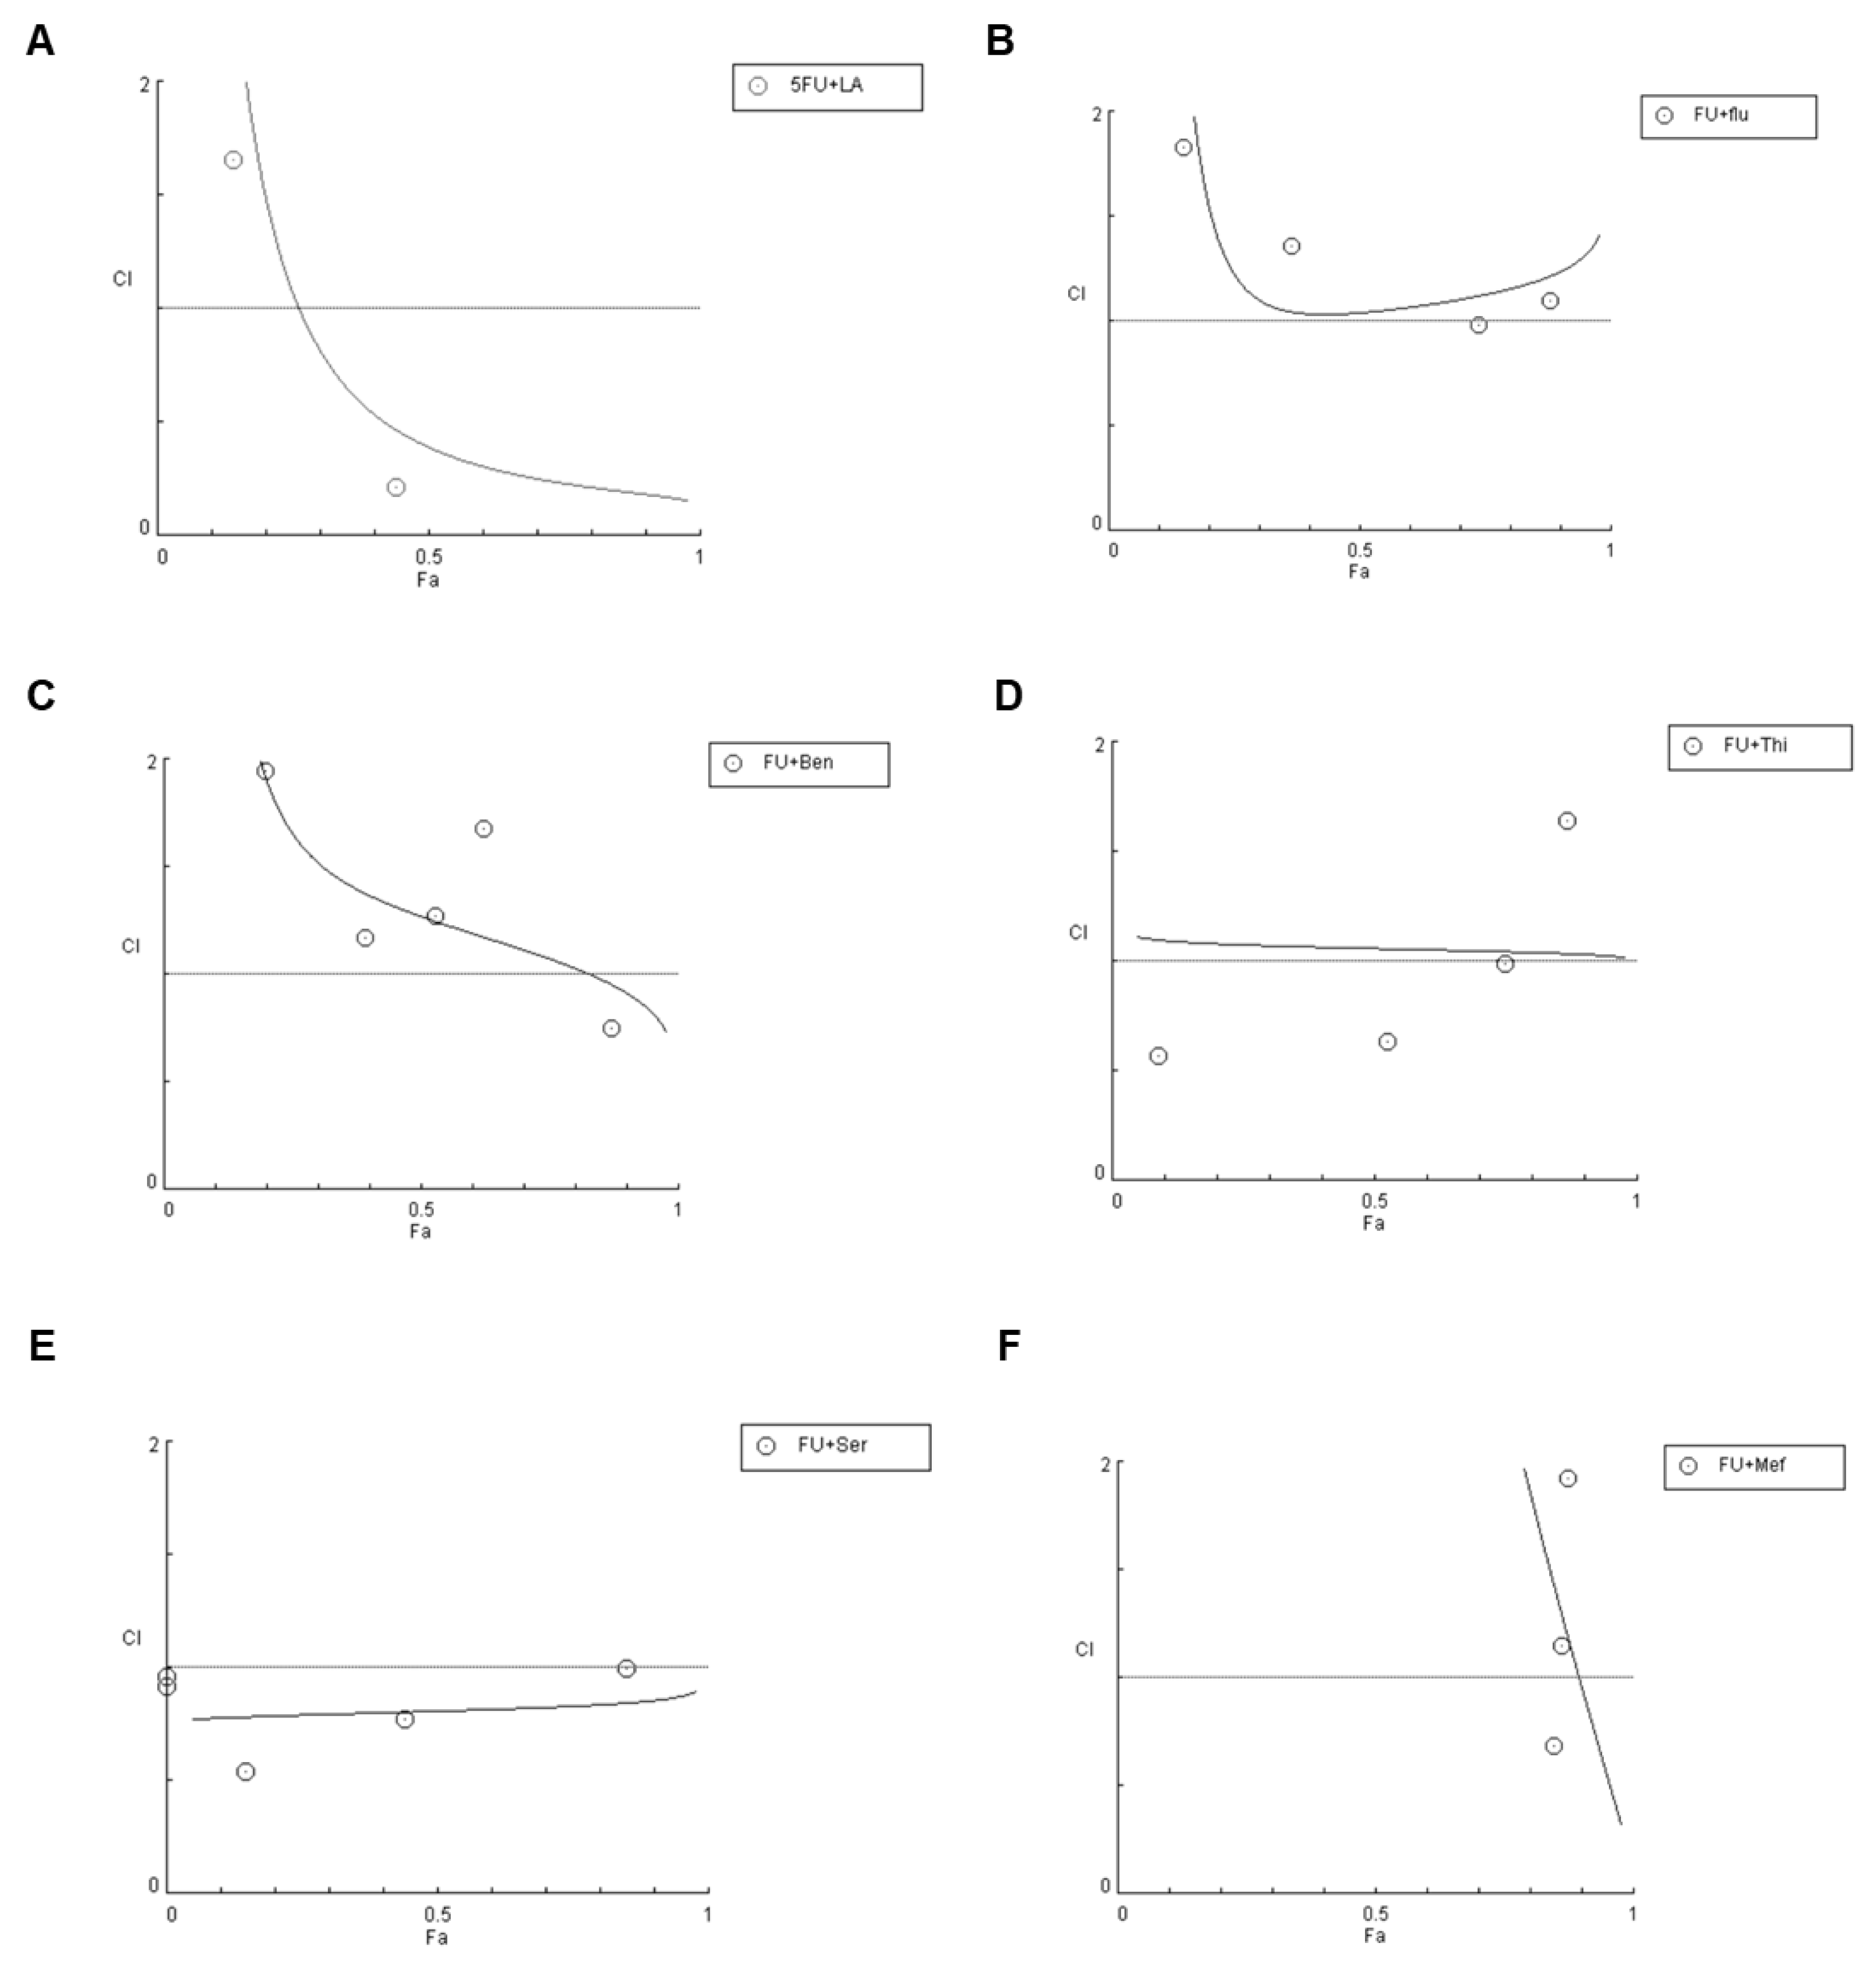
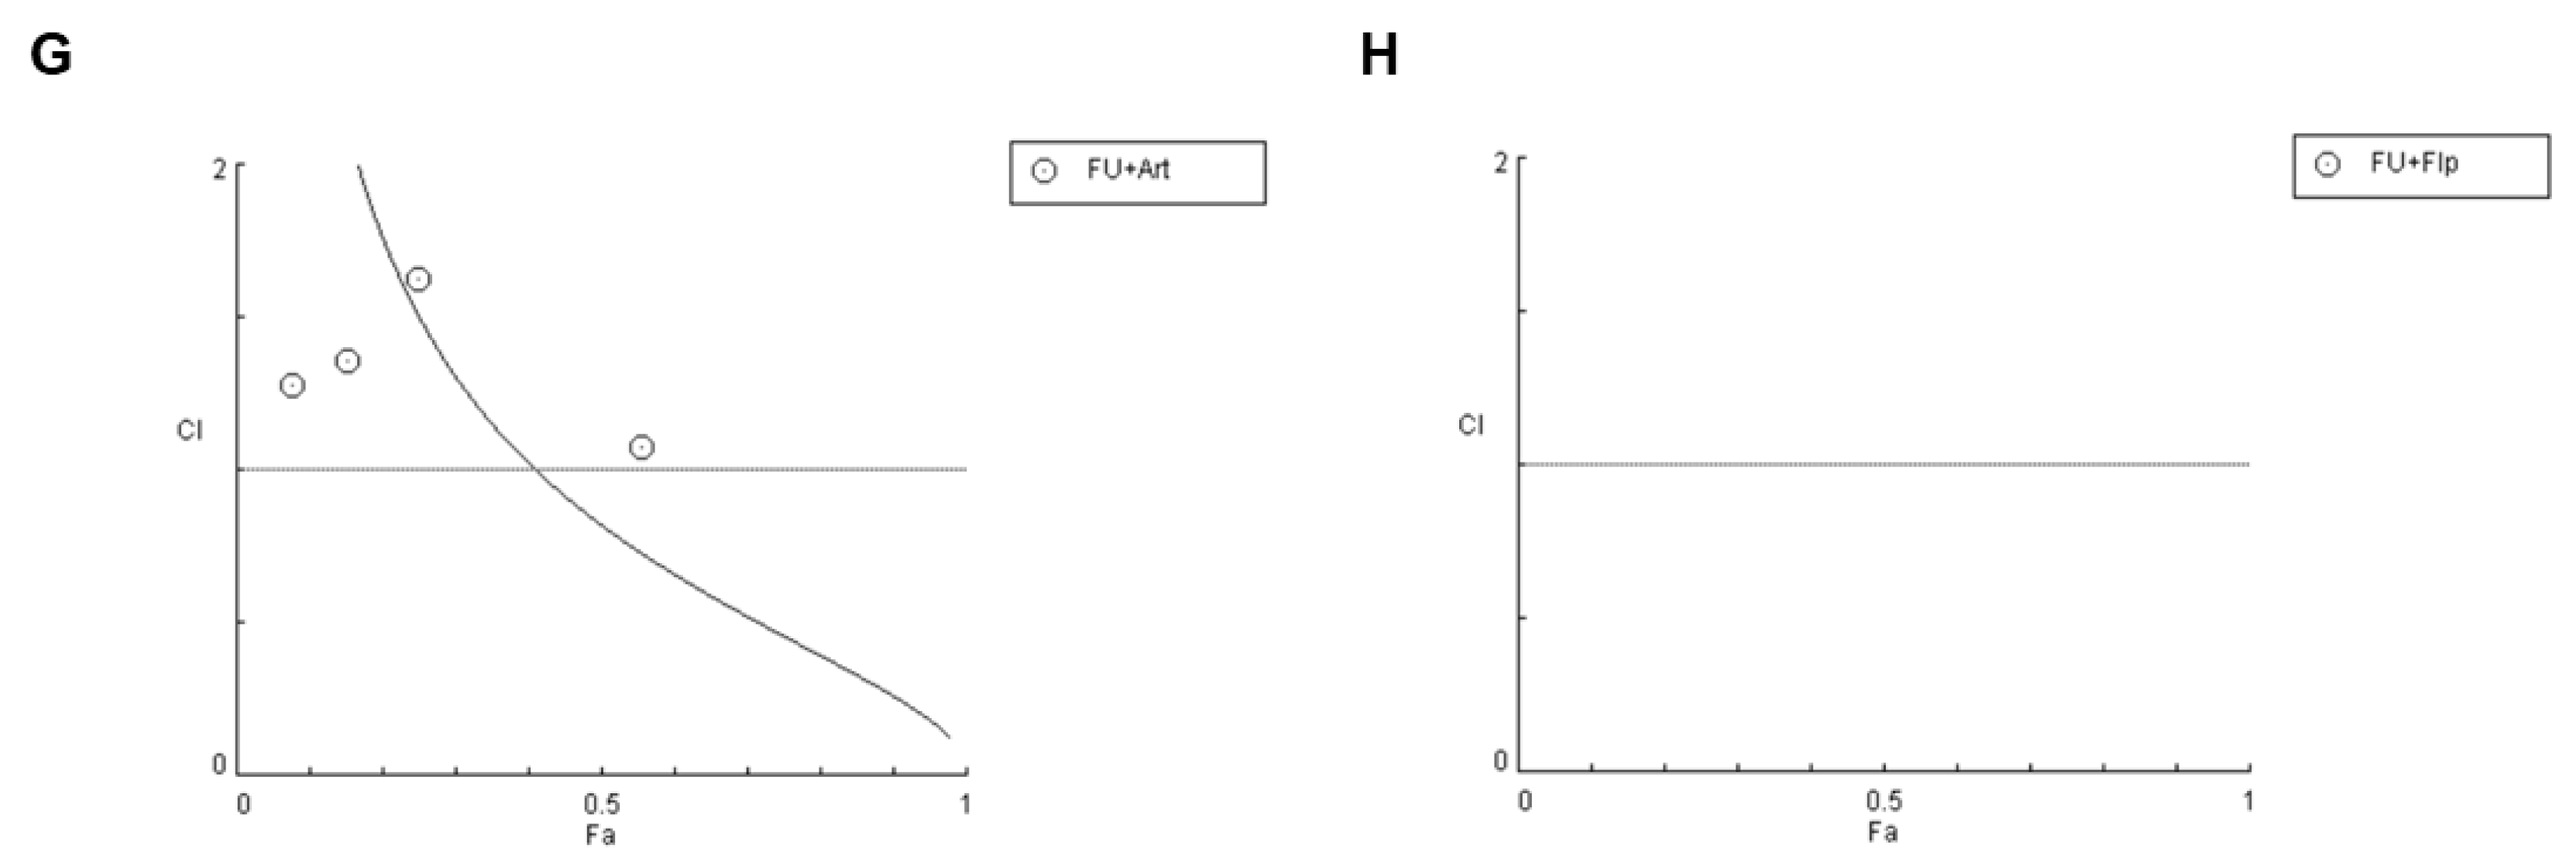
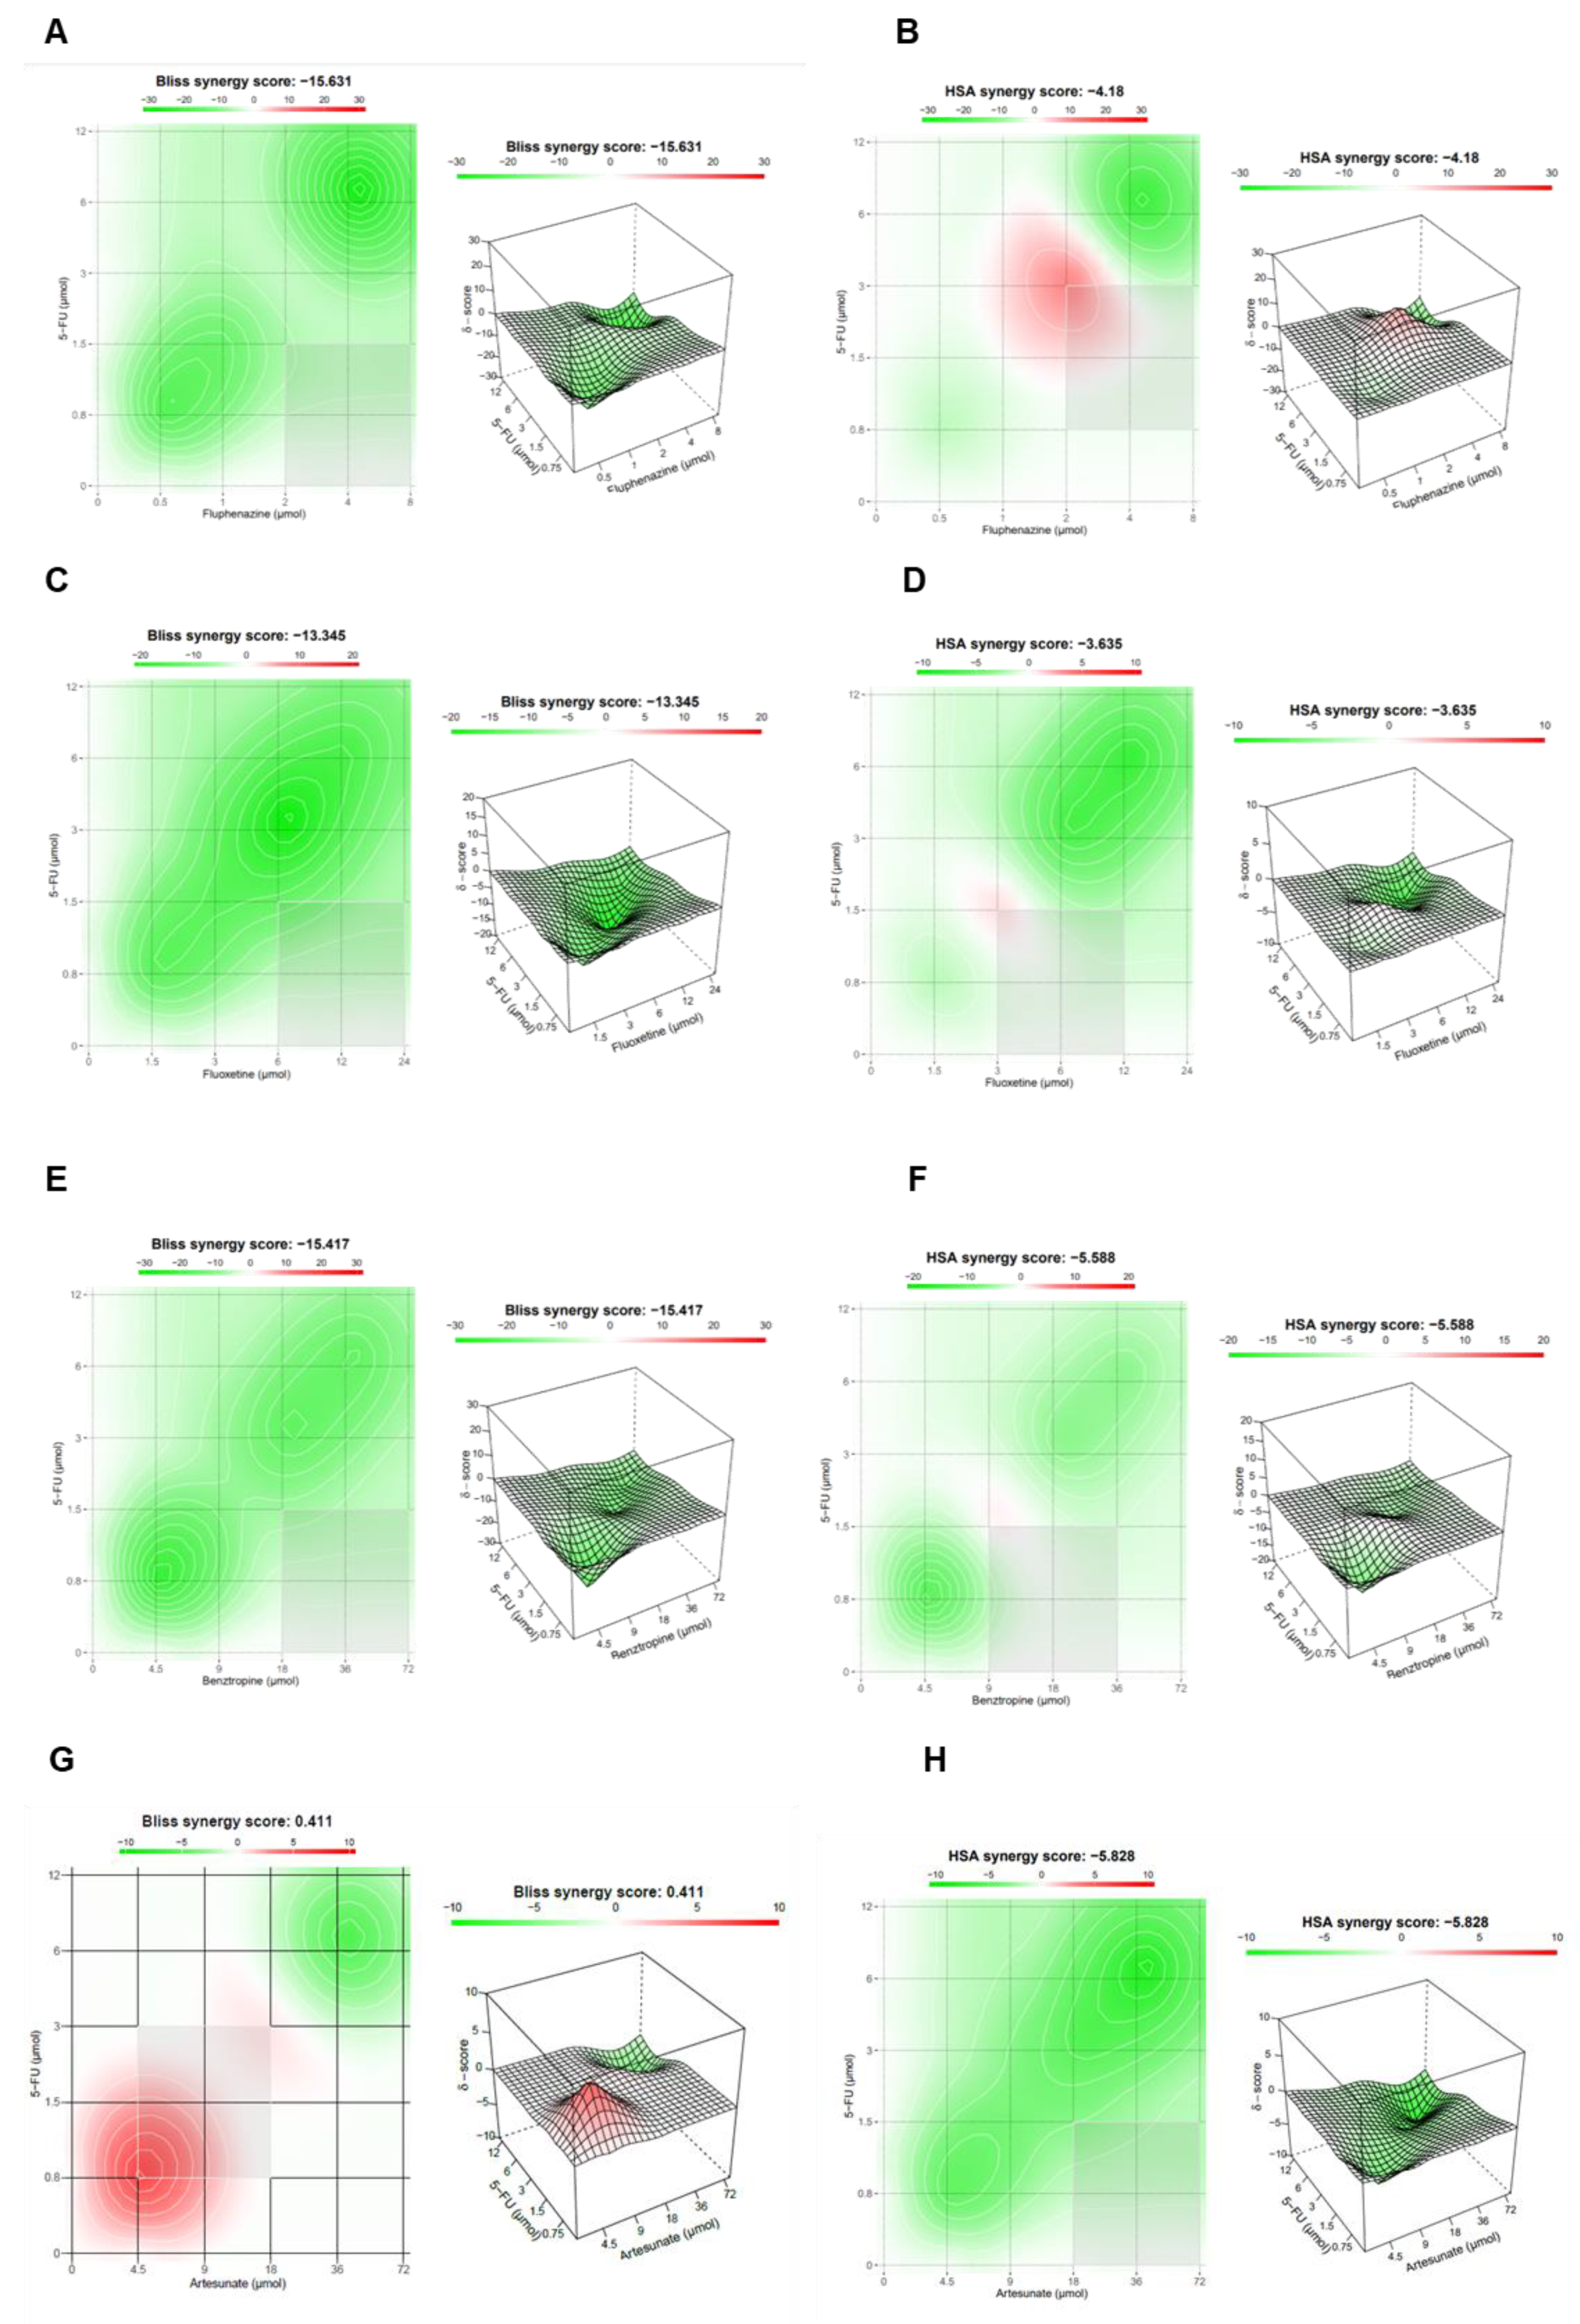
2.1.4. Synergistic Combinations of 5-FU and CNS Agents/Antimalarial Drugs
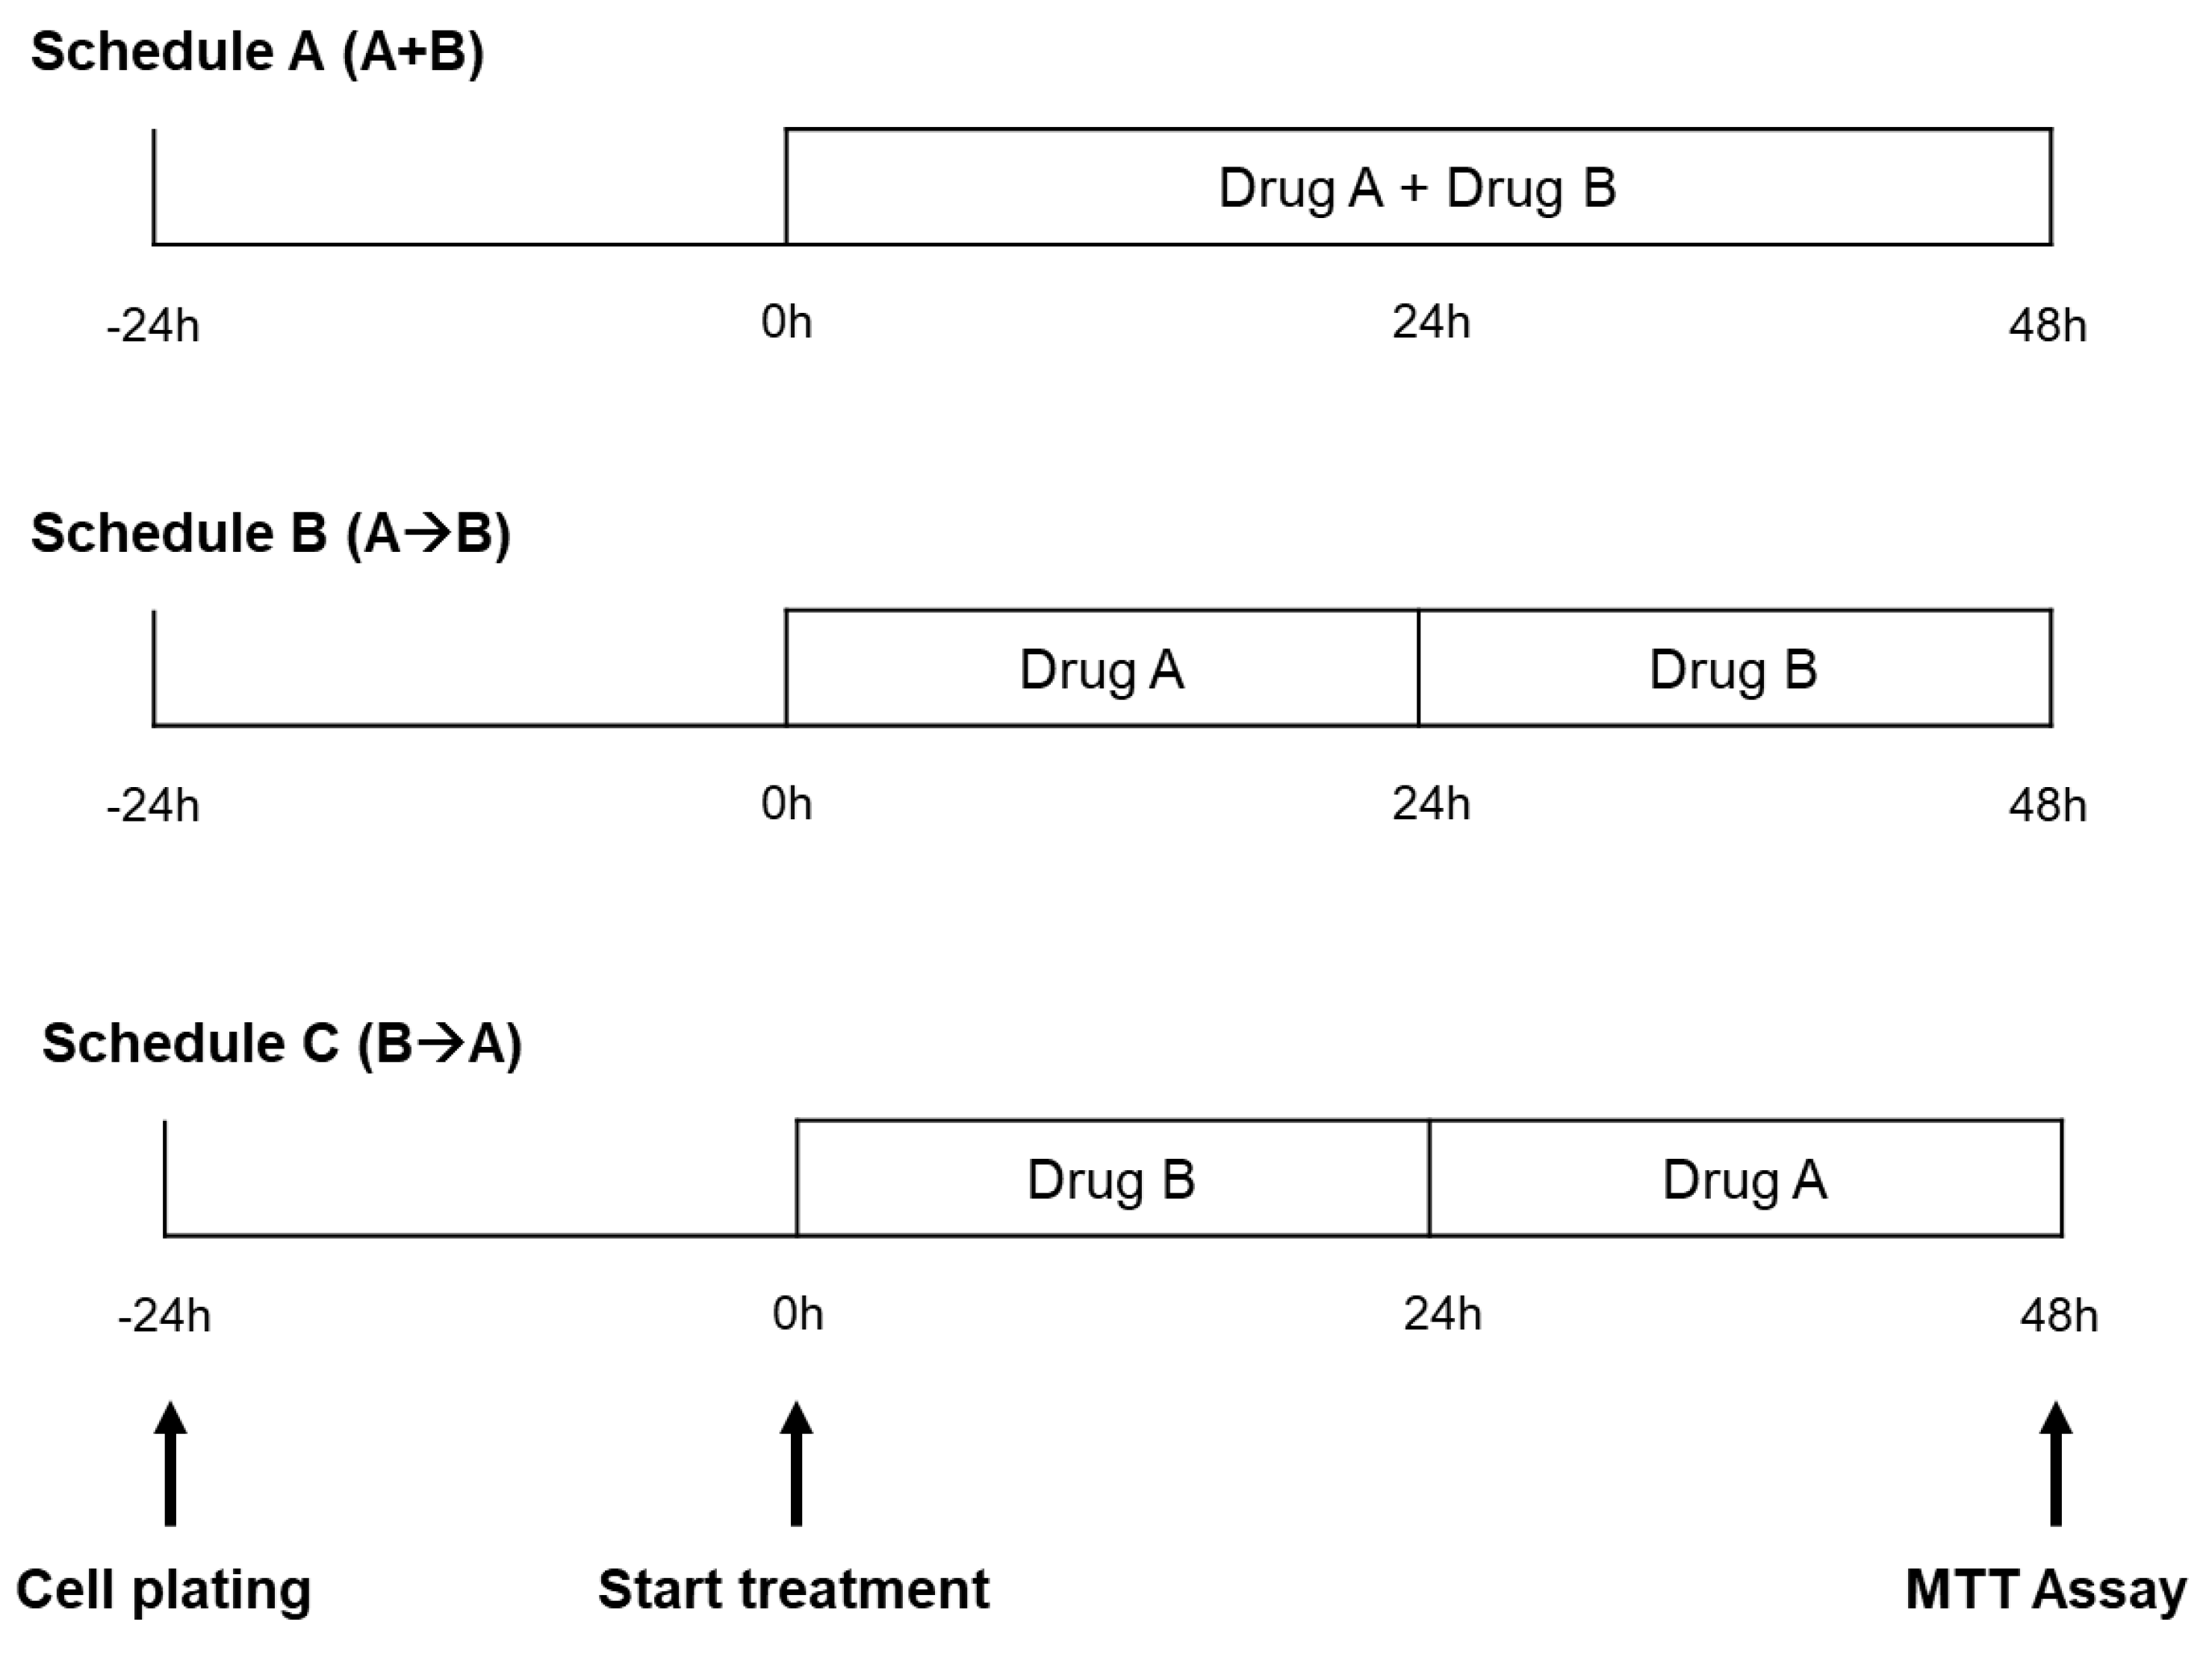
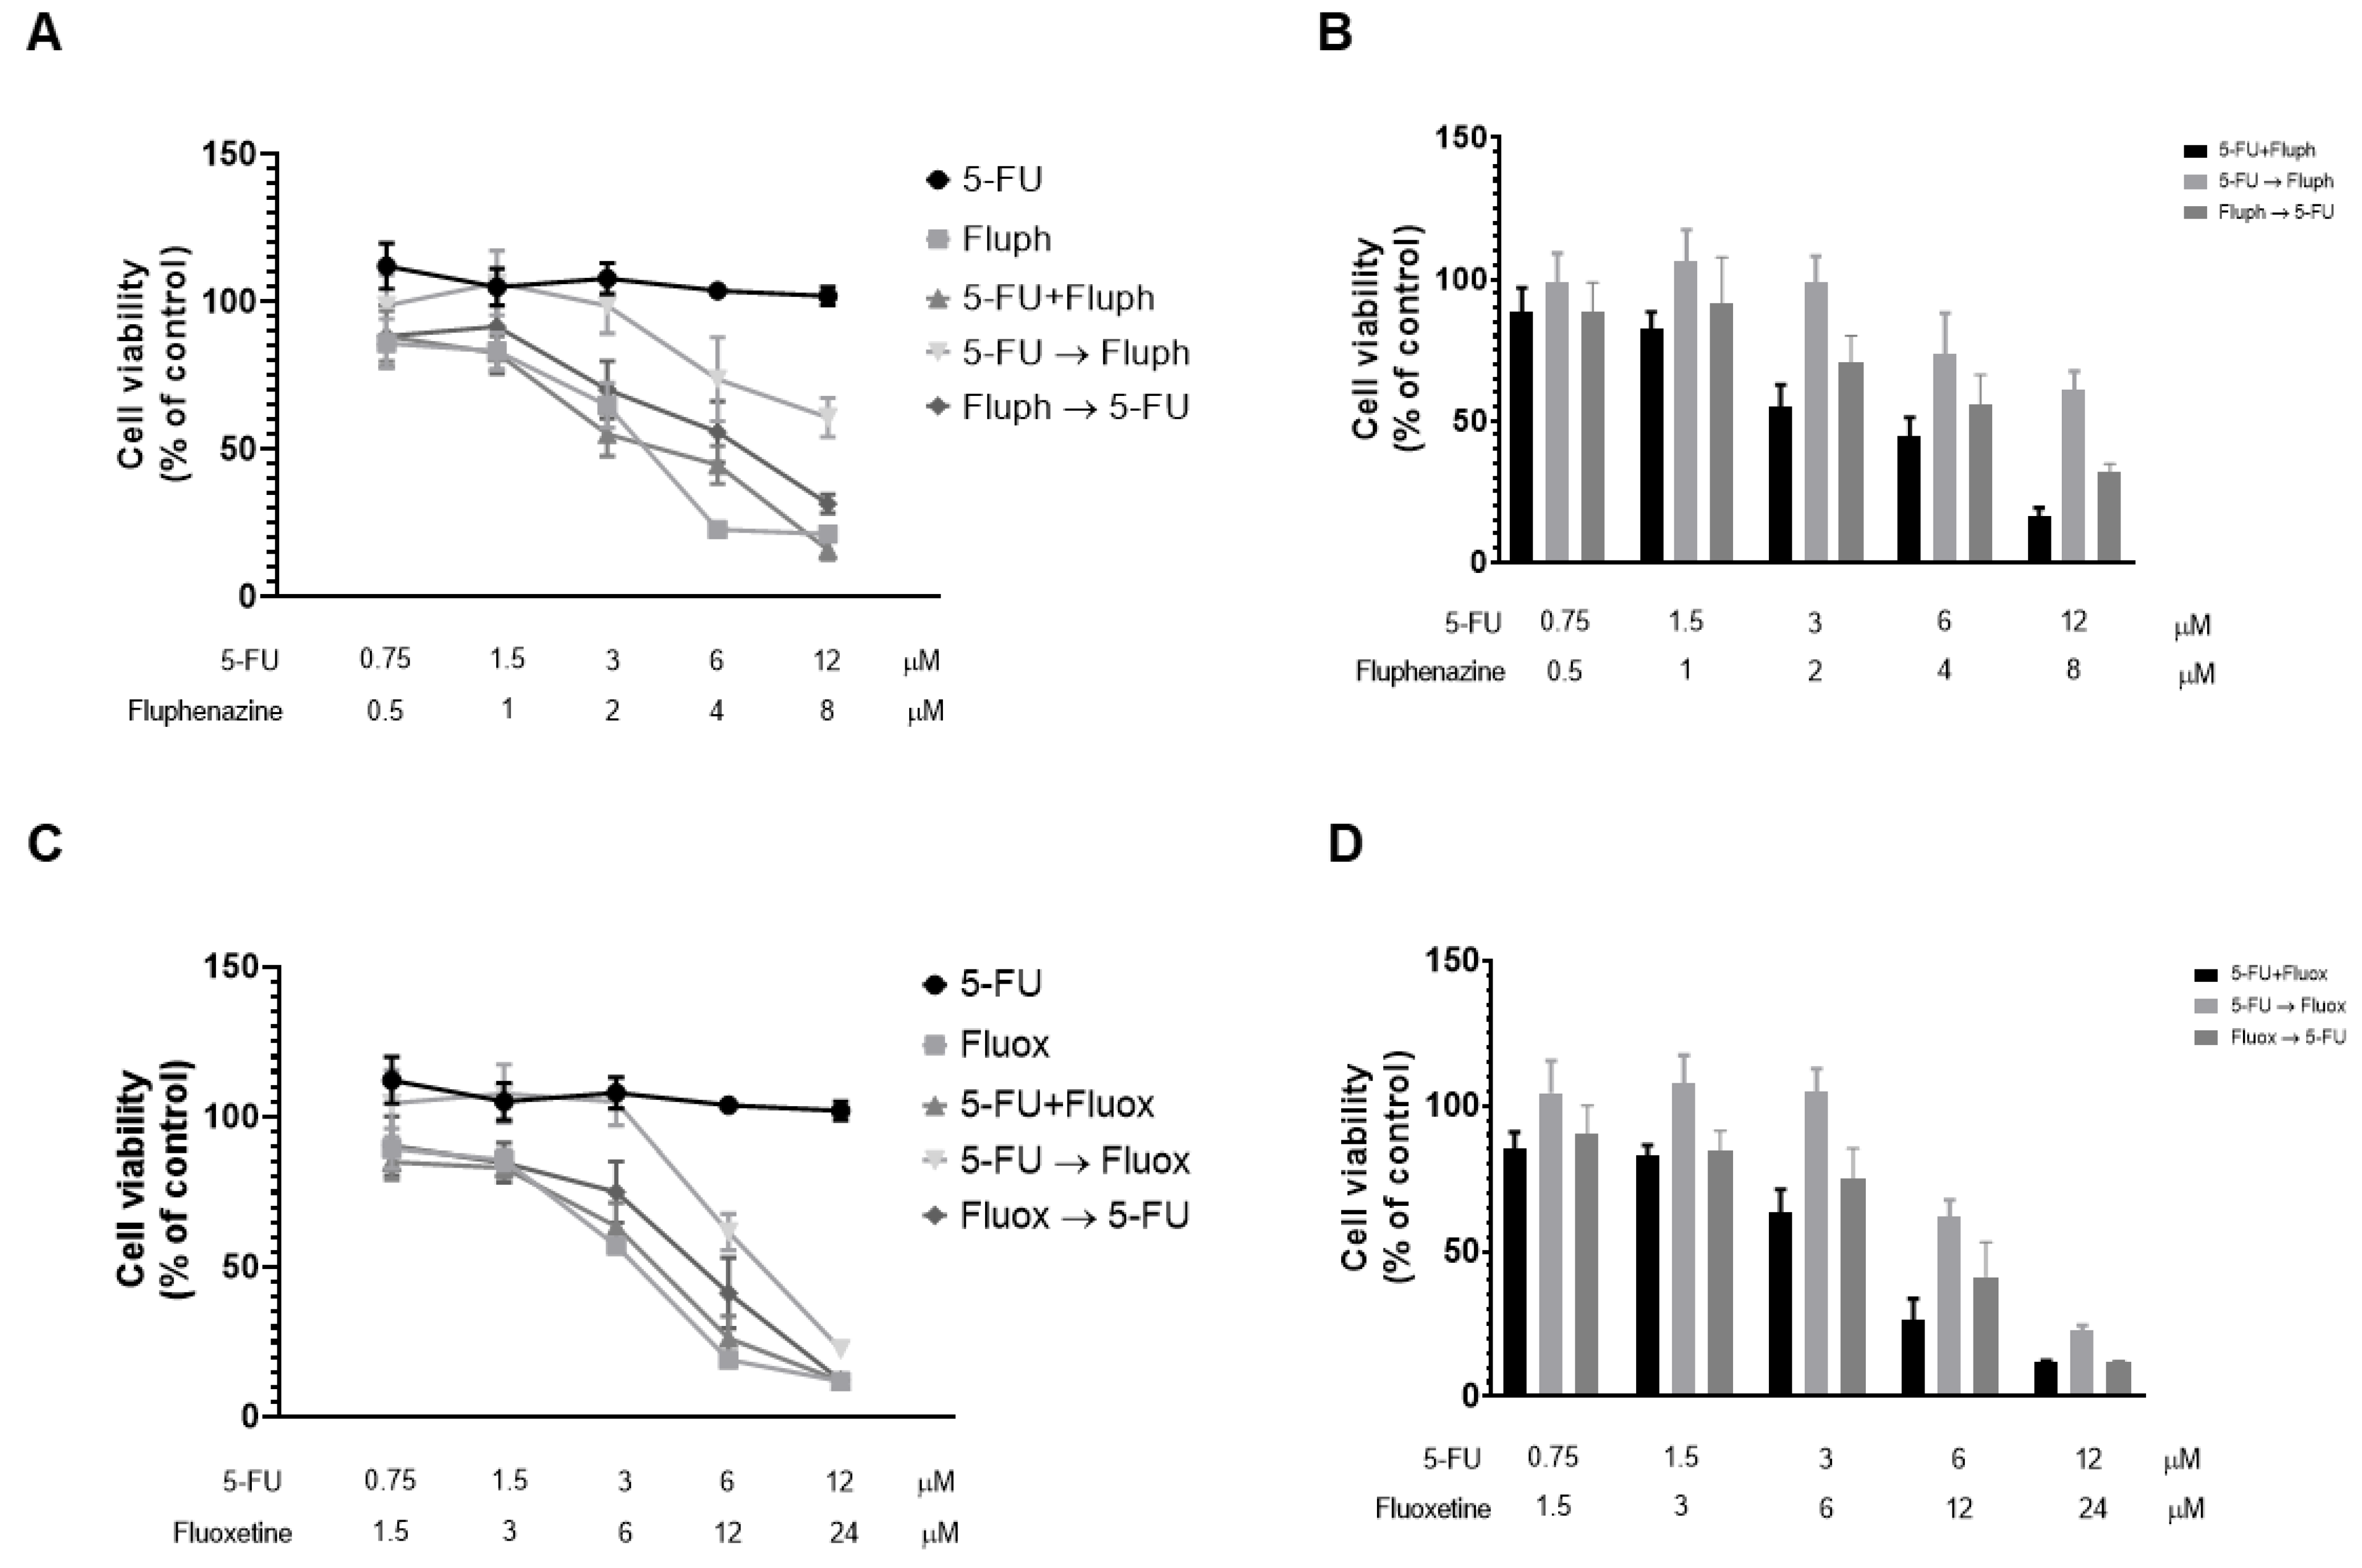
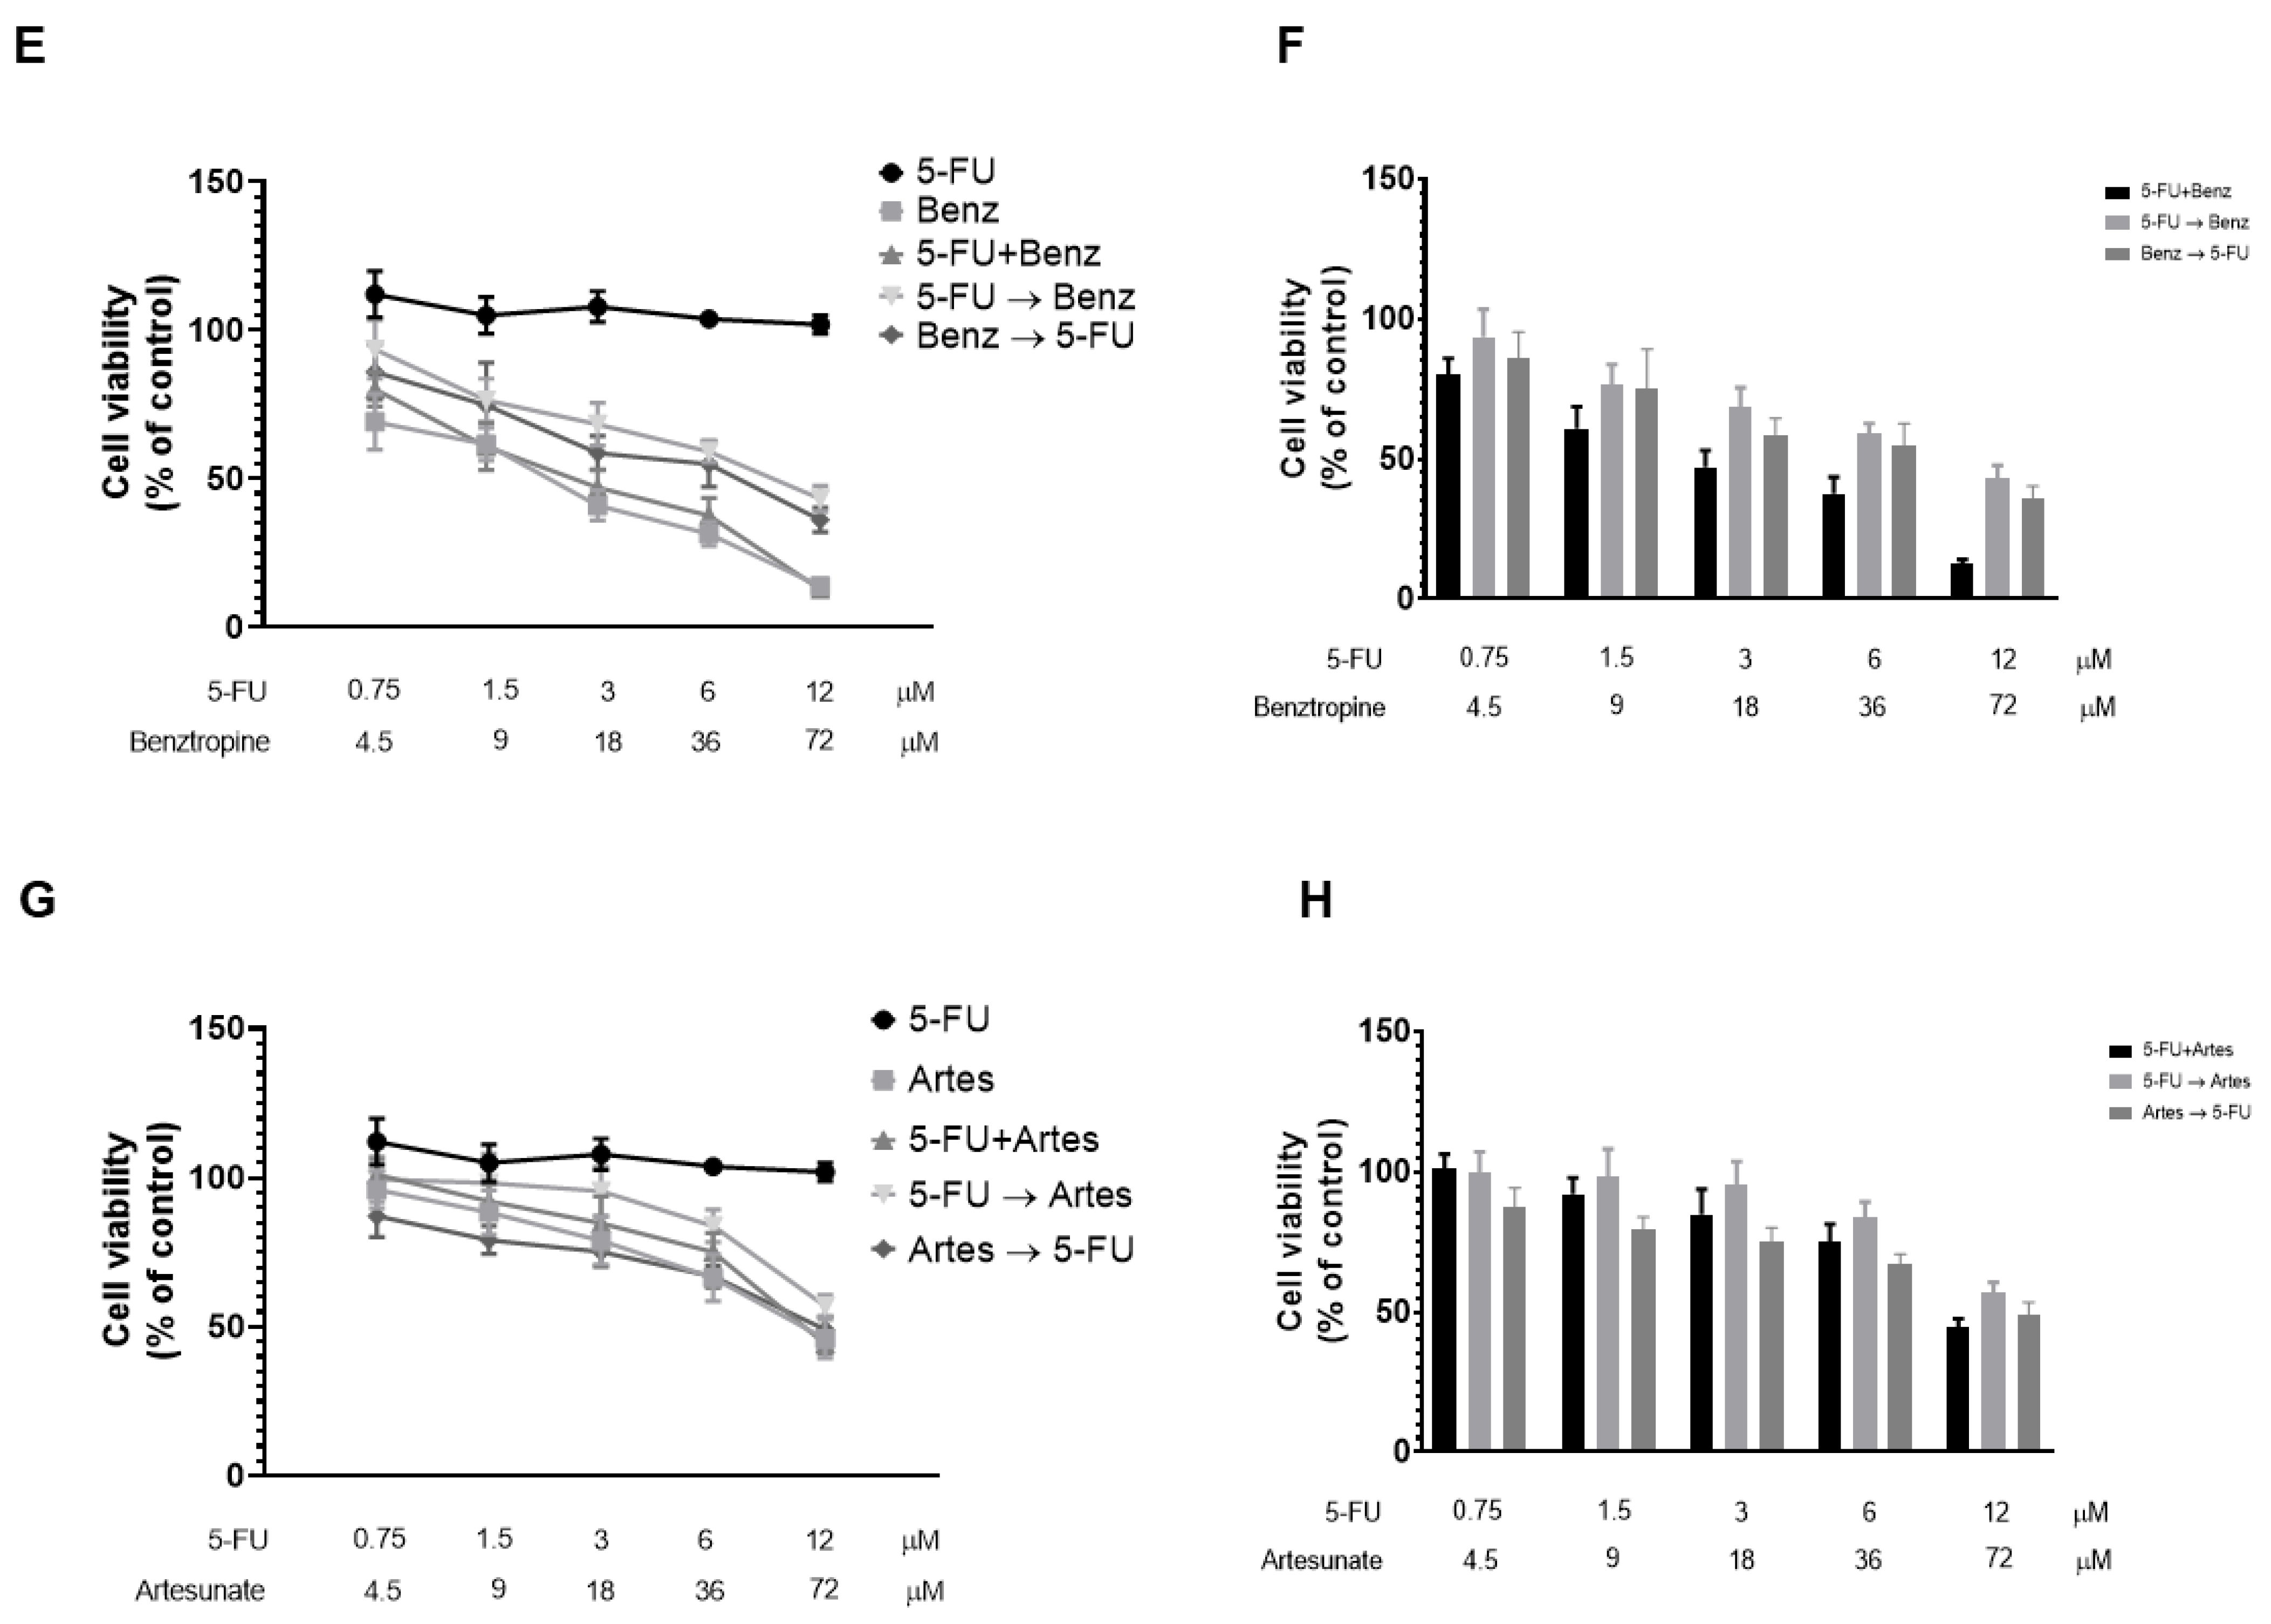
2.1.5. The Effect of Different Combination Schedules of 5-FU and Different CNS Agents and Antimalarial Drugs
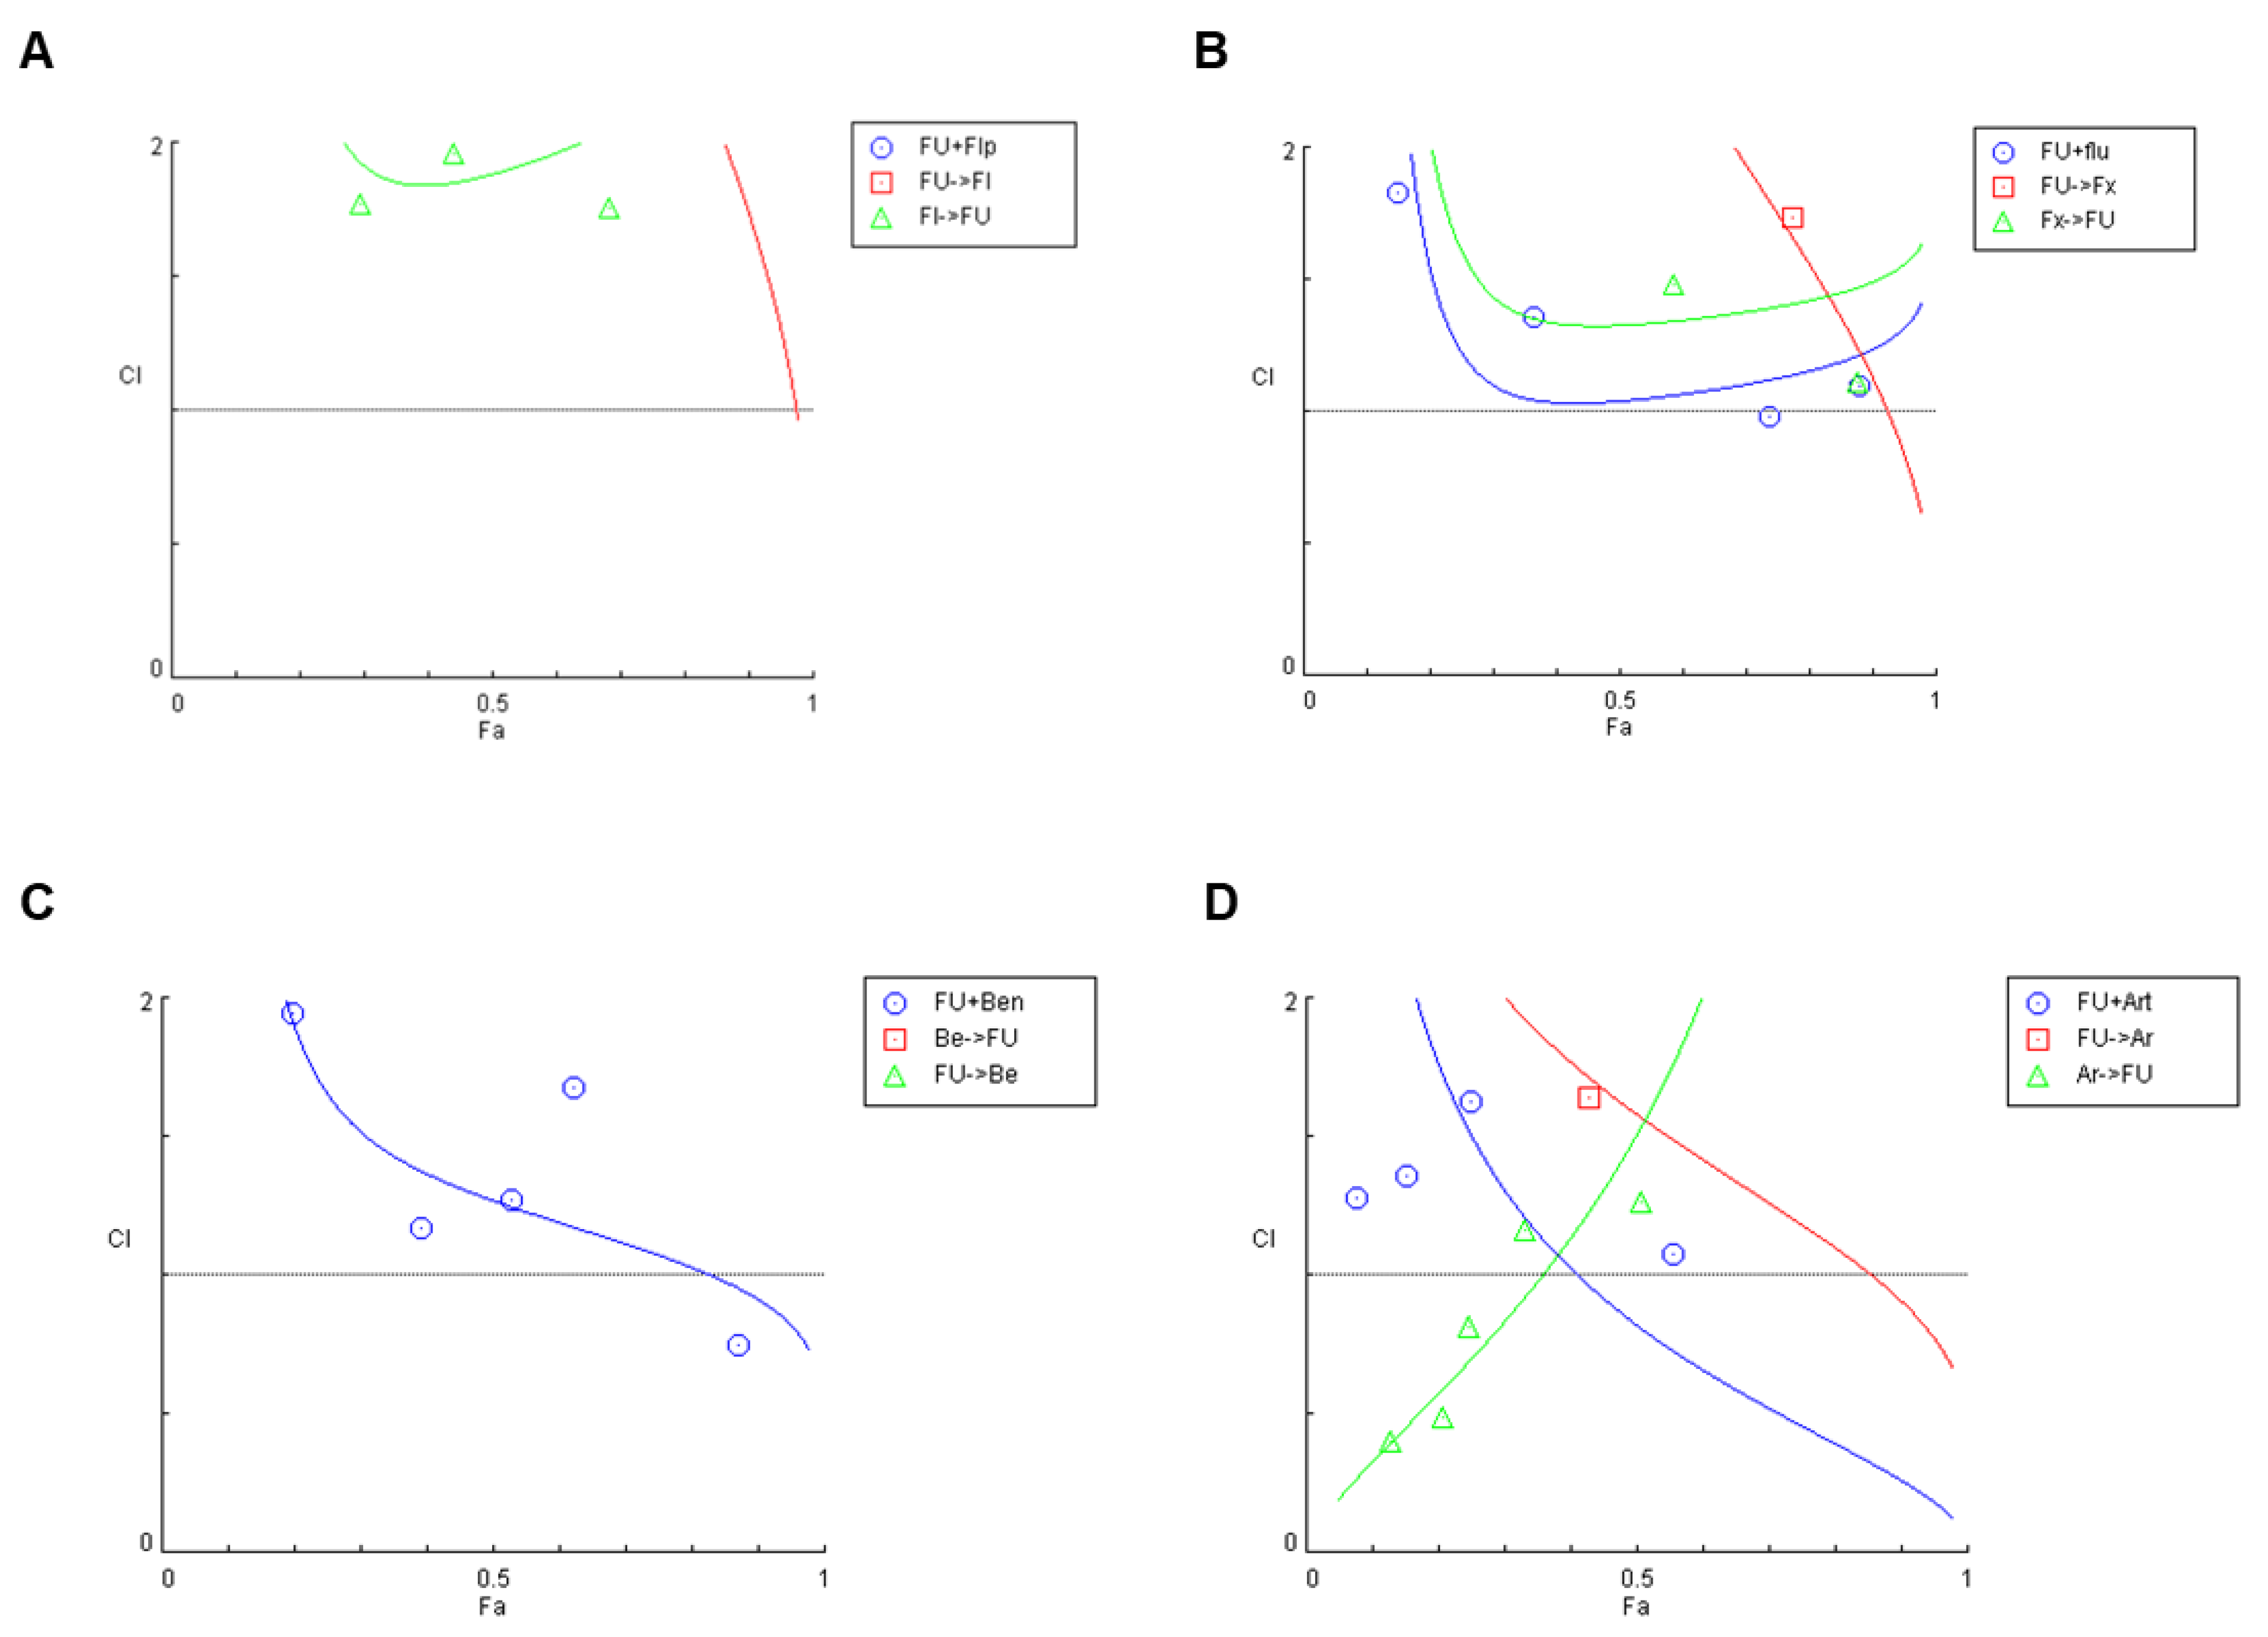
2.1.6. Synergism Evaluation of Different Combination Schedules of 5-FU and CNS Agents/Antimalarial Drugs
2.2. MCF-7 Breast Cancer Cells
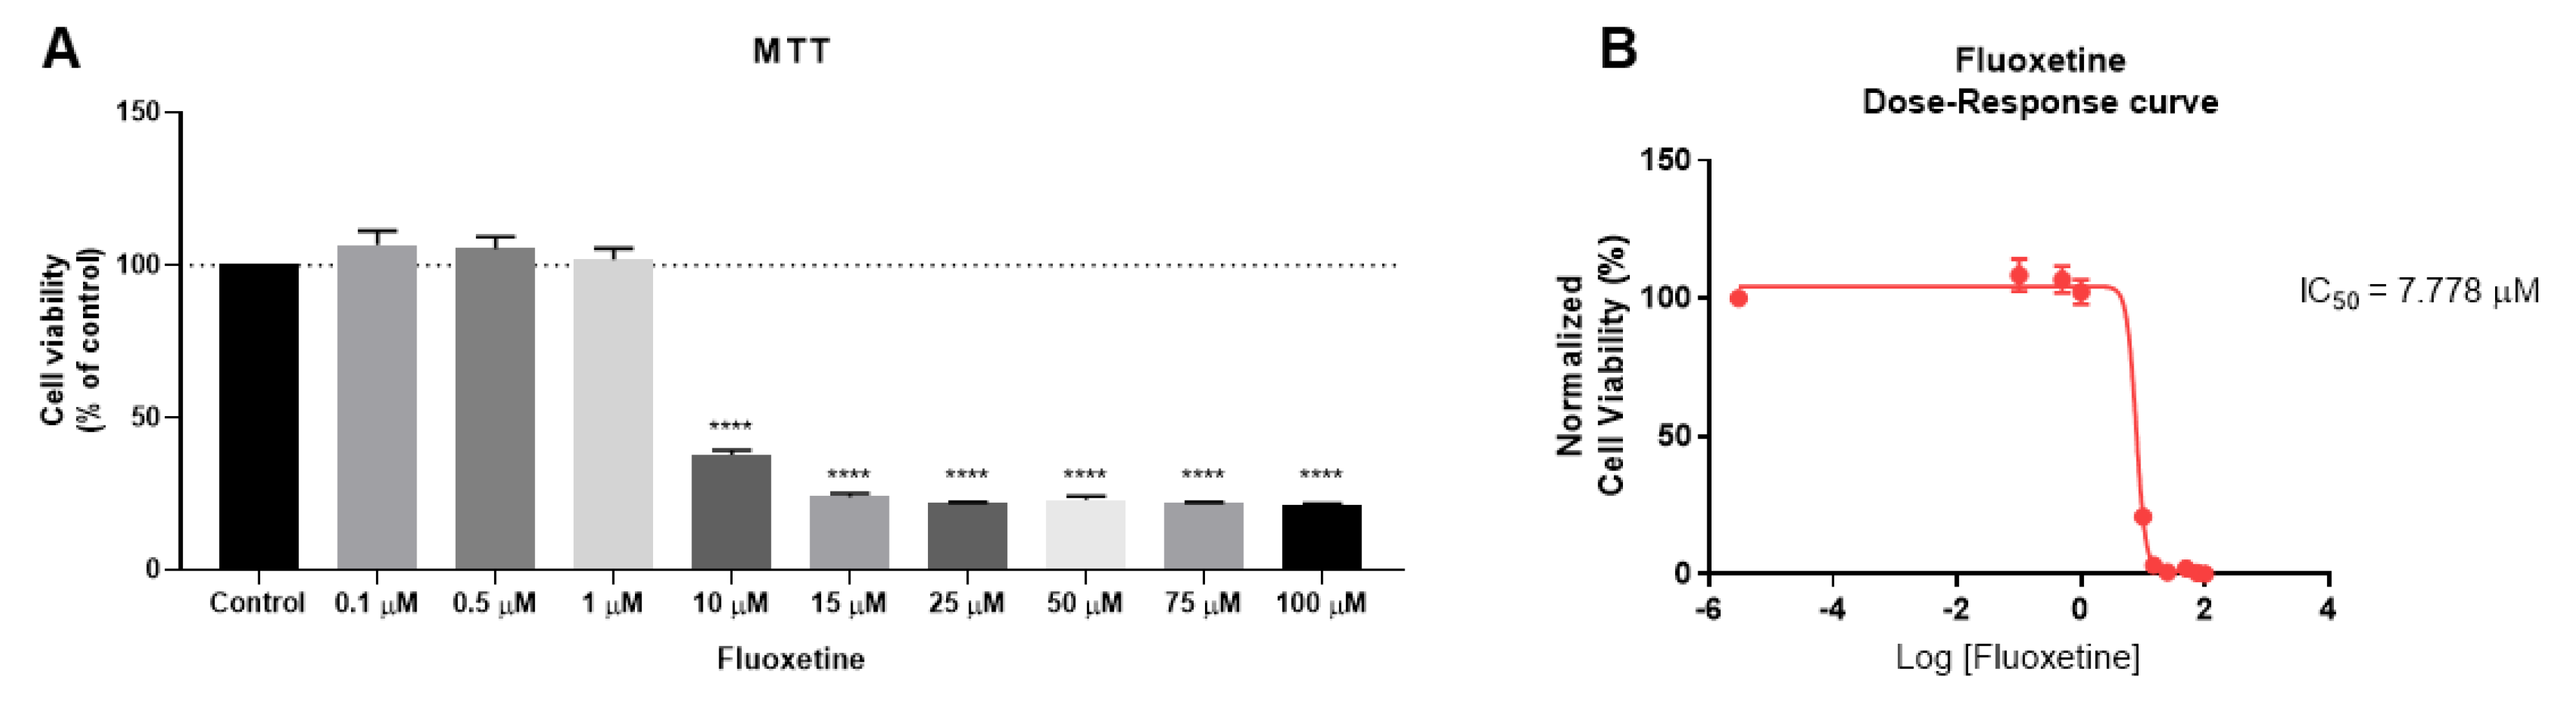
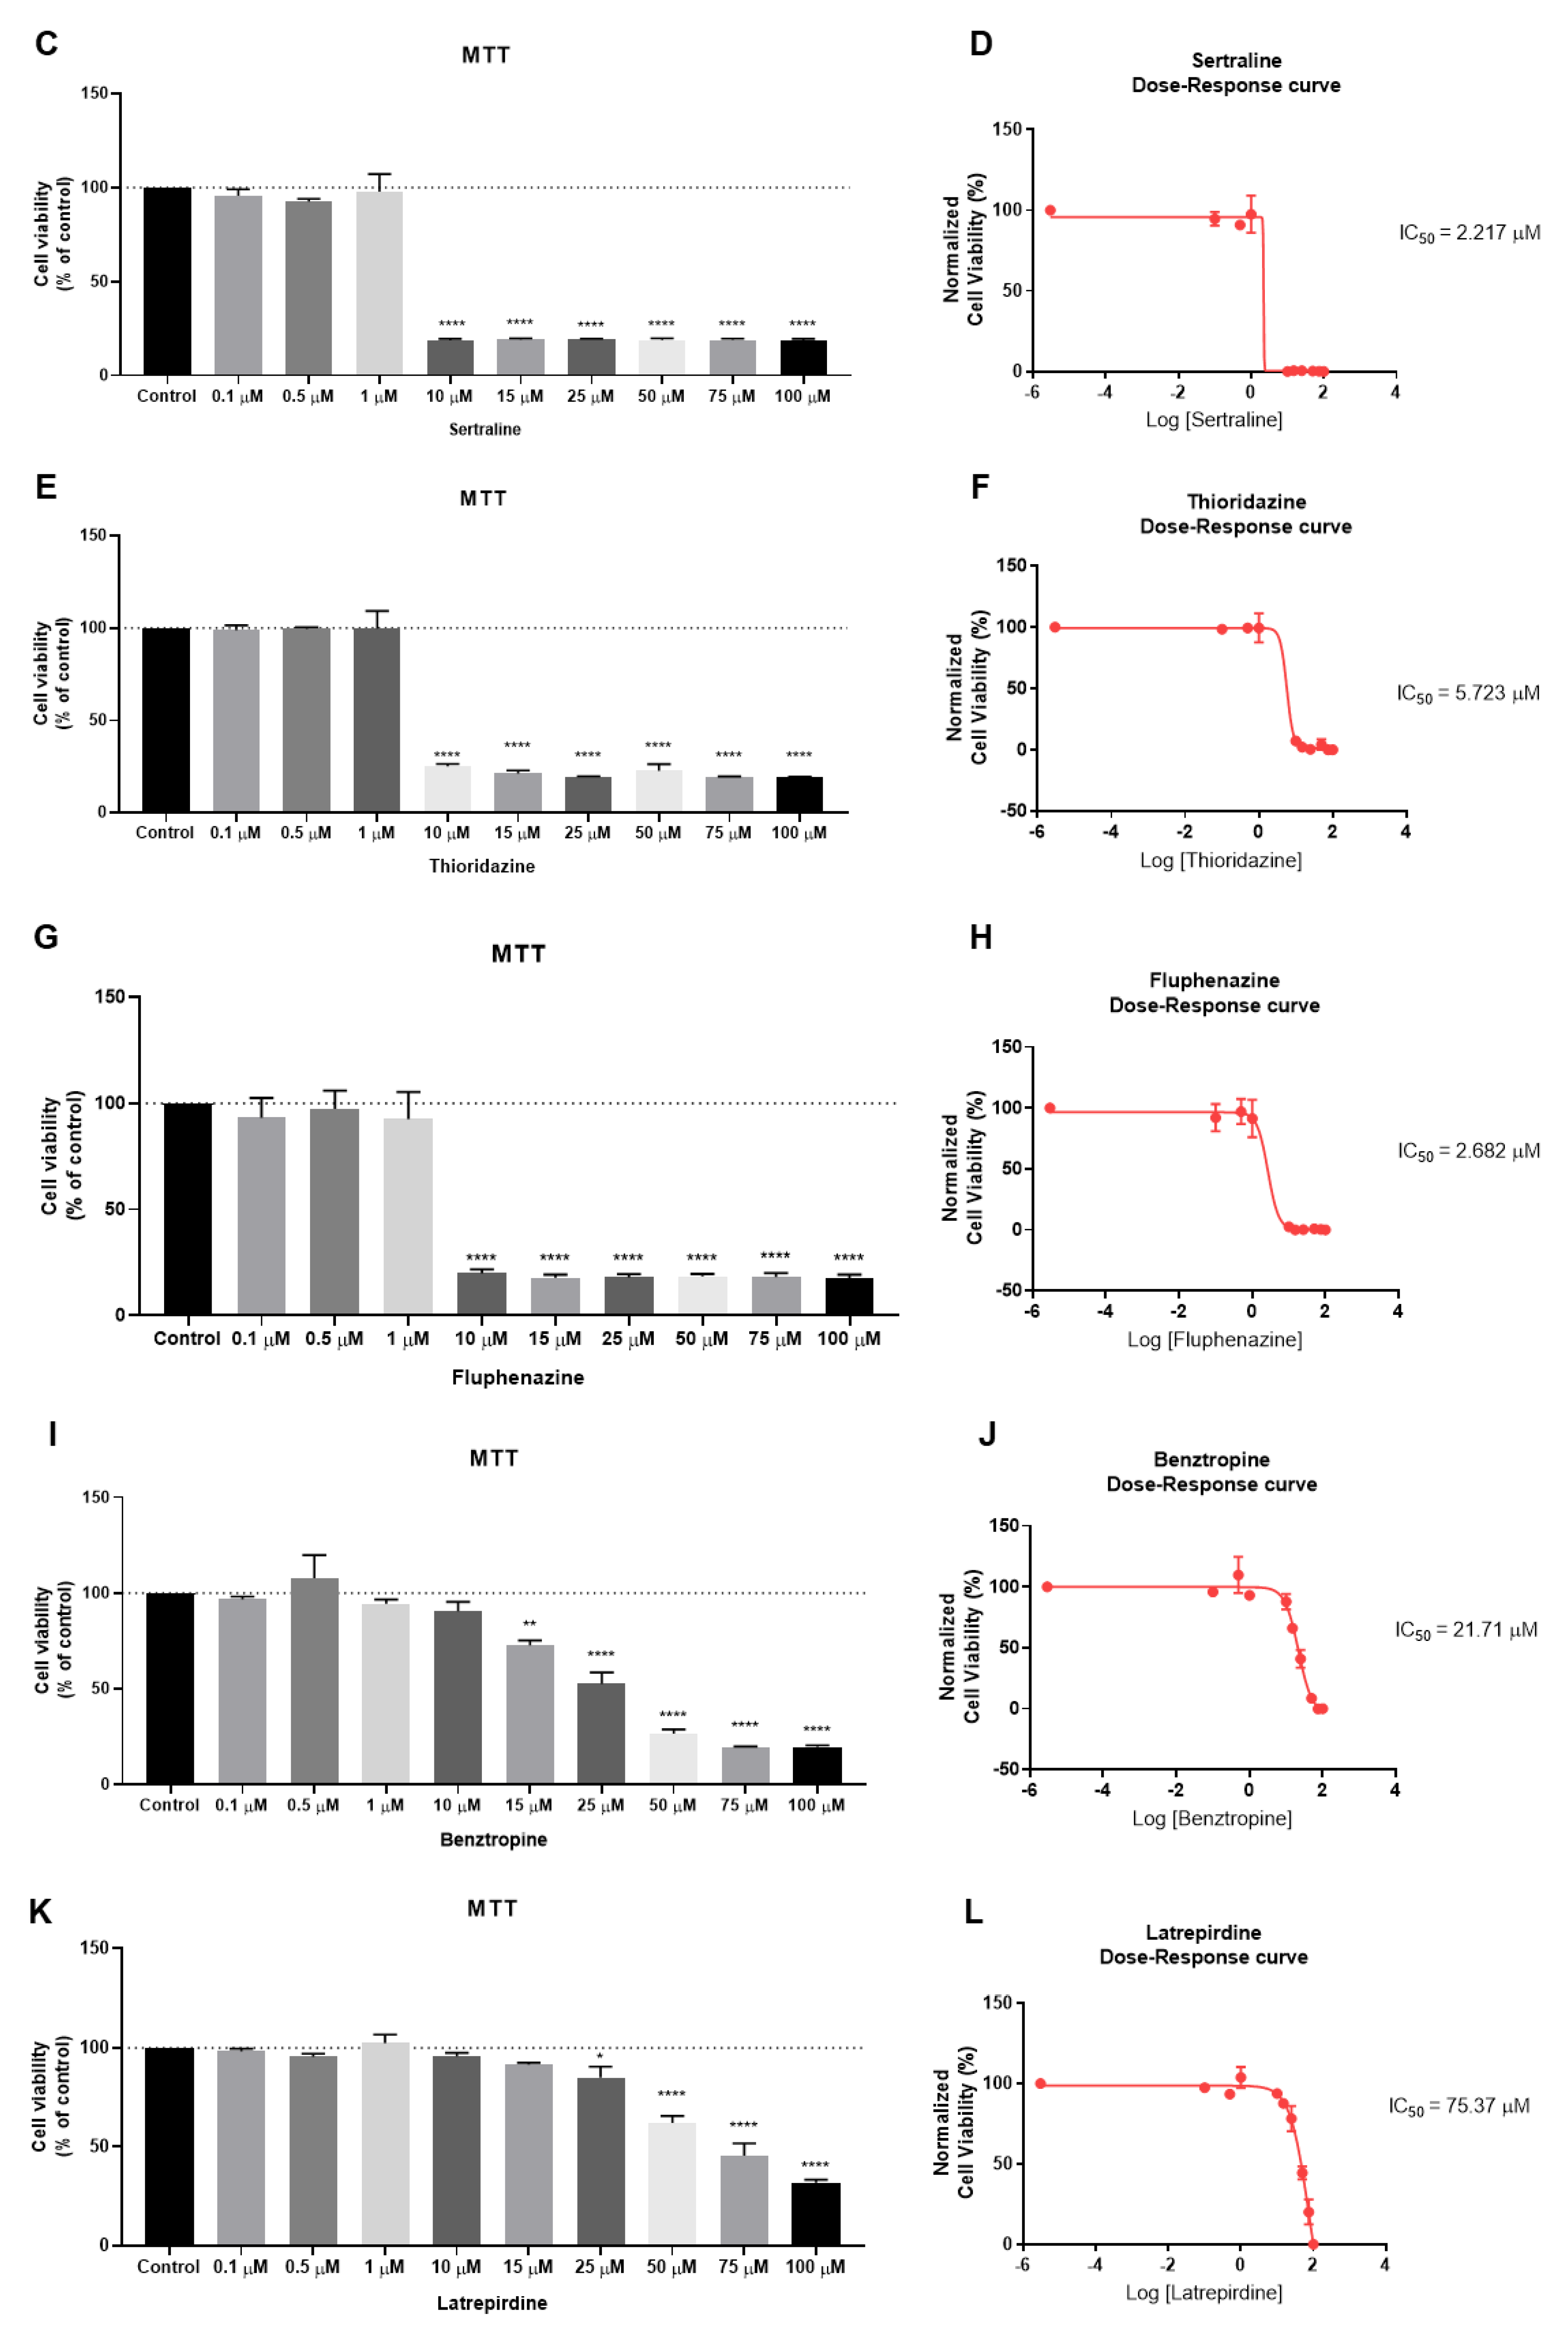
2.2.1. The Effect of CNS Drugs as Single Agents on Cellular Viability
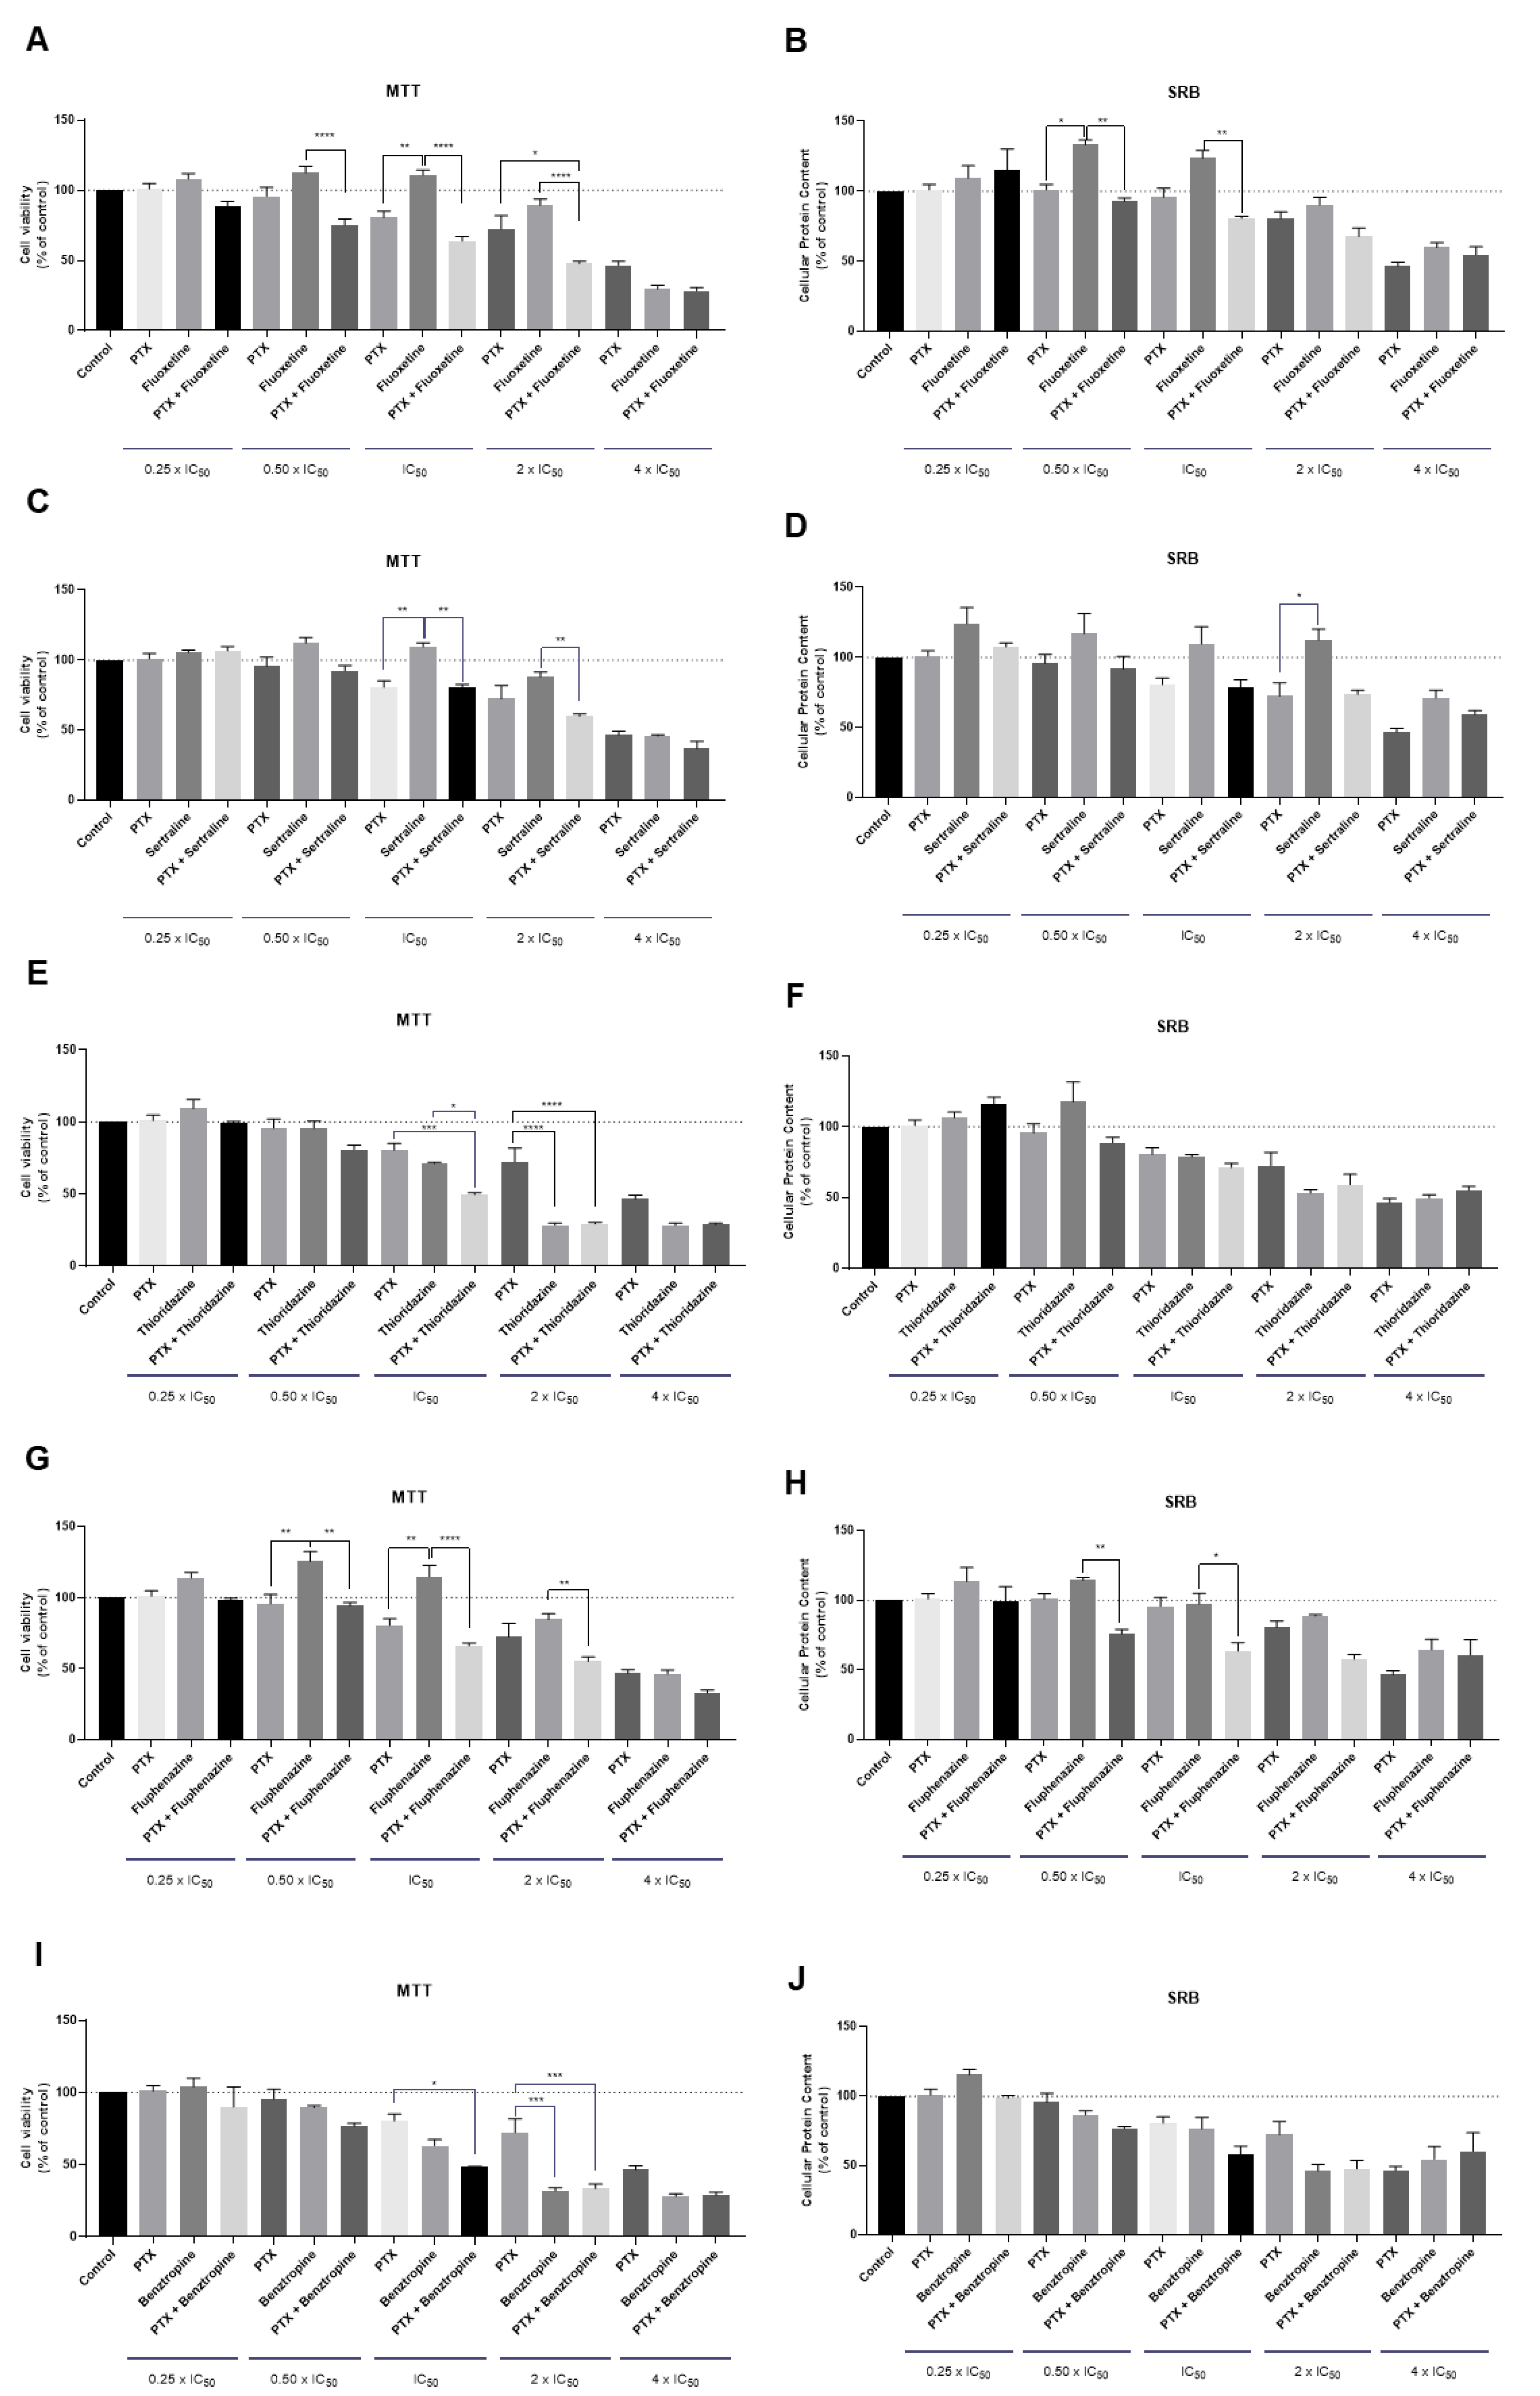
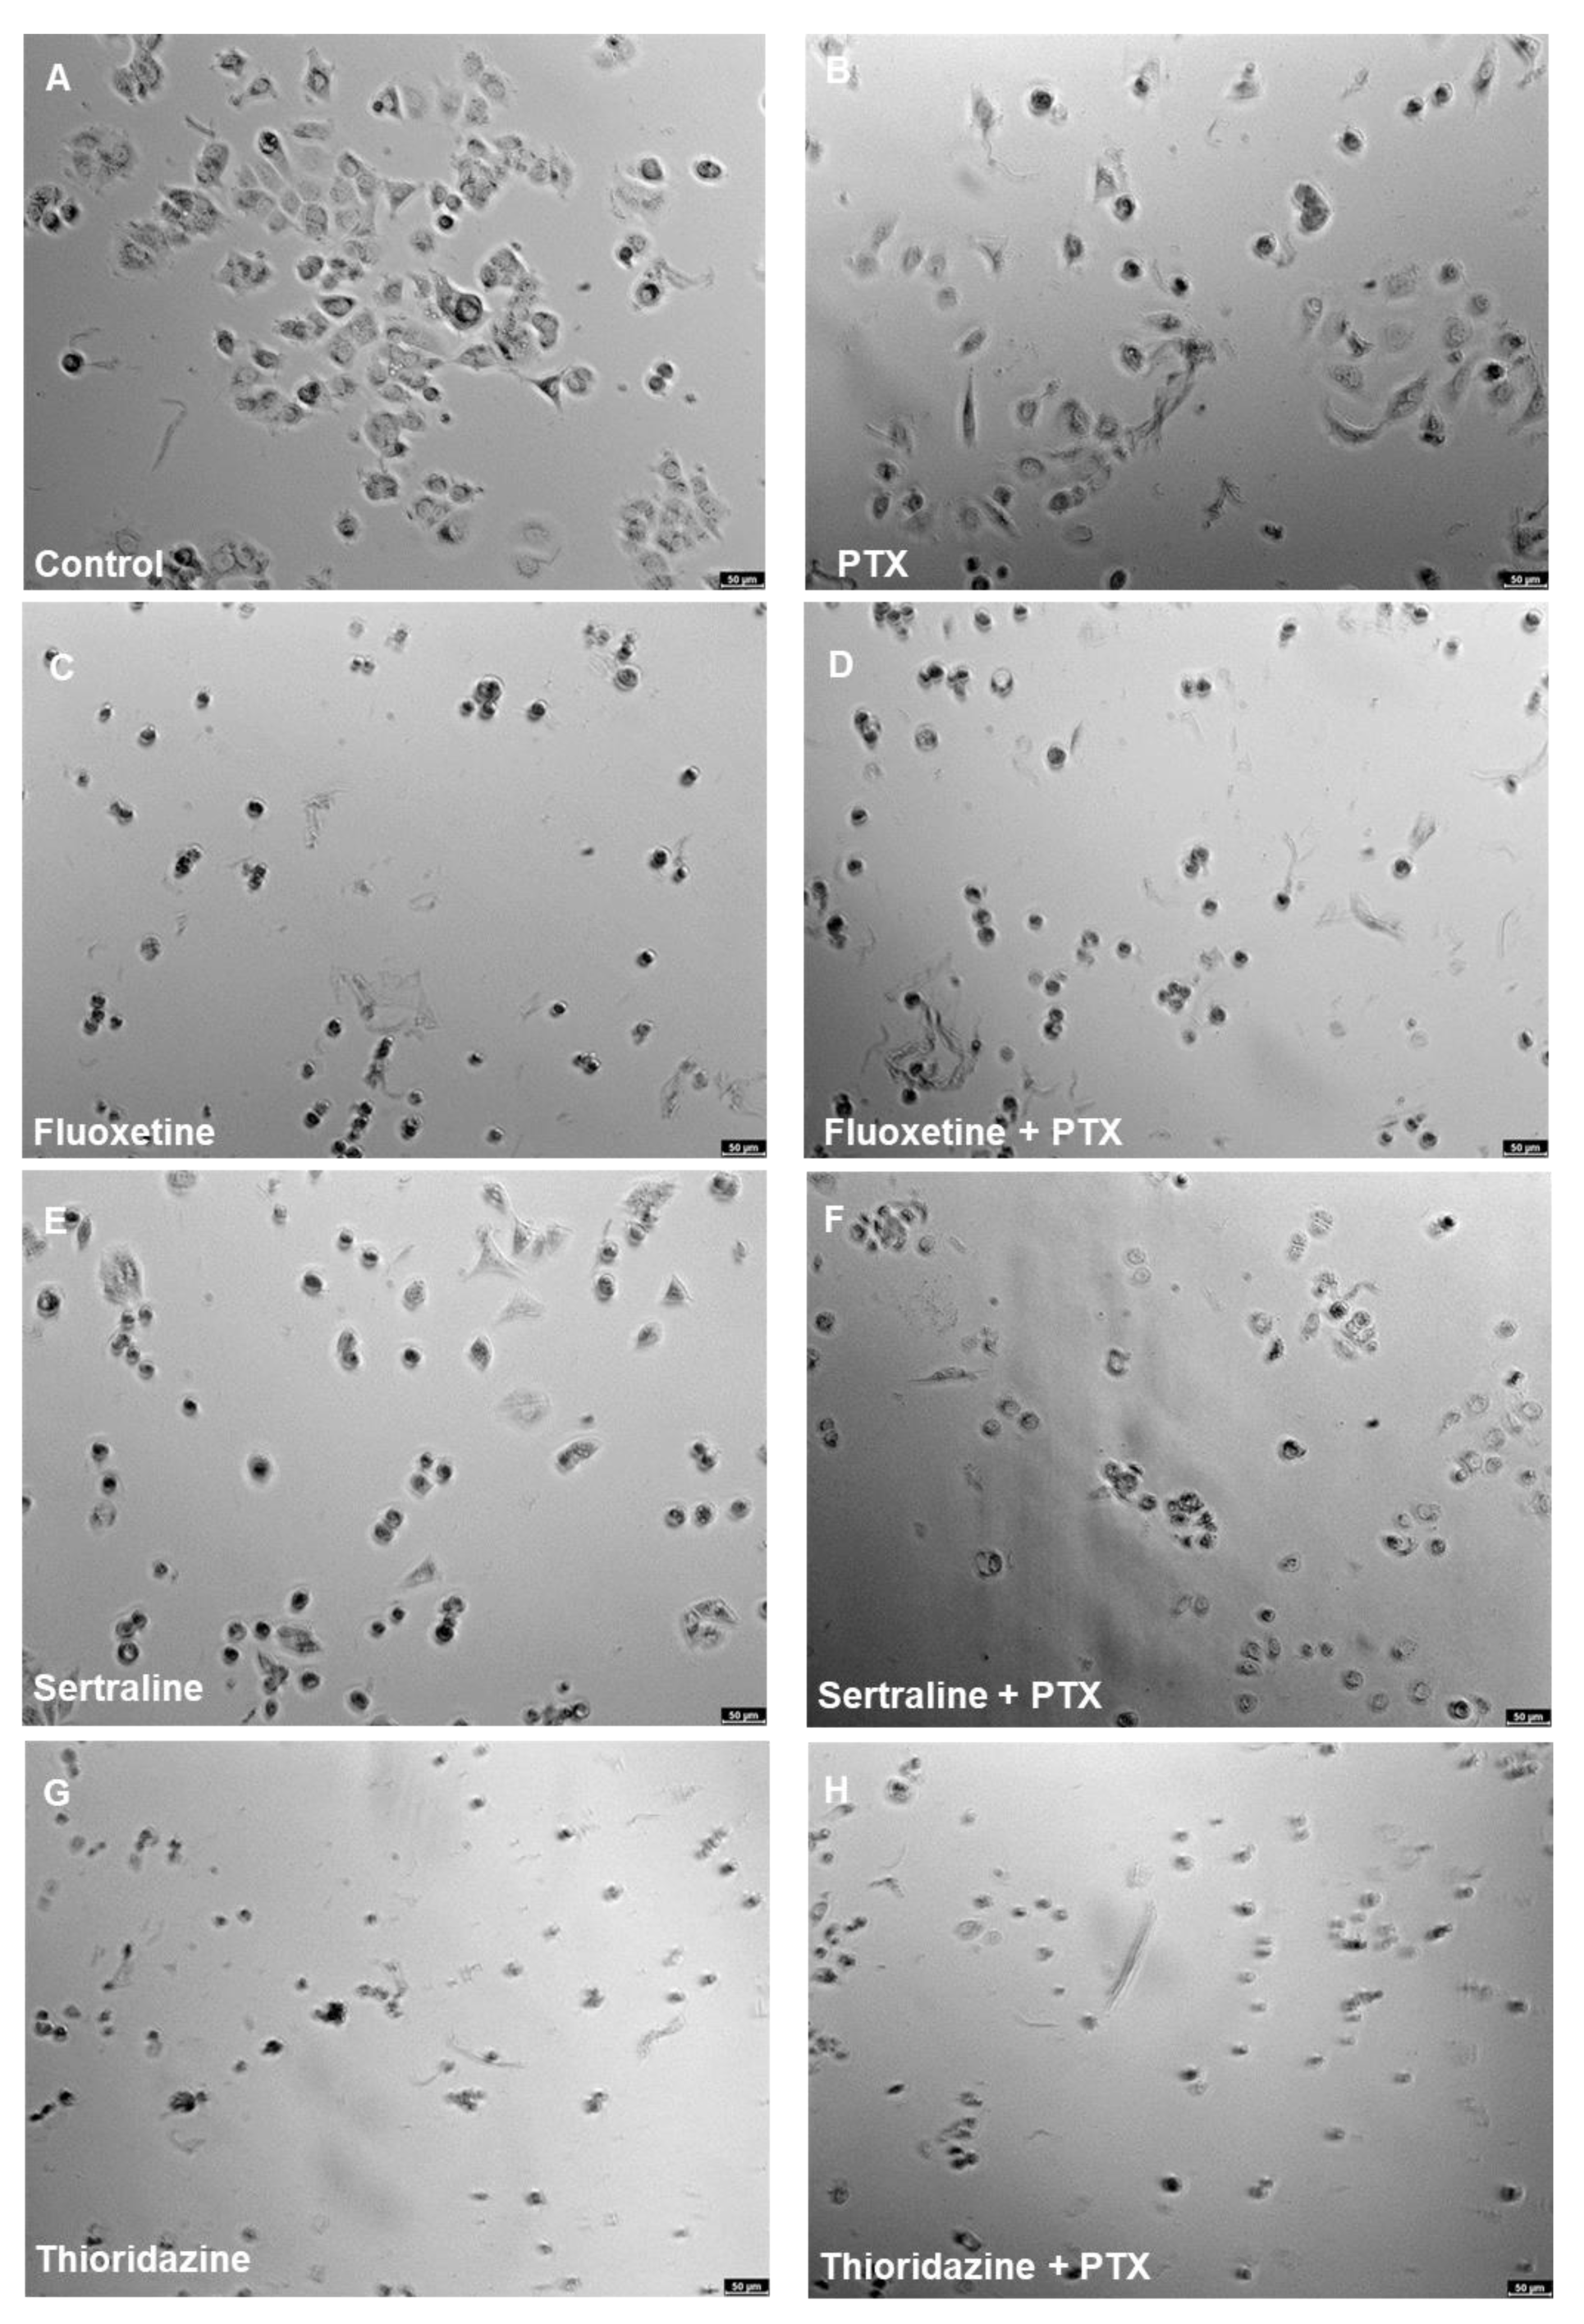
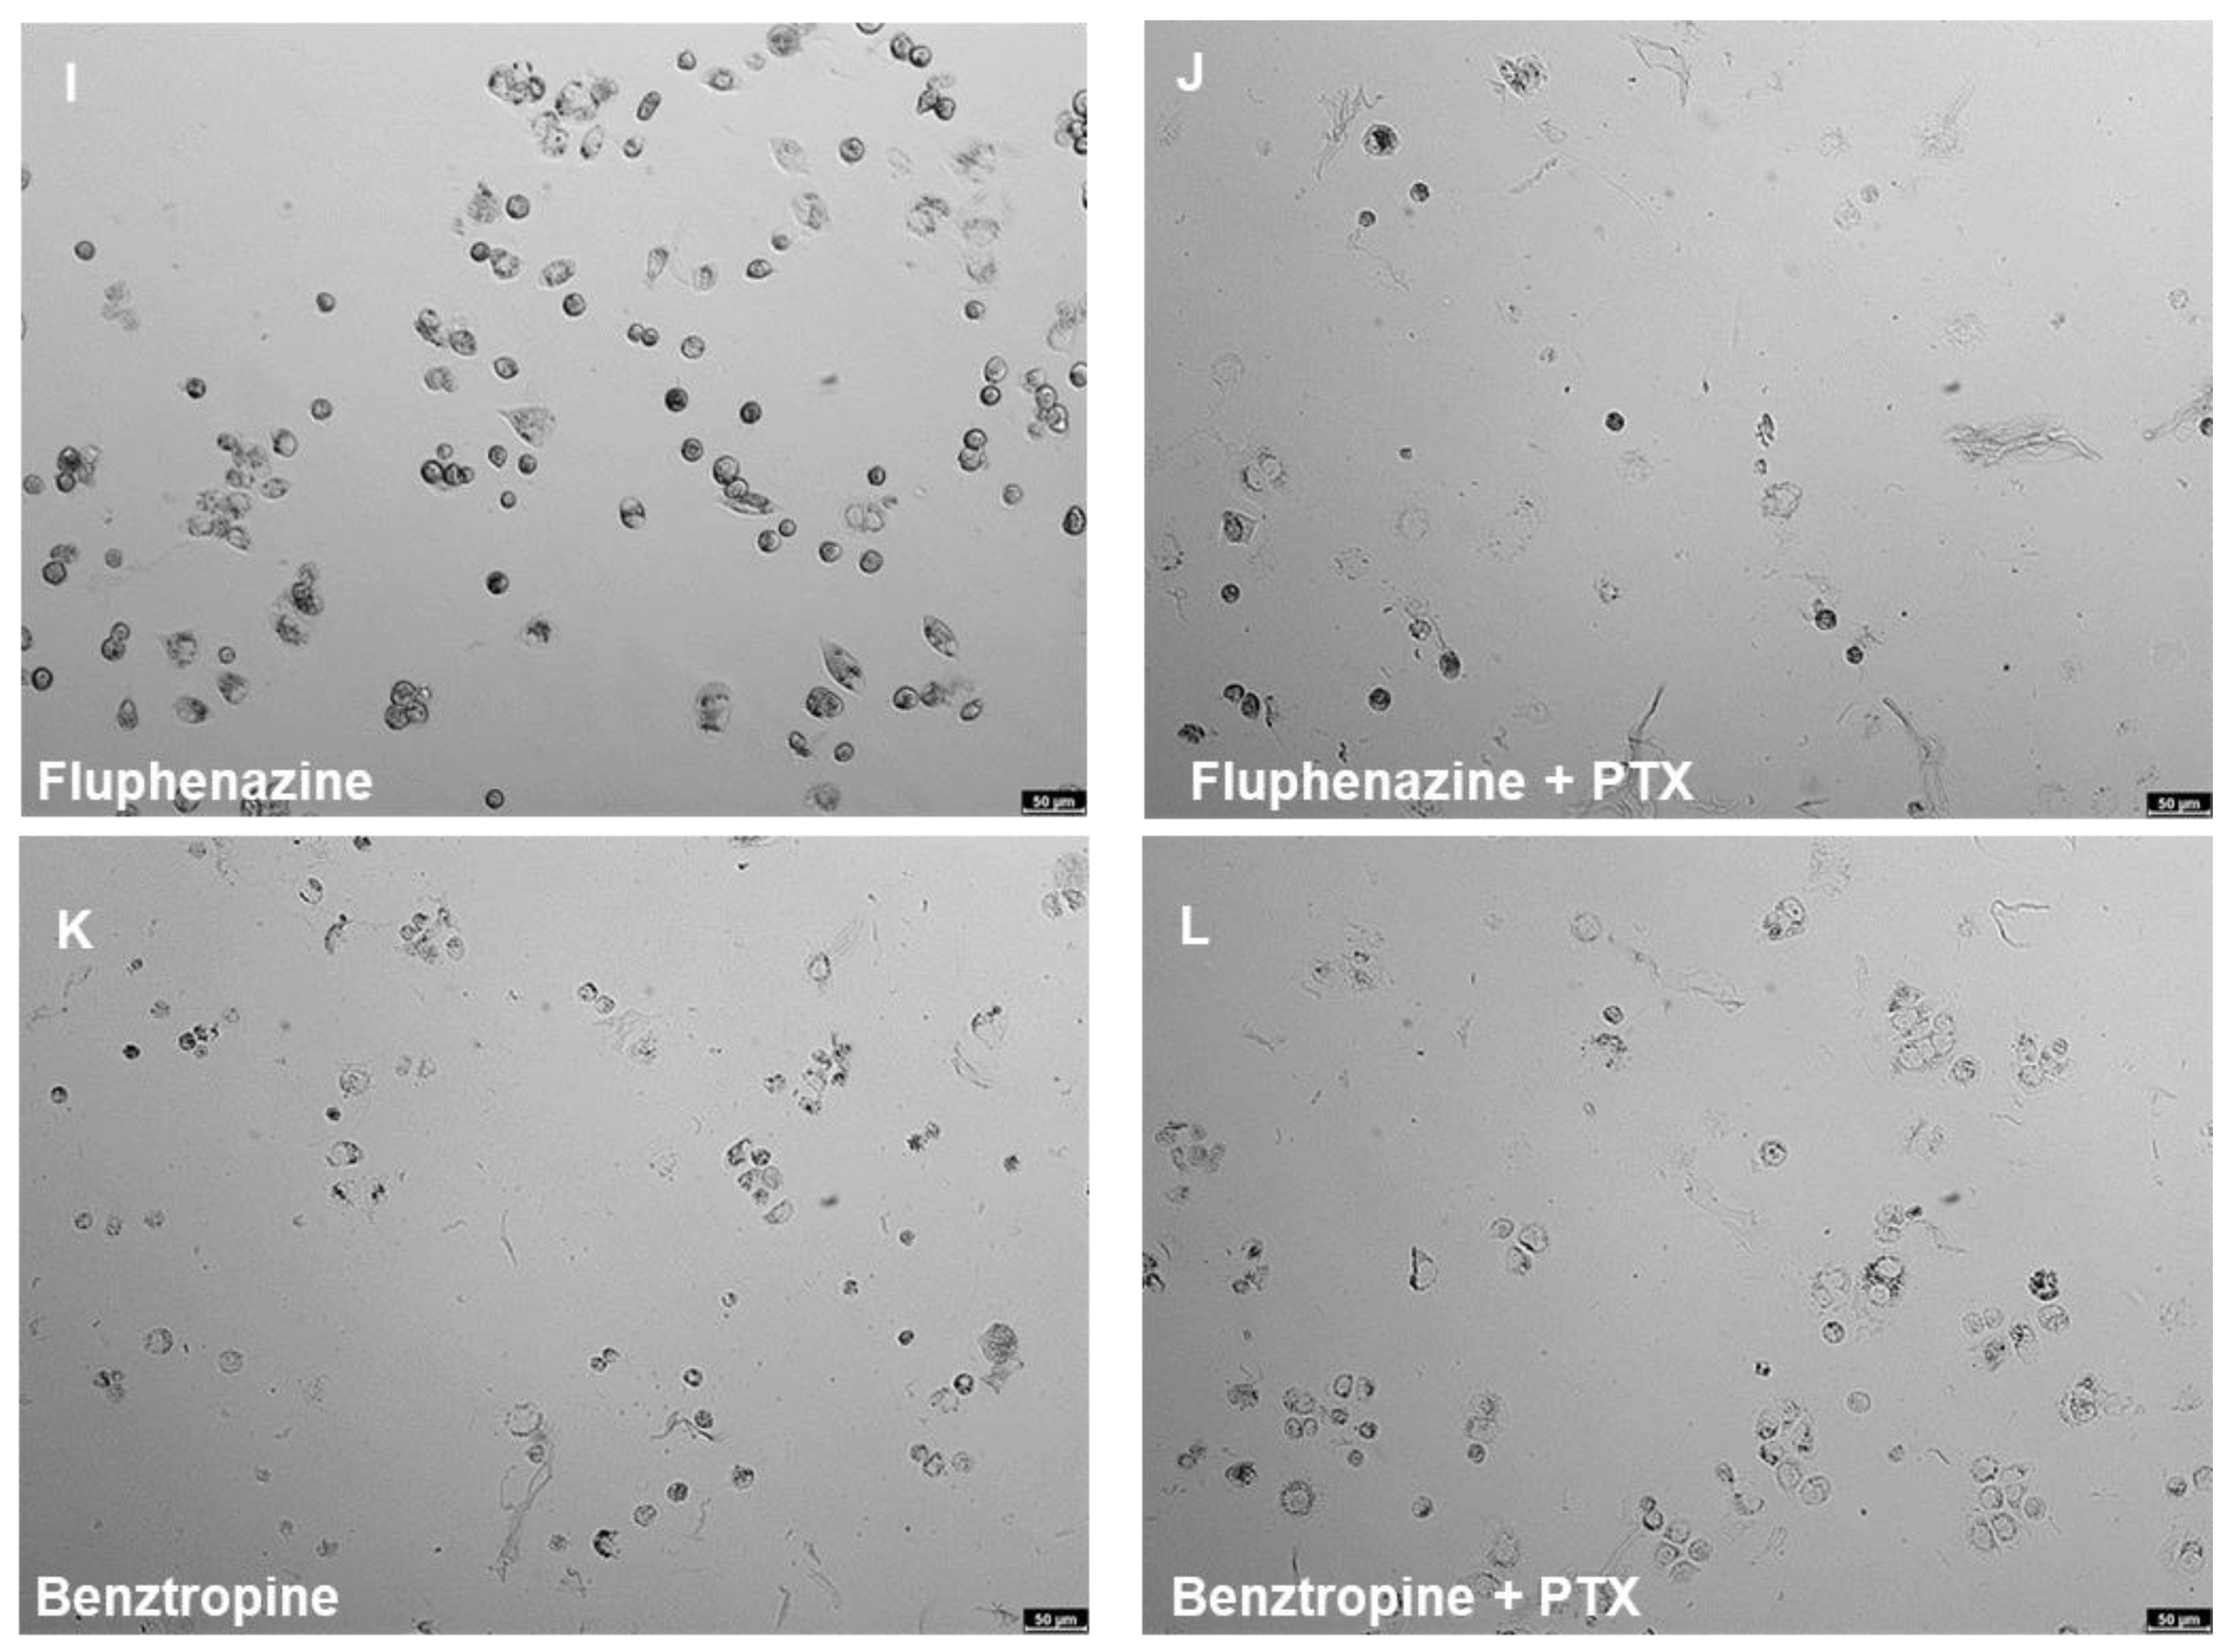
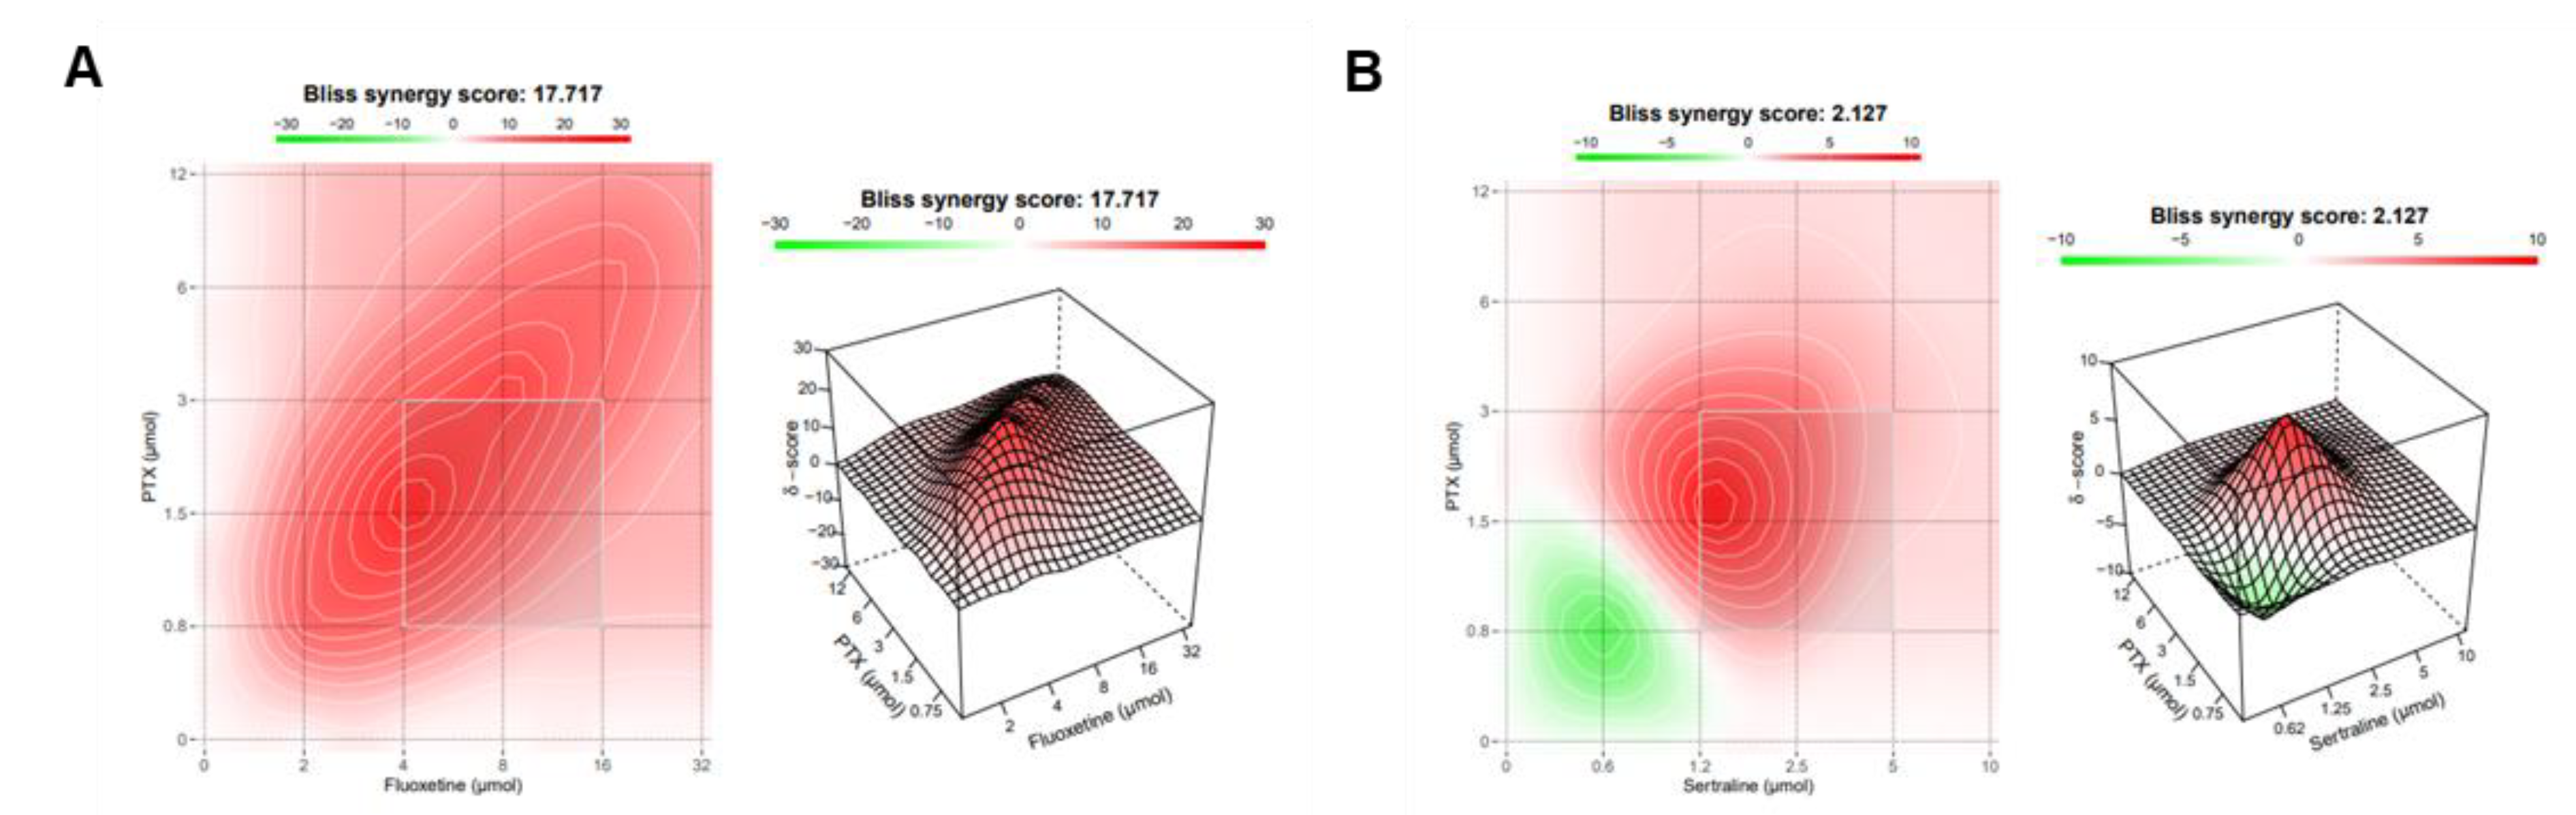
2.2.2. The Effect of Various Combinations of PTX and Different CNS Agents
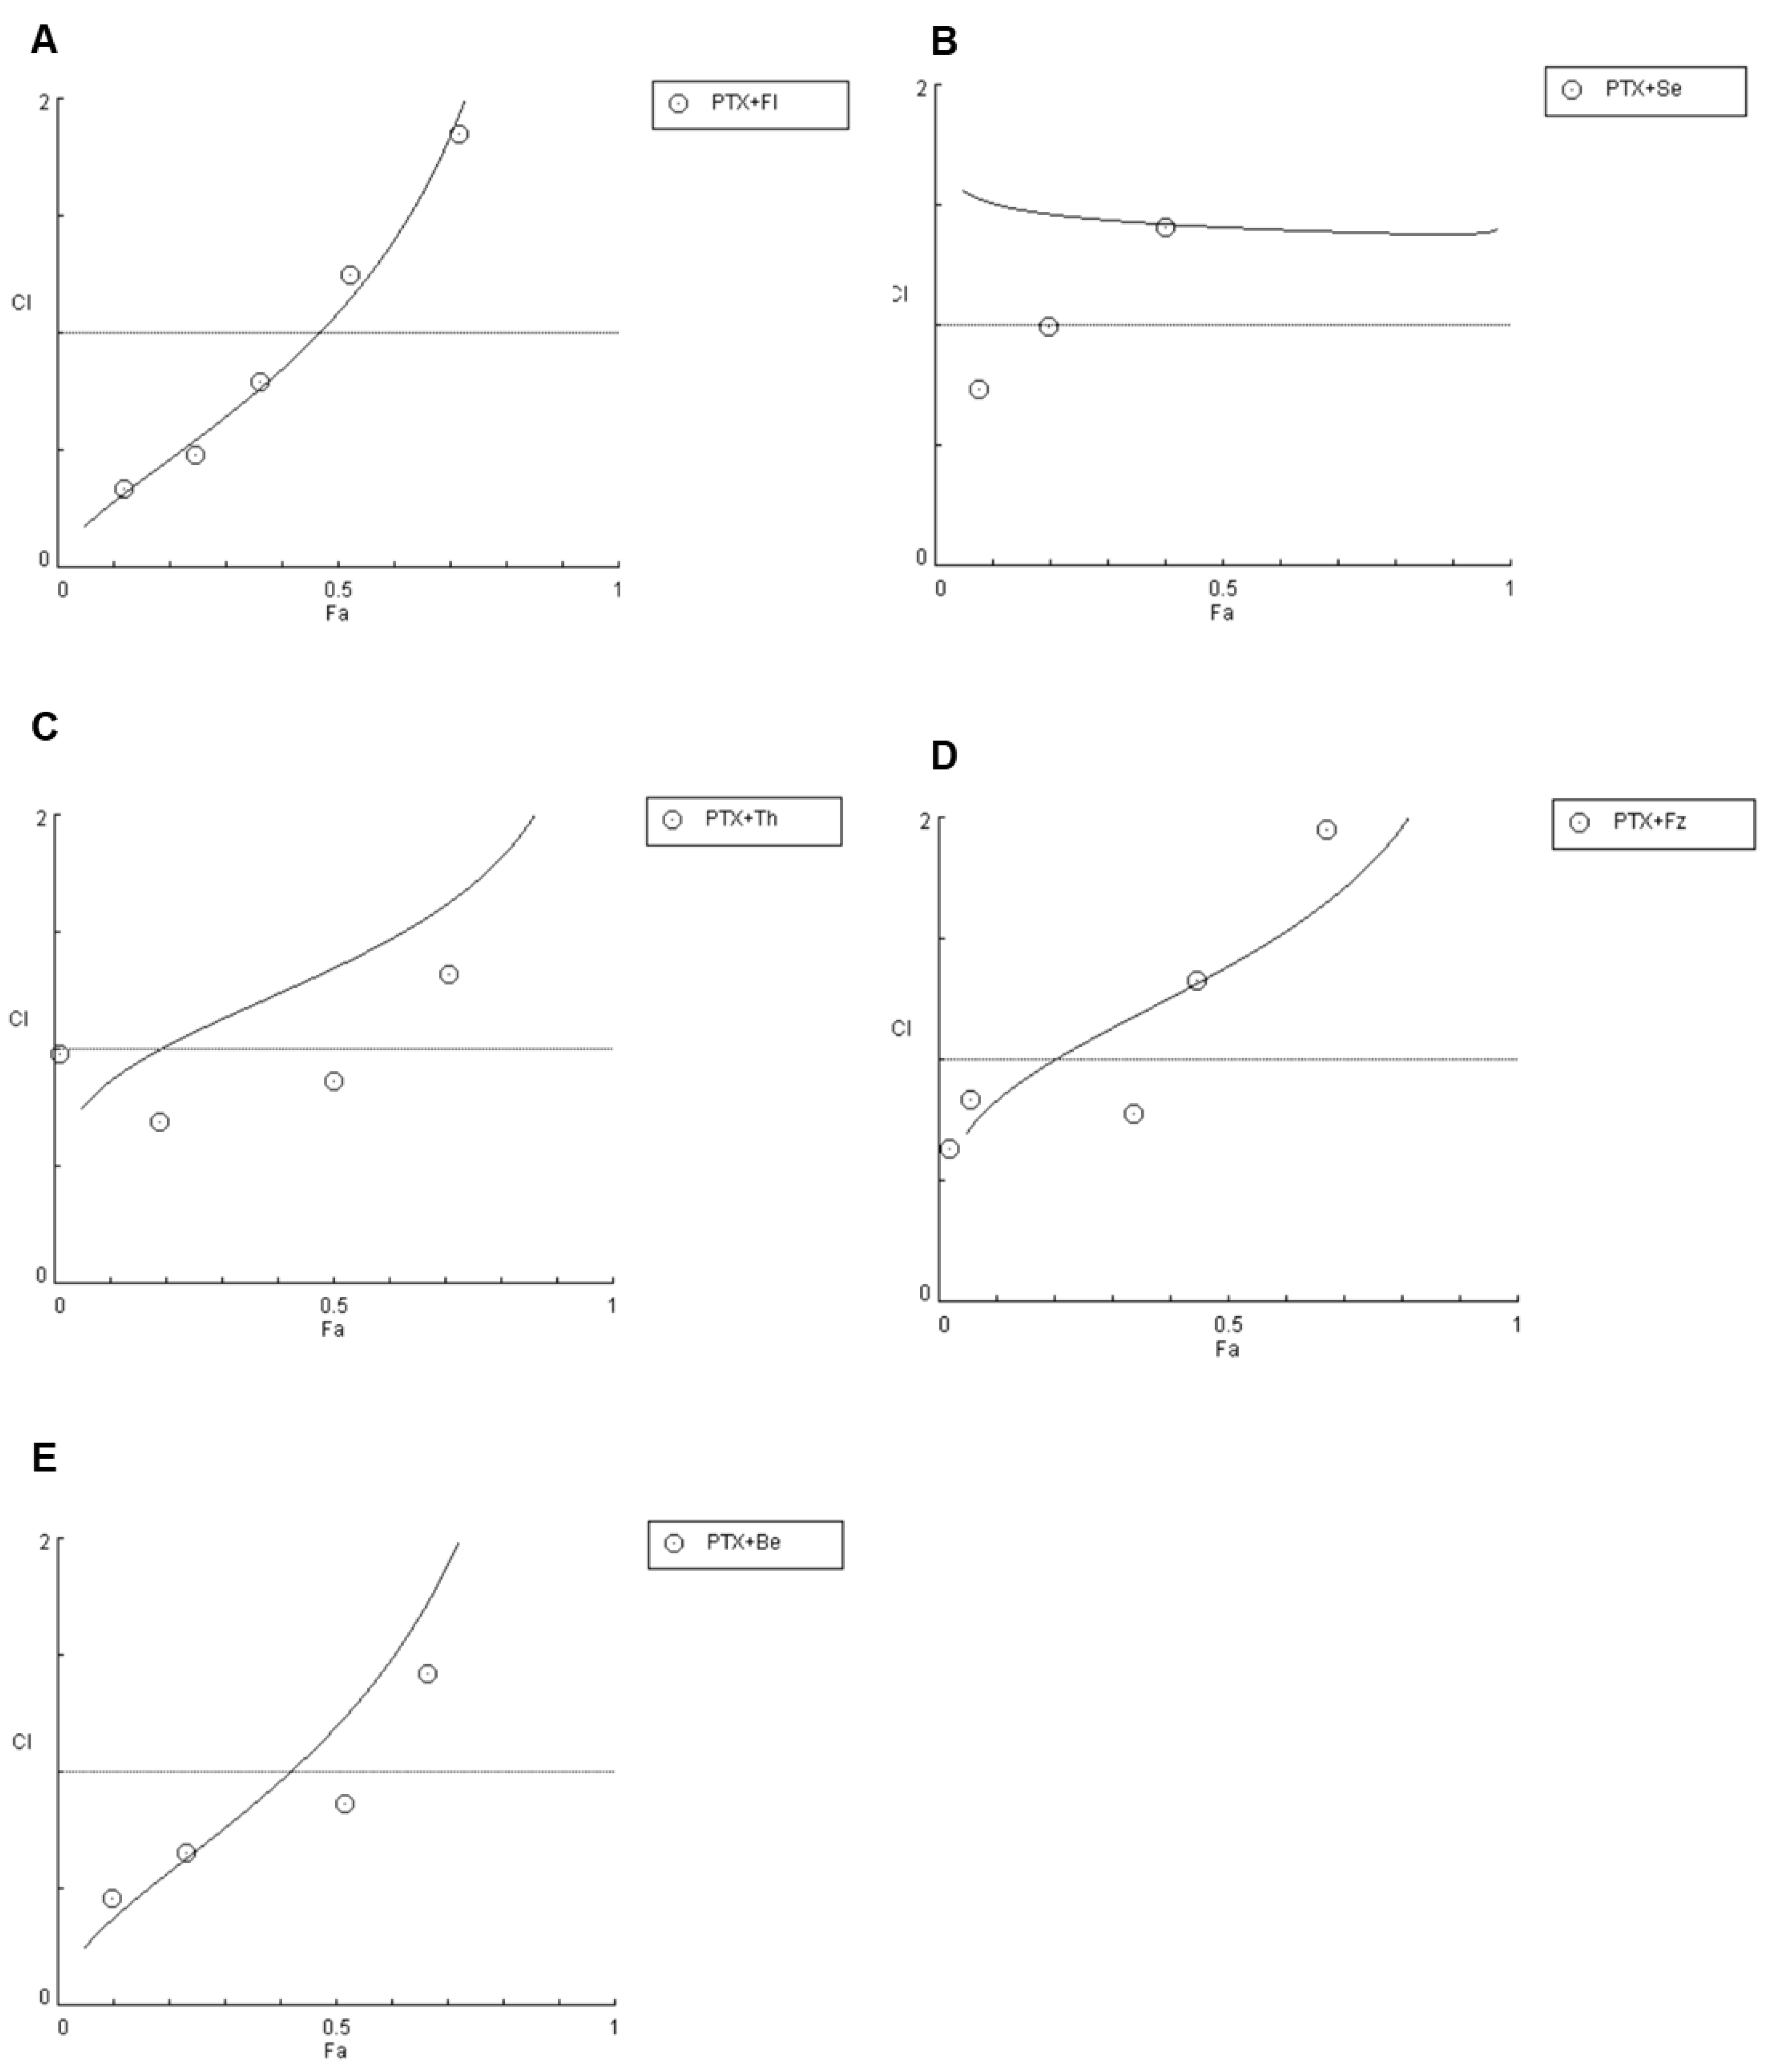
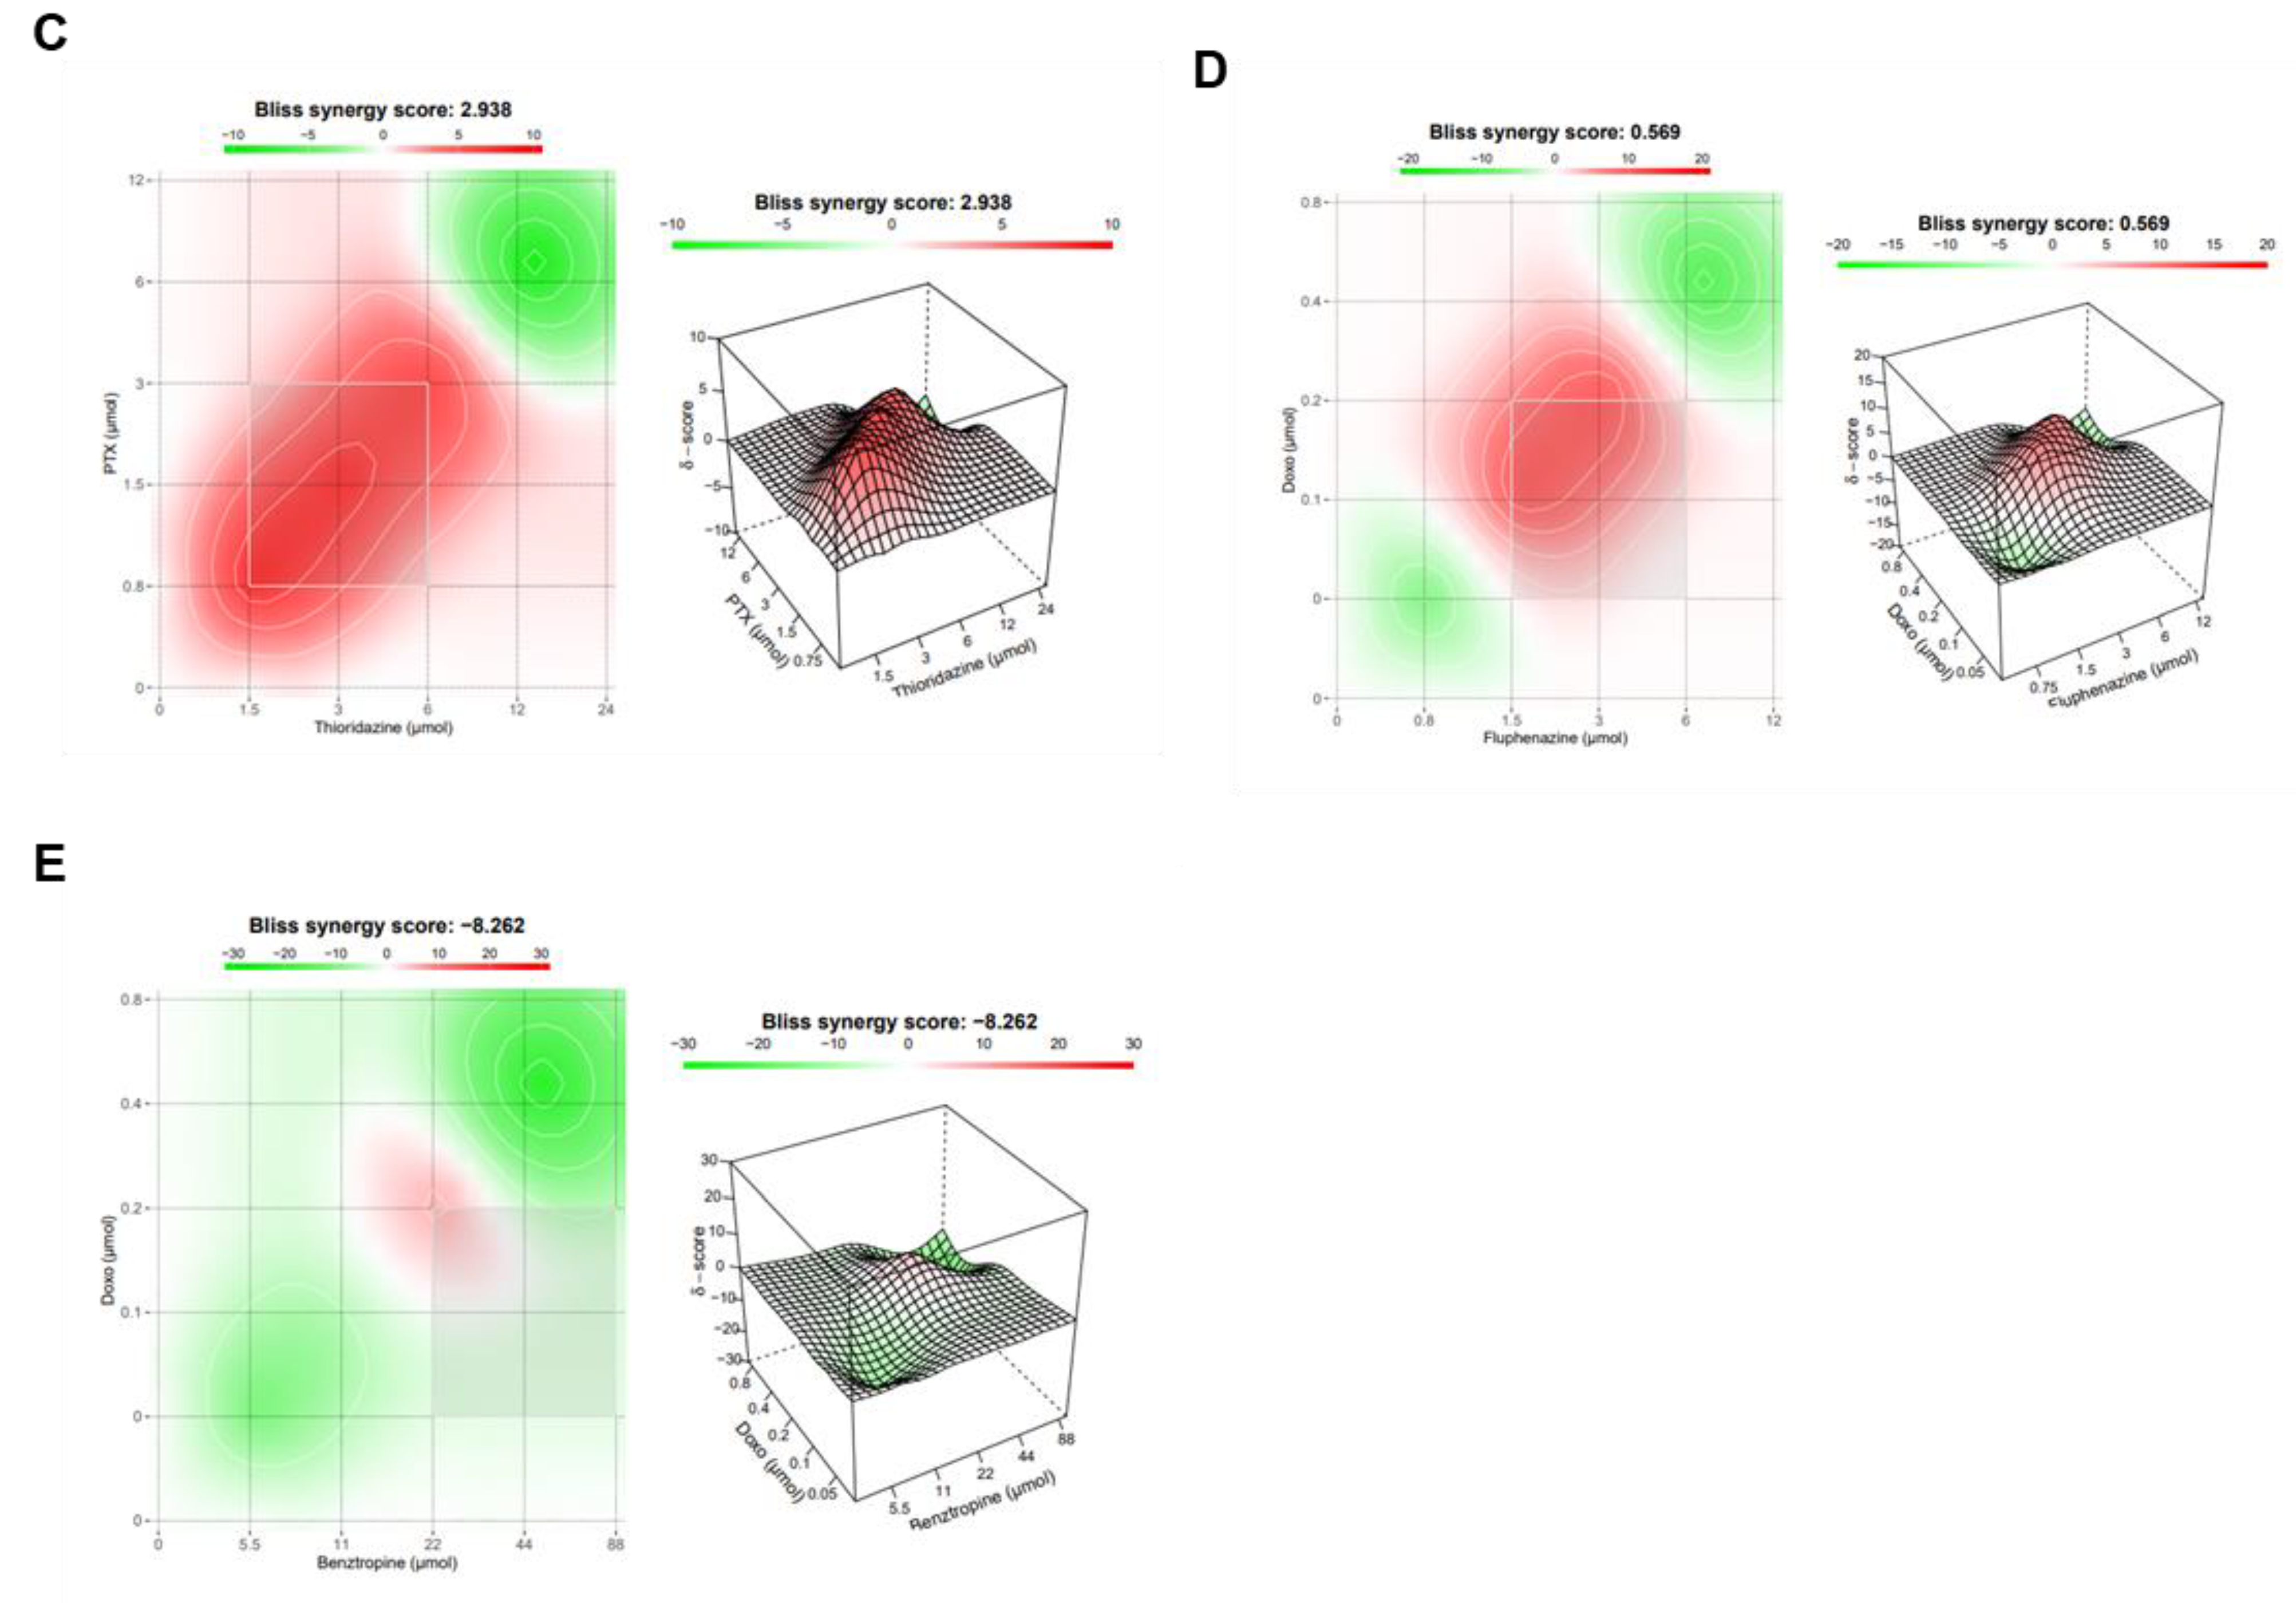
2.2.3. Synergistic Combinations of PTX and CNS Agents
3. Discussion
4. Materials and Methods
4.1. Materials
4.2. Cell Line and Cell Culture
4.3. Drug Treatment
4.4. Cell Viability Assay
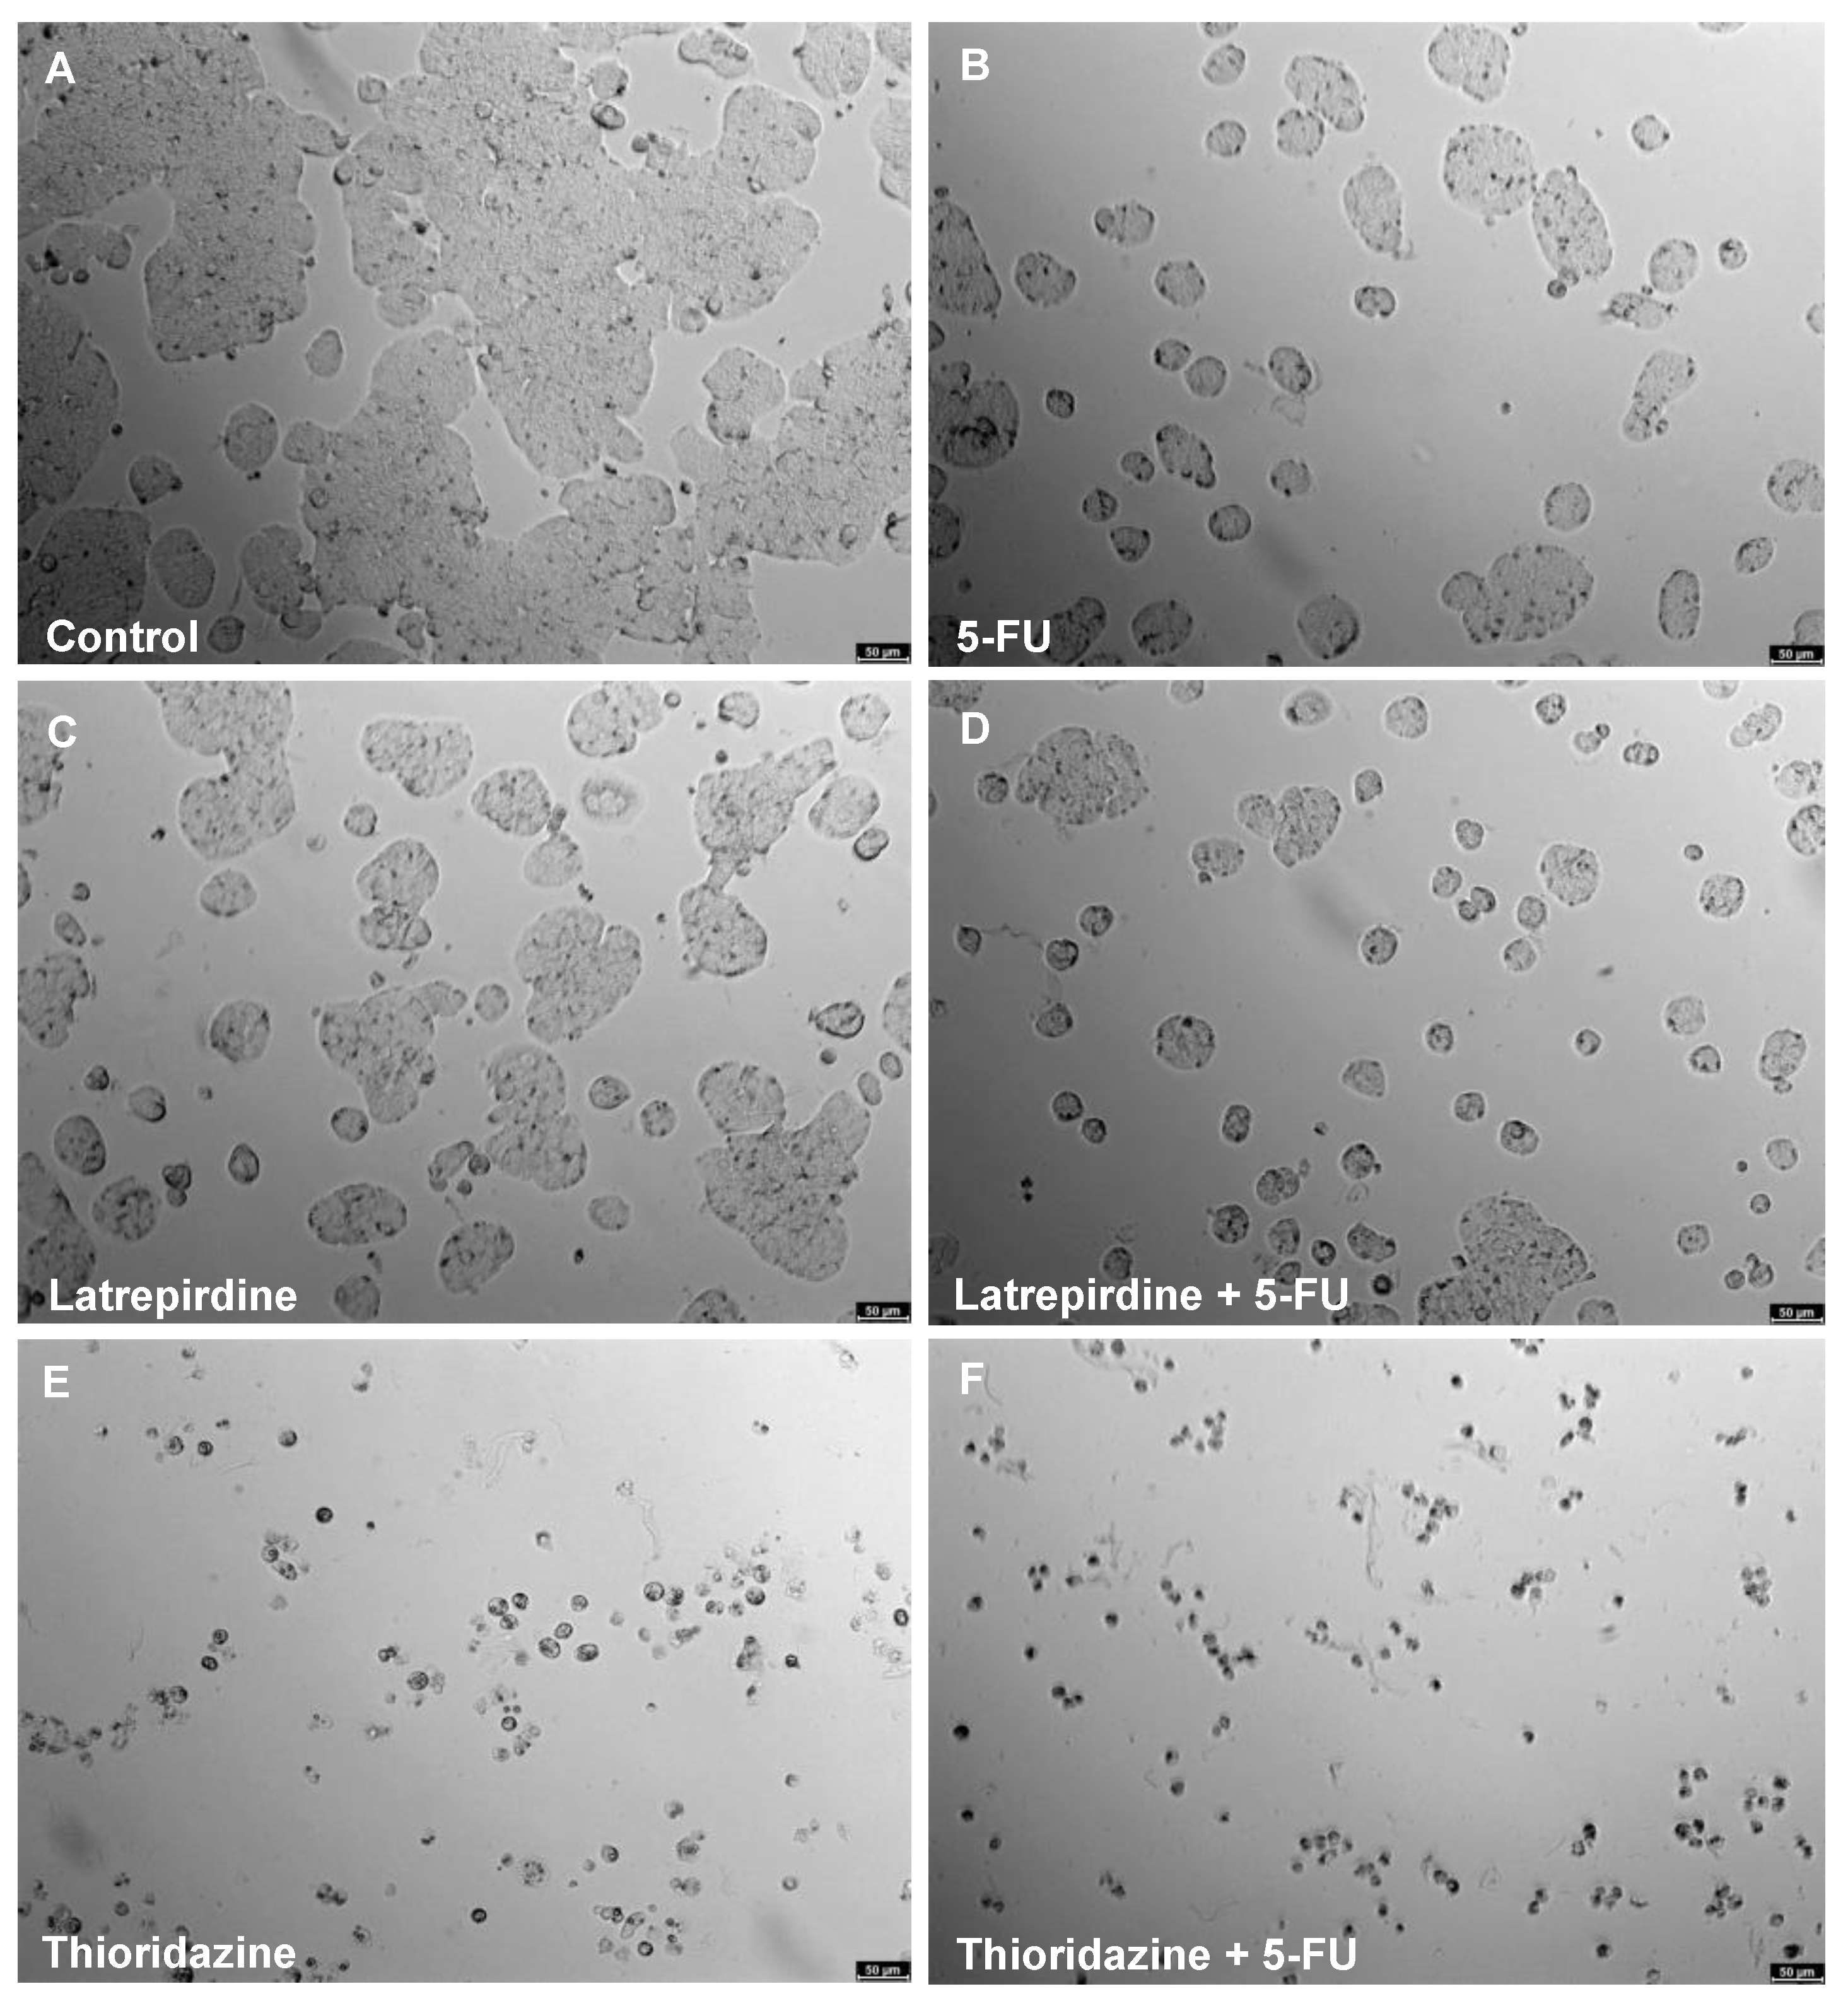
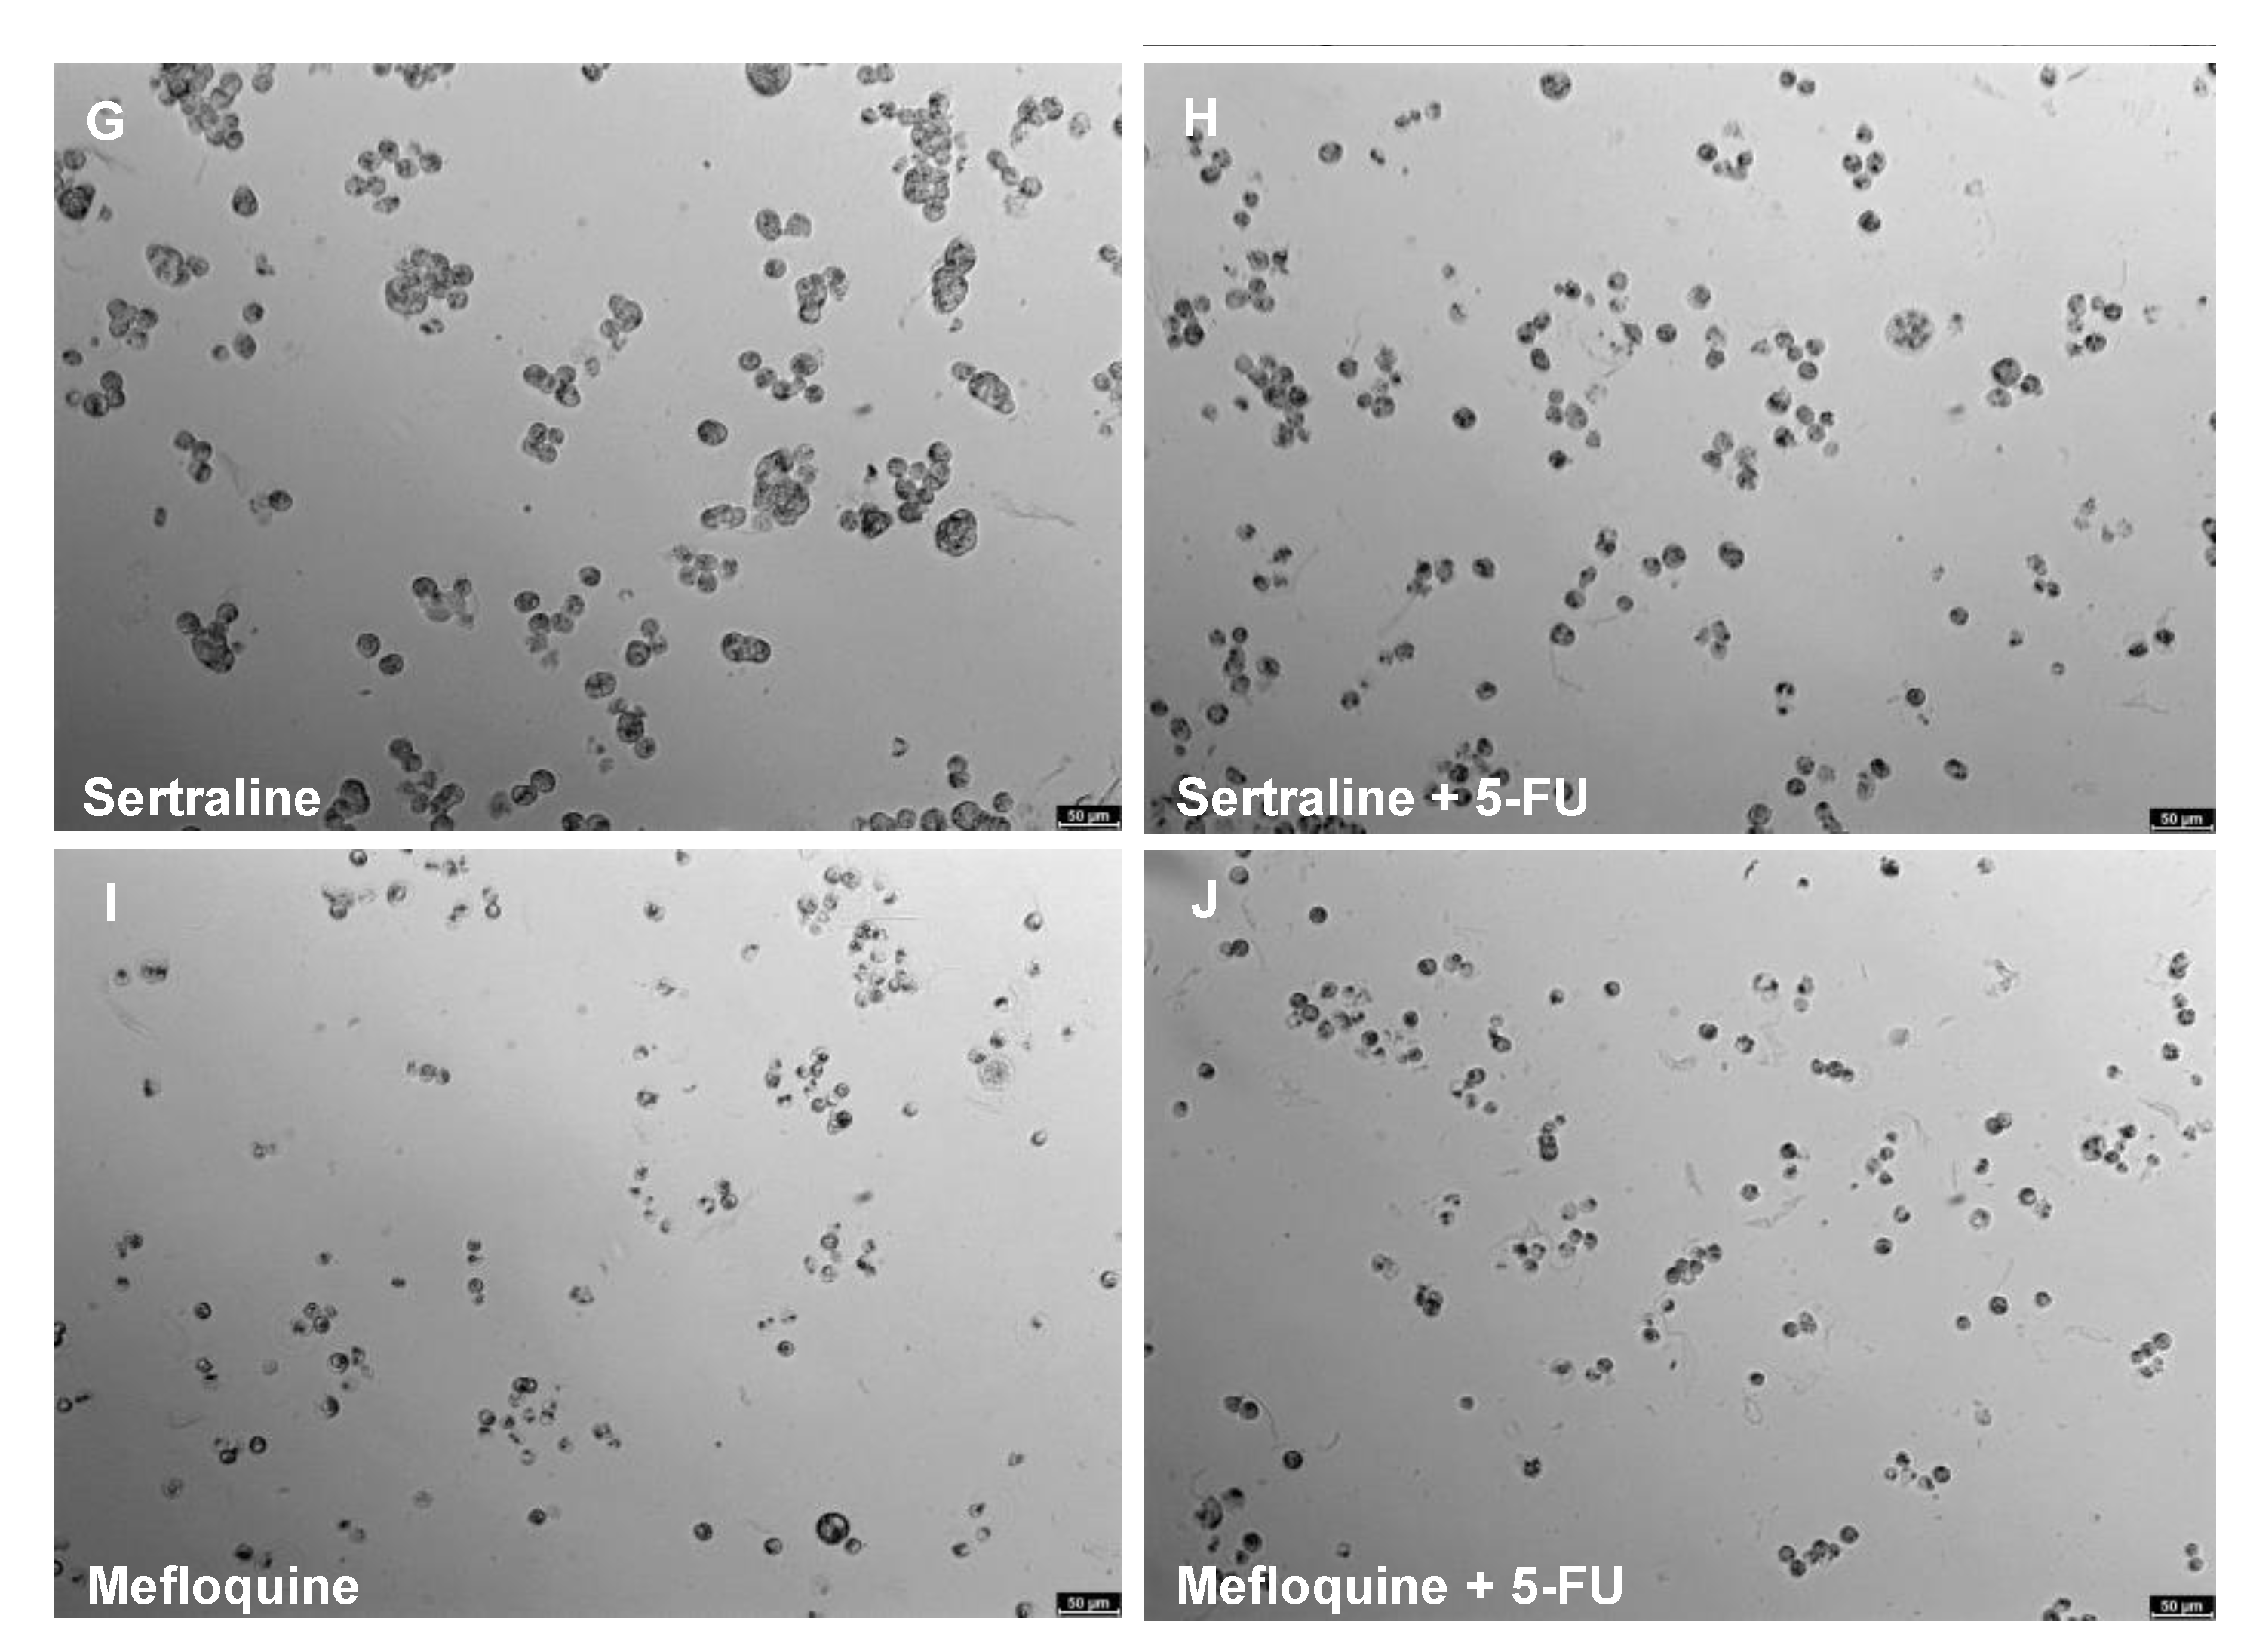
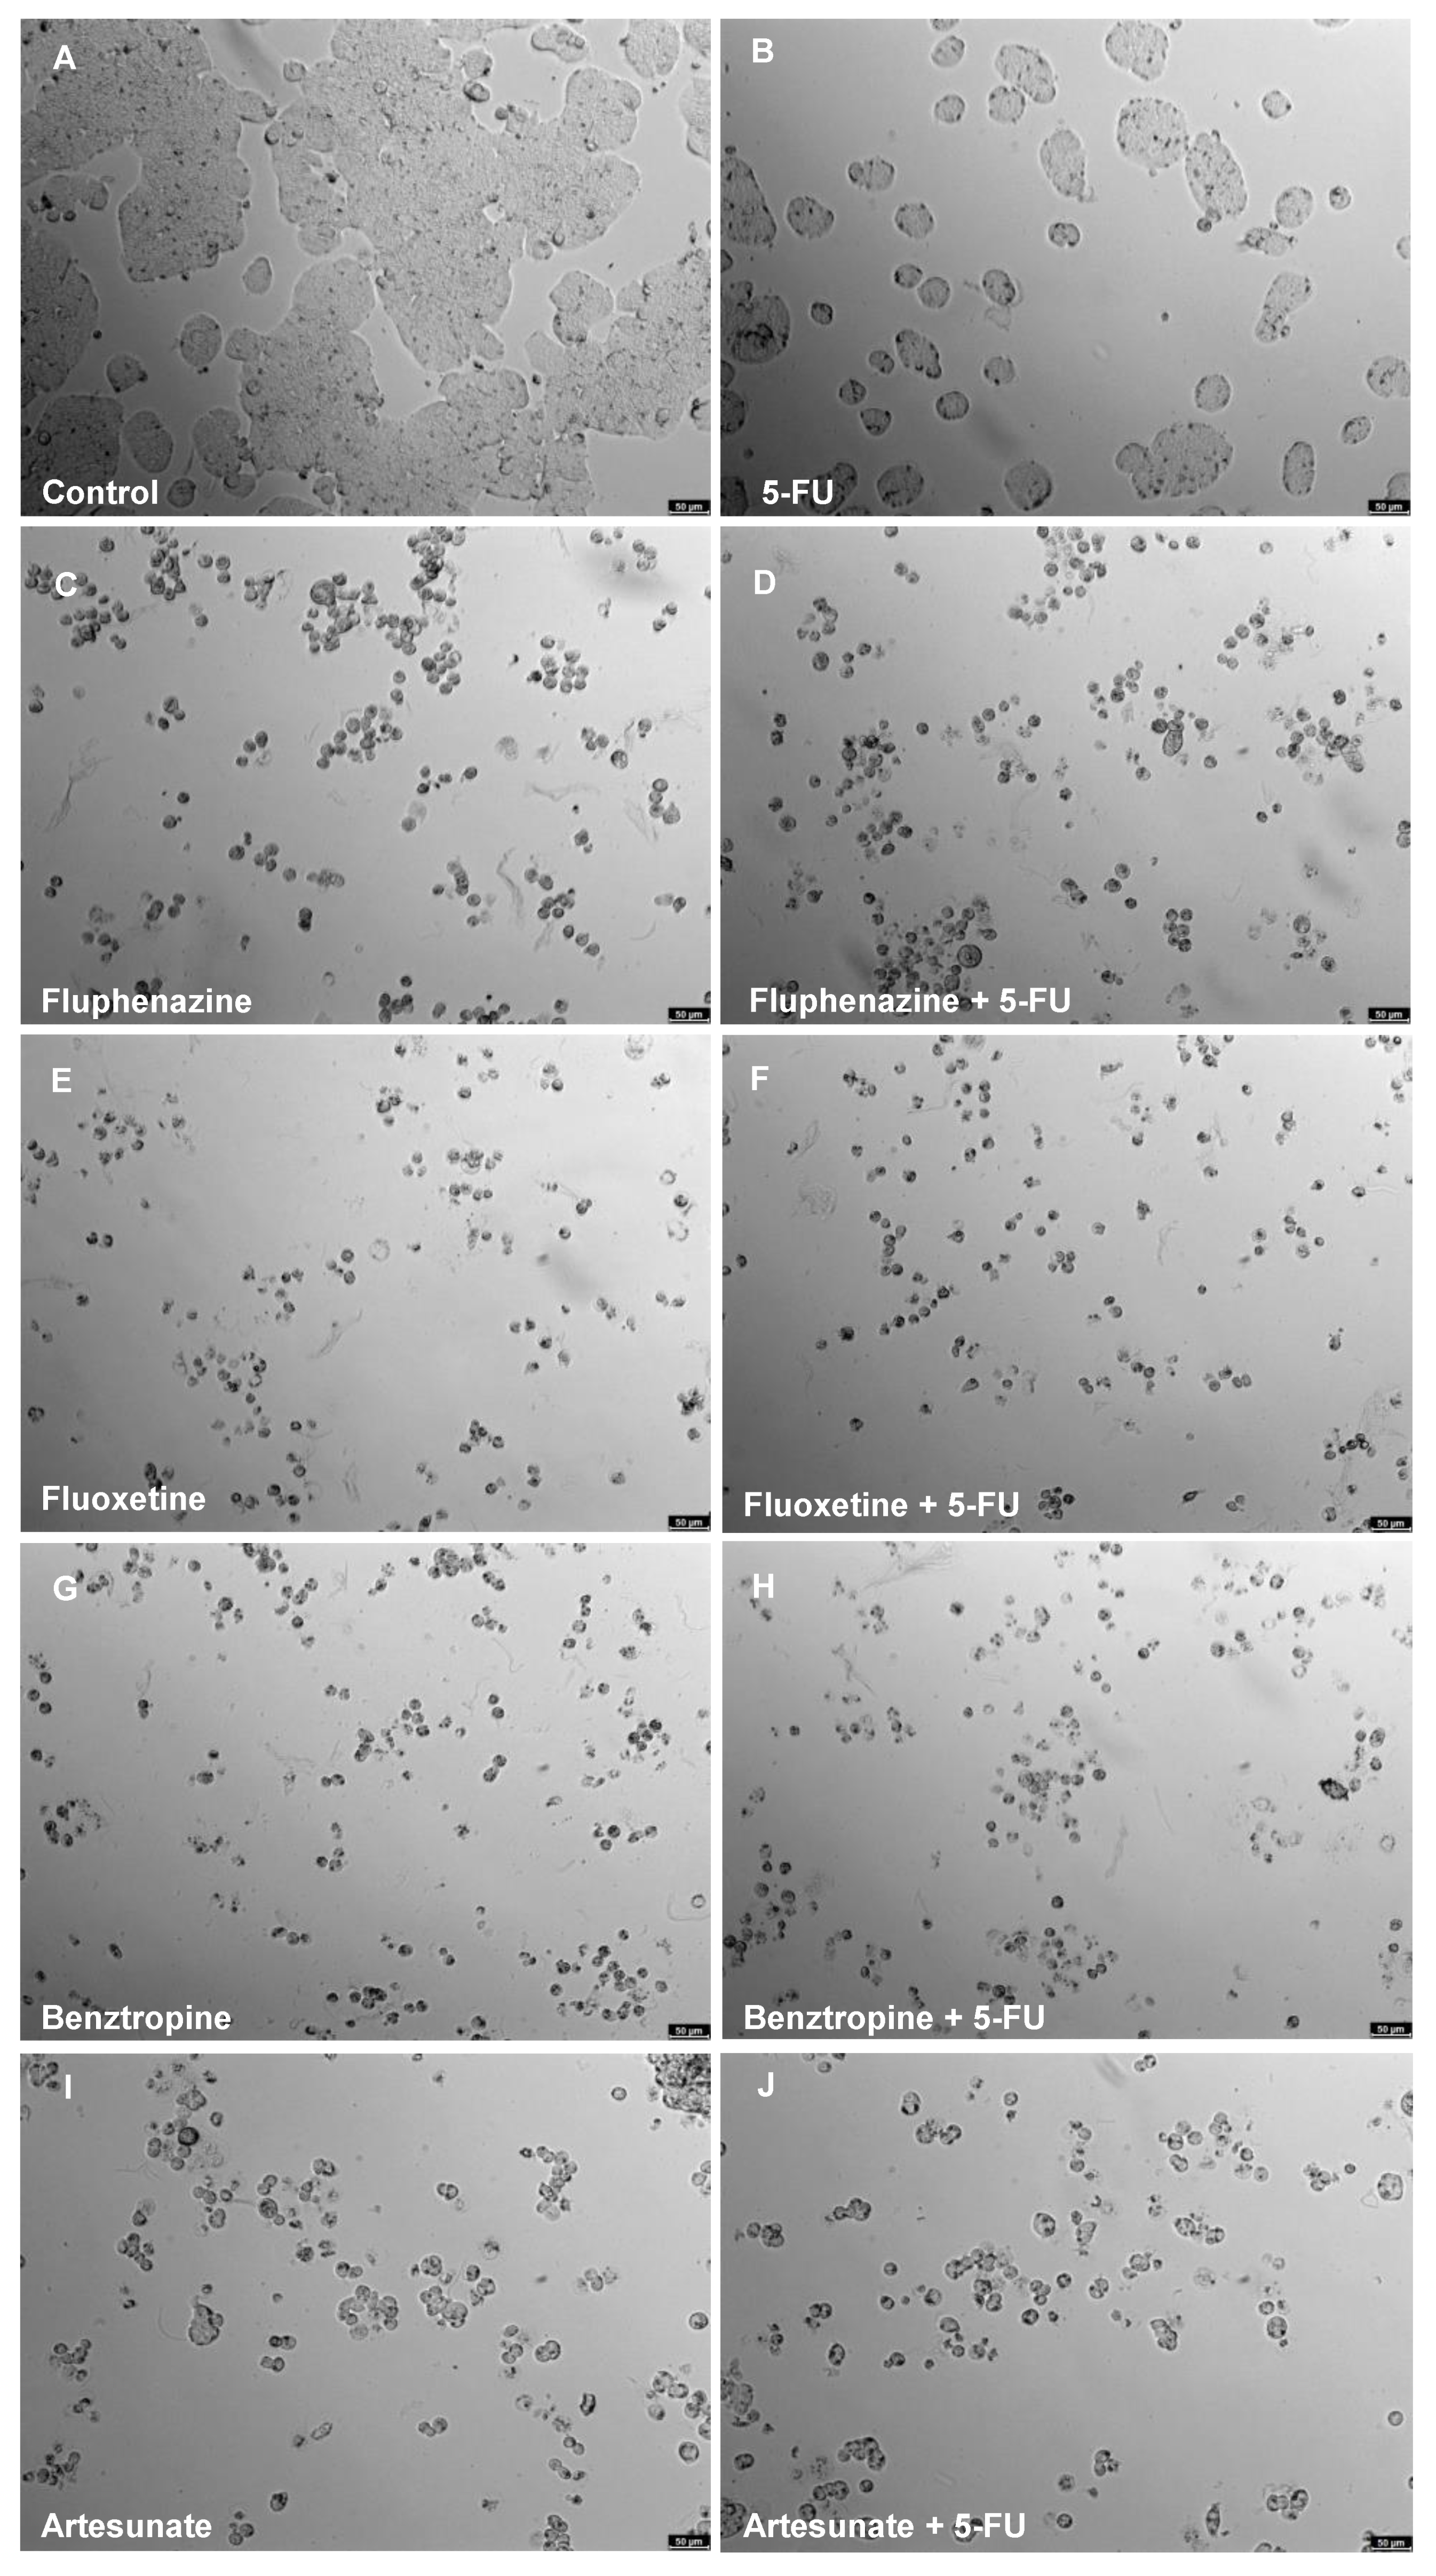
4.5. Cell Morphology Visualisation
4.6. Data Analysis
4.7. Analysis of Drug Interactions
4.8. Statistical Analysis
Author Contributions
Funding
Institutional Review Board Statement
Informed Consent Statement
Data Availability Statement
Acknowledgments
Conflicts of Interest
References
- Siegel, R.L.; Miller, K.D.; Fuchs, H.E.; Jemal, A. Cancer Statistics, 2021. CA Cancer J. Clin. 2021, 71, 7–33. [Google Scholar] [CrossRef] [PubMed]
- Niraula, S.; Seruga, B.; Ocana, A.; Shao, T.; Goldstein, R.; Tannock, I.F.; Amir, E. The price we pay for progress: A meta-analysis of harms of newly approved anticancer drugs. J. Clin. Oncol. 2012, 30, 3012–3019. [Google Scholar] [CrossRef]
- Gupta, S.C.; Sung, B.; Prasad, S.; Webb, L.J.; Aggarwal, B.B. Cancer drug discovery by repurposing: Teaching new tricks to old dogs. Trends Pharmacol. Sci. 2013, 34, 508–517. [Google Scholar] [CrossRef]
- Pantziarka, P.; Bouche, G.; Meheus, L.; Sukhatme, V.; Sukhatme, V.P.; Vikas, P. The repurposing drugs in oncology (ReDO) project. Ecancermedicalscience 2014, 8, 442. [Google Scholar] [CrossRef] [PubMed]
- Hu, Q.; Sun, W.; Wang, C.; Gu, Z. Recent advances of cocktail chemotherapy by combination drug delivery systems. Adv. Drug Deliv. Rev. 2016, 98, 19–34. [Google Scholar] [CrossRef] [PubMed] [Green Version]
- Palmer, A.C.; Sorger, P.K. Combination cancer therapy can confer benefit via patient-to-patient variability without drug additivity or synergy. Cell 2017, 171, 1678–1691.e13. [Google Scholar] [CrossRef] [PubMed] [Green Version]
- Odeh, L.H.; Talib, W.H.; Basheti, I.A. Synergistic effect of thymoquinone and melatonin against breast cancer implanted in mice. J. Cancer Res. Ther. 2018, 14, S324–S330. [Google Scholar] [CrossRef]
- Calaf, G.M.; Ponce-Cusi, R.; Carrión, F. Curcumin and paclitaxel induce cell death in breast cancer cell lines. Oncol. Rep. 2018, 40, 2381–2388. [Google Scholar] [CrossRef]
- Mirzapur, P.; Khazaei, M.R.; Moradi, M.T.; Khazaei, M. Apoptosis induction in human breast cancer cell lines by synergic effect of raloxifene and resveratrol through increasing proapoptotic genes. Life Sci. 2018, 205, 45–53. [Google Scholar] [CrossRef]
- Yao, M.; Yuan, B.; Wang, X.; Sato, A.; Sakuma, K.; Kaneko, K.; Komuro, H.; Okazaki, A.; Hayashi, H.; Toyoda, H.; et al. Synergistic cytotoxic effects of arsenite and tetrandrine in human breast cancer cell line MCF-7. Int. J. Oncol. 2017, 51, 587–598. [Google Scholar] [CrossRef] [Green Version]
- Hu, L.X.; Du, Y.Y.; Zhang, Y.; Pan, Y.Y. Synergistic effects of exemestane and aspirin on MCF-7 human breast cancer cells. Asian Pac. J. Cancer Prev. 2012, 13, 5903–5908. [Google Scholar] [CrossRef] [PubMed] [Green Version]
- Mokhtari, R.B.; Homayouni, T.S.; Baluch, N.; Morgatskaya, E.; Kumar, S.; Das, B.; Yeger, H. Combination therapy in combating cancer. Oncotarget 2017, 8, 38022–38043. [Google Scholar] [CrossRef] [Green Version]
- Oliveras-Ferraros, C.; Vazquez-Martin, A.; Colomer, R.; De Llorens, R.; Brunet, J.; Menendez, J.A. Sequence-dependent synergism and antagonism between paclitaxel and gemcitabine in breast cancer cells: The importance of scheduling. Int. J. Oncol. 2008, 32, 113–120. [Google Scholar] [CrossRef] [PubMed] [Green Version]
- Vogus, D.R.; Pusuluri, A.; Chen, R.; Mitragotri, S. Schedule dependent synergy of gemcitabine and doxorubicin: Improvement of in vitro efficacy and lack of in vitro-in vivo correlation. Bioeng. Transl. Med. 2018, 3, 49–57. [Google Scholar] [CrossRef] [Green Version]
- Chou, T.C. Drug combination studies and their synergy quantification using the chou-talalay method. Cancer Res. 2010, 70, 440–446. [Google Scholar] [CrossRef] [Green Version]
- Roney, M.S.I.; Park, S.-K. Antipsychotic dopamine receptor antagonists, cancer, and cancer stem cells. Arch. Pharm. Res. 2018, 41, 384–408. [Google Scholar] [CrossRef]
- Fond, G.; Macgregor, A.; Attal, J.; Larue, A.; Brittner, M.; Ducasse, D.; Capdevielle, D. Antipsychotic drugs: Pro-cancer or anti-cancer? A systematic review. Med. Hypotheses 2012, 79, 38–42. [Google Scholar] [CrossRef]
- Zong, D.; Zielinska-Chomej, K.; Juntti, T.; Mörk, B.; Lewensohn, R.; Hååg, P.; Viktorsson, K. Harnessing the lysosome-dependent antitumor activity of phenothiazines in human small cell lung cancer. Cell Death Dis. 2014, 5, e1111. [Google Scholar] [CrossRef] [Green Version]
- Munson, J.M.; Fried, L.; Rowson, S.A.; Bonner, M.Y.; Karumbaiah, L.; Diaz, B.; Courtneidge, S.A.; Knaus, U.G.; Brat, D.J.; Arbiser, J.L.; et al. Anti-invasive adjuvant therapy with imipramine blue enhances chemotherapeutic efficacy against glioma. Sci. Transl. Med. 2012, 4, 127ra36. [Google Scholar] [CrossRef] [PubMed]
- Abdelaleem, M.; Ezzat, H.; Osama, M.; Megahed, A.; Alaa, W.; Gaber, A.; Shafei, A.; Refaat, A. Prospects for repurposing CNS drugs for cancer treatment. Oncol. Rev. 2019, 13. [Google Scholar] [CrossRef] [PubMed]
- Rajamanickam, S.; Panneerdoss, S.; Gorthi, A.; Timilsina, S.; Onyeagucha, B.; Kovalskyy, D.; Ivanov, D.; Hanes, M.A.; Vadlamudi, R.K.; Chen, Y.; et al. Inhibition of FoxM1 -Mediated DNA repair by imipramine blue suppresses breast cancer growth and metastasis. Clin. Cancer Res. 2016, 22, 3524–3536. [Google Scholar] [CrossRef] [PubMed] [Green Version]
- Yang, W.-H.; Su, Y.-H.; Hsu, W.-H.; Wang, C.-C.; Arbiser, J.L.; Yang, M.-H. Imipramine blue halts head and neck cancer invasion through promoting F-box and leucine-rich repeat protein 14-mediated Twist1 degradation. Oncogene 2016, 35, 2287–2298. [Google Scholar] [CrossRef] [Green Version]
- Metts, J.; Bradley, H.L.; Wang, Z.; Shah, N.P.; Kapur, R.; Arbiser, J.L.; Bunting, K.D. Imipramine blue sensitively and selectively targets FLT3-ITD positive acute myeloid leukemia cells. Sci. Rep. 2017, 7, 4447. [Google Scholar] [CrossRef]
- Laidlaw, K.M.E.; Berhan, S.; Liu, S.; Silvestri, G.; Holyoake, T.L.; Frank, D.A.; Aggarwal, B.; Bonner, M.Y.; Perrotti, D.; Jørgensen, H.G.; et al. Cooperation of imipramine blue and tyrosine kinase blockade demonstrates activity against chronic myeloid leukemia. Oncotarget 2016, 7, 51651–51664. [Google Scholar] [CrossRef] [PubMed] [Green Version]
- Ghorab, M.M.; Alsaid, M.S.; Samir, N.; Abdel-Latif, G.A.; Soliman, A.M.; Ragab, F.A.; Abou El Ella, D.A. Aromatase inhibitors and apoptotic inducers: Design, synthesis, anticancer activity and molecular modeling studies of novel phenothiazine derivatives carrying sulfonamide moiety as hybrid molecules. Eur. J. Med. Chem. 2017, 134, 304–315. [Google Scholar] [CrossRef]
- Wu, C.-H.; Bai, L.-Y.; Tsai, M.-H.; Chu, P.-C.; Chiu, C.-F.; Chen, M.Y.; Chiu, S.-J.; Chiang, J.-H.; Weng, J.-R. Pharmacological exploitation of the phenothiazine antipsychotics to develop novel antitumor agents—A drug repurposing strategy. Sci. Rep. 2016, 6, 27540. [Google Scholar] [CrossRef]
- Kang, S.S.S.; Hong, J.; Lee, J.M.; Moon, H.E.; Jeon, B.; Choi, J.; Yoon, N.A.; Paek, S.H.; Roh, E.J.; Lee, C.J.; et al. Trifluoperazine, a Well-Known Antipsychotic, Inhibits Glioblastoma Invasion by Binding to Calmodulin and Disinhibiting Calcium Release Channel IP 3 R. Mol. Cancer Ther. 2017, 16, 217–227. [Google Scholar] [CrossRef] [Green Version]
- Yeh, C.-T.; Wu, A.T.H.; Chang, P.M.H.; Chen, K.-Y.; Yang, C.-N.; Yang, S.-C.; Ho, C.-C.; Chen, C.-C.; Kuo, Y.-L.; Lee, P.-Y.; et al. Trifluoperazine, an antipsychotic agent, inhibits cancer stem cell growth and overcomes drug resistance of lung cancer. Am. J. Respir. Crit. Care Med. 2012, 186, 1180–1188. [Google Scholar] [CrossRef] [PubMed]
- Bertolesi, G.E.; Shi, C.; Elbaum, L.; Jollimore, C.; Rozenberg, G.; Barnes, S.; Kelly, M.E.M. The Ca 2+ channel antagonists mibefradil and pimozide inhibit cell growth via different cytotoxic mechanisms. Mol. Pharmacol. 2002, 62, 210–219. [Google Scholar] [CrossRef]
- Ji, M.M.; Wang, L.; Zhan, Q.; Xue, W.; Zhao, Y.; Zhao, X.; Xu, P.P.; Shen, Y.; Liu, H.; Janin, A.; et al. Induction of autophagy by valproic acid enhanced lymphoma cell chemosensitivity through HDAC-independent and IP3-mediated PRKAA activation. Autophagy 2015, 11, 2160–2171. [Google Scholar] [CrossRef] [PubMed] [Green Version]
- Chou, Y.W.; Chaturvedi, N.K.; Ouyang, S.; Lin, F.F.; Kaushik, D.; Wang, J.; Kim, I.; Lin, M.F. Histone deacetylase inhibitor valproic acid suppresses the growth and increases the androgen responsiveness of prostate cancer cells. Cancer Lett. 2011, 311, 177–186. [Google Scholar] [CrossRef] [Green Version]
- Terranova-Barberio, M.; Roca, M.S.; Zotti, A.I.; Leone, A.; Bruzzese, F.; Vitagliano, C.; Scogliamiglio, G.; Russo, D.; D’Angelo, G.; Franco, R.; et al. Valproic acid potentiates the anticancer activity of capecitabine in vitro and in vivo in breast cancer models via induction of thymidine phosphorylase expression. Oncotarget 2016, 7, 7715–7731. [Google Scholar] [CrossRef]
- Liu, S.; Liang, B.; Jia, H.; Jiao, Y.; Pang, Z.; Huang, Y. Evaluation of cell death pathways initiated by antitumor drugs melatonin and valproic acid in bladder cancer cells. FEBS Open Bio. 2017, 7, 798–810. [Google Scholar] [CrossRef] [PubMed]
- Saha, S.; Yin, Y.; Kim, K.; Yang, G.-M.; Dayem, A.; Choi, H.; Cho, S.-G. Valproic acid induces endocytosis-mediated doxorubicin internalization and shows synergistic cytotoxic effects in hepatocellular carcinoma cells. Int. J. Mol. Sci. 2017, 18, 1048. [Google Scholar] [CrossRef] [Green Version]
- Entezar-Almahdi, E.; Mohammadi-Samani, S.; Tayebi, L.; Farjadian, F. Recent Advances in Designing 5-Fluorouracil Delivery Systems: A Stepping Stone in the Safe Treatment of Colorectal Cancer. Int. J. Nanomed. 2020, 15, 5445–5458. [Google Scholar] [CrossRef] [PubMed]
- Ben-Hamo, R.; Zilberberg, A.; Cohen, H.; Bahar-Shany, K.; Wachtel, C.; Korach, J.; Aviel-Ronen, S.; Barshack, I.; Barash, D.; Levanon, K.; et al. Resistance to paclitaxel is associated with a variant of the gene BCL2 in multiple tumor types. Npj Precis. Oncol. 2019, 3. [Google Scholar] [CrossRef]
- Duarte, D.; Vale, N. New trends for antimalarial drugs: Synergism between antineoplastics and antimalarials on breast cancer cells. Biomolecules 2020, 10, 1623. [Google Scholar] [CrossRef] [PubMed]
- Grolleman, J.E.; de Voer, R.M.; Elsayed, F.A.; Nielsen, M.; Weren, R.D.A.; Palles, C.; Ligtenberg, M.J.L.; Vos, J.R.; ten Broeke, S.W.; de Miranda, N.F.C.C.; et al. Mutational signature analysis reveals NTHL1 deficiency to cause a multi-tumor phenotype. Cancer Cell 2019, 35, 256–266.e5. [Google Scholar] [CrossRef] [PubMed] [Green Version]
- Selegiline | DrugBank Online. Available online: https://go.drugbank.com/drugs/DB01037 (accessed on 9 April 2021).
- Safinamide | DrugBank Online. Available online: https://go.drugbank.com/drugs/DB06654 (accessed on 9 April 2021).
- Tolcapone | DrugBank Online. Available online: https://go.drugbank.com/drugs/DB00323 (accessed on 9 April 2021).
- Entacapone | DrugBank Online. Available online: https://go.drugbank.com/drugs/DB00494 (accessed on 9 April 2021).
- Bharadwaj, P.R.; Bates, K.A.; Porter, T.; Teimouri, E.; Perry, G.; Steele, J.W.; Gandy, S.; Groth, D.; Martins, R.N.; Verdile, G. Latrepirdine: Molecular mechanisms underlying potential therapeutic roles in Alzheimer’s and other neurodegenerative diseases. Transl. Psychiatry 2013, 3, e332. [Google Scholar] [CrossRef]
- Fluphenazine | DrugBank Online. Available online: https://go.drugbank.com/drugs/DB00623 (accessed on 9 April 2021).
- Thioridazine | DrugBank Online. Available online: https://go.drugbank.com/drugs/DB00679 (accessed on 9 April 2021).
- Fluoxetine | DrugBank Online. Available online: https://go.drugbank.com/drugs/DB00472 (accessed on 9 April 2021).
- Benzatropine | DrugBank Online. Available online: https://go.drugbank.com/drugs/DB00245 (accessed on 9 April 2021).
- Carbidopa | DrugBank Online. Available online: https://go.drugbank.com/drugs/DB00190 (accessed on 9 April 2021).
- Bromocriptine | DrugBank Online. Available online: https://go.drugbank.com/drugs/DB01200 (accessed on 9 April 2021).
- De La Garza, R.; Bubar, M.J.; Carbone, C.L.; Moeller, F.G.; Newton, T.F.; Anastasio, N.C.; Harper, T.A.; Ware, D.L.; Fuller, M.A.; Holstein, G.J.; et al. Evaluation of the dopamine β-hydroxylase (DβH) inhibitor nepicastat in participants who meet criteria for cocaine use disorder. Prog. Neuro Psychopharmacol. Biol. Psychiatry 2015, 59, 40–48. [Google Scholar] [CrossRef] [Green Version]
- Scopolamine | DrugBank Online. Available online: https://go.drugbank.com/drugs/DB00747 (accessed on 9 April 2021).
- Carbamazepine | DrugBank Online. Available online: https://go.drugbank.com/drugs/DB00564 (accessed on 9 April 2021).
- Sertraline | DrugBank Online. Available online: https://go.drugbank.com/drugs/DB01104 (accessed on 9 April 2021).
- Rivastigmine | DrugBank Online. Available online: https://go.drugbank.com/drugs/DB00989 (accessed on 9 April 2021).
- Miles, T.F.; Lester, H.A.; Dougherty, D.A. Allosteric activation of the 5-HT3AB receptor by mCPBG. Neuropharmacology 2015, 91, 103–108. [Google Scholar] [CrossRef] [PubMed] [Green Version]
- Schlicker, E.; Kathmann, M.; Exner, H.J.; Detzner, M.; Göthert, M. The 5-HT3 receptor agonist 1-(m-chlorophenyl)-biguanide facilitates noradrenaline release by blockade of α2-adrenoceptors in the mouse brain cortex. Naunyn. Schmiedebergs. Arch. Pharmacol. 1994, 349, 20–24. [Google Scholar] [CrossRef]
- Ianevski, A.; Giri, A.K.; Aittokallio, T. SynergyFinder 2.0: Visual analytics of multi-drug combination synergies. Nucleic Acids Res. 2021, 48, W488–W493. [Google Scholar] [CrossRef] [PubMed]
- Chou, T.-C. Theoretical basis, experimental design, and computerized simulation of synergism and antagonism in drug combination studies. Pharmacol. Rev. 2006, 58, 621–681. [Google Scholar] [CrossRef] [PubMed]
- Wang, C.-Z.; Zhang, Z.; Wan, J.-Y.; Zhang, C.-F.; Anderson, S.; He, X.; Yu, C.; He, T.-C.; Qi, L.-W.; Yuan, C.-S. Protopanaxadiol, an active ginseng metabolite, significantly enhances the effects of fluorouracil on colon cancer. Nutrients 2015, 7, 799–814. [Google Scholar] [CrossRef] [PubMed] [Green Version]
- Lee, W.-Y.; Hsu, K.-F.; Chiang, T.-A.; Chen, C.-J. Phellinus linteus extract induces autophagy and synergizes with 5-fluorouracil to inhibit breast cancer cell growth. Nutr. Cancer 2015, 67, 275–284. [Google Scholar] [CrossRef]
- Hwang, J.-T.; Ha, J.; Park, O.J. Combination of 5-fluorouracil and genistein induces apoptosis synergistically in chemo-resistant cancer cells through the modulation of AMPK and COX-2 signaling pathways. Biochem. Biophys. Res. Commun. 2005, 332, 433–440. [Google Scholar] [CrossRef] [PubMed]
- Jiang, D.; Wang, L.; Zhao, T.; Zhang, Z.; Zhang, R.; Jin, J.; Cai, Y.; Wang, F. Restoration of the tumor-suppressor function to mutant p53 by Ganoderma lucidum polysaccharides in colorectal cancer cells. Oncol. Rep. 2017, 37, 594–600. [Google Scholar] [CrossRef] [Green Version]
- Fulda, S.; Debatin, K.-M. Sensitization for anticancer drug-induced apoptosis by the chemopreventive agent resveratrol. Oncogene 2004, 23, 6702–6711. [Google Scholar] [CrossRef] [Green Version]
- Patel, B.B.; Sengupta, R.; Qazi, S.; Vachhani, H.; Yu, Y.; Rishi, A.K.; Majumdar, A.P.N. Curcumin enhances the effects of 5-fluorouracil and oxaliplatin in mediating growth inhibition of colon cancer cells by modulating EGFR and IGF-1R. Int. J. Cancer 2008, 122, 267–273. [Google Scholar] [CrossRef]
- Gil-Ad, I.; Zolokov, A.; Lomnitski, L.; Taler, M.; Bar, M.; Luria, D.; Ram, E.; Weizman, A. Evaluation of the potential anti-cancer activity of the antidepressant sertraline in human colon cancer cell lines and in colorectal cancer-xenografted mice. Int. J. Oncol. 2008, 33, 277–286. [Google Scholar] [CrossRef] [PubMed] [Green Version]
- Zhang, C.; Gong, P.; Liu, P.; Zhou, N.; Zhou, Y.; Wang, Y. Thioridazine elicits potent antitumor effects in colorectal cancer stem cells. Oncol. Rep. 2017, 37, 1168–1174. [Google Scholar] [CrossRef] [PubMed]
- Shu, C.-H.; Yang, W.K.; Shih, Y.-L.; Kuo, M.-L.; Huang, T.-S. Cell cycle G2/M arrest and activation of cyclin-dependent kinases associated with low-dose paclitaxel-induced sub-G1 apoptosis. Apoptosis 1997, 2, 463–470. [Google Scholar] [CrossRef] [PubMed]
- Gwynne, W.D.; Hallett, R.M.; Girgis-Gabardo, A.; Bojovic, B.; Dvorkin-Gheva, A.; Aarts, C.; Dias, K.; Bane, A.; Hassell, J.A. Serotonergic system antagonists target breast tumor initiating cells and synergize with chemotherapy to shrink human breast tumor xenografts. Oncotarget 2017, 8, 32101–32116. [Google Scholar] [CrossRef] [Green Version]
- Bowie, M.; Pilie, P.; Wulfkuhle, J.; Lem, S.; Hoffman, A.; Desai, S.; Petricoin, E.; Carter, A.; Ambrose, A.; Seewaldt, V.; et al. Fluoxetine induces cytotoxic endoplasmic reticulum stress and autophagy in triple negative breast cancer. World J. Clin. Oncol. 2015, 6, 299–311. [Google Scholar] [CrossRef] [Green Version]
- Sun, D.; Zhu, L.; Zhao, Y.; Jiang, Y.; Chen, L.; Yu, Y.; Ouyang, L. Fluoxetine induces autophagic cell death via eEF2K-AMPK-mTOR-ULK complex axis in triple negative breast cancer. Cell Prolif. 2018, 51, e12402. [Google Scholar] [CrossRef] [PubMed] [Green Version]
- Hallett, R.M.; Girgis-Gabardo, A.; Gwynne, W.D.; Giacomelli, A.O.; Bisson, J.N.P.; Jensen, J.E.; Dvorkin-Gheva, A.; Hassell, J.A. Serotonin transporter antagonists target tumor-initiating cells in a transgenic mouse model of breast cancer. Oncotarget 2016, 7, 53137–53152. [Google Scholar] [CrossRef] [Green Version]
- Xu, F.; Xia, Y.; Feng, Z.; Lin, W.; Xue, Q.; Jiang, J.; Yu, X.; Peng, C.; Luo, M.; Yang, Y.; et al. Repositioning antipsychotic fluphenazine hydrochloride for treating triple negative breast cancer with brain metastases and lung metastases. Am. J. Cancer Res. 2019, 9, 459–478. [Google Scholar]
- Jänicke, R.U. MCF-7 breast carcinoma cells do not express caspase-3. Breast Cancer Res. Treat. 2009, 117, 219–221. [Google Scholar] [CrossRef] [Green Version]
- Sogawa, C.; Eguchi, T.; Tran, M.T.; Ishige, M.; Trin, K.; Okusha, Y.; Taha, E.A.; Lu, Y.; Kawai, H.; Sogawa, N.; et al. Antiparkinson drug benztropine suppresses tumor growth, circulating tumor cells, and metastasis by acting on SLC6A3/DAT and reducing STAT3. Cancers 2020, 12, 523. [Google Scholar] [CrossRef] [Green Version]
- O’Brien, F.E.; Dinan, T.G.; Griffin, B.T.; Cryan, J.F. Interactions between antidepressants and P-glycoprotein at the blood-brain barrier: Clinical significance of in vitro and in vivo findings. Br. J. Pharmacol. 2012, 165, 289–312. [Google Scholar] [CrossRef] [PubMed] [Green Version]
- Kapoor, A.; Iqbal, M.; Petropoulos, S.; Ho, H.L.; Gibb, W.; Matthews, S.G. Effects of Sertraline and Fluoxetine on P-Glycoprotein at Barrier Sites: In Vivo and In Vitro Approaches. PLoS ONE 2013, 8, e56525. [Google Scholar] [CrossRef]
- Abou El Ela, A.; Härtter, S.; Schmitt, U.; Hiemke, C.; Spahn-Langguth, H.; Langguth, P. Identification of P-glycoprotein substrates and inhibitors among psychoactive compounds—Implications for pharmacokinetics of selected substrates. J. Pharm. Pharmacol. 2010, 56, 967–975. [Google Scholar] [CrossRef] [PubMed]
- Roell, K.R.; Reif, D.M.; Motsinger-Reif, A.A. An introduction to terminology and methodology of chemical synergy—perspectives from across disciplines. Front. Pharmacol. 2017, 8. [Google Scholar] [CrossRef] [PubMed]


| Drug | Mechanism of Action | Ref. |
|---|---|---|
| Selegiline | Irreversible inhibitor of monoamine oxidase type B (MAO-B). Binds to MAO-B and blocks the microsomal metabolism of dopamine, enhancing the dopaminergic activity in the substantial nigra. It can also inhibit monoamine oxidase type A (MAO-A). | [39] |
| Safinamide | Reversible inhibitor of MAO-B; blocks voltage-dependent Na+ and Ca2+ channels and inhibits the glutamate release. | [40] |
| Entacapone | Adjunct to levodopa/carbidopa therapy and reversible inhibitor of catechol-O-methyltransferase (COMT) in peripheral tissues, altering the plasma pharmacokinetics of levodopa. | |
| Tolcapone | [41,42] | |
| Latrepirdine | Blocks H1 histamine receptor activity and interact with calcium channels and a wide range of other neurotransmitter receptors. | [43] |
| Fluphenazine | Blocks postsynaptic mesolimbic dopaminergic D1 and D2 receptors in the brain and depresses the release of hypothalamic and hypophyseal hormones | |
| Thioridazine | [44,45] | |
| Fluoxetine | Selective serotonin reuptake inhibitor (SSRI); inhibits the presynaptic reuptake of the neurotransmitter serotonin, increasing the levels of 5-hydroxytryptamine (5-HT) in the brain. | [46] |
| Benztropine | Selective inhibitor of dopamine transporter; presents affinity for histamine and M1 muscarine receptors. | [47] |
| Carbidopa | Inhibitor of the aromatic amino acid decarboxylase (DDC) and the peripheral metabolism of levodopa. | [48] |
| Bromocriptine | Agonist of dopaminergic D2 and D3 receptors in the brain. | [49] |
| Nepicastat | Inhibitor of Dopamine β-hydroxylase (DβH) | [50] |
| Scopolamine | Non-selective competitive inhibitor of G-protein-coupled muscarinic receptors (mAChRs), with anticholinergic action. | [51] |
| Carbamazepine | Inhibits sodium channel firing, treating seizure activity. In bipolar disorder, carbamazepine is thought to increase dopamine turnover and increase GABA transmission. | [52] |
| Sertraline | Selective inhibitor of serotonin reuptake at the presynaptic neuronal membrane, thereby increasing serotonergic activity. | [53] |
| Rivastigmine | Binds reversibly with and inactivates cholinesterase (e.g., acetylcholinesterase and butyrylcholinesterase), preventing the hydrolysis of acetylcholine, and thus, leading to an increased concentration of acetylcholine at cholinergic synapses. | [54] |
| m-chlorophenilbiguanide | Allosteric agonist and modulator of the 5-HT3 receptor and an antagonist of the α2A-adrenergic receptor. | [55,56] |
| Drug | IC50 (µM) |
|---|---|
| 5-Fluorouracil | 3.79 ‡ |
| Selegiline | >100 |
| Entacapone | 40.89 |
| Tolcapone | 35.47 |
| Latrepirdine | 7.75 ‡ |
| Fluphenazine | 1.86 ‡ |
| Safinamide | >100 |
| Fluoxetine | 6.12 ‡ |
| Benztropine | 18.23 ‡ |
| Thioridazine | 4.26 ‡ |
| Carbidopa | >100 |
| Bromocriptine | >100 |
| Nepicastat | 61.24 |
| Scopolamine | >100 |
| Carbamazepine | >100 |
| Sertraline | 2.45 ‡ |
| Chloroquine | 32.13 |
| Mefloquine | 11.49 ‡ |
| Artesunate | 17.88 ‡ |
| Rivastigmine | >100 |
| m-Chlorophenilbiguanide | >100 |
| Combination (Drug A + Drug B) | Total Dose (Dose A + Dose B) | Fractional Effect (Fa) | CI Value |
|---|---|---|---|
| 5-FU + latrepirdine | 2.75 | 0.14129 | 1.65359 |
| 5.5 | 0.16103 | 2.00449 | |
| 11.0 | 0.17389 | 2.97604 | |
| 22.0 | 0.21248 | 2.69396 | |
| 44.0 | 0.44126 | 0.21700 | |
| 5-FU + fluoxetine | 2.25 | 0.1497 | 1.83049 |
| 4.5 | 0.1688 | 2.64547 | |
| 9.0 | 0.364 | 1.36014 | |
| 18.0 | 0.73678 | 0.98008 | |
| 36.0 | 0.8799 | 1.09726 | |
| 5-FU + benztropine | 5.25 | 0.1984 | 1.94601 |
| 10.5 | 0.3913 | 1.17167 | |
| 21.0 | 0.5293 | 1.27070 | |
| 42.0 | 0.6237 | 1.67649 | |
| 84.0 | 0.8716 | 0.74841 | |
| 5-FU + thioridazine | 1.75 | 0.00001 | 3.28032 |
| 3.5 | 0.0882 | 0.57237 | |
| 7.0 | 0.5245 | 0.63129 | |
| 14.0 | 0.7502 | 0.99126 | |
| 28.0 | 0.8692 | 1.63800 | |
| 5-FU + sertraline | 1.375 | 0.0001 | 0.91640 |
| 2.75 | 0.001 | 0.95924 | |
| 5.5 | 0.1469 | 0.54137 | |
| 11.0 | 0.4412 | 0.76907 | |
| 22.0 | 0.8507 | 0.99970 | |
| 5-FU + mefloquine | 3.625 | 0.2138 | 29.9325 |
| 7.25 | 0.5659 | 4.07663 | |
| 14.5 | 0.8481 | 0.68334 | |
| 29.0 | 0.861 | 1.14685 | |
| 58.0 | 0.873 | 1.92463 | |
| 5-FU + artesunate | 5.25 | 0.00001 | 1461.26 |
| 10.5 | 0.0782 | 1.27561 | |
| 21.0 | 0.1521 | 1.35742 | |
| 42.0 | 0.2489 | 1.62381 | |
| 84.0 | 0.5575 | 1.07643 | |
| 5-FU + fluphenazine | 5.25 | 0.11608 | 11.6103 |
| 10.5 | 0.17321 | 13.0845 | |
| 21.0 | 0.4477 | 8.40182 | |
| 42.0 | 0.5522 | 12.1699 | |
| 84.0 | 0.8399 | 8.04387 |
| Combination Indexes for the Different Drug Combinations | ||||
|---|---|---|---|---|
| Drug Combination (µM) | Schedule A (CI) | Schedule B (CI) | Schedule C (CI) | |
| 5-FU | Fluphenazine | |||
| 0.75 | 0.5 | 11.61 | >100 | 4.09 |
| 1.5 | 1 | 13.08 | >100 | 24.81 |
| 3 | 2 | 8.40 | >100 | 1.77 |
| 6 | 4 | 12.17 | 4.36 | 1.96 |
| 12 | 8 | 8.04 | 4.68 | 1.76 |
| 5-FU | Fluoxetine | |||
| 0.75 | 1.5 | 1.83 | >100 | 7.30 |
| 1.5 | 3 | 2.65 | >100 | 3.53 |
| 3 | 6 | 1.36 | >100 | 2.32 |
| 6 | 12 | 0.98 | 2.56 | 1.48 |
| 12 | 24 | 1.10 | 1.74 | 1.11 |
| 5-FU | Benztropine | |||
| 0.75 | 4.5 | 1.95 | 34.97 | 4.01 |
| 1.5 | 9 | 1.17 | 2.86 | 2.54 |
| 3 | 18 | 1.27 | 3.42 | 2.12 |
| 6 | 36 | 1.68 | 4.33 | 3.58 |
| 12 | 72 | 0.75 | 4.31 | 3.14 |
| 5-FU | Artesunate | |||
| 0.75 | 4.5 | >100 | 7.88 | 0.40 |
| 1.5 | 9 | 1.28 | 4.85 | 0.49 |
| 3 | 18 | 1.36 | 4.22 | 0.81 |
| 6 | 36 | 1.62 | 2.56 | 1.16 |
| 12 | 72 | 1.08 | 1.64 | 1.26 |
| Drug | HT-29 IC50 (µM) | MCF-7 IC50 (µM) |
|---|---|---|
| Fluphenazine | 1.86 | 2.68 ‡ |
| Fluoxetine | 6.12 | 7.78 ‡ |
| Benztropine | 18.23 | 21.71 ‡ |
| Thioridazine | 4.26 | 5.72 ‡ |
| Sertraline | 2.45 | 2.22 ‡ |
| Latrepirdine | 7.75 | 75.37 |
| Combination (Drug A + Drug B) | Total Dose (Dose A + Dose B) | Fractional Effect (Fa) | CI Value |
|---|---|---|---|
| PTX + fluoxetine | 2.75 | 0.1184 | 0.33562 |
| 5.5 | 0.2472 | 0.48322 | |
| 11.0 | 0.3621 | 0.79198 | |
| 22.0 | 0.5227 | 1.24993 | |
| 44.0 | 0.7167 | 1.85505 | |
| PTX + sertraline | 1.375 | 1.0 × 10⁻⁴ | 5.01852 |
| 2.75 | 0.0768 | 0.73865 | |
| 5.5 | 0.1987 | 0.99737 | |
| 11.0 | 0.4012 | 1.40860 | |
| 22.0 | 0.6326 | 2.04261 | |
| PTX + thioridazine | 2.25 | 0.0109 | 0.98541 |
| 4.5 | 0.1895 | 0.69489 | |
| 9.0 | 0.5027 | 0.86789 | |
| 18.0 | 0.7077 | 1.32210 | |
| 36.0 | 0.7128 | 2.62409 | |
| PTX + fluphenazine | 1.5 | 0.01908 | 0.63552 |
| 3.0 | 0.057 | 0.83495 | |
| 6.0 | 0.33804 | 0.78096 | |
| 12.0 | 0.44769 | 1.33256 | |
| 24.0 | 0.67095 | 1.95345 | |
| PTX + benztropine | 6.25 | 0.09897 | 0.45763 |
| 12.5 | 0.2321 | 0.65346 | |
| 25.0 | 0.51629 | 0.86840 | |
| 50.0 | 0.66485 | 1.42716 | |
| 100.0 | 0.71074 | 2.66897 |
Publisher’s Note: MDPI stays neutral with regard to jurisdictional claims in published maps and institutional affiliations. |
© 2021 by the authors. Licensee MDPI, Basel, Switzerland. This article is an open access article distributed under the terms and conditions of the Creative Commons Attribution (CC BY) license (https://creativecommons.org/licenses/by/4.0/).
Share and Cite
Duarte, D.; Cardoso, A.; Vale, N. Synergistic Growth Inhibition of HT-29 Colon and MCF-7 Breast Cancer Cells with Simultaneous and Sequential Combinations of Antineoplastics and CNS Drugs. Int. J. Mol. Sci. 2021, 22, 7408. https://doi.org/10.3390/ijms22147408
Duarte D, Cardoso A, Vale N. Synergistic Growth Inhibition of HT-29 Colon and MCF-7 Breast Cancer Cells with Simultaneous and Sequential Combinations of Antineoplastics and CNS Drugs. International Journal of Molecular Sciences. 2021; 22(14):7408. https://doi.org/10.3390/ijms22147408
Chicago/Turabian StyleDuarte, Diana, Armando Cardoso, and Nuno Vale. 2021. "Synergistic Growth Inhibition of HT-29 Colon and MCF-7 Breast Cancer Cells with Simultaneous and Sequential Combinations of Antineoplastics and CNS Drugs" International Journal of Molecular Sciences 22, no. 14: 7408. https://doi.org/10.3390/ijms22147408