
Pleiotropic Potential of Evernia prunastri Extracts and Their Main Compounds Evernic Acid and Atranorin: In Vitro and In Silico Studies
 , , , , , , and
Abstract
:1. Introduction
2. Results and Discussion
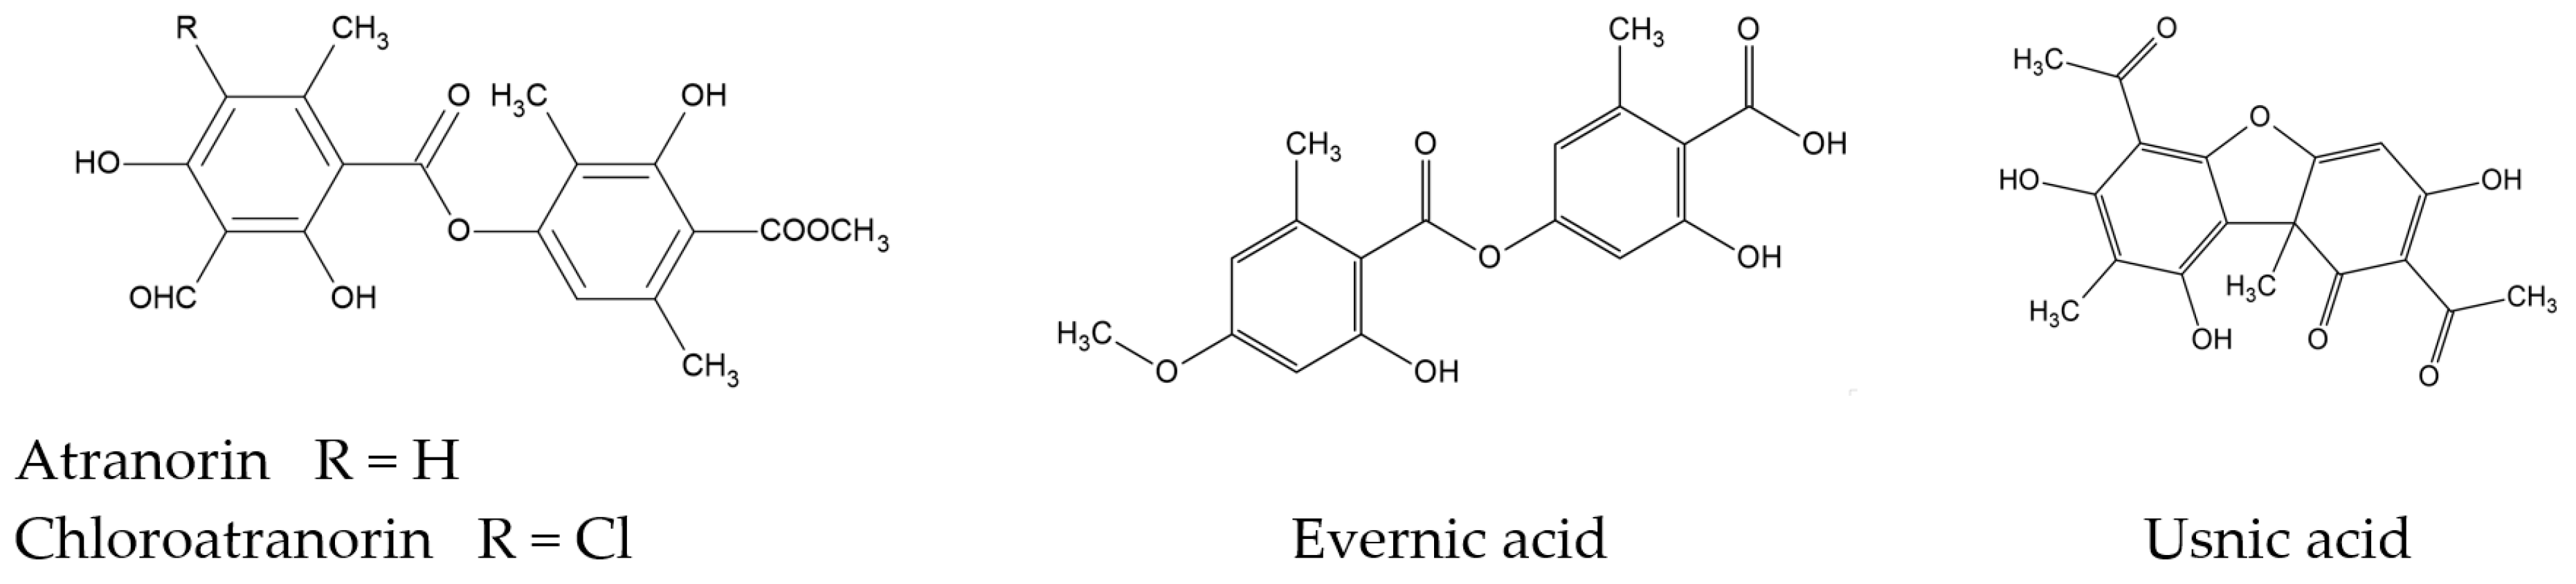
2.1. Phytochemicals Analysis of Evernia prunastri
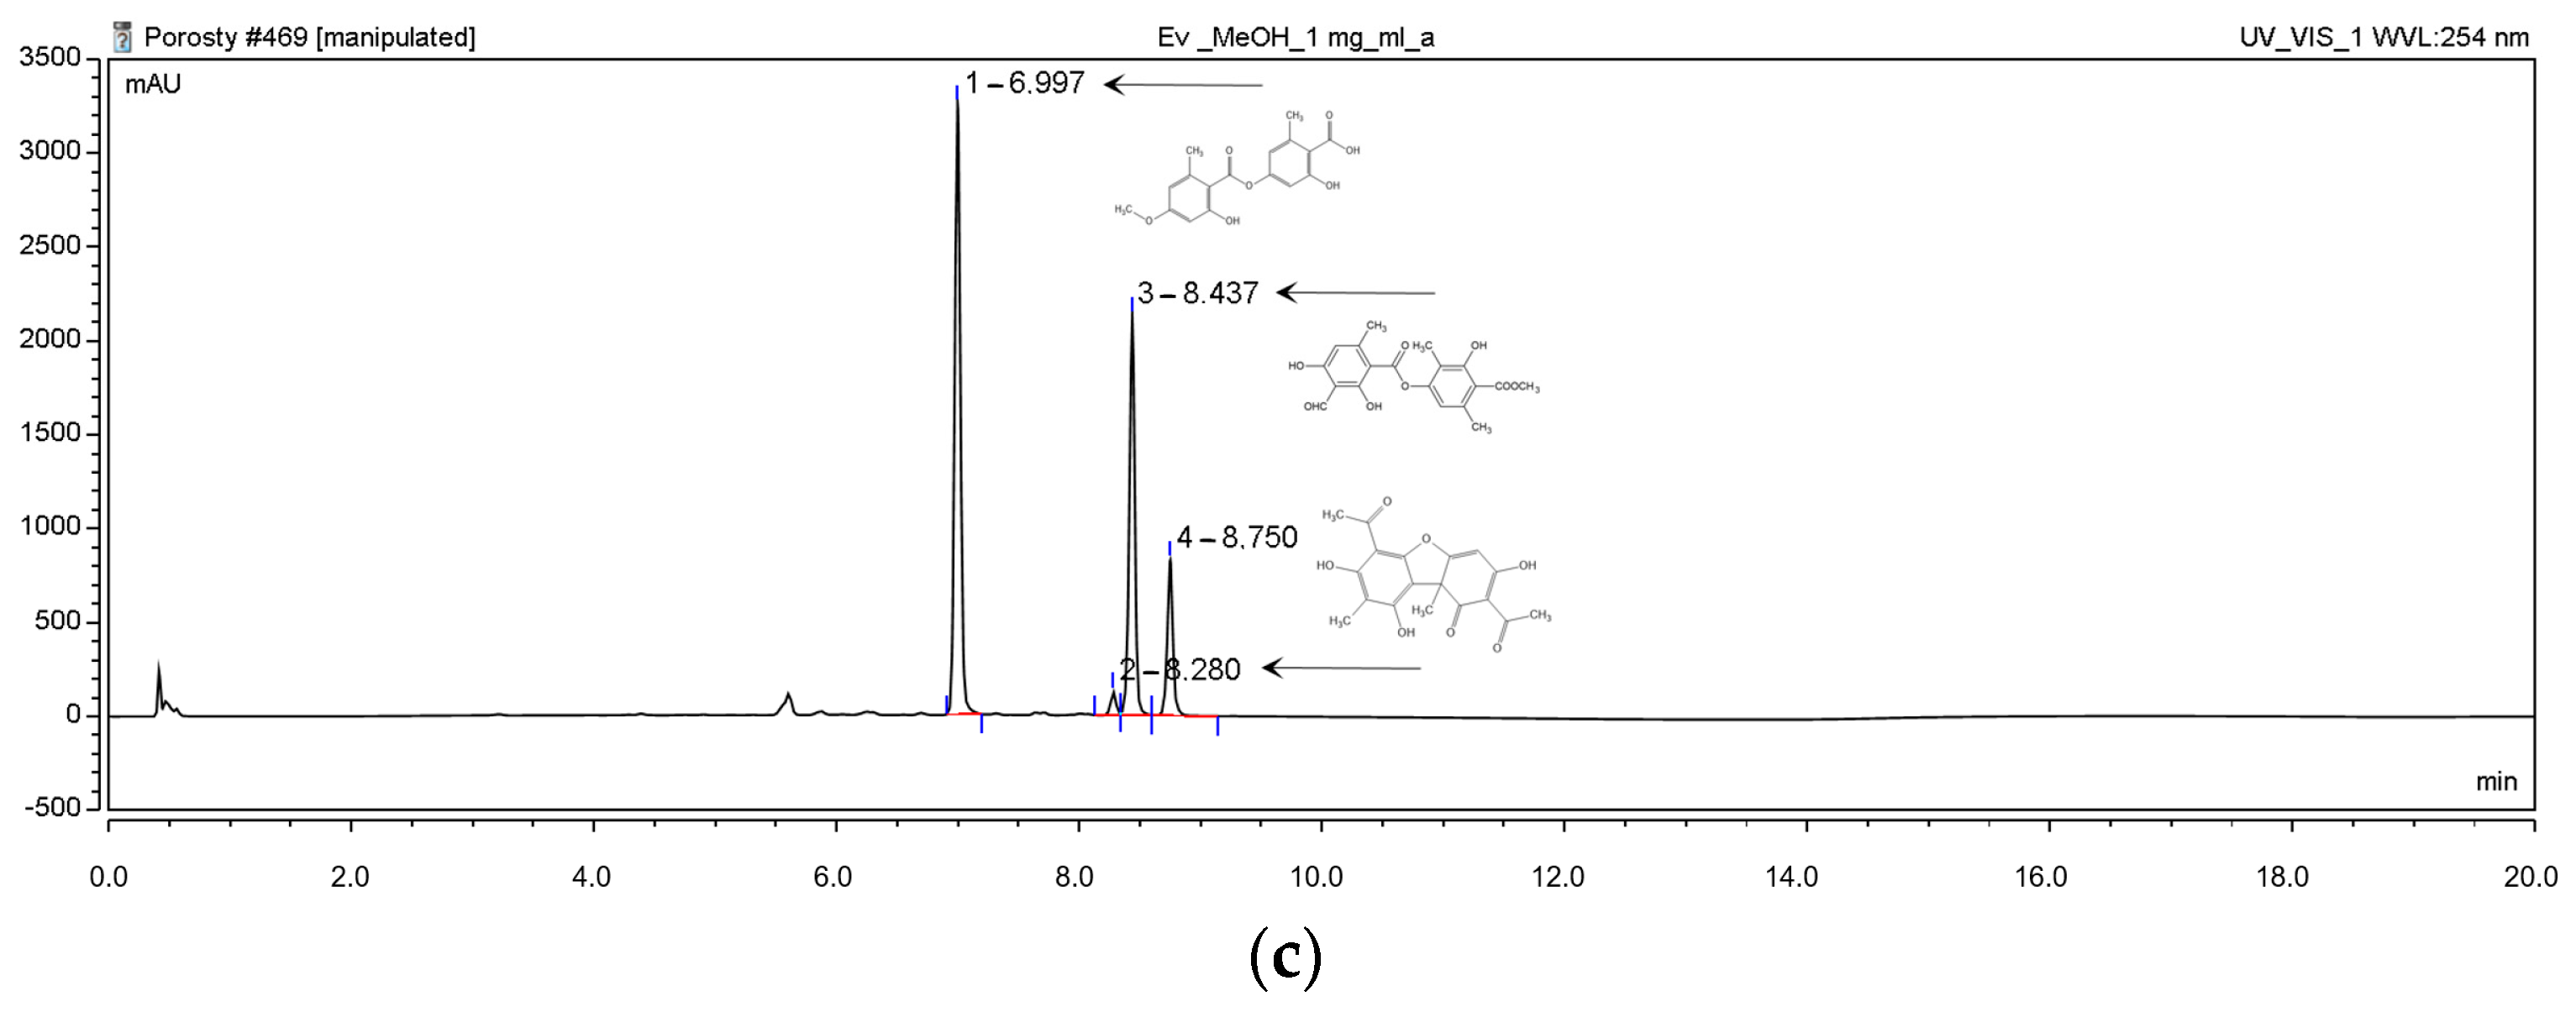
2.1.1. High-Performance Liquid Chromatography (HPLC) Analyses
2.1.2. Total Polyphenol Content
2.2. Biological Activity of Evernia prunastri
2.2.1. Antioxidant Activity
2,2-Diphenyl-1-Picrylhydrazyl (DPPH) and Cupric Ion Reducing Antioxidant Capacity (CUPRAC) Assays
Chelating Activity of Fe2+ and Cu2+
Effect on Antioxidant Enzyme Activity
2.2.2. Anti-Inflammatory Activity
Effect on Cyclooxygenase-2 Activity (COX-2)

| Tested Sample | COX-2 Inhibition (%) | Acetylsalicylic Acid Equivalent (mg/mL) |
|---|---|---|
| Hex | 13.7 ± 1.6 | 7.0 ± 0.4 |
| DCM | 44.8 ± 2.6 | 10.6 ± 0.5 |
| Ace | 57.5 ± 2.2 | 12.0 ± 0.4 |
| MeOH | 96.3 ± 1.9 | 16.5 ± 1.0 |
| MeOH-H2O | 12.4 ± 2.3 | 6.8 ± 0.9 |
| H2O | 18.5 ± 2.5 | 7.5 ± 0.2 |
| EA | 43.5 ± 2.7 | 10.4 ± 0.2 |
| ATR | na* | na* |
Anti-Hyaluronidase Activity
2.2.3. Neuroprotective Activity
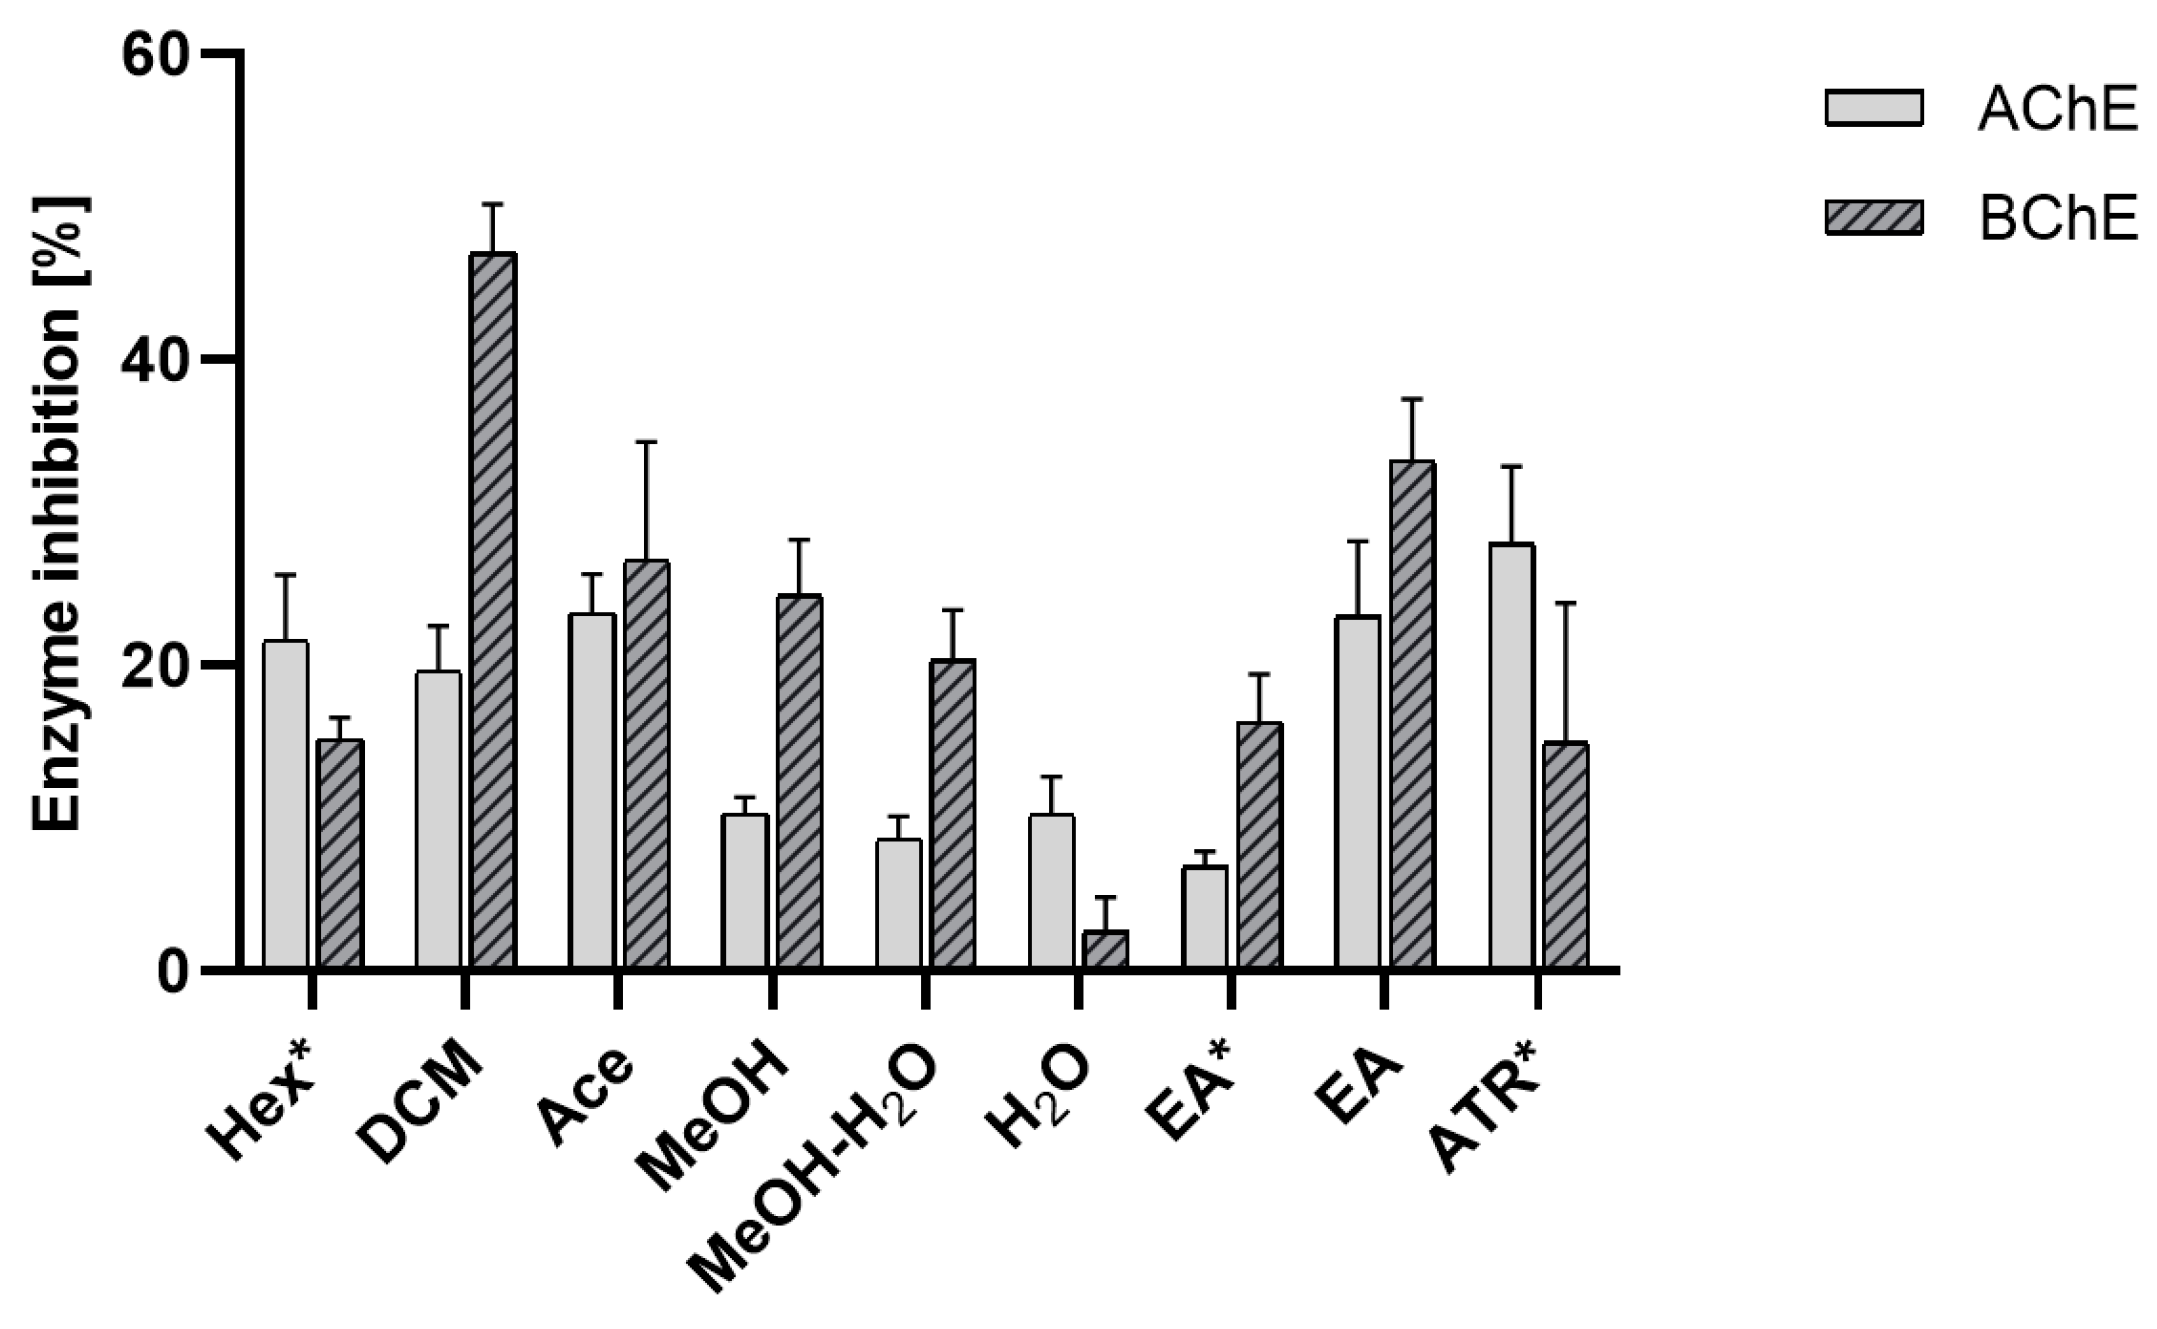
Effect on Acetylcholinesterase (AChE) and Butyrylcholinesterase (BChE) Activity
Effect on Tyrosinase Activity
α-Glucosidase Inhibitory Assay
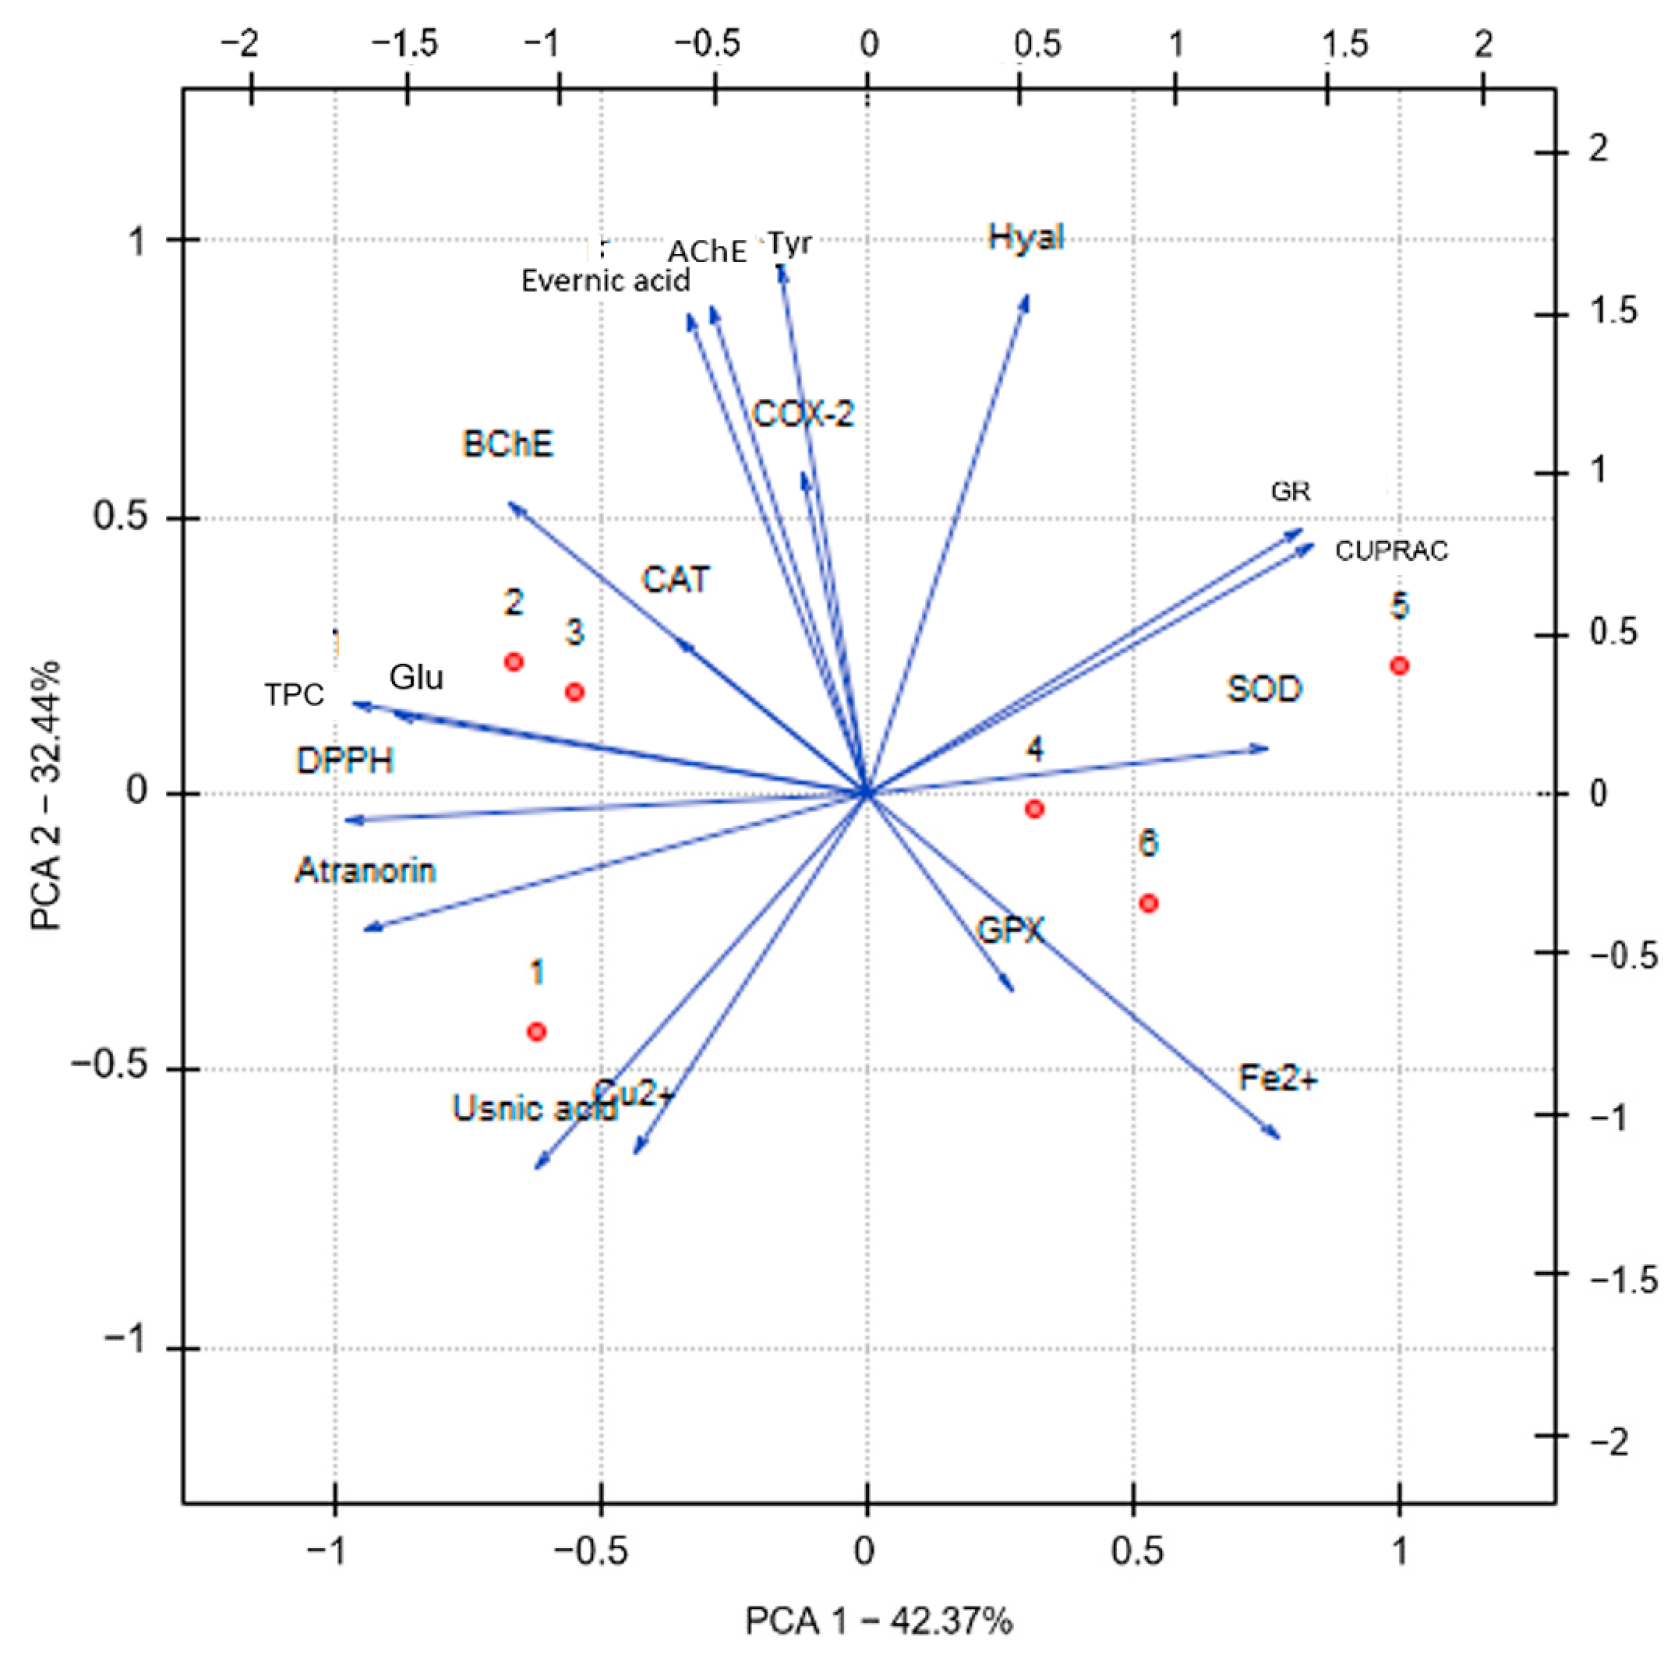
2.3. Principal Component Analysis (PCA)
2.4. Molecular Docking Study
2.4.1. Cyclooxygenase-2 (COX-2)
2.4.2. Acetylcholinesterase (AChE)
2.4.3. Butyrylcholinesterase (BChE)
2.4.4. Tyrosinase (Tyr)
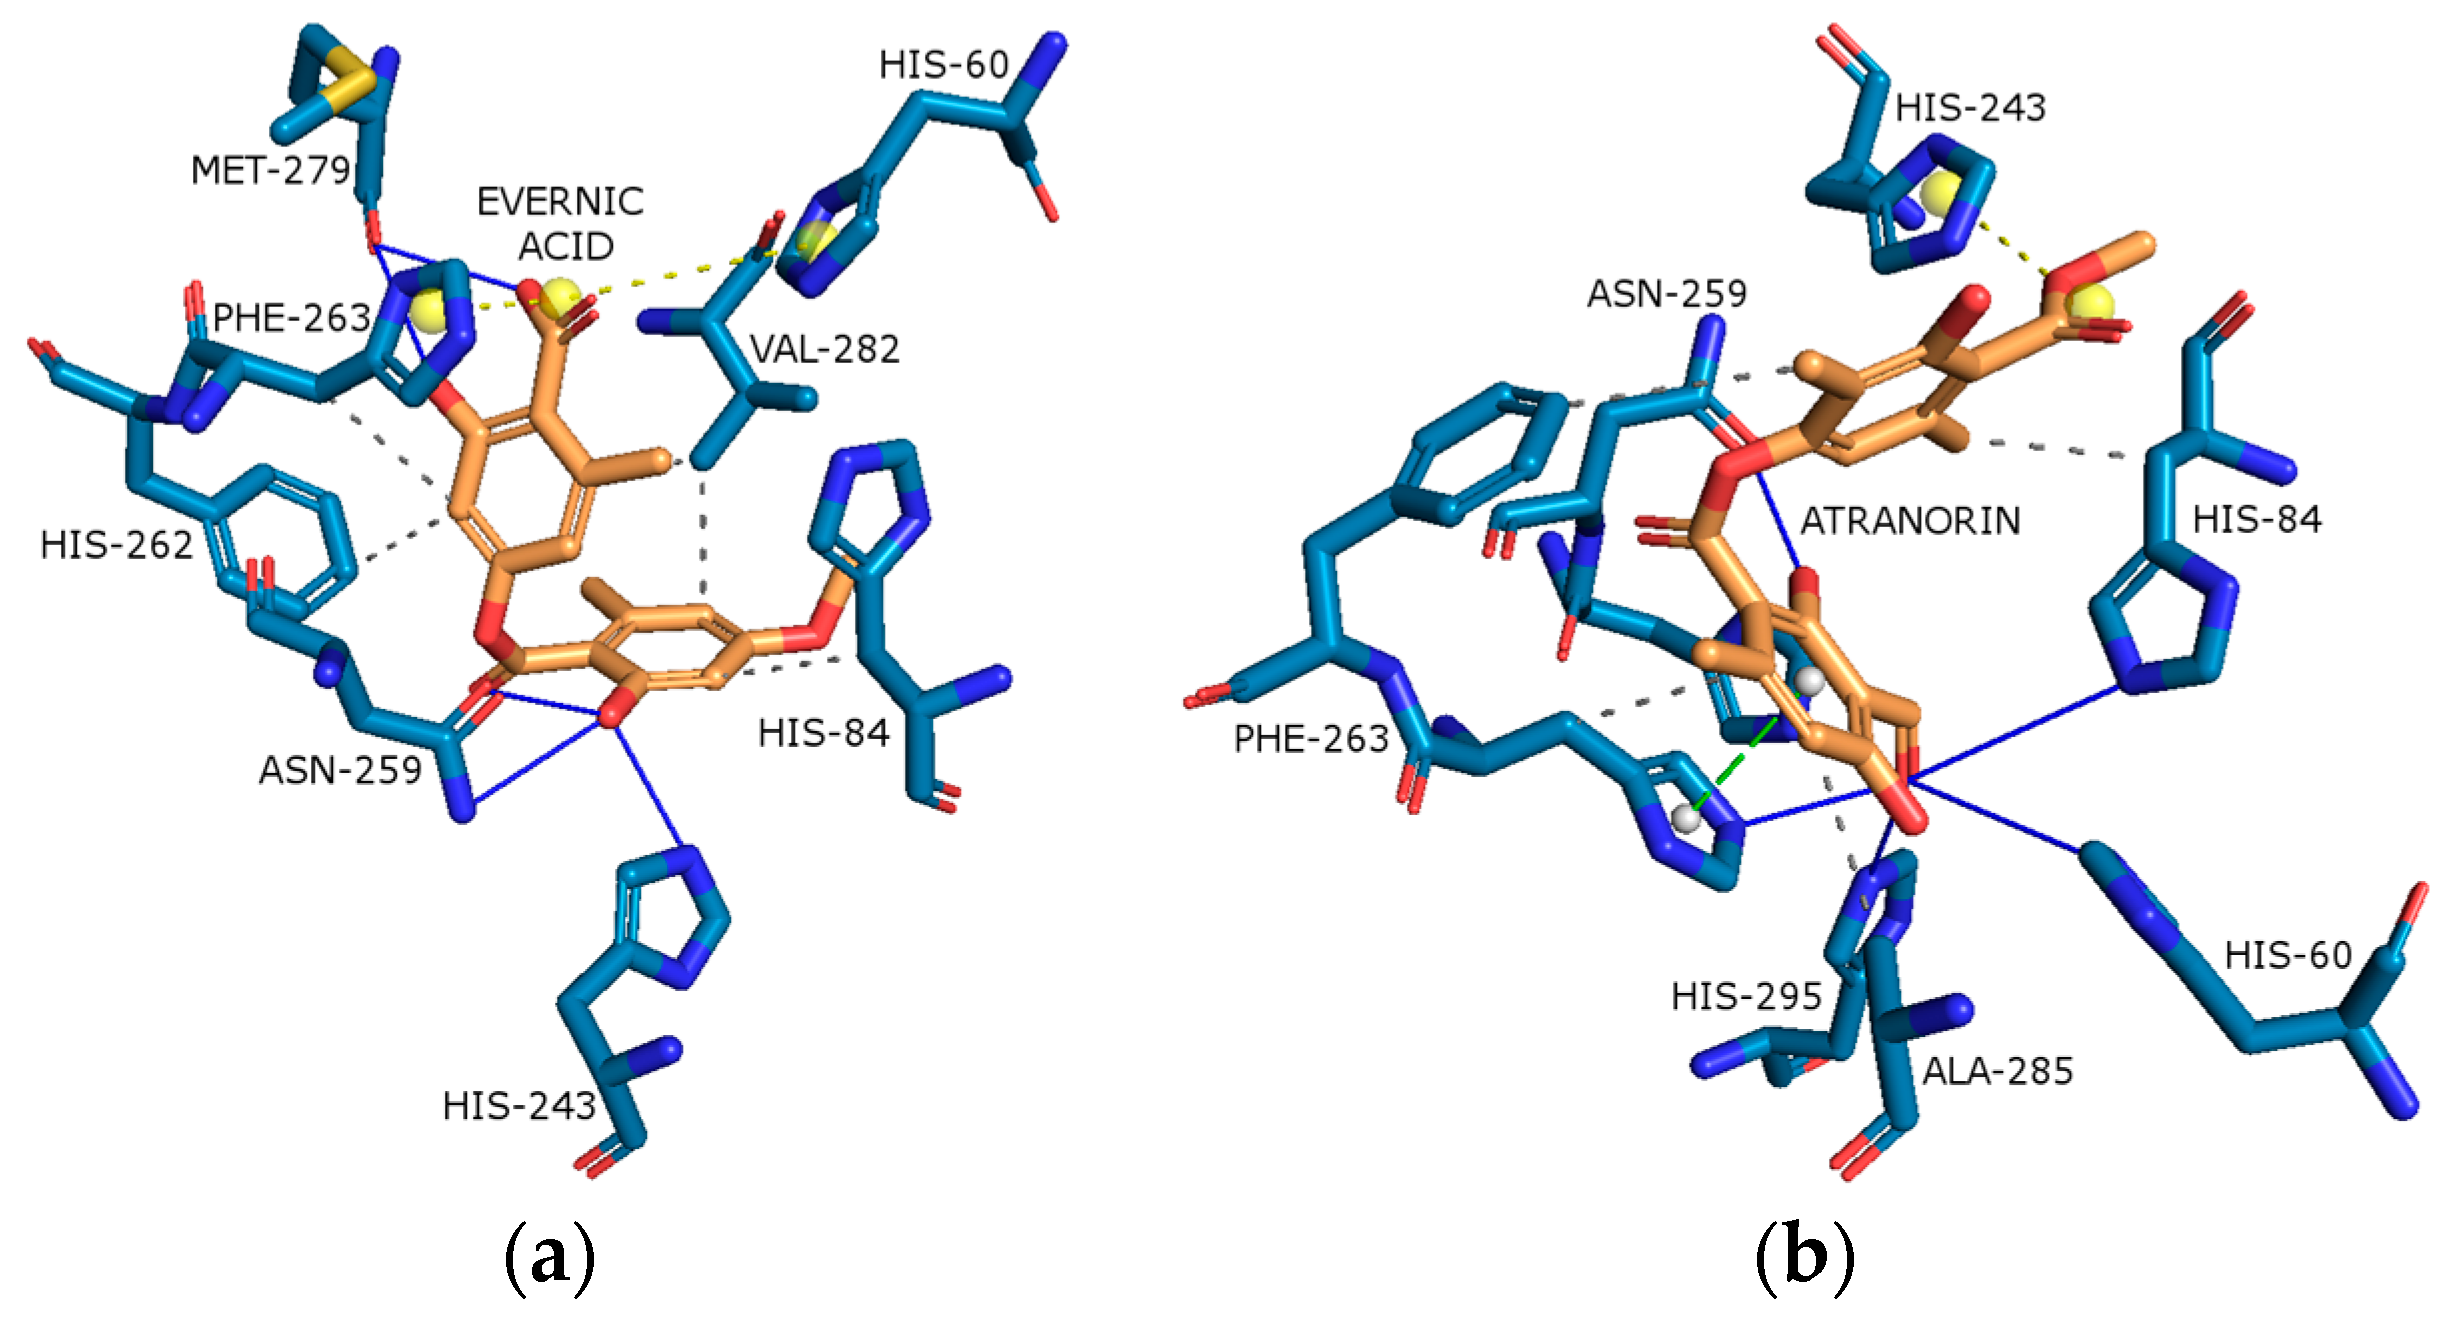
2.4.5. α-Glucosidase
2.5. Permeability through the Blood–Brain Barrier (PAMPA-BBB)
3. Materials and Methods
3.1. Plant Material and Reagents
3.2. Preparation of Extract
3.3. HPLC Analyses of the Extracts
3.4. Total Phenolic Content (TPC)
3.5. Antioxidant Activity
3.5.1. DPPH and CUPRAC Analysis
DPPH Analysis
CUPRAC Analysis
3.5.2. Chelating Activity of Fe2+ and Cu2+
Fe2+ Chelating Activity
Cu2+ Chelating Activity
3.5.3. Enzymatic Activity
Effect on Superoxide Dismutase Activity (SOD)
Effect on Superoxide Dismutase Activity (GR)
Effect on Glutathione Peroxidase (GPx)
Effect on Catalase Activity (CAT)
3.6. Anti-Inflammatory Activity
3.6.1. Effect on Cyclooxygenase-2 Activity (COX-2)
3.6.2. Effect on Hyaluronidase Activity
3.7. Neuroprotective Activity
3.7.1. Effect on Acetylcholinesterase (AChE) and Butyrylcholinesterase (BChE) Activity
3.7.2. Effect on Tyrosinase Activity
3.7.3. α-Glucosidase Inhibitory Assay
3.8. Principal Component Analysis (PCA)
3.9. Molecular Docking on Cholinesterse and Tyrosinase Activity
3.10. Permeability through the Blood–Brain Barrier (PAMPA-BBB)
3.11. Statistical Analysis
4. Conclusions
Supplementary Materials
Author Contributions
Funding
Institutional Review Board Statement
Informed Consent Statement
Data Availability Statement
Conflicts of Interest
References
- Burch, J.B.; Augustine, A.D.; Frieden, L.A.; Hadley, E.; Howcroft, T.K.; Johnson, R.; Khalsa, P.S.; Kohanski, R.A.; Li, X.L.; Macchiarini, F. Advances in geroscience: Impact on healthspan and chronic disease. J. Gerontol. Ser. A Biomed. Sci. Med. Sci. 2014, 69, S1–S3. [Google Scholar] [CrossRef]
- Checa, J.; Aran, J.M. Reactive oxygen species: Drivers of physiological and pathological processes. J. Inflamm. Res. 2020, 13, 1057–1073. [Google Scholar] [CrossRef]
- Armstrong, R.A. Risk factors for Alzheimer’s disease. Folia Neuropathol. 2019, 57, 87–105. [Google Scholar] [CrossRef]
- Cárdenas, A.M.; Ardiles, A.O.; Barraza, N.; Baéz-Matus, X.; Caviedes, P. Role of tau protein in neuronal damage in Alzheimer’s disease and Down syndrome. Arch. Med. Res. 2012, 43, 645–654. [Google Scholar] [CrossRef]
- Di Maio, A.; De Rosa, A.; Pelucchi, S.; Garofalo, M.; Marciano, B.; Nuzzo, T.; Gardoni, F.; Isidori, A.M.; Di Luca, M.; Errico, F. Analysis of mRNA and protein levels of CAP2, DLG1 and ADAM10 genes in post-mortem brain of schizophrenia, Parkinson’s and Alzheimer’s disease patients. Int. J. Mol. Sci. 2022, 23, 1539. [Google Scholar] [CrossRef]
- Clark, L.F.; Kodadek, T. The immune system and neuroinflammation as potential sources of blood-based biomarkers for Alzheimer’s disease, Parkinson’s disease, and Huntington’s disease. ACS Chem. Neurosci. 2016, 7, 520–527. [Google Scholar] [CrossRef]
- Chang, Y.; Kim, C.K.; Kim, M.-K.; Seo, W.; Oh, K. Insulin resistance is associated with poor functional outcome after acute ischemic stroke in non-diabetic patients. Sci. Rep. 2021, 11, 1229. [Google Scholar] [CrossRef]
- Akintola, A.A.; van Heemst, D. Insulin, aging, and the brain: Mechanisms and implications. Front. Endocrinol. 2015, 6, 13. [Google Scholar] [CrossRef]
- Frölich, L.; Blum-Degen, D.; Bernstein, H.-G.; Engelsberger, S.; Humrich, J.; Laufer, S.; Muschner, D.; Thalheimer, A.; Türk, A.; Hoyer, S. Brain insulin and insulin receptors in aging and sporadic Alzheimer’s disease. J. Neural Transm. 1998, 105, 423–438. [Google Scholar] [CrossRef]
- Yousof Ali, M.; Jung, H.A.; Choi, J.S. Anti-diabetic and anti-Alzheimer’s disease activities of Angelica decursiva. Arch. Pharm. Res. 2015, 38, 2216–2227. [Google Scholar] [CrossRef]
- Matough, F.A.; Budin, S.B.; Hamid, Z.A.; Alwahaibi, N.; Mohamed, J. The role of oxidative stress and antioxidants in diabetic complications. Sultan Qaboos Univ. Med. J. 2012, 12, 5. [Google Scholar] [CrossRef] [PubMed]
- Adenubi, O.T.; Famuyide, I.M.; McGaw, L.J.; Eloff, J.N. Lichens: An update on their ethnopharmacological uses and potential as sources of drug leads. J. Ethnopharmacol. 2022, 298, 115657. [Google Scholar] [CrossRef] [PubMed]
- Fernández-Moriano, C.; Divakar, P.K.; Crespo, A.; Gómez-Serranillos, M.P. Protective effects of lichen metabolites evernic and usnic acids against redox impairment-mediated cytotoxicity in central nervous system-like cells. Food Chem. Toxicol. 2017, 105, 262–277. [Google Scholar] [CrossRef] [PubMed]
- Kosanić, M.; Manojlović, N.; Janković, S.; Stanojković, T.; Ranković, B. Evernia prunastri and Pseudoevernia furfuraceae lichens and their major metabolites as antioxidant, antimicrobial and anticancer agents. Food Chem. Toxicol. 2013, 53, 112–118. [Google Scholar] [CrossRef] [PubMed]
- Le Pogam, P.; Schinkovitz, A.; Legouin, B.; Le Lamer, A.-C.; Boustie, J.; Richomme, P. Matrix-free UV-laser desorption ionization mass spectrometry as a versatile approach for accelerating dereplication studies on lichens. Anal. Chem. 2015, 87, 10421–10428. [Google Scholar] [CrossRef] [PubMed]
- Staples, R.; LaDuca, R.L.; Roze, L.V.; Laivenieks, M.; Linz, J.E.; Beaudry, R.; Fryday, A.; Schilmiller, A.L.; Koptina, A.V.; Smith, B. Structure and chemical analysis of major specialized metabolites produced by the lichen Evernia prunastri. Chem. Biodivers. 2020, 17, e1900465. [Google Scholar] [CrossRef] [PubMed]
- Carpenter, T.S.; Kirshner, D.A.; Lau, E.Y.; Wong, S.E.; Nilmeier, J.P.; Lightstone, F.C. A method to predict blood-brain barrier permeability of drug-like compounds using molecular dynamics simulations. Biophys. J. 2014, 107, 630–641. [Google Scholar] [CrossRef]
- Reddy, R.G.; Veeraval, L.; Maitra, S.; Chollet-Krugler, M.; Tomasi, S.; Lohezic-Le Devehat, F.; Boustie, J.; Chakravarty, S. Lichen-derived compounds show potential for central nervous system therapeutics. Phytomedicine 2016, 23, 1527–1534. [Google Scholar] [CrossRef]
- Seo, C.; Choi, Y.-H.; Ahn, J.S.; Yim, J.H.; Lee, H.K.; Oh, H. PTP1B inhibitory effects of tridepside and related metabolites isolated from the Antarctic lichen Umbilicaria antarctica. J. Enzyme Inhib. Med. Chem. 2009, 24, 1133–1137. [Google Scholar] [CrossRef]
- Aoussar, N.; Rhallabi, N.; Mhand, R.A.; Manzali, R.; Bouksaim, M.; Douira, A.; Mellouki, F. Seasonal variation of antioxidant activity and phenolic content of Pseudevernia furfuracea, Evernia prunastri and Ramalina farinacea from Morocco. J. Saudi Soc. Agric. Sci. 2020, 19, 1–6. [Google Scholar] [CrossRef]
- Studzińska-Sroka, E.; Majchrzak-Celińska, A.; Zalewski, P.; Szwajgier, D.; Baranowska-Wójcik, E.; Kaproń, B.; Plech, T.; Żarowski, M.; Cielecka-Piontek, J. Lichen-Derived Compounds and Extracts as Biologically Active Substances with Anticancer and Neuroprotective Properties. Pharmaceuticals 2021, 14, 1293. [Google Scholar] [CrossRef]
- Mitra, S.; Tareq, A.M.; Das, R.; Bin Emran, T.; Nainu, F.; Chakraborty, A.J.; Ahmad, I.; Tallei, T.E.; Idris, A.M.; Simal-Gandara, J. Polyphenols: A first evidence in the synergism and bioactivities. Food Rev. Int. 2023, 39, 4419–4441. [Google Scholar] [CrossRef]
- Collin, F. Chemical basis of reactive oxygen species reactivity and involvement in neurodegenerative diseases. Int. J. Mol. Sci. 2019, 20, 2407. [Google Scholar] [CrossRef]
- Aoussar, N.; Manzali, R.; Nattah, I.; Rhallabi, N.; Vasiljevic, P.; Bouksaim, M.; Douira, A.; Manojlovic, N.; Mellouki, F. Chemical composition and antioxidant activity of two lichens species (Pseudevernia furfuracea L. and Evernia prunastri L.) collected from Morocco. JMES 2017, 8, 1968–1976. [Google Scholar]
- Mitrović, T.; Stamenković, S.; Cvetković, V.; Tošić, S.; Stanković, M.; Radojević, I.; Stefanović, O.; Čomić, L.; Đačić, D.; Ćurčić, M. Antioxidant, antimicrobial and antiproliferative activities of five lichen species. Int. J. Mol. Sci. 2011, 12, 5428–5448. [Google Scholar] [CrossRef]
- Salim, S. Oxidative Stress and the Central Nervous System. J. Pharmacol. Exp. Ther. 2017, 360, 201–205. [Google Scholar] [CrossRef]
- Li, Q.; Liu, Y.; Dai, X.; Jiang, W.; Zhao, H. Nanozymes regulate redox homeostasis in ROS-related inflammation. Front. Chem. 2021, 9, 740607. [Google Scholar] [CrossRef]
- Singh, D. Astrocytic and microglial cells as the modulators of neuroinflammation in Alzheimer’s disease. J. Neuroinflamm. 2022, 19, 206. [Google Scholar] [CrossRef]
- Thakur, S.; Dhapola, R.; Sarma, P.; Medhi, B.; Reddy, D.H. Neuroinflammation in Alzheimer’s disease: Current progress in molecular signaling and therapeutics. Inflammation 2023, 46, 1–17. [Google Scholar] [CrossRef]
- Shcherbakova, A.; Strömstedt, A.A.; Göransson, U.; Gnezdilov, O.; Turanov, A.; Boldbaatar, D.; Kochkin, D.; Ulrich-Merzenich, G.; Koptina, A. Antimicrobial and antioxidant activity of Evernia prunastri extracts and their isolates. World J. Microbiol. Biotechnol. 2021, 37, 129. [Google Scholar] [CrossRef]
- Studzińska-Sroka, E.; Piotrowska, H.; Kucińska, M.; Murias, M.; Bylka, W. Cytotoxic activity of physodic acid and acetone extract from Hypogymnia physodes against breast cancer cell lines. Pharm. Biol. 2016, 54, 2480–2485. [Google Scholar] [CrossRef] [PubMed]
- Studzinska-Sroka, E.; Galanty, A.; Bylka, W. Atranorin-an interesting lichen secondary metabolite. Mini Rev. Med. Chem. 2017, 17, 1633–1645. [Google Scholar] [CrossRef] [PubMed]
- Molina-Holgado, F.; Hider, R.C.; Gaeta, A.; Williams, R.; Francis, P. Metals ions and neurodegeneration. Biometals 2007, 20, 639–654. [Google Scholar] [CrossRef] [PubMed]
- Yoo, J.; Han, J.; Lim, M.H. Transition metal ions and neurotransmitters: Coordination chemistry and implications for neurodegeneration. RSC Chem. Biol. 2023, 4, 548–563. [Google Scholar] [CrossRef]
- Ejaz, H.W.; Wang, W.; Lang, M. Copper Toxicity Links to Pathogenesis of Alzheimer’s Disease and Therapeutics Approaches. Int. J. Mol. Sci. 2020, 21, 7660. [Google Scholar] [CrossRef]
- Faller, P.; Hureau, C.; Berthoumieu, O. Role of metal ions in the self-assembly of the Alzheimer’s amyloid-β peptide. Inorg. Chem. 2013, 52, 12193–12206. [Google Scholar] [CrossRef]
- Sharma, A.K.; Pavlova, S.T.; Kim, J.; Finkelstein, D.; Hawco, N.J.; Rath, N.P.; Kim, J.; Mirica, L.M. Bifunctional compounds for controlling metal-mediated aggregation of the aβ42 peptide. J. Am. Chem. Soc. 2012, 134, 6625–6636. [Google Scholar] [CrossRef]
- Nikseresht, S.; Bush, A.I.; Ayton, S. Treating Alzheimer’s disease by targeting iron. Br. J. Pharmacol. 2019, 176, 3622–3635. [Google Scholar] [CrossRef]
- Mucha, P.; Skoczyńska, A.; Małecka, M.; Hikisz, P.; Budzisz, E. Overview of the antioxidant and anti-inflammatory activities of selected plant compounds and their metal ions complexes. Molecules 2021, 26, 4886. [Google Scholar] [CrossRef]
- Hauck, M.; Huneck, S. Lichen substances affect metal adsorption in Hypogymnia physodes. J. Chem. Ecol. 2007, 33, 219–223. [Google Scholar] [CrossRef]
- Khadhri, A.; Mendili, M.; Araújo, M.E.M.; Seaward, M.R.D. Comparative study of secondary metabolites and bioactive properties of the lichen Cladonia foliacea with and without the lichenicolous fungus Heterocephalacria bachmannii. Symbiosis 2019, 79, 25–31. [Google Scholar] [CrossRef]
- Mendili, M.; Bannour, M.; Araújo, M.E.M.; Seaward, M.R.D.; Khadhri, A. Lichenochemical screening and antioxidant capacity of four Tunisian lichen species. Chem. Biodivers. 2021, 18, e2000735. [Google Scholar] [CrossRef] [PubMed]
- Teleanu, D.M.; Niculescu, A.-G.; Lungu, I.I.; Radu, C.I.; Vladâcenco, O.; Roza, E.; Costăchescu, B.; Grumezescu, A.M.; Teleanu, R.I. An overview of oxidative stress, neuroinflammation, and neurodegenerative diseases. Int. J. Mol. Sci. 2022, 23, 5938. [Google Scholar] [CrossRef] [PubMed]
- Pei, J.; Pan, X.; Wei, G.; Hua, Y. Research progress of glutathione peroxidase family (GPX) in redoxidation. Front. Pharmacol. 2023, 14, 1147414. [Google Scholar] [CrossRef]
- Couto, N.; Wood, J.; Barber, J. The role of glutathione reductase and related enzymes on cellular redox homoeostasis network. Free Radic. Biol. Med. 2016, 95, 27–42. [Google Scholar] [CrossRef] [PubMed]
- Erfani, S.; Valadbeigi, T.; Aboutaleb, N.; Karimi, N.; Moghimi, A.; Khaksari, M. Usnic acid improves memory impairment after cerebral ischemia/reperfusion injuries by anti-neuroinflammatory, anti-oxidant, and anti-apoptotic properties. Iran. J. Basic Med. Sci. 2020, 23, 1225. [Google Scholar] [PubMed]
- Kotan, E.; Alpsoy, L.; Anar, M.; Aslan, A.; Agar, G. Protective role of methanol extract of Cetraria islandica (L.) against oxidative stress and genotoxic effects of AFB1 in human lymphocytes in vitro. Toxicol. Ind. Health 2011, 27, 599–605. [Google Scholar] [CrossRef]
- Ahmadi, M.; Bekeschus, S.; Weltmann, K.-D.; von Woedtke, T.; Wende, K. Non-steroidal anti-inflammatory drugs: Recent advances in the use of synthetic COX-2 inhibitors. RSC Med. Chem. 2022, 13, 471–496. [Google Scholar] [CrossRef]
- López, D.E.; Ballaz, S.J. The role of brain cyclooxygenase-2 (Cox-2) beyond neuroinflammation: Neuronal homeostasis in memory and anxiety. Mol. Neurobiol. 2020, 57, 5167–5176. [Google Scholar] [CrossRef]
- Guan, P.-P.; Wang, P. Integrated communications between cyclooxygenase-2 and Alzheimer’s disease. FASEB J. 2019, 33, 13–33. [Google Scholar] [CrossRef]
- Prabhakaran, J.; Molotkov, A.; Mintz, A.; Mann, J.J. Progress in PET imaging of neuroinflammation targeting COX-2 enzyme. Molecules 2021, 26, 3208. [Google Scholar] [CrossRef] [PubMed]
- Vlad, S.C.; Miller, D.R.; Kowall, N.W.; Felson, D.T. Protective effects of NSAIDs on the development of Alzheimer disease. Neurology 2008, 70, 1672–1677. [Google Scholar] [CrossRef] [PubMed]
- Paździora, W.; Podolak, I.; Grudzińska, M.; Paśko, P.; Grabowska, K.; Galanty, A. Critical Assessment of the Anti-Inflammatory Potential of Usnic Acid and Its Derivatives—A Review. Life 2023, 13, 1046. [Google Scholar] [CrossRef] [PubMed]
- Papierska, K.; Krajka-Kuźniak, V.; Paluszczak, J.; Kleszcz, R.; Skalski, M.; Studzińska-Sroka, E.; Baer-Dubowska, W. Lichen-Derived Depsides and Depsidones Modulate the Nrf2, NF-κB and STAT3 Signaling Pathways in Colorectal Cancer Cells. Molecules 2021, 26, 4787. [Google Scholar] [CrossRef] [PubMed]
- Joshi, T.; Sharma, P.; Joshi, T.; Chandra, S. In silico screening of anti-inflammatory compounds from Lichen by targeting cyclooxygenase-2. J. Biomol. Struct. Dyn. 2020, 38, 3544–3562. [Google Scholar] [CrossRef] [PubMed]
- Studzińska-Sroka, E.; Dubino, A. Lichens as a source of chemical compounds with anti-inflammatory activity. Herba Pol. 2018, 64, 56–64. [Google Scholar] [CrossRef]
- Studzińska-Sroka, E.; Majchrzak-Celińska, A.; Zalewski, P.; Szwajgier, D.; Baranowska-Wójcik, E.; Żarowski, M.; Plech, T.; Cielecka-Piontek, J. Permeability of Hypogymnia physodes Extract Component—Physodic Acid through the Blood–Brain Barrier as an Important Argument for Its Anticancer and Neuroprotective Activity within the Central Nervous System. Cancers 2021, 13, 1717. [Google Scholar] [CrossRef]
- Gao, Y.; Sun, Y.; Yang, H.; Qiu, P.; Cong, Z.; Zou, Y.; Song, L.; Guo, J.; Anastassiades, T.P. A low molecular weight hyaluronic acid derivative accelerates excisional wound healing by modulating pro-inflammation, promoting epithelialization and neovascularization, and remodeling collagen. Int. J. Mol. Sci. 2019, 20, 3722. [Google Scholar] [CrossRef]
- Li, F.; Ducker, M.; Sun, B.; Szele, F.G.; Czernuszka, J.T. Interpenetrating polymer networks of collagen, hyaluronic acid, and chondroitin sulfate as scaffolds for brain tissue engineering. Acta Biomater. 2020, 112, 122–135. [Google Scholar] [CrossRef]
- Girish, K.S.; Kemparaju, K.; Nagaraju, S.; Vishwanath, B.S. Hyaluronidase inhibitors: A biological and therapeutic perspective. Curr. Med. Chem. 2009, 16, 2261–2288. [Google Scholar] [CrossRef]
- Gębalski, J.; Graczyk, F.; Załuski, D. Paving the way towards effective plant-based inhibitors of hyaluronidase and tyrosinase: A critical review on a structure–activity relationship. J. Enzyme Inhib. Med. Chem. 2022, 37, 1120–1195. [Google Scholar] [CrossRef] [PubMed]
- Galanty, A.; Zagrodzki, P.; Gdula-Argasińska, J.; Grabowska, K.; Koczurkiewicz-Adamczyk, P.; Wróbel-Biedrawa, D.; Podolak, I.; Pękala, E.; Paśko, P. A Comparative Survey of Anti-Melanoma and Anti-Inflammatory Potential of Usnic Acid Enantiomers—A Comprehensive In Vitro Approach. Pharmaceuticals 2021, 14, 945. [Google Scholar] [CrossRef] [PubMed]
- Anand, P.; Singh, B. A review on cholinesterase inhibitors for Alzheimer’s disease. Arch. Pharm. Res. 2013, 36, 375–399. [Google Scholar] [CrossRef] [PubMed]
- Sacks, D.; Baxter, B.; Campbell, B.C.V.; Carpenter, J.S.; Cognard, C.; Dippel, D.; Eesa, M.; Fischer, U.; Hausegger, K.; Hirsch, J.A.; et al. Multisociety Consensus Quality Improvement Revised Consensus Statement for Endovascular Therapy of Acute Ischemic Stroke. Int. J. Stroke Off. J. Int. Stroke Soc. 2018, 13, 612–632. [Google Scholar] [CrossRef] [PubMed]
- Sharma, K. Cholinesterase inhibitors as Alzheimer’s therapeutics (Review). Mol. Med. Rep. 2019, 20, 1479–1487. [Google Scholar] [CrossRef]
- Xing, S.; Li, Q.; Xiong, B.; Chen, Y.; Feng, F.; Liu, W.; Sun, H. Structure and therapeutic uses of butyrylcholinesterase: Application in detoxification, Alzheimer’s disease, and fat metabolism. Med. Res. Rev. 2021, 41, 858–901. [Google Scholar] [CrossRef]
- Guillozet, A.L.; Mesulam, M.; Smiley, J.F.; Mash, D.C. Butyrylcholinesterase in the life cycle of amyloid plaques. Ann. Neurol. Off. J. Am. Neurol. Assoc. Child Neurol. Soc. 1997, 42, 909–918. [Google Scholar] [CrossRef]
- Cetin Cakmak, K.; Gülçin, İ. Anticholinergic and antioxidant activities of usnic acid-an activity-structure insight. Toxicol. Rep. 2019, 6, 1273–1280. [Google Scholar] [CrossRef]
- Nagar, S.; Pigott, M.; Kukula-Koch, W.; Sheridan, H. Unravelling Novel Phytochemicals and Anticholinesterase Activity in Irish Cladonia portentosa. Molecules 2023, 28, 4145. [Google Scholar] [CrossRef]
- Studzińska-Sroka, E.; Majchrzak-Celińska, A.; Bańdurska, M.; Rosiak, N.; Szwajgier, D.; Baranowska-Wójcik, E.; Szymański, M.; Gruszka, W.; Cielecka-Piontek, J. Is Caperatic Acid the Only Compound Responsible for Activity of Lichen Platismatia glauca within the Nervous System? Antioxidants 2022, 11, 2069. [Google Scholar] [CrossRef]
- Chen, J.; Yu, X.; Huang, Y. Inhibitory mechanisms of glabridin on tyrosinase. Spectrochim. Acta Part A Mol. Biomol. Spectrosc. 2016, 168, 111–117. [Google Scholar] [CrossRef] [PubMed]
- Peng, Z.; Wang, G.; He, Y.; Wang, J.J.; Zhao, Y. Tyrosinase inhibitory mechanism and anti-browning properties of novel kojic acid derivatives bearing aromatic aldehyde moiety. Curr. Res. Food Sci. 2023, 6, 100421. [Google Scholar] [CrossRef] [PubMed]
- Lai, X.; Wichers, H.J.; Soler-Lopez, M.; Dijkstra, B.W. Structure and Function of Human Tyrosinase and Tyrosinase-Related Proteins. Chemistry 2018, 24, 47–55. [Google Scholar] [CrossRef] [PubMed]
- Carballo-Carbajal, I.; Laguna, A.; Romero-Giménez, J.; Cuadros, T.; Bové, J.; Martinez-Vicente, M.; Parent, A.; Gonzalez-Sepulveda, M.; Peñuelas, N.; Torra, A.; et al. Brain tyrosinase overexpression implicates age-dependent neuromelanin production in Parkinson’s disease pathogenesis. Nat. Commun. 2019, 10, 973. [Google Scholar] [CrossRef] [PubMed]
- Martins-Gomes, C.; Coutinho, T.E.; Silva, T.L.; Andreani, T.; Silva, A.M. Neurotoxicity Assessment of Four Different Pesticides Using In Vitro Enzymatic Inhibition Assays. Toxics 2022, 10, 448. [Google Scholar] [CrossRef] [PubMed]
- Searle, T.; Ali, F.R.; Al-Niaimi, F. The versatility of azelaic acid in dermatology. J. Dermatolog. Treat. 2022, 33, 722–732. [Google Scholar] [CrossRef] [PubMed]
- Behera, B.C.; Adawadkar, B.; Makhija, U. Tyrosinase-inhibitory activity in some species of the lichen family Graphidaceae. J. Herb. Pharmacother. 2006, 6, 55–69. [Google Scholar] [CrossRef]
- Verma, N.; Behera, B.C.; Sonone, A.; Makhija, U. Lipid peroxidation and tyrosinase inhibition by lichen symbionts grown in vitro. African J. Biochem. Res. 2008, 2, 225–231. [Google Scholar]
- Brandão, L.F.G.; da Silva Santos, N.P.; Pereira, E.C.G.; da Silva, N.H.; de Fatima Cepa Matos, M.; Bogo, D.; Honda, N.K. Effects of fumarprotocetraric acid, a depsidone from the lichen Cladonia verticillaris, on tyrosinase activity. Orbital Electron. J. Chem. 2017, 9, 256–260. [Google Scholar] [CrossRef]
- Patil, S.M.; Martiz, R.M.; Satish, A.M.; Shbeer, A.M.; Ageel, M.; Al-Ghorbani, M.; Ranganatha, L.; Parameswaran, S.; Ramu, R. Discovery of novel coumarin derivatives as potential dual inhibitors against α-glucosidase and α-amylase for the management of post-prandial hyperglycemia via molecular modelling approaches. Molecules 2022, 27, 3888. [Google Scholar] [CrossRef]
- Sonia, T.A.; Sharma, C.P. Oral Delivery of Insulin; Elsevier: Amsterdam, The Netherlands, 2014; ISBN 1908818689. [Google Scholar]
- Madhusudhanan, J.; Suresh, G.; Devanathan, V. Neurodegeneration in type 2 diabetes: Alzheimer’s as a case study. Brain Behav. 2020, 10, e01577. [Google Scholar] [CrossRef] [PubMed]
- Lv, Y.-Q.; Yuan, L.; Sun, Y.; Dou, H.-W.; Su, J.-H.; Hou, Z.-P.; Li, J.-Y.; Li, W. Long-term hyperglycemia aggravates α-synuclein aggregation and dopaminergic neuronal loss in a Parkinson’s disease mouse model. Transl. Neurodegener. 2022, 11, 14. [Google Scholar] [CrossRef]
- El Hayek, M.S.; Ernande, L.; Benitah, J.-P.; Gomez, A.-M.; Pereira, L. The role of hyperglycaemia in the development of diabetic cardiomyopathy. Arch. Cardiovasc. Dis. 2021, 114, 748–760. [Google Scholar] [CrossRef] [PubMed]
- Chowdhury, T.A.; Jacob, P. Challenges in the management of people with diabetes and cancer. Diabet. Med. 2019, 36, 795–802. [Google Scholar] [CrossRef] [PubMed]
- Malone, J.I. Diabetic central neuropathy: CNS damage related to hyperglycemia. Diabetes 2016, 65, 355–357. [Google Scholar] [CrossRef] [PubMed]
- Pishdad, R.; Pishdad, P.; Pishdad, G.R. Acarbose versus repaglinide in diabetes treatment: A new appraisal of two old rivals. Am. J. Med. Sci. 2020, 359, 212–217. [Google Scholar] [CrossRef] [PubMed]
- Do, T.-H.; Duong, T.-H.; Nguyen, H.T.; Nguyen, T.-H.; Sichaem, J.; Nguyen, C.H.; Nguyen, H.-H.; Long, N.P. Biological activities of lichen-derived monoaromatic compounds. Molecules 2022, 27, 2871. [Google Scholar] [CrossRef]
- Maulidiyah, M.; Darmawan, A.; Wahyu, W.; Musdalifah, A.; La, O.A.S.; Nurdin, M. Potential of usnic acid compound from lichen genus Usnea sp. as antidiabetic agents. J. Oleo Sci. 2022, 71, 127–134. [Google Scholar] [CrossRef]
- Duong, T.-H.; Devi, A.P.; Huynh, N.-V.; Sichaem, J.; Tran, H.-D.; Alam, M.; Nguyen, T.-P.; Nguyen, H.-H.; Chavasiri, W.; Nguyen, T.-C. Synthesis, α-glucosidase inhibition, and molecular docking studies of novel N-substituted hydrazide derivatives of atranorin as antidiabetic agents. Bioorg. Med. Chem. Lett. 2020, 30, 127359. [Google Scholar] [CrossRef]
- Karunaratne, V.; Thadhani, V.M.; Khan, S.N.; Choudhary, M.I. Potent α-glucosidase inhibitors from the lichen Cladonia species from Sri Lanka. J. Natl. Sci. Found. Sri Lanka 2014, 42, 95–98. [Google Scholar] [CrossRef]
- Kurita, T. Principal component analysis (PCA). In Computer Vision, A Reference Guide; Springer: Cham, Switzerland, 2019; pp. 1–4. [Google Scholar]
- Allee, K.D.; Do, C.; Raymundo, F.G. Principal component analysis and factor analysis in accounting research. J. Financ. Report. 2022, 7, 1–39. [Google Scholar] [CrossRef]
- Abdel-Salam, O.M.E.; Sleem, A.A.; Youness, E.R.; Mohammed, N.A.; Omara, E.A.; Shabana, M.E. Neuroprotective effects of the glutathione precursor N-acetylcysteine against rotenone-induced neurodegeneration. React. Oxyg. Species 2019, 8, 231–244. [Google Scholar] [CrossRef]
- Zhang, R.; Xue, B.; Tao, Y.; Zhao, H.; Zhang, Z.; Wang, X.; Zhou, X.; Jiang, B.; Yang, Z.; Yan, X. Edge-site engineering of defective Fe–N4 nanozymes with boosted catalase-like performance for retinal vasculopathies. Adv. Mater. 2022, 34, 2205324. [Google Scholar] [CrossRef] [PubMed]
- Cava, C.; Castiglioni, I. Integration of molecular docking and in vitro studies: A powerful approach for drug discovery in breast cancer. Appl. Sci. 2020, 10, 6981. [Google Scholar] [CrossRef]
- Bugni, T.S.; Andjelic, C.D.; Pole, A.R.; Rai, P.; Ireland, C.M.; Barrows, L.R. Biologically active components of a Papua New Guinea analgesic and anti-inflammatory lichen preparation. Fitoterapia 2009, 80, 270–273. [Google Scholar] [CrossRef]
- Xie, J.; Shen, Z.; Anraku, Y.; Kataoka, K.; Chen, X. Nanomaterial-based blood-brain-barrier (BBB) crossing strategies. Biomaterials 2019, 224, 119491. [Google Scholar] [CrossRef]
- Majchrzak-Celińska, A.; Kleszcz, R.; Studzińska-Sroka, E.; Łukaszyk, A.; Szoszkiewicz, A.; Stelcer, E.; Jopek, K.; Rucinski, M.; Cielecka-Piontek, J.; Krajka-Kuźniak, V. Lichen Secondary Metabolites Inhibit the Wnt/β-Catenin Pathway in Glioblastoma Cells and Improve the Anticancer Effects of Temozolomide. Cells 2022, 11, 1084. [Google Scholar] [CrossRef]
- Studzińska-Sroka, E.; Galanty, A.; Gościniak, A.; Wieczorek, M.; Kłaput, M.; Dudek-Makuch, M.; Cielecka-Piontek, J. Herbal Infusions as a Valuable Functional Food. Nutrients 2021, 13, 4051. [Google Scholar] [CrossRef]
- Santos, J.S.; Brizola, V.R.A.; Granato, D. High-throughput assay comparison and standardization for metal chelating capacity screening: A proposal and application. Food Chem. 2017, 214, 515–522. [Google Scholar] [CrossRef]
- Watanabe, M.; de Moura Neiva, L.B.; da Costa Santos, C.X.; Laurindo, F.R.M.; de Fátima Fernandes Vattimo, M. Isoflavone and the heme oxygenase system in ischemic acute kidney injury in rats. Food Chem. Toxicol. 2007, 45, 2366–2371. [Google Scholar] [CrossRef]
- Baranowska-Wójcik, E.; Szwajgier, D.; Winiarska-Mieczan, A. Regardless of the brewing conditions, various types of tea are a source of acetylcholinesterase inhibitors. Nutrients 2020, 12, 709. [Google Scholar] [CrossRef]
- Protein Data Bank (PDB). Available online: https://www.rcsb.org/ (accessed on 12 November 2022).
- PubChem. Available online: https://pubchem.ncbi.nlm.nih.gov (accessed on 12 November 2022).
- Morris, G.M.; Huey, R.; Lindstrom, W.; Sanner, M.F.; Belew, R.K.; Goodsell, D.S.; Olson, A.J. AutoDock4 and AutoDockTools4: Automated docking with selective receptor flexibility. J. Comput. Chem. 2009, 30, 2785–2791. [Google Scholar] [CrossRef] [PubMed]
- Eberhardt, J.; Santos-Martins, D.; Tillack, A.F.; Forli, S. AutoDock Vina 1.2. 0: New docking methods, expanded force field, and python bindings. J. Chem. Inf. Model. 2021, 61, 3891–3898. [Google Scholar] [CrossRef] [PubMed]
- Trott, O.; Olson, A.J. AutoDock Vina: Improving the speed and accuracy of docking with a new scoring function, efficient optimization, and multithreading. J. Comput. Chem. 2010, 31, 455–461. [Google Scholar] [CrossRef] [PubMed]
- Adasme, M.F.; Linnemann, K.L.; Bolz, S.N.; Kaiser, F.; Salentin, S.; Haupt, V.J.; Schroeder, M. PLIP 2021: Expanding the scope of the protein–ligand interaction profiler to DNA and RNA. Nucleic Acids Res. 2021, 49, W530–W534. [Google Scholar] [CrossRef] [PubMed]
- 0The PyMOL Molecular Graphics System, Version 2.0; Schrödinger, LLC.: New York, NY, USA, 2015.
- Jakubec, D.; Skoda, P.; Krivak, R.; Novotny, M.; Hoksza, D. PrankWeb 3: Accelerated ligand-binding site predictions for experimental and modelled protein structures. Nucleic Acids Res. 2022, 50, W593–W597. [Google Scholar] [CrossRef] [PubMed]
- Krivák, R.; Hoksza, D. P2Rank: Machine learning based tool for rapid and accurate prediction of ligand binding sites from protein structure. J. Cheminform. 2018, 10, 1–12. [Google Scholar] [CrossRef] [PubMed]
- Jendele, L.; Krivak, R.; Skoda, P.; Novotny, M.; Hoksza, D. PrankWeb: A web server for ligand binding site prediction and visualization. Nucleic Acids Res. 2019, 47, W345–W349. [Google Scholar] [CrossRef]
- Chen, X.; Murawski, A.; Patel, K.; Crespi, C.L.; Balimane, P. V A novel design of artificial membrane for improving the PAMPA model. Pharm. Res. 2008, 25, 1511–1520. [Google Scholar] [CrossRef]
- Latacz, G.; Lubelska, A.; Jastrzębska-Więsek, M.; Partyka, A.; Marć, M.A.; Satała, G.; Wilczyńska, D.; Kotańska, M.; Więcek, M.; Kamińska, K. The 1, 3, 5-triazine derivatives as innovative chemical family of 5-HT6 serotonin receptor agents with therapeutic perspectives for cognitive impairment. Int. J. Mol. Sci. 2019, 20, 3420. [Google Scholar] [CrossRef]


| Content [%] | Hex | DCM | Ace | MeOH | MeOH-H2O | H2O |
|---|---|---|---|---|---|---|
| Evernic acid | 1.81 ± 0.01 | 63.13 ± 0.31 | 55.22 ± 1.24 | 58.32 ± 0.20 | 23.95 ±0.06 | 0.11 ± 0.01 |
| Atranorin | 61.04 ± 3.45 | 44.46 ± 0.63 | 37.70 ± 1.14 | 19.72 ± 0.16 | 0.65 ± 0.05 | 0.53 ± 0.03 |
| Usnic acid | 5.25 ± 0.11 | 1.66 ± 0.03 | 1.52 ± 0.05 | 1.02 ± 0.02 | 1.07 ± 0,08 | 0.06 ± 0.01 |
| Extracts/ Substance | DPPH IC50 (mg/mL) | CUPRAC IC0.5 (mg/mL) |
|---|---|---|
| Hex | >28.00 | 0.16 ± 0.00 |
| DCM | >28.00 | 0.47 ± 0.02 |
| Ace | 24.31 ± 0.62 | 0.47 ± 0.03 |
| MeOH | 9.37 ± 0.61 | 0.69 ± 0.02 |
| MeOH-H2O | 6.83 ± 0.55 | 1.03 ± 0.03 |
| H2O | 4.83 ± 1.97 | 0.61 ± 0.05 |
| Vitamin C | 0.074 ± 0.001 | 0.058 ± 0.001 |
| Tested Sample | Chelating Fe2+ [%] | ||
|---|---|---|---|
| Concentration [mg/mL] | |||
| 0.5 | 1.5 | 2.5 | |
| Hex | 8.15 ± 2.36 | 36.79 ± 1.19 | 75.82 ± 2.45 |
| DCM | na | 13.31 ± 3.36 | 19.91 ± 4.95 |
| Ace | 10.94 ± 1.33 | 14.93 ± 3.65 | 24.20 ± 2.06 |
| MeOH | 12.03 ± 3.15 | 44.77 ± 3.12 | 57.30 ± 6.05 |
| MeOH-H2O | 85.12 ± 5.14 | 95.57 ± 1.30 | 97.21 ± 0.24 |
| H2O | 67.02 ± 0.97 | 92.13 ± 2.17 | 98.45 ± 0.49 |
| Quercetin | 44.05 ± 2.66 | 58.95 ± 0.85 | 79.47 ± 3.14 |
| Tested Sample | Chelating Cu2+ [%] | ||||
|---|---|---|---|---|---|
| Concentration [mg/mL] | |||||
| 0.1 | 0.5 | 1.5 | 2.5 | 5 | |
| Hex | 10.96 ± 2.35 | 59.16 ± 1.17 | 90.06 ± 1.91 | 95.17± 4.16 | 87.70± 6.22 |
| DCM | 5.69 ± 0.92 | 35.02 ± 0.60 | 59.44 ± 3.09 | 74.89 ± 1.91 | 89.56 ± 2.20 |
| Ace | 10.12 ± 3.74 | 41.73 ± 6.09 | 61.70 ± 9.56 | 77.22 ± 7.33 | 88.78 ± 3.67 |
| MeOH | 6.95 ± 2.68 | 31.99 ± 3.50 | 66.46 ± 7.33 | 84.15 ± 4.75 | 94.48 ± 1.24 |
| MeOH-H2O | 1.86 ± 1.53 | 18.39 ± 1.90 | 43.84 ± 1.08 | 62.24 ± 1.81 | 82.81 ± 1.32 |
| H2O | 3.09 ± 2.69 | 32.38 ± 3.60 | 68.43 ± 3.80 | 82.44 ± 1.92 | 91.63 ± 1.48 |
| Quercetin | 53.16 ± 2.24 | 97.57 ± 0.98 | nt | nt | nt |
| Tested Sample | SOD Inhibition (%) | GR Inhibition (%) | GR Inhibition (nmol NADPH/ min Incubation) | GPx Inhibition (%) | GPx Inhibition (nmol NADPH/ min Incubation) | CAT Inhibition (%) | CAT Inhibition of the H2O2 Depletion (mmol/mL min Reaction) |
|---|---|---|---|---|---|---|---|
| Hex | 37.4 ± 2.6 | 14.9 ± 5.1 | 559 ± 191 | 40.0 ± 5.6 | 79.6 ± 11.1 | 13.5 ± 3.9 | 0.03 ± 0.01 |
| DCM | 35.6 ± 1.6 | 22.4 ± 4.2 | 840 ± 158 | 29.7 ± 4.3 | 59.1 ± 8.6 | 74.0 ± 3.5 | 0.36 ± 0.02 |
| Ace | 35.0 ± 1.0 | 24.2 ± 3.2 | 907 ± 120 | 16.4 ± 3.2 | 32.6 ± 6.4 | na | na |
| MeOH | 50.1 ± 2.3 | 36.3 ± 2.9 | 1374 ± 110 | 54.0 ± 2.6 | 107.5 ± 5.2 | na | na |
| MeOH -H2O | 48.0 ± 2.7 | 37.2 ± 3.0 | 1396 ± 113 | 26.7 ± 3.4 | 53.1 ± 6.8 | 18.6 ± 4.0 | 0.07 ± 0.02 |
| H2O | 38.9 ± 3.6 | 26.9 ± 4.6 | 1011 ± 173 | 39.2 ± 2.4 | 78.0 ± 4.8 | 18.3 ± 4.5 | 0.07 ± 0.02 |
| EA | 34.1 ± 1.7 | 10.3 ± 3.7 | 388 ± 139 | 10.0 ± 2.6 | 19.9 ± 5.2 | na | na |
| Tested Sample | α-Glucosidase Inhibition [%] | |||
|---|---|---|---|---|
| 1 mg/mL | 3 mg/mL | 5 mg/mL | ||
| Hex | 14.23 ± 2.13 | 80.69 ± 5.94 | 94.18 ± 3.75 | |
| DCM | 5.74 ± 2.50 | 17.55 ± 0.83 | 98.33 ± 2.00 | |
| Ace | 3.64 ± 0.56 | 15.64 ± 2.07 | 97.13 ± 2.51 | |
| MeOH | 0.13 ± 0.11 | 11.35 ± 3.29 | 84.03 ± 5.78 | |
| MeOH-H2O | na | 2.63 ± 1.25 | 4.66 ± 0.43 | |
| H2O | na | na | 3.19 ± 1.86 | |
| EA | nt | nt | 95.00 ± 6.06 | |
| ATR | nt | nt | 19.14 ± 8.50 | |
| Acarbose | 10 mg/mL | 50 mg/mL | ||
| 1.59 ± 8.12 | 85.23 ± 8.12 | |||
| Evernic Acid | Atranorin | |
|---|---|---|
| COX-2 |  |  |
| AChE |  |  |
| BChE |  |  |
| α-Glucosidase |  | na |
| Tested Sample | Pe × 10−6 [cm/s] (t = 4 h) | Tested Sample | Pe × 10−6 [cm/s] (t = 4 h) |
|---|---|---|---|
| Evernic acid (from Hex) | 2.63 ± 1.50 | Atranorin (from Hex) | 3.07 ± 0.13 |
| Evernic acid (from DCM) | 3.16 ± 0.94 | Atranorin (from DCM) | 1.95 ± 0.06 |
| Evernic acid (from Ace) | 2.20 ± 0.73 | Atranorin (from Ace) | 2.85 ± 0.14 |
| Evernic acid (from MeOH) | 4.92 ± 0.34 | Atranorin (from MeOH) | 3.40 ± 0.13 |
| Evernic acid (from MeOH-H2O) | 0.74 ± 0.18 | Atranorin (from MeOH-H2O) | nd |
| Evernic acid (from H2O) | nd | Atranorin (from H2O) | nd |
| Evernic acid | 8.6 ± 0.4 * | Atranorin | 2.2 ± 0.1 ** |
| PDB Code | Coordinates of Grid Box | Size of Grid Box (Å) | Maximum Radius Limit (Å) | |
|---|---|---|---|---|
| COX-2 | 5F1A | x = 30.725 y = 35.102 z = 242.610 | x = 52 y = 62 z = 60 | 0.375 |
| Human AChE | 4BDT | x = −1.18 y = −36.63 z = −51.58 | x = 40 y = 40 z = 40 | 0.375 |
| Human BChE | 4BDS | x = 136.26 y = 115.98 z = 42.30 | x = 40 y = 40 z = 40 | 0.375 |
| Tyrosinase | 2Y9X | x = −8.064 y = −25.776 z = −39.384 | x = 60 y = 60 z = 60 | 0.375 |
| α-glucosidase | 2QMJ | x = −20.83 y = −6.56 z = −5.04 | x = 40 y = 40 z = 40 | 0.375 |
Disclaimer/Publisher’s Note: The statements, opinions and data contained in all publications are solely those of the individual author(s) and contributor(s) and not of MDPI and/or the editor(s). MDPI and/or the editor(s) disclaim responsibility for any injury to people or property resulting from any ideas, methods, instructions or products referred to in the content. |
© 2023 by the authors. Licensee MDPI, Basel, Switzerland. This article is an open access article distributed under the terms and conditions of the Creative Commons Attribution (CC BY) license (https://creativecommons.org/licenses/by/4.0/).
Share and Cite
Studzińska-Sroka, E.; Bulicz, M.; Henkel, M.; Rosiak, N.; Paczkowska-Walendowska, M.; Szwajgier, D.; Baranowska-Wójcik, E.; Korybalska, K.; Cielecka-Piontek, J. Pleiotropic Potential of Evernia prunastri Extracts and Their Main Compounds Evernic Acid and Atranorin: In Vitro and In Silico Studies. Molecules 2024, 29, 233. https://doi.org/10.3390/molecules29010233
Studzińska-Sroka E, Bulicz M, Henkel M, Rosiak N, Paczkowska-Walendowska M, Szwajgier D, Baranowska-Wójcik E, Korybalska K, Cielecka-Piontek J. Pleiotropic Potential of Evernia prunastri Extracts and Their Main Compounds Evernic Acid and Atranorin: In Vitro and In Silico Studies. Molecules. 2024; 29(1):233. https://doi.org/10.3390/molecules29010233
Chicago/Turabian StyleStudzińska-Sroka, Elżbieta, Magdalena Bulicz, Marika Henkel, Natalia Rosiak, Magdalena Paczkowska-Walendowska, Dominik Szwajgier, Ewa Baranowska-Wójcik, Katarzyna Korybalska, and Judyta Cielecka-Piontek. 2024. "Pleiotropic Potential of Evernia prunastri Extracts and Their Main Compounds Evernic Acid and Atranorin: In Vitro and In Silico Studies" Molecules 29, no. 1: 233. https://doi.org/10.3390/molecules29010233