


UPLC-MS Analysis, Quantification of Compounds, and Comparison of Bioactivity of Methanol Extract and Its Fractions from Qiai (Artemisia argyi Lévl. et Van.)

Abstract
:
1. Introduction
2. Results and Discussion
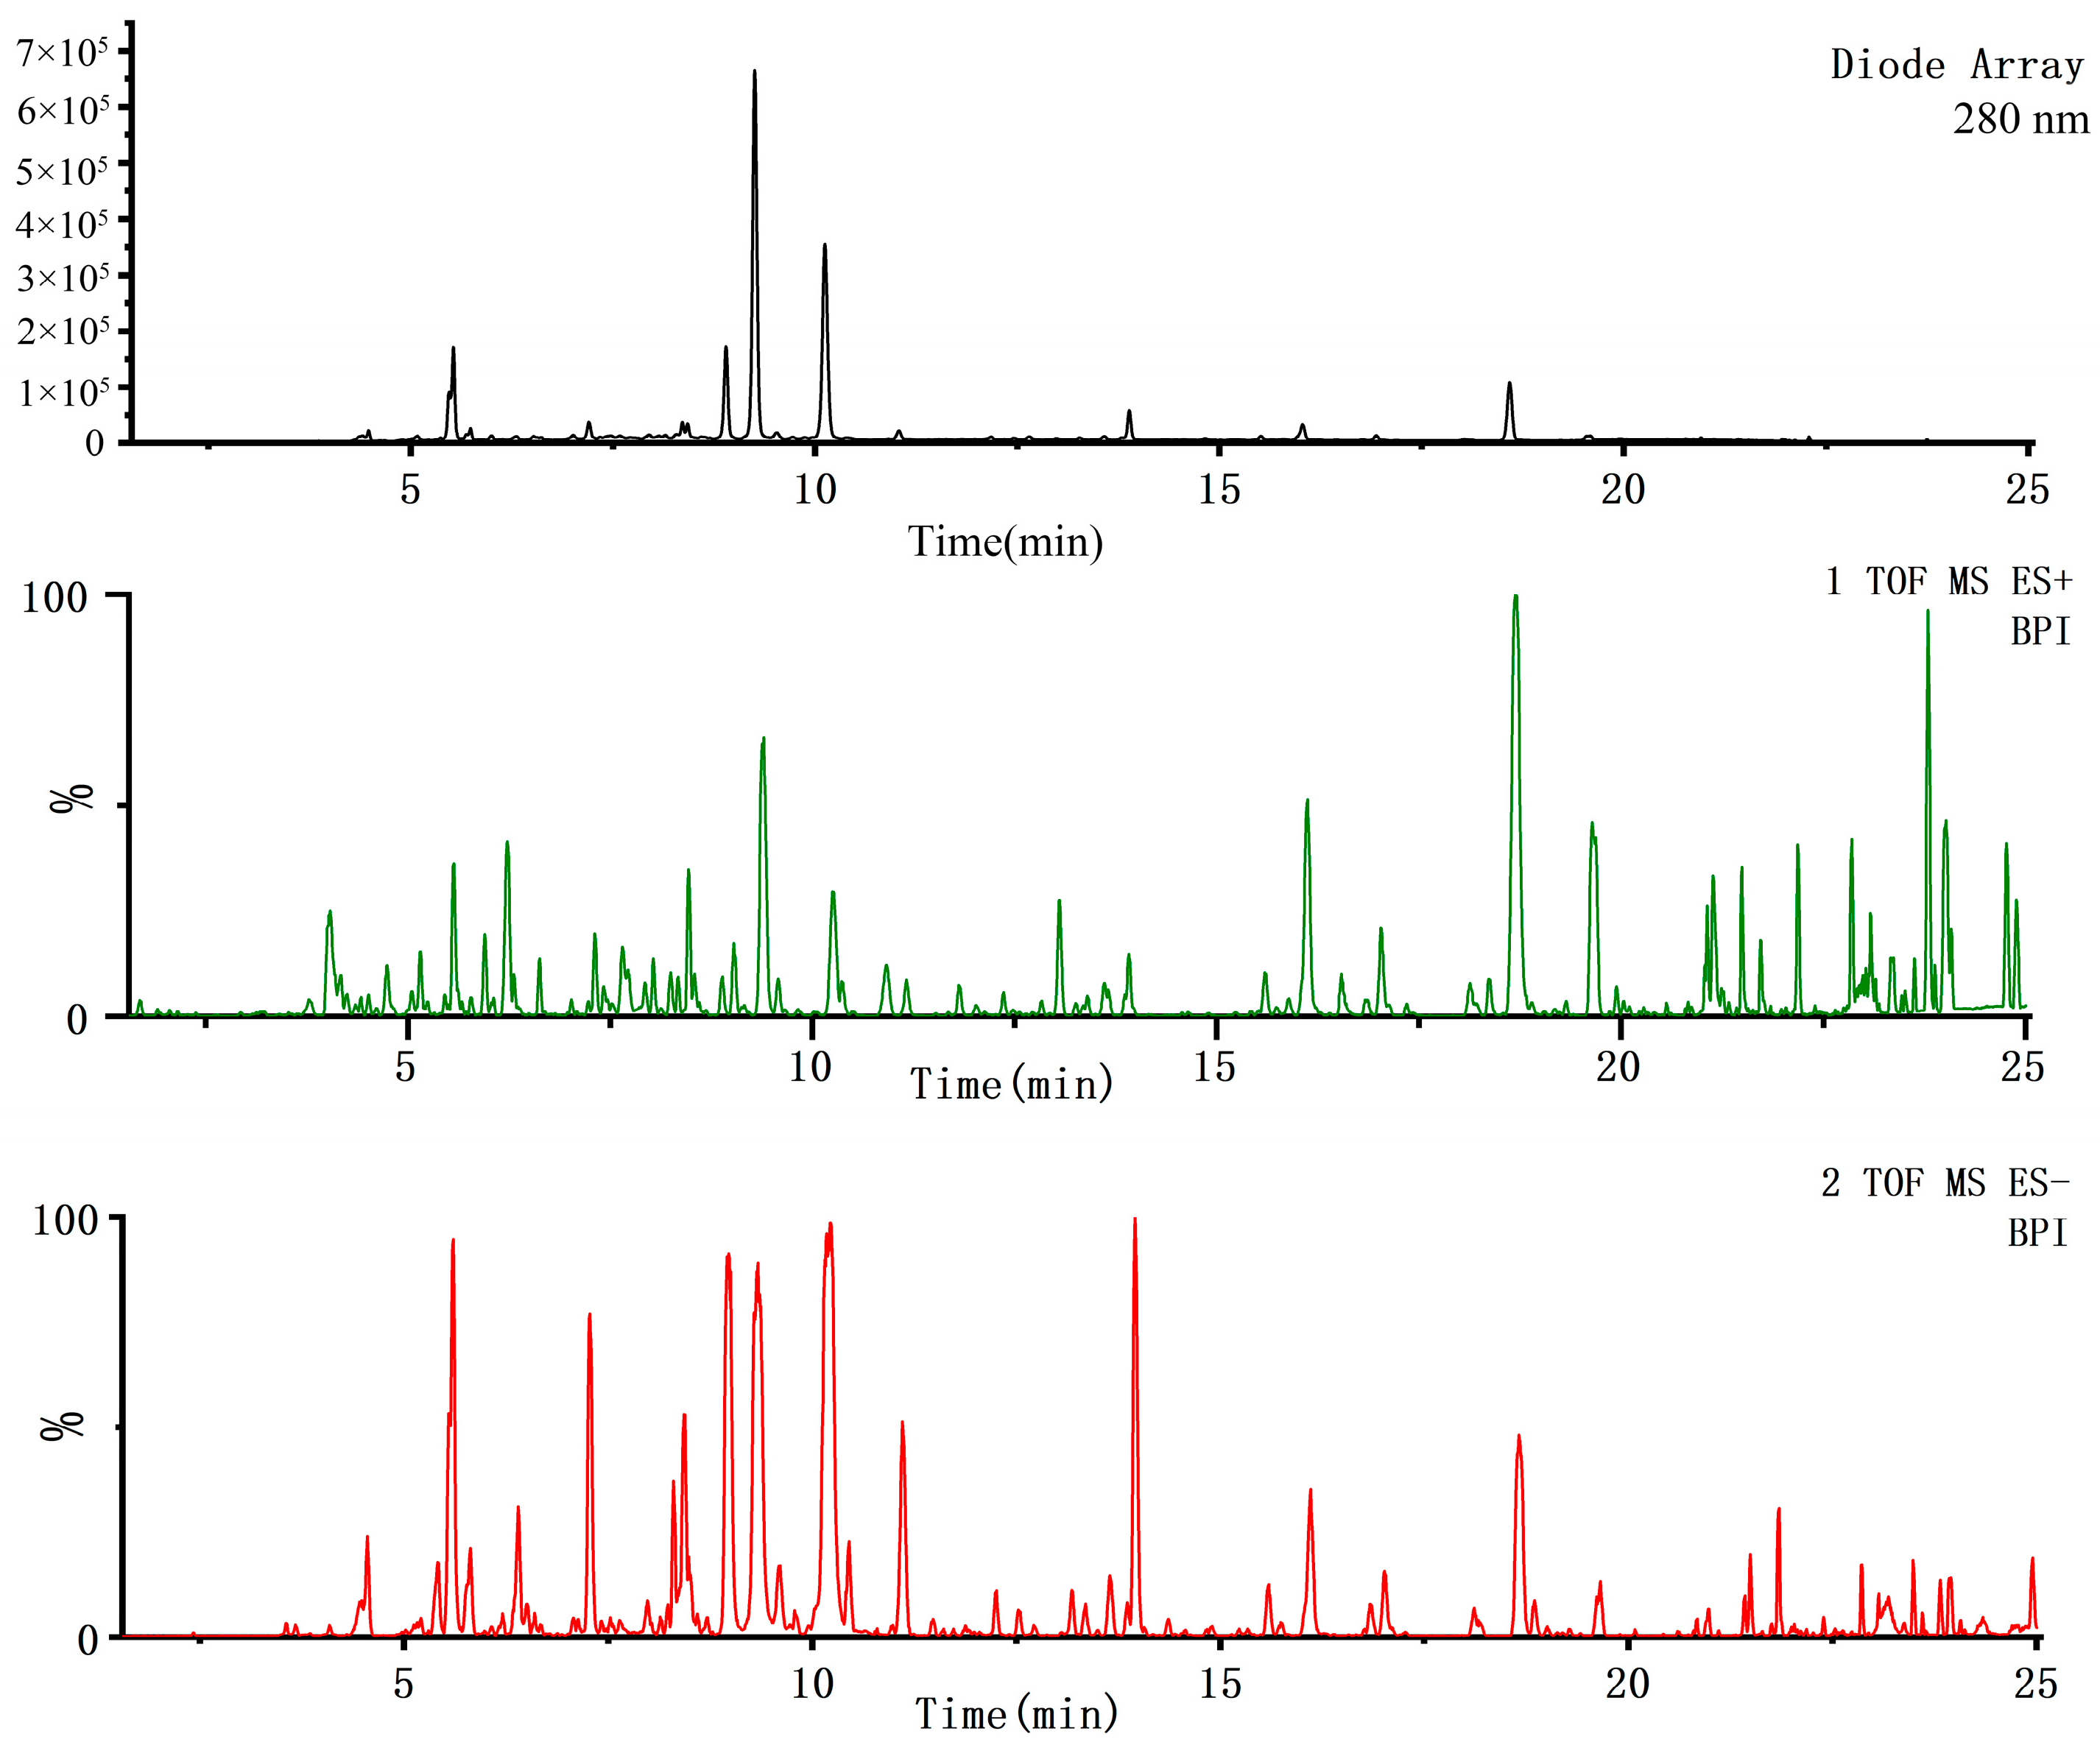
2.1. Identification of QA Extract by UPLC-Q-TOF/MS
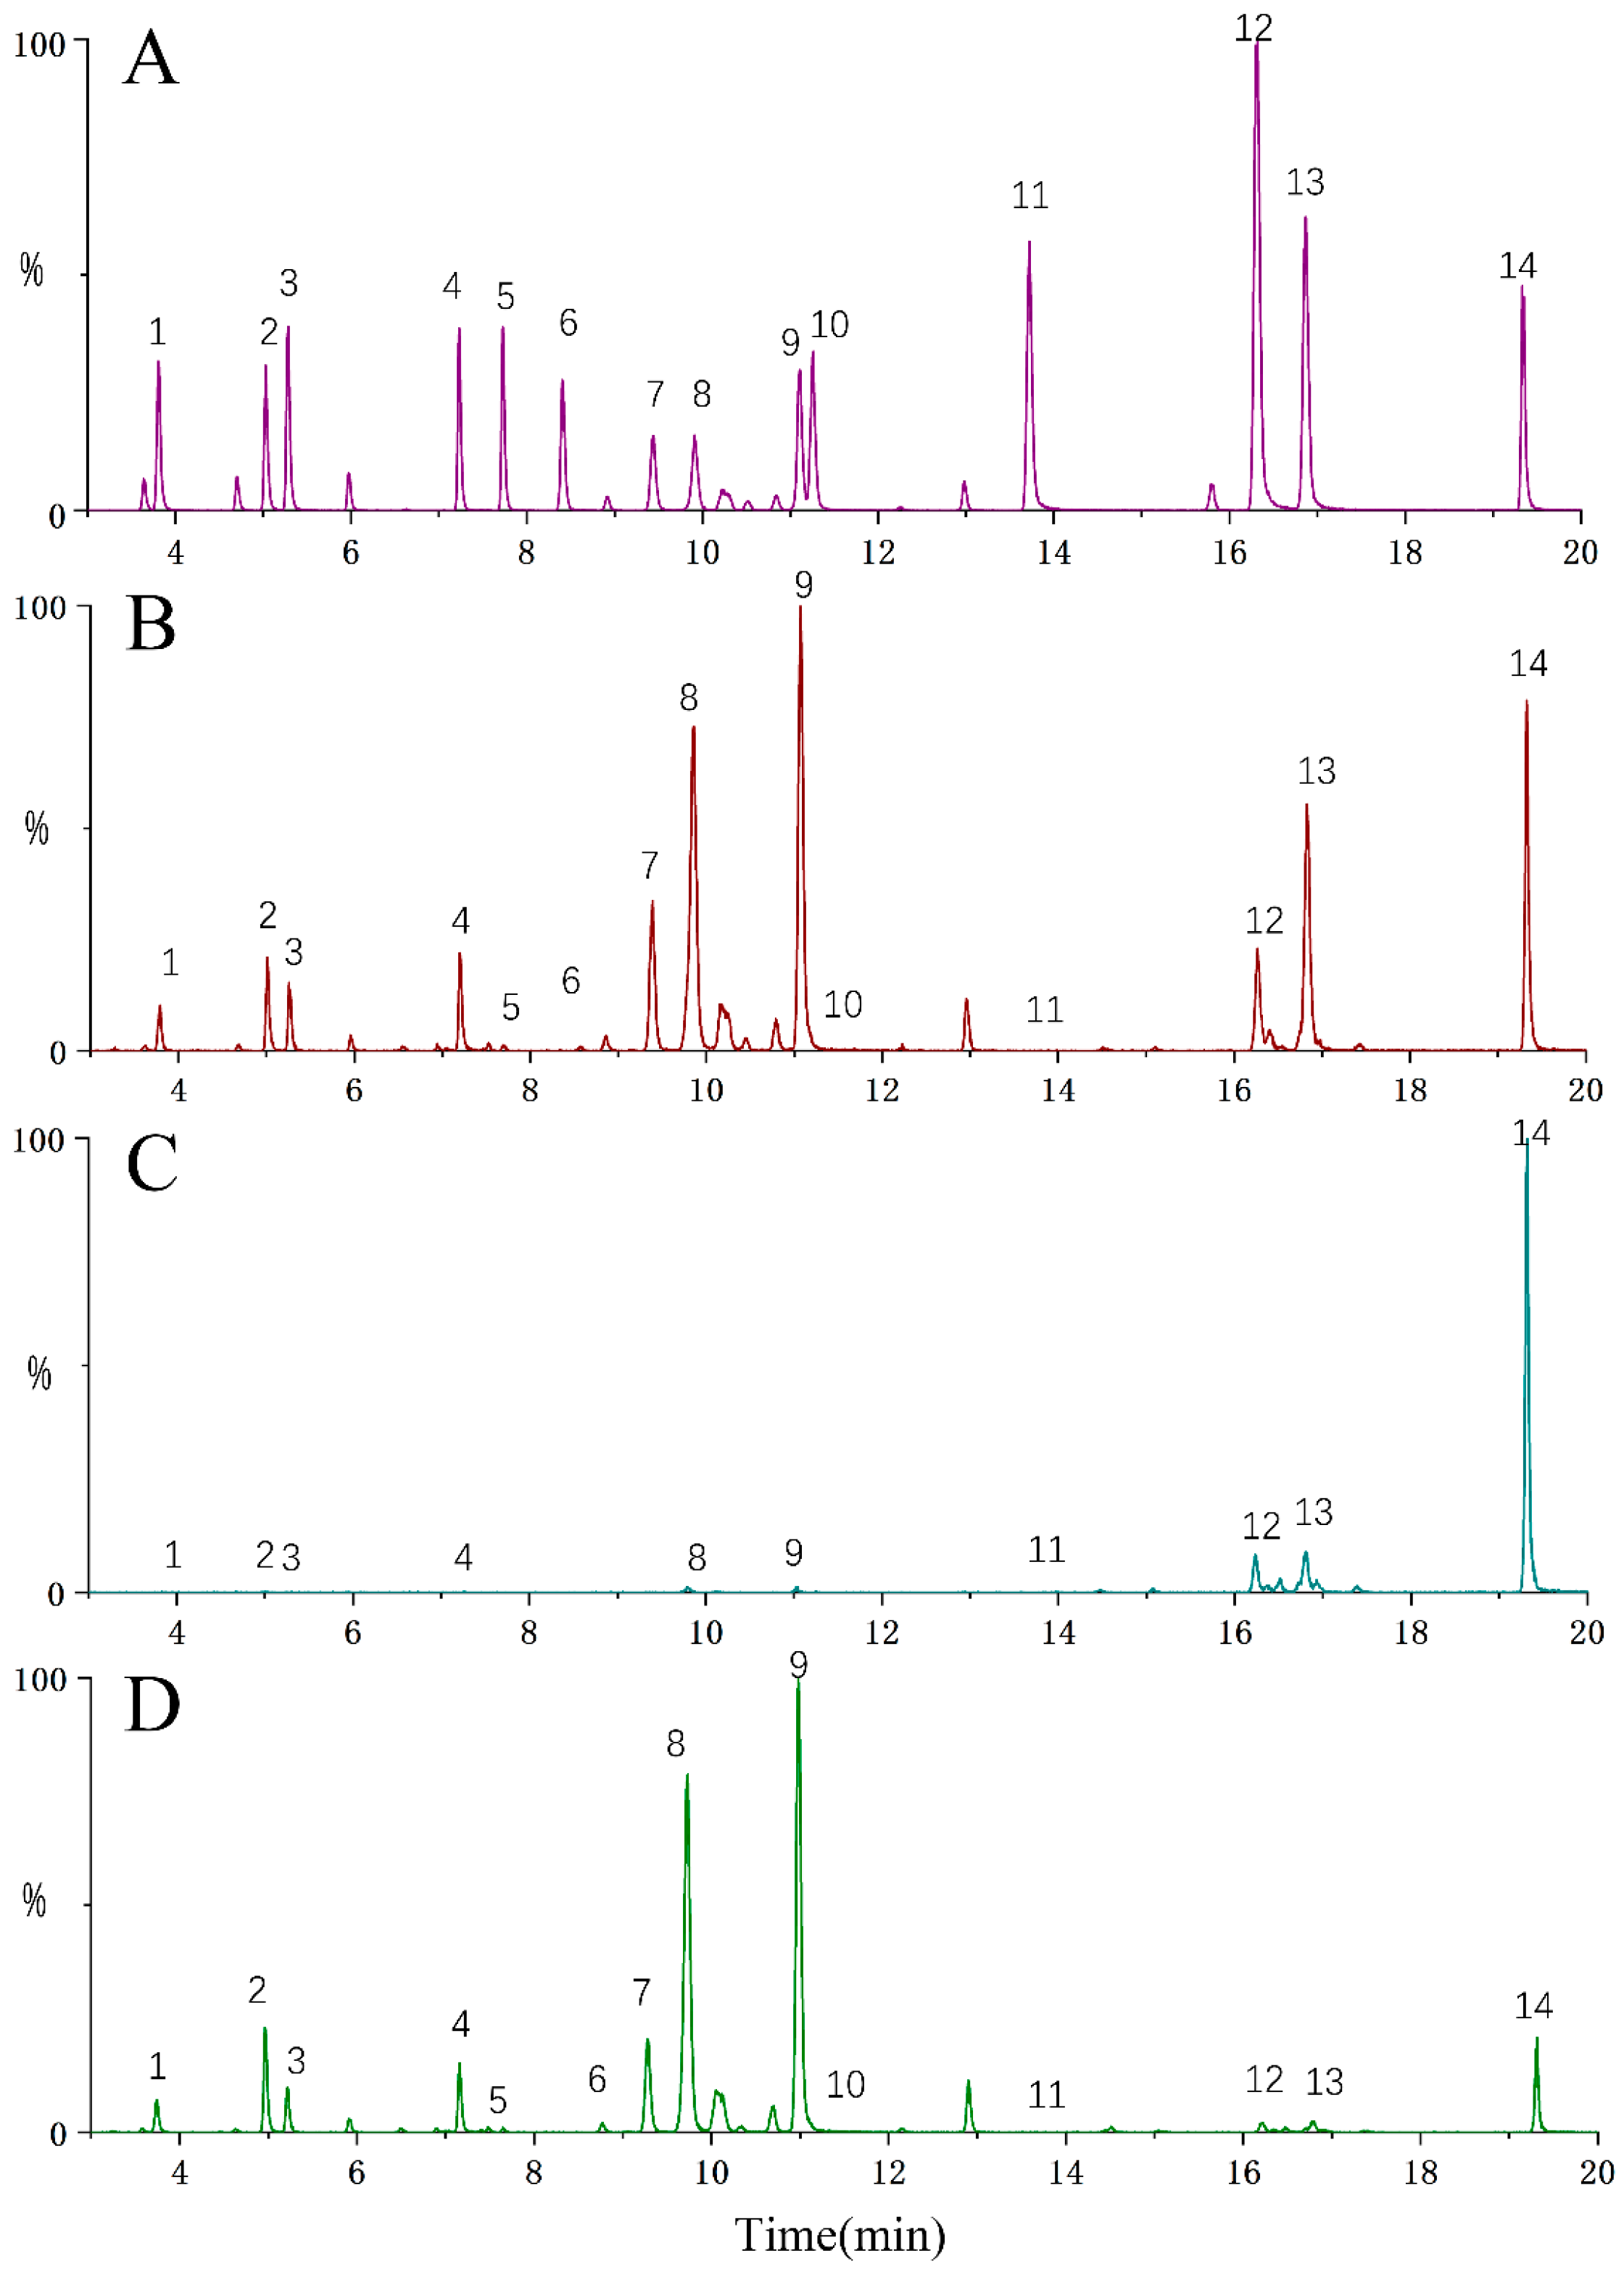
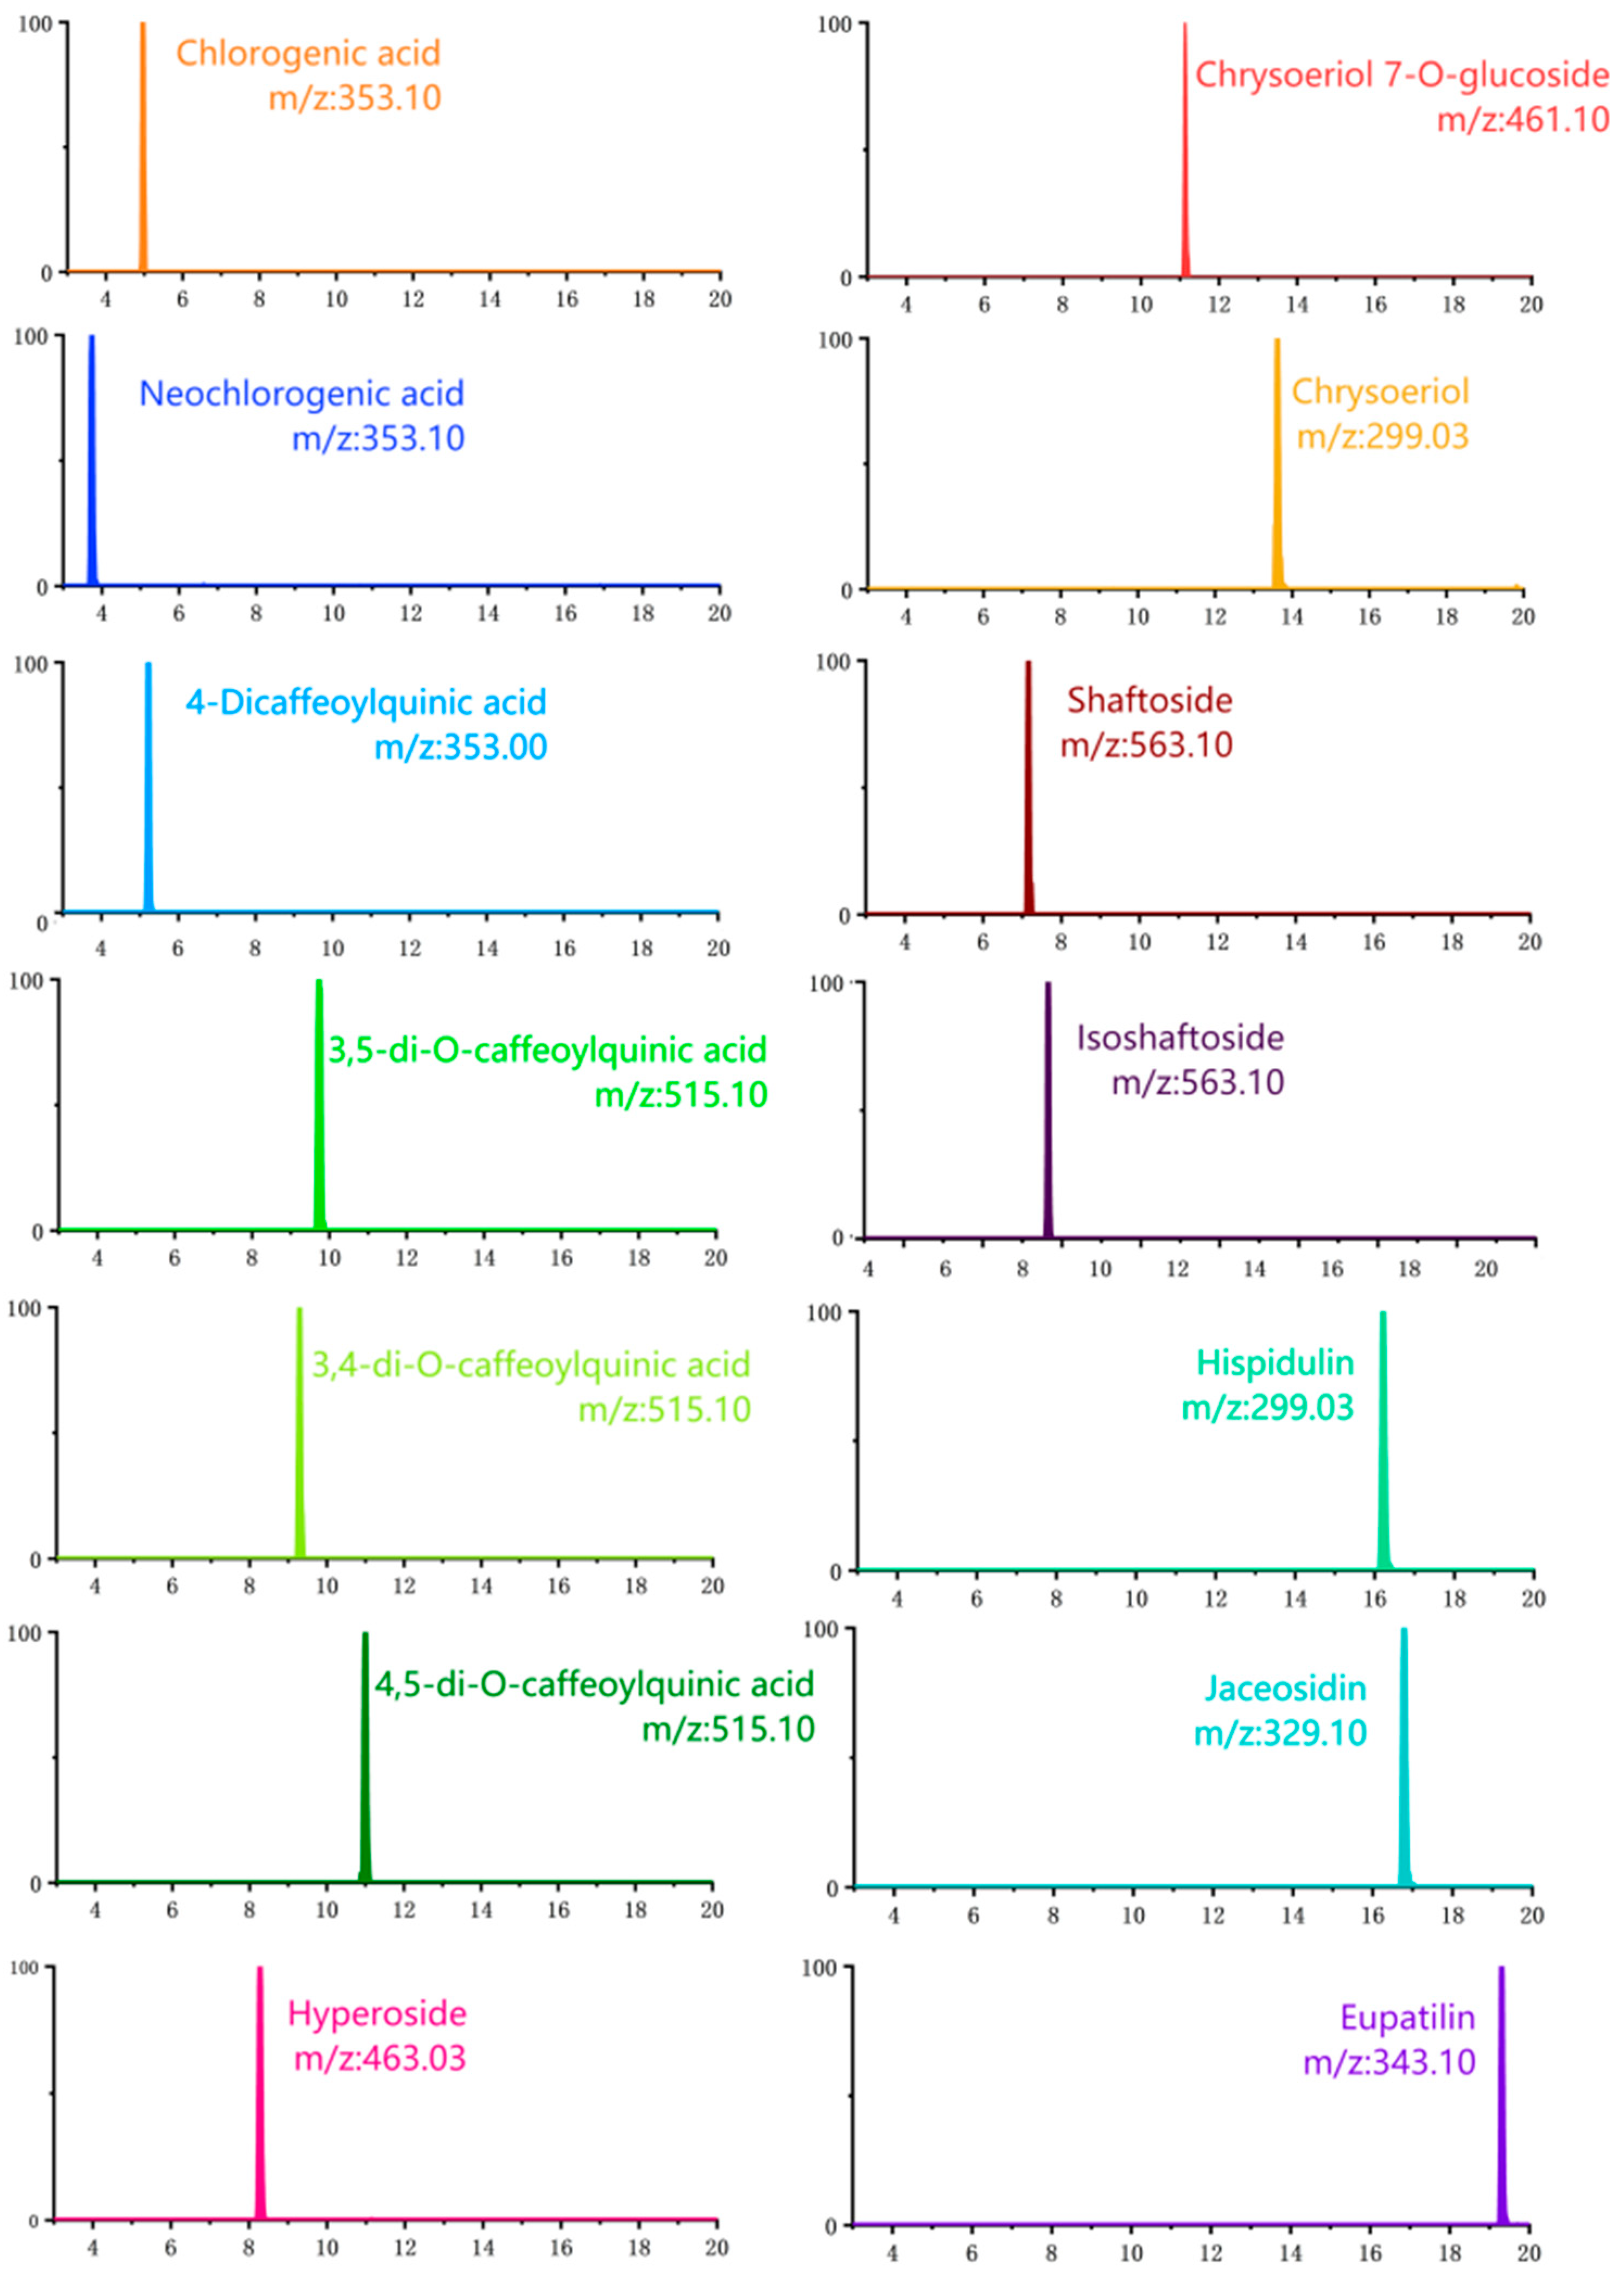
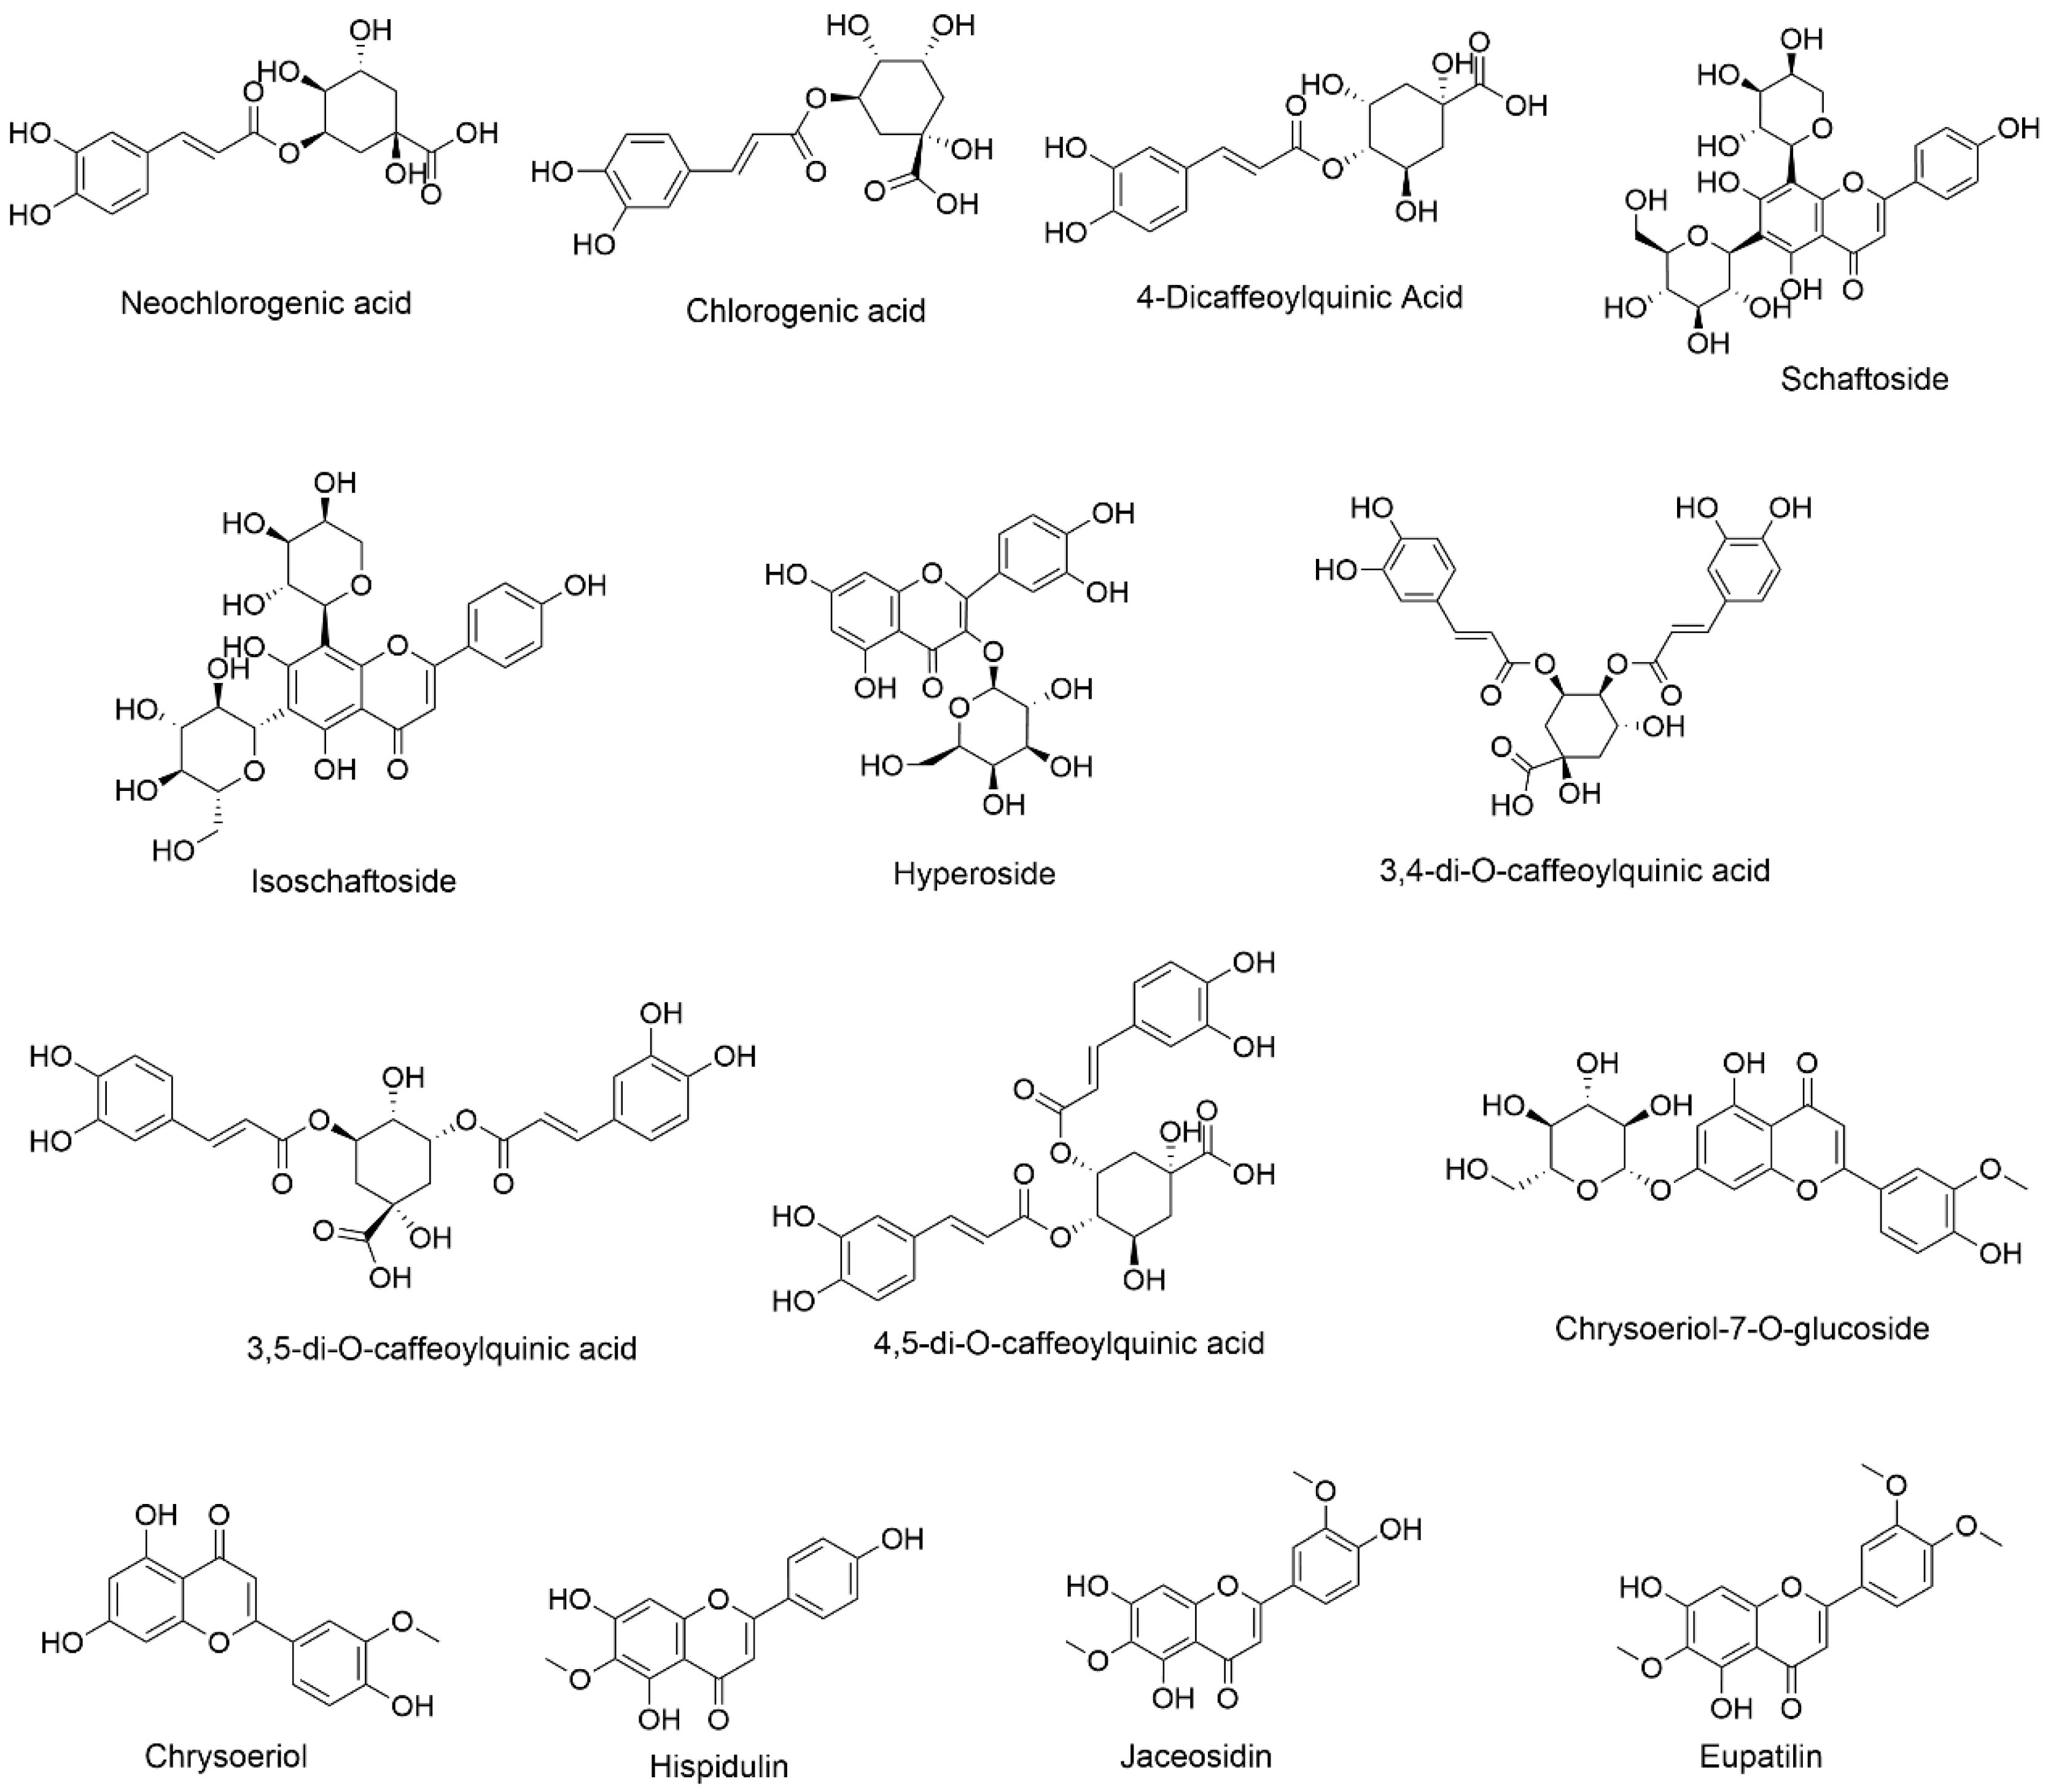
2.2. Quantitative Analyses of Fourteen Compounds
2.2.1. Method Validation
2.2.2. Quantitative Analysis
2.3. Evaluation of Antioxidant Potential
2.4. Inhibition of the NO Release Capacity
2.5. Antibacterial Activities
3. Materials and Methods
3.1. Chemicals
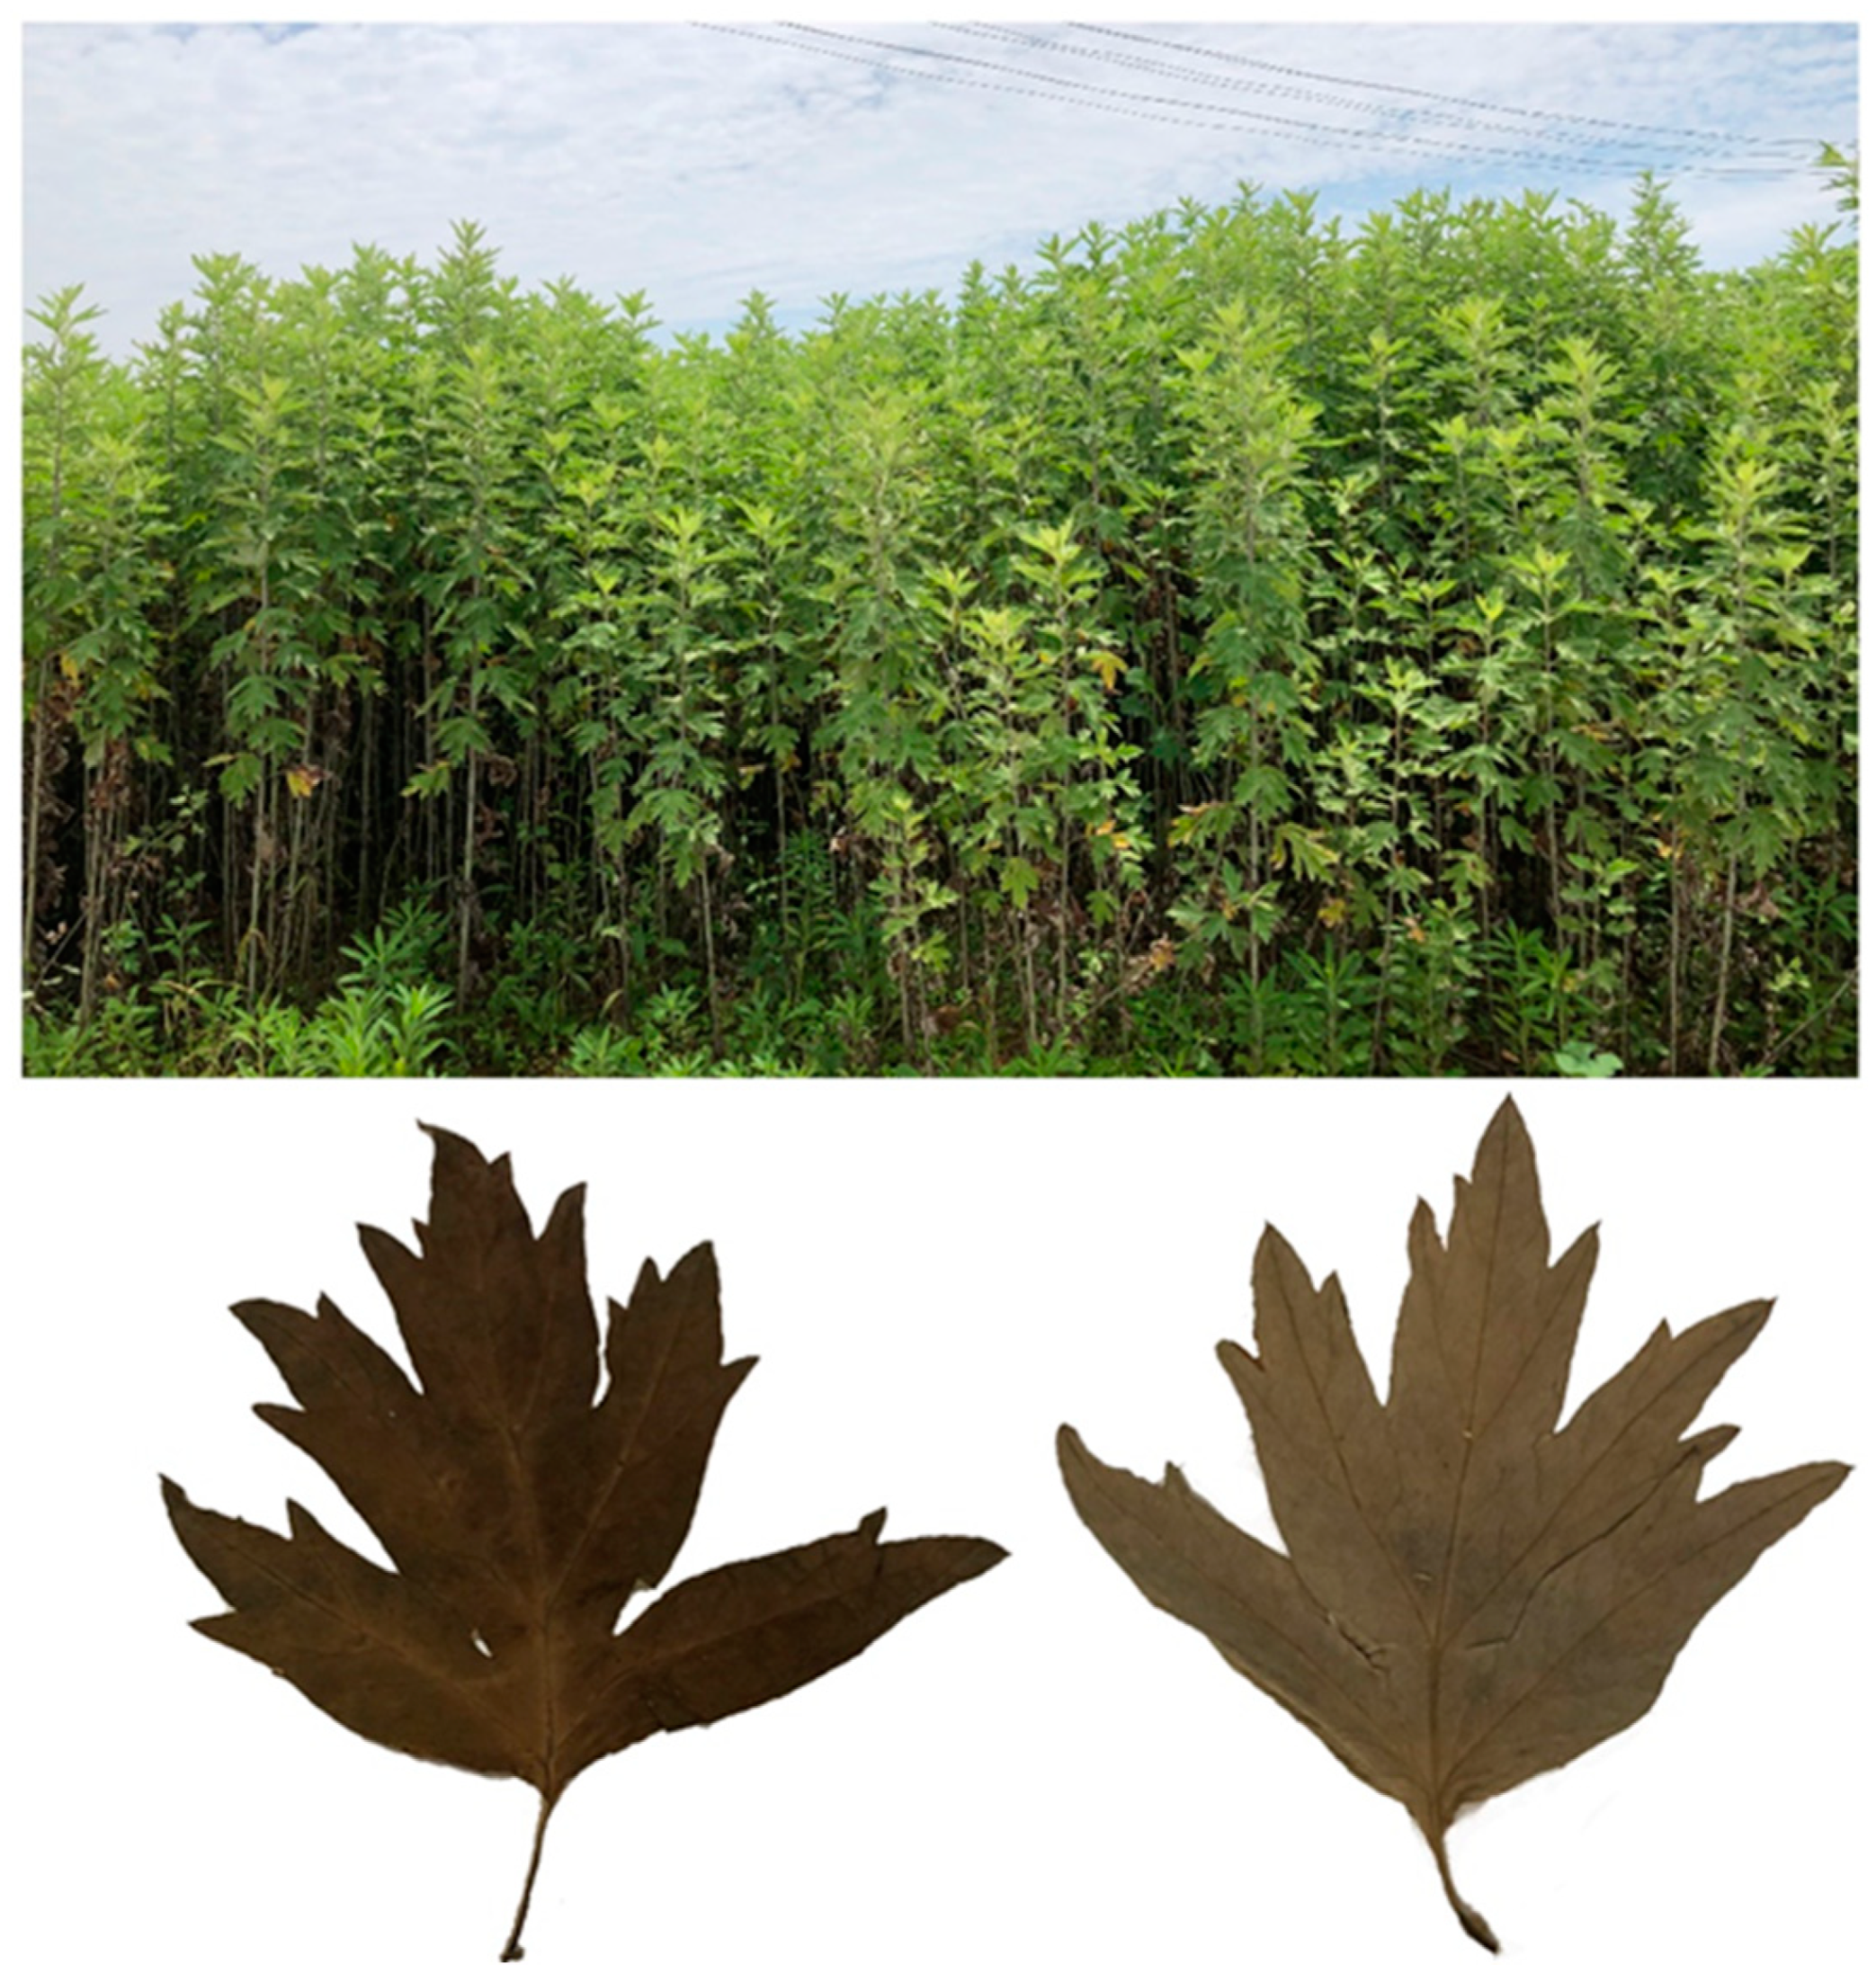
3.2. Plant Material
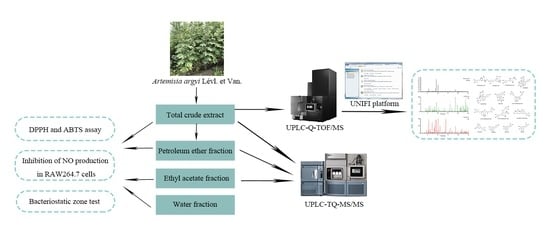
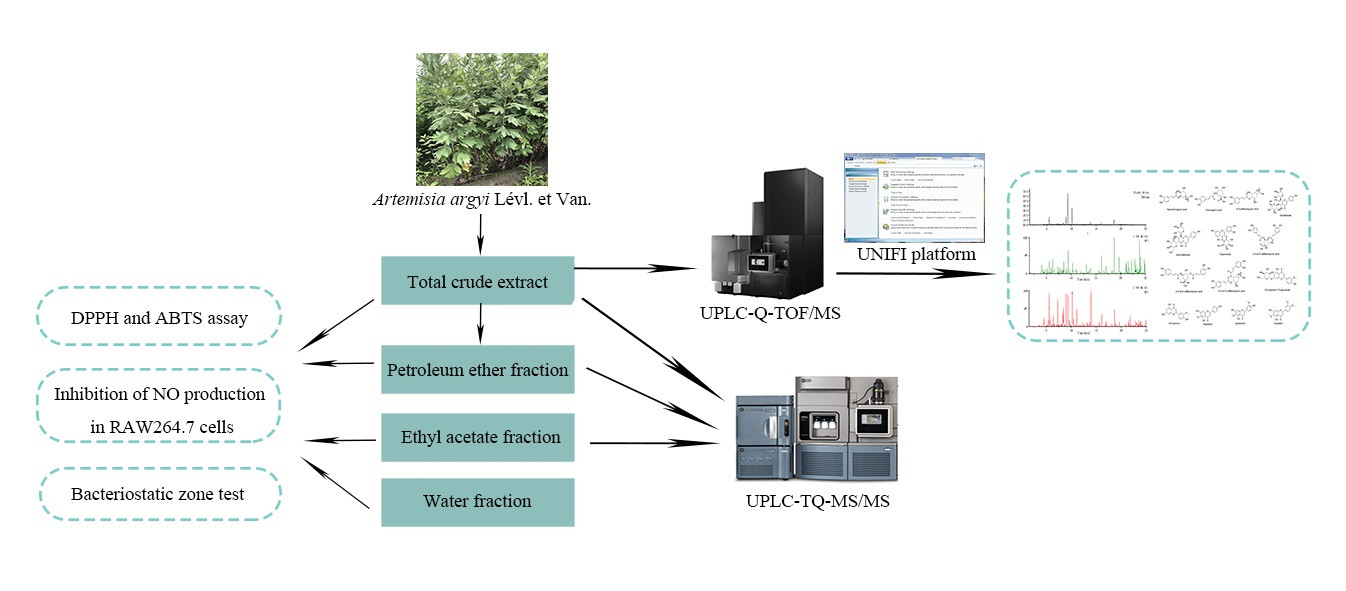
3.3. Preparation of Extract and Fractions
3.4. UPLC-Q-TOF/MS Analysis
3.5. Construction of UNIFI Theoretical Library on Chemical Constituents of QA
3.6. UPLC-TQ-MS/MS Quantitative Analysis of Main Components
3.6.1. Preparation of Standard Solution and Sample Solution
3.6.2. Instrumentation and Analytical Conditions
3.7. Evaluation of Antioxidant Activity
3.7.1. DPPH Assay
3.7.2. ABTS Assay
3.8. Determination of Anti-Inflammatory Activity by Inhibition of NO
3.9. Disc Diffusion Assay
4. Conclusions
Supplementary Materials
Author Contributions
Funding
Data Availability Statement
Conflicts of Interest
Sample Availability
References
- Editorial Board of Chinese Pharmacopoeia. Pharmacopoeia of the People’s Republic of China; China Pharmaceutical Science and Technology Press: Beijing, China, 2015; p. 89. [Google Scholar]
- Schlaeger, J.M.; Stoffel, C.L.; Bussell, J.L.; Cai, H.Y.; Takayama, M.; Yajima, H.; Takakura, N. Moxibustion for Cephalic Version of Breech Presentation. J. Midwifery Women’s Health 2018, 63, 309–322. [Google Scholar] [CrossRef]
- Li, S.Z. Compendium of Materia Medica; People’s Medical Publishing House: Beijing, China, 1987; p. 157. [Google Scholar]
- Xue, Z.J.; Guo, L.X.; Guo, M.; Yang, G.Y.; Zhang, D.; Guo, L.; Zheng, Y.G. Study on difference of chemical constituents of Qiai in different harvest periods. Zhongguo Zhong Yao Za Zhi 2019, 44, 5433–5440, (In Chinese, English Abstract). [Google Scholar]
- Chang, Y.Q.; Xue, Z.J.; Yang, G.Y.; Guo, M.; Zhang, D.; Zheng, Y.G.; Guo, L. Dynamic changes of volatile components of Qiai from different harvest time based on GC-MS and chemometrics analysis. Zhongguo Zhong Yao Za Zhi 2020, 45, 2417–2424, (In Chinese, English Abstract). [Google Scholar]
- Wang, X.J.; Deng, Y.H.; Zhang, L.P.; Zheng, G.H.; Chen, L.L.; Fang, Y. Identification and determination of phenolic acids and flavonoids in Artemisiae Argyi Folium by UPLC-DAD-MS. Zhongguo Zhong Yao Za Zhi 2019, 44, 983–989, (In Chinese, English Abstract). [Google Scholar] [PubMed]
- Hu, J.Q.; Wan, D.R.; Pu, R.; Shi, N.N.; Huang, L.Q.; Li, L.Y.; Long, W.F. Quality evaluation and genuine regional analysis on Artemisia Argyi Folium from different places of China and Korean. China J. Tradit. Chin. Med. Pharm. 2019, 34, 553–556, (In Chinese, English Abstract). [Google Scholar]
- Chen, C.J.; Luo, D.D.; Miao, Y.H.; Kang, L.P.; Guo, L.P.; Liu, D.H.; Huang, L.Q. Analysis and evaluation of volatile oil content in leaves of different Artemisia argyi germplasm resources. Zhongguo Zhong Yao Za Zhi 2021, 46, 3814–3823, (In Chinese, English Abstract). [Google Scholar] [PubMed]
- Li, M.; Chai, X.; Wang, L.; Yang, J.; Wang, Y. Study of the Variation of Phenolic Acid and Flavonoid Content from Fresh Artemisiae argyi Folium to Moxa Wool. Molecules 2019, 24, 4603. [Google Scholar] [CrossRef] [Green Version]
- Kim, Y.B.; Cho, H.J.; Yi, Y.S. Anti-inflammatory role of Artemisia argyi methanol extract by targeting the caspase-11 non-canonical inflammasome in macrophages. J. Ethnopharmacol. 2023, 307, 116231. [Google Scholar] [CrossRef] [PubMed]
- Su, S.H.; Sundhar, N.; Kuo, W.W.; Lai, S.C.; Kuo, C.H.; Ho, T.J.; Lin, P.Y.; Lin, S.Z.; Shih, C.Y.; Lin, Y.J.; et al. Artemisia argyi extract induces apoptosis in human gemcitabine-resistant lung cancer cells via the PI3K/MAPK signaling pathway. J. Ethnopharmacol. 2022, 299, 115658. [Google Scholar] [CrossRef]
- Han, Y.; Park, H.J.; Hong, M.K.; Shin, M.R.; Roh, S.S.; Kwon, E.Y. Artemisiae argyi Water Extract Alleviates Obesity-Induced Metabolic Disorder. Curr. Issues Mol. Biol. 2022, 4, 6158–6171. [Google Scholar] [CrossRef] [PubMed]
- Liu, Y.; He, Y.; Wang, F.; Xu, R.; Yang, M.; Ci, Z.; Wu, Z.; Zhang, D.; Lin, J. From longevity grass to contemporary soft gold: Explore the chemical constituents, pharmacology, and toxicology of Artemisia argyi H.Lév. & vaniot essential oil. J. Ethnopharmacol. 2021, 279, 114404. [Google Scholar] [PubMed]
- Xia, J.X.; Zhao, B.B.; Zan, J.F.; Wang, P.; Chen, L.L. Simultaneous determination of phenolic acids and flavonoids in Artemisiae Argyi Folium by HPLC-MS/MS and discovery of antioxidant ingredients based on relevance analysis. J. Pharm. Biomed Anal. 2019, 175, 112734. [Google Scholar] [CrossRef] [PubMed]
- Chang, Y.; Fan, W.; Shi, H.; Feng, X.; Zhang, D.; Wang, L.; Zheng, Y.; Guo, L. Characterization of phenolics and discovery of α-glucosidase inhibitors in Artemisia argyi leaves based on ultra-performance liquid chromatography-tandem mass spectrometry and relevance analysis. J. Pharm. Biomed Anal. 2022, 220, 114982. [Google Scholar] [CrossRef]
- Luo, D.D.; Peng, H.S.; Zhang, Y.; Huang, X.Z.; Zhan, Z.L.; Liu, D.H.; Kang, L.P.; Huang, L.Q. Comparison of chemical components between Artemisia stolonifera and Artemisia argyi using UPLC-Q-TOF-MS. Zhongguo Zhong Yao Za Zhi 2020, 45, 4057–4064, (In Chinese, English Abstract). [Google Scholar]
- Guo, L.; Zhang, D.; Xue, Z.J.; Jiao, Q.; Liu, A.P.; Zheng, Y.G.; Liu, E.H.; Duan, L. Comparison of Artemisiae argyi Folium and Artemisiae lavandulaefoliae Folium by simultaneous determination of multi-components with single reference standard method and chemometric analysis. Phytochem. Anal. 2019, 30, 14–25. [Google Scholar] [CrossRef] [PubMed] [Green Version]
- Yang, M.T.; Kuo, T.F.; Chung, K.F.; Liang, Y.C.; Yang, C.W.; Lin, C.Y.; Feng, C.S.; Chen, Z.W.; Lee, T.H.; Hsiao, C.L.; et al. Authentication, phytochemical characterization and anti-bacterial activity of two Artemisia species. Food Chem. 2020, 333, 127458. [Google Scholar] [CrossRef]
- Cui, L.L.; Wang, X.Z.; Lu, J.; Tian, J.; Wang, L.; Qu, J.J.; Liu, Z.H.; Wei, J.F. Rapid Identification of Chemical Constituents in Artemisia argyi Lévi. et Vant by UPLC-Q-Exactive-MS/MS. J. Food Qual. 2021, 7, 5597327. [Google Scholar] [CrossRef]
- Anand, A.; Komati, A.; Katragunta, K.; Shaik, H.; Nagendla, N.K.; Kuncha, M.; Mudiam, M.K.R.; Babu, K.S.; Tiwari, A.K. Phytometabolomic analysis of boiled rhizome of Nymphaea nouchali (Burm. f.) using UPLC-Q-TOF-MSE, LC-QqQ-MS & GC-MS and evaluation of antihyperglycemic and antioxidant activities. Food Chem. 2021, 342, 128313. [Google Scholar]
- Nie, R.Z.; Dang, M.Z.; Ge, Z.Z.; Huo, Y.Q.; Yu, B.; Tang, S.W. Interactions of chlorogenic acid and isochlorogenic acid A with model lipid bilayer membranes: Insights from molecular dynamics simulations. Chem. Phys. Lipids 2021, 240, 105136. [Google Scholar] [CrossRef]
- Wen, K.; Fang, X.; Yang, J.; Yao, Y.; Nandakumar, K.S.; Salem, M.L.; Cheng, K. Recent Research on Flavonoids and their Biomedical Applications. Curr. Med. Chem. 2021, 28, 1042–1066. [Google Scholar] [CrossRef]
- Wu, C.Y.; Guo, Y.Y.; Zhou, J.; Long, F.; Zhang, W.; Shen, H.; Xu, J.D.; Zhou, S.S.; Li, S.L. Holistic quality evaluation of Hibisci Mutabilis Folium by integrating UPLC-QTOF-MS/MS chemical profiling and UPLC-TQ-MS/MS quantification approaches. J. Pharm. Biomed Anal. 2022, 218, 114869. [Google Scholar] [CrossRef] [PubMed]
- Liu, H.; Hao, J.; Wu, C.; Liu, G.; Wang, X.; Yu, J.; Liu, Y.; Zhao, H. Eupatilin Alleviates Lipopolysaccharide-Induced Acute Lung Injury by Inhibiting Inflammation and Oxidative Stress. Med. Sci. Monit. 2019, 25, 8289–8296. [Google Scholar] [CrossRef]
- Yun, N.; Kang, J.W.; Lee, S.M. Protective effects of chlorogenic acid against is chemia/reperfusion injury in rat liver: Molecular evidence of its antioxidant and anti-inflammatory properties. J. Nutr. Biochem. 2012, 23, 1249–1255. [Google Scholar] [CrossRef]
- Su, M.; Liu, F.; Luo, Z.; Wu, H.; Zhang, X.; Wang, D.; Zhu, Y.; Sun, Z.; Xu, W.; Miao, Y. The Antibacterial Activity and Mechanism of Chlorogenic Acid Against Foodborne Pathogen Pseudomonas aeruginosa. Foodborne Pathog. Dis. 2019, 16, 823–830. [Google Scholar] [CrossRef] [PubMed]
- Zeb, A. Concept, mechanism, and applications of phenolic antioxidants in foods. J. Food Biochem. 2020, 44, e13394. [Google Scholar] [CrossRef] [PubMed]
- Fernandez-Panchon, M.S.; Villano, D.; Troncoso, A.M.; Garcia-Parrilla, M.C. Antioxidant activity of phenolic compounds: From in vitro results to in vivo evidence. Crit. Rev. Food Sci. Nutr. 2008, 48, 649–671. [Google Scholar] [CrossRef]
- Min, S.W.; Kim, N.J.; Baek, N.I.; Kim, D.H. Inhibitory effect of eupatilin and jaceosidin isolated from Artemisia princeps on carrageenan-induced inflammation in mice. J. Ethnopharmacol. 2009, 125, 497–500. [Google Scholar] [CrossRef] [PubMed]
- Neetu, N.; Katiki, M.; Dev, A.; Gaur, S.; Tomar, S.; Kumar, P. Structural and Biochemical Analyses Reveal that Chlorogenic Acid Inhibits the Shikimate Pathway. J. Bacteriol. 2020, 202, e00248-20. [Google Scholar] [CrossRef]
- Wu, Y.; Liang, S.; Zhang, M.; Wang, Z.; Wang, Z.; Ren, X. The Effect of Chlorogenic Acid on Bacillus subtilis Based on Metabolomics. Molecules 2020, 25, 4038. [Google Scholar] [CrossRef]
- Xie, Y.; Yang, W.; Tang, F.; Chen, X.; Ren, L. Antibacterial activities of flavonoids: Structure-activity relationship and mechanism. Curr. Med. Chem. 2015, 22, 132–149. [Google Scholar] [CrossRef]
- Baliyan, S.; Mukherjee, R.; Priyadarshini, A.; Vibhuti, A.; Gupta, A.; Pandey, R.P.; Chang, C.M. Determination of Antioxidants by DPPH Radical Scavenging Activity and Quantitative Phytochemical Analysis of Ficus religiosa. Molecules 2022, 27, 1326. [Google Scholar] [CrossRef] [PubMed]
- Deng, W.; Zhu, Y.; Lin, J.; Zheng, L.; Zhang, C.; Luo, M. Inhibition of soluble epoxide hydrolase lowers portal hypertension in cirrhotic rats by ameliorating endothelial dysfunction and liver fibrosis. Prostaglandins Oth Lipid M. 2017, 131, 67–74. [Google Scholar] [CrossRef] [PubMed]


| No. | Component Name | Observed RT (min) | Formula | Observed Neutral Mass (Da) | Observed m/z | Mass Error (mDa) | Adducts |
|---|---|---|---|---|---|---|---|
| 1 | 14-deoxyactucin | 1.65 | C15H16O4 | 260.1047 | 278.1386 | −0.1 | +NH4 |
| 2 | Artemisargins B | 3.99 | C18H24O7 | 376.1522 | 394.1860 | 0 | +NH4 |
| 3 | Neochlorogenic acid | 4.47 | C16H18O9 | 354.0938 | 353.0910 | 0.2 | +H |
| 4 | Arteglasin A | 4.57 | C17H20O5 | 304.1307 | 322.1645 | −0.4 | +NH4 |
| 5 | 7-hydroxy-2H-chromen-2-one | 5.53 | C9H6O3 | 162.0323 | 163.0396 | 0.6 | +H |
| 6 | Moxartenolide | 6.98 | C20H22O5 | 342.1462 | 360.18 | −0.5 | +NH4 |
| 7 | Schaftoside | 7.27 | C26H28O14 | 564.1481 | 565.1554 | 0.2 | +H |
| 8 | 5alpha-hydroxydehydroleucodin | 7.28 | C15H16O4 | 260.1049 | 261.1122 | 0 | +H |
| 9 | Argyin D | 7.28 | C15H18O5 | 278.1153 | 301.1045 | −0.1 | +Na |
| 10 | Austroy unnane D | 7.63 | C15H18O5 | 278.1155 | 301.1047 | 0.1 | +Na |
| 11 | 7-hydroxy-6-methoxy-2H-1-benzopyran-2-one | 8.01 | C10H8O4 | 192.0423 | 193.0496 | 0 | +H |
| 12 | 10-epi-artecanin | 8.09 | C15H18O5 | 278.1151 | 301.1044 | −0.3 | +Na |
| 13 | Eriodictyol | 8.37 | C15H12O6 | 288.0633 | 289.0705 | −0.1 | +H |
| 14 | Quercetol | 8.43 | C15H10O7 | 302.0432 | 303.0505 | 0.6 | +H |
| 15 | Hyperoside | 8.43 | C21H20O12 | 464.0949 | 465.1021 | −0.6 | +H |
| 16 | Luteolin | 8.50 | C15H10O6 | 286.0479 | 287.0552 | 0.2 | +H |
| 17 | 13-acetoxy-8alpha-hydroxy-7,11-dehydro-11,13-dihydroanhydrovertorin | 8.56 | C17H22O6 | 322.1413 | 323.1486 | −0.4 | +H |
| 18 | 3,4-di-O-caffeoylquinic acid | 8.99 | C25H24O12 | 516.1263 | 517.1336 | −0.4 | +H |
| 19 | Demethoxy aschantin | 9.09 | C19H18O4 | 310.1199 | 328.1537 | −0.6 | +NH4 |
| 20 | 3,5-di-O-caffeoylquinic acid | 9.35 | C25H24O12 | 516.1262 | 517.1335 | −0.6 | +H |
| 21 | Tuberiferine | 10.87 | C15H18O3 | 246.1253 | 247.1325 | −0.3 | +H |
| 22 | Trichocadinin C | 10.88 | C15H16O4 | 260.1043 | 261.1116 | −0.6 | +H |
| 23 | Argyin C | 13.57 | C19H24O7 | 364.1524 | 365.1597 | 0.2 | +H |
| 24 | 5,6,2′,4′-tetrahydroxy-7,5′-dimethoxyflavone | 13.83 | C17H14O8 | 346.0689 | 347.0761 | 0 | +H |
| 25 | Eupafolin | 15.56 | C16H12O7 | 300.0637 | 301.071 | 0.4 | +H |
| 26 | Hispidulin | 15.56 | C10H8O3 | 300.0637 | 301.071 | 0.4 | +H |
| 27 | Trichocadinin B | 15.85 | C15H16O3 | 244.1101 | 245.1174 | 0.2 | +H |
| 28 | Jaceosidin | 16.08 | C17H14O7 | 330.0749 | 331.0822 | 0.9 | +H |
| 29 | Artemisian D | 16.10 | C30H36O8 | 524.2414 | 542.2752 | 0.3 | +NH4 |
| 30 | Artemisiane B | 16.20 | C30H34O9 | 538.2197 | 561.2089 | −0.6 | +Na |
| 31 | Artemisian A | 16.25 | C30H36O8 | 524.2408 | 542.2746 | −0.2 | +NH4 |
| 32 | Apicin | 17.00 | C18H16O8 | 360.0847 | 361.0920 | 0.2 | +H |
| 33 | Jaceidin | 17.00 | C18H16O8 | 360.0847 | 361.0920 | 0.2 | +H |
| 34 | 5,7-dihydroxy-3′,4′-dimethoxy flavone | 18.09 | C17H14O6 | 314.0791 | 315.0864 | 0.1 | +H |
| 35 | 5,6-dihydroxy-3′,4′,7-trimethoxyflavone | 18.66 | C18H16O7 | 344.0901 | 345.0973 | 0.5 | +H |
| 36 | Eupatilin | 18.66 | C18H16O7 | 344.0901 | 345.0973 | 0.5 | +H |
| 37 | Artanomaloide | 18.86 | C30H34O7 | 506.2302 | 507.2375 | −0.2 | +H |
| 38 | Artemisianin A | 18.86 | C30H36O8 | 524.2409 | 542.2747 | −0.1 | +NH4 |
| 39 | Chrysoplenitin | 19.62 | C19H18O8 | 374.1007 | 375.1079 | 0.5 | +H |
| 40 | Ladanein | 19.99 | C17H14O6 | 314.0789 | 315.0862 | −0.1 | +H |
| 41 | 8-acetylarteminolide | 20.03 | C32H36O8 | 548.2403 | 549.2476 | −0.7 | +H |
| 42 | Artemetin | 20.79 | C20H20O8 | 388.1154 | 389.1227 | −0.4 | +H |
| 43 | Koninginin T | 21.46 | C17H26O3 | 276.2086 | 277.2159 | −0.3 | +H |
| 44 | Artanomaloide C | 21.46 | C35H40O8 | 588.2722 | 589.2795 | −0.1 | +H |
| 45 | 9-oxo-(10E,12E)-octadeca-10,12-dienoic acid | 22.00 | C18H30O3 | 294.2189 | 317.2081 | −0.6 | +Na |
| 46 | Artemisolide | 22.15 | C25H32O4 | 396.2303 | 397.2376 | 0.2 | +H |
| 47 | Artemargyinolide A | 22.36 | C40H50O7 | 642.3552 | 660.389 | −0.5 | +NH4 |
| No. | Component Name | Observed RT (min) | Formula | Observed Neutral Mass (Da) | Observed m/z | Mass Error (mDa) | Adducts |
|---|---|---|---|---|---|---|---|
| 1 | Cirsilineol | 4.51 | C17H14O7 | 330.0715 | 375.0697 | −2.5 | +HCOO |
| 2 | 4-Dicaffeoylquinic Acid | 5.76 | C16H18O9 | 354.0957 | 353.0885 | 0.6 | -H |
| 3 | Acrifolide | 6.54 | C15H16O6 | 292.0947 | 337.0929 | 0 | +HCOO |
| 4 | 1β,2β-epoxy-3β,4α,10α-trihydroxyguaian-6α,12-olide | 6.63 | C15H20O6 | 296.1262 | 295.1189 | 0.2 | -H |
| 5 | Isotanciloide | 6.63 | C15H20O6 | 296.1262 | 295.1189 | 0.2 | -H |
| 6 | Schaftoside | 7.24 | C26H28O14 | 564.1494 | 563.1421 | 1.5 | -H |
| 7 | Isoschaftoside | 7.48 | C26H28O14 | 564.1486 | 563.1413 | 0.7 | -H |
| 8 | Argyin D | 7.61 | C15H18O5 | 278.116 | 277.1088 | 0.6 | -H |
| 9 | 10-epi-artecanin | 7.95 | C15H18O5 | 278.116 | 277.1087 | 0.6 | -H |
| 10 | Artemetin | 8.10 | C20H20O8 | 388.115 | 433.1132 | −0.8 | +HCOO |
| 11 | Hyperoside | 8.39 | C21H20O12 | 464.0971 | 463.0899 | 1.7 | -H |
| 12 | 3alpha,4alpha,10beta-trihydroxy-8alpha-acetoxyguai-1,11(13)-dien-6alpha,12-olide | 8.59 | C17H22O7 | 338.1368 | 337.1295 | 0.2 | -H |
| 13 | 3,4-di-O-caffeoylquinic acid | 8.93 | C25H24O12 | 516.1278 | 515.1206 | 1.1 | -H |
| 14 | Chlorogenic acid | 9.29 | C16H18O9 | 354.0953 | 353.088 | 0.2 | -H |
| 15 | 4,5-di-O-caffeoylquinic acid | 9.29 | C25H24O12 | 516.1275 | 515.1203 | 0.8 | -H |
| 16 | 4-Hydroxyacetophenone | 10.16 | C8H8O2 | 136.0529 | 135.0456 | 0.5 | -H |
| 17 | 3,4-O-dicaffeoylquinic acid | 10.16 | C25H24O12 | 516.1285 | 515.1212 | 1.7 | -H |
| 18 | Chrysoeriol 7-O-glucoside | 11.08 | C22H22O11 | 462.3601 | 461.3528 | 0.8 | -H |
| 19 | Eriodictyol | 12.68 | C15H12O6 | 288.0638 | 287.0565 | 0.4 | -H |
| 20 | Eupatilin 7-O-beta-D-glucopyranoside | 13.08 | C24H26O12 | 506.1433 | 551.1415 | 0.8 | +HCOO |
| 21 | Luteolin | 13.31 | C15H10O6 | 286.0484 | 285.0411 | 0.7 | -H |
| 22 | Apigenin | 13.61 | C15H10O5 | 270.0534 | 315.0516 | 0.6 | +HCOO |
| 23 | Chrysoeriol | 13.67 | C16H12O6 | 300.2678 | 299.2909 | 1.8 | -H |
| 24 | 5,6,2′,4′-tetrahydroxy-7,5′-dimethoxyflavone | 13.82 | C17H14O8 | 346.0692 | 345.0619 | 0.3 | -H |
| 25 | Naringenin | 14.86 | C15H12O5 | 272.0686 | 271.0613 | 0.1 | -H |
| 26 | Hispidulin | 15.55 | C16H12O6 | 300.064 | 299.0567 | 0.6 | -H |
| 27 | Eupafolin | 15.7 | C16H12O7 | 300.0639 | 299.0566 | 0.5 | -H |
| 28 | Jaceidin | 16.01 | C18H16O8 | 360.0845 | 359.0772 | 0 | -H |
| 29 | Jaceosidin | 16.07 | C17H14O7 | 330.0745 | 329.0672 | 0.5 | -H |
| 30 | Artemisian D | 16.08 | C30H36O8 | 524.2411 | 569.2393 | 0.1 | +HCOO |
| 31 | Artemisian A | 16.23 | C30H36O8 | 524.2403 | 523.233 | −0.7 | -H |
| 32 | 5,7-dihydroxy-3′,4′-dimethoxy flavone | 16.98 | C17H14O6 | 314.0796 | 359.0778 | 0.6 | +HCOO |
| 33 | Apicin | 16.98 | C18H16O8 | 360.0851 | 359.0778 | 0.6 | -H |
| 34 | Ladanein | 18.07 | C17H14O6 | 314.0796 | 313.0723 | 0.6 | -H |
| 35 | 5,6-dihydroxy-3′,4′,7-trimethoxyflavone | 18.63 | C18H16O7 | 344.0905 | 343.0833 | 0.9 | -H |
| 36 | Eupatilin | 18.63 | C18H16O7 | 344.0905 | 343.0833 | 0.9 | -H |
| 37 | Artemisian C | 18.81 | C30H36O8 | 524.2418 | 523.2345 | 0.8 | -H |
| 38 | Artemisianin D | 18.97 | C30H36O8 | 524.2416 | 523.2343 | 0.5 | -H |
| 39 | Chrysoplenitin | 19.61 | C19H18O8 | 374.1009 | 373.0936 | 0.7 | -H |
| 40 | Argyinolide O | 20.58 | C30H34O6 | 490.2362 | 535.2344 | 0.7 | +HCOO |
| 41 | 13-oxo-9Z,11E-octadecadienoic acid | 21.45 | C18H30O3 | 294.2204 | 293.2131 | 0.9 | -H |
| 42 | Artanomaloide A | 21.83 | C35H42O8 | 590.2895 | 635.2877 | 1.5 | +HCOO |
| 43 | Artemilinin A | 22.82 | C30H40O7 | 528.3065 | 527.2992 | −2.2 | -H |
| No. | Standards | Regression Equation | Linear Range (ng/mL) | R2 | LOD (ng/mL) | LOQ (μg/mL) | Intra-Day RSD (%) | Inter-Day RSD (%) | Recovery Range (%) |
|---|---|---|---|---|---|---|---|---|---|
| 1 | Neochlorogenic acid | y = 81.359x − 414.46 | 1.60–2000.00 | 0.9999 | 0.50 | 1.52 | 1.34 | 0.87 | 99.74 ± 2.03 |
| 2 | Chlorogenic acid | y = 112.05x − 54.224 | 1.60–2000.00 | 0.9999 | 0.49 | 1.48 | 1.02 | 1.38 | 98.61 ± 1.02 |
| 3 | 4-Dicaffeoylquinic Acid | y = 86.488x − 151.05 | 3.20–2000.00 | 0.9999 | 1.04 | 3.15 | 1.28 | 0.99 | 99.26 ± 1.47 |
| 4 | Schaftoside | y = 63.919x − 81.799 | 3.20–2000.00 | 0.9997 | 1.05 | 3.18 | 2.03 | 1.98 | 101.74 ± 1.77 |
| 5 | Isoschaftoside | y = 66.869x − 204.17 | 1.60–2000.00 | 0.9999 | 0.50 | 1.52 | 1.57 | 1.35 | 98.81 ± 1.56 |
| 6 | Hyperoside | y = 151.14x − 129.05 | 1.60–2000.00 | 0.9999 | 0.51 | 1.55 | 1.18 | 1.36 | 98.26 ± 1.63 |
| 7 | 3,4-di-O-caffeoylquinic acid | y = 70.087x − 1247.2 | 1.60–2000.00 | 0.9999 | 0.48 | 1.45 | 0.86 | 1.26 | 97.56 ± 1.04 |
| 8 | 3,5-di-O-caffeoylquinic acid | y = 82.844x − 1638.1 | 8.00–2000.00 | 0.9984 | 2.63 | 7.97 | 0.79 | 1.01 | 98.62 ± 0.98 |
| 9 | 4,5-di-O-caffeoylquinic acid | y = 152.35x − 2803.6 | 8.00–2000.00 | 0.9988 | 2.61 | 7.91 | 1.33 | 1.21 | 100.85 ± 0.97 |
| 10 | Chrysoeriol 7-O-glucoside | y = 325.22x + 4607.7 | 3.20–2000.00 | 0.9978 | 1.05 | 3.18 | 1.55 | 1.16 | 99.57 ± 1.62 |
| 11 | Chrysoeriol | y = 311.26x + 2755.2 | 1.60–2000.00 | 0.9996 | 0.49 | 1.48 | 1.96 | 1.73 | 99.08 ± 2.06 |
| 12 | Hispidulin | y = 636.33x + 22250 | 1.60–2000.00 | 0.9967 | 0.49 | 1.48 | 1.94 | 2.16 | 98.63 ± 1.29 |
| 13 | Jaceosidin | y = 406.28x + 3851.4 | 16.00–2000.00 | 0.9996 | 5.32 | 15.89 | 2.31 | 2.07 | 97.93 ± 1.59 |
| 14 | Eupatilin | y = 191.01x + 1368 | 8.00–2000.00 | 0.9997 | 2.63 | 7.97 | 0.96 | 1.41 | 99.37 ± 1.66 |
| Name | Content (mg/g) | ||
|---|---|---|---|
| QA-TE | QA-FEA | QA-FWT | |
| Neochlorogenic acid | 3.59 ± 0.07 ** | 0.07 ± 0.01 * | 3.52 ± 0.06 * |
| Chlorogenic acid | 16.67 ± 0.21 ** | 0.40 ± 0.01 * | 16.67 ± 0.19 ** |
| 4-Dicaffeoylquinic Acid | 2.79 ± 0.09 ** | 0.06 ± 0.01 * | 3.74 ± 0.06 * |
| Schaftoside | 2.68 ± 0.04 * | 0.16 ± 0.01 * | 5.98 ± 0.05 ** |
| Isoschaftoside | 0.10 ± 0.01 * | — | 0.27 ± 0.01 * |
| Hyperoside | 0.34 ± 0.03 * | 0.13 ± 0.01 * | 1.32 ± 0.05 * |
| 3,4-di-O-caffeoylquinic acid | 19.30 ± 0.23 ** | — | 69.16 ± 0.71 ** |
| 3,5-di-O-caffeoylquinic acid | 93.63 ± 1.15 ** | 8.21 ± 0.33 ** | 101.40 ± 1.83 ** |
| 4,5-di-O-caffeoylquinic acid | 48.27 ± 0.46 ** | 3.35 ± 0.11 * | 73.55 ± 0.68 ** |
| Chrysoeriol 7-O-glucoside | 0.15 ± 0.02 * | — | 0.08 ± 0.01 * |
| Chrysoeriol | 0.01 ± 0.01 * | 0.04 ± 0.01 * | 0.01 ± 0.01 * |
| Hispidulin | 0.57 ± 0.01 * | 1.93 ± 0.02 ** | 0.35 ± 0.01 * |
| Jaceosidin | 2.41 ± 0.04 ** | 15.61 ± 0.45 ** | 2.79 ± 0.02 ** |
| Eupatilin | 7.99 ± 0.29 ** | 48.54 ± 0.77 ** | 6.90 ± 0.08 ** |
Disclaimer/Publisher’s Note: The statements, opinions and data contained in all publications are solely those of the individual author(s) and contributor(s) and not of MDPI and/or the editor(s). MDPI and/or the editor(s) disclaim responsibility for any injury to people or property resulting from any ideas, methods, instructions or products referred to in the content. |
© 2023 by the authors. Licensee MDPI, Basel, Switzerland. This article is an open access article distributed under the terms and conditions of the Creative Commons Attribution (CC BY) license (https://creativecommons.org/licenses/by/4.0/).
Share and Cite
Zhang, T.; Wan, D.; Li, Y.; Wang, S.; Zhou, X.; Sefidkon, F.; Yang, X. UPLC-MS Analysis, Quantification of Compounds, and Comparison of Bioactivity of Methanol Extract and Its Fractions from Qiai (Artemisia argyi Lévl. et Van.). Molecules 2023, 28, 2022. https://doi.org/10.3390/molecules28052022
Zhang T, Wan D, Li Y, Wang S, Zhou X, Sefidkon F, Yang X. UPLC-MS Analysis, Quantification of Compounds, and Comparison of Bioactivity of Methanol Extract and Its Fractions from Qiai (Artemisia argyi Lévl. et Van.). Molecules. 2023; 28(5):2022. https://doi.org/10.3390/molecules28052022
Chicago/Turabian StyleZhang, Ting, Dingrong Wan, Yuanyuan Li, Sisi Wang, Xiuteng Zhou, Fatemeh Sefidkon, and Xinzhou Yang. 2023. "UPLC-MS Analysis, Quantification of Compounds, and Comparison of Bioactivity of Methanol Extract and Its Fractions from Qiai (Artemisia argyi Lévl. et Van.)" Molecules 28, no. 5: 2022. https://doi.org/10.3390/molecules28052022