
Resonance Raman and Visible Micro-Spectroscopy for the In-Vivo and In-Vitro Characterization of Anthocyanin-Based Pigments in Blue and Violet Flowers: A Comparison with HPLC-ESI- MS Analysis of the Extracts

 , ,
, ,  and
and
Abstract
:1. Introduction
2. Results and Discussion
2.1. Blue Flower Petals Containing Acylated Delphinidin Glycosides
2.2. Blue Flower Petals Containing Metalloanthocyanins
2.3. Blue Flower Petals Containing Rare Anthocyanins
3. Materials and Methods
3.1. Materials
3.2. Extraction and Purification of Extracts
- SPE on a cartridge packed with Amberlite XAD-7: the sample was eluted from the cartridge using 3 mL of (A) Milli-Q H2O: AcOH 20: 1 and 3 mL of (B) MeOH: AcOH 20: 1. The A fraction contains free sugars and organic acid molecules, while pigment molecules were eluted with the B fraction. The cartridge was pre-conditioned in the same way. This step was performed for all the flowers except for Commelina communis and Salvia patens.
- SPE on a cartridge packed with Sephadex LH-20: the eluents were (A) MeOH: H2O:AcOH in a ratio 6:12:1 and (B) MeOH. The extracts loaded into the cartridge were fractionated using eluent A and 2 to 4 fractions were collected depending on the sample. By eluting with B, a final yellowish fraction containing flavonols and/or flavones was obtained. Conditioning was performed using 3 mL of B. This step was carried out as described for all the flowers except for Commelina communis and Salvia patens, for which the supramolecular complex was eluted with Milli-Q H2O so as not to cause alterations.
- SPE with DSC-MCAX cartridge: (A) Milli-Q H2O + 0.1% HCOOH, (B) MeOH and (C) 0.01 M phosphate buffer solution at pH 6 and MeOH in the ratio 1:1 were used as eluents. The sample was dissolved in a small amount of A, loaded and washed with A. The residual flavonols/flavones were then eluted with B and finally the anthocyanins with C. Conditioning of the cartridge was achieved with 3 mL of B and 2 mL of A.
3.3. Reconstruction of Commelinin
3.4. Instrumental Analysis Techniques
3.4.1. Raman Spectroscopy
3.4.2. HPLC-ESI-MS
3.4.3. Visible Absorption Micro-Spectroscopy
3.5. Quantum Mechanical Calculations
4. Conclusions
Supplementary Materials
Author Contributions
Funding
Institutional Review Board Statement
Informed Consent Statement
Data Availability Statement
Acknowledgments
Conflicts of Interest
References
- Brouillard, R.; Chassaing, S.; Isorez, G.; Kueny-Stotz, M.; Figueiredo, P. The Visible Flavonoids or Anthocyanins: From Research to Applications. In Recent Advances in Polyphenol Research; Santos-Buelga, C., Escribano-Bailon, M.T., Lattanzio, V., Eds.; Blackwell Publishing Ltd: Oxford, UK, 2010; Volume 2, pp. 1–22. [Google Scholar]
- Yoshida, K.; Mori, M.; Kondo, T. Blue Flower Color Development by Anthocyanins: From Chemical Structure to Cell Physiology. Nat. Prod. Rep. 2009, 26, 884–915. [Google Scholar] [CrossRef] [PubMed]
- Wrolstad, R.E. Interaction of Natural Colors with Other Ingredients. Anthocyanin Pigments - Bioactivity and Coloring Properties. J. Food Sci. 2004, 69, C419–C425. [Google Scholar] [CrossRef]
- Flamini, R.; Mattivi, F.; de Rosso, M.; Arapitsas, P.; Bavaresco, L. Advanced Knowledge of Three Important Classes of Grape Phenolics: Anthocyanins, Stilbenes and Flavonols. Int. J. Mol. Sci. 2013, 14, 19651–19669. [Google Scholar] [CrossRef] [PubMed]
- Cardon Dominique. Natural Dyes. Sources, Tradition, Technology and Science; Archetype Publications Ltd.: London, UK, 2007. [Google Scholar]
- Melo, M.J. History of Natural Dyes in the Ancient Mediterranean World. In Handbook of Natural Colorants; John Wiley & Sons, Ltd.: Chichester, UK, 2009; pp. 1–20. ISBN 9780470511992. [Google Scholar]
- Derrick, M.; Wright, J.; Newman, R. Plant Dye Identification in Japanese Woodblock Prints. Arnoldia 2017, 74, 12–28. [Google Scholar]
- Trouillas, P.; Sancho-García, J.C.; de Freitas, V.; Gierschner, J.; Otyepka, M.; Dangles, O. Stabilizing and Modulating Color by Copigmentation: Insights from Theory and Experiment. Chem. Rev. 2016, 116, 4937–4982. [Google Scholar] [CrossRef]
- Mazza, G.; Cacace, J.E.; Kay, C.D. Methods of Analysis for Anthocyanins in Plants and Biological Fluids. J. AOAC Int. 2004, 87, 129–145. [Google Scholar] [CrossRef]
- Harborne, J. Spectral Methods of Characterizing Anthocyanins. Biochem. J. 1958, 70, 22–28. [Google Scholar] [CrossRef]
- Honda, T.; Saito, N. Recent Progress in the Chemistry of Polyacylated Anthocyanins as Flower Color Pigments. Heterocycles 2002, 56, 633–692. [Google Scholar] [CrossRef]
- Goto, T.; Kondo, T. Structure and Molecular Stacking of Anthocyanins—Flower Color Variation. Angew. Chem. Int. Edit. 1991, 30, 17–33. [Google Scholar] [CrossRef]
- Kondo, T.; Yoshida, K.; Nakagawa, A.; Kawai, T.; Tamura, H.; Goto, T. Structural Basis of Blue Colour Development in Flower Petals in Commelina Communis. Nature 1992, 358, 515–518. [Google Scholar]
- Shiono, M.; Matsugaki, N.; Takeda, K. Structure of Commelinin, a Blue Complex Pigment from the Blue Flowers of Commelina Communis. Proc. Jpn. Acad. Ser. B 2008, 84, 452–456. [Google Scholar] [CrossRef]
- Shiono, M.; Matsugaki, N.; Takeda, K. Structure of Blue Cornflower Pigment. Nature 2005, 436, 791. [Google Scholar] [CrossRef]
- Fedenko, V.S.; Shemet, S.A.; Landi, M. UV–Vis Spectroscopy and Colorimetric Models for Detecting Anthocyanin-Metal Complexes in Plants: An Overview of in Vitro and in Vivo Techniques. J. Plant Physiol. 2017, 212, 13–28. [Google Scholar] [CrossRef]
- Stewart, R.N.; Norris, K.H.; Asen, S. Microspectrophotometric Measurement of PH and PH Effect on Color of Petal Epidermal Cells. Phytochemistry 1975, 14, 937–942. [Google Scholar] [CrossRef]
- Tatsuzawa, F. Flower Colors and Flavonoids in the Cultivars of Lobelia Erinus L. (Campanulaceae). Dyes Pigment. 2020, 180, 108500. [Google Scholar] [CrossRef]
- Mizuno, T.; Yabuya, T.; Kitajima, J.; Iwashina, T. Identification of Novel C-Glycosylflavones and Their Contribution Toflower Colour of the Dutch Iris Cultivars. Plant Physiol. Bioch. 2013, 72, 116–124. [Google Scholar] [CrossRef]
- Turrell, G.; Corset, J. (Eds.) Raman Microscopy. Developments and Applications, 1st ed.; Academic Press: Cambridge, MA, USA, 1996. [Google Scholar]
- Tu, A.T. Raman Spectroscopy in Biology: Principles and Applications; Wiley: New York, NY, USA, 1982. [Google Scholar]
- Hernanz, A.; Carmona, P.; Navarro, R. (Eds.) Spectroscopy of Biological Molecules: Modern Trends; Springer Netherlands: Dordrecht, The Netherlands, 2012. [Google Scholar]
- de Gelder, J.; de Gussem, K.; Vandenabeele, P.; Moens, L. Reference Database of Raman Spectra of Biological Molecules. J. Raman Spectrosc. 2007, 38, 1133–1147. [Google Scholar] [CrossRef]
- Moskovits, M. Surface-Enhanced Raman Spectroscopy: A Brief Retrospective. J. Raman Spectrosc. 2005, 36, 485–496. [Google Scholar] [CrossRef]
- Merlin, J.; Statoua, A.; Cornard Malika Saidi-idrissi, J.; Brouillard, R. Resonance Raman Spetroscopic Studies of Anthocyanins and Anthocyanidins in Aqueous Solutions. Phytochemistry 1994, 35, 7–232. [Google Scholar]
- Merlin, J.C.; Cornard, J.P.; Stastoua, A.; Saidi-Idrissi, M.; Lautie, M.F.; Brouillard, R. Vibrational Analysis of Hydroxyflavylium Derivatives by IR, Fourier Transform Raman and Resonance Raman Spectroscopies. Spectrochim. Acta A 1994, 50, 703–712. [Google Scholar] [CrossRef]
- Burns, A.E.; Mazauric, J.P.; Cheynier, V. Resonance Raman Study on the PH Dependence on Grape Anthocyanins. In Physical Methods in Food Analysis. ACS Symposium Series; Tunick, M.H., Onwulata, C.I., Eds.; American Chemical Society: Washington, DC, USA, 2013; Volume 1138, pp. 127–135. ISBN 9780841228849. [Google Scholar]
- Tachibana, N.; Kimura, Y.; Ohno, T. Examination of Molecular Mechanism for the Enhanced Thermal Stability of Anthocyanins by Metal Cations and Polysaccharides. Food Chem. 2014, 143, 452–458. [Google Scholar] [CrossRef] [PubMed]
- Buchweitz, M.; Gudi, G.; Carle, R.; Kammerer, D.R.; Schulz, H. Systematic Investigations of Anthocyanin-Metal Interactions by Raman Spectroscopy. J. Raman Spectrosc. 2012, 43, 2001–2007. [Google Scholar] [CrossRef]
- Zaffino, C.; Russo, B.; Bruni, S. Surface-Enhanced Raman Scattering (SERS) Study of Anthocyanidins. Spectrochim. Acta A 2015, 149, 41–47. [Google Scholar] [CrossRef] [PubMed]
- Zaffino, C.; Bruni, S.; Russo, B.; Pilu, R.; Lago, C.; Colonna, G.M. Identification of Anthocyanins in Plant Sources and Textiles by Surface-Enhanced Raman Spectroscopy (SERS). J. Raman Spectrosc. 2016, 47, 269–276. [Google Scholar] [CrossRef]
- Dai, H.; Forbes, A.; Guo, X.; He, L. Prediction of Anthocyanin Color Stability against Iron Co-Pigmentation by Surface-Enhanced Raman Spectroscopy. Foods 2022, 11, 3436. [Google Scholar] [CrossRef]
- Merlin, J.-C.; Statoua, A.; Brouillard, R. Investigation of the In Vivo Organization of Anthocyanins Using Resonance Raman Microspectrometry. Phytochemistry 1985, 24, 1575–1581. [Google Scholar] [CrossRef]
- Gamsjaeger, S.; Baranska, M.; Schulz, H.; Heiselmayer, P.; Musso, M. Discrimination of Carotenoid and Flavonoid Content in Petals of Pansy Cultivars (Viola x Wittrockiana) by FT-Raman Spectroscopy. J. Raman Spectrosc. 2011, 42, 1240–1247. [Google Scholar] [CrossRef]
- Bloor, S.J.; Falshaw, R. Covalently Linked Anthocyanin-Flavonol Pigments from Blue Agapanthus Flowers. Phytochemistry 2000, 53, 575–579. [Google Scholar] [CrossRef]
- Saito, N.; Toki, K.; Moriyama, H.; Shigihara, A.; Honda, T. Acylated Anthocyanins from the Blue-Violet Flowers of Anemone Coronaria. Phytochemistry 2002, 60, 365–373. [Google Scholar] [CrossRef]
- Brandt, K.; Kondo, T.; Aoki, H.; Goto, T. Structure and Biosynthesis of Anthocyanins in Flowers of Campanula. Phytochemistry 1993, 33, 209–212. [Google Scholar] [CrossRef]
- Goto, T.; Kondo, T.; Kawai, T.; Tamura, H. Structure of Cinerarin, a Tetra-Acylated Anthocyanin Isolated from the Blue Garden Cineraria, Senecio Cruentus. Tetrahedron Lett. 1984, 25, 6021–6024. [Google Scholar] [CrossRef]
- Goto, T.; Kondo, T.; Tamura, H.; Kawahori, K. Structure of Platyconin, a Diacylated Anthocyanin Isolated from the Chinese Bell-Flower Platycodon Grandiflorum. Tetrahedron Lett. 1983, 24, 2181–2184. [Google Scholar] [CrossRef]
- Kondo, T.; Hagihara, S.; Takaya, Y.; Yoshida, K. Polyacylated Anthocyanins in Bluish-Purple Petals of Chinese Bellflower, Platycodon Grandiflorum. Int. J. Mol. Sci. 2021, 22, 4044. [Google Scholar] [CrossRef]
- Yoshikane, M.; Yoshida, K.; Kondo, T.; Goto, T. Structure of Anthocyanins in Scarlet, Purple and Blue Flowers of Salvia. Tetrahedron Lett. 1989, 30, 6729–6732. [Google Scholar]
- Saito, N.; Timberlakes, C.F.; Tucknott, O.G.; S Lewis, I.A. Fast Atom Bombardment Mass Spectrometry of the Anthocyanins Violanin and Platyconin. Phytochemistry 1983, 22, 1007–1009. [Google Scholar] [CrossRef]
- Takeda, K.; Yanagisawa, M.; Kifune, T.; Kinoshita, T.; Timberlake~, C.F. A Blue Pigment Complex in Flowers of Salvia Patens. Phytochemistry 1994, 35, 1167–1169. [Google Scholar] [CrossRef]
- Harborne, J.B. Comparative Biochemistry of the Flavonoids-IV. Correlations between Chemistry, Pollen Morphology and Systematics in the Family of Plumbaginaceae*. Phytochemistry 1967, 6, 1415–1428. [Google Scholar] [CrossRef]
- Skaar, I.; Jordheim, M.; Byamukama, R.; Mbabazi, A.; Wubshet, S.G.; Kiremire, B.; Andersen, Ø.M. New Anthocyanidin and Anthocyanin Pigments from Blue Plumbago. J. Agr. Food Chem. 2012, 60, 1510–1515. [Google Scholar] [CrossRef]
- Byng, J.W.; Chase, M.W.; Christenhusz, M.J.; Fay, M.F.; Judd, W.S.; Mabberley, D.J.; Sennikov, A.N.; Soltis, D.E.; Soltis, P.S.; Stevens, P.F. An Update of the Angiosperm Phylogeny Group Classification for the Orders and Families of Flowering Plants: APG IV. Bot. J. Linn. Soc. 2016, 181, 1–20. [Google Scholar]
- Sun, J.; Lin, L.Z.; Chen, P. Study of the Mass Spectrometric Behaviors of Anthocyanins in Negative Ionization Mode and Its Applications for Characterization of Anthocyanins and Non-Anthocyanin Polyphenols. Rapid Commun. Mass Sp. 2012, 26, 1123–1133. [Google Scholar] [CrossRef]
- Tatsuzawa, F.; Mukai, C.; Igarashi, M.; Hishida, A.; Satta, N.; Honda, K.; Nakajo, S.; Takehara, A.; Tanikawa, N. Anthocyanins and Anthocyanidins in the Flowers of Aconitum (Ranunculaceae). Biochem. Syst. Ecol. 2019, 87, 103937. [Google Scholar] [CrossRef]
- Goto, T.; Kondo, T.; Tamura, H.; Takase, S. Structure of Malonylawobanin, the Real Anthocyanin Present in Blue-Colored Flower Petals of Commelina Communis. Tetrahedron Lett. 1983, 24, 4863–4866. [Google Scholar] [CrossRef]
- Kondo, T.; Oyama, K.I.; Yoshida, K. Chiral Molecular Recognition on Formation of a Metalloanthocyanin: A Supramolecular Metal Complex Pigment from Blue Flowers of Salvia Patens. Angew. Chem. Int. Ed. 2001, 40, 894–897. [Google Scholar] [CrossRef]
- Tamura, H.; Kondo, T.; Goto, T. The Composition of Commelinin, a Highly Associated Metalloanthocyanin Present in the Blue Flower Petals of Commelina Communis. Tetrahedron Lett. 1986, 27, 1801–1804. [Google Scholar] [CrossRef]
- Asada, T.; Koi, Y.; Arakawa, R.; Zhu, F.; Sadaoka, M.; Tamura, H. Isolation Techniques for Anthocyanidin 3,5-Diglucosides and Their Related Chemicals Using Supramolecules Technique, and Two Solid-Phase Extraction Cartridges. J. Chromatogr. A 2014, 1351, 21–28. [Google Scholar] [CrossRef]
- Lee, C.; Yang, W.; Parr, R.G. Development of the Colle-Salvetti Correlation-Energy Formula into a Functional of the Electron Density. Phys. Rev. B Condens. Matter. 1988, 37, 785–789. [Google Scholar] [CrossRef]
- Miehlich, B.; Savin, A.; Stoll, H.; Preuss, H. Results Obtained with the Correlation Energy Density Functionals of Becke and Lee, Yang and Parr. Chem. Phys. Lett. 1989, 157, 200–206. [Google Scholar] [CrossRef]
- Becke, A.D. Density-Functional Exchange-Energy Approximation with Correct Asymptotic Behavior. Phys. Rev. A 1988, 38, 3098–3100. [Google Scholar] [CrossRef]
- Becke, A.D. A New Mixing of Hartree–Fock and Local Density-functional Theories. J. Chem. Phys. 1993, 98, 1372–1377. [Google Scholar] [CrossRef]
- Petersson, G.A.; Bennett, A.; Tensfeldt, T.G.; Al-Laham, M.A.; Shirley, W.A.; Mantzaris, J. A Complete Basis Set Model Chemistry. I. The Total Energies of Closed-Shell Atoms and Hydrides of the First-Row Elements. J. Chem. Phys. 1988, 89, 2193–2218. [Google Scholar] [CrossRef]
- Machado, N.F.; Batista de Carvalho, L.A.; Otero, J.C.; Marques, M.P. A Conformational Study of Hydroxyflavones by Vibrational Spectroscopy Coupled to DFT Calculations. Spectrochim. Acta A 2013, 109, 116–124. [Google Scholar] [CrossRef] [Green Version]


| Flower | HPLC-ESI-MS (m/z) | Anthocyanin | Ref. | Molecular Structure |
|---|---|---|---|---|
Agapanthus | [M]+ 1597 [M-H]− 1596 | (6” ‘-O-(Delphinidin 3-O-(6”-O-p-coumaroylglucoside) 7-O-glucosyl)) (6” “-O-(kaempferol 3-O-glucoside, 7-O-xyloside, 4’-O-glucosyl)) succinate | [35] |  |
Anemone coronaria | (1) [M]+ 1289 [M-2H]− 1287 (2) [M]+ 1375 [M-2H]− 1373 (3) [M]+ 1507 [M-2H]− 1505 (4) [M]+ 1491 [M-2H]− 1489 (5) [M]+ 1331 [M-2H]− 1329 | (1) Delphinidin 3-[2-(2-(caffeoyl)glucosyl)galactoside]-7-[6-(caffeoyl)glucoside]-3’-[glucuronide] (2) Delphinidin 3-[2-(2-(caffeoyl) glucosyl)-6-(malonyl)galactoside]-7-[6-(caffeoyl)glucoside]-3’-[glucuronide] (3) Delphinidin 3-[2-(2-(caffeoyl)glucosyl)-6-(2-(tartaryl)malonyl)galactoside]-7-[6-(caffeoyl)glucoside]-3’-[glucuronide] (4) Delphinidin 3-[2-(2-(caffeoyl)glucosyl)-6-(2-(tartaryl)malonyl)galactoside]-7-[6-(caffeoyl)glucoside] (5) Cyanidin 3-[2-(2-(caffeoyl) glucosyl)-6-(2-(tartaryl)malonyl) galactoside]-7-[6-(caffeoyl) glucoside]-3’-[glucuronide] | [36] |  |
Campanula portenschlagia-na | [M]+ 1175 [M-2H]− 1173 | Violdelphin [7-O-(6-O-(4-O-(6-O-(4-hydroxybenzoyl)glucosyl)-oxybenzoyl)glucosyl)-3-O-(6-O rhamnosyl-glucosyl)delphinidin | [37,48] |  |
Ceratostigma plumbaginoides | [M]+ 493 [M-2H+H2O]− 509 | Europinidin-3-galactoside | [44] |  |
Cineraria (Senecio cruentus) | [M+H]+ 1523 [M-H]− 1521 | Cinerarin [3-O- (6-O-malonylglucosyl)-7-O-(6-O-(4-O-(6-O-caffeoylglucosyl)caffeoyl)glucosyl-3’-O-(6-O-caffeoylglucosyl)delphinidin] | [38] |  |
Commelina communis | [M]+ 859 [M-2H+H2O]− 875 | Malonylawobanin [3-O- (6-O- (trans-p-coumaroyl)glucosyl) -5-O- (6-O-malonylglucosyl) delphinidin] | [49] |  |
Lobelia erinus | (1) [M]+ 1567 [M-2H]− 1565 (2) [M]+ 1653 [M-2H]− 1651 (3) [M]+ 1667 [M-2H]− 1665 | (1) Demalonyllobelinin A [3-O-(6-O-(4-O-(p-coumaroyl)rhamnosyl) glucosyl)-5-O-glucosyl- 3’,5’ -di-O-(6-O-(caffeoyl)glucosyl) delphinidin] (2) Lobelinin A [3-O-(6-O-(4-O-(p-coumaroyl)rhamnosyl) glucosyl)-5-O-(6-O-(malonyl)glucosyl- 3’,5’ -di-O-(6-O-(caffeoyl)glucosyl) delphinidin] (3) Lobelinin B [3-O-(6-O-(4-O-(p-coumaroyl)rhamnosyl) glucosyl)-5-O-(6-O)-malonyl)glucosyl- 3’-O-(6-O-(caffeoyl)glucosyl)- 5’-O-(6-O-(feruloyl)glucosyl) delphinidin] | [18] |  |
Platycodon | (1) [M]+ 1421 [M-2H]− 1419 (2) [M]+ 1405 [M-2H]2- 1403 | (1) Platyconin [3-O-(6-O- (rhamnosyl)-glucosyl) -7-O-(6-O-(4-O-(6-O- (4-O-(glucosyl)- caffeoyl)glucosyl)caffeoyl)glucosyl) delphinidin] (2) 3-O-(6-O-rhamnosyl-glucosyl)-7-O-(6-O-(4-O- (6-O-(4-O-glucosyl-p-coumaroyl)glucosyl caffeoyl)glucosyl) delphinidin | [39,40] |  |
Plumbago capensis | [M]+ 505 [M-2H+H2O]− 521 | 3-O-rhamnosyl-5,7-di-O-methylmalvidin | [45] |  |
Salvia farinacea | (1) [M]+ 859 [M-2H+H2O]− 875 (2) [M]+ 887 [M-2H+H2O]− 903 | (1) Malonylawobanin (see Commelina communis) (2) Salviamalvin [3-O-(6-O-p-coumaroylglucosyl)-5-O-(6-O-malonylglucosyl) malvidin] | [41] |  |
Salvia patens | [M]+ 859 [M-2H+H2O]− 875 | Malonylawobanin (see Commelina communis) | [43] | |
Viola tricolor | (1) [M]+ 919 [M-2H+H2O]− 935 | (1,2) Violanin [3-O-(6-O-(p-coumaroyl rhamnosyl)glucosyl)-5-O-glucosyldelphinidin] | [42] |  |
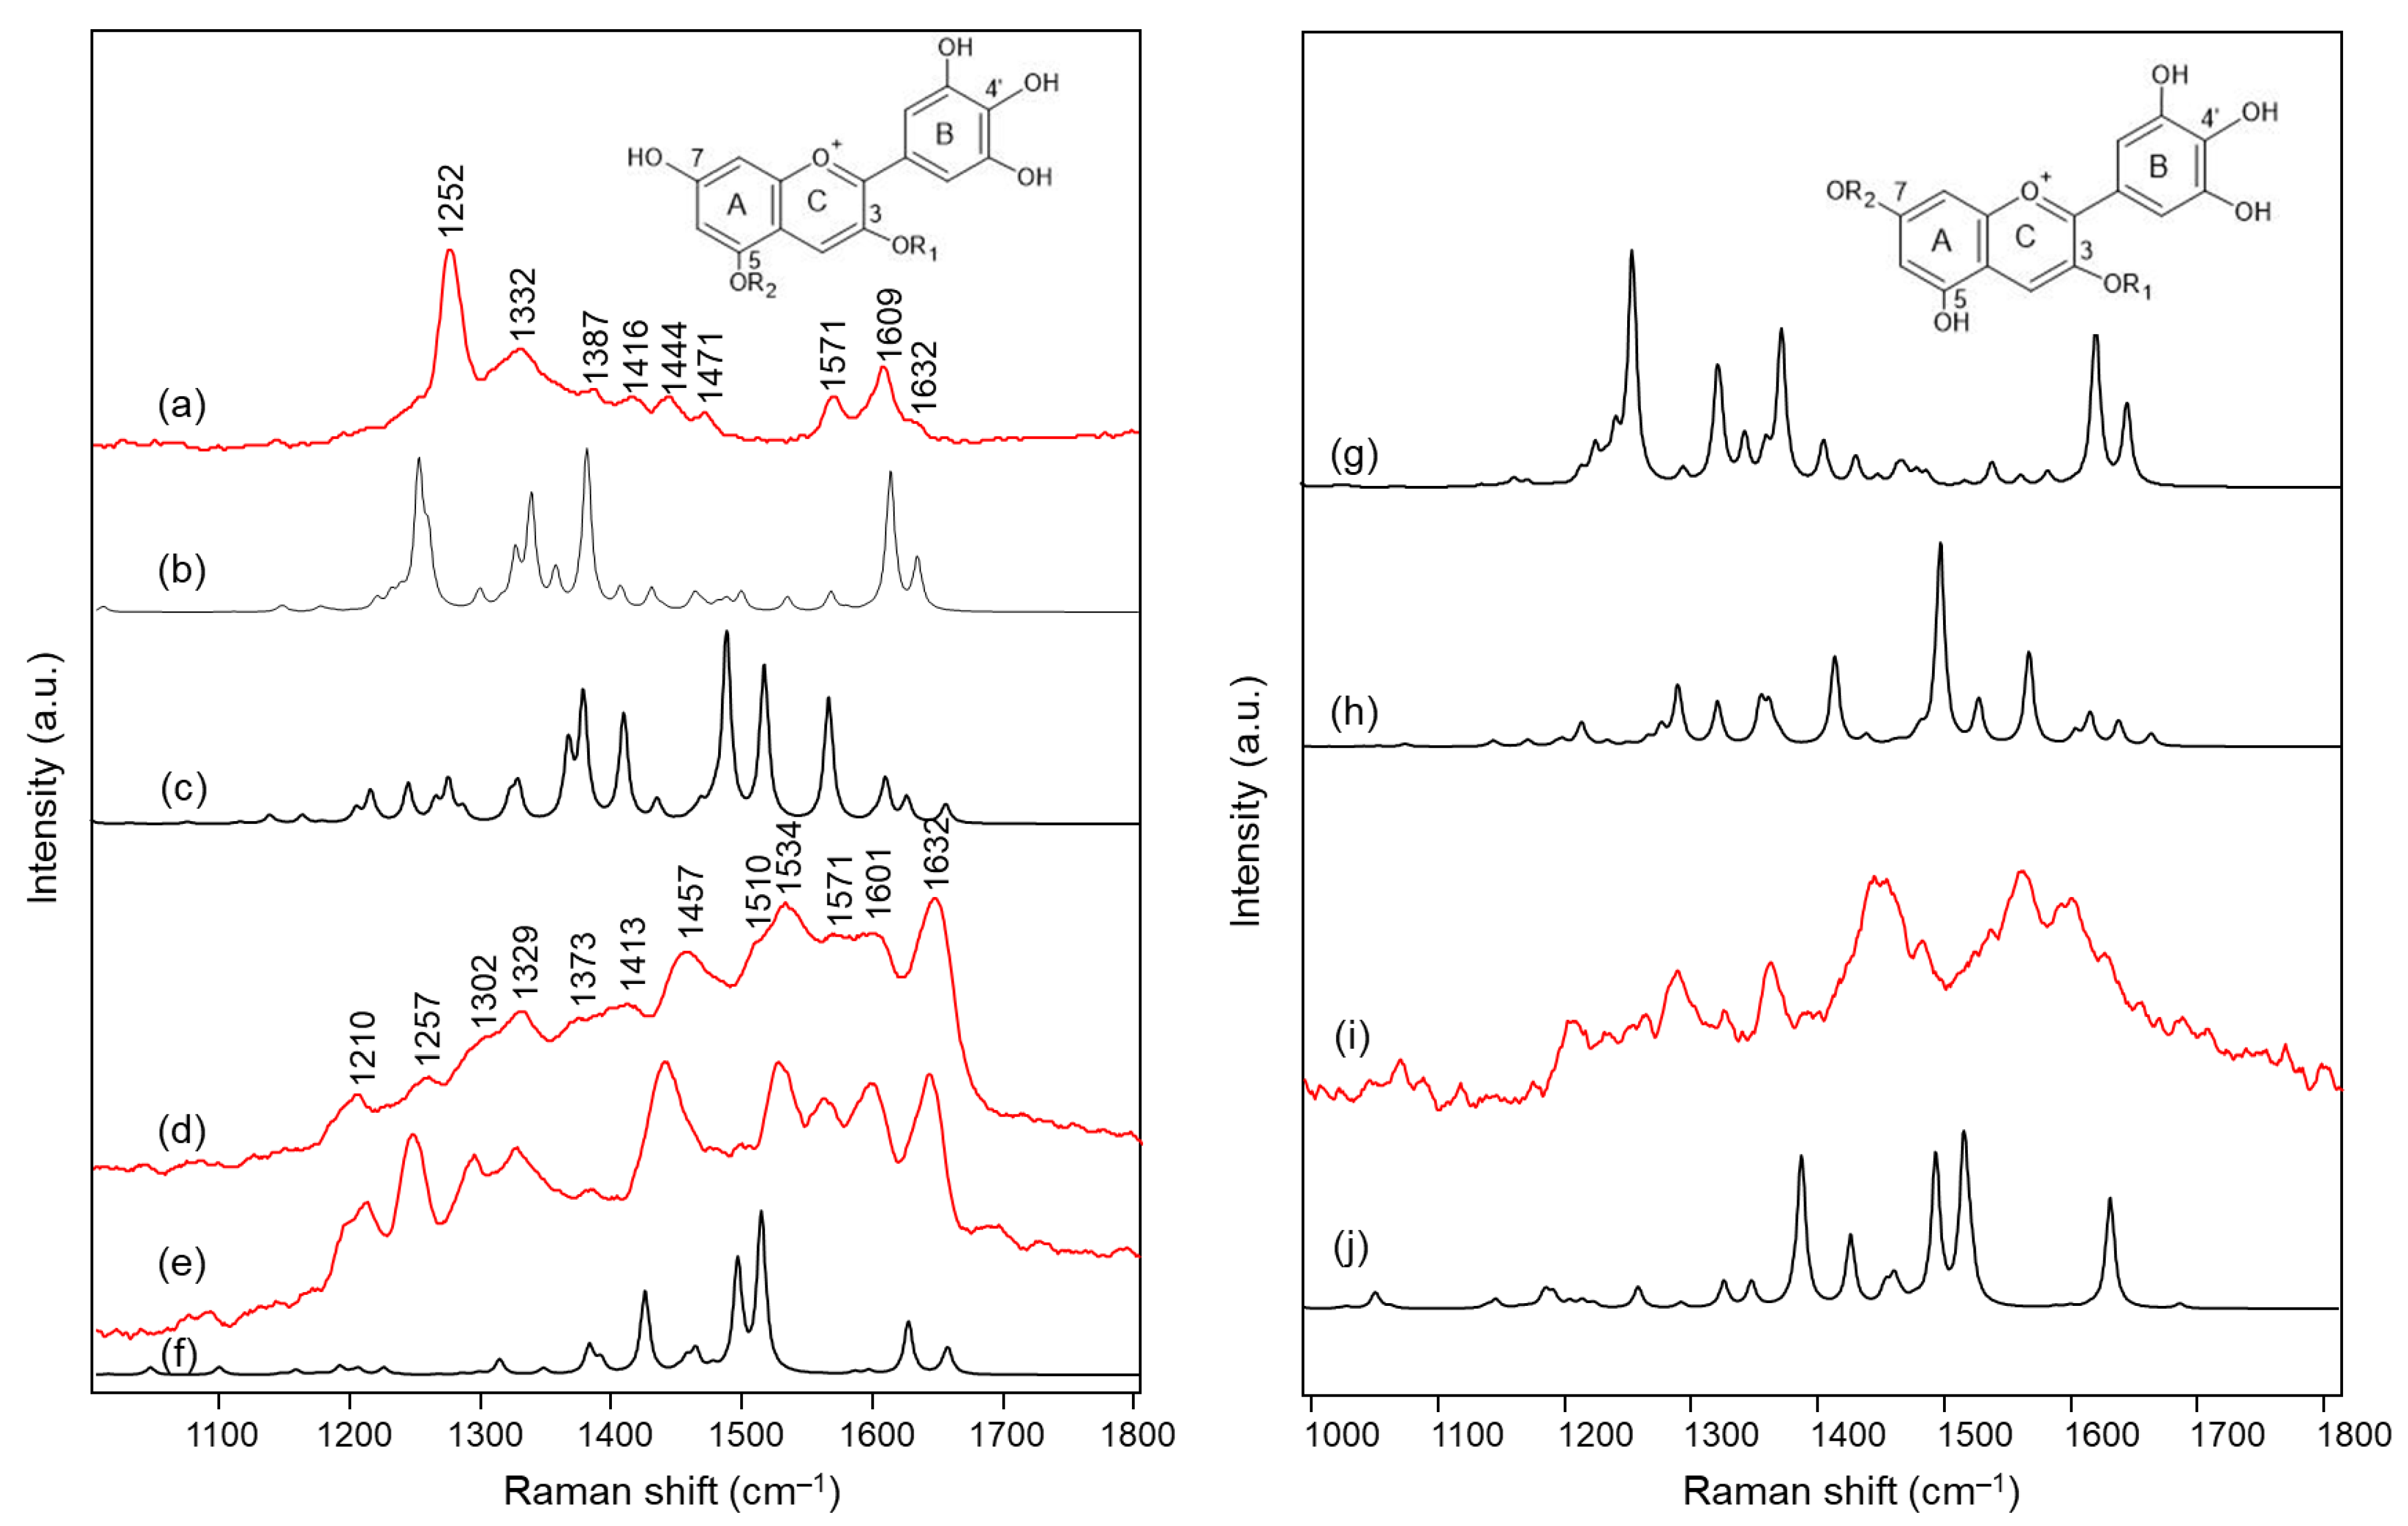
| Delphinidin 3,5-di-O- methyl AH+ Form | Delphinidin 3,5- diglucoside Chloride | Delphinidin 3,5-di-O- methyl 4’-quinonoidal A Form | Delphinidin 3,5-di- glucoside | Lobelia | Viola tricolor | Salvia farinacea | Malonyl-Awobanin | Assignment |
|---|---|---|---|---|---|---|---|---|
| Calc. | Exp. | Calc. | Exp. | Exp. | Exp. | Exp. | Exp. | |
| FT-Raman (solid) | RR (aqueous solution pH 4) | RR | RR | RR | RR (aqueous solution pH 4) | |||
| 1638 | 1632 | - | - | - | - | - | - | ν(C=C) benzopyrilium |
| - | - | 1630 (+1613) | 1650 | 1648 | 1641 | 1651 | 1640 | ν(C=C) benzopyrilium + ν(C=O) |
| 1618 | 1609 | - | - | - | - | - | ν(C=C) B ring | |
| 1571 | 1571 | 1569 | 1601 | 1601 | 1602 | 1603 | 1603 | ν(C=C) B ring + δ(C‒H) benzopyrilium |
| - | - | 1520 | 1571 | 1568 | 1559 | 1565 | 1563 | ν(C=C) benzopyrilium, B ring and inter-ring |
| - | - | 1491 | 1534 | 1529 | - | 1529 | 1522 | ν(C=C) benzopyrilium, B ring and inter-ring, δ(C‒OH) B ring |
| - | - | 1470 | 1510 | 1497 | 1506 | 1509 | 1505 | δ(C‒H) benzopyrilium and B ring |
| 1465 | 1471 | - | - | - | - | - | - | δ(C‒H) aliphatic |
| 1437 | 1457 | 1446 | 1447 | 1450 | 1445 | δ(C‒H) A ring | ||
| 1432 | 1444 | - | - | - | - | - | - | δ(C‒H) benzopyrilium |
| - | - | 1412 | - | - | 1462 | 1457 | 1457 | ν(C=C) benzopyrilium + δ(C‒H) and δ(O‒H) B ring |
| 1408 | 1416 | - | - | - | - | - | - | δ(C‒OH) B ring |
| 1381 | 1387 | - | - | - | - | δ(C=C‒C) + δ(C‒OH) | ||
| 1380 | - | - | - | - | - | δ(C‒OH) A and B rings | ||
| 1357 | - | - | - | - | - | - | - | δ(C‒H) C ring + δ(C‒OH) B ring |
| - | - | 1368 | 1413 | - | 1410 | - | - | breathing A ring + δ inter-ring with B ring |
| 1338 | 1332 | - | - | - | - | - | - | δ(C=C‒C) + δ(C‒O‒H) B ring |
| - | - | 1330 | 1373 | 1386 | 1372 | 1379 | - | δ(C=C‒C) + δ(C‒O‒H) A ring |
| - | - | 1276 | 1329 | 1325 | 1327 | 1324 | 1331 | δ(C‒H) + δ(C‒OH) B ring |
| - | - | 1266 | 1302 | 1297 | 1303 | 1298 | 1303 | δ(C‒H) + δ(C‒OH) A ring and B ring |
| 1251 | 1275 | - | - | - | δ(C‒O‒H) + ν(C‒O) benzopyrilium | |||
| - | - | 1245 | 1257 | 1243 | 1258 | 1255 | 1257 | δ(C‒H) benzopyrilium |
| - | - | 1216 | - | - | - | - | - | δ(C‒H) + δ(O‒H) benzopyrilium and B ring |
| - | - | 1205 | 1210 | 1202 | 1197 | 1199 | 1209 | δ(C‒H) + δ(O‒H) A ring |
| Delphinidin 3,7-di-O- methyl 4’-quinonoidal A Form | Agapanthus | Anemone | Campanula | Cineraria | Platycodon | Assignment |
|---|---|---|---|---|---|---|
| Calc. | Exp. | Exp. | Exp. | Exp. | Exp. | |
| RR | RR | RR | RR | RR | ||
| 1612 | 1628 | 1632 | 1628 | 1626 | 1632 | ν(C=C) + ν(C=O) benzopyrilium |
| 1564 | 1601 | 1600 | 1605 | 1603 | 1605 | ν(C=C) benzopyrilium + ν(C=O) + ν(C=C) + ν B ring |
| 1525 | 1561 | 1562 | 1560 | 1562 | 1559 | ν(C=C) B ring + ν(C=C) benzopyrilium |
| 1495 | - | - | - | - | - | δ(C‒OH) and δ(C‒H) B ring + ν(C=C) benzopyrilium and inter-ring |
| 1413 | 1465 | 1453 | 1463 | 1454 | 1462 | breathing benzopyrilium + δ(C‒OH) B ring |
| - | 1418 | - | - | - | - | |
| 1362 | 1360 | 1371 | 1366 | 1363 | 1361 | ν(C=C) benzopyrilium and B ring + δ(C‒H) |
| 1355 | - | - | - | - | - | ν(C‒OH) A ring |
| 1322 | - | - | - | - | - | breathing A ring + δ inter-ring with B ring |
| 1291 | 1294 | 1293 | 1298 | 1292 | 1290 | ν(C=C) + δ(C‒H) and δ(O‒H) A ring |
| 1215 | 1205 | 1219 | 1216 | 1211 | 1208 | δ(C‒H) rings |
Disclaimer/Publisher’s Note: The statements, opinions and data contained in all publications are solely those of the individual author(s) and contributor(s) and not of MDPI and/or the editor(s). MDPI and/or the editor(s) disclaim responsibility for any injury to people or property resulting from any ideas, methods, instructions or products referred to in the content. |
© 2023 by the authors. Licensee MDPI, Basel, Switzerland. This article is an open access article distributed under the terms and conditions of the Creative Commons Attribution (CC BY) license (https://creativecommons.org/licenses/by/4.0/).
Share and Cite
Bruni, S.; Longoni, M.; Minzoni, C.; Basili, M.; Zocca, I.; Pieraccini, S.; Sironi, M. Resonance Raman and Visible Micro-Spectroscopy for the In-Vivo and In-Vitro Characterization of Anthocyanin-Based Pigments in Blue and Violet Flowers: A Comparison with HPLC-ESI- MS Analysis of the Extracts. Molecules 2023, 28, 1709. https://doi.org/10.3390/molecules28041709
Bruni S, Longoni M, Minzoni C, Basili M, Zocca I, Pieraccini S, Sironi M. Resonance Raman and Visible Micro-Spectroscopy for the In-Vivo and In-Vitro Characterization of Anthocyanin-Based Pigments in Blue and Violet Flowers: A Comparison with HPLC-ESI- MS Analysis of the Extracts. Molecules. 2023; 28(4):1709. https://doi.org/10.3390/molecules28041709
Chicago/Turabian StyleBruni, Silvia, Margherita Longoni, Camilla Minzoni, Martina Basili, Ilaria Zocca, Stefano Pieraccini, and Maurizio Sironi. 2023. "Resonance Raman and Visible Micro-Spectroscopy for the In-Vivo and In-Vitro Characterization of Anthocyanin-Based Pigments in Blue and Violet Flowers: A Comparison with HPLC-ESI- MS Analysis of the Extracts" Molecules 28, no. 4: 1709. https://doi.org/10.3390/molecules28041709