

Fabrication and Evaluation of Polyvinyl Alcohol/Corn Starch/Patchouli Oil Hydrogel Films Loaded with Silver Nanoparticles Biosynthesized in Pogostemon cablin Benth Leaves’ Extract


Abstract
:1. Introduction
2. Results
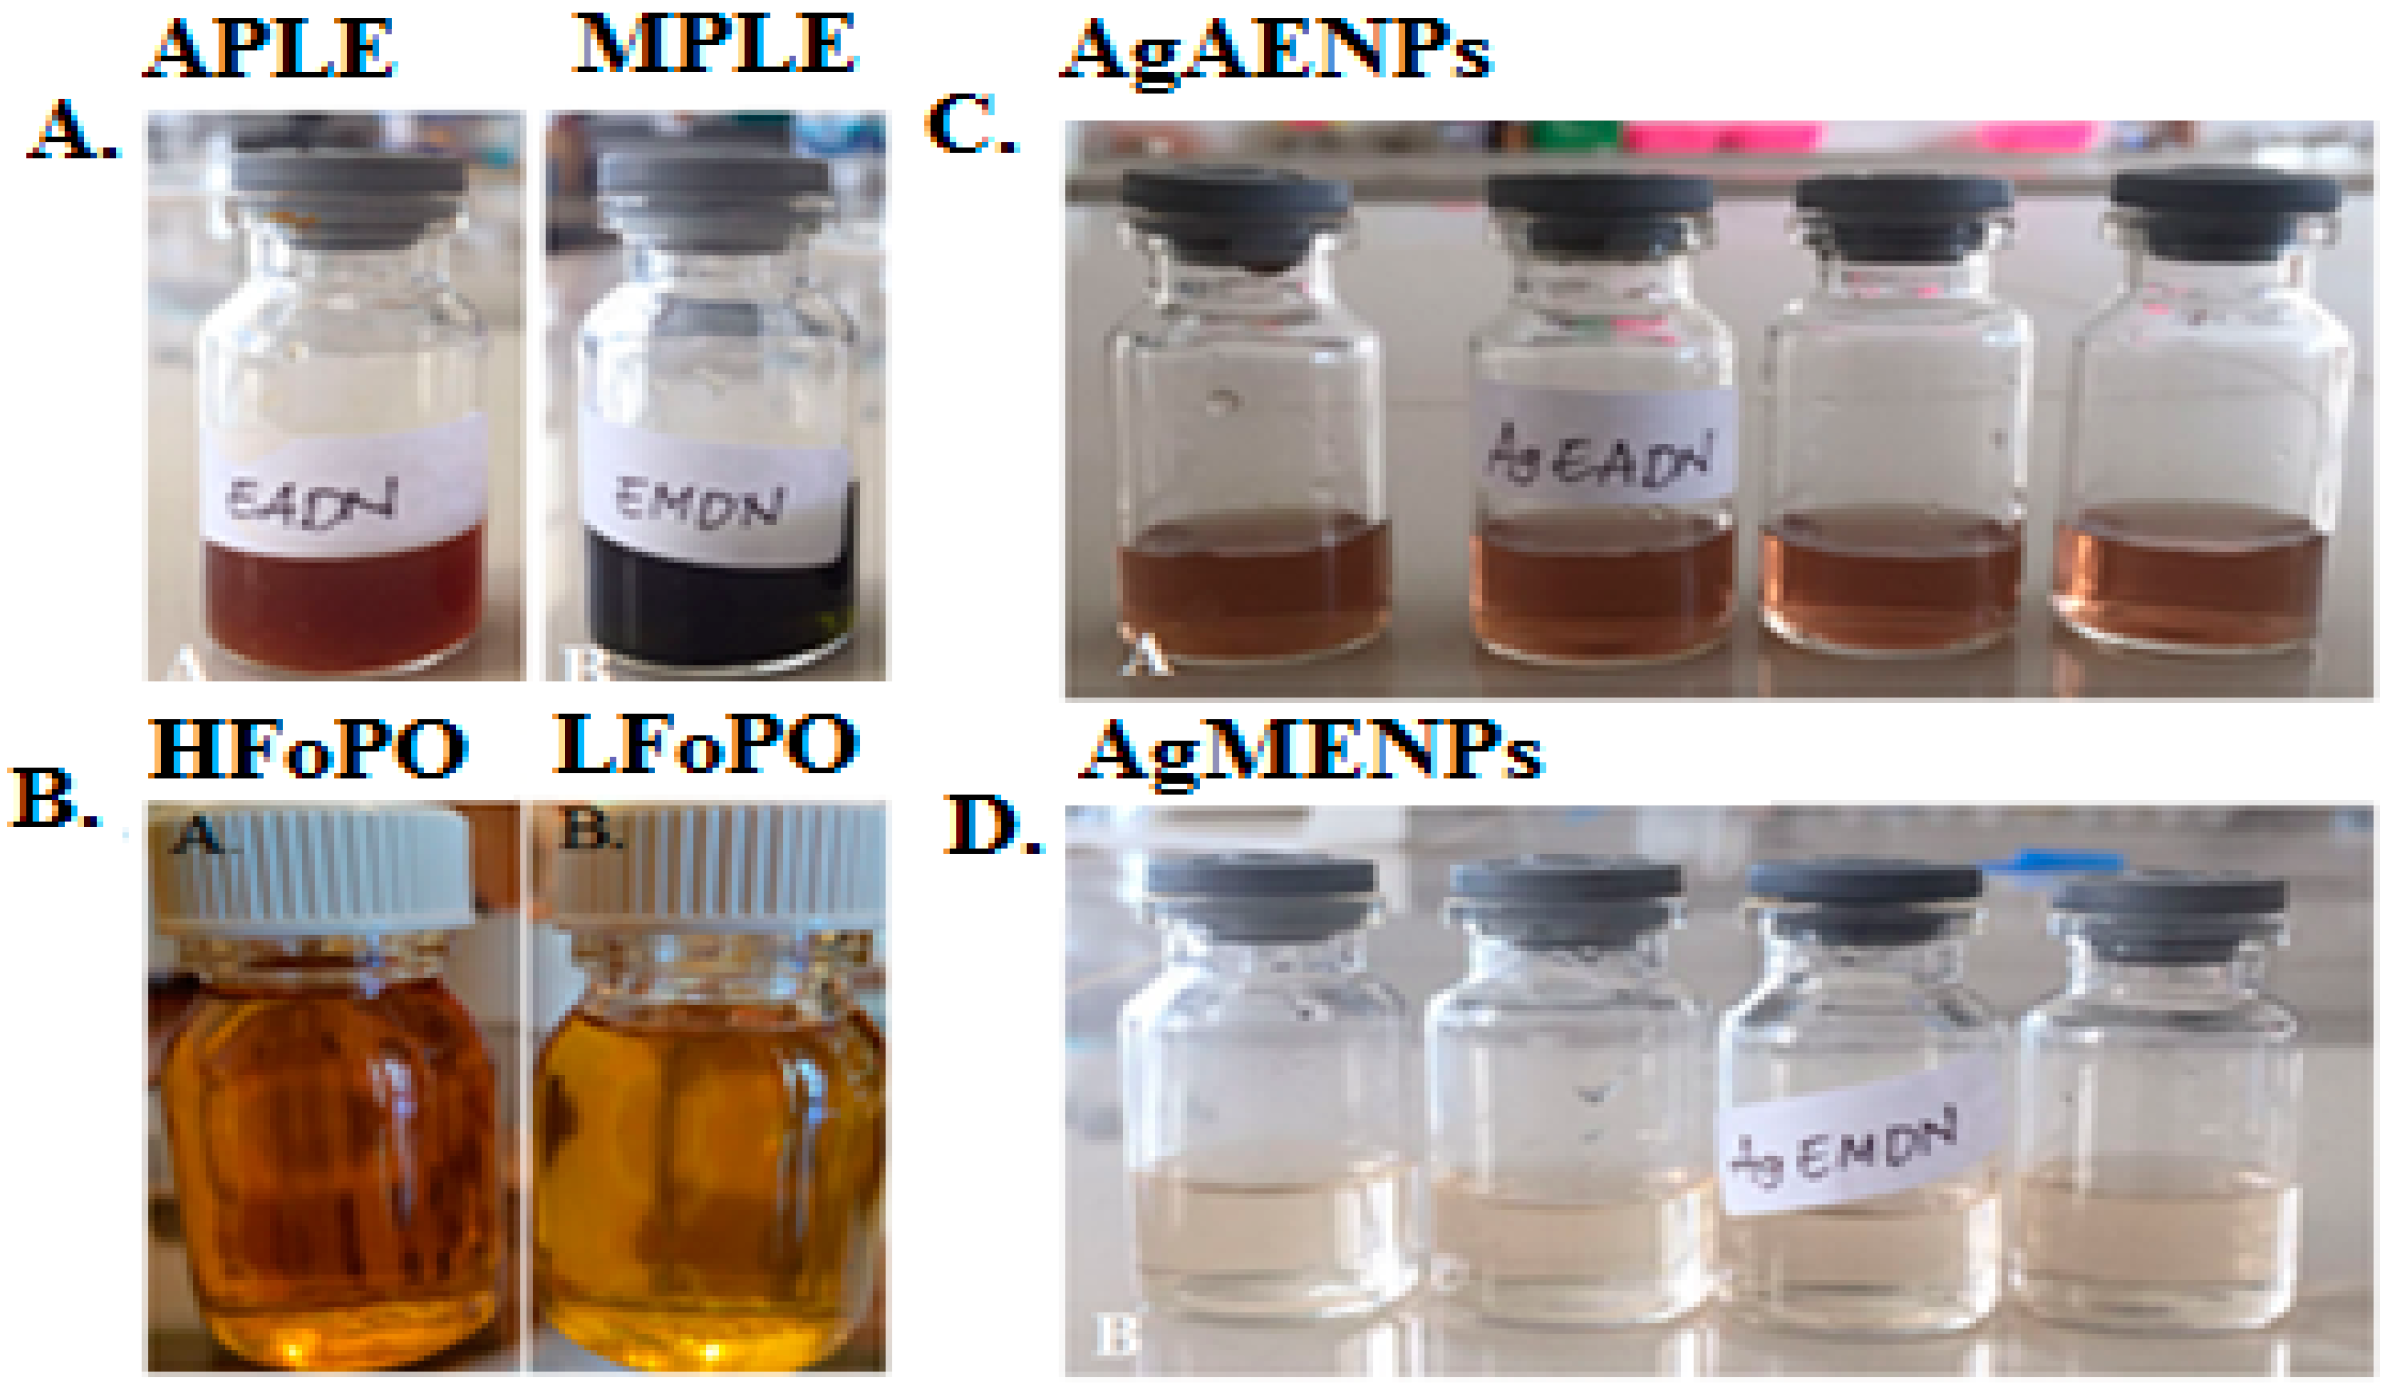
2.1. Patchouli Leaf Extract
2.1.1. FT-IR Analysis of Aqueous Patchouli Leaf Extract (APPLE) and Methanolic Patchouli Leaf Extract (MPLE)
2.1.2. GC-MS Analysis of Aqueous Patchouli Leaves Extract (APLE) and Methanolic Patchouli Leaves Extract (MPLE)
2.2. Patchouli Oil Fractionations
GC-MS LFoPO and HFoPO Analysis
2.3. Green Synthesis Silver Nanoparticles
2.3.1. UV-Vis Spectroscopy Analysis
2.3.2. FT-IR Analysis of AgAENPs and AgMENPs
2.3.3. XRD Analysis
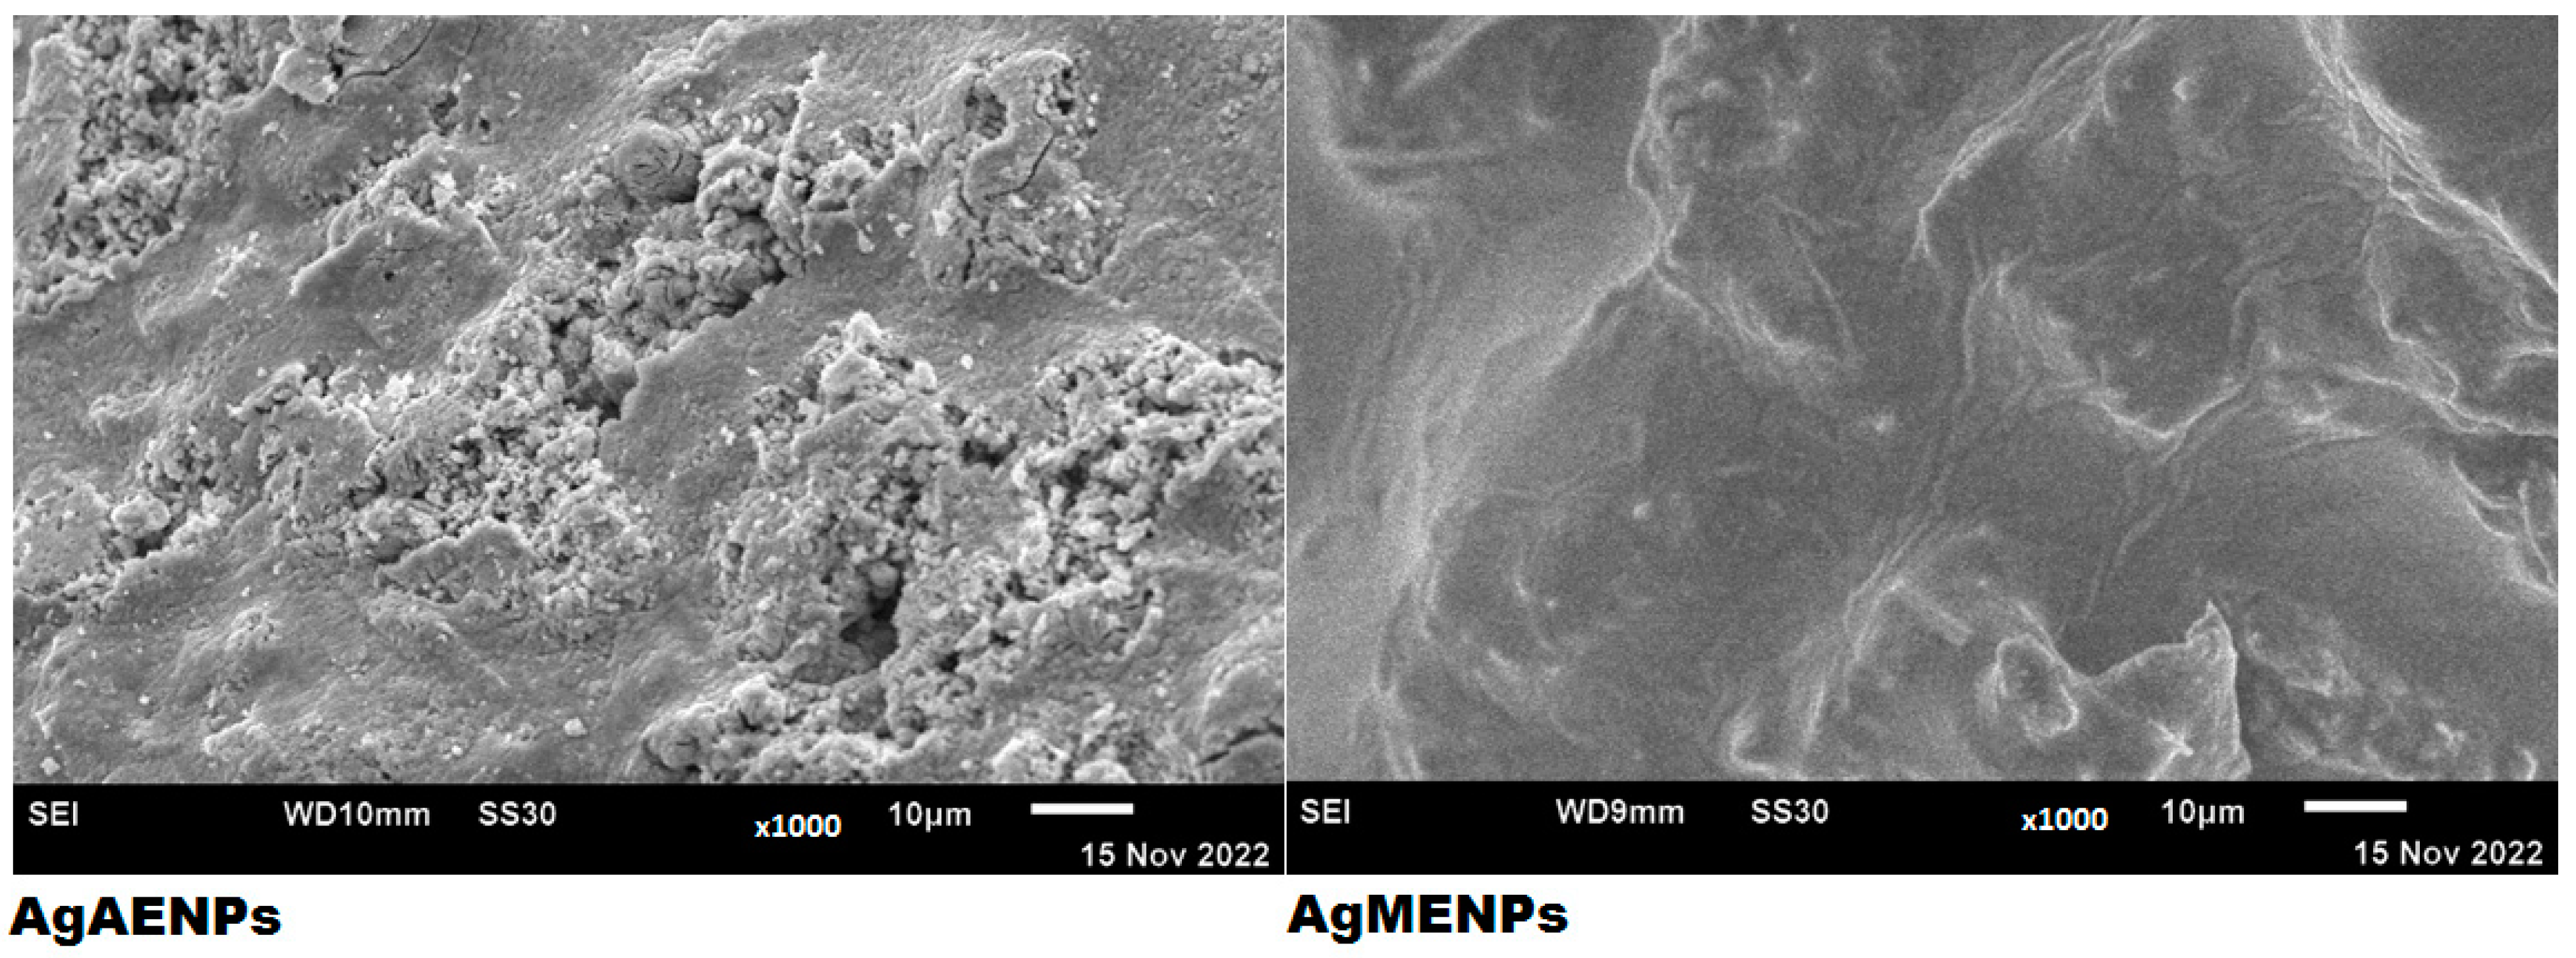
2.3.4. SEM Analysis
2.4. Polyvinyl Alcohol/Corn Starch/Patchouli Oil Hydrogel Films Loaded with Silver Nanoparticles (PVA/CS/PO/AgNPs)
2.4.1. Organoleptic Assay
2.4.2. pH and Spreadability
2.4.3. Gel Fraction and Swelling Index Test
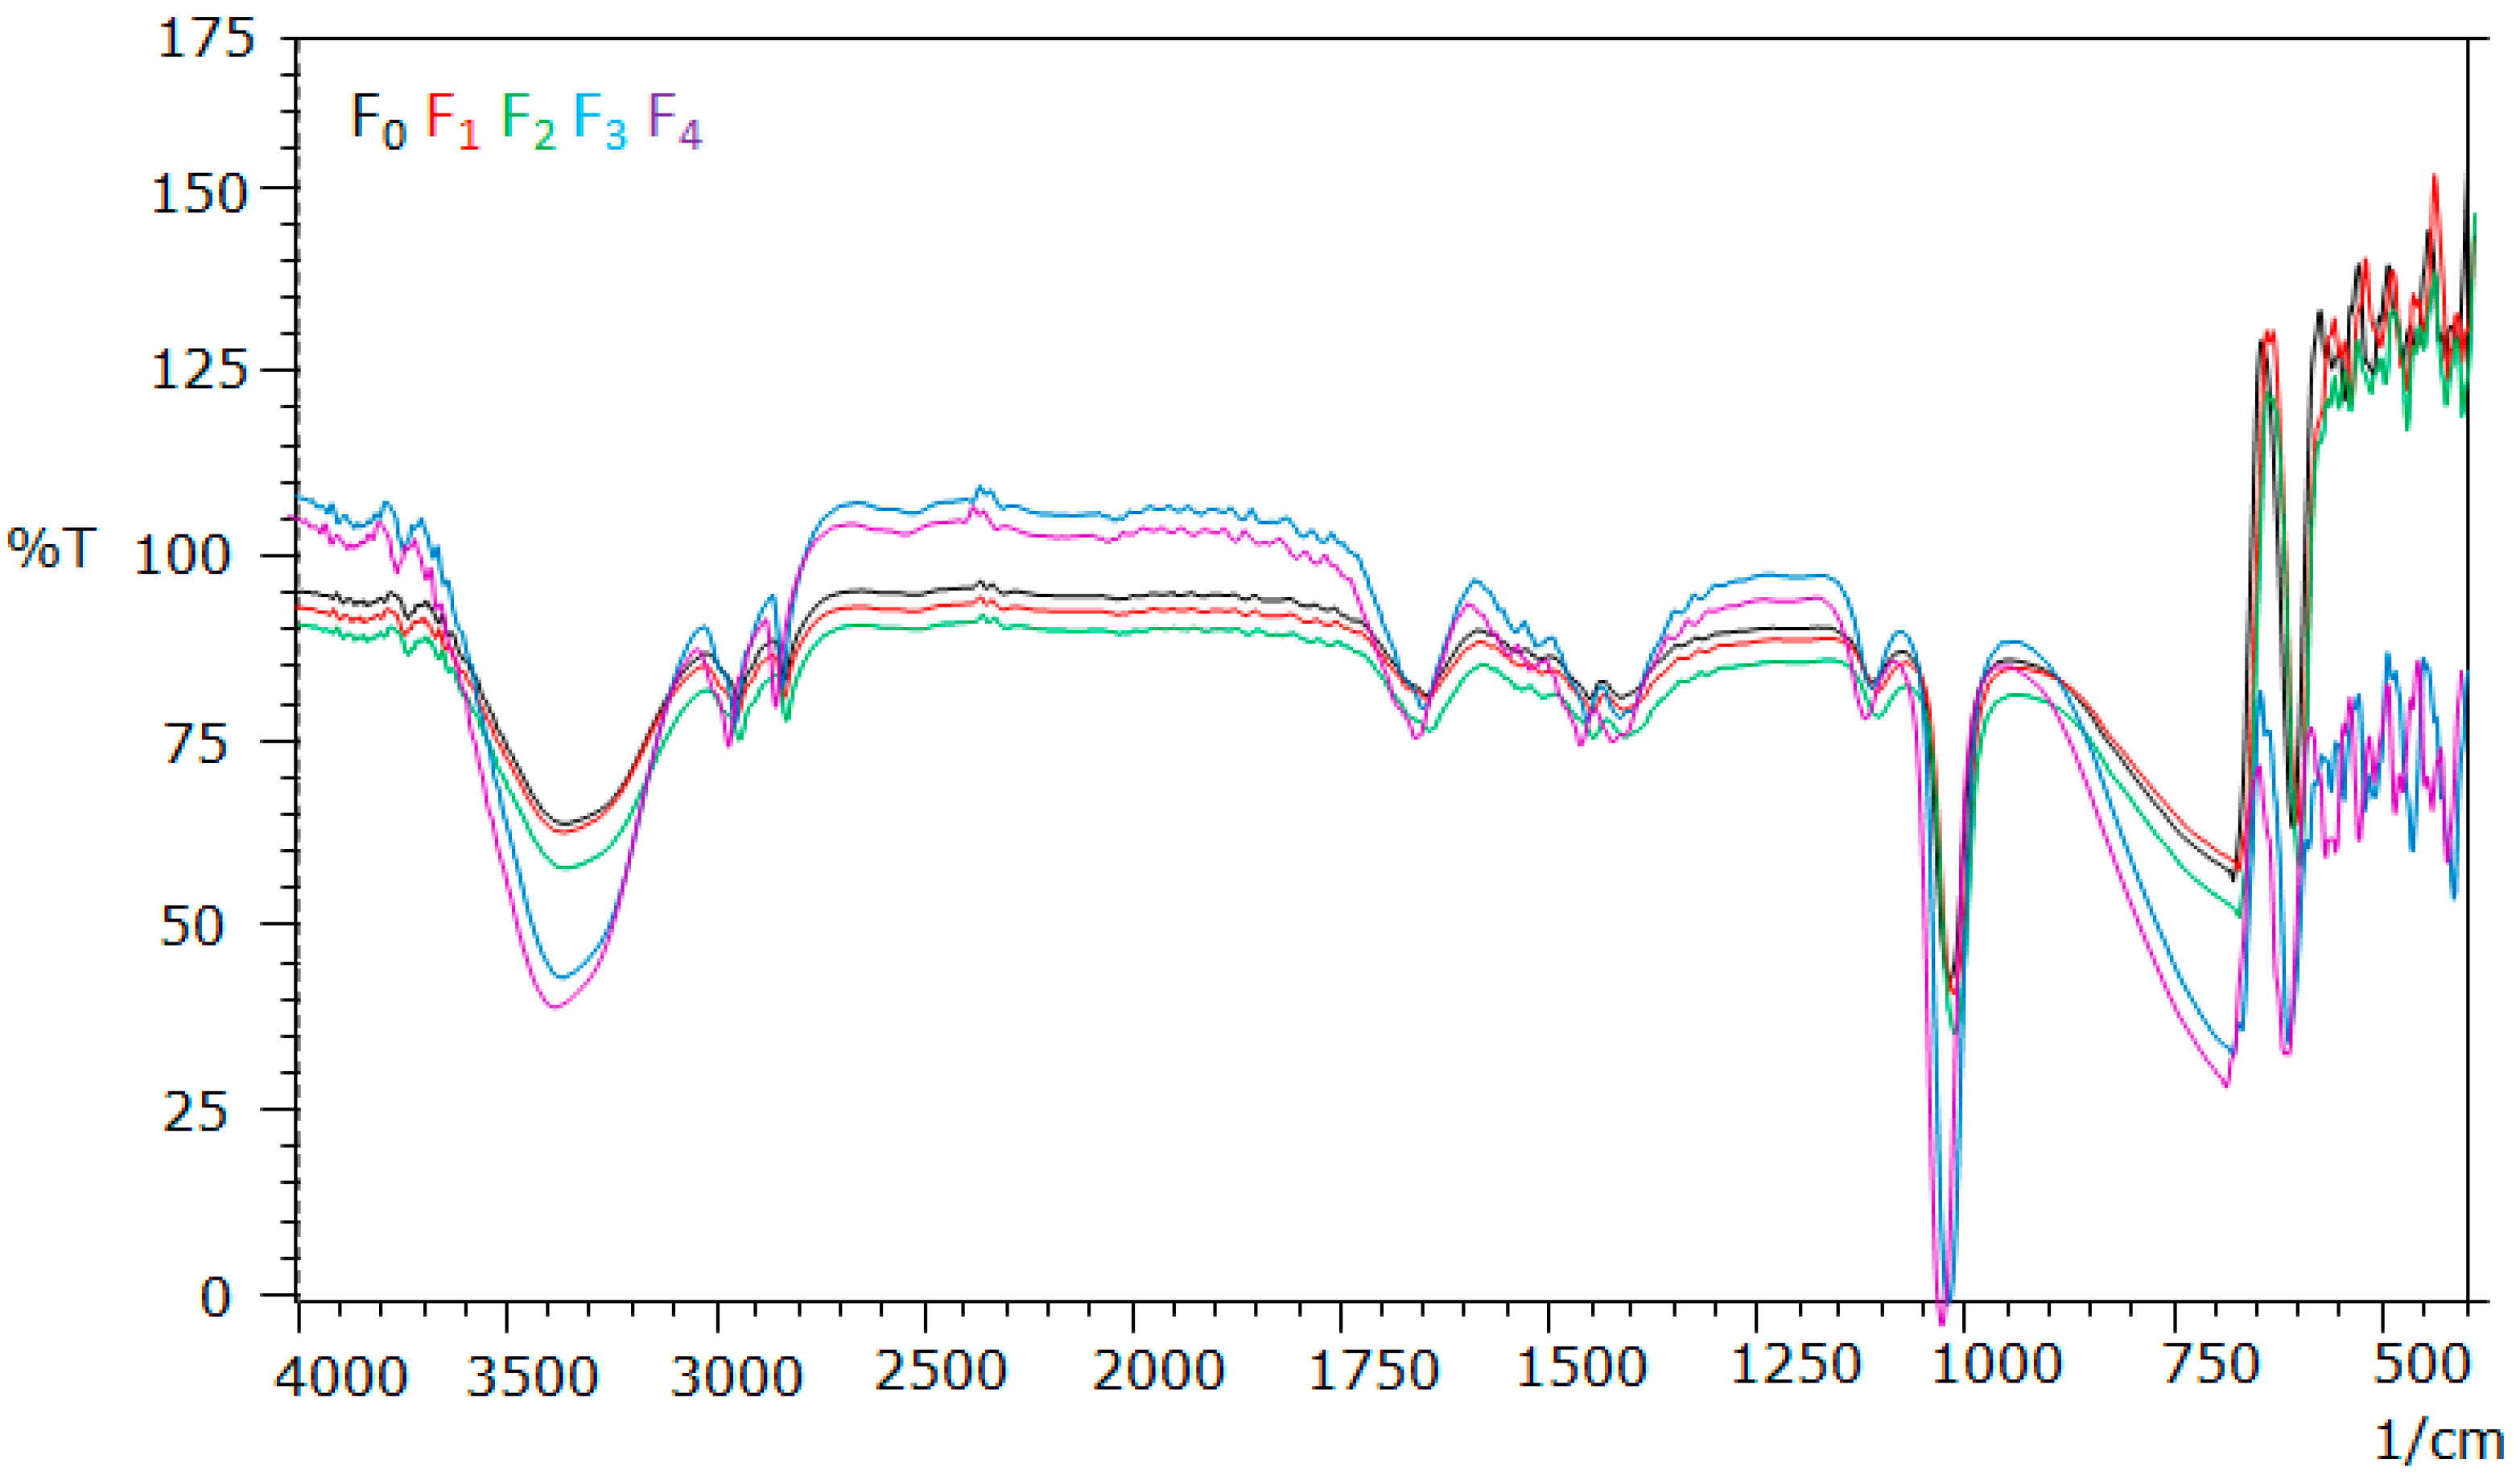
2.4.4. FT-IR Analysis
2.4.5. SEM Analysis
2.4.6. TGA and DTA Analysis
2.4.7. Antimicrobial Activity
3. Discussion
3.1. Phytochemistry Screening of Pogostemon cablin Benth
3.2. Patchouli Oil
3.3. Green Synthesis Silver Nanoparticle
Characterization of Silver Nanoparticles (AgAENPs and AgMENPs)
3.4. Polyvinyl Alcohol/Corn Starch/Patchouli Oil Hydrogel Films Loaded with Silver Nanoparticles (PVA/CS/PO/AgNPs)
4. Materials and Methods
4.1. Materials
4.2. Preparation of Patchouli Leaf Extract
4.2.1. Aqueous Patchouli Leaves Extract (APLE)
4.2.2. Methanolic Patchouli Leave Extract (MPLE)
4.2.3. Phytochemicals Aqueous Patchouli Leave Extract (APLE) and Methanolic Patchouli Leaves Extract (MPLE) Screening
4.3. Preparation of Light Fraction Patchouli Oil and Heavy Fraction Patchouli Oil
4.3.1. FT-IR Analysis
4.3.2. GC-MS Analysis
4.4. Green Synthesis Silver Nanoparticles Using Patchouli Leaf Extract
4.4.1. UV-Vi Spectrophotometer Analysis
4.4.2. FT-IR Analysis
4.4.3. XRD Analysis
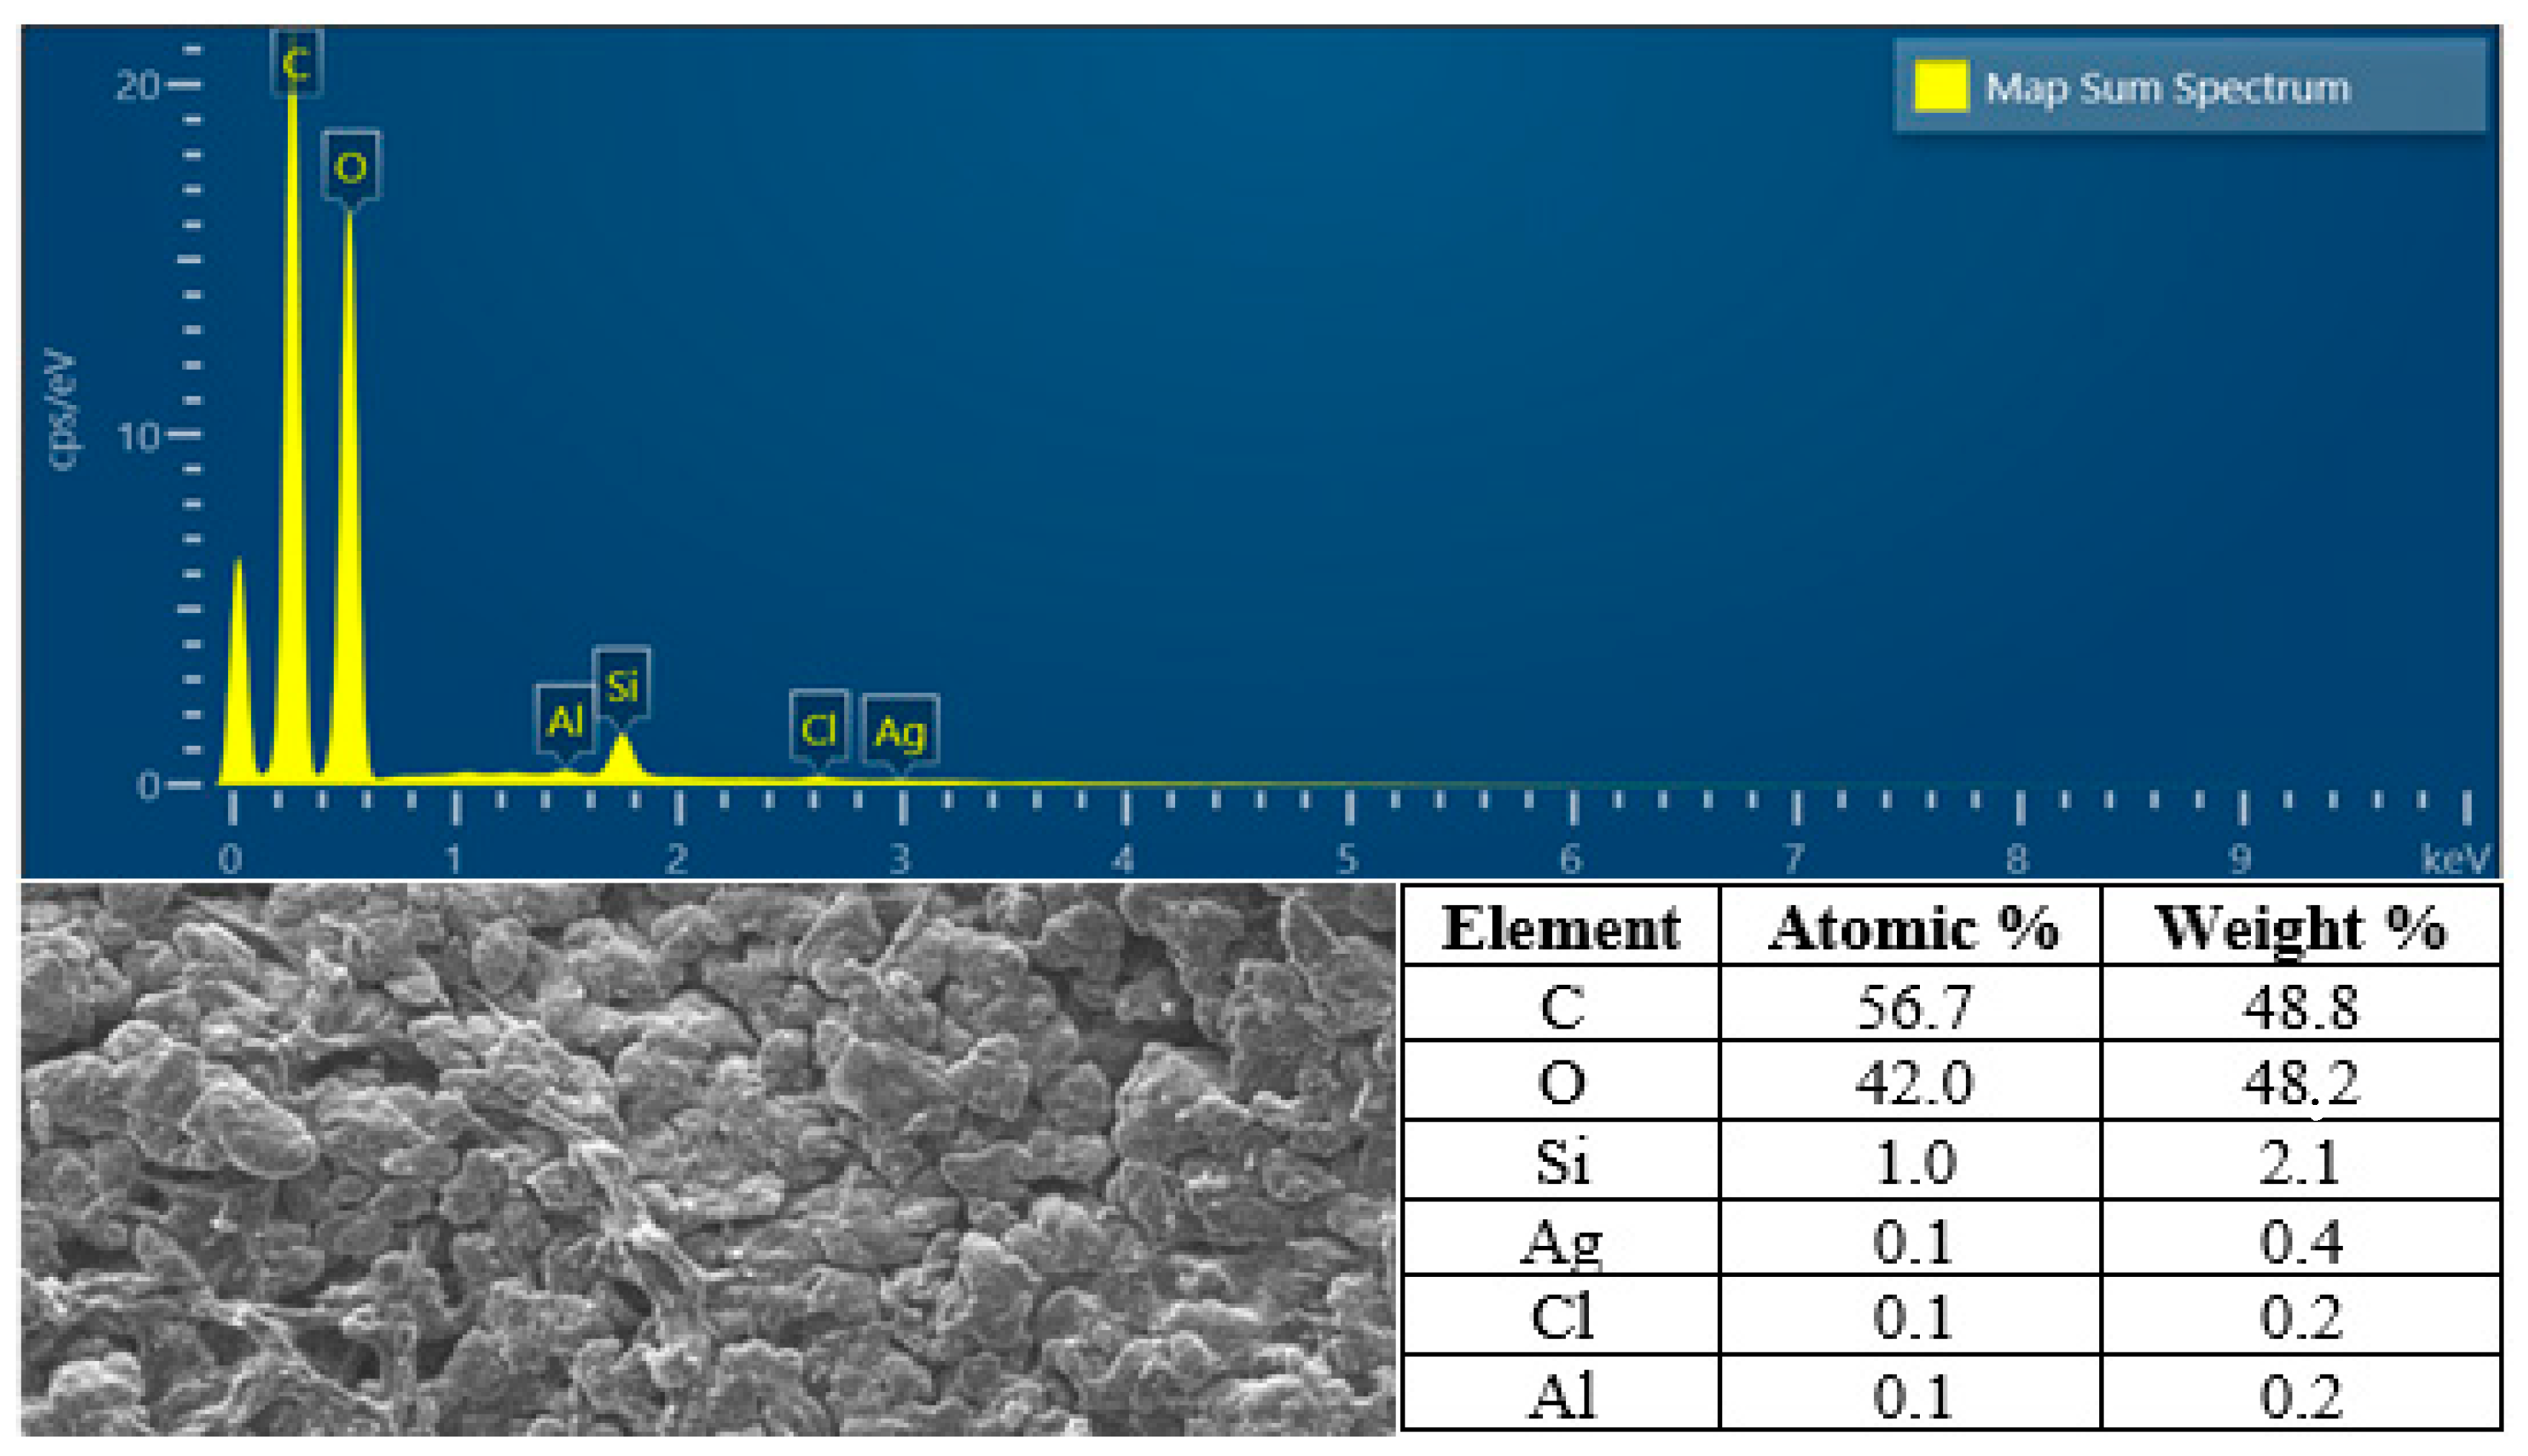
4.4.4. SEM-EDX Analysis
4.5. Polyvinyl Alcohol/Corn Starch/Patchouli Oil Hydrogel Films loaded with Silver Nanoparticles (PVA/CS/PO/AgNPs)
4.6. Evaluation of Hydrogel Film Preparations
4.6.1. Fraction Gel
4.6.2. Swelling Index
4.6.3. pH Test
4.6.4. Spreadability Test
4.7. Characterization of Hydrogels
4.7.1. FT-IR Analysis
4.7.2. SEM Analysis
4.7.3. TGA and DTA Analysis
4.7.4. Antibacterial Assay
5. Conclusions
Author Contributions
Funding
Institutional Review Board Statement
Informed Consent Statement
Data Availability Statement
Acknowledgments
Conflicts of Interest
Sample Availability
References
- Posangi, I.; Posangi, J.; Wuisan, J. Efek Ekstrak Daun Sirsak (Annona muricata L.) Pada Kadar Kolesterol Total Tikus Wistar. J. Biomedik JBM 2012, 4, 37–42. [Google Scholar] [CrossRef]
- Swamy, M.K.; Sinniah, U.R. Patchouli (Pogostemon cablin Benth.): Botany, Agrotechnology and Biotechnological Aspects. Ind. Crops Prod. 2016, 87, 161–176. [Google Scholar] [CrossRef]
- Ismalita; Khairan, K.; Rahmi; Muhammad, S.; Indra, I. Green Synthesis of Sulfur Nanoparticles Using Allium sativum: Its Effects on the Growth of Pogostemon cablin Benth. and the Chemical Characterization of the Patchouli Oil after Being Harvested. Nanotechnol. Environ. Eng. 2022, 7, 359–375. [Google Scholar] [CrossRef]
- Singh, A.; Peppas, N.A. Hydrogels and Scaffolds for Immunomodulation. Adv. Mater. 2014, 26, 6530–6541. [Google Scholar] [CrossRef]
- Baghaie, S.; Khorasani, M.T.; Zarrabi, A.; Moshtaghian, J. Wound Healing Properties of PVA/Starch/Chitosan Hydrogel Membranes with Nano Zinc Oxide as Antibacterial Wound Dressing Material. J. Biomater. Sci. Polym. Ed. 2017, 28, 2220–2241. [Google Scholar] [CrossRef] [PubMed]
- Takahama, U.; Ansai, T.; Hirota, S. Slow Hydrolysis of Amylose in Soluble Starch and Amylopectin in Suspendable Starch Liberated from Non-Glutinous Rice Flour Heated with a Sorghum Extract. Heliyon 2022, 8, e11605. [Google Scholar] [CrossRef]
- Mojally, M.; Sharmin, E.; Obaid, N.A.; Alhindi, Y.; Abdalla, A.N. Polyvinyl Alcohol/Corn Starch/Castor Oil Hydrogel Films, Loaded with Silver Nanoparticles Biosynthesized in Mentha piperita Leaves’ Extract. J. King Saud Univ.-Sci. 2022, 34, 101879. [Google Scholar] [CrossRef]
- Palanisamy, N.; Ferina, N.; Amirulhusni, A.; Mohd-Zain, Z.; Hussaini, J.; Ping, L.; Durairaj, R. Antibiofilm Properties of Chemically Synthesized Silver Nanoparticles Found against Pseudomonas Aeruginosa. J. Nanobiotechnol. 2014, 12, 2. [Google Scholar] [CrossRef] [Green Version]
- Kemala, P.; Idroes, R.; Khairan, K.; Tallei, T.E.; Ramli, M.; Efendi, R. Green synthesis of silver nanoparticles using Calotropis gigantea and its characterization using UV-Vis Spectroscopy. IOP Conf. Ser. Earth Environ. Sci. 2022, 951, 01209. [Google Scholar] [CrossRef]
- Mirda, E.; Idroes, R.; Khairan, K.; Tallei, T.E.; Ramli, M.; Earlia, N.; Maulana, A.; Idroes, G.M.; Muslem, M.; Jalil, Z. Synthesis of Chitosan-Silver Nanoparticle Composite Spheres and Their Antimicrobial Activities. Polymers 2021, 13, 3990. [Google Scholar] [CrossRef]
- Parmar, A.; Kapil, S.; Sachar, S.; Sharma, S. Design of Experiment Based Methodical Optimization and Green Syntheses of Hybrid Patchouli Oil Coated Silver Nanoparticles for Enhanced Antibacterial Activity. Curr. Res. Green Sustain. Chem. 2020, 3, 100016. [Google Scholar] [CrossRef]
- Heroweti, J.; Rochman, M.F.; Wibowo, D.N.; Khasanah, I.R.; Salma, S. Efektifitas Penyembuhan Luka Sayat Spray Gel Minyak Nilam Pada Kelinci (Oryctolagus cuniculus). Media Farm. 2022, 18, 10. [Google Scholar] [CrossRef]
- Gaikwad, S.; Birla, S.; Ingle, A.P.; Gade, A.; Ingle, P.; Golińska, P.; Rai, M. Superior in Vivo Wound-Healing Activity of Mycosynthesized Silver Nanogel on Different Wound Models in Rat. Front. Microbiol. 2022, 13, 881404. [Google Scholar] [CrossRef]
- Khairan; Muhammad, S.; Diah, M. Patchouli (Pogostemon cablin Benth): Chemistry, Biology, and Anti-Inflammatory Activities: A Review. In Proceedings of the 2nd International Conference of Essential Oils, Banda Aceh, Indonesia, 29–30 October 2019; SCITEPRESS—Science and Technology Publications: Setúbal, Portugal, 2019; pp. 67–73. [Google Scholar]
- Bunrathep, S.; Lockwood, G.B.; Songsak, T.; Ruangrungsi, N. Chemical Constituents from Leaves and Cell Cultures of Pogostemon cablin and Use of Precursor Feeding to Improve Patchouli Alcohol Level. ScienceAsia 2006, 32, 293. [Google Scholar] [CrossRef]
- Jeong, J.B.; Choi, J.; Lou, Z.; Jiang, X.; Lee, S.-H. Patchouli Alcohol, an Essential Oil of Pogostemon cablin, Exhibits Anti-Tumorigenic Activity in Human Colorectal Cancer Cells. Int. Immunopharmacol. 2013, 16, 184–190. [Google Scholar] [CrossRef]
- Kim, T.J.; Pyun, D.H.; Park, S.Y.; Lee, H.J.; Abd El-Aty, A.M.; Song, J.-H.; Shin, Y.K.; Jeong, J.H.; Jung, T.W. Patchouli Alcohol Improves Wound Healing in High Fat Diet-Fed Mice through AMPK-Mediated Suppression of Inflammation and TGFb1 Signaling. Biochem. Biophys. Res. Commun. 2021, 561, 136–142. [Google Scholar] [CrossRef]
- Mori, Y.; Ono, T.; Miyahira, Y.; Nguyen, V.Q.; Matsui, T.; Ishihara, M. Antiviral Activity of Silver Nanoparticle/Chitosan Composites against H1N1 Influenza A Virus. Nanoscale Res. Lett. 2013, 8, 93. [Google Scholar] [CrossRef] [Green Version]
- Kemala, P.; Idroes, R.; Khairan, K.; Ramli, M.; Jalil, Z.; Idroes, G.M.; Tallei, T.E.; Helwani, Z.; Safitri, E.; Iqhrammullah, M.; et al. Green Synthesis and Antimicrobial Activities of Silver Nanoparticles Using Calotropis gigantea from Ie Seu-Um Geothermal Area, Aceh Province, Indonesia. Molecules 2022, 27, 5310. [Google Scholar] [CrossRef]
- Okuma, C.H.; Andrade, T.A.M.; Caetano, G.F.; Finci, L.I.; Maciel, N.R.; Topan, J.F.; Cefali, L.C.; Polizello, A.C.M.; Carlo, T.; Rogerio, A.P.; et al. Development of Lamellar Gel Phase Emulsion Containing Marigold Oil (Calendula officinalis) as a Potential Modern Wound Dressing. Eur. J. Pharm. Sci. 2015, 71, 62–72. [Google Scholar] [CrossRef]
- Nikam, S. Anti-Acne Gel of Isotretinoin: Formulation and Evaluation. Asian J. Pharm. Clin. Res. 2017, 10, 257. [Google Scholar] [CrossRef] [Green Version]
- Bhalekar, M.R.; Madgulkar, A.R.; Kadam, G.J. Evaluation of Gelling Agents for Clindamycin Phosphate Gel. World J. Pharm. Pharm. Sci. 2015, 4, 2022–2033. [Google Scholar]
- Özyazıcı, M.; Fırlak, M.; Tanrıverdı, S.T.; Rençber, S.; Karavana, S.Y.; Kahraman, M.V. Bioadhesive Gel and Hydrogel Systems for Buccal Delivery of Ketoprofen: Preparation and In Vitro Evaluation Studies. Biosensors 2015, 6, 78–91. [Google Scholar]
- Quraishi, S.; Martins, M.; Barros, A.A.A.; Gurikov, P.; Raman, S.P.; Smirnova, I.; Duarte, A.R.C.; Reis, R.L. Novel Non-Cytotoxic Alginate–Lignin Hybrid Aerogels as Scaffolds for Tissue Engineering. J. Supercrit. Fluids 2015, 105, 1–8. [Google Scholar] [CrossRef]
- Tanwar, R.; Gupta, V.; Kumar, P.; Kumar, A.; Singh, S.; Gaikwad, K.K. Development and Characterization of PVA-Starch Incorporated with Coconut Shell Extract and Sepiolite Clay as an Antioxidant Film for Active Food Packaging Applications. Int. J. Biol. Macromol. 2021, 185, 451–461. [Google Scholar] [CrossRef]
- Vashist, A.; Gupta, Y.K.; Ahmad, S. Interpenetrating Biopolymer Network Based Hydrogels for an Effective Drug Delivery System. Carbohydr. Polym. 2012, 87, 1433–1439. [Google Scholar] [CrossRef]
- Makarov, V.V.; Love, A.J.; Sinitsyna, O.V.; Makarova, S.; Yaminsky, V.; Taliansk, M.E.; Kalinina, N.O. A Review: “Green” Nanotechnologies: Synthesis of Metal Nanoparticles Using Plants. Acta Nat. 2014, 6, 20. [Google Scholar]
- Conzatti, G.; Faucon, D.; Castel, M.; Ayadi, F.; Cavalie, S.; Tourrette, A. Alginate/Chitosan Polyelectrolyte Complexes: A Comparative Study of the Influence of the Drying Step on Physicochemical Properties. Carbohydr. Polym. 2017, 172, 142–151. [Google Scholar] [CrossRef] [Green Version]
- Astuti, P.; Khairan, K.; Marthoenis, M.; Hasballah, K. Antidepressant-like Activity of Patchouli Oil Var. Tapak Tuan (Pogostemon cablin Benth) via Elevated Dopamine Level: A Study Using Rat Model. Pharmaceuticals 2022, 15, 608. [Google Scholar] [CrossRef]
- Khairan, K.; Zahraturriaz; Jalil, Z. Green Synthesis of Sulphur Nanoparticles Using Aqueous Garlic Extract (Allium sativum). Rasayan J. Chem. 2019, 12, 50–57. [Google Scholar] [CrossRef]
- Abdjul, N.; Paputungan, M.; Duengo, S. Analisis Komponen Kimia Minyak Atsiri Pada Tanaman Nilam Hasil Distilasi Uap Air Dengan Menggunakan KG-SM. J. Sainstek 2013, 7, 1–16. [Google Scholar]
- Khairan, K.; Idroes, R.; Tumilaar, S.G.; Tallei, T.E.; Idroes, G.M.; Rahmadhany, F.; Futri, M.U.; Dinura, N.M.; Mauliza, S.; Diana, M.; et al. Molecular Docking Study of Fatty Acids from Pliek U Oil in the Inhibition of SARS-CoV-2 Protein and Enzymes. IOP Conf. Ser. Mater. Sci. Eng. 2021, 1087, 012058. [Google Scholar] [CrossRef]
- Khairan, K.; Idroes, R.; Tallei, T.E.; Nasim, M.J.; Jacob, C. Bioactive Compounds from Medicinal Plants and Their Possible Effect as Therapeutics Agents against COVID-19: A Review. Curr. Nutr. Food Sci. 2021, 17, 621–633. [Google Scholar] [CrossRef]
- Chandika, P.; Khan, F.; Heo, S.-Y.; Kim, T.-H.; Kim, Y.-M.; Yi, M.; Jung, W.-K. Multifunctional Dual Cross-Linked Poly (Vinyl Alcohol)/Methacrylate Hyaluronic Acid/Chitooligosaccharide-Sinapic Acid Wound Dressing Hydrogel. Int. J. Biol. Macromol. 2022, 222, 1137–1150. [Google Scholar] [CrossRef]
- Shivhare, U.D.; Jain, K.B.; Mathur, V.B.; Bhusari, K.P.; Roy, A.A. Formulation Development and Evaluation of Diclofenac Sodium Gel Using Water Soluble Polyacrylamide Polymer. Dig. J. Nanomater. Biostruct. 2009, 4, 285–290. [Google Scholar]
- Chopra, H.; Bibi, S.; Kumar, S.; Khan, M.S.; Kumar, P.; Singh, I. Preparation and Evaluation of Chitosan/PVA Based Hydrogel Films Loaded with Honey for Wound Healing Application. Gels 2022, 8, 111. [Google Scholar] [CrossRef]


| Extract | Secondary Metabolites | ||||
|---|---|---|---|---|---|
| Alkaloids | Flavonoids | Tannins | Saponins | Terpenoids | |
| APLE | (ve)+ | (ve)− | (ve)+ | (ve)− | (ve)+ |
| MPLE | (ve)+ | (ve)+ | (ve)+ | (ve)− | (ve)+ |
| Before Chemical Reaction | After Chemical Reaction | ||||||
|---|---|---|---|---|---|---|---|
| APLE | MPLE | AgAENPs | AgMENPs | ||||
| Wavelength (cm−1) | Functional Group | Wavelength (cm−1) | Functional Group | Wavelength (cm−1) | Functional Group | Wavelength (cm−1) | Functional Group |
| 3400.22 | -O-H | 3350.15 | -O-H | 3590.12 | -O-H | 3450.14 | -O-H |
| 2138.15 | -C-N | 2850.14 | -C-H | 2200.11 | -C-N | ||
| 1640.20 | -C=C | 1680.22 | -C=C | 1675.11 | -C=C | 1670.21 | -C=C |
| 1340.20 | -C-N | 1150.10 | -C-O | ||||
| 1050.45 | -C-O | ||||||
| 1125.16 | -C-O | ||||||
| No. | Chemical Composition | Chemical Composition | ||
|---|---|---|---|---|
| APLE | % Area | MPLE | % Area | |
| 1. | α-Guaiene | 8.25 | 4.7-Methanoazulene | 2.97 |
| 2. | α-Patchoulene | 2.36 | Cyclohexene | 0.86 |
| 3. | Azulen | 10.67 | Seychellene | 1.16 |
| 4. | Veridiflorol | 7.36 | Caryophyllene | 3.18 |
| 5. | Patchouli alcohol | 71.36 | α-Guaiene | 20.44 |
| 6. | Seychellene | 12.66 | ||
| 7. | α-Humulene | 1.24 | ||
| 8. | α-Patchoulene | 13.38 | ||
| 9. | Azulene | 0.69 | ||
| 10. | α-Guaiene | 2.40 | ||
| 11. | α-Bulnesene | 4.87 | ||
| 12. | α-Panasinsen | 0.53 | ||
| 13. | Caryophyllene-oxide | 0.85 | ||
| 14. | Cyclopropenazulene | 0.89 | ||
| 15. | Veridiflorol | 1.71 | ||
| 16. | Patchouli alcohol | 30.91 | ||
| 17. | Cyclohexanol | 1.25 | ||
| Total | 100.00 | Total | 100.00 | |
| Treatment | Operational Conditions | Patchouli Alcohol c (%) | |||
|---|---|---|---|---|---|
| Feed Volume (mL) | Temperature (°C) | Result (mL) | Yield Percent (%) | ||
| LfoPO a | 200 | 125 | 121 | 60.5 | 28.68 |
| HfoPO b | 79 | 115–160 | 69 | 34.5 | 60.66 |
| Loss | - | - | 10 | 5 | - |
| AgNPs | Average Diameter ± SD (nm) |
|---|---|
| AgAENPs a | 167.70 ± 1.92 |
| AgMENPs b | 83.83 ± 2.94 |
| Formula | Scent | Color | Shape | Homogeneity |
|---|---|---|---|---|
| F0 | No scent | White | Semi-solid | Homogeneous |
| F1 | No scent | Purple | Semi-solid | Homogeneous |
| F2 | Patchouli scent | Brown | Semi-solid | Homogeneous |
| F3 | No scent | Purple | Semi-solid | Homogeneous |
| F4 | Patchouli scent | Brown | Semi-solid | Homogeneous |
| Formula | pH | Spreadability (cm) | ||||||||||
|---|---|---|---|---|---|---|---|---|---|---|---|---|
| pH | SD | 1(g) | SD | 3(g) | SD | 5(g) | SD | 7(g) | SD | 9(g) | SD | |
| F0 | 6.03 | ±0.05 | 2.00 | ±0.00 | 2.15 | ±0.07 | 2.25 | ±0.07 | 2.25 | ±0.07 | 2.35 | ±0.07 |
| F1 | 6.40 | ±0.10 | 1.50 | ±0.00 | 1.60 | ±0.00 | 1.75 | ±0.07 | 1.90 | ±0.00 | 2.00 | ±0.00 |
| F2 | 6.40 | ±0.10 | 2.10 | ±0.14 | 2.30 | ±0.00 | 2.40 | ±0.00 | 2.55 | ±0.07 | 2.70 | ±0.00 |
| F3 | 6.60 | ±0.15 | 1.70 | ±0.14 | 1.85 | ±0.07 | 1.95 | ±0.07 | 2.00 | ±0.00 | 2.25 | ±0.07 |
| F4 | 6.50 | ±0.05 | 1.80 | ±0.14 | 2.35 | ±0.07 | 2.45 | ±0.07 | 2.50 | ±0.14 | 2.90 | ±0.14 |
| Formula | Gel Fraction | Swelling Index | ||||
|---|---|---|---|---|---|---|
| Wo (g) | We (g) | Yield (%) | Wa (g) | Ws (g) | Yield (%) | |
| F0 | 0.032 | 0.095 | 2.96 | 0.123 | 0.132 | 1.07 |
| F1 | 0.034 | 0.098 | 2.88 | 0.111 | 0.135 | 1.21 |
| F2 | 0.016 | 0.030 | 1.88 | 0.110 | 0.120 | 1.09 |
| F3 | 0.032 | 0.076 | 2.30 | 0.118 | 0.134 | 1.13 |
| F4 | 0.040 | 0.088 | 2.20 | 0.093 | 0.140 | 1.50 |
| Formula | Inhibition Zone | Formula | Inhibition Zone | ||
|---|---|---|---|---|---|
| S. aureus | S. epidermidis | ||||
| (mm) | SD | (mm) | SD | ||
| Vancomycin (30 µg) | 21.06 | ±0.33 | Amoxicillin (25 µg) | 18.92 | ±1.23 |
| Aquadest | 0.00 | ±0.00 | Aquadest | 0.00 | ±0.00 |
| F0 | 0.00 | ±0.00 | F0 | 0.00 | ±0.00 |
| F1 | 12.13 | ±0.92 | F1 | 10.14 | ±2.92 |
| F2 | 11.00 | ±0.40 | F2 | 8.00 | ±0.02 |
| F3 | 11.20 | ±0.52 | F3 | 7.80 | ±0.14 |
| F4 | 11.00 | ±0.34 | F4 | 7.90 | ±0.02 |
| No. | Ingredients | Formula | ||||
|---|---|---|---|---|---|---|
| F0 | F1 | F2 | F3 | F4 | ||
| 1. | Corn starch, CS (gram) | 2.8 | 2.8 | 2.8 | 2.8 | 2.8 |
| 2. | Polyvinyl alcohol, PVA (gram) | 1.2 | 1.2 | 1.2 | 1.2 | 1.2 |
| 3. | Aquadest (mL) | 40 | 40 | 40 | 40 | 40 |
| 4. | Light fraction patchouli oil, LFoPO (gram) | - | 0.4 | 0.4 | - | - |
| 5. | Heavy fraction patchouli oil, HFoPO (gram) | - | - | - | 0.4 | 0.4 |
| 6. | Tween 80, TW-80 (0.4 g in 4 mL etanol) | 4 | 4 | 4 | 4 | 4 |
| 7. | Glycerol (2 mL in 10 mL etanol) | 12 | 12 | 12 | 12 | 12 |
| 8. | Silver nanoparticles, AgEADN (mL) | - | 1 | - | 1 | - |
| 9. | Silver nanoparticles, AgEMDN (mL) | - | - | 1 | - | 1 |
| 10. | Acidified glutaraldehida, GL a in 1 mL etanol (mL) | 1 | 1 | 1 | 1 | 1 |
Disclaimer/Publisher’s Note: The statements, opinions and data contained in all publications are solely those of the individual author(s) and contributor(s) and not of MDPI and/or the editor(s). MDPI and/or the editor(s) disclaim responsibility for any injury to people or property resulting from any ideas, methods, instructions or products referred to in the content. |
© 2023 by the authors. Licensee MDPI, Basel, Switzerland. This article is an open access article distributed under the terms and conditions of the Creative Commons Attribution (CC BY) license (https://creativecommons.org/licenses/by/4.0/).
Share and Cite
Khairan, K.; Hasan, M.; Idroes, R.; Diah, M. Fabrication and Evaluation of Polyvinyl Alcohol/Corn Starch/Patchouli Oil Hydrogel Films Loaded with Silver Nanoparticles Biosynthesized in Pogostemon cablin Benth Leaves’ Extract. Molecules 2023, 28, 2020. https://doi.org/10.3390/molecules28052020
Khairan K, Hasan M, Idroes R, Diah M. Fabrication and Evaluation of Polyvinyl Alcohol/Corn Starch/Patchouli Oil Hydrogel Films Loaded with Silver Nanoparticles Biosynthesized in Pogostemon cablin Benth Leaves’ Extract. Molecules. 2023; 28(5):2020. https://doi.org/10.3390/molecules28052020
Chicago/Turabian StyleKhairan, Khairan, Miftahul Hasan, Rinaldi Idroes, and Muhammad Diah. 2023. "Fabrication and Evaluation of Polyvinyl Alcohol/Corn Starch/Patchouli Oil Hydrogel Films Loaded with Silver Nanoparticles Biosynthesized in Pogostemon cablin Benth Leaves’ Extract" Molecules 28, no. 5: 2020. https://doi.org/10.3390/molecules28052020