
Femtosecond Time-Resolved Observation of Relaxation and Wave Packet Dynamics of the S1 State in Electronically Excited o-Fluoroaniline
 ,
,
Abstract
:1. Introduction
- (1)
- Can quantum beat frequency be explained by the ionization cross-section?
- (2)
- Do in-phase signals appear in quantum beat phenomena?
2. Results and Discussion
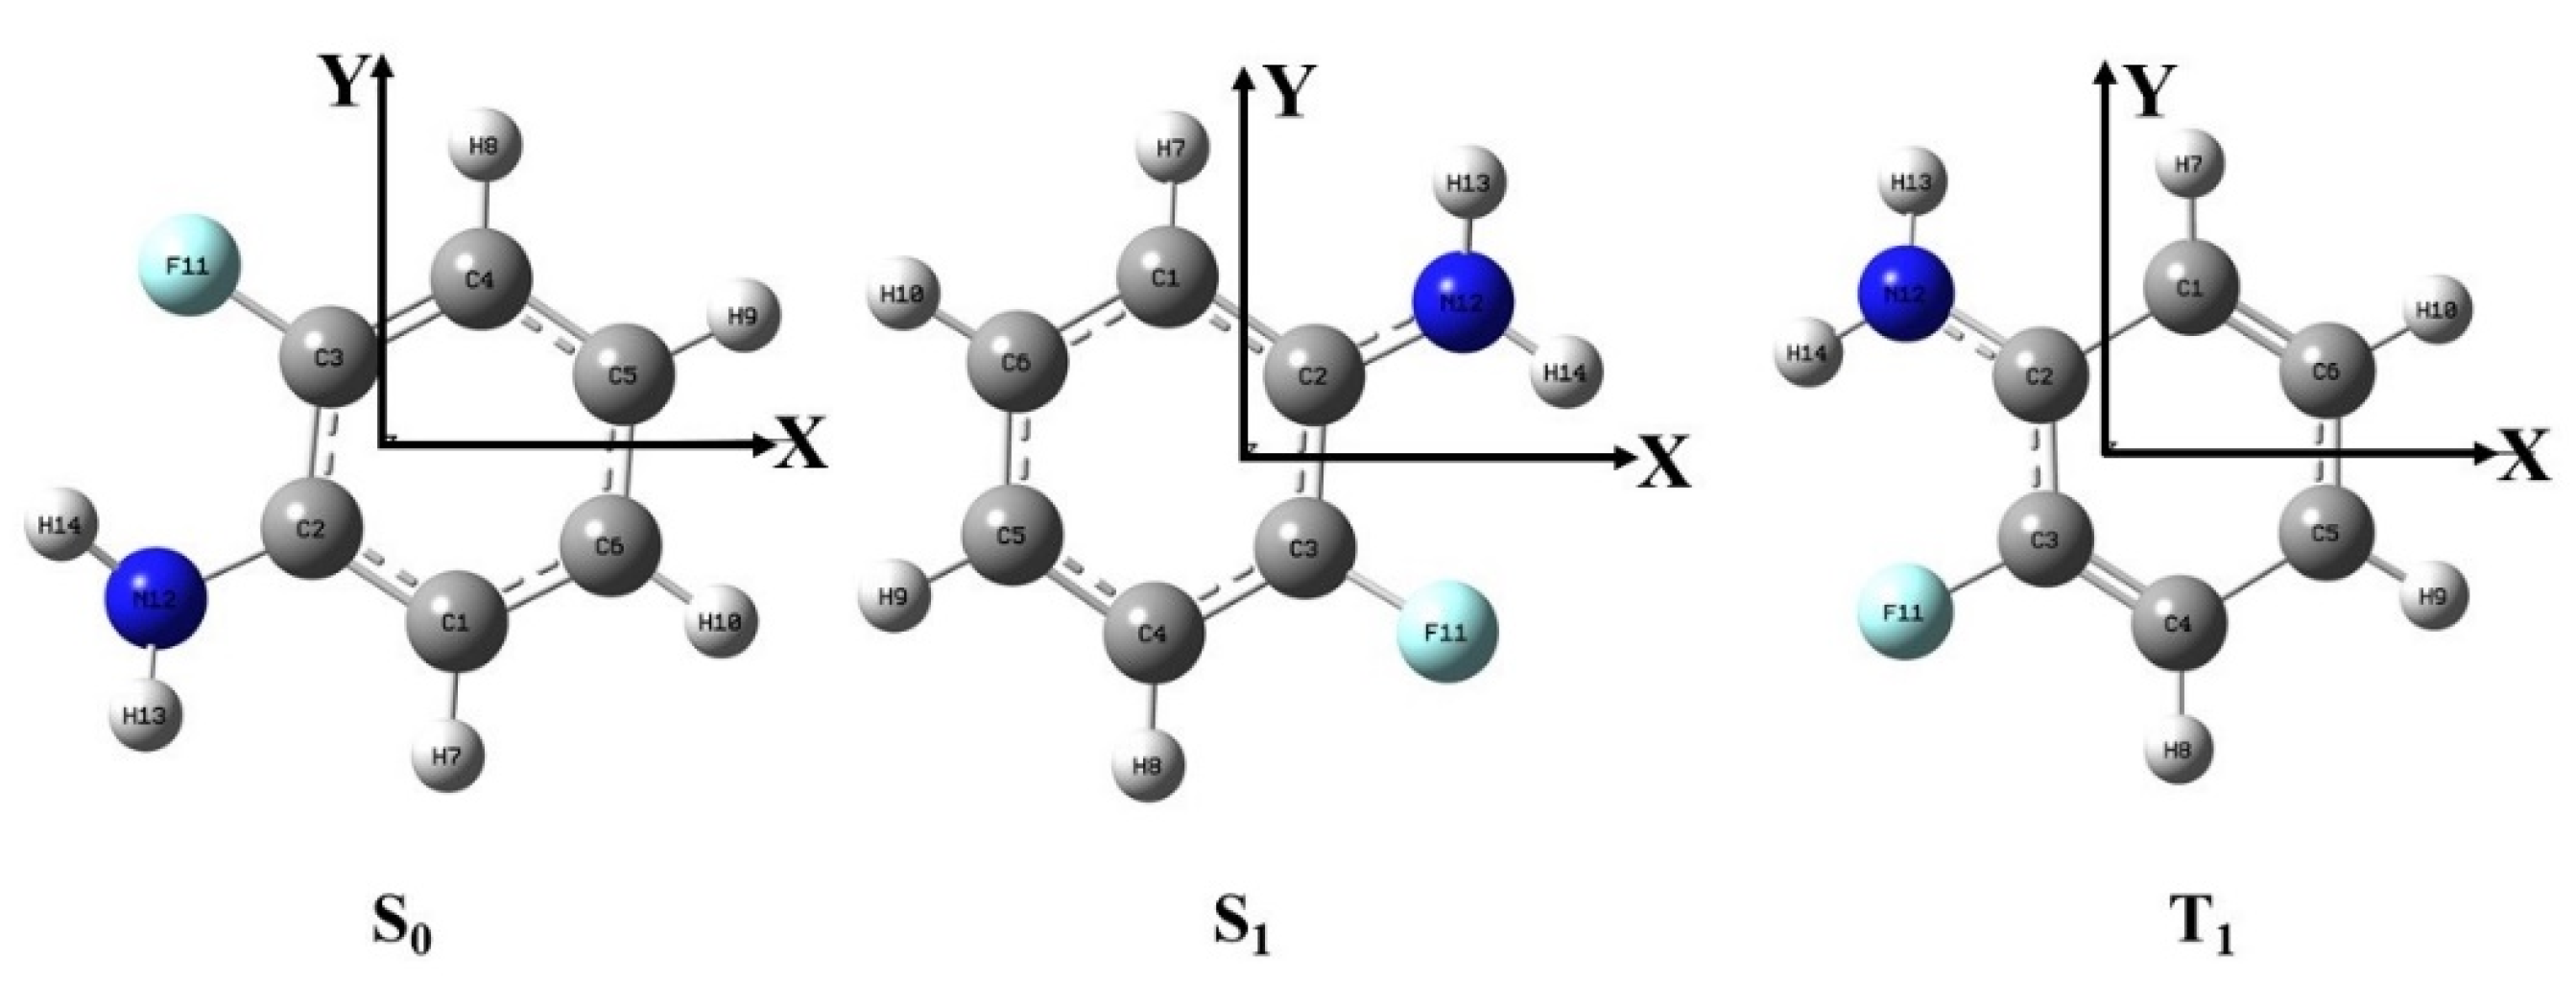
2.1. Ground State Geometry of o-Fluoroaniline
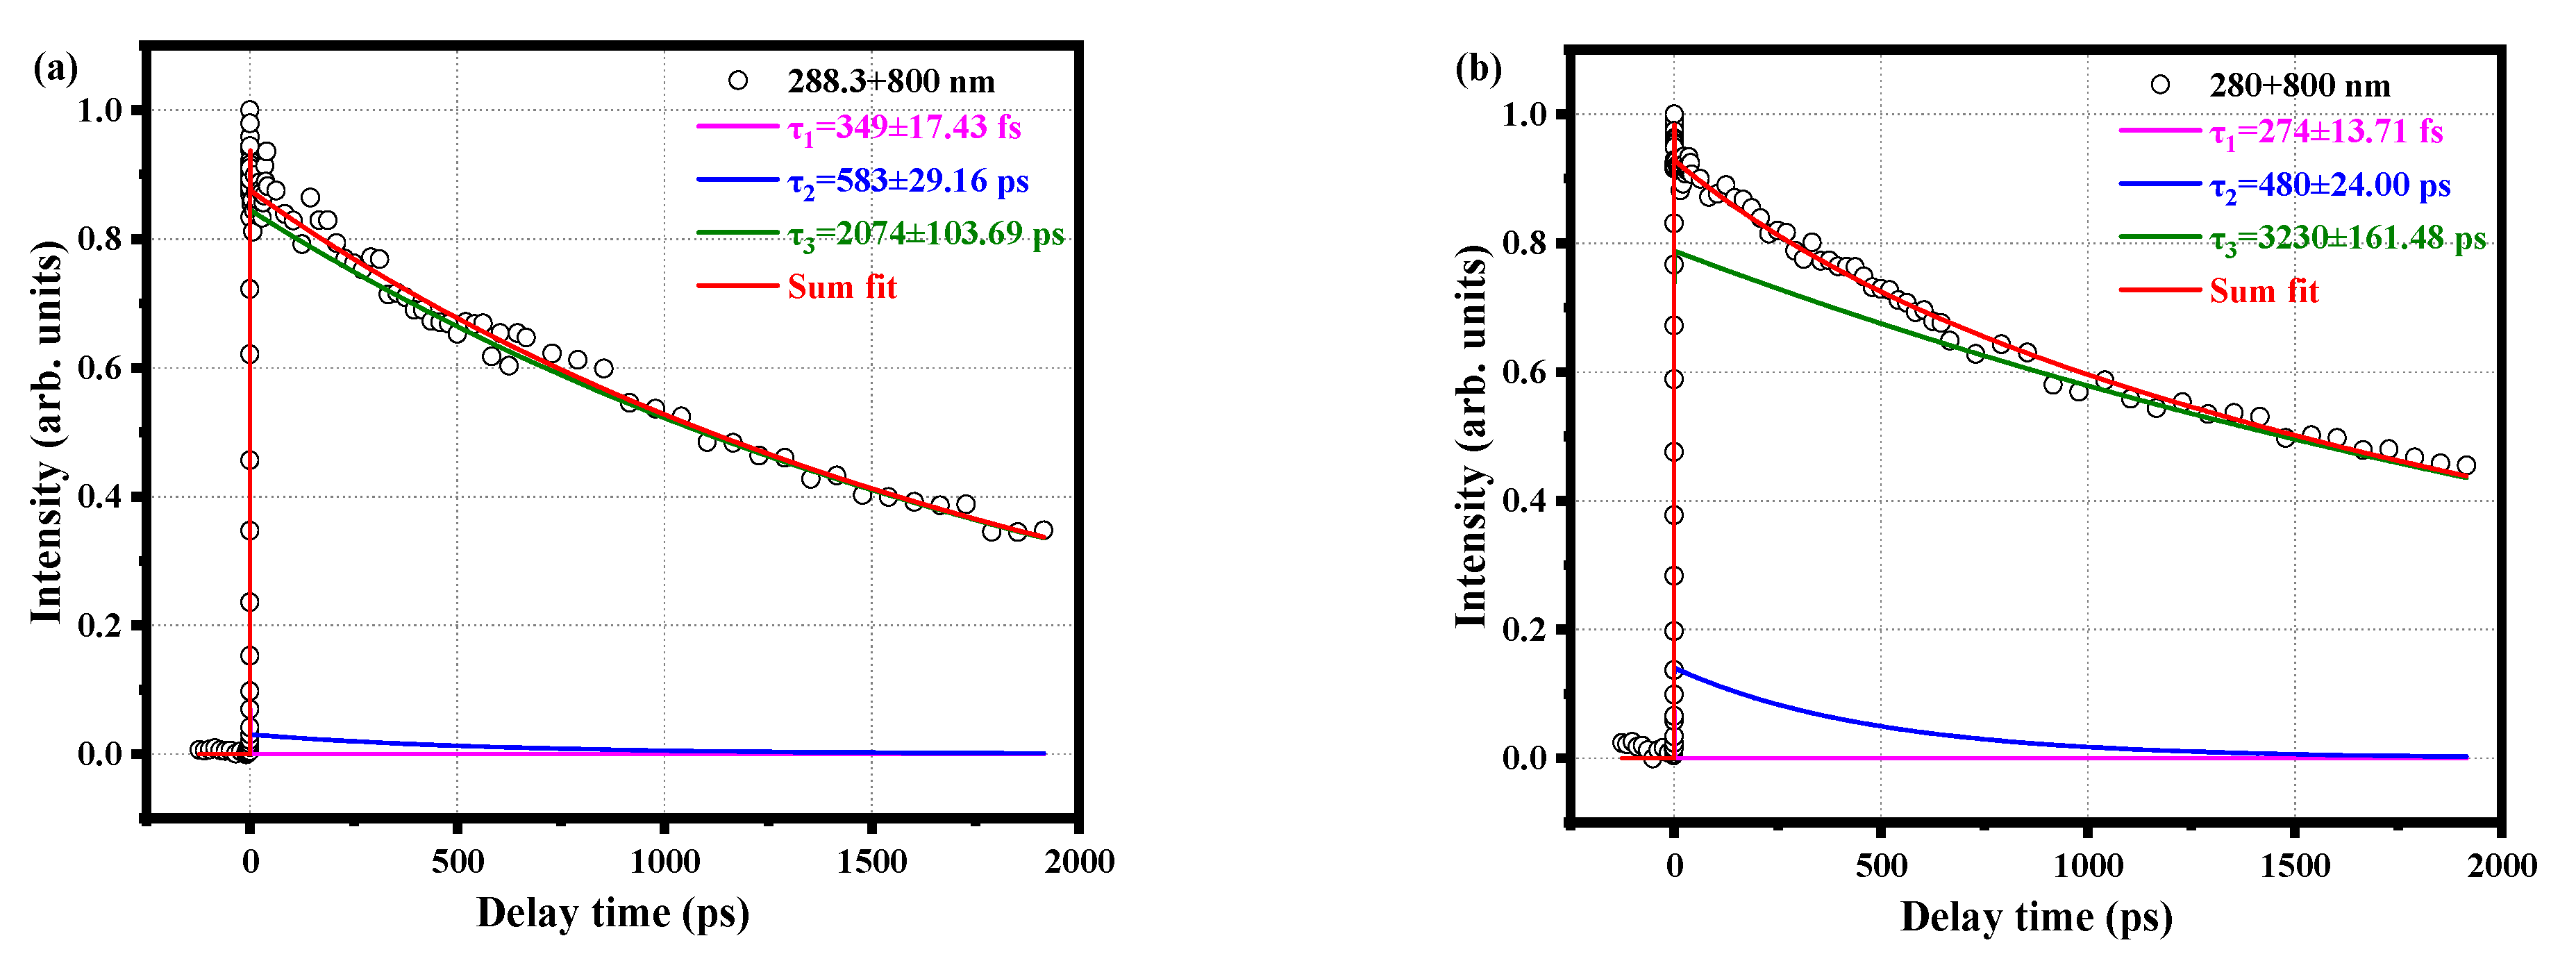
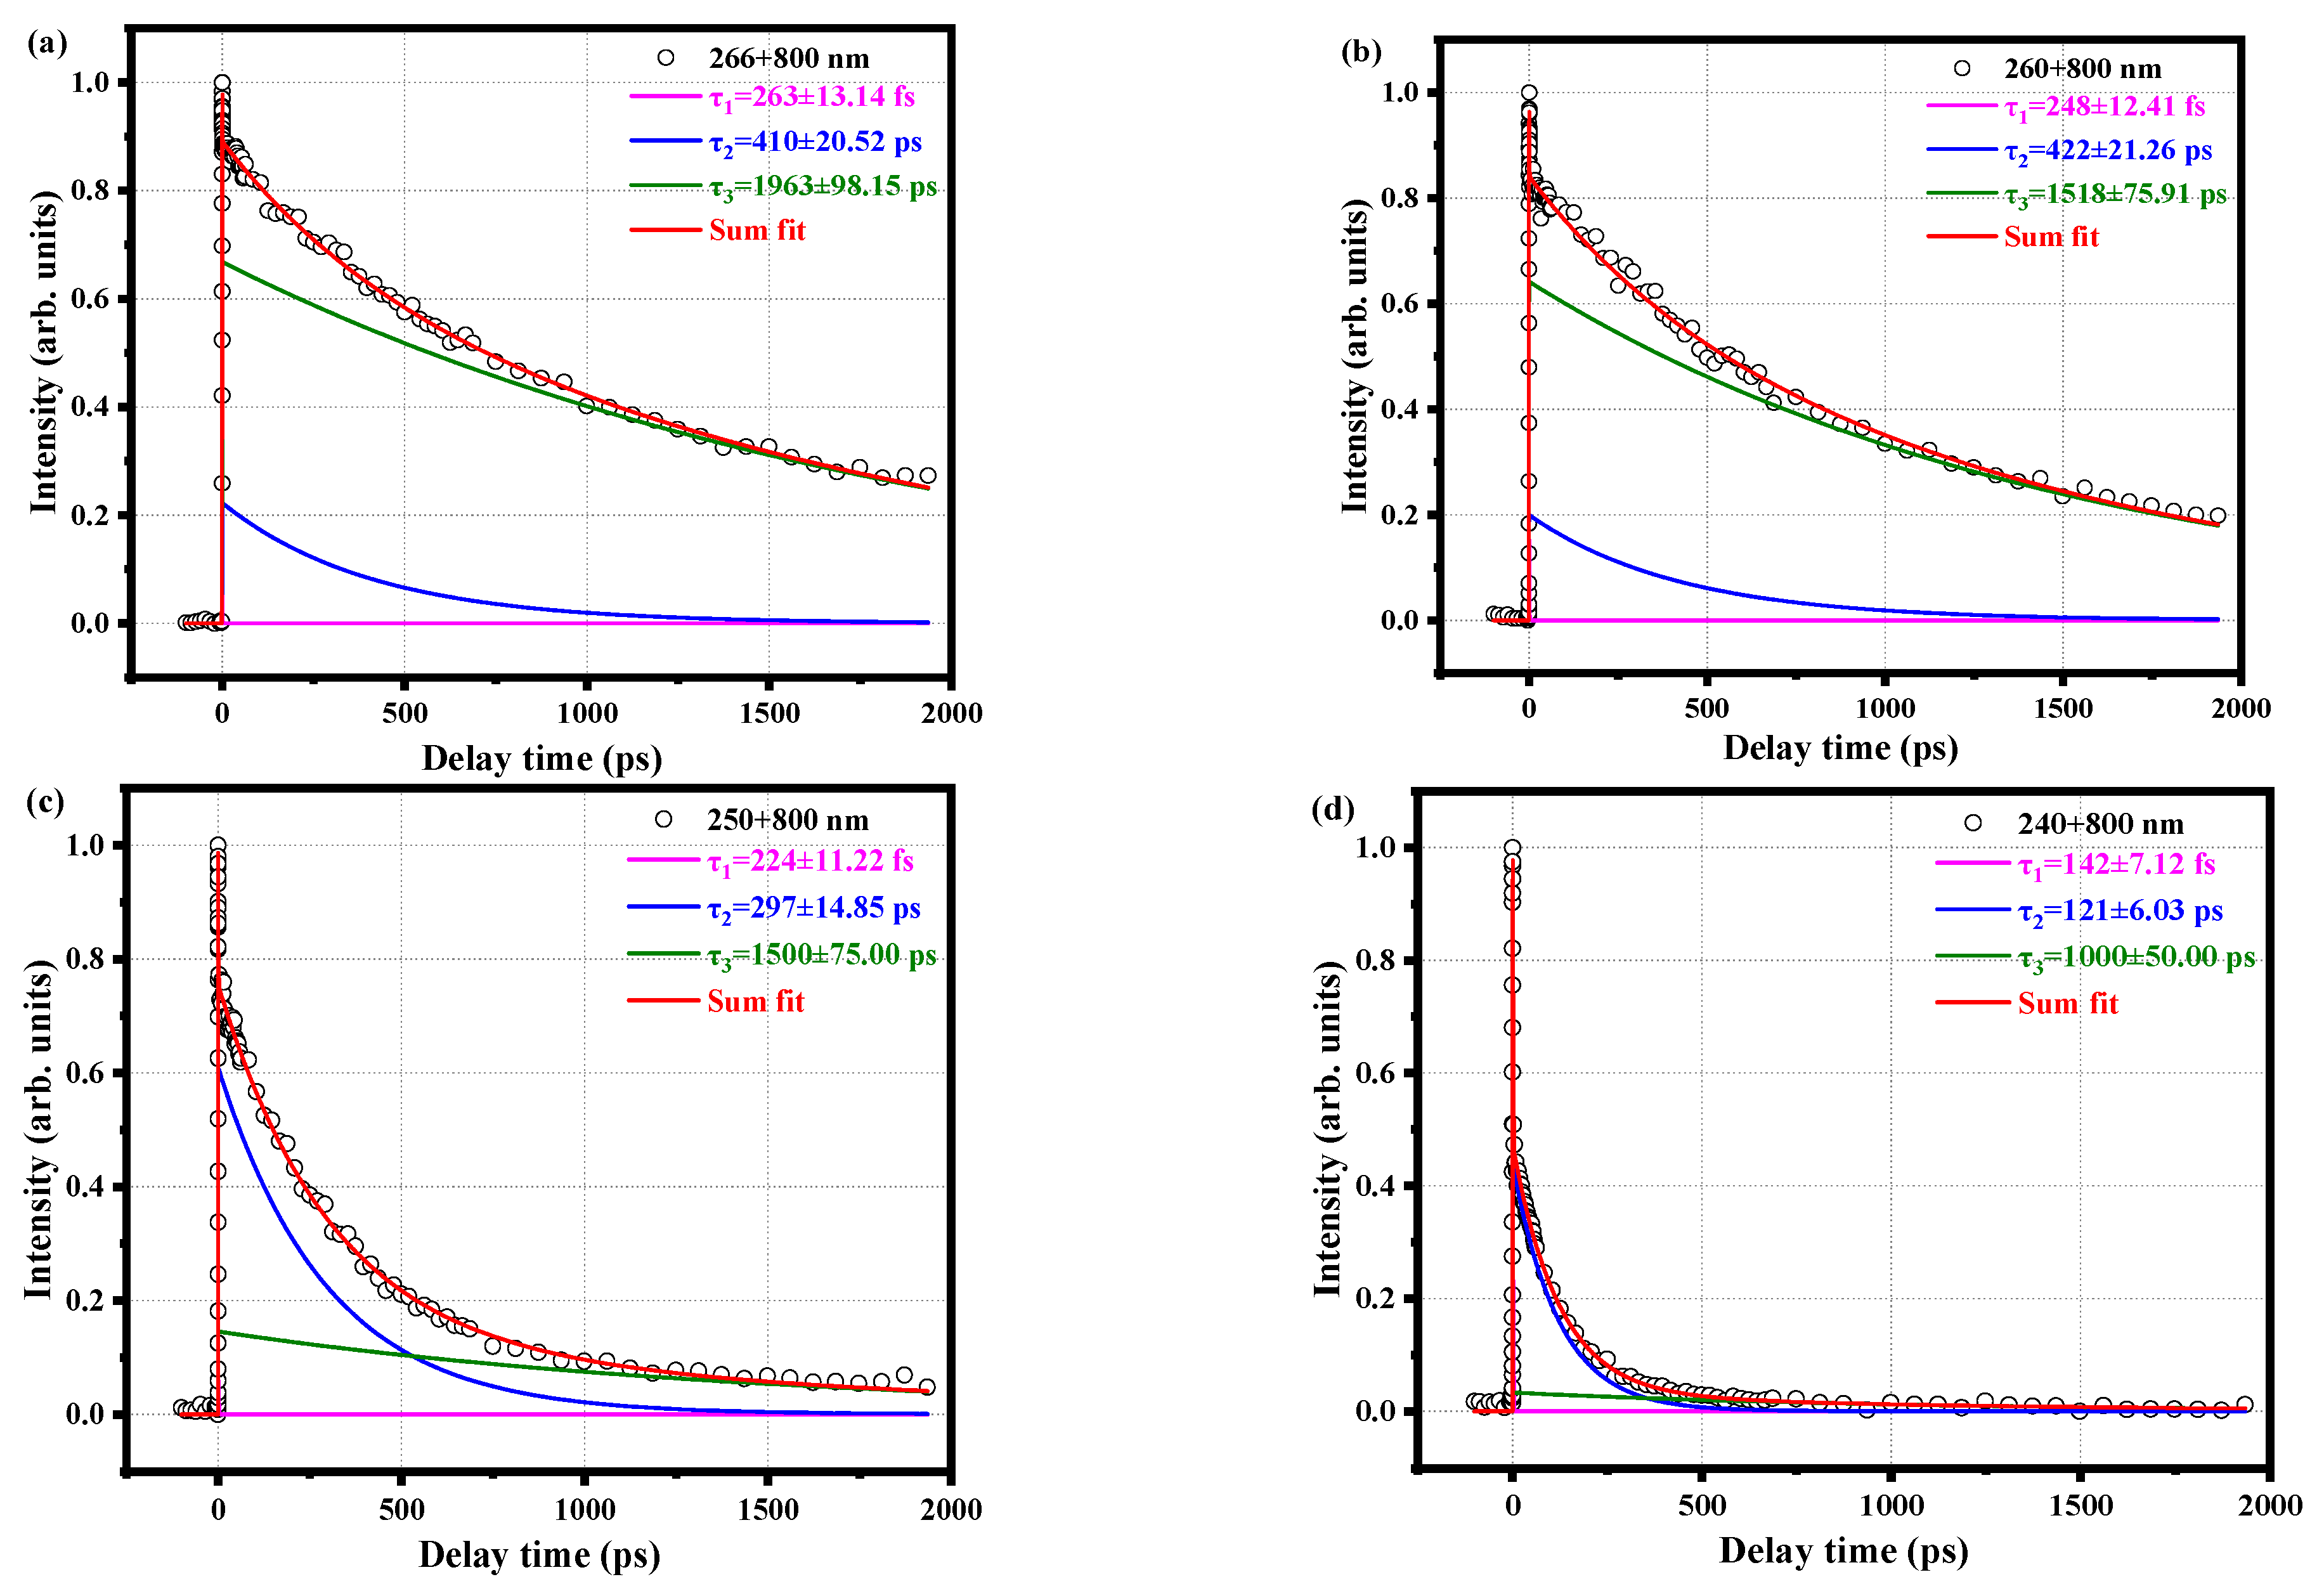
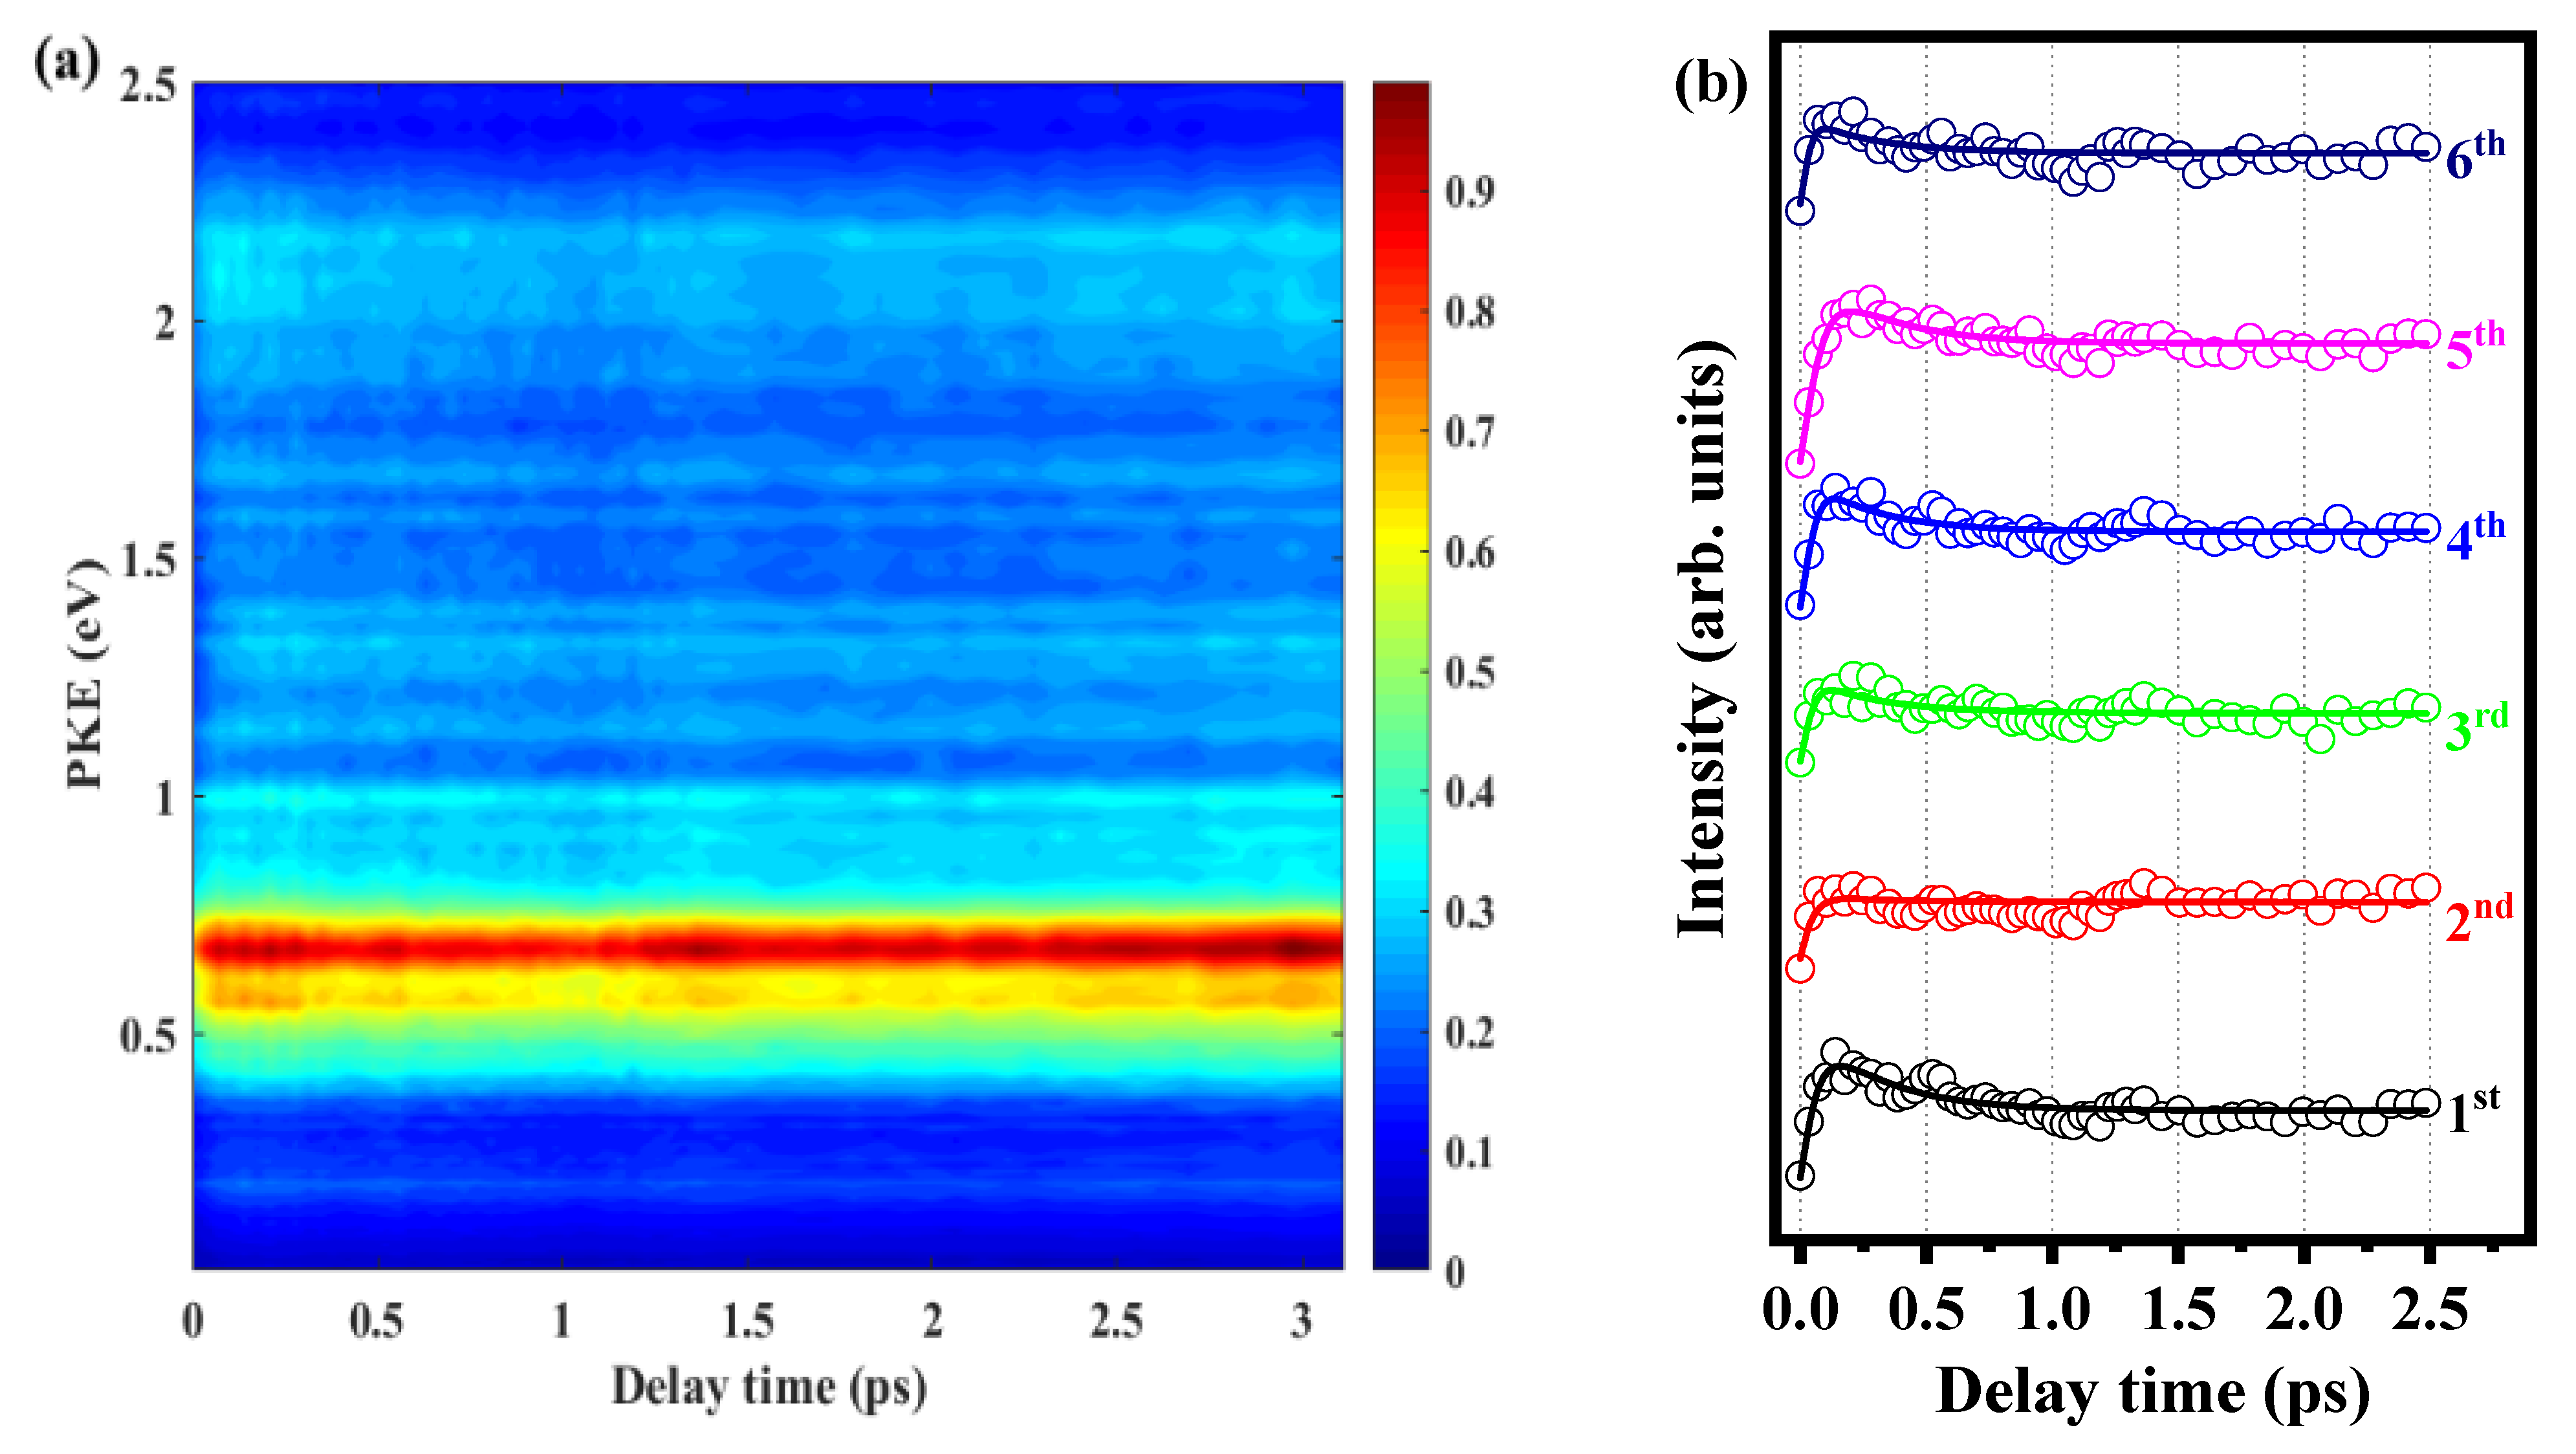
2.2. Relaxation Kinetics of o-Fluoroaniline
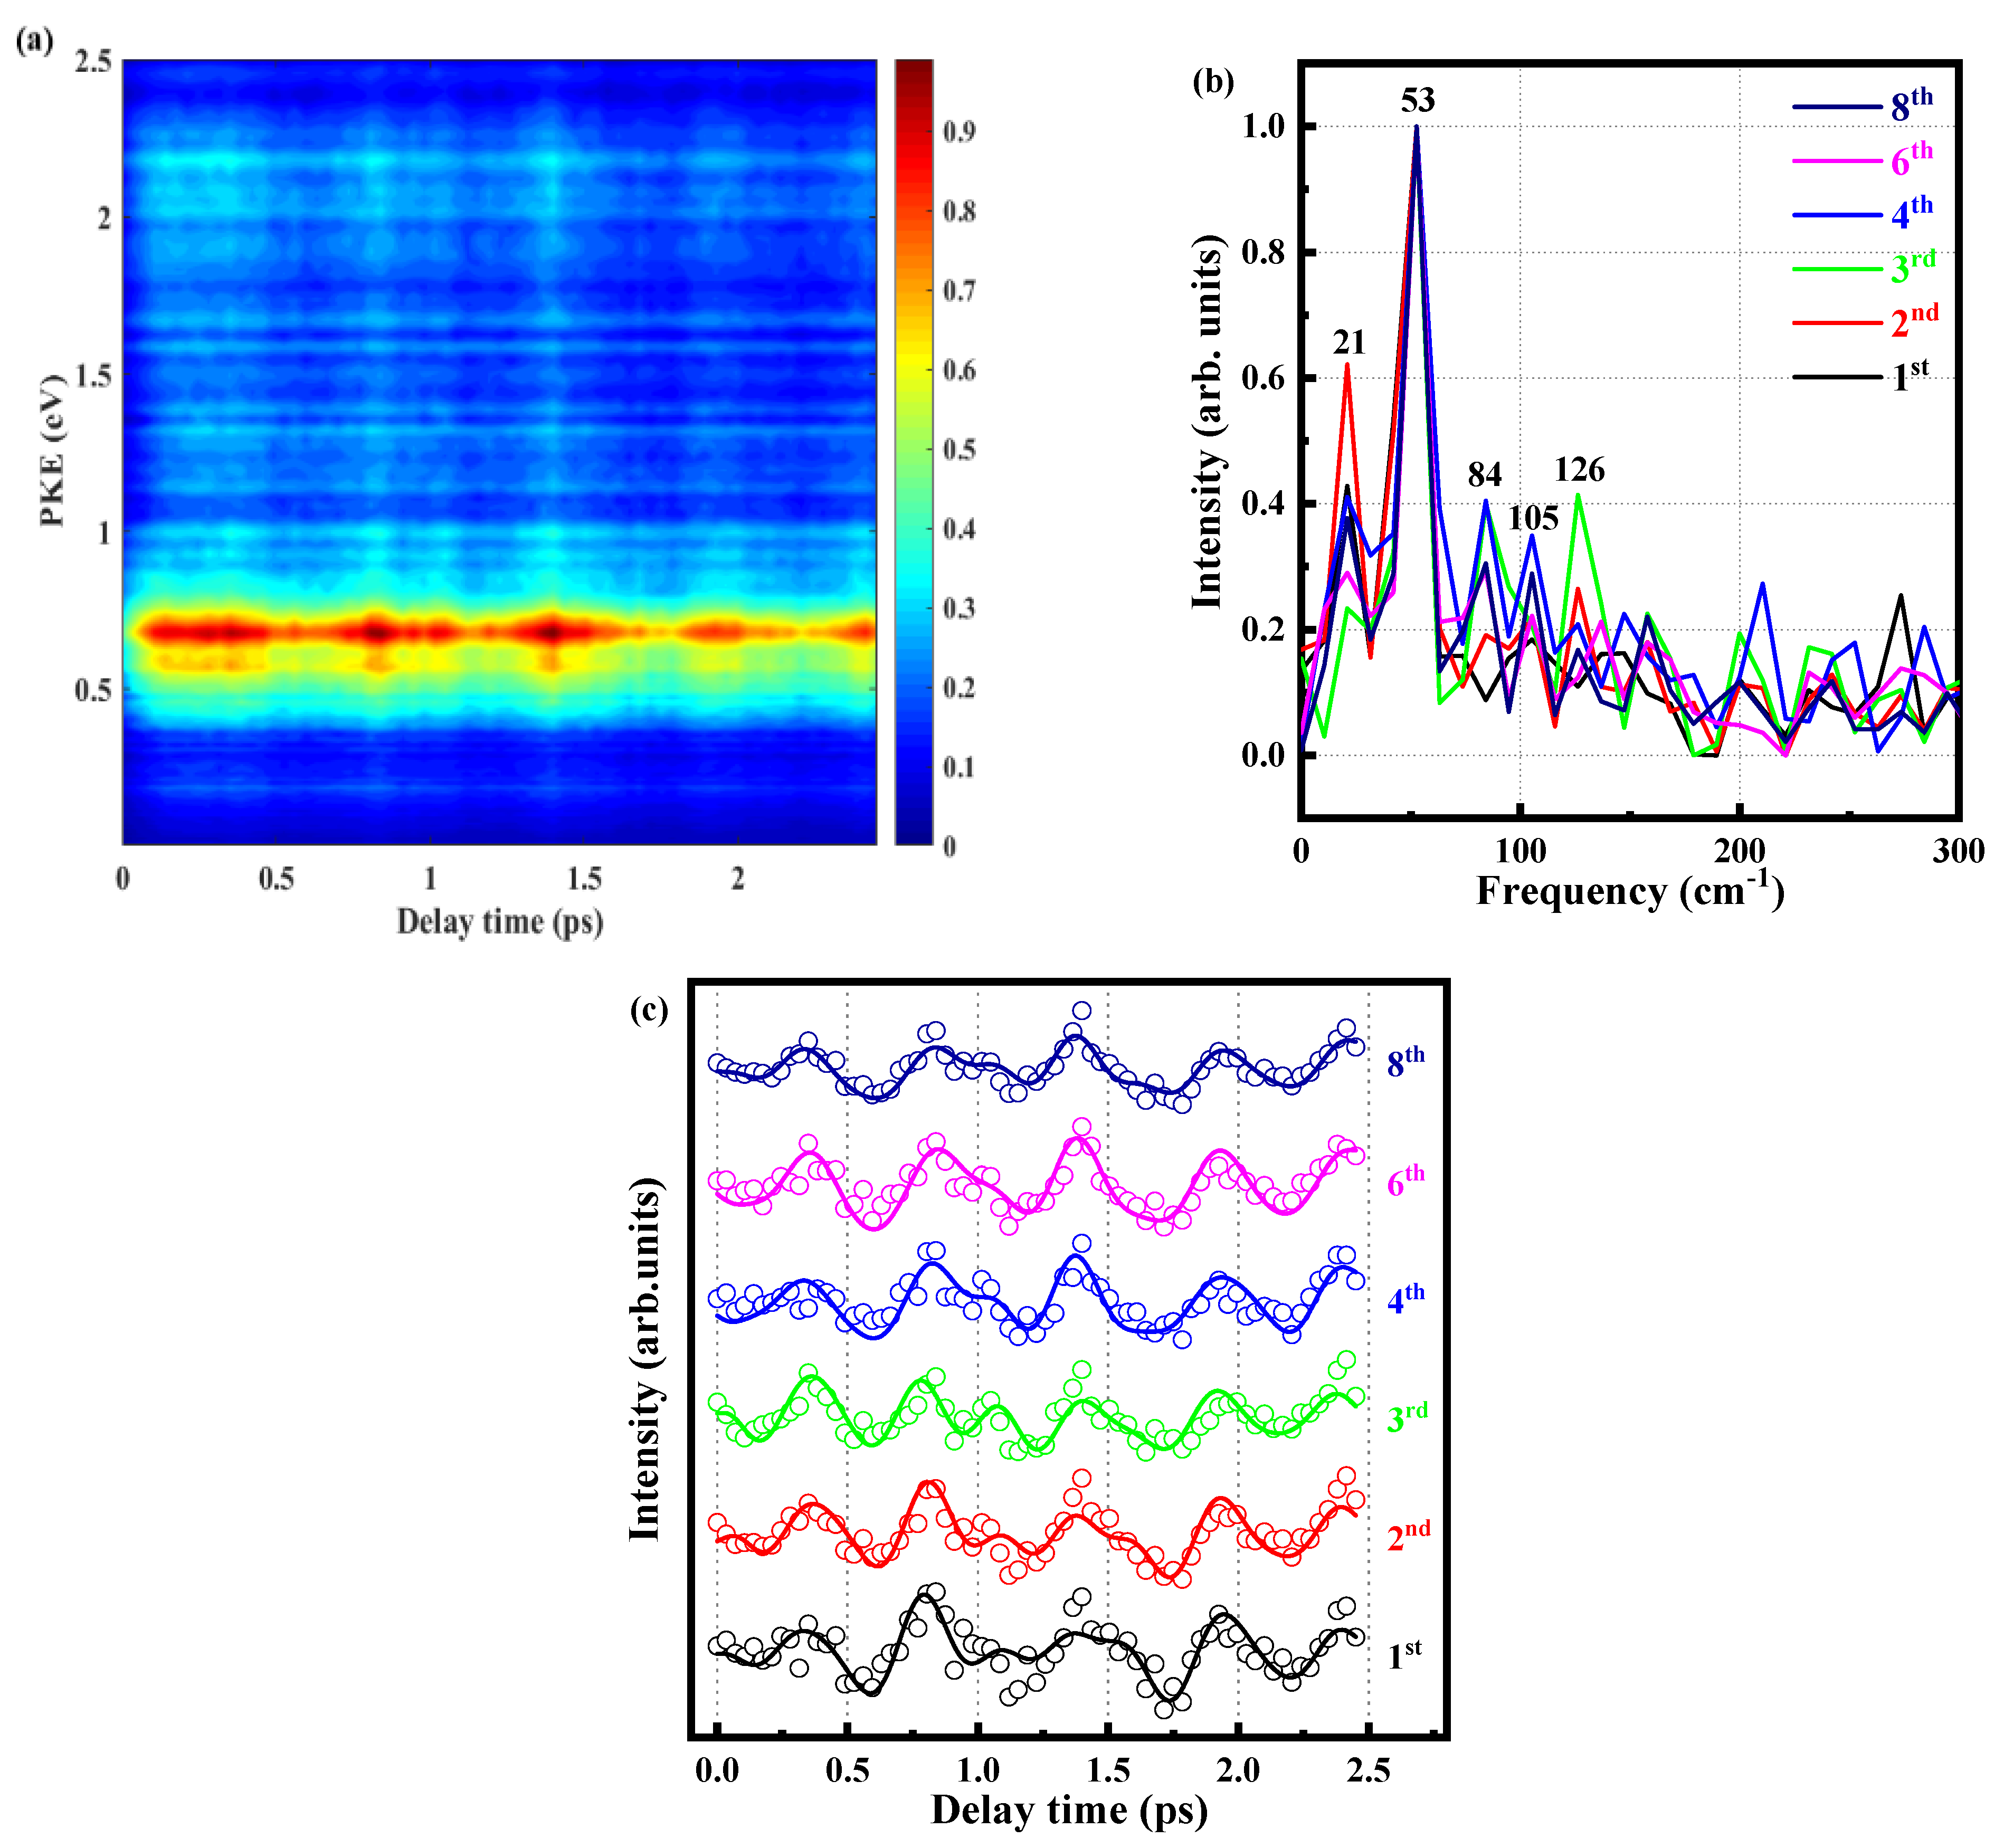
2.3. Quantum Beat of the S1 State of o-Fluoroaniline
3. Experimental and Theoretical Methods
3.1. Experimental Parameters
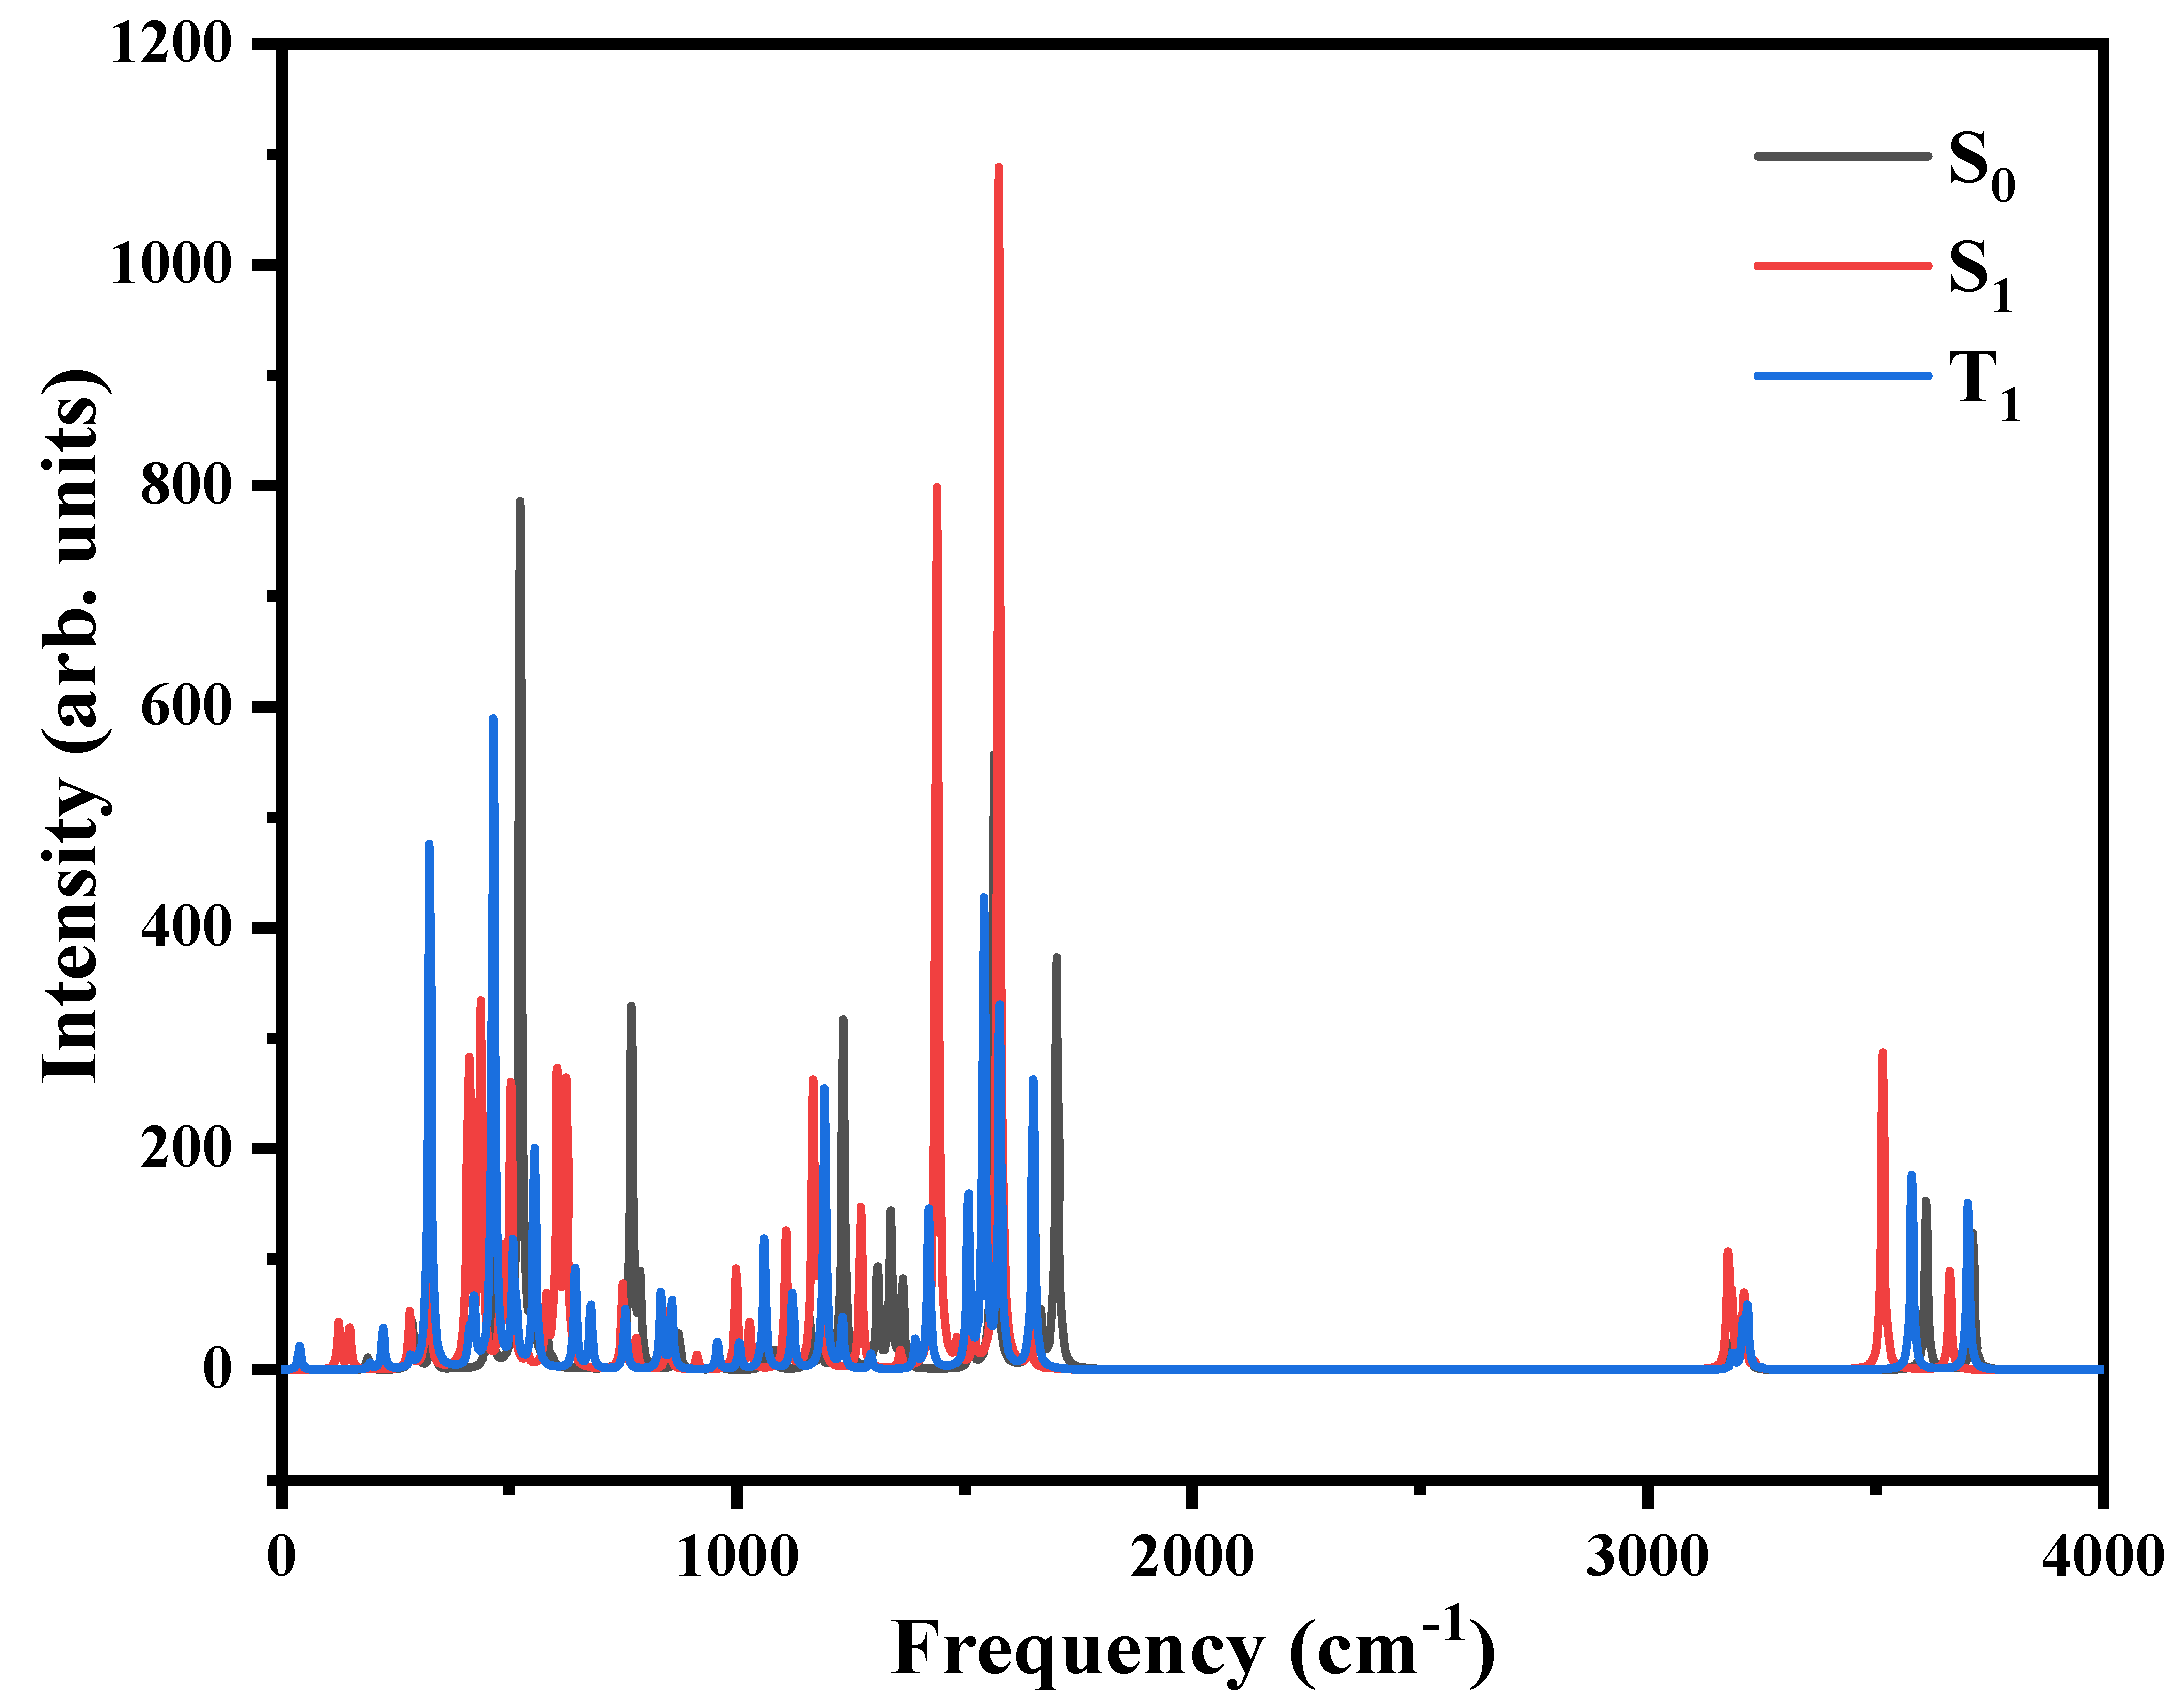
3.2. Theoretical Calculation
4. Conclusions
Author Contributions
Funding
Institutional Review Board Statement
Informed Consent Statement
Data Availability Statement
Conflicts of Interest
Sample Availability
Appendix A


References
- Kuthirummal, N.; Weber, P.M. Rydberg states: Sensitive probes of molecular structure. Chem. Phys. Lett. 2003, 378, 647–653. [Google Scholar] [CrossRef]
- Cheng, X.X.; Zhang, Y.; Deb, S.; Minitti, M.P.; Gao, Y.; Jónssonad, H.P.; Weber, M. Ultrafast structural dynamics in Rydberg excited N,N,N′,N′-tetramethylethylenediamine: Conformation dependent electron lone pair interaction and charge delocalization. Chem. Sci. 2014, 5, 4394–4403. [Google Scholar] [CrossRef]
- Cheng, X.X.; Zhang, Y.; Gao, Y.; Jónsson, H.; Weber, P.M. Ultrafast structural pathway of charge transfer in N,N,N’,N’-tetramethylethylenediamine. J. Phys. Chem. A 2015, 199, 2813–2818. [Google Scholar] [CrossRef]
- Minitti, M.P.; Weber, P.M. Time-Resolved Conformational Dynamics in Hydrocarbon Chains. Phys. Rev. Lett. 2007, 98, 253004. [Google Scholar] [CrossRef]
- Deb, S.; Minitti, M.P.; Weber, P.M. Structural dynamics and energy flow in Rydberg-excited clusters of N,N-dimethylisopropylamine. J. Chem. Phys. 2011, 135, 044319. [Google Scholar] [CrossRef] [Green Version]
- Zewail, A.H. Femtochemistry: Atomic-scale dynamics of the chemical bond using ultrafast lasers (Nobel Lecture). Angew. Chem. Int. Edit. 2000, 39, 2586–2631. [Google Scholar] [CrossRef]
- Kobayashi, T.; Kida, Y. Ultrafast spectroscopy with sub-10 fs deep-ultraviolet pulses. Phys. Chem. Chem. Phys. 2012, 14, 6200–6210. [Google Scholar]
- Pruna, F.R.; Springate, E.; Offerhaus, H.L.; Krishnamurthy, M.; Farid, N.; Nicole, C.; Vrakking, M.J.J. Spatial alignment of diatomic molecules in intense laser fields: I. Experimental results. J. Phys. B At. Mol. Opt. Phys. 2001, 34, 4919–4938. [Google Scholar] [CrossRef]
- Baumert, T.; Gerber, G. Fundamental Interactions of Molecules (Na2, Na3) with Intense Femtosecond Laser Pulses. Isr. J. Chem. 1994, 34, 103–114. [Google Scholar] [CrossRef]
- Ling, F.Z.; Wang, Y.M.; Li, S.; Wei, J.; Tang, Y.; Zhang, B. Imaging Reversible and Irreversible Structural Evolution in Photoexcited 2,4-Difluoroaniline. J. Phys. Chem. Lett. 2018, 9, 5468–5473. [Google Scholar] [CrossRef]
- Ling, F.Z.; Li, S.; Song, X.L.; Tang, Y.; Wang, Y.M.; Zhang, B. Visualization of coherent nuclear motion between different geometries in photoexcited 2,4-difluorophenol. Phys. Rev. A 2017, 95, 043421. [Google Scholar] [CrossRef]
- Lin, J.L.; Tzeng, W.B. Ionization energy of o-fluoroaniline and vibrational levels of o-fluoroaniline cation determined by mass-analyzed threshold ionization spectroscopy. Phys. Chem. Chem. Phys. 2000, 2, 3759–3763. [Google Scholar] [CrossRef]
- Waware, U.S.; Rashid, M.; Hamouda, A.M.S. Highly improved AC conductivity of poly (aniline-o-fluoroaniline). Ionics 2019, 25, 1057–1065. [Google Scholar] [CrossRef]
- Ling, F.Z.; Li, S.; Song, X.L.; Wang, Y.M.; Long, J.Y.; Zhang, B. Femtosecond time-resolved observation of butterfly vibration in electronically excited o-fluorophenol. Sci. Rep. 2017, 7, 15362. [Google Scholar] [CrossRef] [Green Version]
- Li, S.; Long, J.Y.; Ling, F.Z.; Wang, Y.M.; Song, X.l.; Zhang, S.; Zhang, B. Real-time visualization of the vibrational wavepacket dynamics in electronically excited pyrimidine via femtosecond time-resolved photoelectron imaging. J. Chem. Phys. 2017, 147, 044309. [Google Scholar] [CrossRef]
- Kim, J.; Woo, K.C.; Kim, S.K. Femtosecond Wavepacket Dynamics Reveals the Molecular Structures in the Excited (S1) and Cationic (D0) States. J. Phys. Chem. A 2021, 125, 6629–6635. [Google Scholar] [CrossRef]
- Stolow, A.; Bragg, A.E.; Neumark, D.M. Femtosecond time-resolved photoelectron spectroscopy. Chem. Rev. 2004, 104, 1719–1758. [Google Scholar] [CrossRef] [Green Version]
- Neumark, D.M. Time-resolved photoelectron spectroscopy of molecules and clusters. Annu. Rev. Phys. Chem. 2001, 52, 255–277. [Google Scholar] [CrossRef] [Green Version]
- Reid, K.L. Photoelectron Angular Distributions. Annu. Rev. Phys. Chem. 2003, 54, 397–424. [Google Scholar] [CrossRef]
- Suzuki, T. Femtosecond time-resolved photoelectron imaging. Annu. Rev. Phys. Chem. 2006, 57, 555–592. [Google Scholar] [CrossRef]
- Stavros, V.G.; Verlet, J.R.R. Gas-phase femtosecond particle spectroscopy: A bottom-up approach to nucleotide dynamics. Annu. Rev. Phys. Chem. 2016, 67, 211–232. [Google Scholar] [CrossRef]
- Carley, R.E.; Heesel, E.; Fielding, H.H. Femtosecond lasers in gas phase chemistry. Chem. Soc. Rev. 2005, 11, 949–969. [Google Scholar]
- Roberts, G.M.; Chatterley, A.S.; Young, J.D.; Stavros, V.G. Direct Observation of Hydrogen Tunneling Dynamics in Photoexcited Phenol. J. Phys. Chem. Lett. 2012, 3, 348–352. [Google Scholar] [CrossRef]
- Livingstone, R.A.; Thompson, J.O.F.; Iljina, M.; Donaldson, R.J.; Sussman, B.J.; Paterson, M.J.; Townsend, D. Time-resolved photoelectron imaging of excited state relaxation dynamics in phenol, catechol, resorcinol, and hydroquinone. J. Chem. Phys. 2012, 137, 184304. [Google Scholar] [CrossRef] [Green Version]
- Remmers, K.; Meerts, W.L.; Rentien, A.Z.; Barbu, K.L.; Lahmani, F. Structural information on the S0 and S1 state of o-fluorophenol by hole burning and high resolution ultraviolet spectroscopy. J. Chem. Phys. 2000, 112, 6237–6244. [Google Scholar] [CrossRef]
- Karsili, T.N.; Wenge, A.M.; Marchetti, B.; Ashfold, M.N. Symmetry matters: Photodissociation dynamics of symmetrically versus asymmetrically substituted phenols. Phys. Chem. Chem. Phys. 2014, 16, 588–598. [Google Scholar] [CrossRef] [Green Version]
- Wei, J.; Cao, L.; Song, X.L.; Wang, Y.M.; Zhang, S.; Zhang, B. Wavepacket dynamics of the excited (S1) state of 2,5-difluoroaniline by accidental resonance with the Rydberg states. J. Chem. Phys. 2022, 157, 204302. [Google Scholar] [CrossRef]
- Thompson, J.O.F.; Livingstone, R.A.; Townsend, D. Following the relaxation dynamics of photoexcited aniline in the 273-266 nm region using time-resolved photoelectron imaging. J. Chem. Phys. 2013, 139, 034316. [Google Scholar] [CrossRef]
- Ling, F.Z.; Li, S.; Wei, J.; Liu, K.; Wang, Y.M.; Zhang, B. Unraveling the electronic relaxation dynamics in photoexcited 2,4-difluoroaniline via femtosecond time-resolved photoelectron imaging. J. Chem. Phys. 2018, 148, 144311. [Google Scholar] [CrossRef]
- Kirkby, O.M.; Sala, M.; Balerdi, G.; Nalda, R.D.; Bañares, L.; Guérin, S.; Fielding, H.H. Comparing the electronic relaxation dynamics of aniline and d7-aniline following excitation at 272–238 nm. Phys. Chem. Chem. Phys. 2015, 17, 16270–16276. [Google Scholar] [CrossRef] [Green Version]
- Liu, Y.Z.; Qin, C.C.; Zhang, S.; Wang, Y.M.; Zhang, B. Ultrafast Dynamics of the First Excited State of Chlorobenzene. Acta Phys.-Chim. Sin. 2011, 27, 965–970. [Google Scholar]
- Parker, D.S.N.; Minns, R.S.; Penfold, T.J.; Worth, G.A.; Fielding, H.H. Ultrafast dynamics of the S1 excited state of benzene. Chem. Phys. Lett. 2009, 469, 43–47. [Google Scholar] [CrossRef]
- Scheps, R.; Florida, D.; Rice, S.A. Influence of large amplitude vibrational motion on the rate of intersystem crossing: A study of single vibronic level fluorescence from aniline- h7, aniline N, N-d2, aniline- d5, and aniline- d7. J. Chem. Phys. 1974, 61, 1730–1747. [Google Scholar] [CrossRef]
- Robin, M.B. Higher Excited States of Polyatomic Molecules; Academic Press: New York, NY, USA, 1974; Volume 1. [Google Scholar]
- Lu, T.; Chen, F.W. Multiwfn: A multifunctional wavefunction analyzer. J. Comput. Chem. 2012, 33, 580–592. [Google Scholar] [CrossRef]
- Davidson, E.R. Comment on Dunning’s correlation-consistent basis sets. Chem. Phys. Lett. 1996, 260, 514. [Google Scholar] [CrossRef]
- Yang, S.C.; Tzeng, W.B. Mass-analyzed threshold ionization spectroscopy of deuterium-substituted isotopomers of o-fluoroaniline and m-fluoroaniline cations. J. Mol. Spectrosc. 2011, 269, 49–55. [Google Scholar] [CrossRef]
- Spesyvtsev, R.; Horio, T.; Suzuki, Y.I.; Suzuki, T. Observation of the wavepacket dynamics on the 1B2(1Σu+) state of CS2 by sub-20 fs photoelectron imaging using 159 nm probe pulses. J. Chem. Phys. 2015, 142, 074308. [Google Scholar] [CrossRef]
- Hao, Q.L.; Long, J.Y.; Deng, X.L.; Tang, Y.; Abulimiti, B.; Zhang, B. Superexcited State Dynamics of OCS: An Experimental Identification of Three Competing Decay-Channels Among Autoionization, Internal Conversion and Neutral Predissociation. J. Phys. Chem. A 2017, 121, 3858–3863. [Google Scholar] [CrossRef]
- Dribinski, V.; Ossadtchi, A.; Mandelshtam, V.A.; Reisler, H. Reconstruction of Abel-transformable images: The Gaussian basis-set expansion Abel transform method. Rev. Sci. Instrum. 2002, 73, 2634–2642. [Google Scholar] [CrossRef] [Green Version]
- Frisch, M.J.; Trucks, G.W.; Schlegel, H.B.; Scuseria, G.E.; Robb, M.A.; Cheeseman, J.R.; Scalmani, G.; Barone, V.; Mennucci, B.; Petersson, G.A.; et al. Gaussian09 Revision D. 01; Gaussian, Inc.: Wallingford, UK, 2010. [Google Scholar]
- Lu, T. Molclus Program, Version 1.9.9.7. Available online: http://www.keinsci.com/research/molclus.html (accessed on 16 December 2021).
- Stephens, P.J.; Devlin, F.J.; Chabalowski, C.F.; Frisch, M.J. Ab Initio Calculation of Vibrational Absorption and Circular Dichroism Spectra Using Density Functional Force Fields. J. Phys. Chem. 1994, 98, 247–257. [Google Scholar] [CrossRef]
- McLean, A.D.; Chandler, G.S. Contracted Gaussian-basis sets for molecular calculations. 1. 2nd row atoms, Z = 11–18. J. Chem. Phys. 1980, 72, 5639. [Google Scholar] [CrossRef]
- Raghavachari, K.; Binkley, J.S.; Seeger, R.; Pople, J.A. Self-Consistent Molecular Orbital Methods. 20. Basis set for correlated wave-functions. J. Chem. Phys. 1980, 72, 650. [Google Scholar]
- Liu, Z.Y.; Lu, T.; Chen, Q.X. An sp-hybridized all-carboatomic ring, cyclo 18 carbon: Electronic structure, electronic spectrum, and optical nonlinearity. Carbon 2020, 165, 461–467. [Google Scholar] [CrossRef]


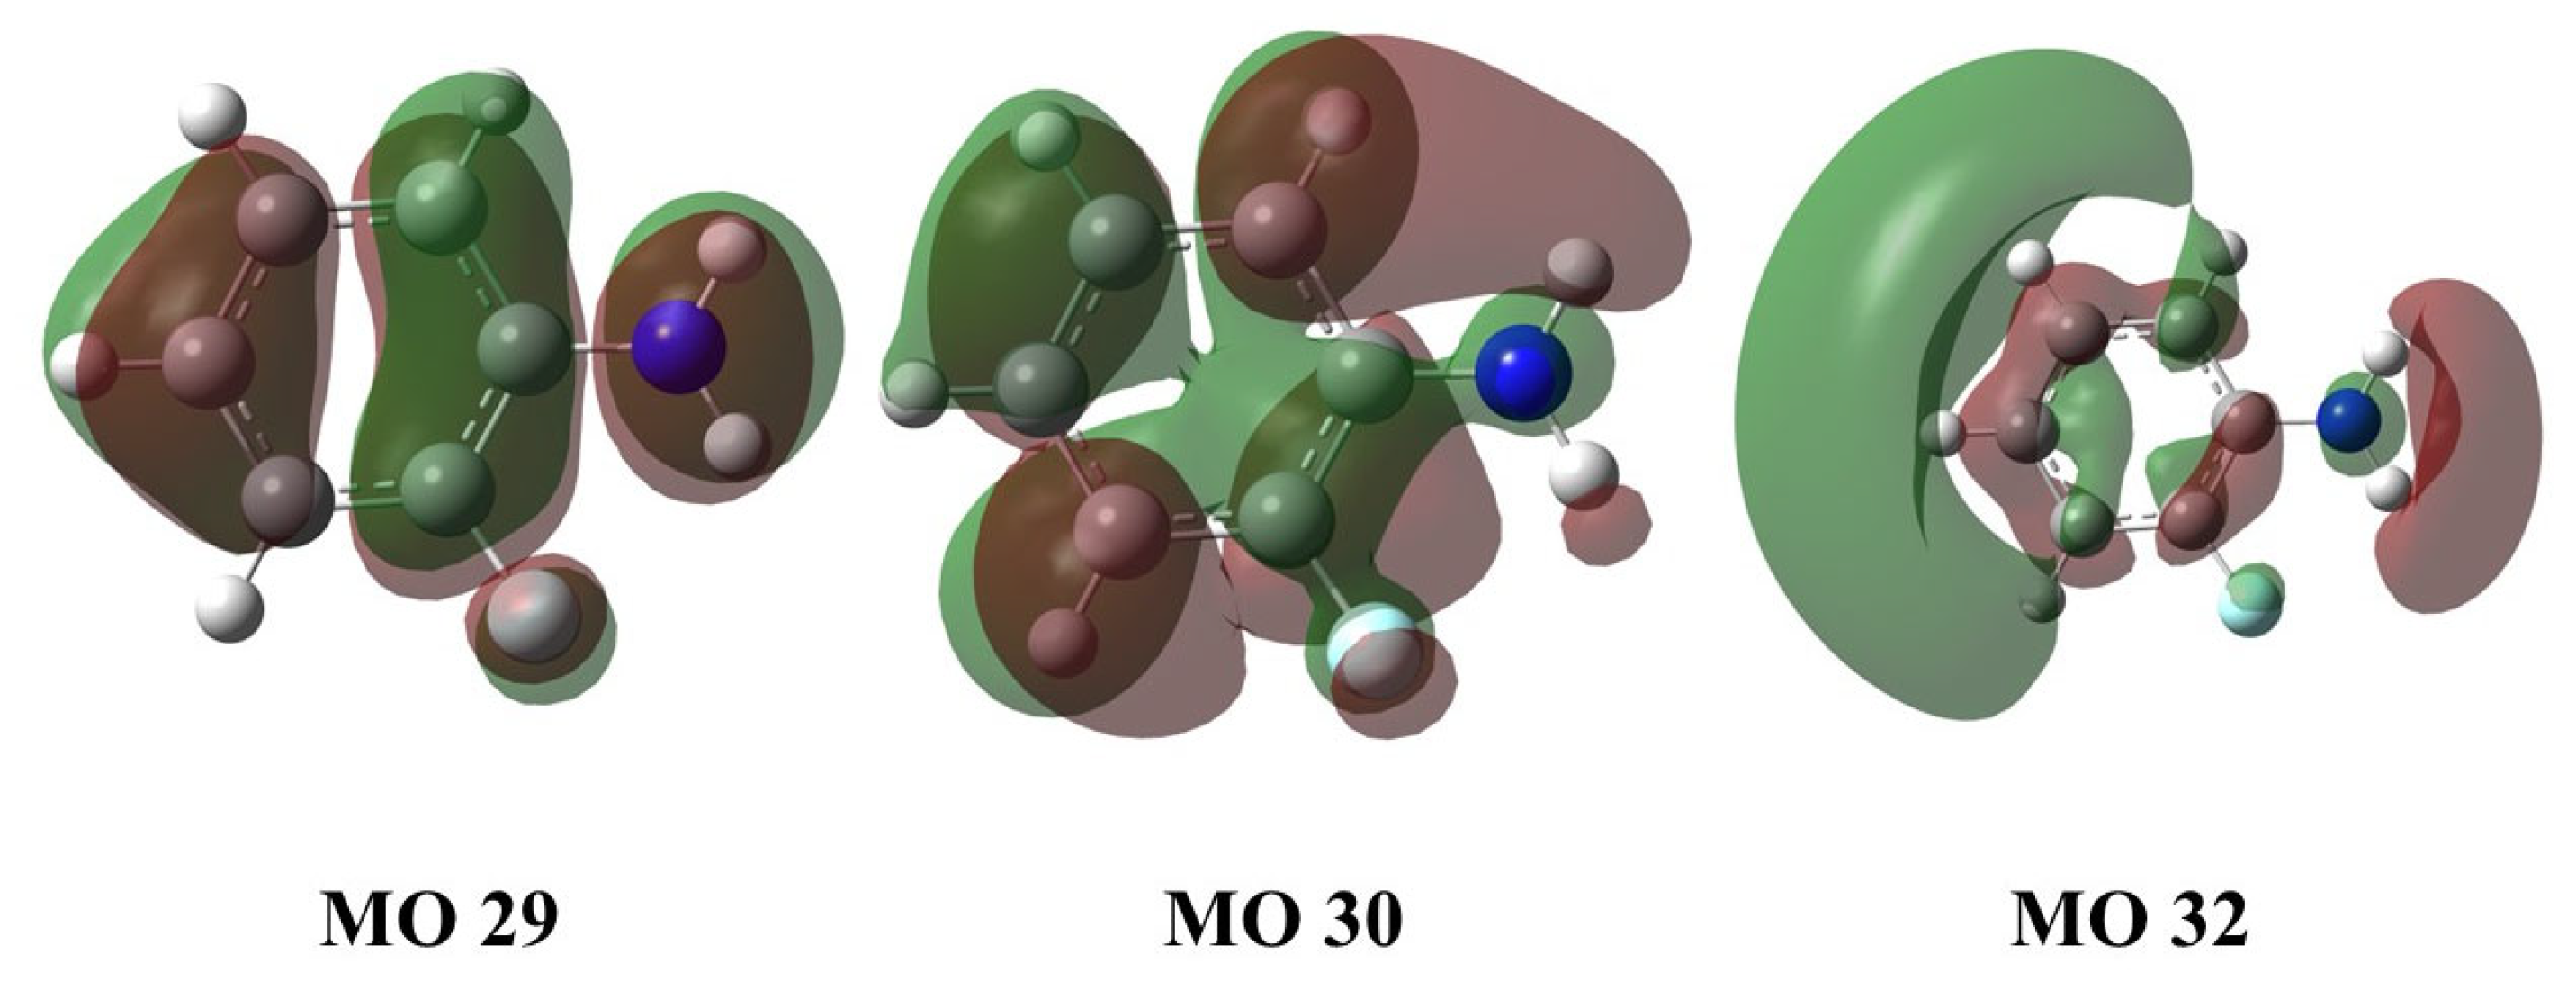
| State | Transition | Wavelength/nm | E/eV | f |
|---|---|---|---|---|
| S1 | 29 → 30 | 291.88 | 4.25 | 0.0600 |
| S2 | 29 → 32 | 243.54 | 5.09 | 0.0107 |
| T1 | 30 → 32 | 359.37 | 3.45 | 0.0023 |
| Theoretical Value | Experimental Value | |||||||
|---|---|---|---|---|---|---|---|---|
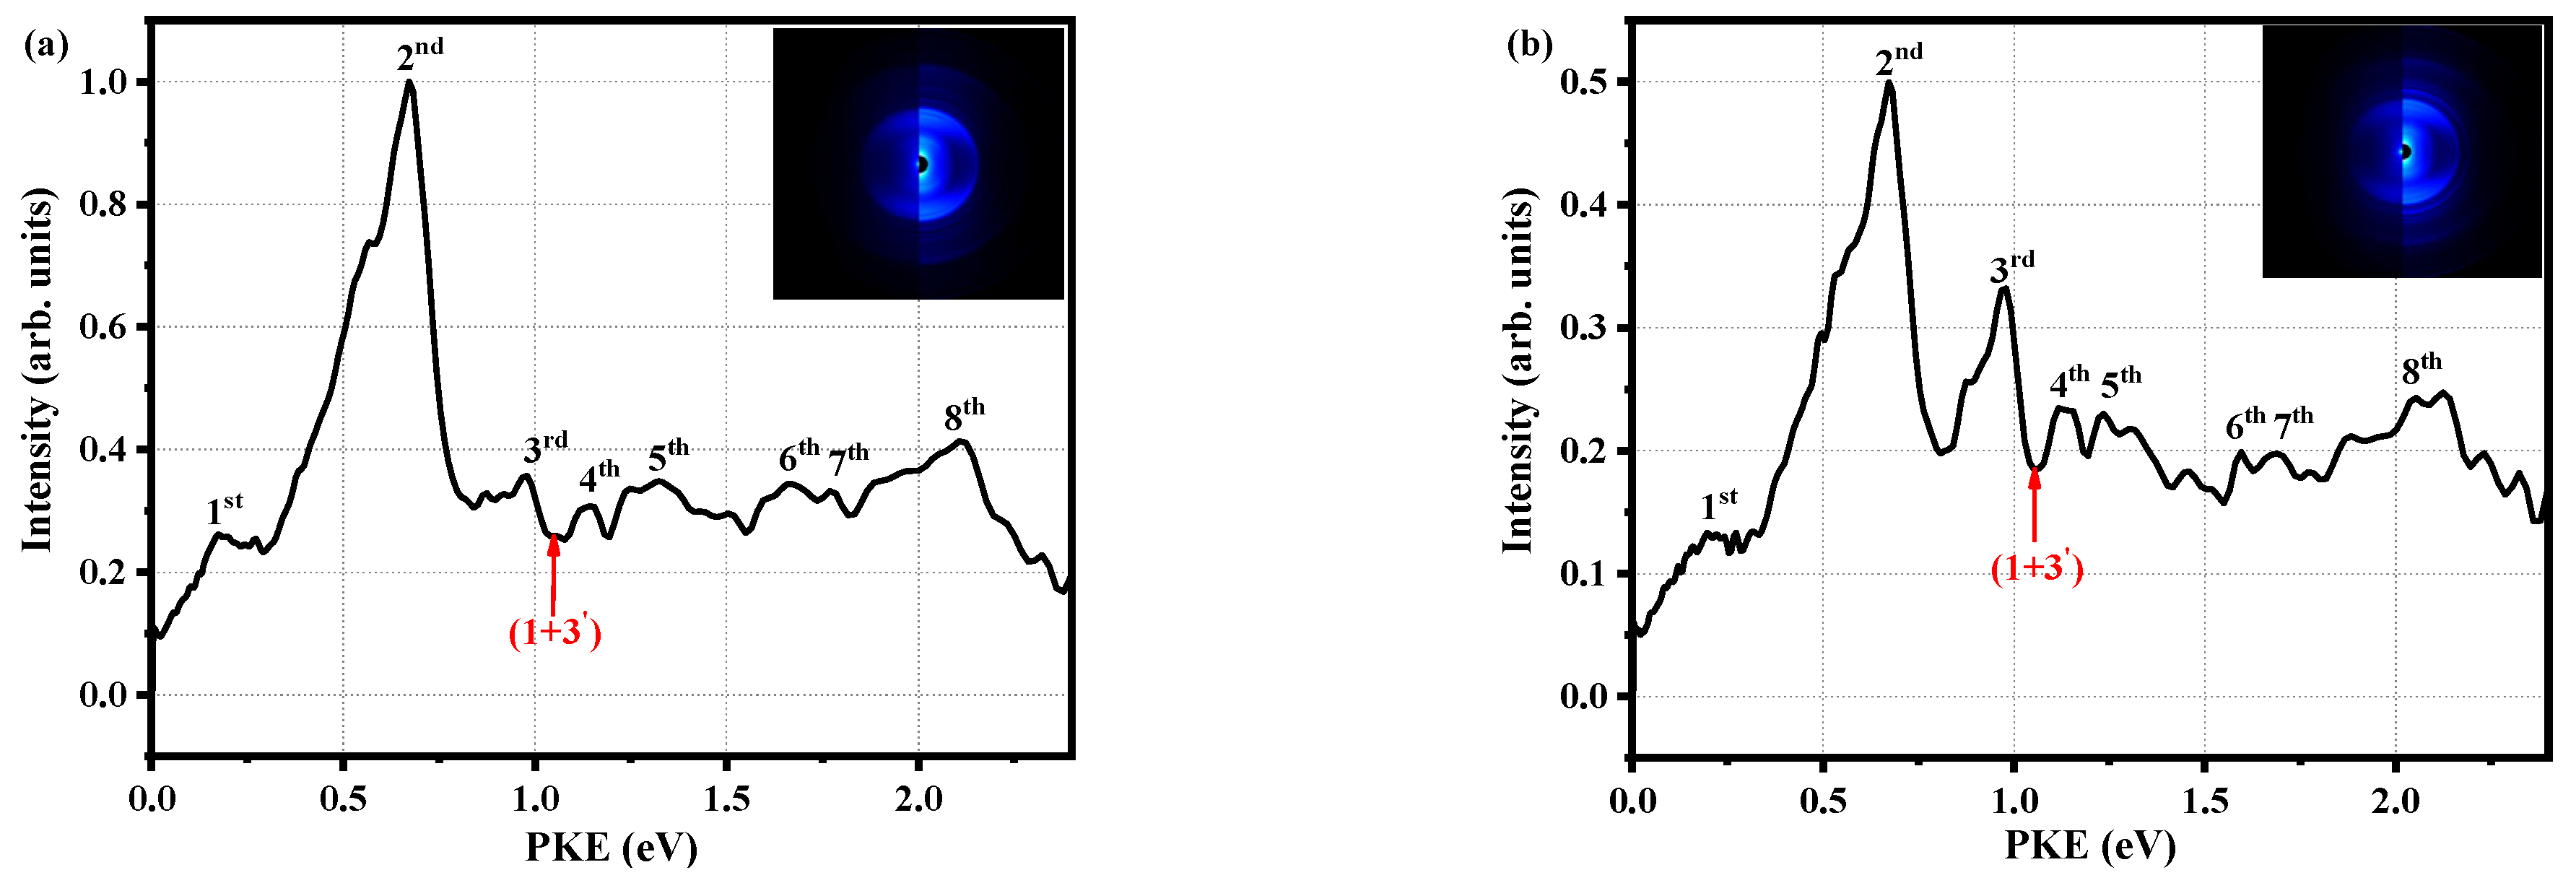
| Peaks | PKE (eV) | HDI | EDI | E (eV) | n | δ | T (eV) | States |
| 1st | 0.18 | 11.31 | 2.72 | 5.11 | 3 | 0.84 | 4.97 | 3s |
| 2nd | 0.67 | 3 | 0.63 | 5.46 | 3pz | |||
| 3rd | 0.98 | 9.64 | 3.84 | 5.70 | 3 | 0.47 | 5.77 | 3py |
| 4th | 1.14 | 10.31 | 1.79 | 5.88 | 3 | 0.36 | 5.93 | 3px |
| 6th | 1.67 | 8.20 | 1.61 | 6.44 | 4 | 0.91 | 6.46 | 4s |
| 7th | 1.77 | 11.31 | 2.72 | 5.11 | 3 | 0.83 | 5.01 | 3s |
| 8th | 2.11 | 8.72 | 2.99 | 6.67 | 4 | 0.29 | 6.90 | 4py |
| Vibrational State | v1 | ||||
|---|---|---|---|---|---|
| Frequency (cm−1) | 21 | 52 | 84 | 105 | 126 |
| Periodicity (fs) | 1588 | 642 | 397 | 318 | 265 |
Disclaimer/Publisher’s Note: The statements, opinions and data contained in all publications are solely those of the individual author(s) and contributor(s) and not of MDPI and/or the editor(s). MDPI and/or the editor(s) disclaim responsibility for any injury to people or property resulting from any ideas, methods, instructions or products referred to in the content. |
© 2023 by the authors. Licensee MDPI, Basel, Switzerland. This article is an open access article distributed under the terms and conditions of the Creative Commons Attribution (CC BY) license (https://creativecommons.org/licenses/by/4.0/).
Share and Cite
Abulimiti, B.; An, H.; Gu, Z.; Deng, X.; Zhang, B.; Xiang, M.; Wei, J. Femtosecond Time-Resolved Observation of Relaxation and Wave Packet Dynamics of the S1 State in Electronically Excited o-Fluoroaniline. Molecules 2023, 28, 1999. https://doi.org/10.3390/molecules28041999
Abulimiti B, An H, Gu Z, Deng X, Zhang B, Xiang M, Wei J. Femtosecond Time-Resolved Observation of Relaxation and Wave Packet Dynamics of the S1 State in Electronically Excited o-Fluoroaniline. Molecules. 2023; 28(4):1999. https://doi.org/10.3390/molecules28041999
Chicago/Turabian StyleAbulimiti, Bumaliya, Huan An, Zhenfei Gu, Xulan Deng, Bing Zhang, Mei Xiang, and Jie Wei. 2023. "Femtosecond Time-Resolved Observation of Relaxation and Wave Packet Dynamics of the S1 State in Electronically Excited o-Fluoroaniline" Molecules 28, no. 4: 1999. https://doi.org/10.3390/molecules28041999