

Sustainable Synthesis of Bright Fluorescent Nitrogen-Doped Carbon Dots from Terminalia chebula for In Vitro Imaging

 ,
,  , ,
, ,  , ,
, ,  and
and 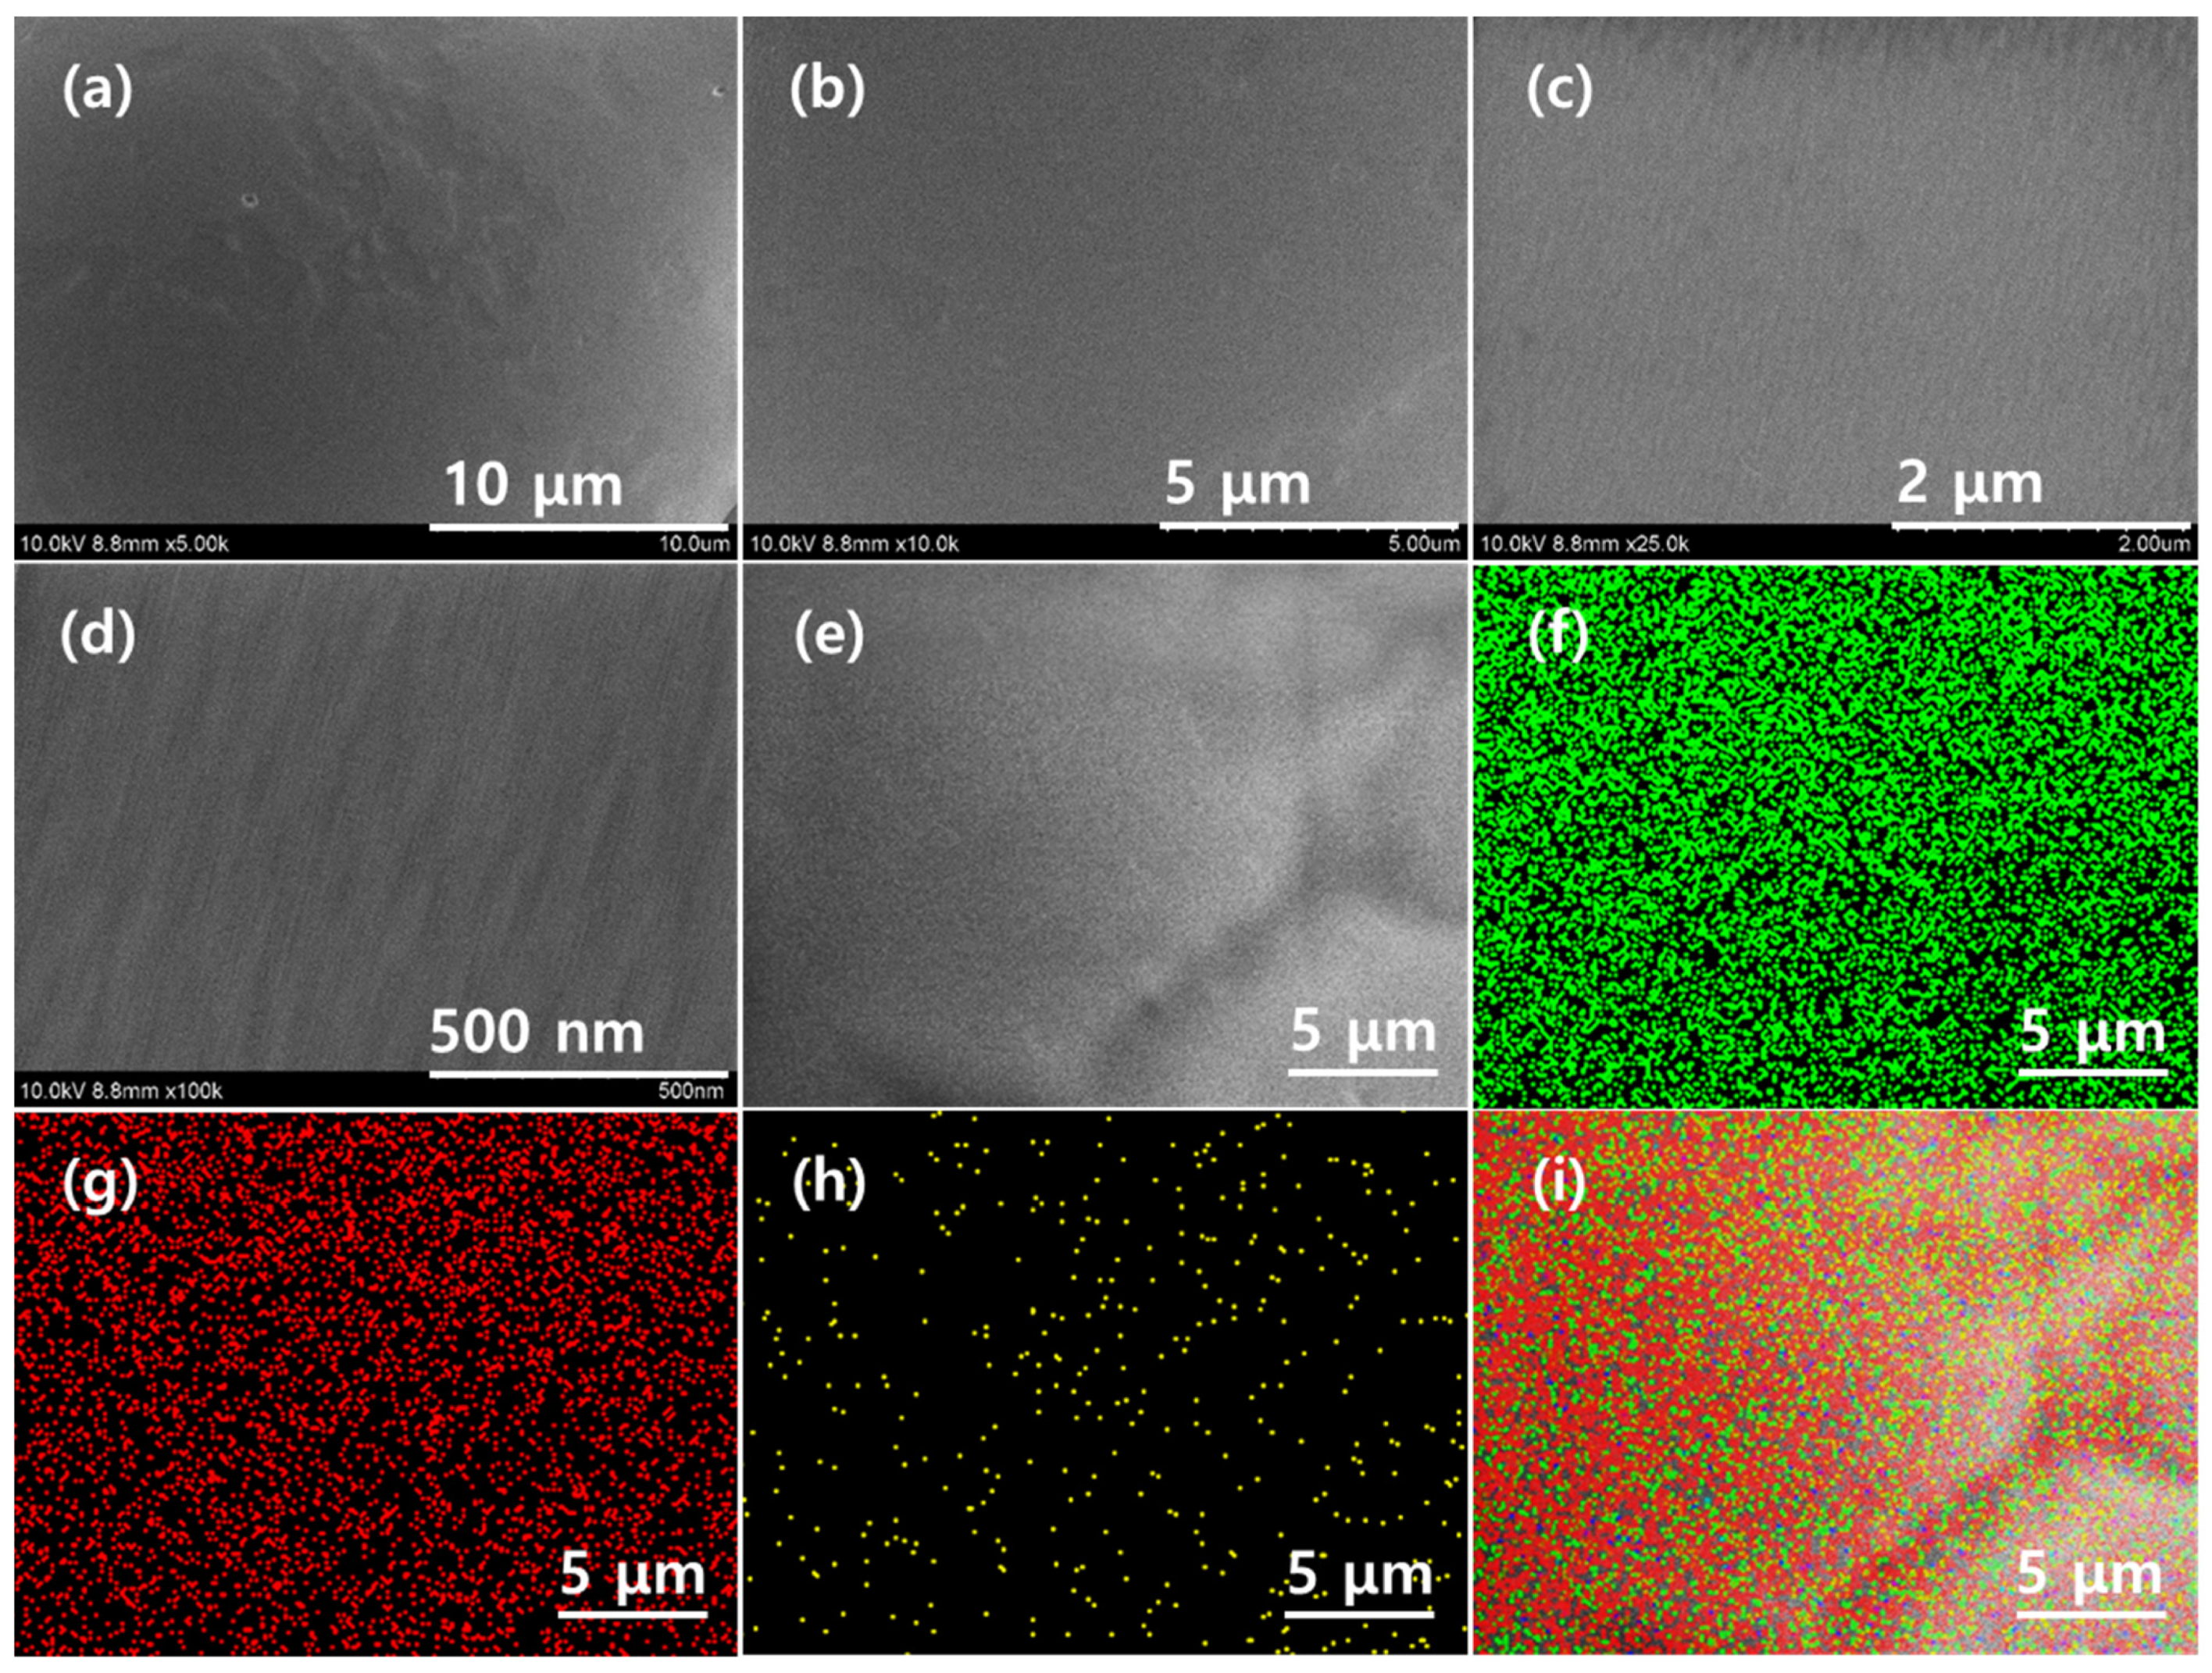
Abstract
:1. Introduction
2. Results and Discussion
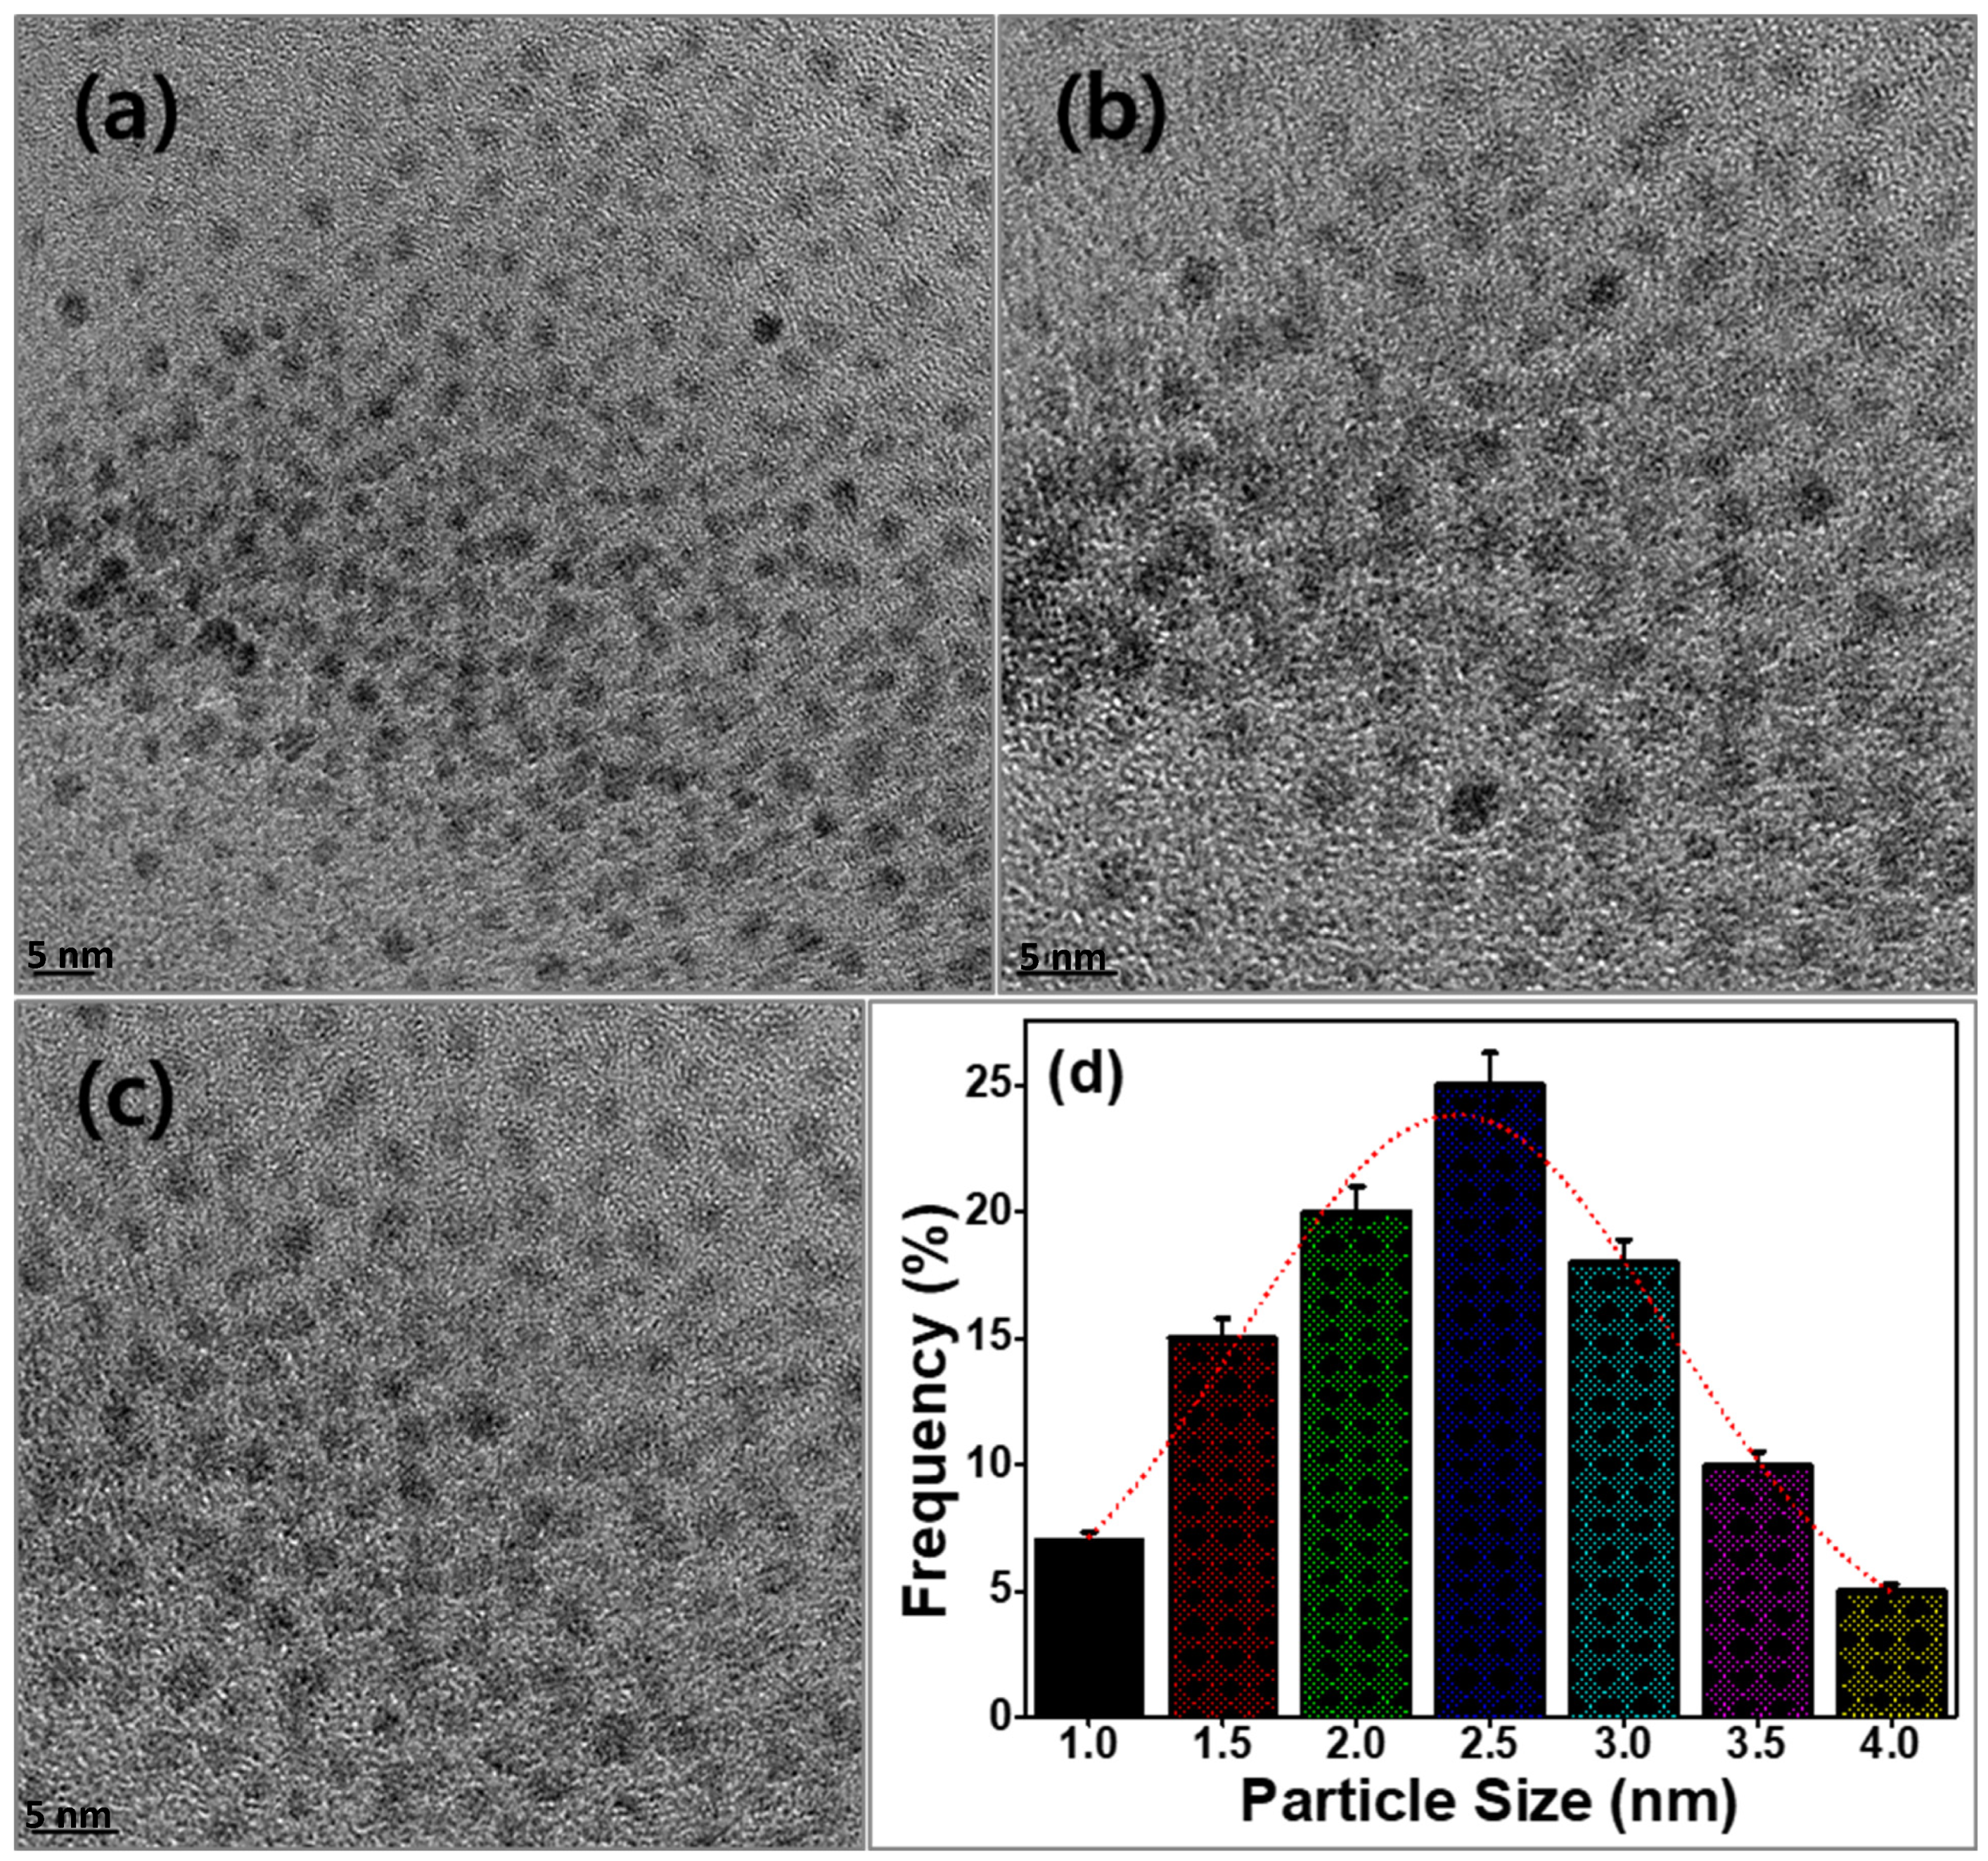
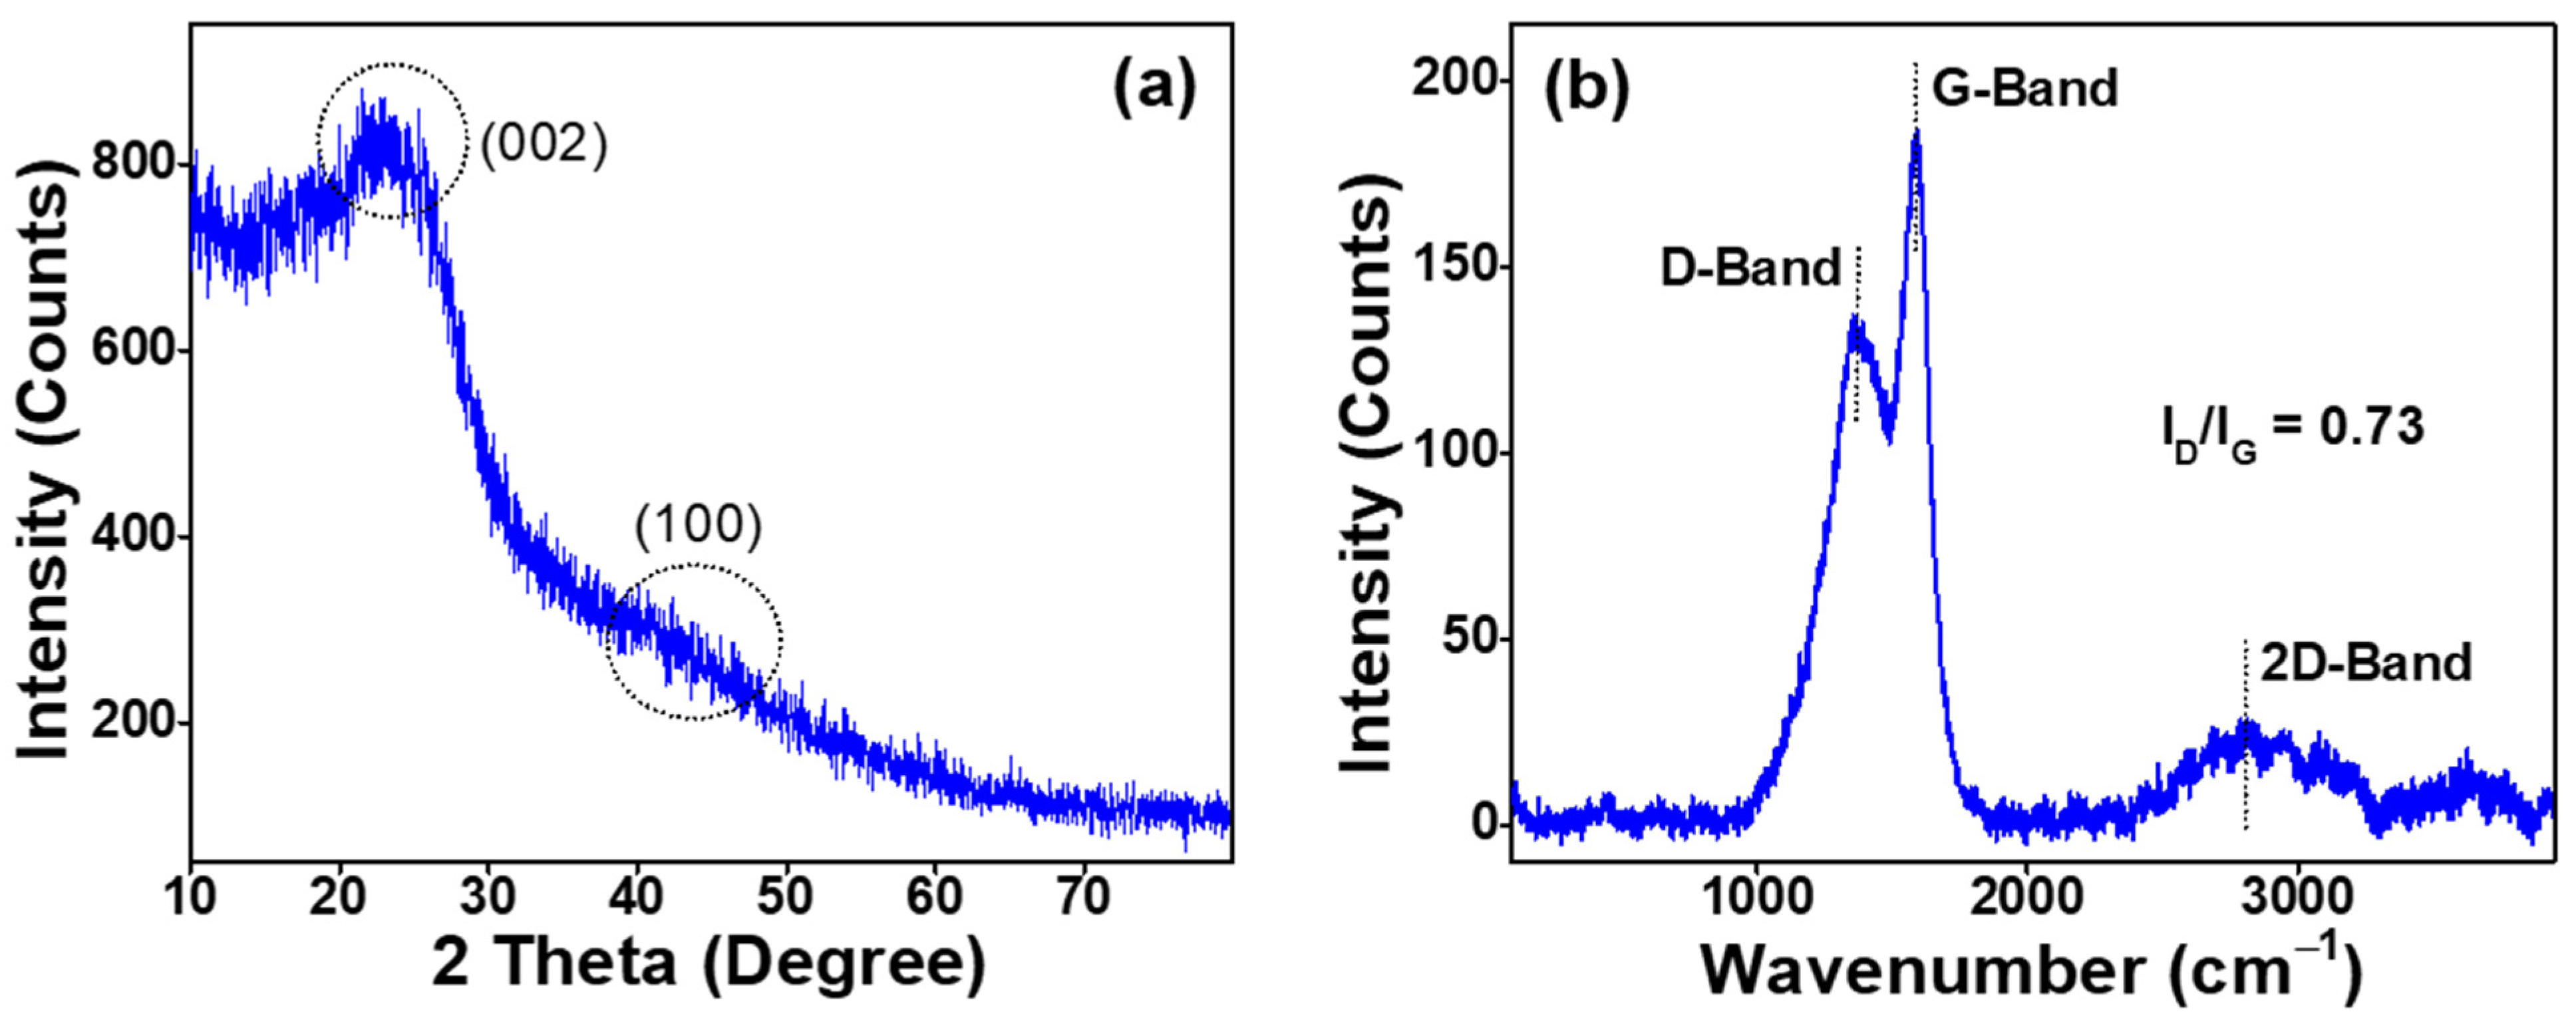
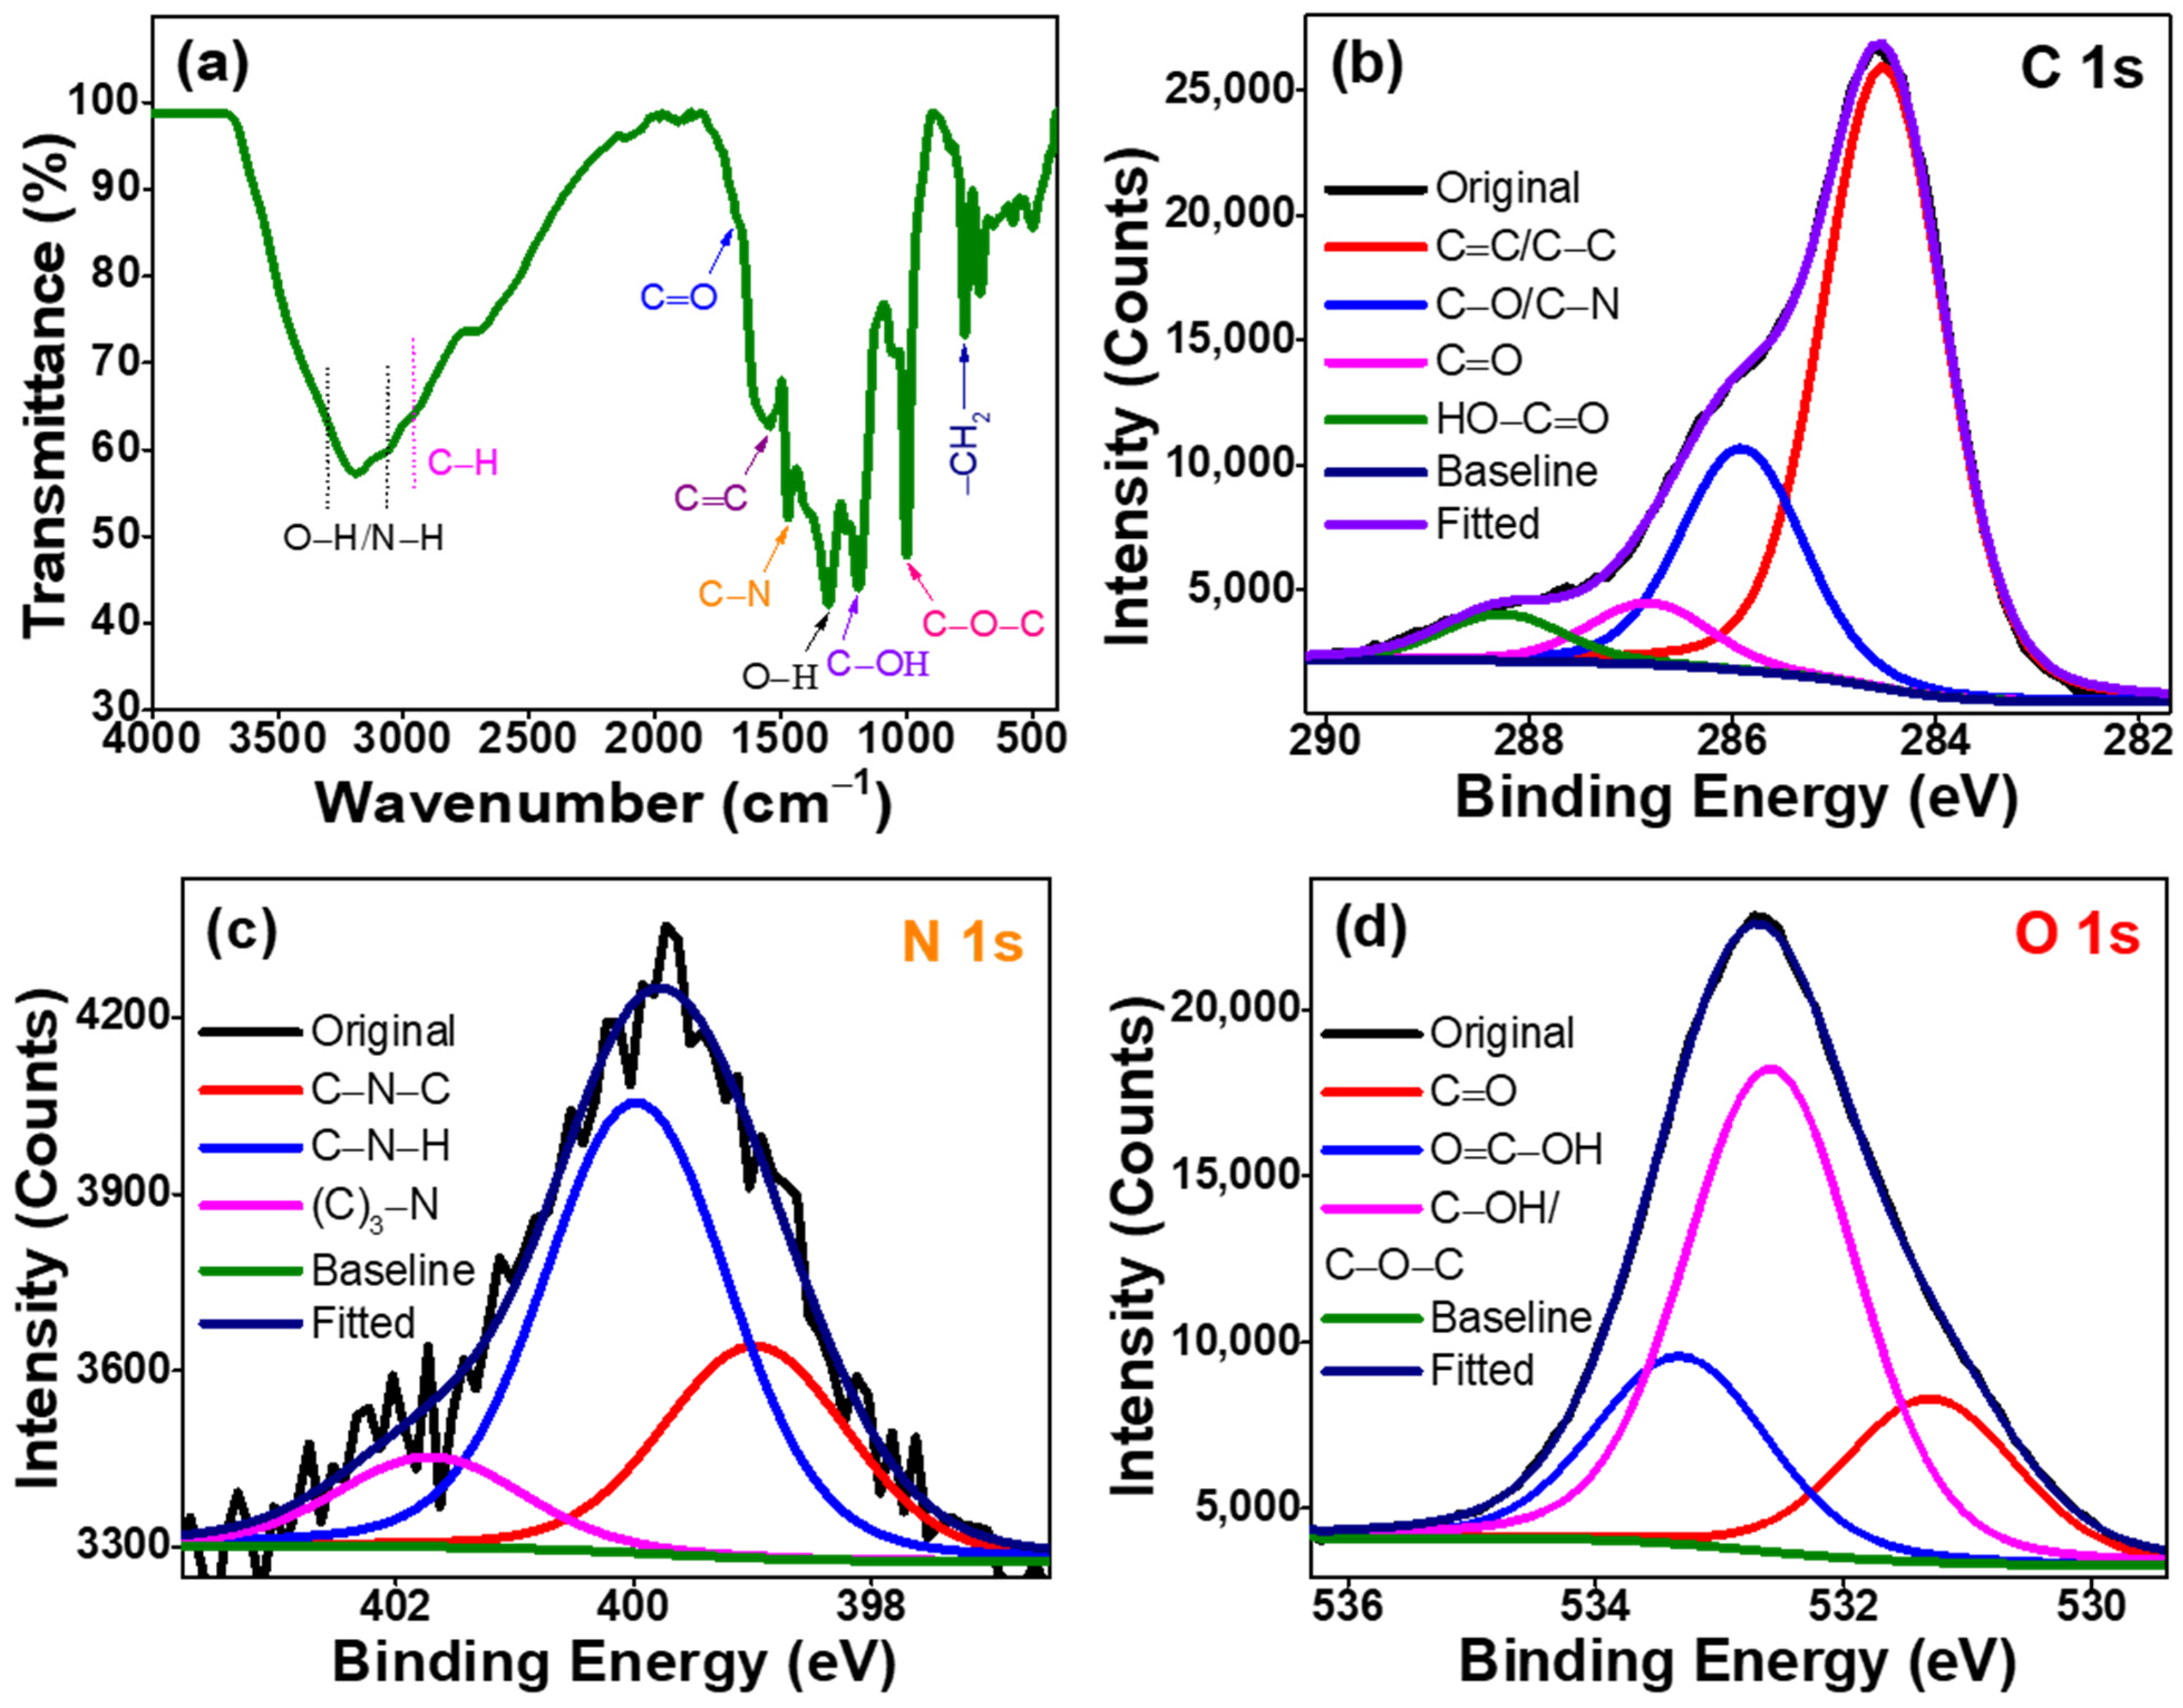
2.1. Structural Properties of Synthesized TC-CDs
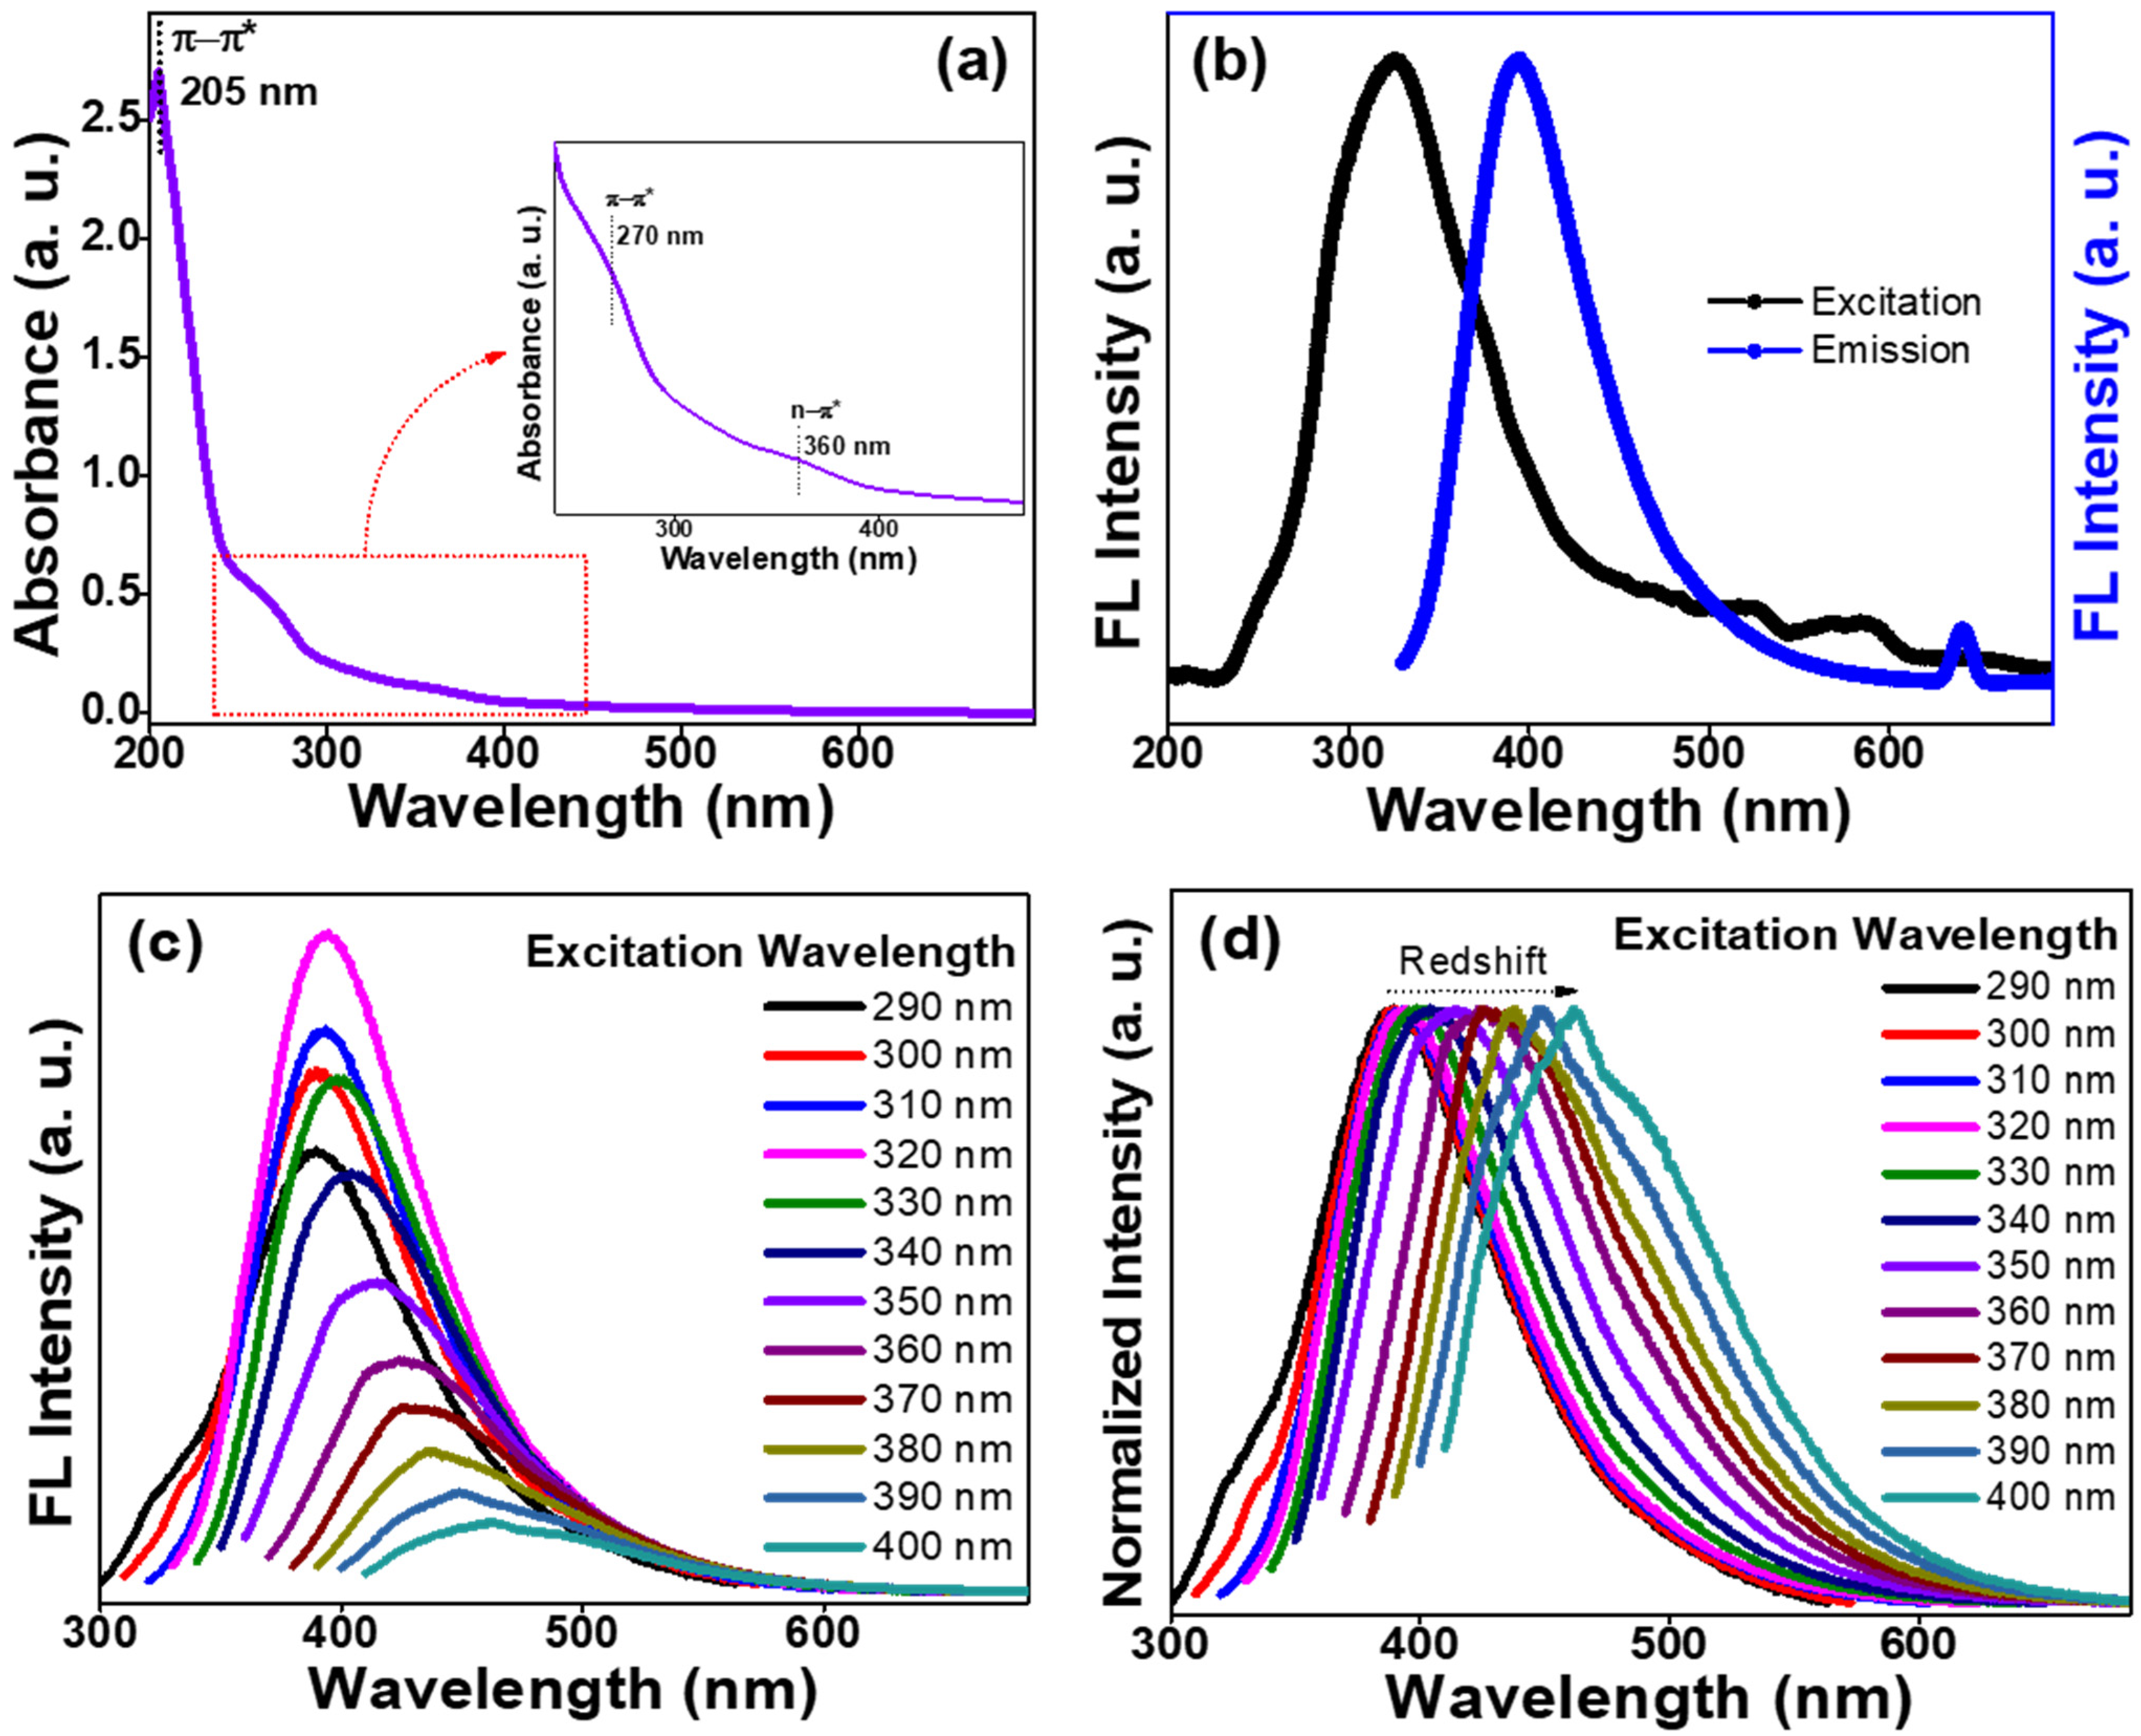
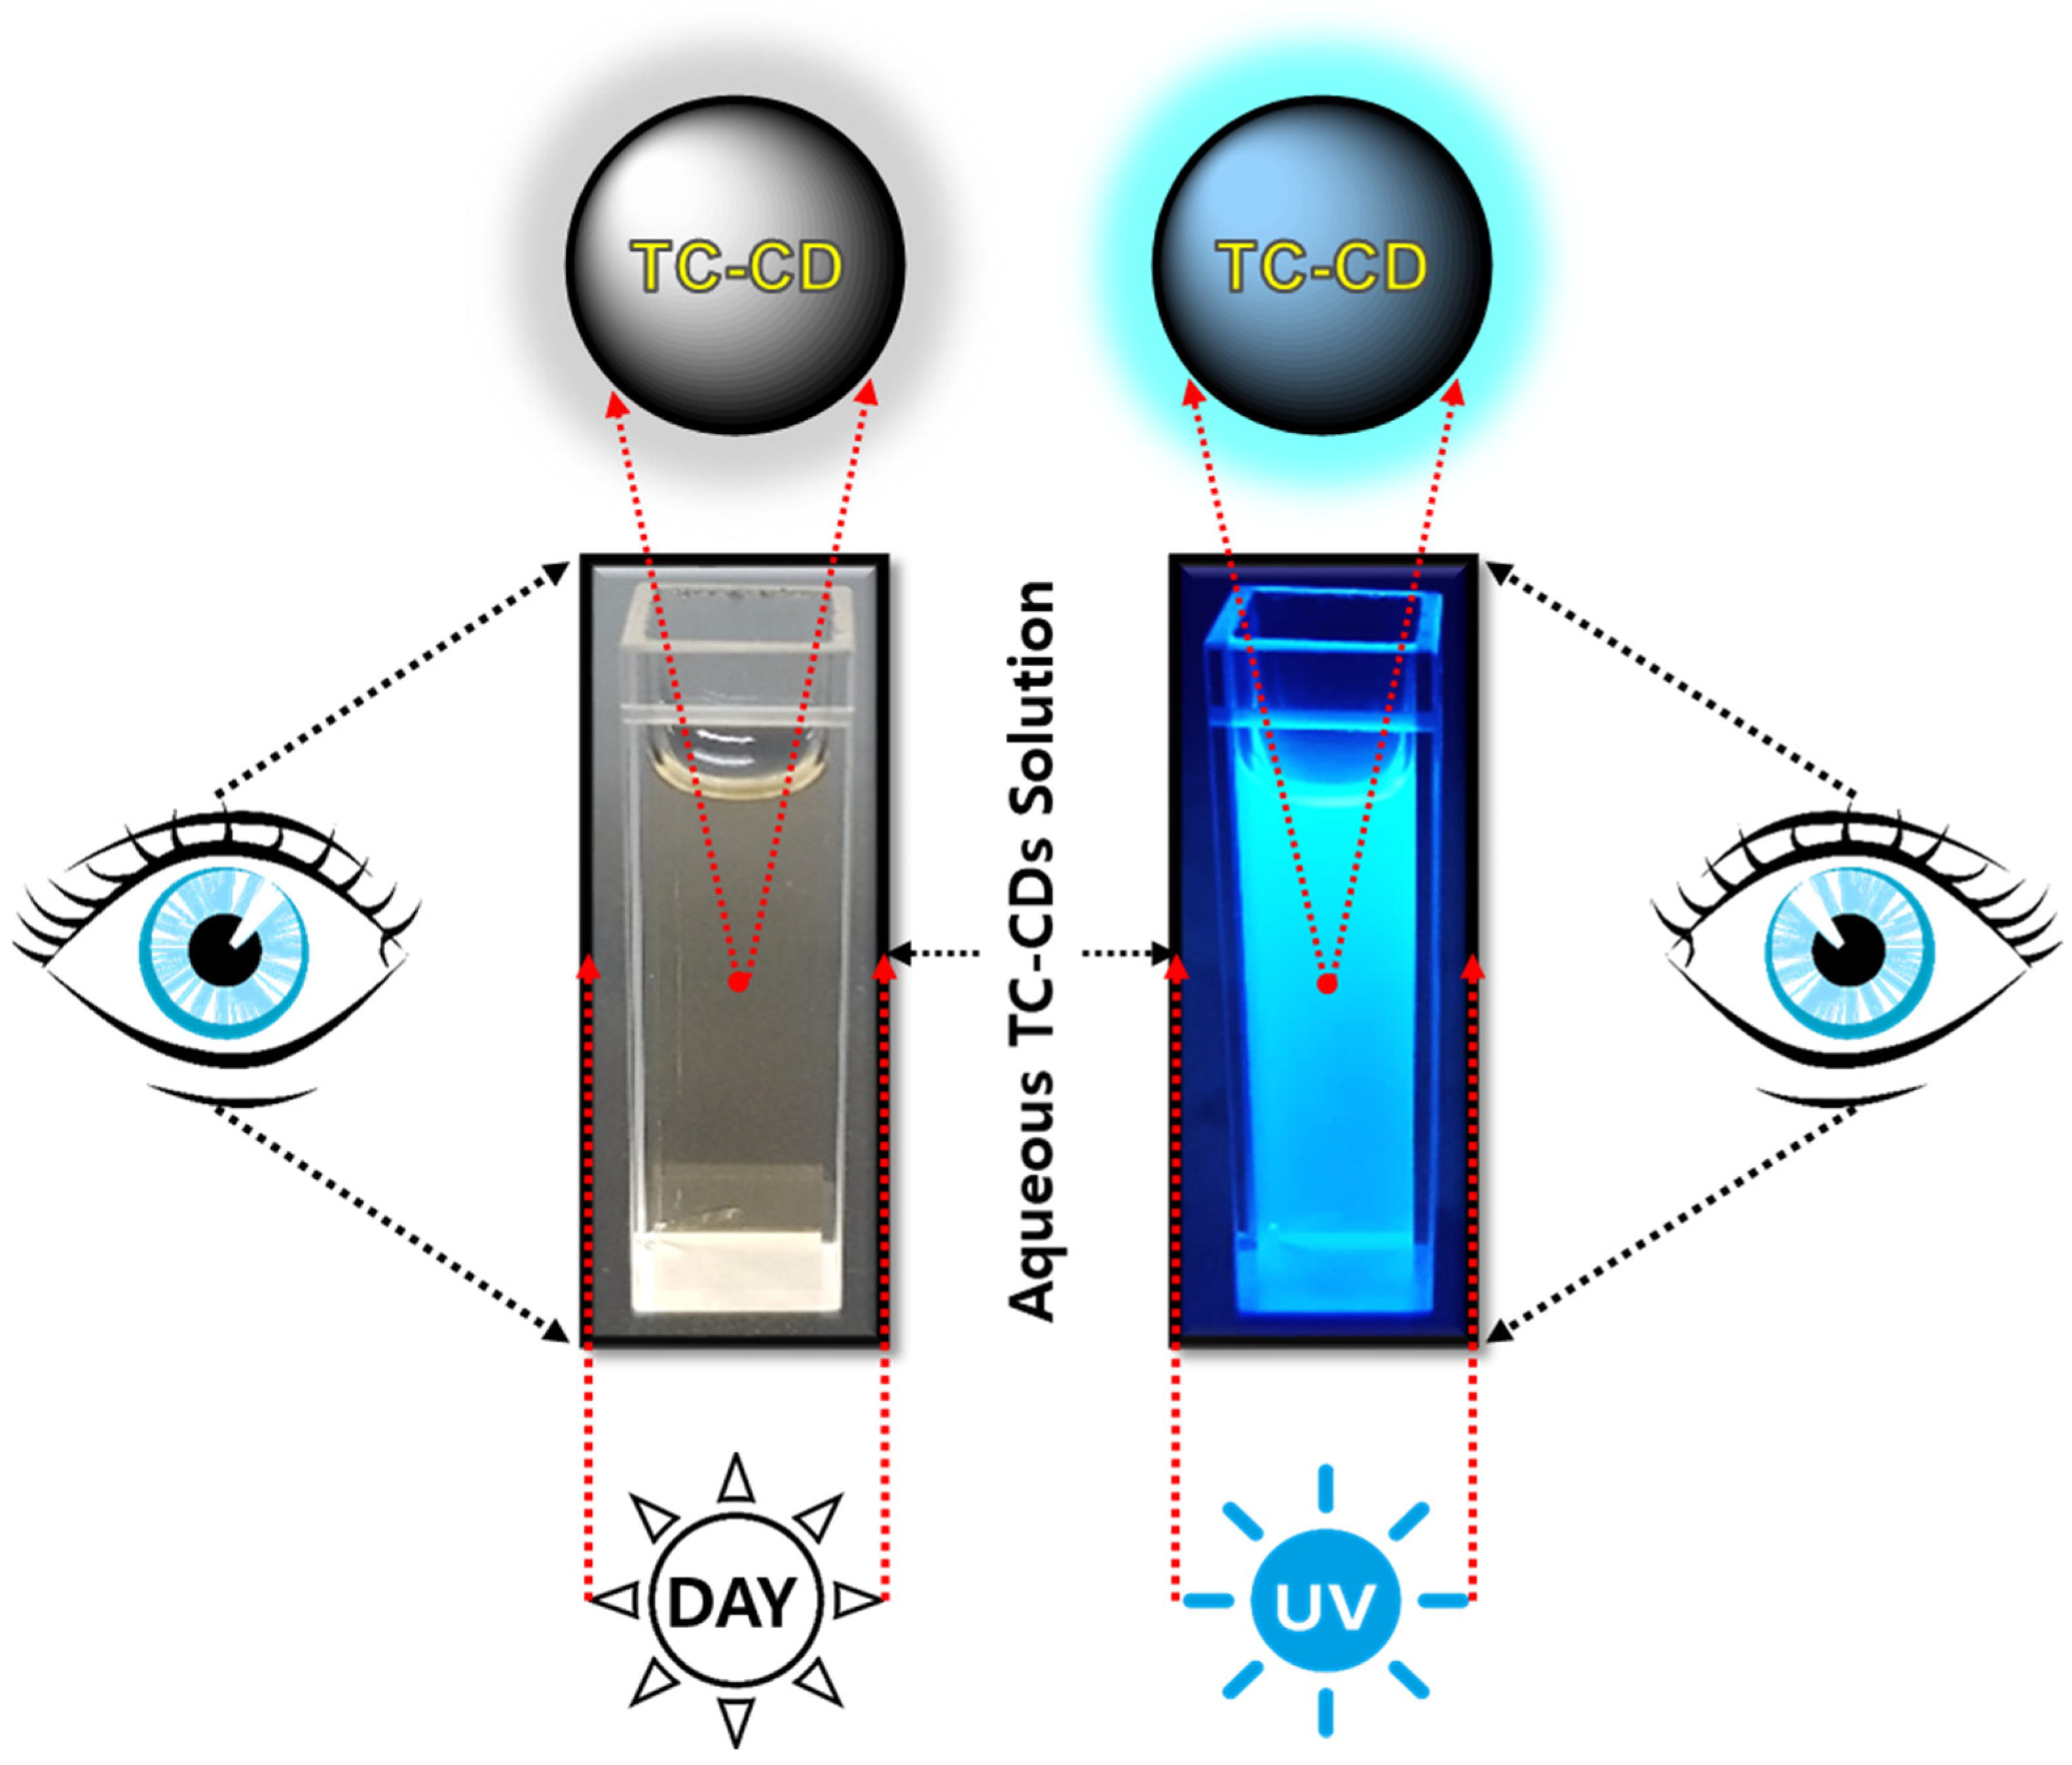
2.2. Optical Properties of Synthesized TC-CDs
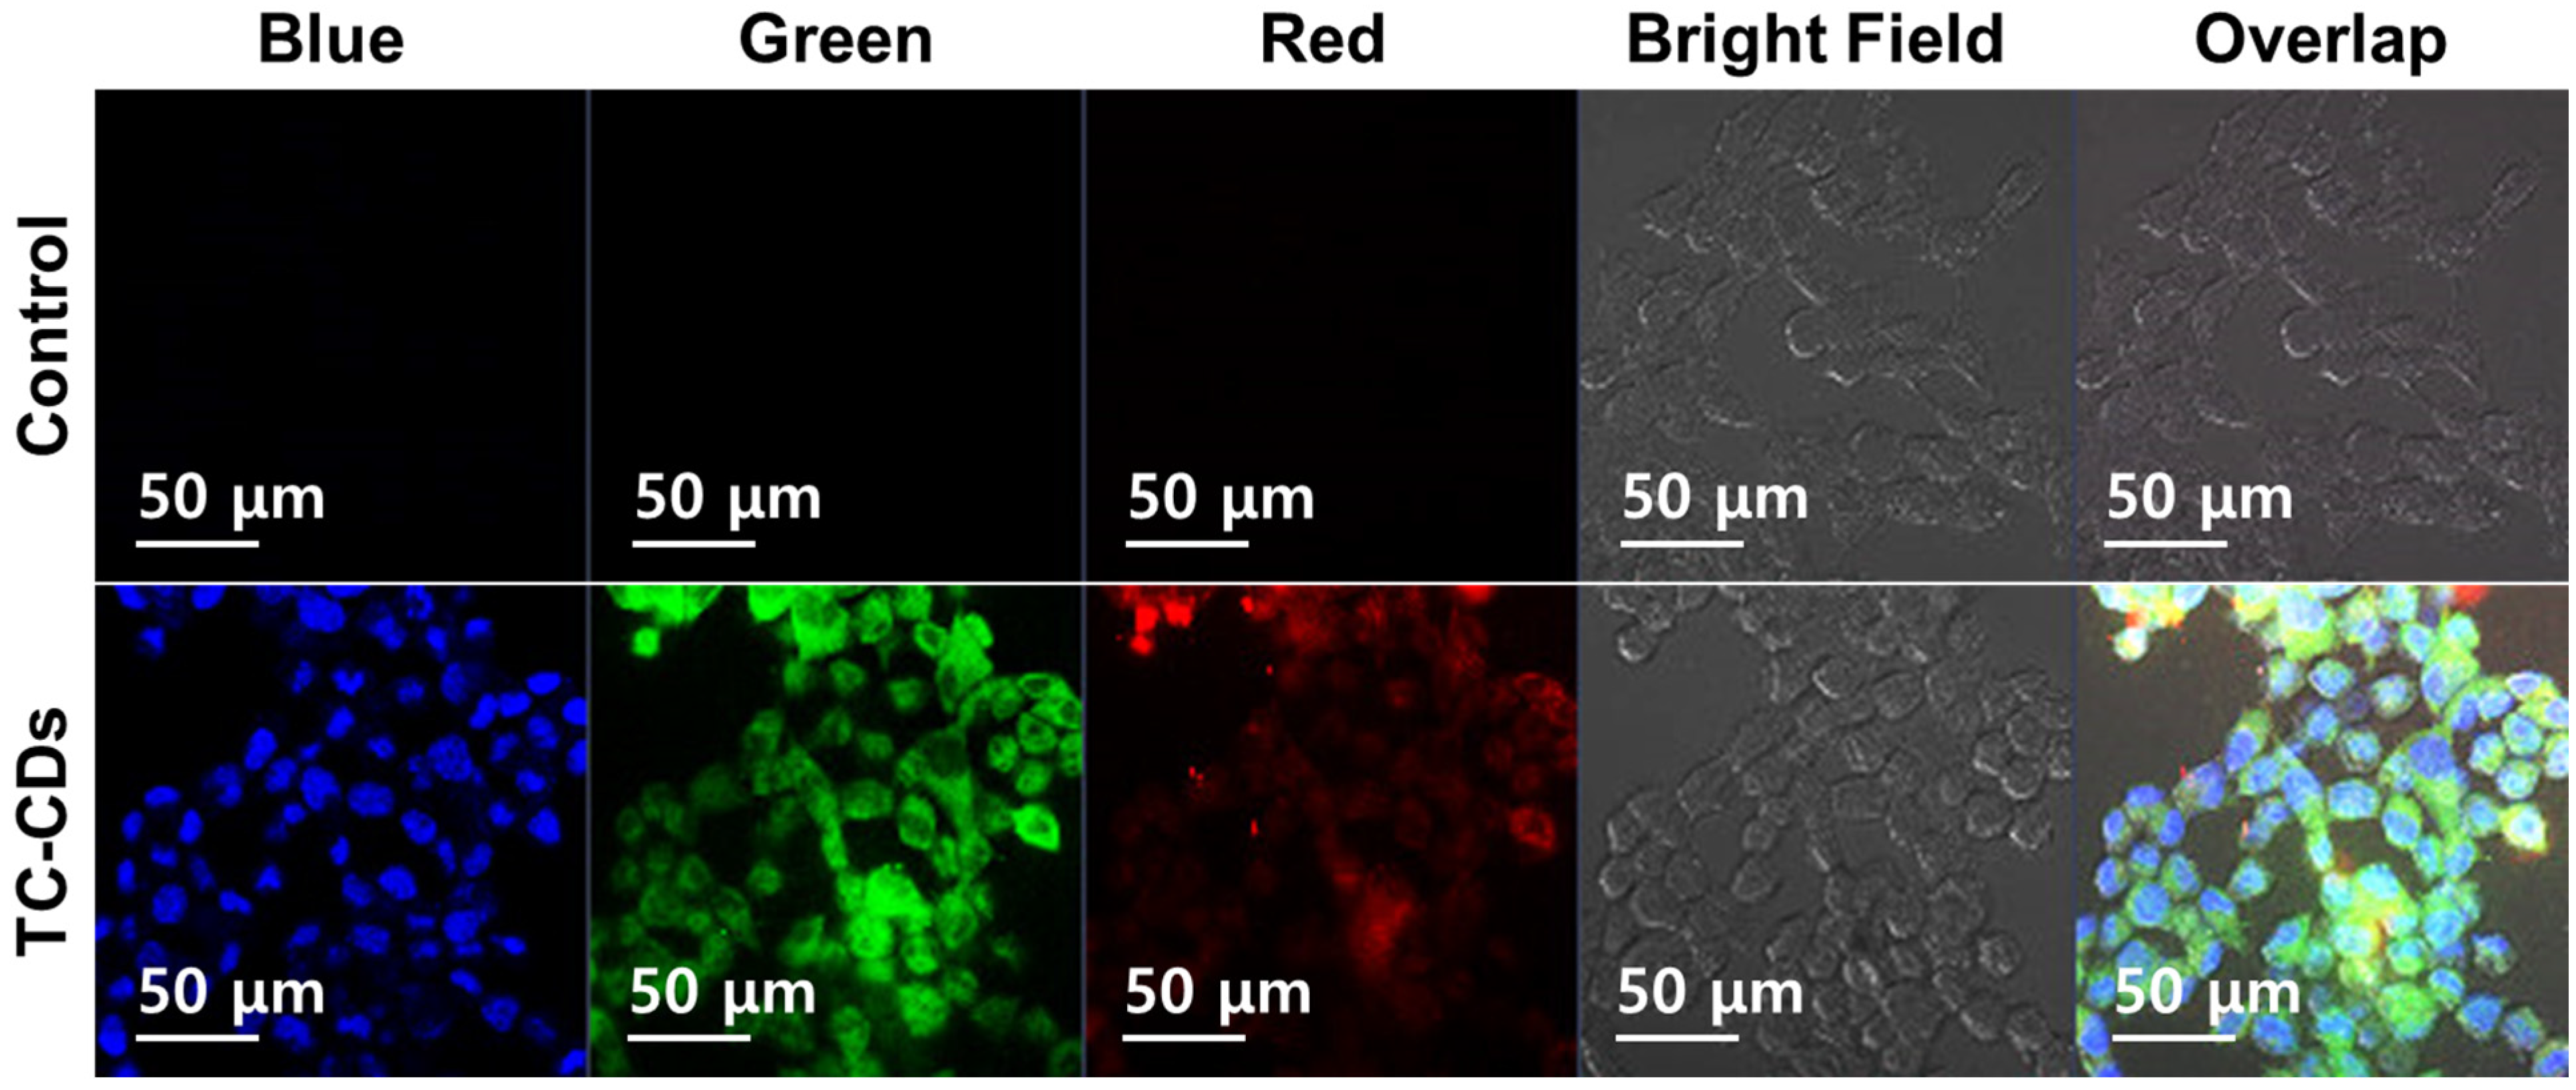
2.3. Bioimaging Applications of Synthesized TC-CDs
3. Conclusions
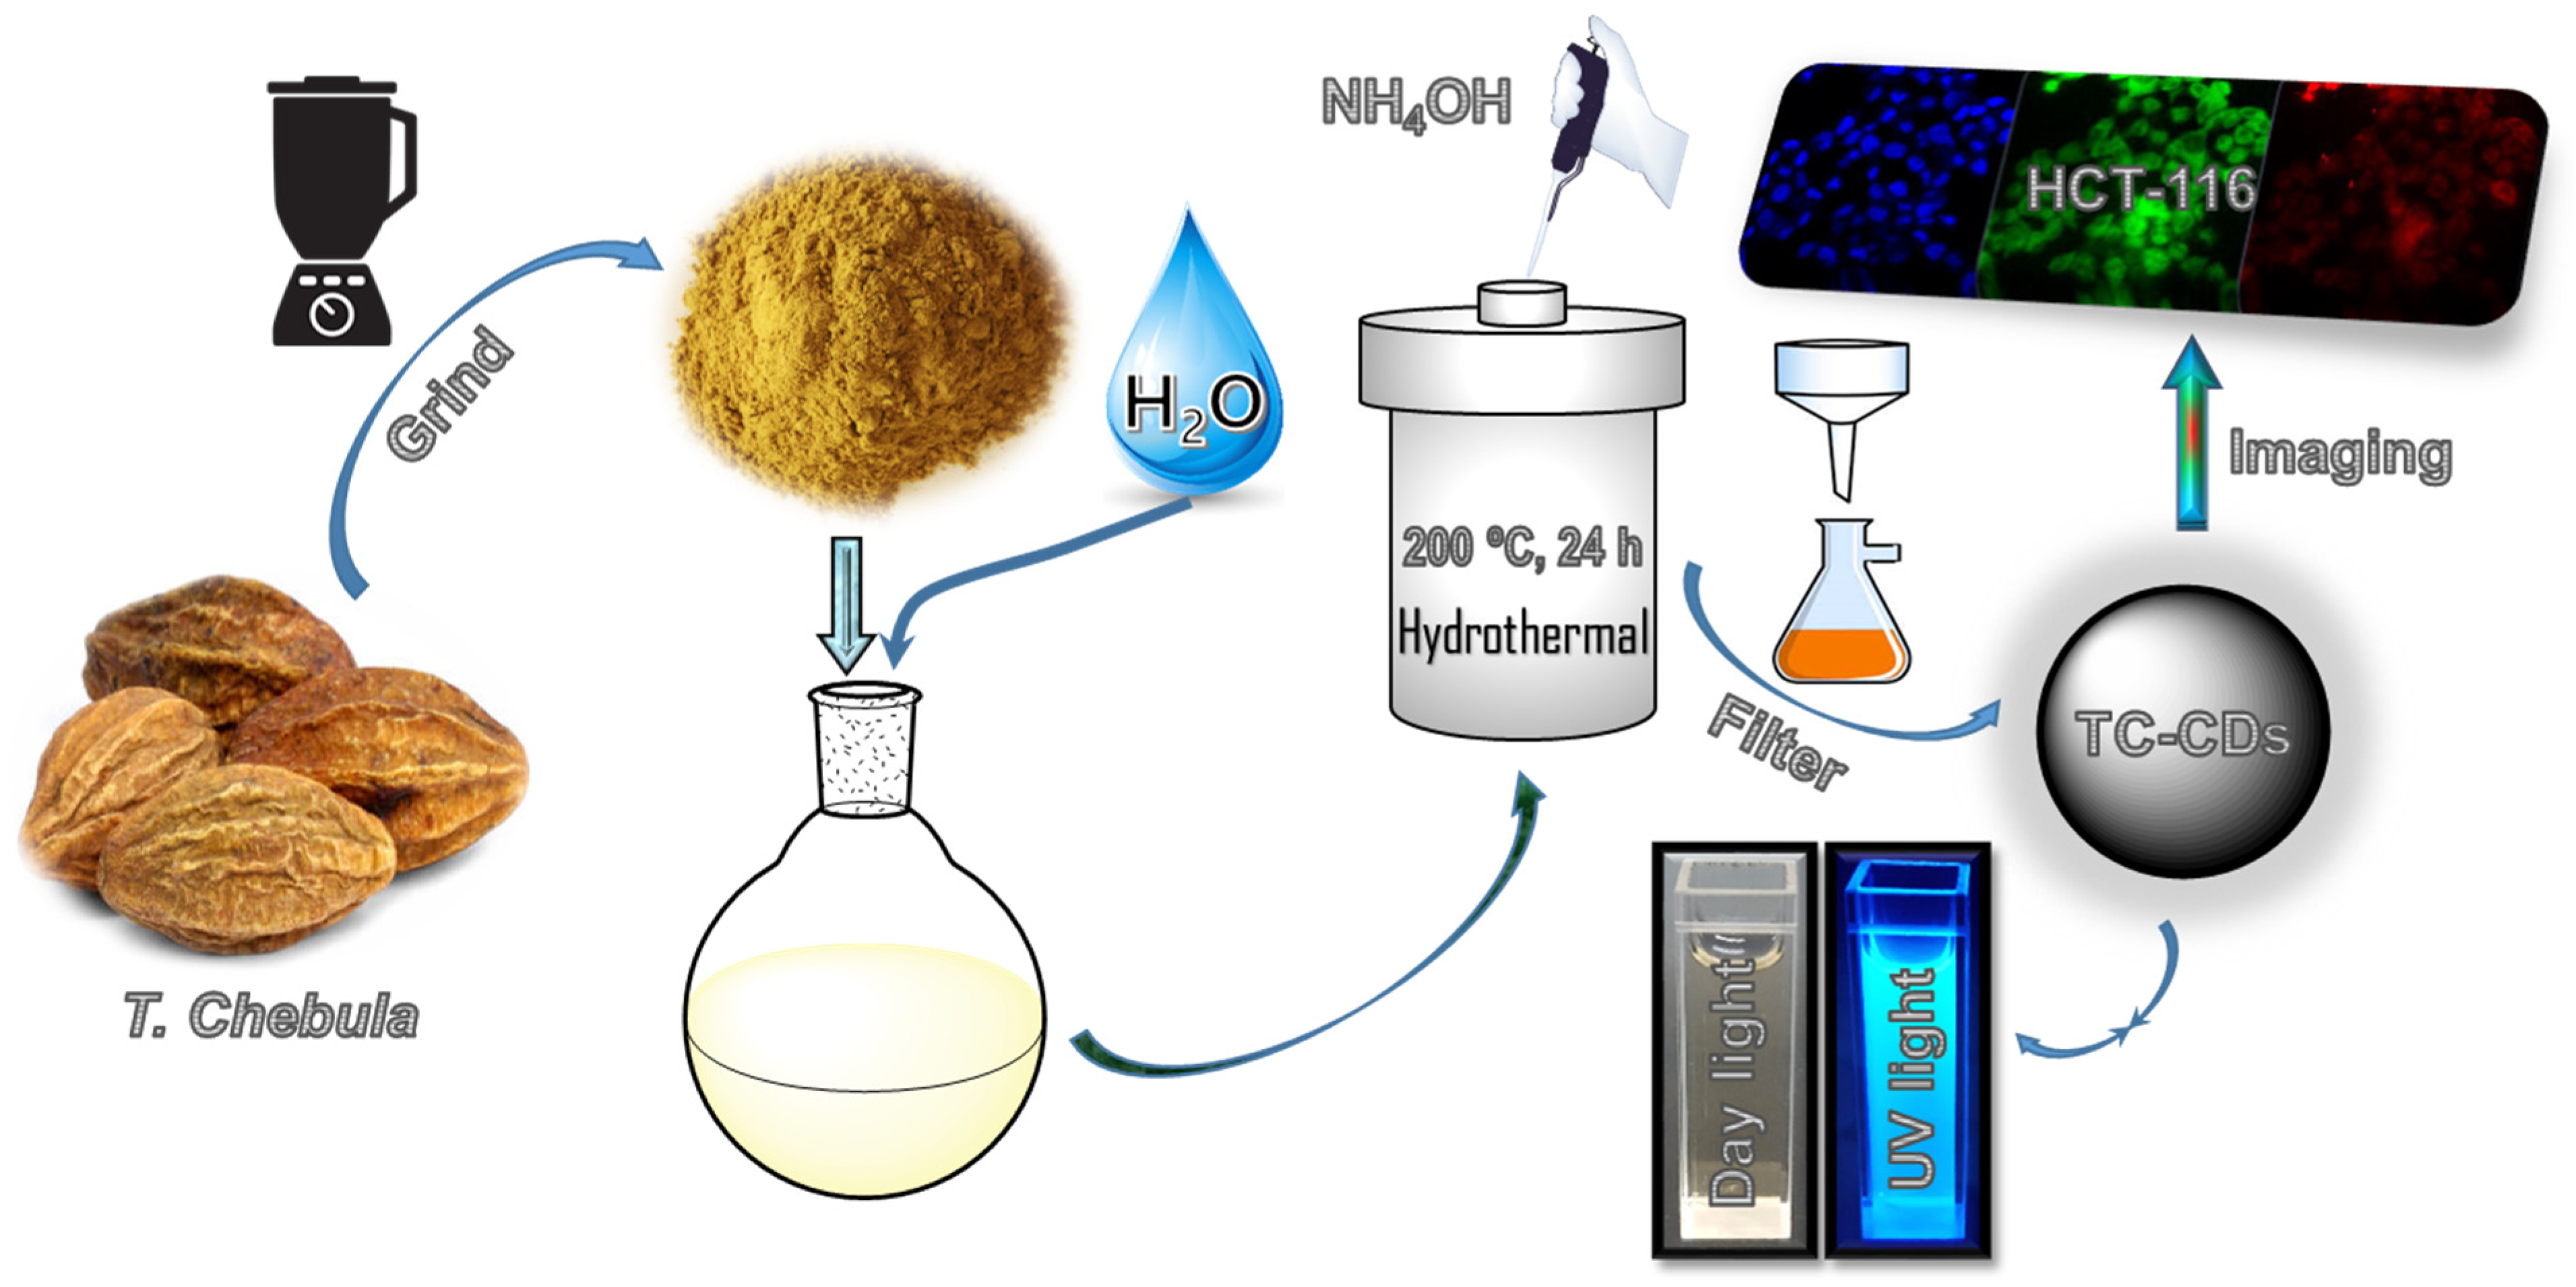
4. Materials and Methods
4.1. Materials
4.2. Synthesis of TC-CDs
Supplementary Materials
Author Contributions
Funding
Institutional Review Board Statement
Informed Consent Statement
Data Availability Statement
Acknowledgments
Conflicts of Interest
Sample Availability
References
- Maiti, D.; Tong, X.; Mou, X.; Yang, K. Carbon-Based Nanomaterials for Biomedical Applications: A Recent Study. Front. Pharmacol. 2018, 9, 1401. [Google Scholar] [CrossRef] [PubMed] [Green Version]
- Liu, J.; Li, R.; Yang, B. Carbon Dots: A New Type of Carbon-Based Nanomaterial with Wide Applications. ACS Cent. Sci. 2020, 6, 2179–2195. [Google Scholar] [CrossRef]
- Kościk, I.; Jankowski, D.; Jagusiak, A. Carbon Nanomaterials for Theranostic Use. C 2022, 8, 3. [Google Scholar] [CrossRef]
- Jorns, M.; Pappas, D. A Review of Fluorescent Carbon Dots, Their Synthesis, Physical and Chemical Characteristics, and Applications. Nanomaterials 2021, 11, 1448. [Google Scholar] [CrossRef]
- Gayen, B.; Palchoudhury, S.; Chowdhury, J. Carbon Dots: A Mystic Star in the World of Nanoscience. J. Nanomater. 2019, 2019, 3451307. [Google Scholar] [CrossRef] [Green Version]
- Su, W.; Wu, H.; Xu, H.; Zhang, Y.; Li, Y.; Li, X.; Fan, L. Carbon dots: A booming material for biomedical applications. Mater. Chem. Front. 2020, 4, 821–836. [Google Scholar] [CrossRef]
- Ayiloor Rajesh, G.; John, V.L.; Pookunnath Santhosh, A.; Krishnan Nair Ambika, A.; Thavarool Puthiyedath, V. Carbon Dots from Natural Sources for Biomedical Applications. Part. Part. Syst. Charact. 2022, 39, 2200017. [Google Scholar] [CrossRef]
- Chahal, S.; Macairan, J.-R.; Yousefi, N.; Tufenkji, N.; Naccache, R. Green synthesis of carbon dots and their applications. RSC Adv. 2021, 11, 25354–25363. [Google Scholar] [CrossRef]
- Sharma, A.; Das, J. Small molecules derived carbon dots: Synthesis and applications in sensing, catalysis, imaging, and biomedicine. J. Nanobiotechnol. 2019, 17, 92. [Google Scholar] [CrossRef] [Green Version]
- Kang, C.; Huang, Y.; Yang, H.; Yan, X.F.; Chen, Z.P. A Review of Carbon Dots Produced from Biomass Wastes. Nanomaterials 2020, 10, 2316. [Google Scholar] [CrossRef]
- Kaur, A.; Pandey, K.; Kaur, R.; Vashishat, N.; Kaur, M. Nanocomposites of Carbon Quantum Dots and Graphene Quantum Dots: Environmental Applications as Sensors. Chemosensors 2022, 10, 367. [Google Scholar] [CrossRef]
- Luo, W.-K.; Zhang, L.-L.; Yang, Z.-Y.; Guo, X.-H.; Wu, Y.; Zhang, W.; Luo, J.-K.; Tang, T.; Wang, Y. Herbal medicine derived carbon dots: Synthesis and applications in therapeutics, bioimaging and sensing. J. Nanobiotechnol. 2021, 19, 320. [Google Scholar] [CrossRef] [PubMed]
- Varsha Raveendran, P.T.; Renuka, N.K. Hydrothermal synthesis of biomass-derived carbon nanodots: Characterization and applications. Mater. Chem. Phys. 2022, 288, 126236. [Google Scholar] [CrossRef]
- Khayal, A.; Dawane, V.; Amin, M.A.; Tirth, V.; Yadav, V.K.; Algahtani, A.; Khan, S.H.; Islam, S.; Yadav, K.K.; Jeon, B.-H. Advances in the Methods for the Synthesis of Carbon Dots and Their Emerging Applications. Polymers 2021, 13, 3190. [Google Scholar] [CrossRef] [PubMed]
- Wang, X.; Feng, Y.; Dong, P.; Huang, J. A Mini Review on Carbon Quantum Dots: Preparation, Properties, and Electrocatalytic Application. Front. Chem. 2019, 7, 671. [Google Scholar] [CrossRef] [PubMed]
- Omar, N.A.S.; Fen, Y.W.; Irmawati, R.; Hashim, H.S.; Ramdzan, N.S.M.; Fauzi, N.I.M. A Review on Carbon Dots: Synthesis, Characterization and Its Application in Optical Sensor for Environmental Monitoring. Nanomaterials 2022, 12, 2365. [Google Scholar] [CrossRef]
- Arul, V.; Edison, T.N.J.I.; Lee, Y.R.; Sethuraman, M.G. Biological and catalytic applications of green synthesized fluorescent N-doped carbon dots using Hylocereus undatus. J. Photochem. Photobiol. B Biol. 2017, 168, 142–148. [Google Scholar] [CrossRef]
- Edison, T.N.J.I.; Atchudan, R.; Shim, J.-J.; Kalimuthu, S.; Ahn, B.-C.; Lee, Y.R. Turn-off fluorescence sensor for the detection of ferric ion in water using green synthesized N-doped carbon dots and its bio-imaging. J. Photochem. Photobiol. B Biol. 2016, 158, 235–242. [Google Scholar] [CrossRef]
- Atchudan, R.; Edison, T.; Aseer, K.R.; Perumal, S.; Karthik, N.; Lee, Y.R. Highly fluorescent nitrogen-doped carbon dots derived from Phyllanthus acidus utilized as a fluorescent probe for label-free selective detection of Fe(3+) ions, live cell imaging and fluorescent ink. Biosens. Bioelectron. 2018, 99, 303–311. [Google Scholar] [CrossRef]
- Atchudan, R.; Edison, T.N.J.I.; Sethuraman, M.G.; Lee, Y.R. Efficient synthesis of highly fluorescent nitrogen-doped carbon dots for cell imaging using unripe fruit extract of Prunus mume. Appl. Surf. Sci. 2016, 384, 432–441. [Google Scholar] [CrossRef]
- Atchudan, R.; Edison, T.N.J.I.; Chakradhar, D.; Perumal, S.; Shim, J.-J.; Lee, Y.R. Facile green synthesis of nitrogen-doped carbon dots using Chionanthus retusus fruit extract and investigation of their suitability for metal ion sensing and biological applications. Sens. Actuators B Chem. 2017, 246, 497–509. [Google Scholar] [CrossRef]
- Atchudan, R.; Edison, T.N.J.I.; Perumal, S.; Vinodh, R.; Lee, Y.R. Betel-derived nitrogen-doped multicolor carbon dots for environmental and biological applications. J. Mol. Liq. 2019, 296, 111817. [Google Scholar] [CrossRef]
- Mansuriya, B.D.; Altintas, Z. Carbon Dots: Classification, Properties, Synthesis, Characterization, and Applications in Health Care—An Updated Review (2018–2021). Nanomaterials 2021, 11, 2525. [Google Scholar] [CrossRef]
- Evans, W.C.; Evans, D. Chapter 21—Phenols and phenolic glycosides. In Trease and Evans’ Pharmacognosy, 16th ed.; Evans, W.C., Evans, D., Eds.; W.B. Saunders: Philadelphia, PA, USA, 2009; pp. 219–262. [Google Scholar]
- Sajid, M.; Cameotra, S.S.; Ahmad Khan, M.S.; Ahmad, I. Chapter 23—Nanoparticle-Based Delivery of Phytomedicines: Challenges and Opportunities. In New Look to Phytomedicine; Ahmad Khan, M.S., Ahmad, I., Chattopadhyay, D., Eds.; Academic Press: Cambridge, MA, USA, 2019; pp. 597–623. [Google Scholar]
- Jagtap, A.G.; Karkera, S.G. Potential of the aqueous extract of Terminalia chebula as an anticaries agent. J. Ethnopharmacol. 1999, 68, 299–306. [Google Scholar] [CrossRef]
- Bag, A.; Bhattacharyya, S.K.; Chattopadhyay, R.R. The development of Terminalia chebula Retz. (Combretaceae) in clinical research. Asian Pac. J. Trop. Biomed. 2013, 3, 244–252. [Google Scholar] [CrossRef] [Green Version]
- Edison, T.J.I.; Sethuraman, M.G. Instant green synthesis of silver nanoparticles using Terminalia chebula fruit extract and evaluation of their catalytic activity on reduction of methylene blue. Process Biochem. 2012, 47, 1351–1357. [Google Scholar] [CrossRef]
- Edison, T.N.J.I.; Atchudan, R.; Sethuraman, M.G.; Lee, Y.R. Supercapacitor performance of carbon supported Co3O4 nanoparticles synthesized using Terminalia chebula fruit. J. Taiwan Inst. Chem. Eng. 2016, 68, 489–495. [Google Scholar] [CrossRef]
- Wang, X.; Yang, T.; Yu, Z.; Liu, T.; Jin, R.; Weng, L.; Bai, Y.; Gooding, J.J.; Zhang, Y.; Chen, X. Intelligent Gold Nanoparticles with Oncogenic MicroRNA-Dependent Activities to Manipulate Tumorigenic Environments for Synergistic Tumor Therapy. Adv. Mater. 2022, 34, 2110219. [Google Scholar] [CrossRef]
- Sharma, A.; Panwar, V.; Thomas, J.; Chopra, V.; Roy, H.S.; Ghosh, D. Actin-binding carbon dots selectively target glioblastoma cells while sparing normal cells. Colloids Surf. B Biointerfaces 2021, 200, 111572. [Google Scholar] [CrossRef]
- Deb, A.; Chowdhury, D. Unraveling the origin of photoluminescence in dual emissive biogenic carbon dot. Mater. Today Commun. 2022, 31, 103777. [Google Scholar] [CrossRef]
- Al-Hashimi, B.; Omer, K.M.; Rahman, H.S. Inner filter effect (IFE) as a simple and selective sensing platform for detection of tetracycline using milk-based nitrogen-doped carbon nanodots as fluorescence probe. Arab. J. Chem. 2020, 13, 5151–5159. [Google Scholar] [CrossRef]
- Atchudan, R.; Chandra Kishore, S.; Gangadaran, P.; Jebakumar Immanuel Edison, T.N.; Perumal, S.; Rajendran, R.L.; Alagan, M.; Al-Rashed, S.; Ahn, B.-C.; Lee, Y.R. Tunable fluorescent carbon dots from biowaste as fluorescence ink and imaging human normal and cancer cells. Environ. Res. 2022, 204, 112365. [Google Scholar] [CrossRef] [PubMed]
- Gaddam, R.R.; Vasudevan, D.; Narayan, R.; Raju, K.V.S.N. Controllable synthesis of biosourced blue-green fluorescent carbon dots from camphor for the detection of heavy metal ions in water. RSC Adv. 2014, 4, 57137–57143. [Google Scholar] [CrossRef]
- Atchudan, R.; Edison, T.N.J.I.; Perumal, S.; Vinodh, R.; Sundramoorthy, A.K.; Babu, R.S.; Lee, Y.R. Morus nigra-derived hydrophilic carbon dots for the highly selective and sensitive detection of ferric ion in aqueous media and human colon cancer cell imaging. Colloids Surf. A Physicochem. Eng. Asp. 2022, 635, 128073. [Google Scholar] [CrossRef]
- Pontes, S.M.A.; Rodrigues, V.S.F.; Carneiro, S.V.; Oliveira, J.J.P.; Moura, T.A.; Paschoal, A.R.; Antunes, R.A.; Oliveira, D.R.d.; Oliveira, J.R.; Fechine, L.M.U.D.; et al. One-pot Solvothermal Synthesis of Full-color Carbon Quantum Dots for Application in Light Emitting Diodes. Nano-Struct. Nano-Objects 2022, 32, 100917. [Google Scholar] [CrossRef]
- Wang, Z.; Zhang, Y.; Zhang, S.; Ge, M.; Zhang, H.; Wang, S.; Chen, Z.; Li, S.; Yang, C. Natural xylose-derived carbon dots towards efficient semi-artificial photosynthesis. J. Colloid Interface Sci. 2023, 629, 12–21. [Google Scholar] [CrossRef]
- Reckmeier, C.J.; Schneider, J.; Susha, A.S.; Rogach, A.L. Luminescent colloidal carbon dots: Optical properties and effects of doping [Invited]. Opt. Express 2016, 24, A312–A340. [Google Scholar] [CrossRef]
- Rajapandi, S.; Pandeeswaran, M.; Kousalya, G.N. Novel green synthesis of N-doped carbon dots from fruits of Opuntia ficus Indica as an effective catalyst for the photocatalytic degradation of methyl orange dye and antibacterial studies. Inorg. Chem. Commun. 2022, 146, 110041. [Google Scholar] [CrossRef]
- Perumal, S.; Atchudan, R.; Ramalingam, S.; Edison, T.N.J.I.; Lee, H.M.; Cheong, I.W.; Devarajan, N.; Lee, Y.R. Comparative investigation on antibacterial studies of Oxalis corniculata and silver nanoparticle stabilized graphene surface. J. Mater. Sci. 2022, 57, 11630–11648. [Google Scholar] [CrossRef]
- Zhao, L.; Wang, Y.; Zhao, X.; Deng, Y.; Xia, Y. Facile Synthesis of Nitrogen-Doped Carbon Quantum Dots with Chitosan for Fluorescent Detection of Fe3+. Polymers 2019, 11, 1731. [Google Scholar] [CrossRef]
- Li, N.; Li, R.; Li, Z.; Yang, Y.; Wang, G.; Gu, Z. Pentaethylenehexamine and histidine-functionalized graphene quantum dots for ultrasensitive fluorescence detection of microRNA with target and molecular beacon double cycle amplification strategy. Sens. Actuators B Chem. 2019, 283, 666–676. [Google Scholar] [CrossRef]
- Xu, H.; Yang, X.; Li, G.; Zhao, C.; Liao, X. Green Synthesis of Fluorescent Carbon Dots for Selective Detection of Tartrazine in Food Samples. J. Agric. Food Chem. 2015, 63, 6707–6714. [Google Scholar] [CrossRef]
- Krishnaiah, P.; Atchudan, R.; Perumal, S.; Salama, E.-S.; Lee, Y.R.; Jeon, B.-H. Utilization of waste biomass of Poa pratensis for green synthesis of n-doped carbon dots and its application in detection of Mn2+ and Fe3+. Chemosphere 2022, 286, 131764. [Google Scholar] [CrossRef]
- Thara, C.R.; Korah, B.K.; Mathew, S.; John, B.K.; Mathew, B. Dual mode detection and sunlight-driven photocatalytic degradation of tetracycline with tailor-made N-doped carbon dots. Environ. Res. 2023, 216, 114450. [Google Scholar] [CrossRef]
- Perumal, S.; Atchudan, R.; Thirukumaran, P.; Yoon, D.H.; Lee, Y.R.; Cheong, I.W. Simultaneous removal of heavy metal ions using carbon dots-doped hydrogel particles. Chemosphere 2022, 286, 131760. [Google Scholar] [CrossRef]
- Hou, Y.; Zhang, R.; Cheng, H.; Wang, Y.; Zhang, Q.; Zhang, L.; Wang, L.; Li, R.; Wu, X.; Li, B. Mg2+-doped carbon dots synthesized based on Lycium ruthenicum in cell imaging and promoting osteogenic differentiation in vitro. Colloids Surf. A Physicochem. Eng. Asp. 2023, 656, 130264. [Google Scholar] [CrossRef]
- Shi, H.; Li, X.; Li, Y.; Feng, S. Carbon dots derived from peptone as “off-on” fluorescent probes for the detection of oxalic acid. Spectrochim. Acta Part A Mol. Biomol. Spectrosc. 2023, 287, 122038. [Google Scholar] [CrossRef]
- Guo, L.; Zhu, M.; Shi, W.; Wang, K.; Leng, S.; Brahmia, A. Evaluation of the corrosion inhibition behavior of N, S co-doped memory-type carbon dots for mild steel in HCl solution. Mater. Lett. 2023, 330, 133403. [Google Scholar] [CrossRef]
- Dager, A.; Uchida, T.; Maekawa, T.; Tachibana, M. Synthesis and characterization of Mono-disperse Carbon Quantum Dots from Fennel Seeds: Photoluminescence analysis using Machine Learning. Sci. Rep. 2019, 9, 14004. [Google Scholar] [CrossRef] [Green Version]
- Atchudan, R.; Edison, T.N.J.I.; Perumal, S.; Muthuchamy, N.; Lee, Y.R. Hydrophilic nitrogen-doped carbon dots from biowaste using dwarf banana peel for environmental and biological applications. Fuel 2020, 275, 117821. [Google Scholar] [CrossRef]
- Shi, J.; Zhou, Y.; Ning, J.; Hu, G.; Zhang, Q.; Hou, Y.; Zhou, Y. Prepared carbon dots from wheat straw for detection of Cu2+ in cells and zebrafish and room temperature phosphorescent anti-counterfeiting. Spectrochim. Acta Part A Mol. Biomol. Spectrosc. 2022, 281, 121597. [Google Scholar] [CrossRef] [PubMed]
- Bhattacharjee, T.; Rabha, R.; Chowdhury, D.; Majumdar, G. Carbon Dot grafted pH sensitive smart paper for highly efficient separation of anionic/cationic dyes from a mixture. Sustain. Mater. Technol. 2022, 33, e00489. [Google Scholar] [CrossRef]
- Atchudan, R.; Jebakumar Immanuel Edison, T.N.; Perumal, S.; Vinodh, R.; Babu, R.S.; Sundramoorthy, A.K.; Renita, A.A.; Lee, Y.R. Facile synthesis of nitrogen-doped porous carbon materials using waste biomass for energy storage applications. Chemosphere 2022, 289, 133225. [Google Scholar] [CrossRef] [PubMed]
- Atchudan, R.; Kishore, S.C.; Edison, T.N.J.I.; Perumal, S.; Vinodh, R.; Sundramoorthy, A.K.; Babu, R.S.; Alagan, M.; Lee, Y.R. Highly Fluorescent Carbon Dots as a Potential Fluorescence Probe for Selective Sensing of Ferric Ions in Aqueous Solution. Chemosensors 2021, 9, 301. [Google Scholar] [CrossRef]
- Mathew, S.; Rose Chacko, A.; Korah, B.K.; Susan Punnose, M.; Mathew, B. Green synthesized carbon quantum dot as dual sensor for Fe(II) ions and rational design of catalyst for visible light mediated abatement of pollutants. Appl. Surf. Sci. 2022, 606, 154975. [Google Scholar] [CrossRef]
- Bandi, R.; Gangapuram, B.R.; Dadigala, R.; Eslavath, R.; Singh, S.S.; Guttena, V. Facile and green synthesis of fluorescent carbon dots from onion waste and their potential applications as sensor and multicolour imaging agents. RSC Adv. 2016, 6, 28633–28639. [Google Scholar] [CrossRef]
- Atchudan, R.; Edison, T.N.J.I.; Perumal, S.; Clament Sagaya Selvam, N.; Lee, Y.R. Green synthesized multiple fluorescent nitrogen-doped carbon quantum dots as an efficient label-free optical nanoprobe for in vivo live-cell imaging. J. Photochem. Photobiol. A Chem. 2019, 372, 99–107. [Google Scholar] [CrossRef]
- Venugopalan, P.; Vidya, N. Microwave-assisted green synthesis of carbon dots derived from wild lemon (Citrus pennivesiculata) leaves as a fluorescent probe for tetracycline sensing in water. Spectrochim. Acta Part A Mol. Biomol. Spectrosc. 2023, 286, 122024. [Google Scholar] [CrossRef]
- Zhao, D.; Ma, W.; Wang, R.; Yang, X.; Li, J.; Qiu, T.; Xiao, X. The Preparation of Green Fluorescence-Emissioned Carbon Dots/Poly(N-Isopropylacrylamide) Temperature-Sensitive Hydrogels and Research on Their Properties. Polymers 2019, 11, 1171. [Google Scholar] [CrossRef] [Green Version]
- Atchudan, R.; Edison, T.N.J.I.; Aseer, K.R.; Perumal, S.; Lee, Y.R. Hydrothermal conversion of Magnolia liliiflora into nitrogen-doped carbon dots as an effective turn-off fluorescence sensing, multi-colour cell imaging and fluorescent ink. Colloids Surf. B Biointerfaces 2018, 169, 321–328. [Google Scholar] [CrossRef]
- Chen, B.; Li, F.; Li, S.; Weng, W.; Guo, H.; Guo, T.; Zhang, X.; Chen, Y.; Huang, T.; Hong, X.; et al. Large scale synthesis of photoluminescent carbon nanodots and their application for bioimaging. Nanoscale 2013, 5, 1967–1971. [Google Scholar] [CrossRef]
- Atchudan, R.; Jebakumar Immanuel Edison, T.N.; Shanmugam, M.; Perumal, S.; Somanathan, T.; Lee, Y.R. Sustainable synthesis of carbon quantum dots from banana peel waste using hydrothermal process for in vivo bioimaging. Phys. E Low-Dimens. Syst. Nanostruct. 2021, 126, 114417. [Google Scholar] [CrossRef]
- Gao, X.; Zhang, Y.; Wu, Y.; Li, L.; Liu, Y.; Nguyen, T.T.; Du, C.; Zhou, T.; Wei, Y.; Du, W. Table tennis bat cypress baseplate derived fluorescence carbon dots: In vivo bioimaging applications. Phys. E Low-Dimens. Syst. Nanostruct. 2022, 140, 115200. [Google Scholar] [CrossRef]
- Karadag, S.N.; Ustun, O.; Yilmaz, A.; Yilmaz, M. The fabrication of excitation-dependent fluorescence boron/nitrogen co-doped carbon quantum dots and their employment in bioimaging. Chem. Phys. 2022, 562, 111678. [Google Scholar] [CrossRef]


Publisher’s Note: MDPI stays neutral with regard to jurisdictional claims in published maps and institutional affiliations. |
© 2022 by the authors. Licensee MDPI, Basel, Switzerland. This article is an open access article distributed under the terms and conditions of the Creative Commons Attribution (CC BY) license (https://creativecommons.org/licenses/by/4.0/).
Share and Cite
Atchudan, R.; Perumal, S.; Edison, T.N.J.I.; Sundramoorthy, A.K.; Sangaraju, S.; Babu, R.S.; Lee, Y.R. Sustainable Synthesis of Bright Fluorescent Nitrogen-Doped Carbon Dots from Terminalia chebula for In Vitro Imaging. Molecules 2022, 27, 8085. https://doi.org/10.3390/molecules27228085
Atchudan R, Perumal S, Edison TNJI, Sundramoorthy AK, Sangaraju S, Babu RS, Lee YR. Sustainable Synthesis of Bright Fluorescent Nitrogen-Doped Carbon Dots from Terminalia chebula for In Vitro Imaging. Molecules. 2022; 27(22):8085. https://doi.org/10.3390/molecules27228085
Chicago/Turabian StyleAtchudan, Raji, Suguna Perumal, Thomas Nesakumar Jebakumar Immanuel Edison, Ashok K. Sundramoorthy, Sambasivam Sangaraju, Rajendran Suresh Babu, and Yong Rok Lee. 2022. "Sustainable Synthesis of Bright Fluorescent Nitrogen-Doped Carbon Dots from Terminalia chebula for In Vitro Imaging" Molecules 27, no. 22: 8085. https://doi.org/10.3390/molecules27228085