
Process Simulation and Life Cycle Assessment of Waste Plastics: A Comparison of Pyrolysis and Hydrocracking

Abstract
:1. Introduction
2. Results and Discussion
2.1. Overall Material and Energy Balances for Model Validation
2.1.1. Pyrolysis Process
| QOverall = HHDPE − HProducts + Qequipment |
| Where HHDPE = −1463.7 kW |
| HProducts = −274.84 − 37.56 − 323.66 − 92.26 = −733.32 kW |
| Qequipment = 1096.68 + 105.27 − 351.08 − 121.47 = 729.4 kW |
| QOverall = −1463.7 − (−733.32) + 729.4 ≈ 0 |
2.1.2. Hydrocracking Process
| QOverall = Hfeed − HProducts + Qequipment HFeed = HHDPE+HH2 = −1463.7 + 5.01 = −1458.69 kW HProducts = −268.97 − 385.50 = − 654.47 kW Qequipment = 965.71 + 105.27 − 210.02 − 73.97 = 786.99 kW QOverall = −1461.69 − (−654.47) + 786.99 ≈ 0 |
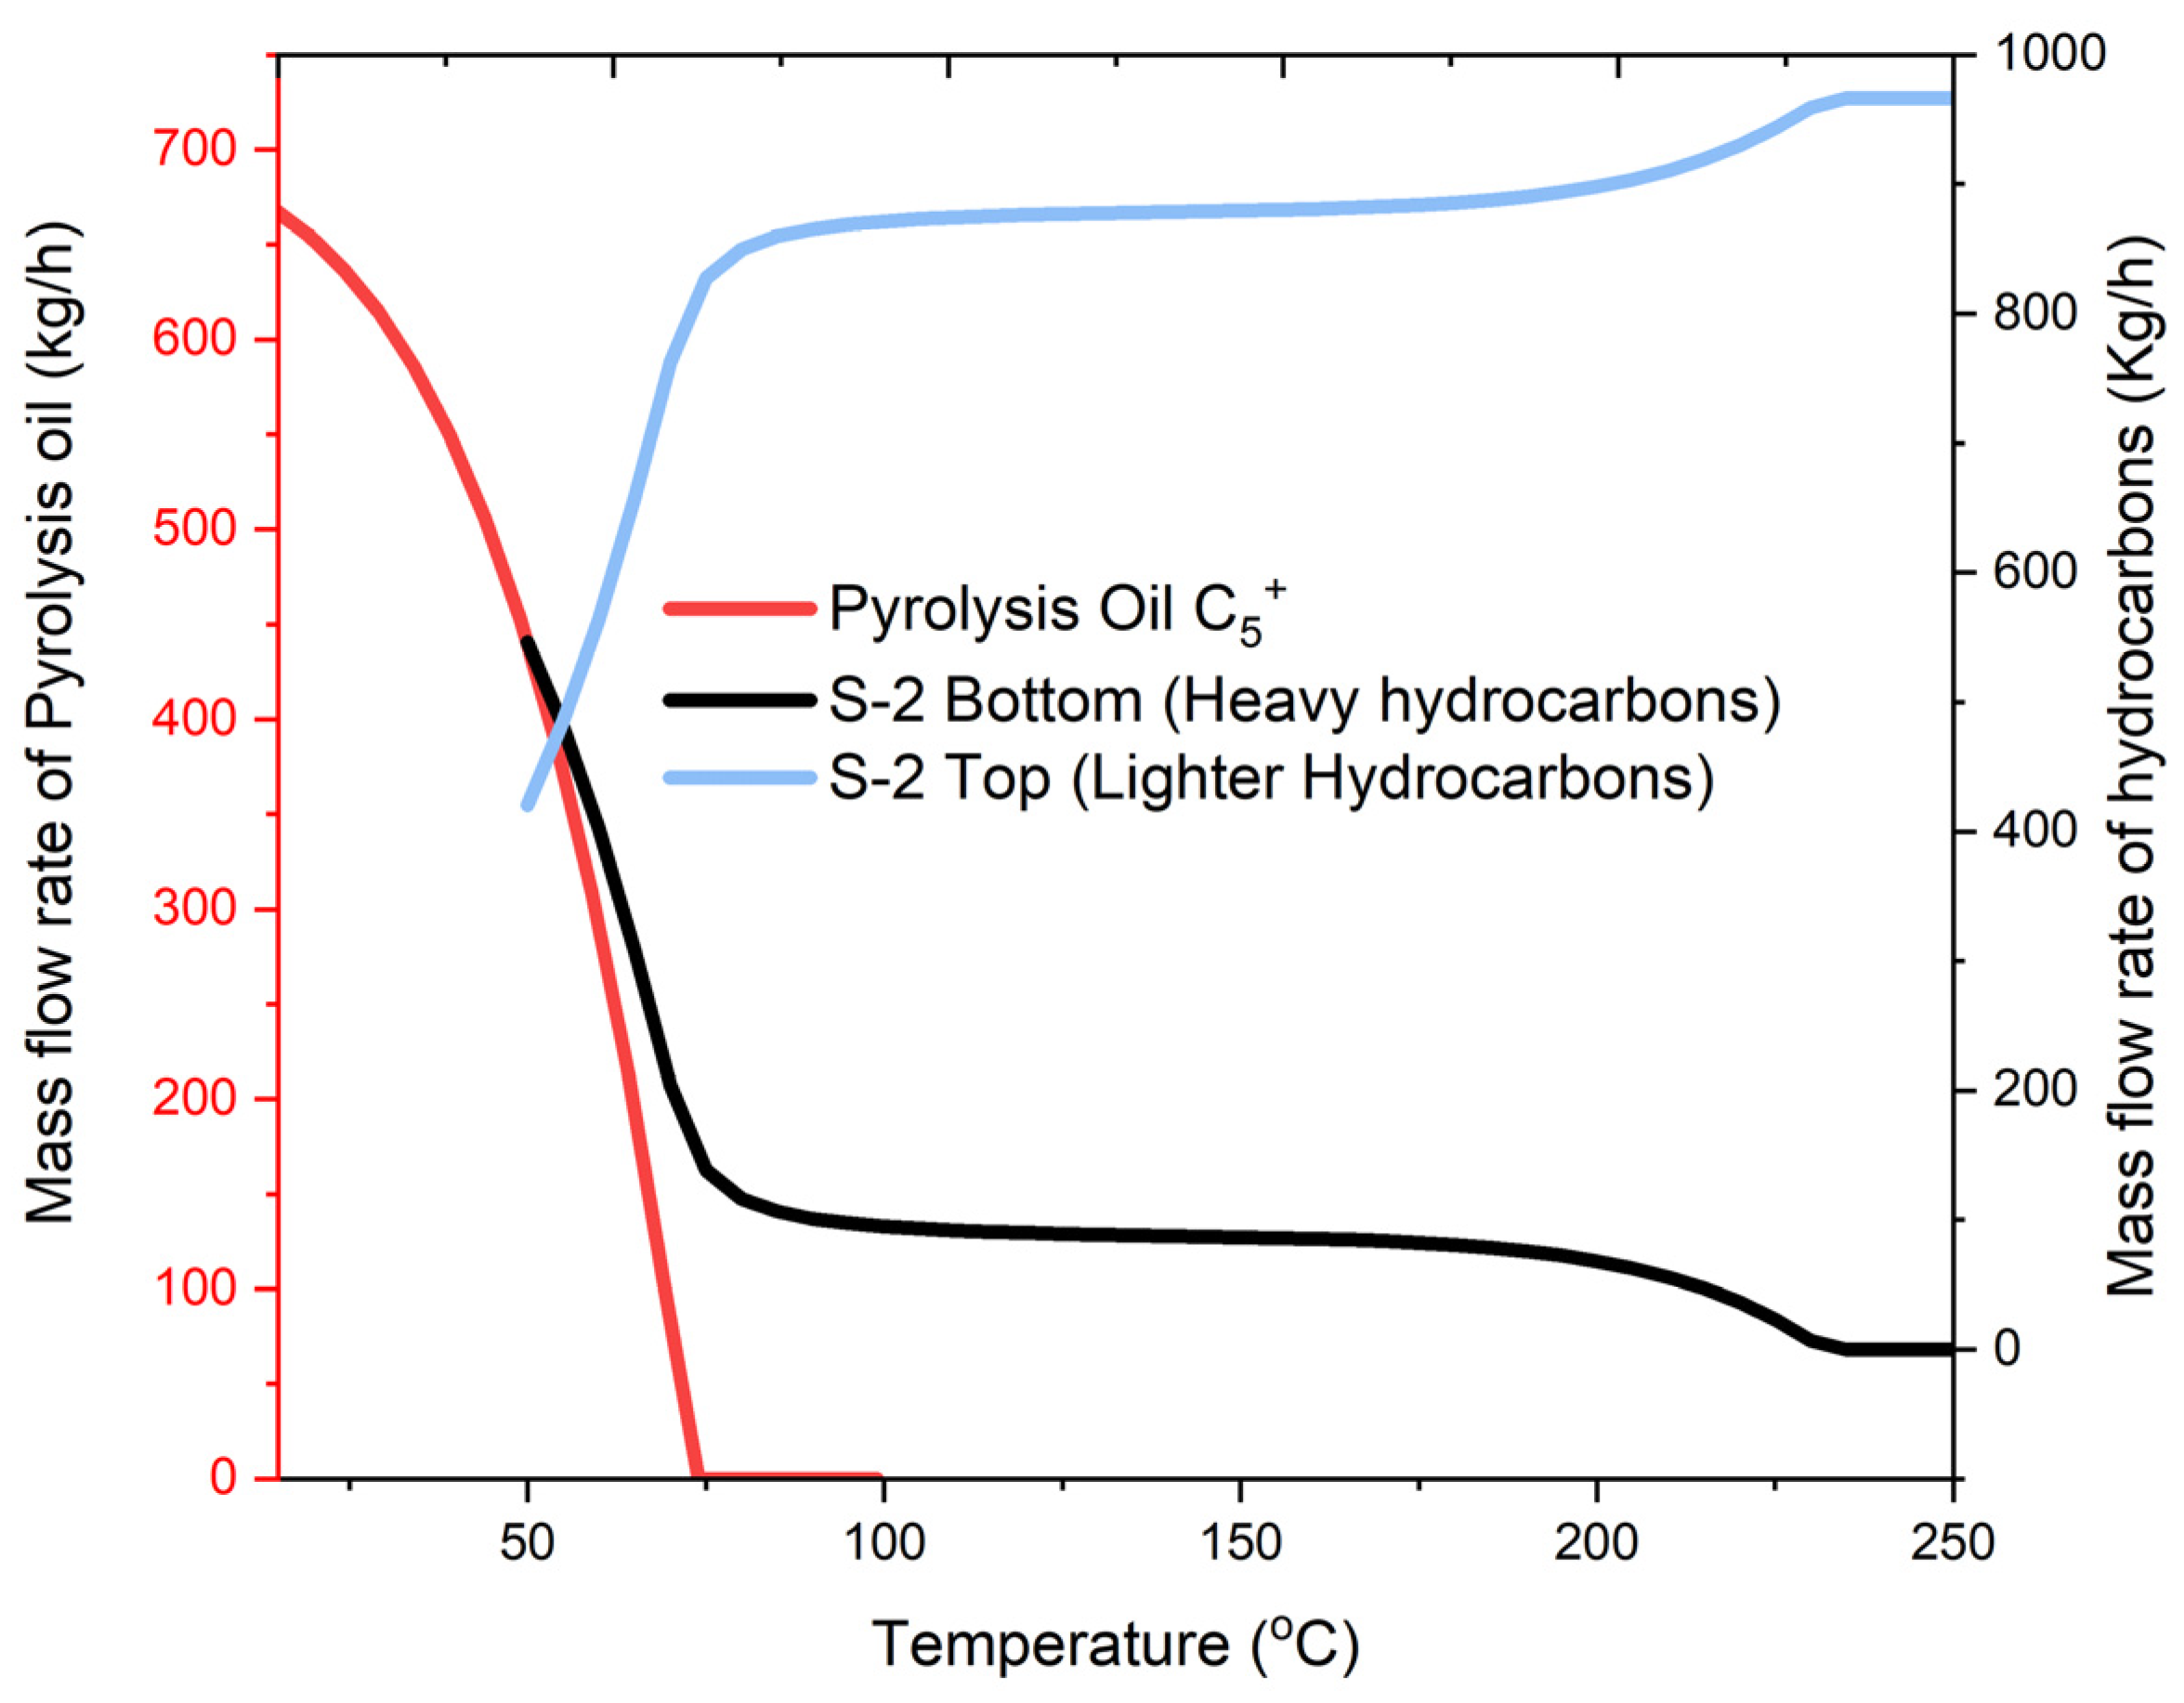
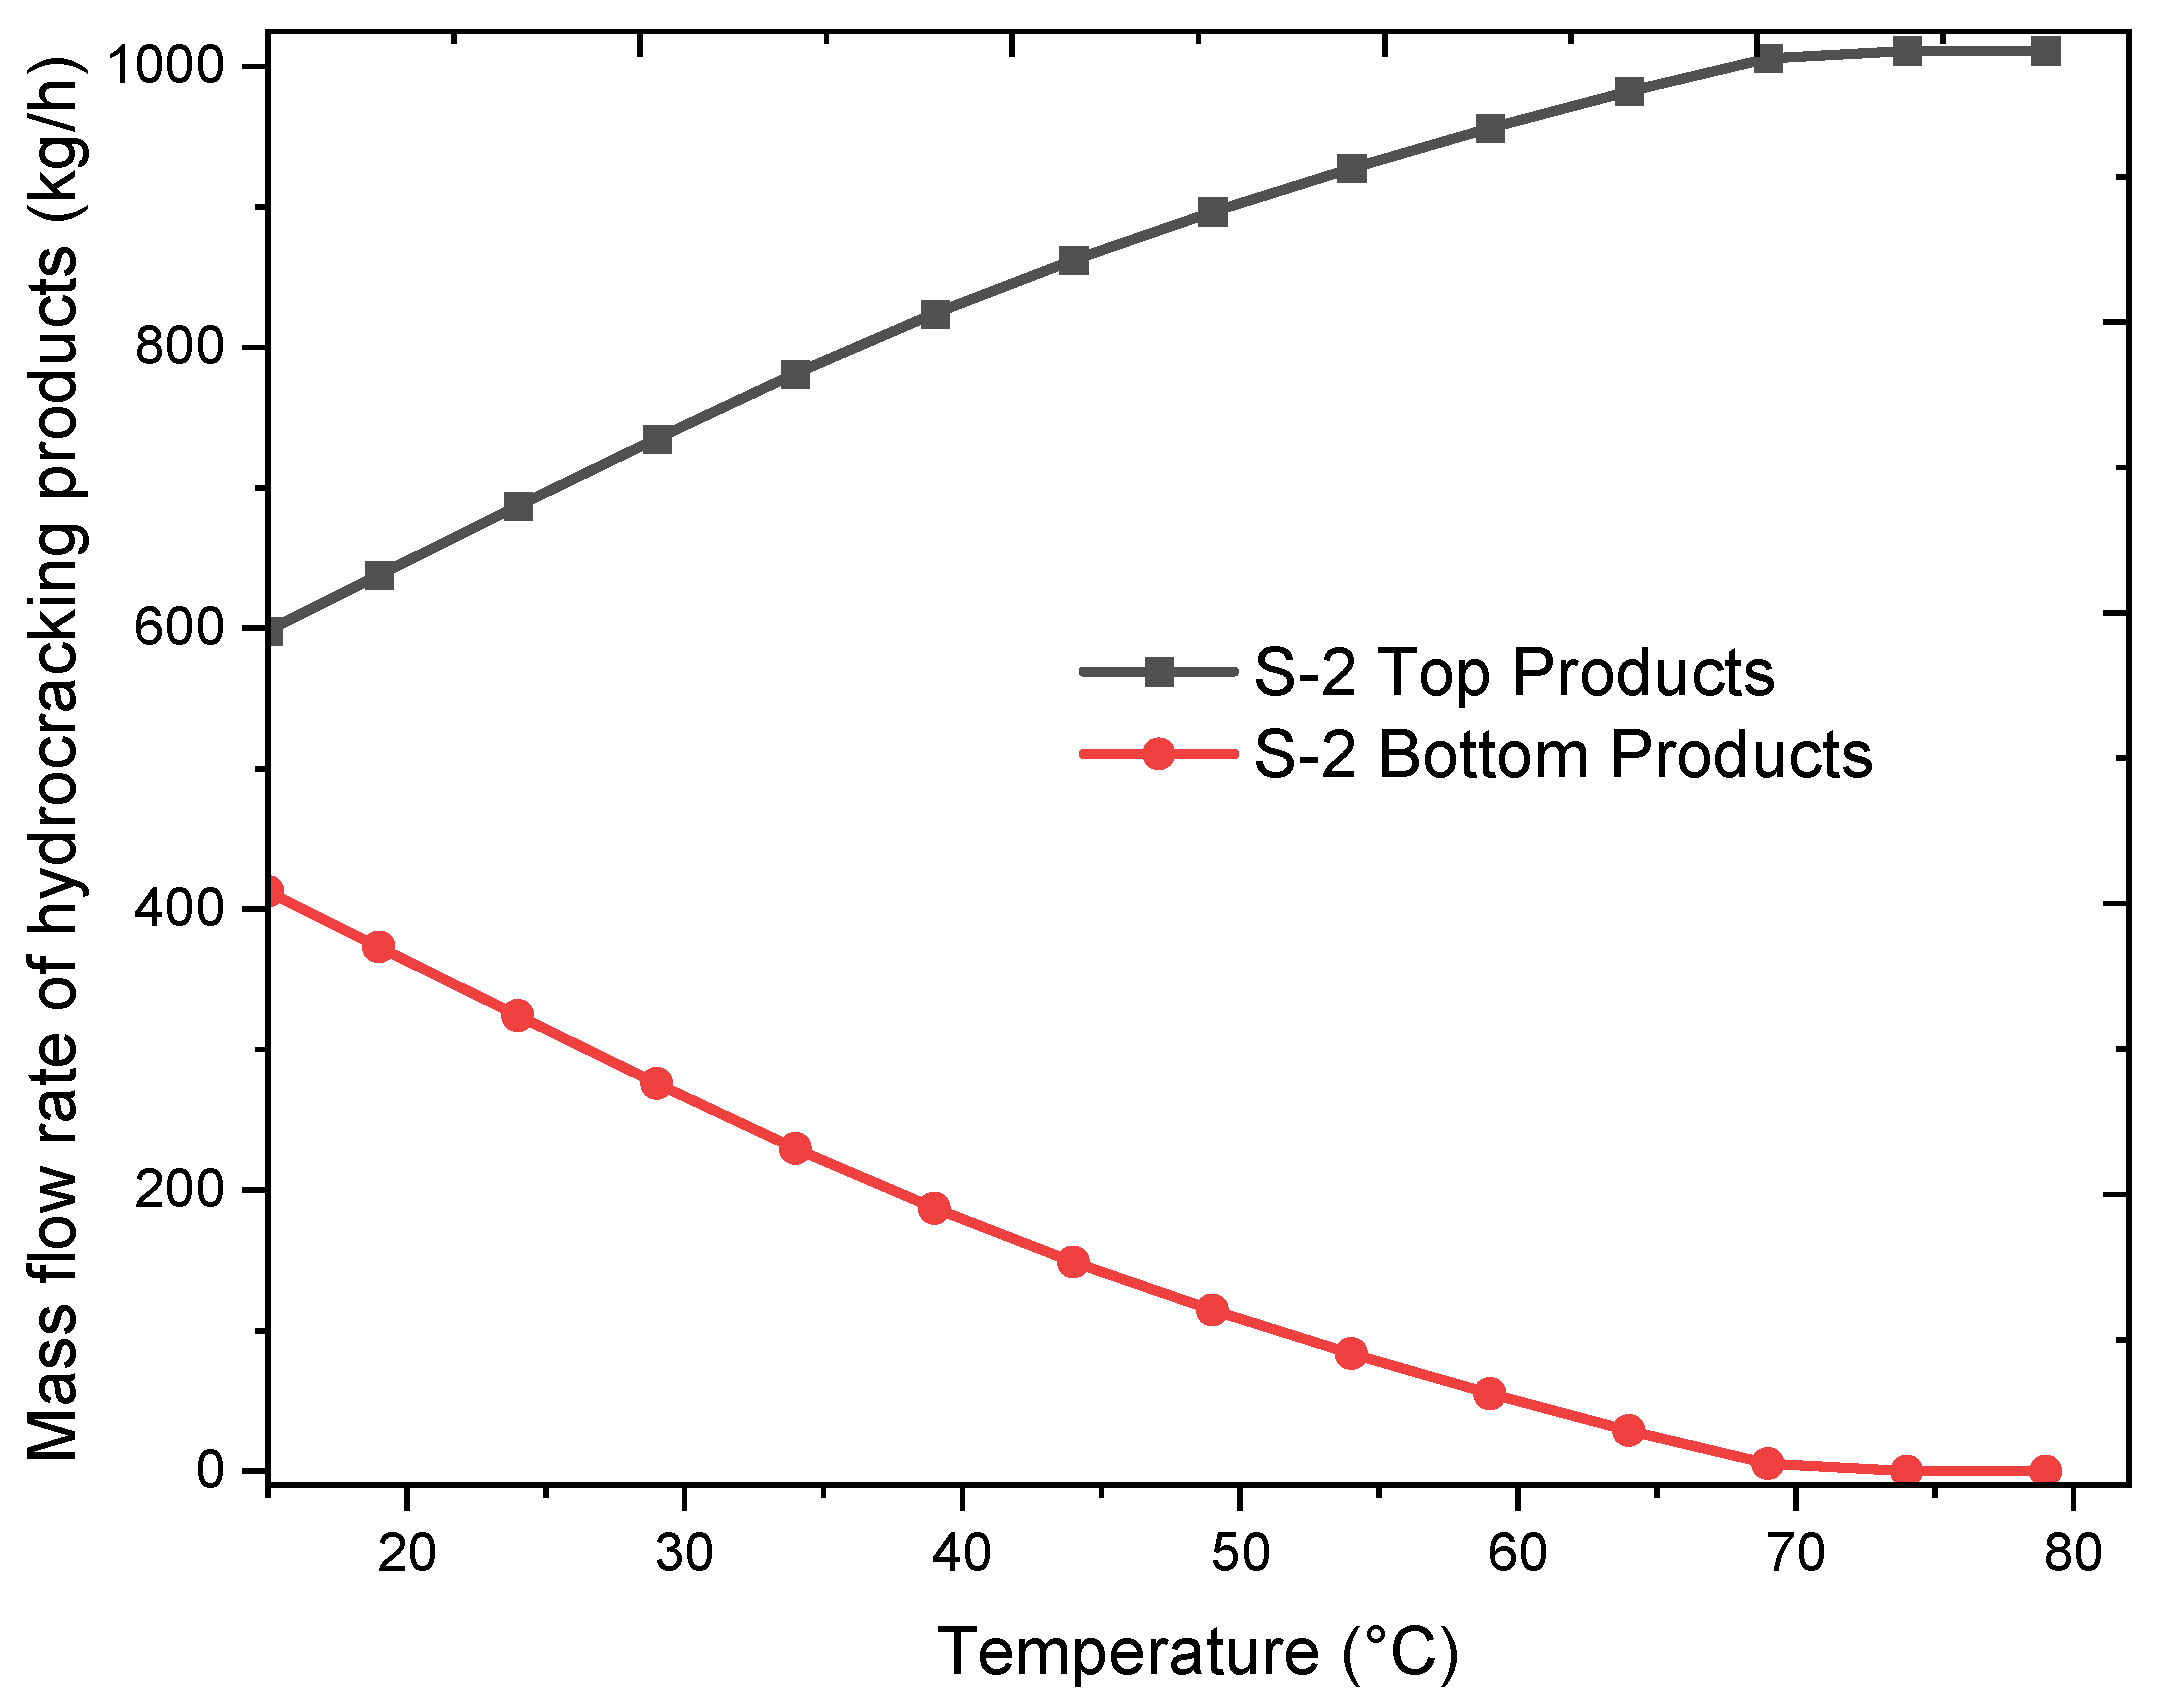
2.2. Sensitivity Analysis
2.3. Simulation Output
2.4. Life Cycle Impact Assessment (LCIA)
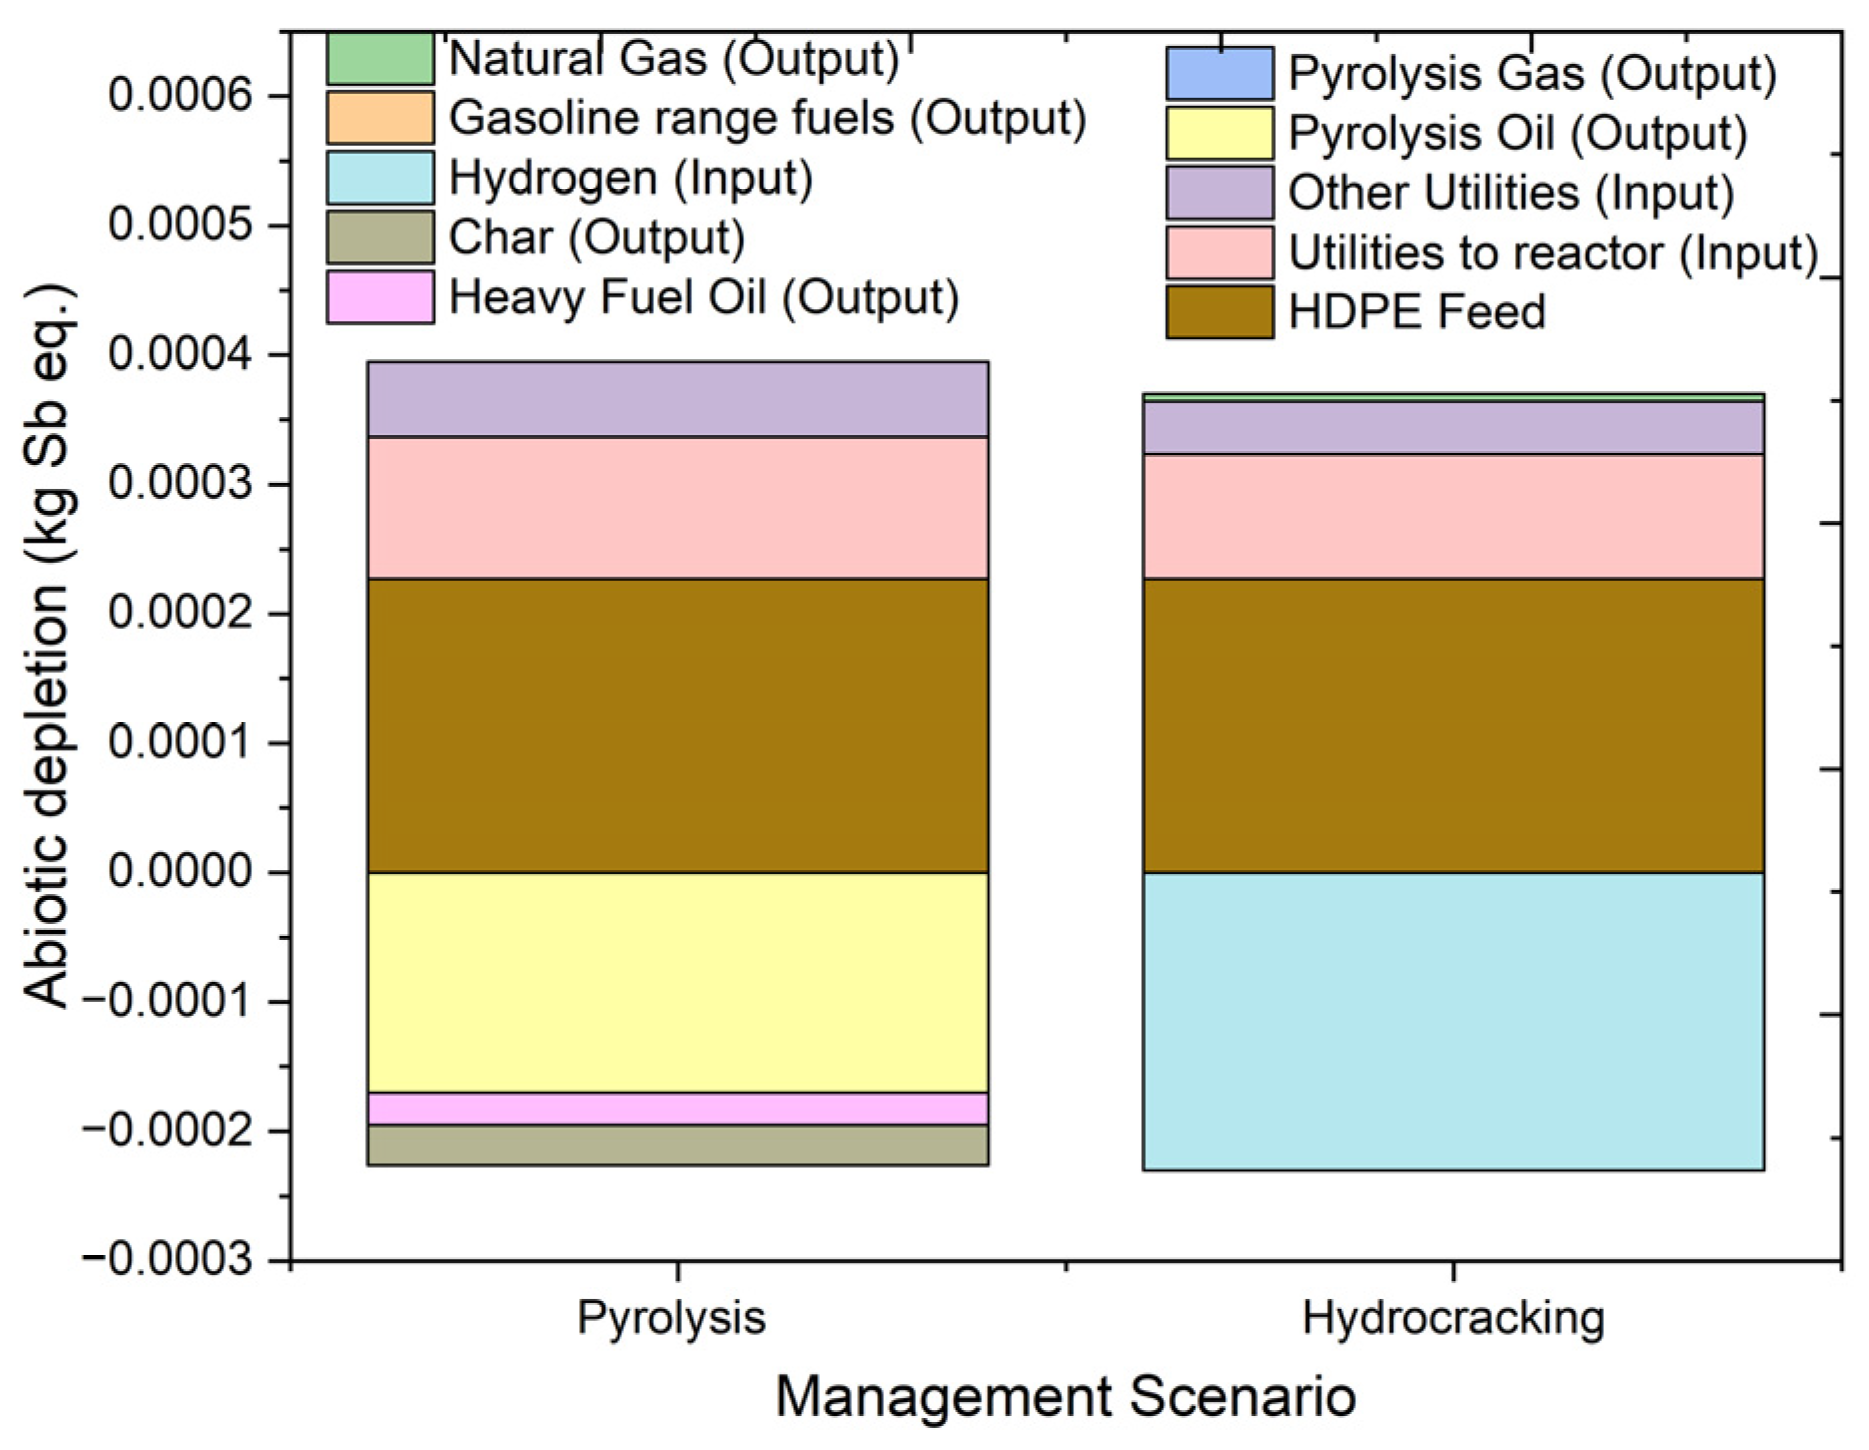
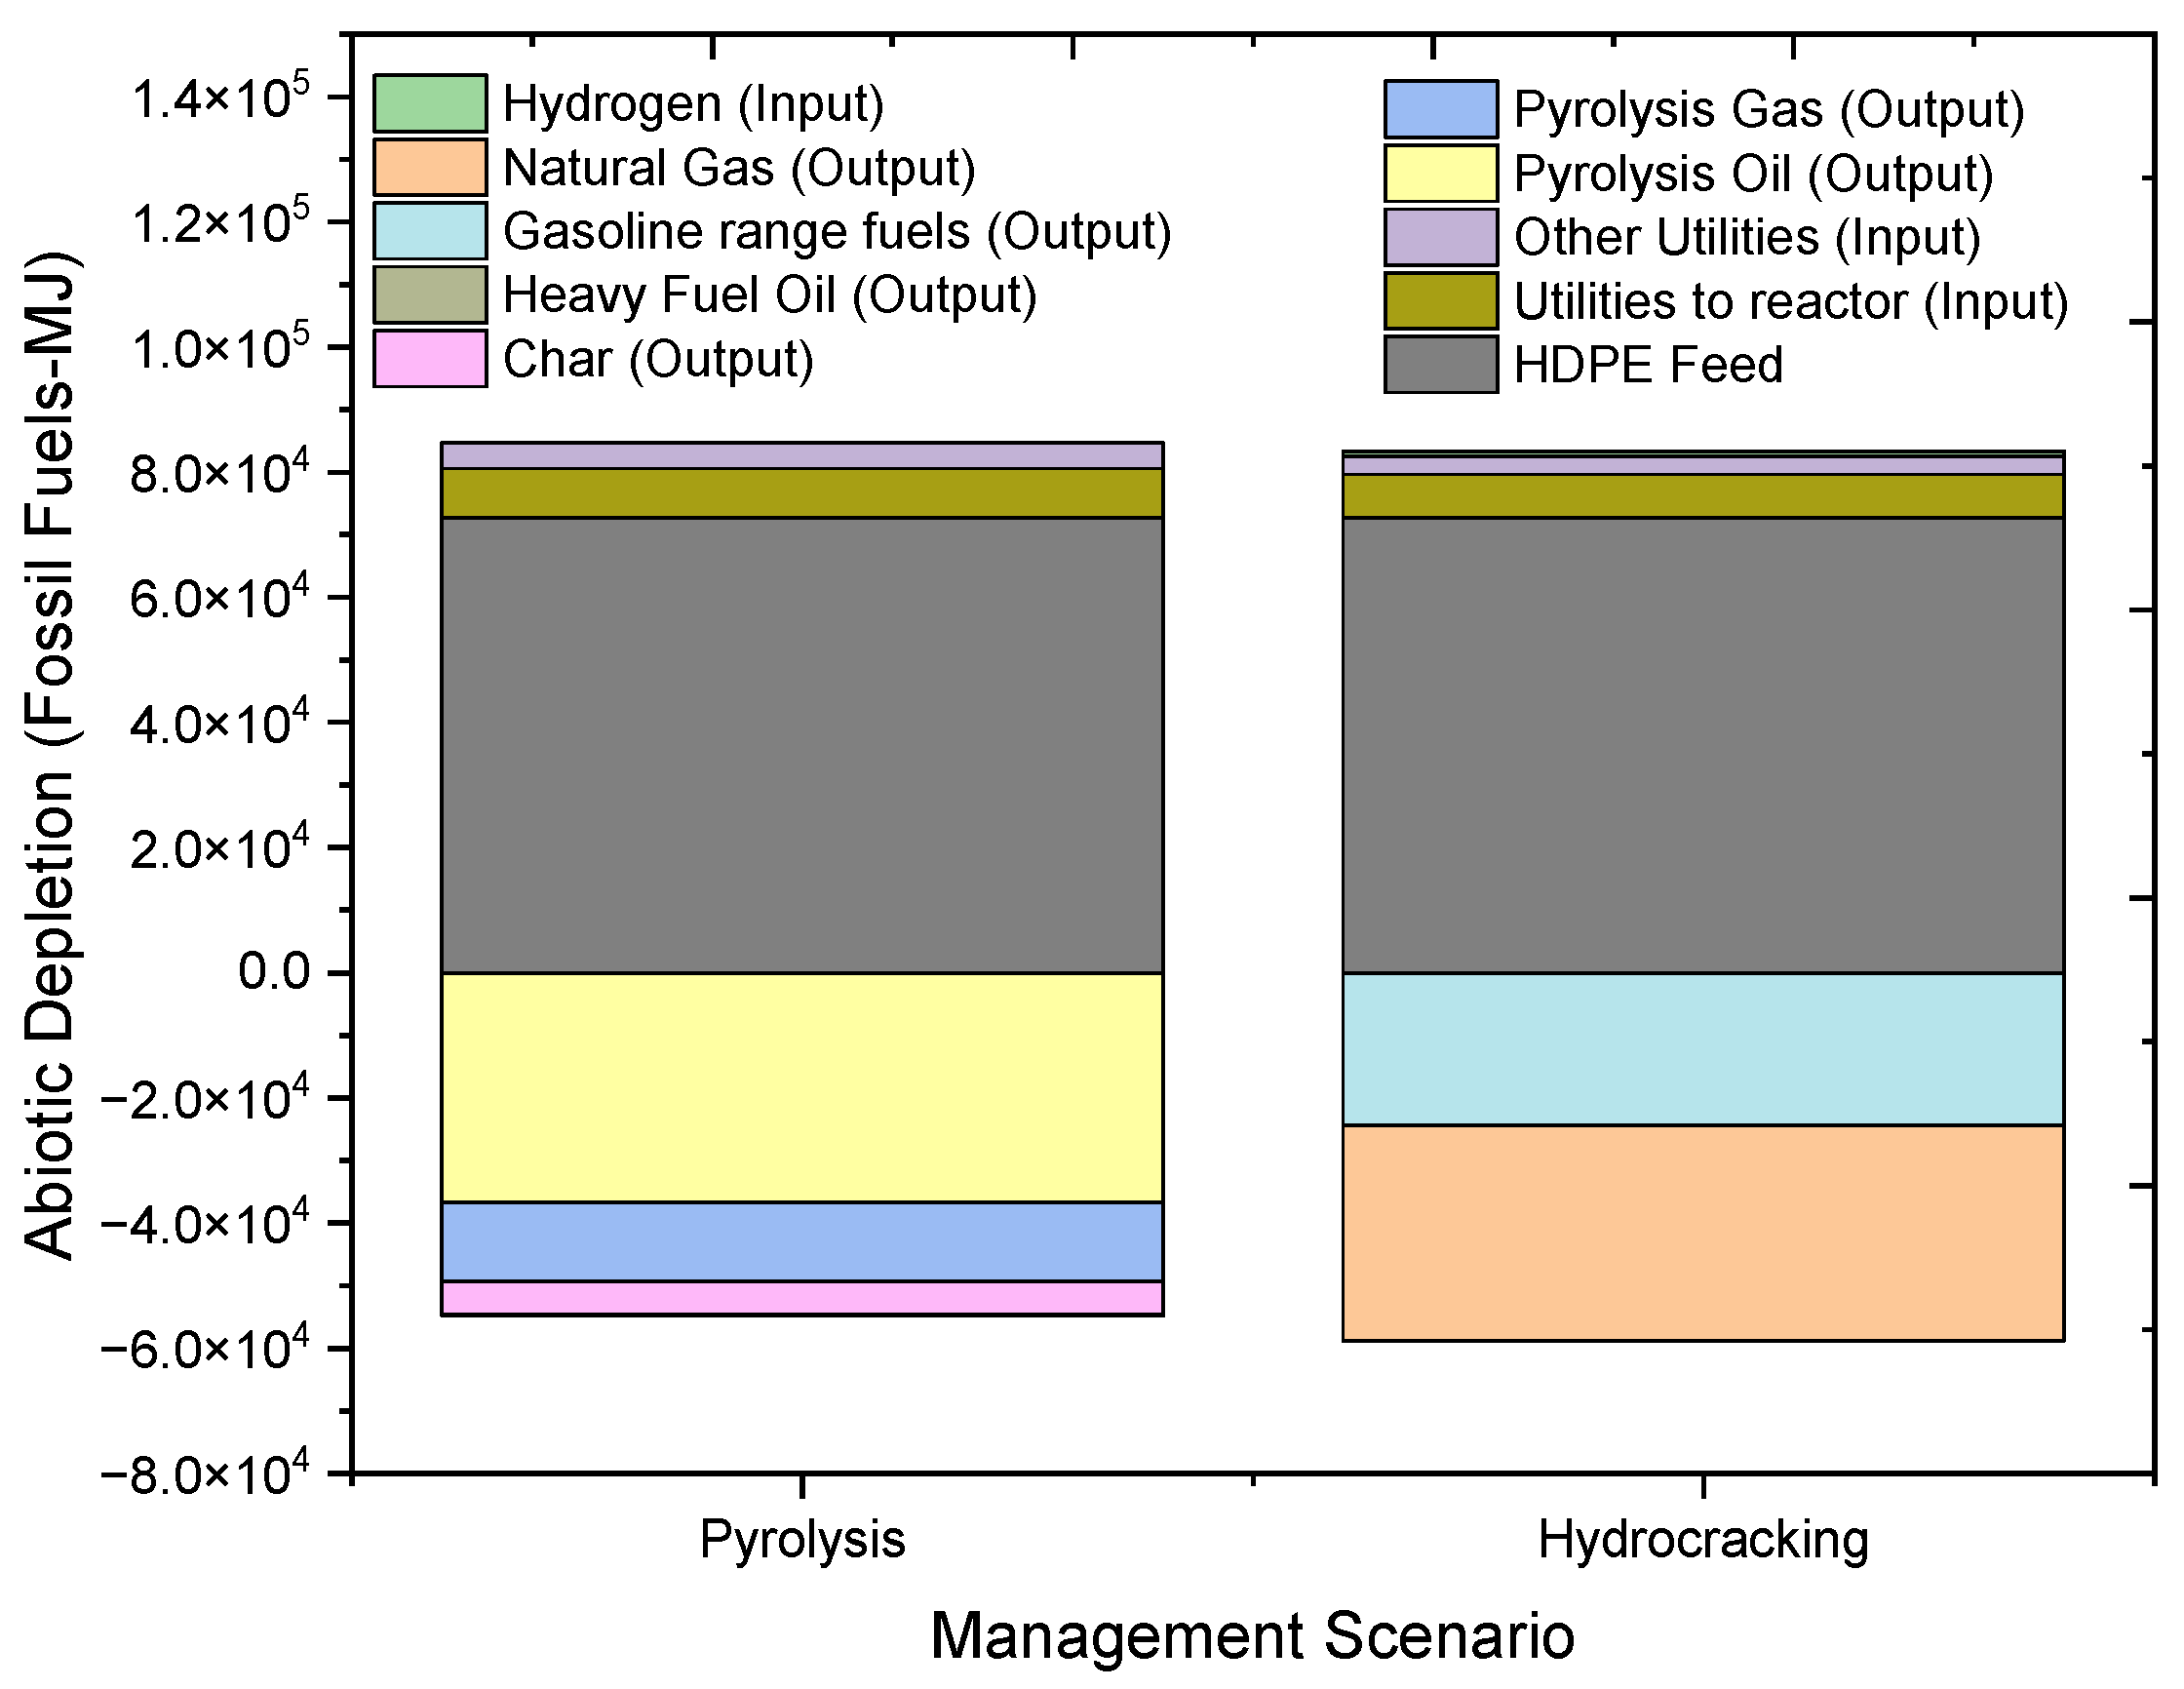
2.4.1. Abiotic Depletion
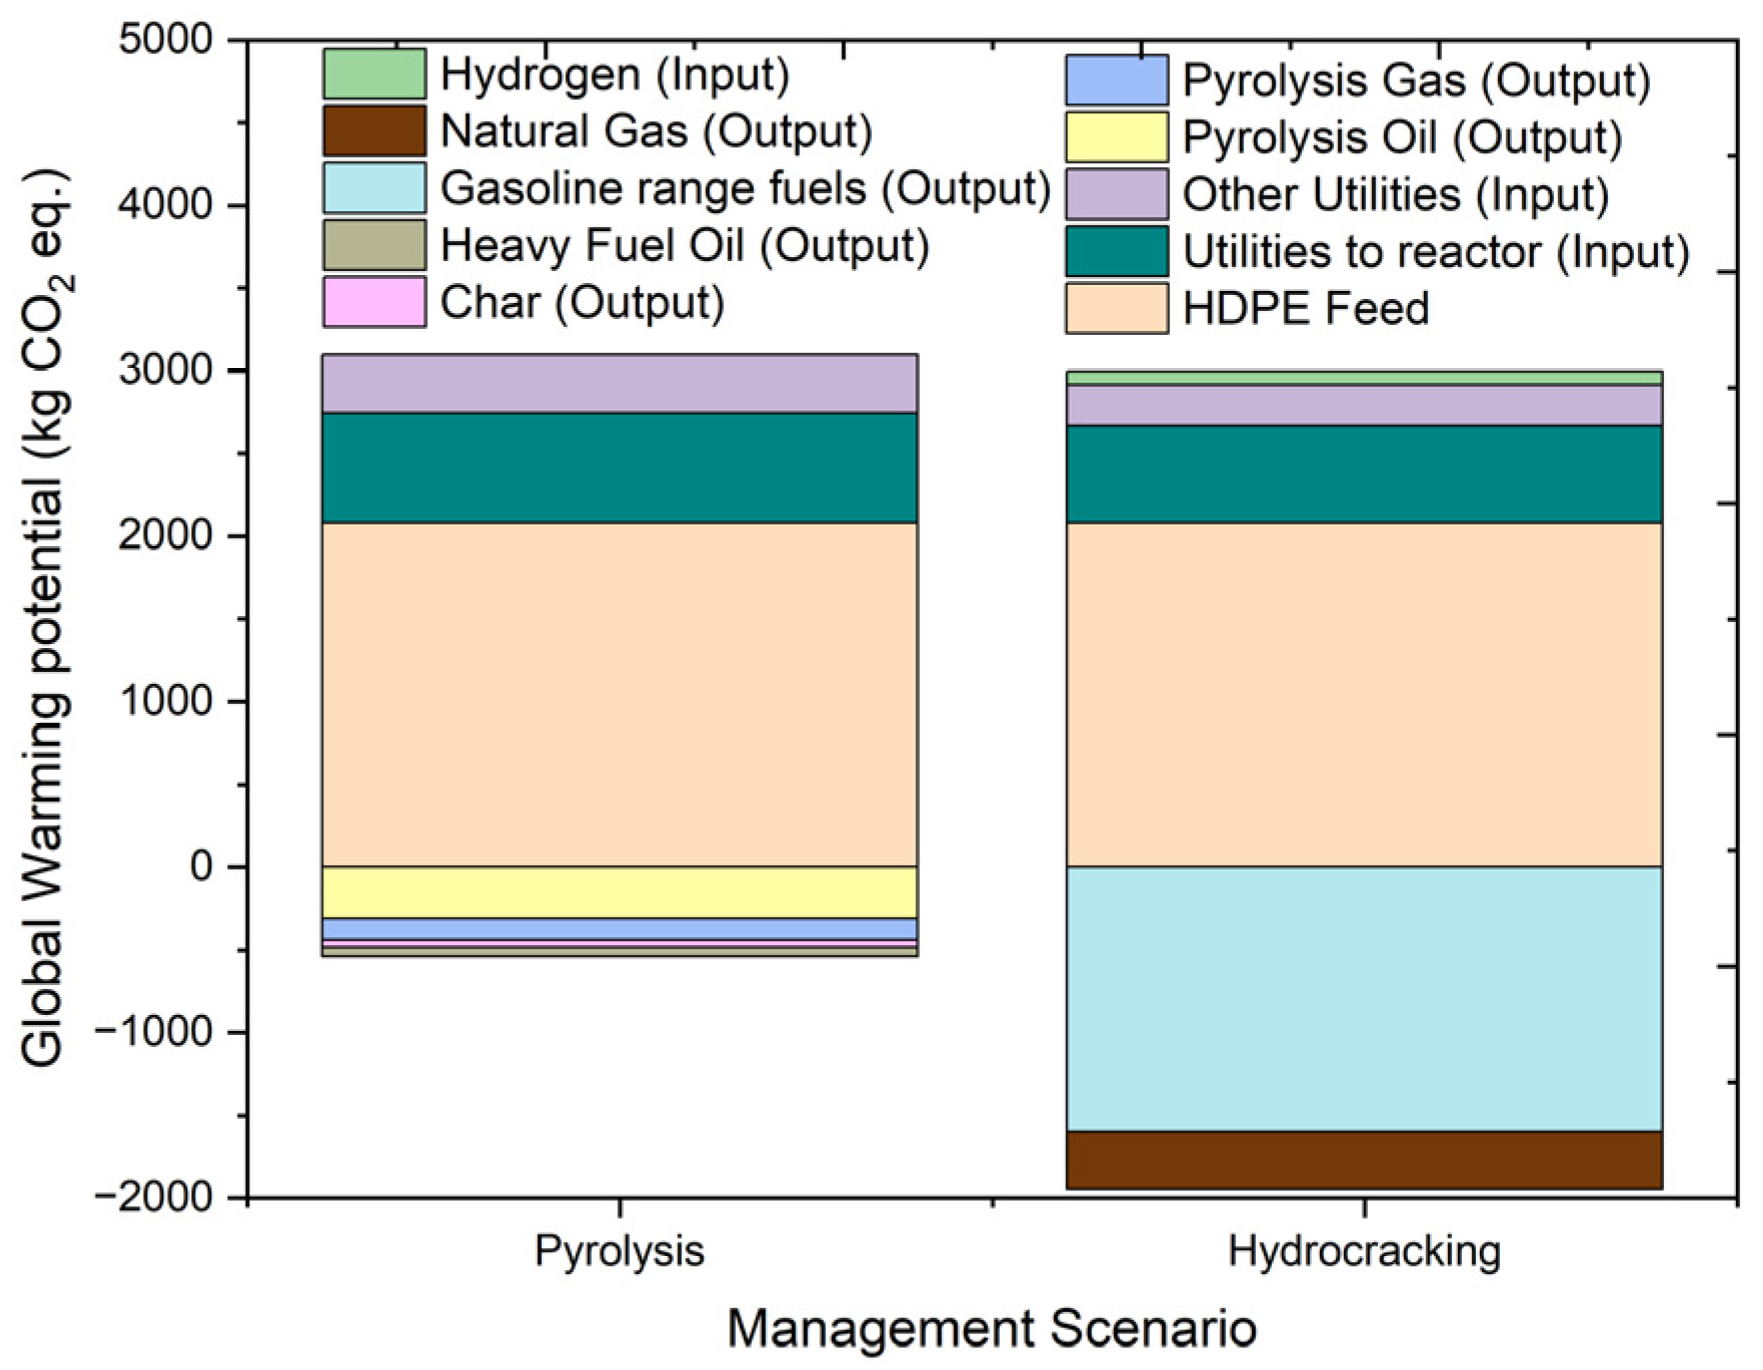
2.4.2. Global Warming Potential (GWP)
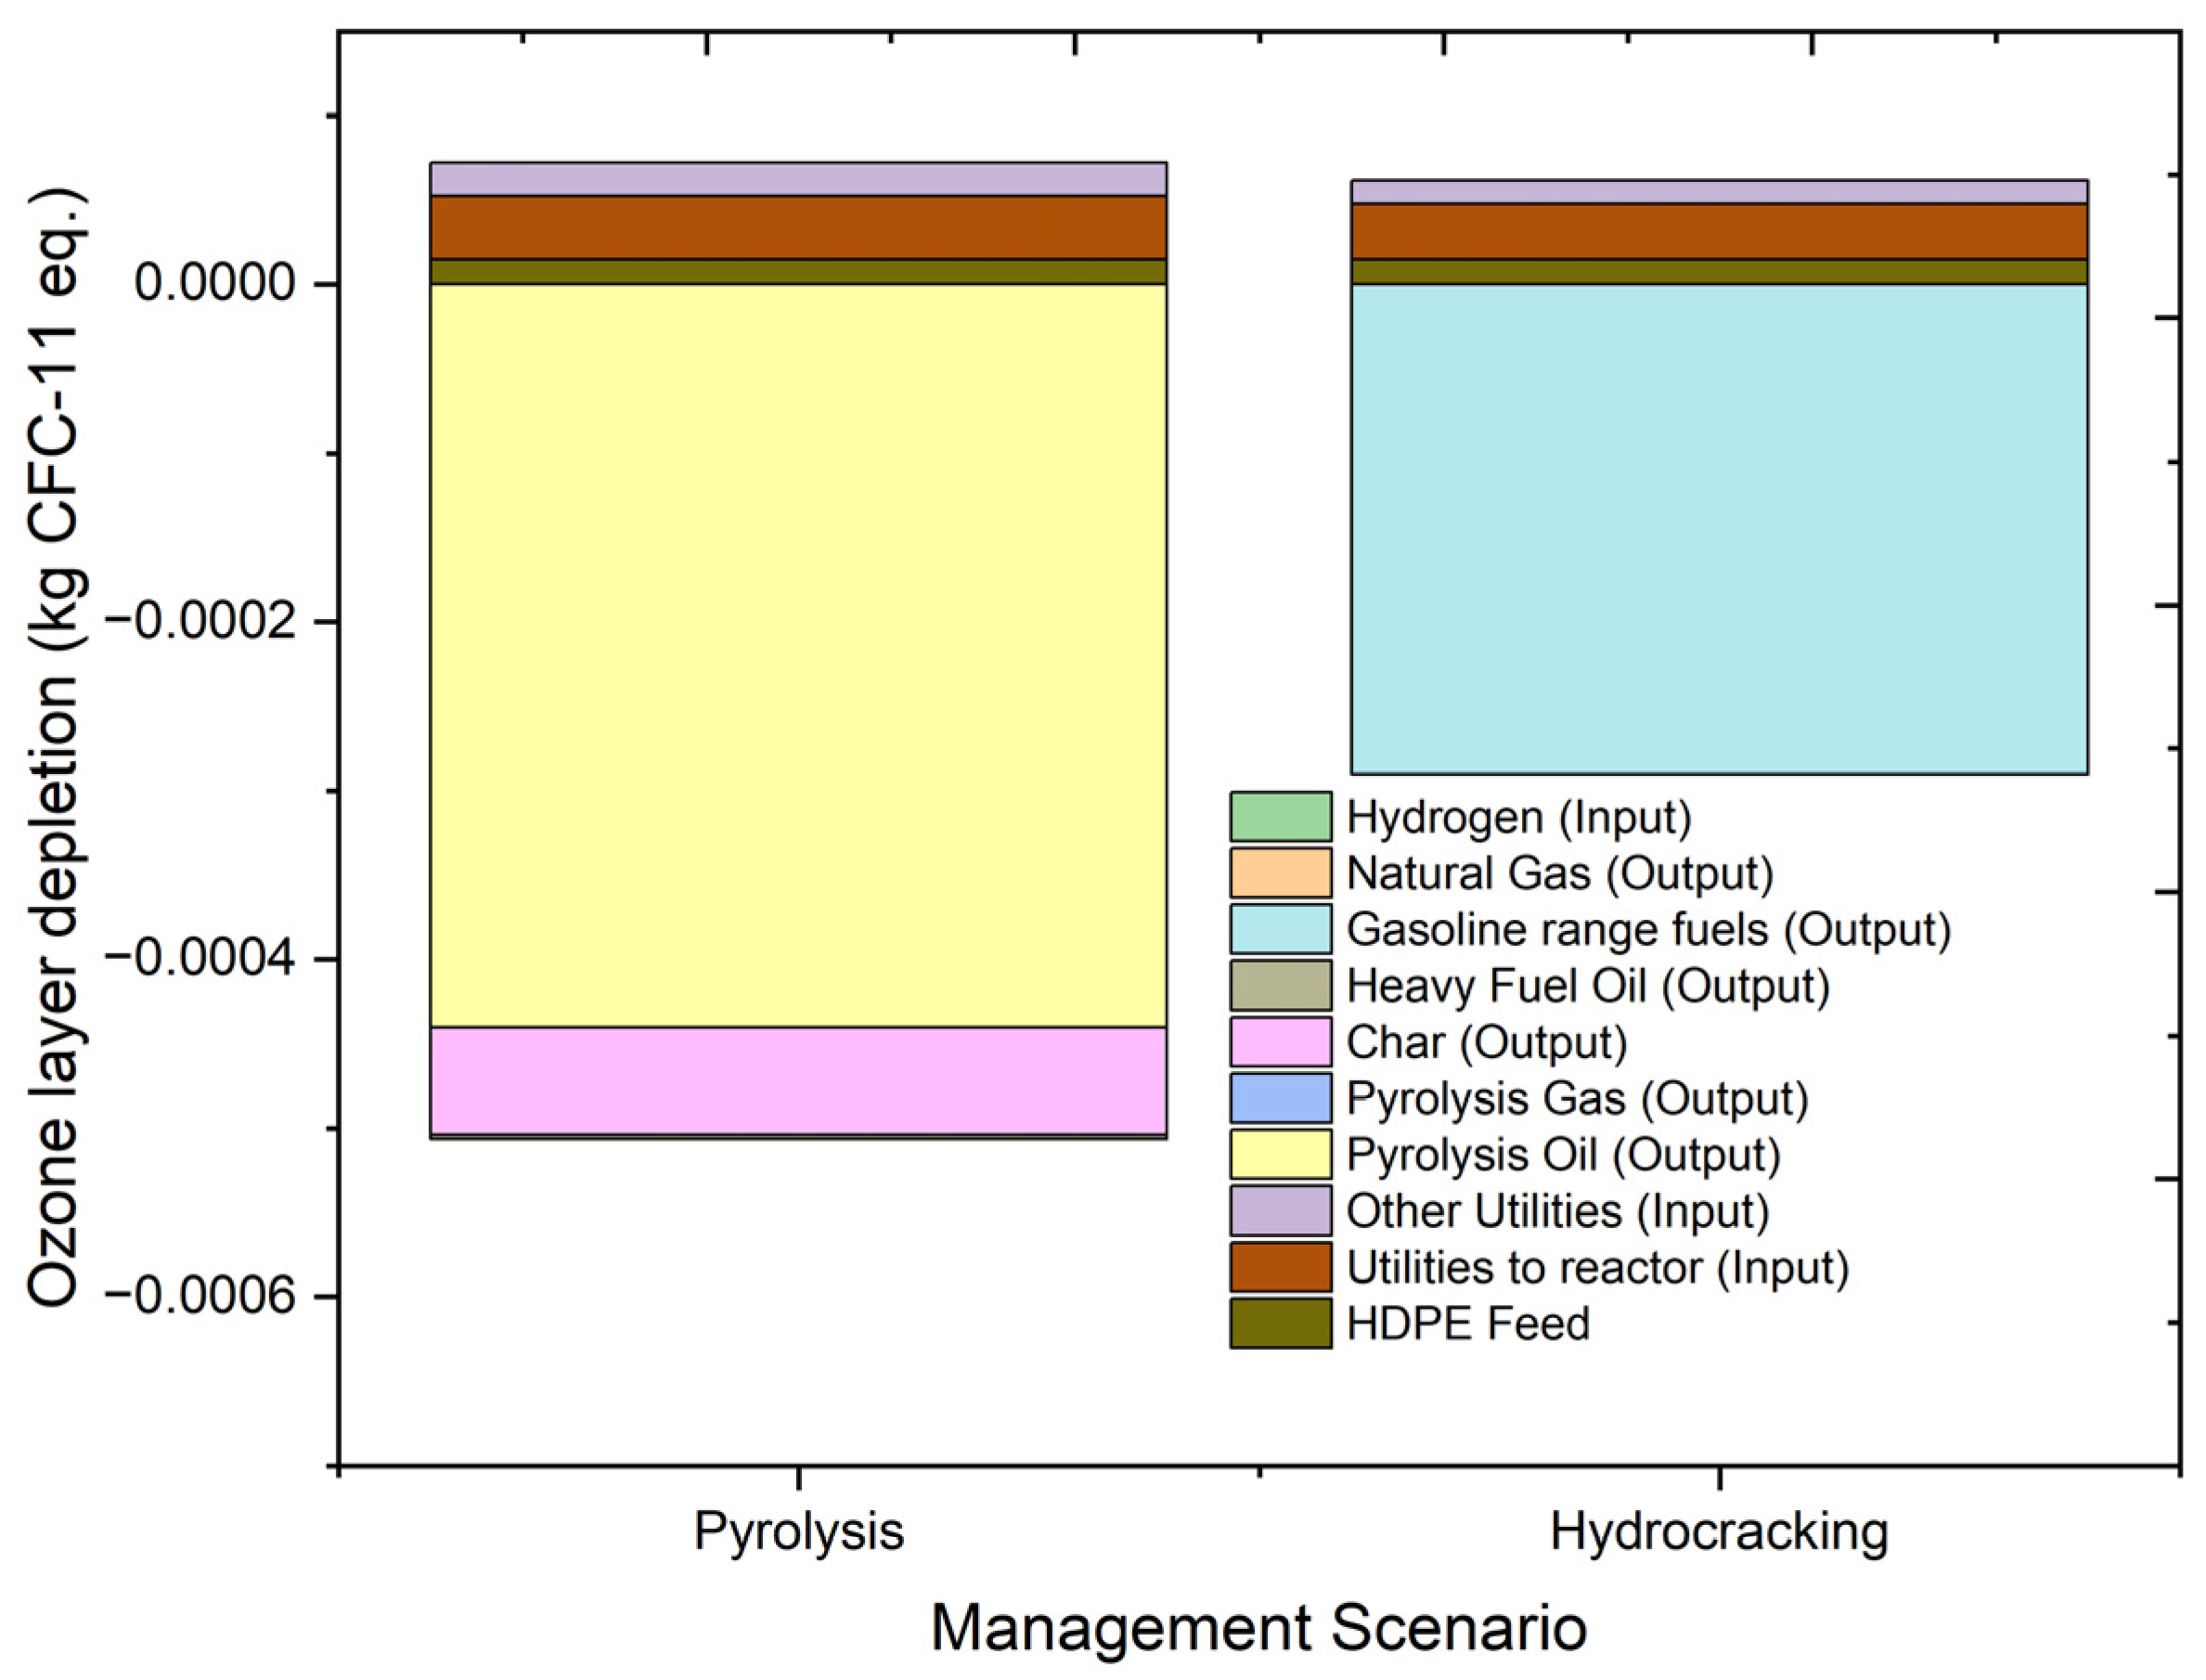
2.4.3. Ozone Layer Depletion (ODP)
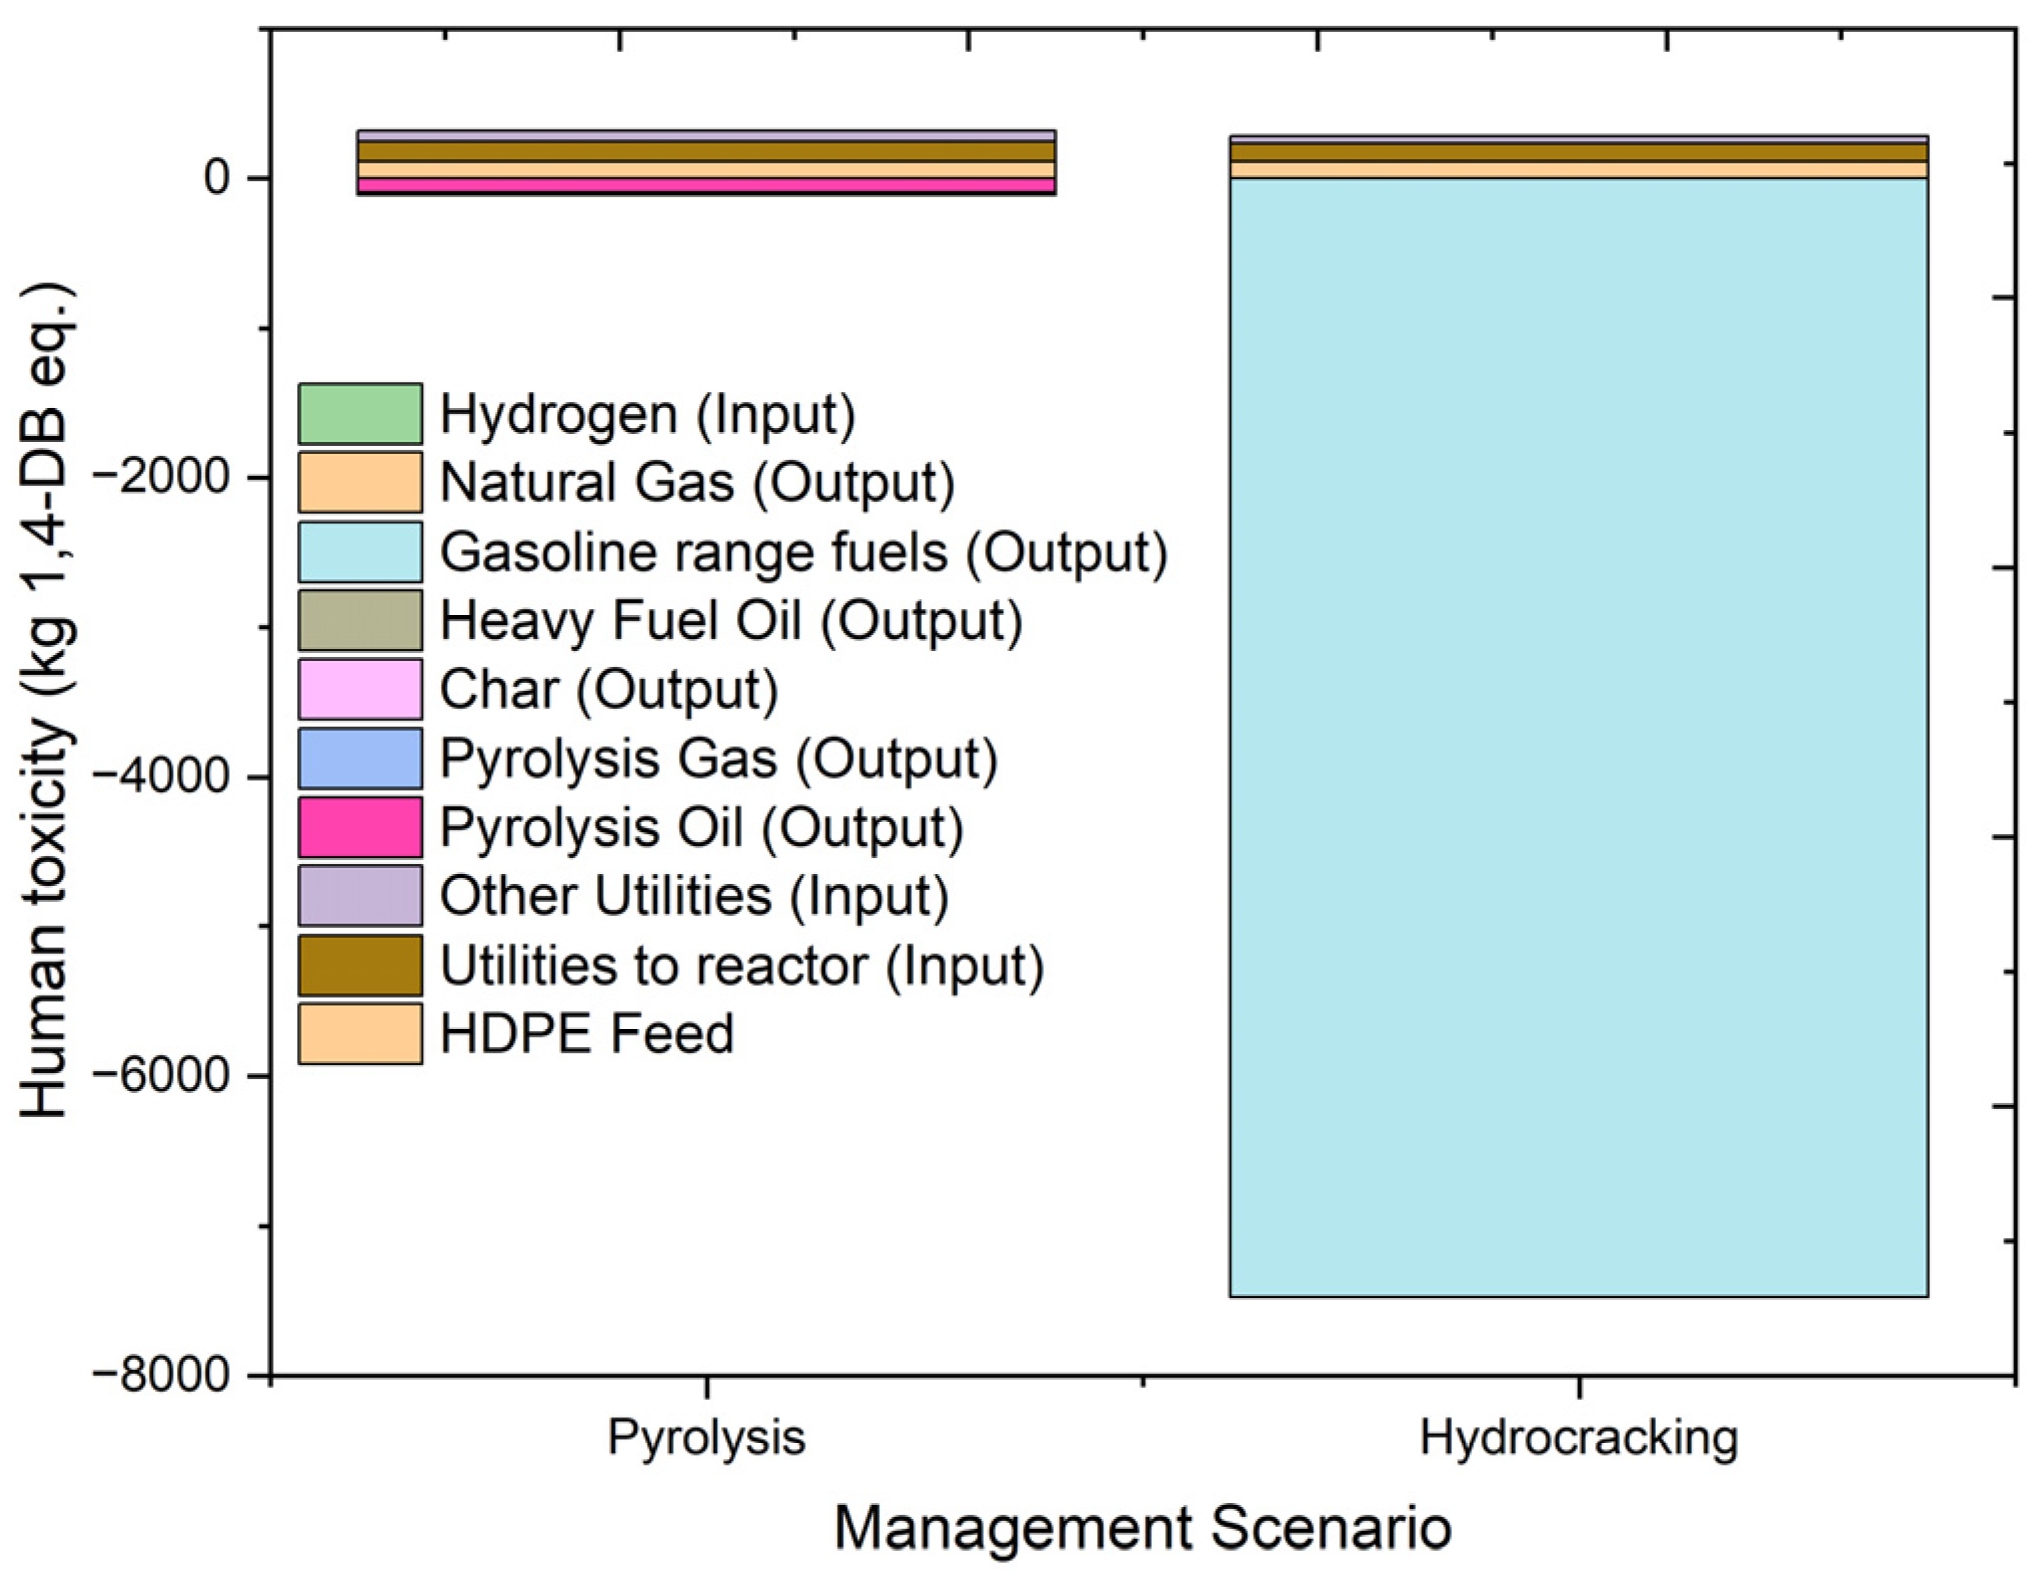
2.4.4. Human Toxicity
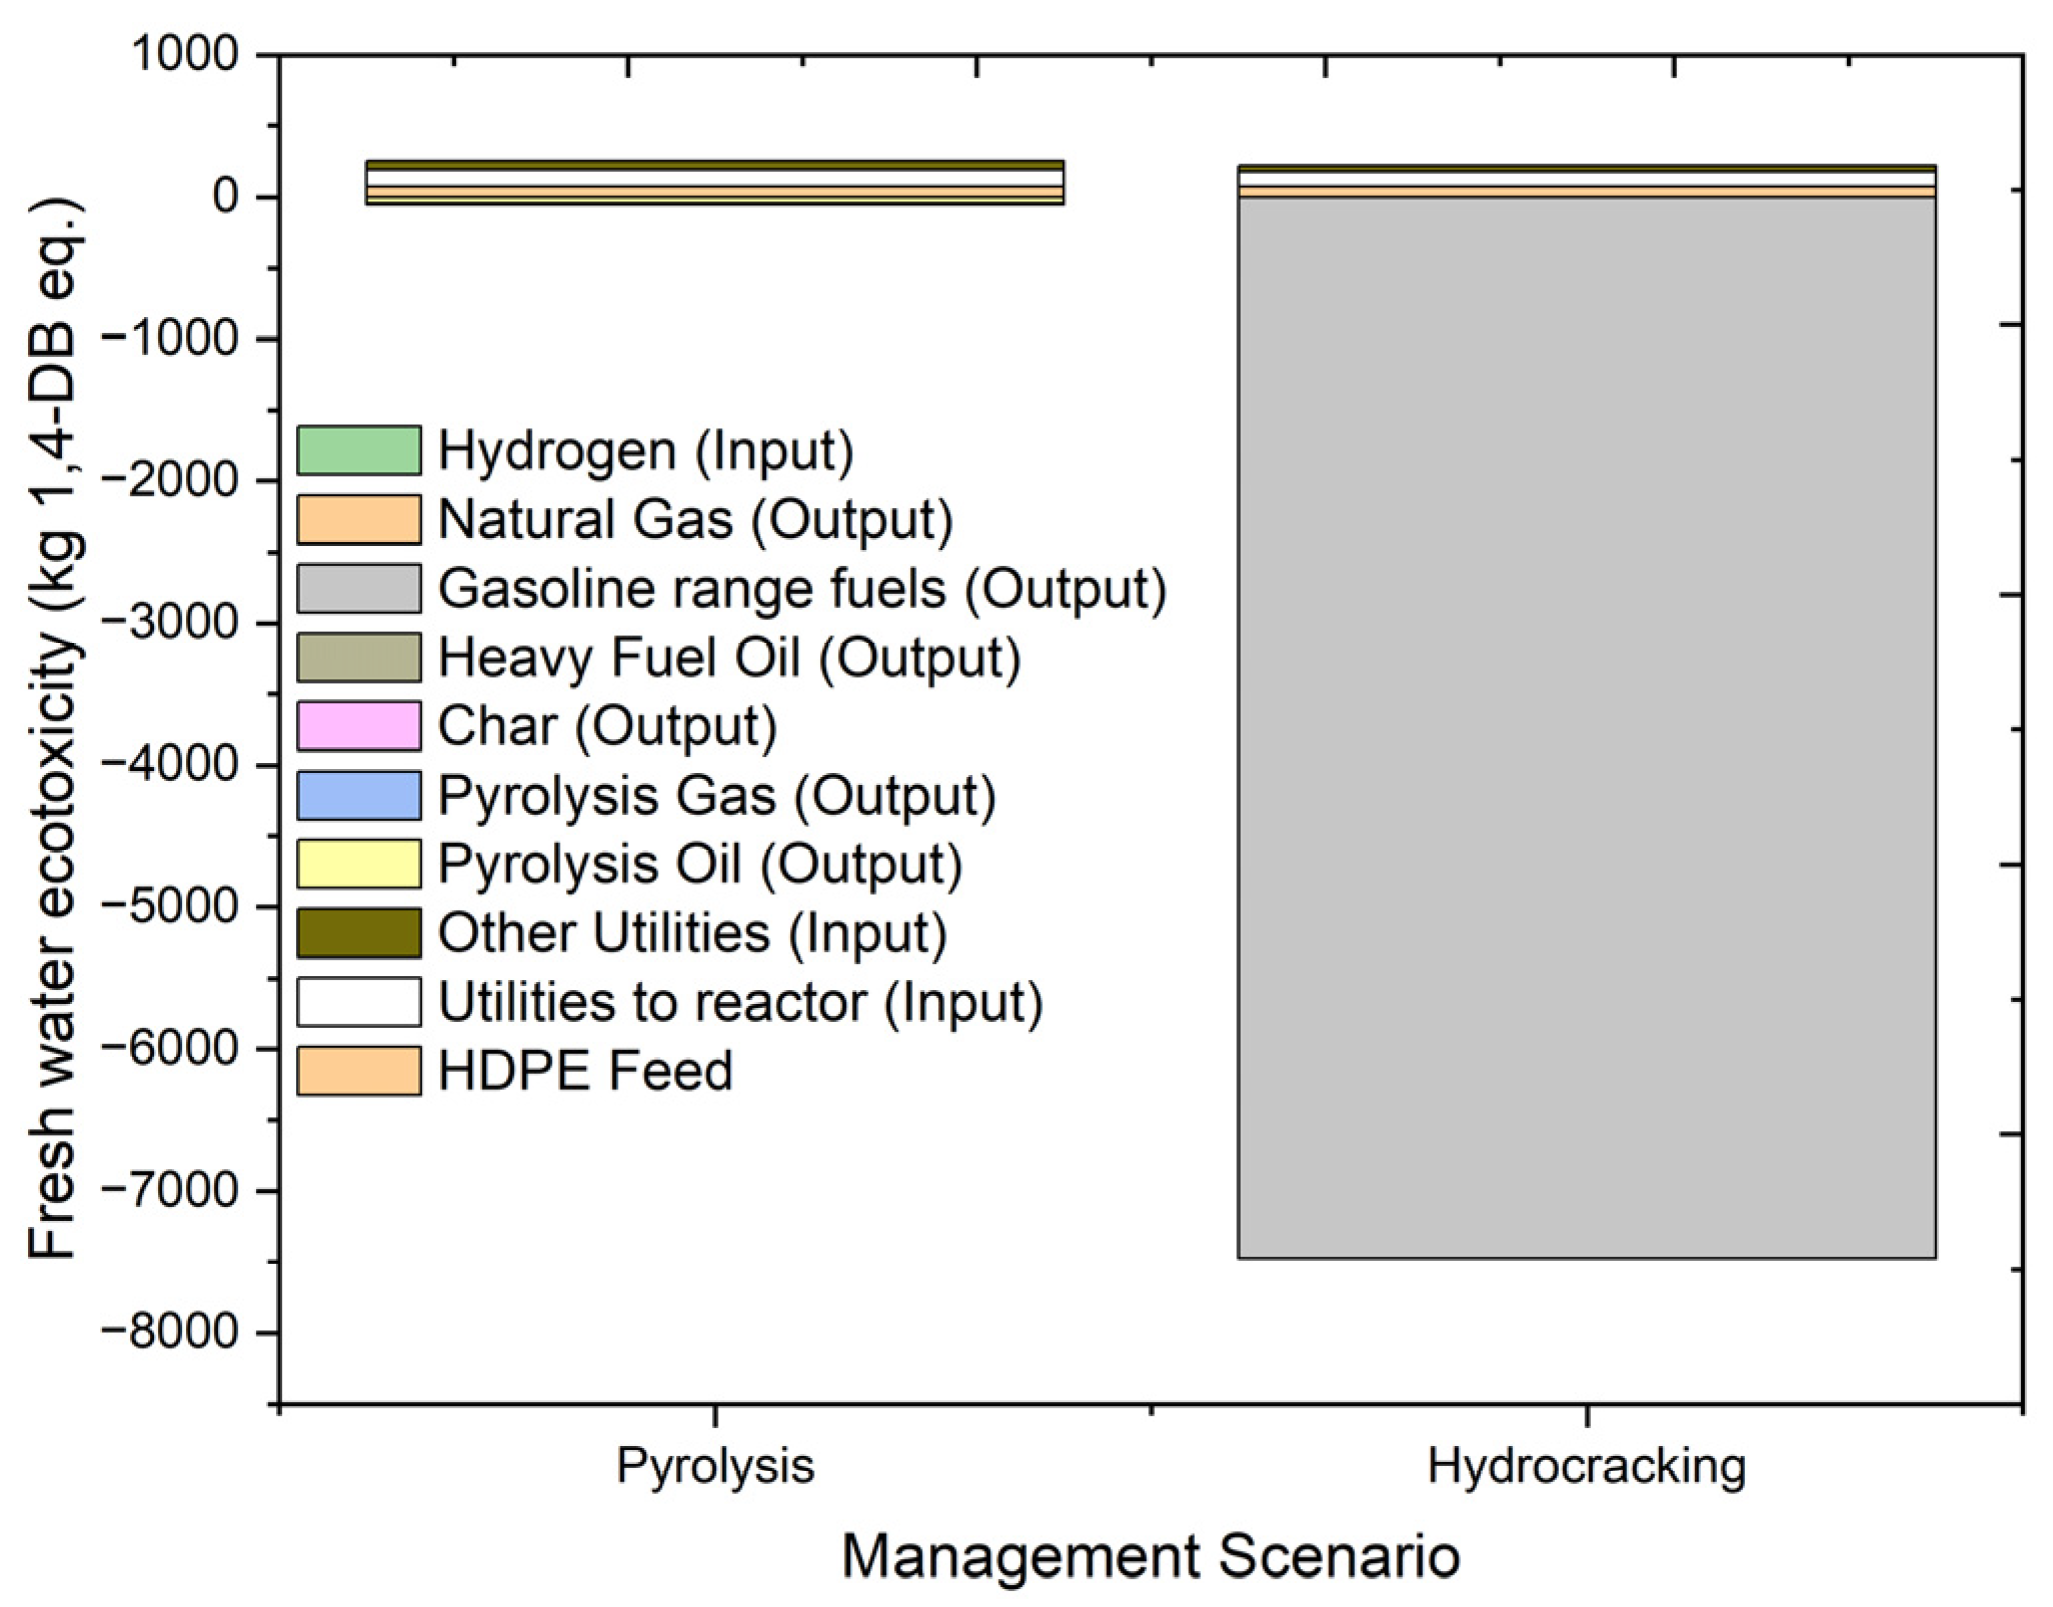
2.4.5. Fresh Water Ecotoxicity (FAETP)
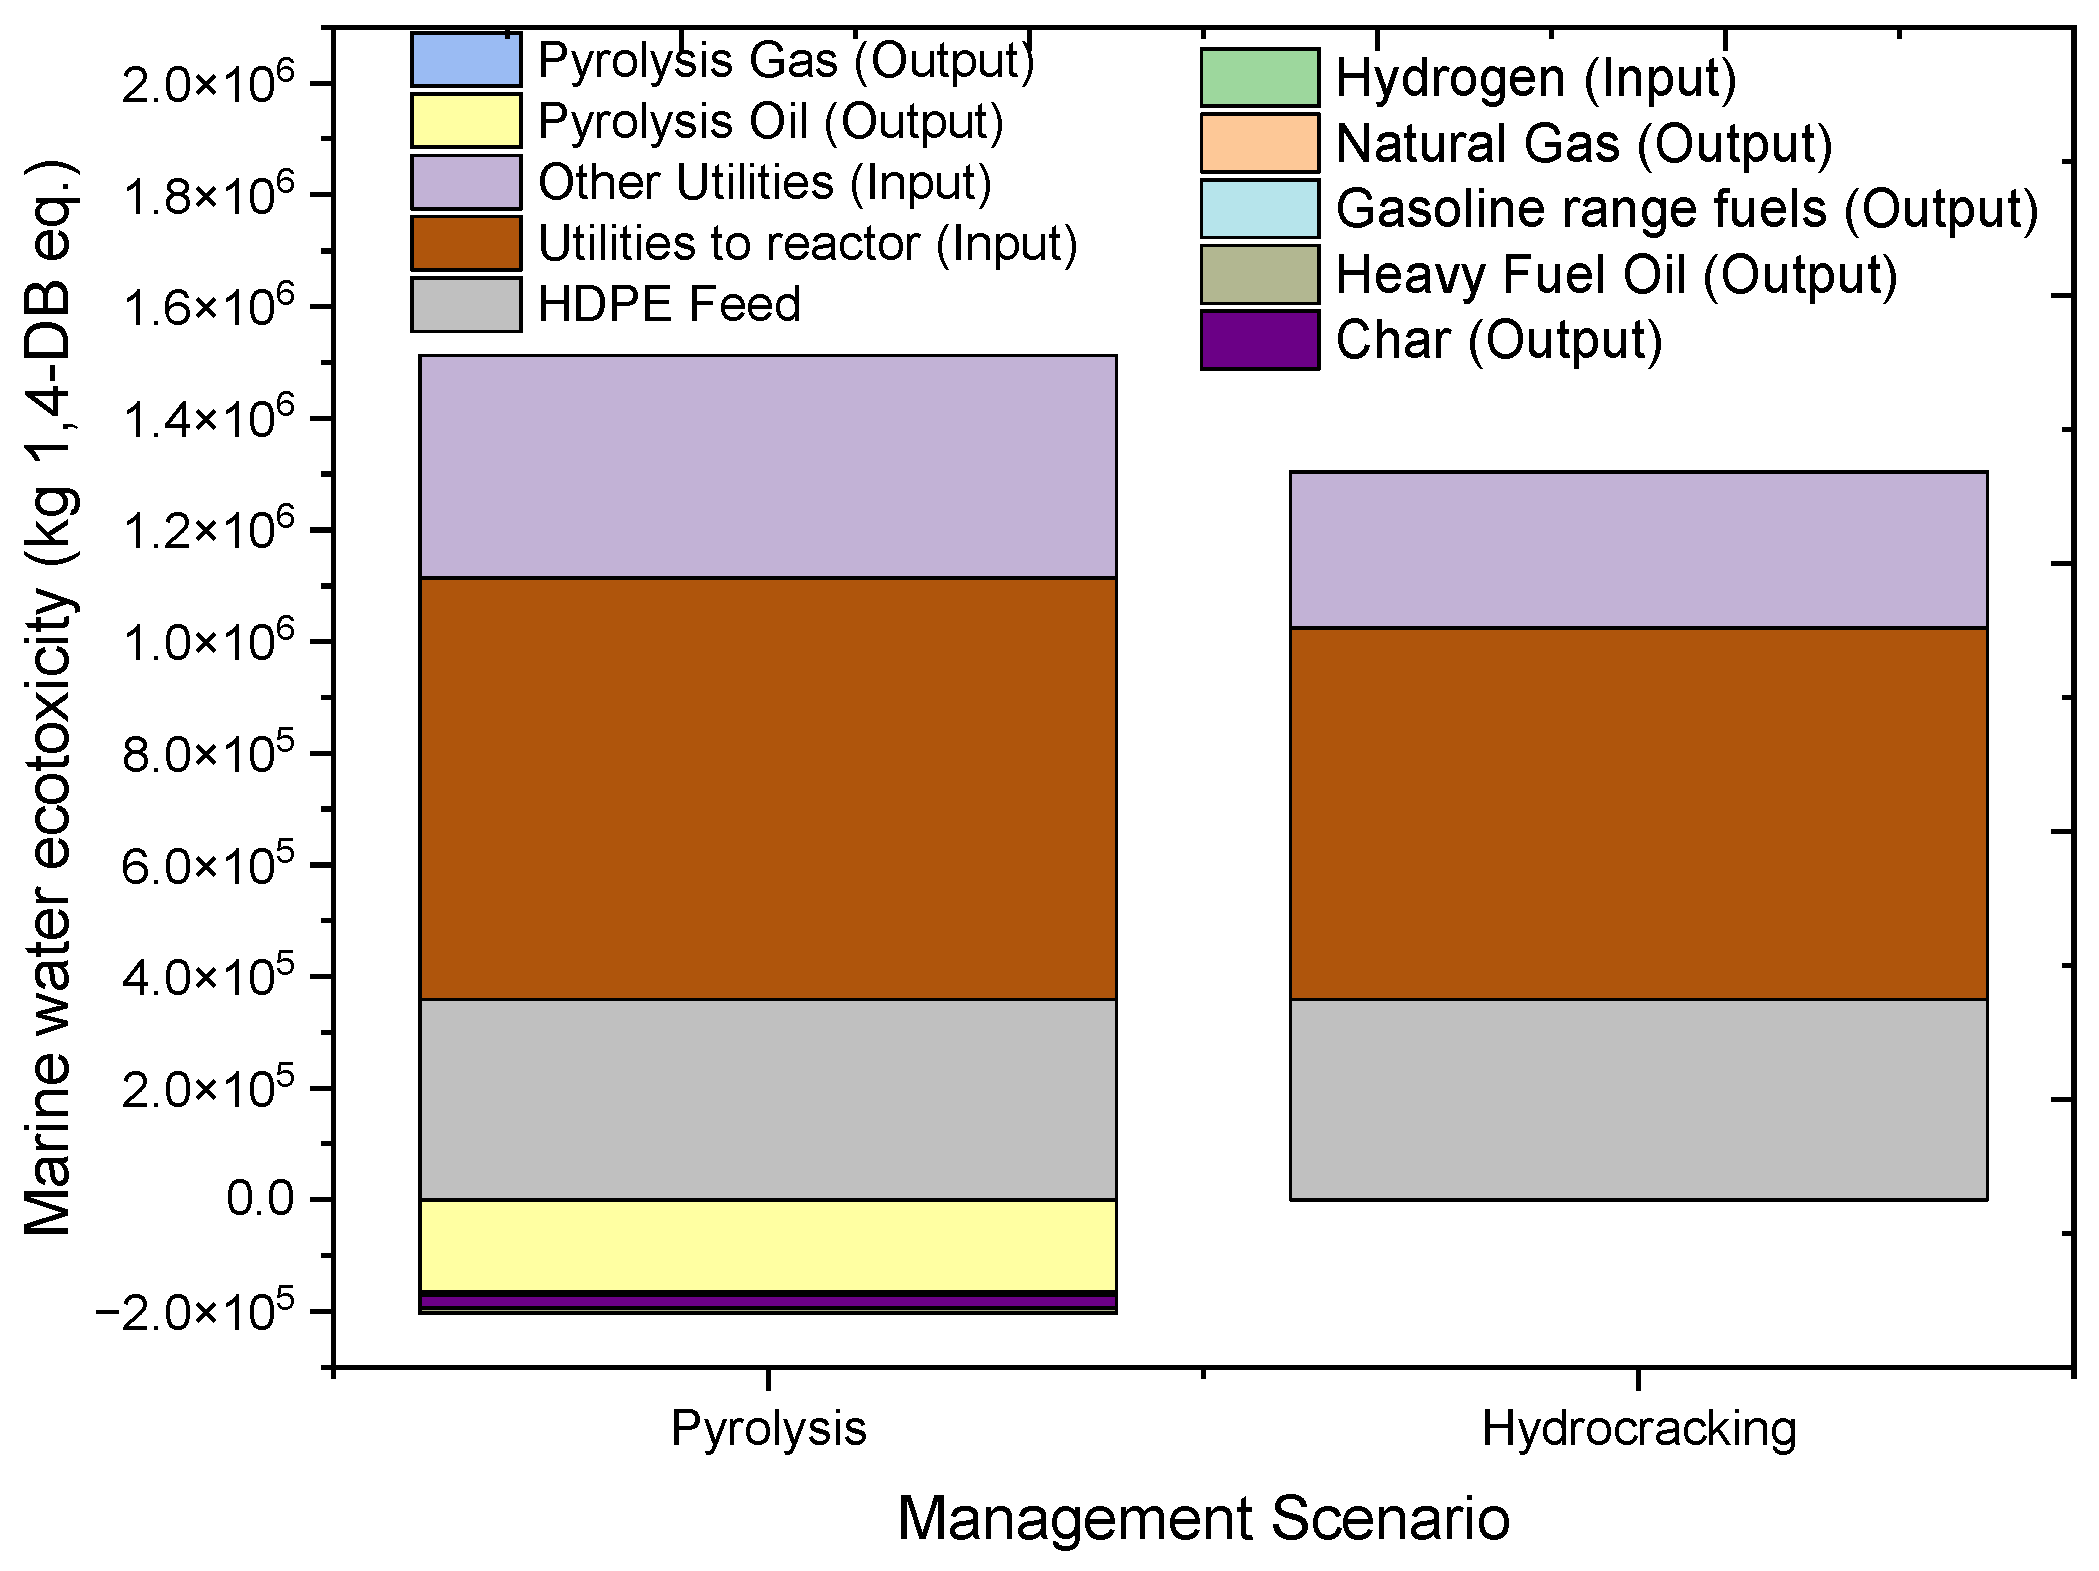
2.4.6. Marine Aquatic Ecotoxicity (MAETP)
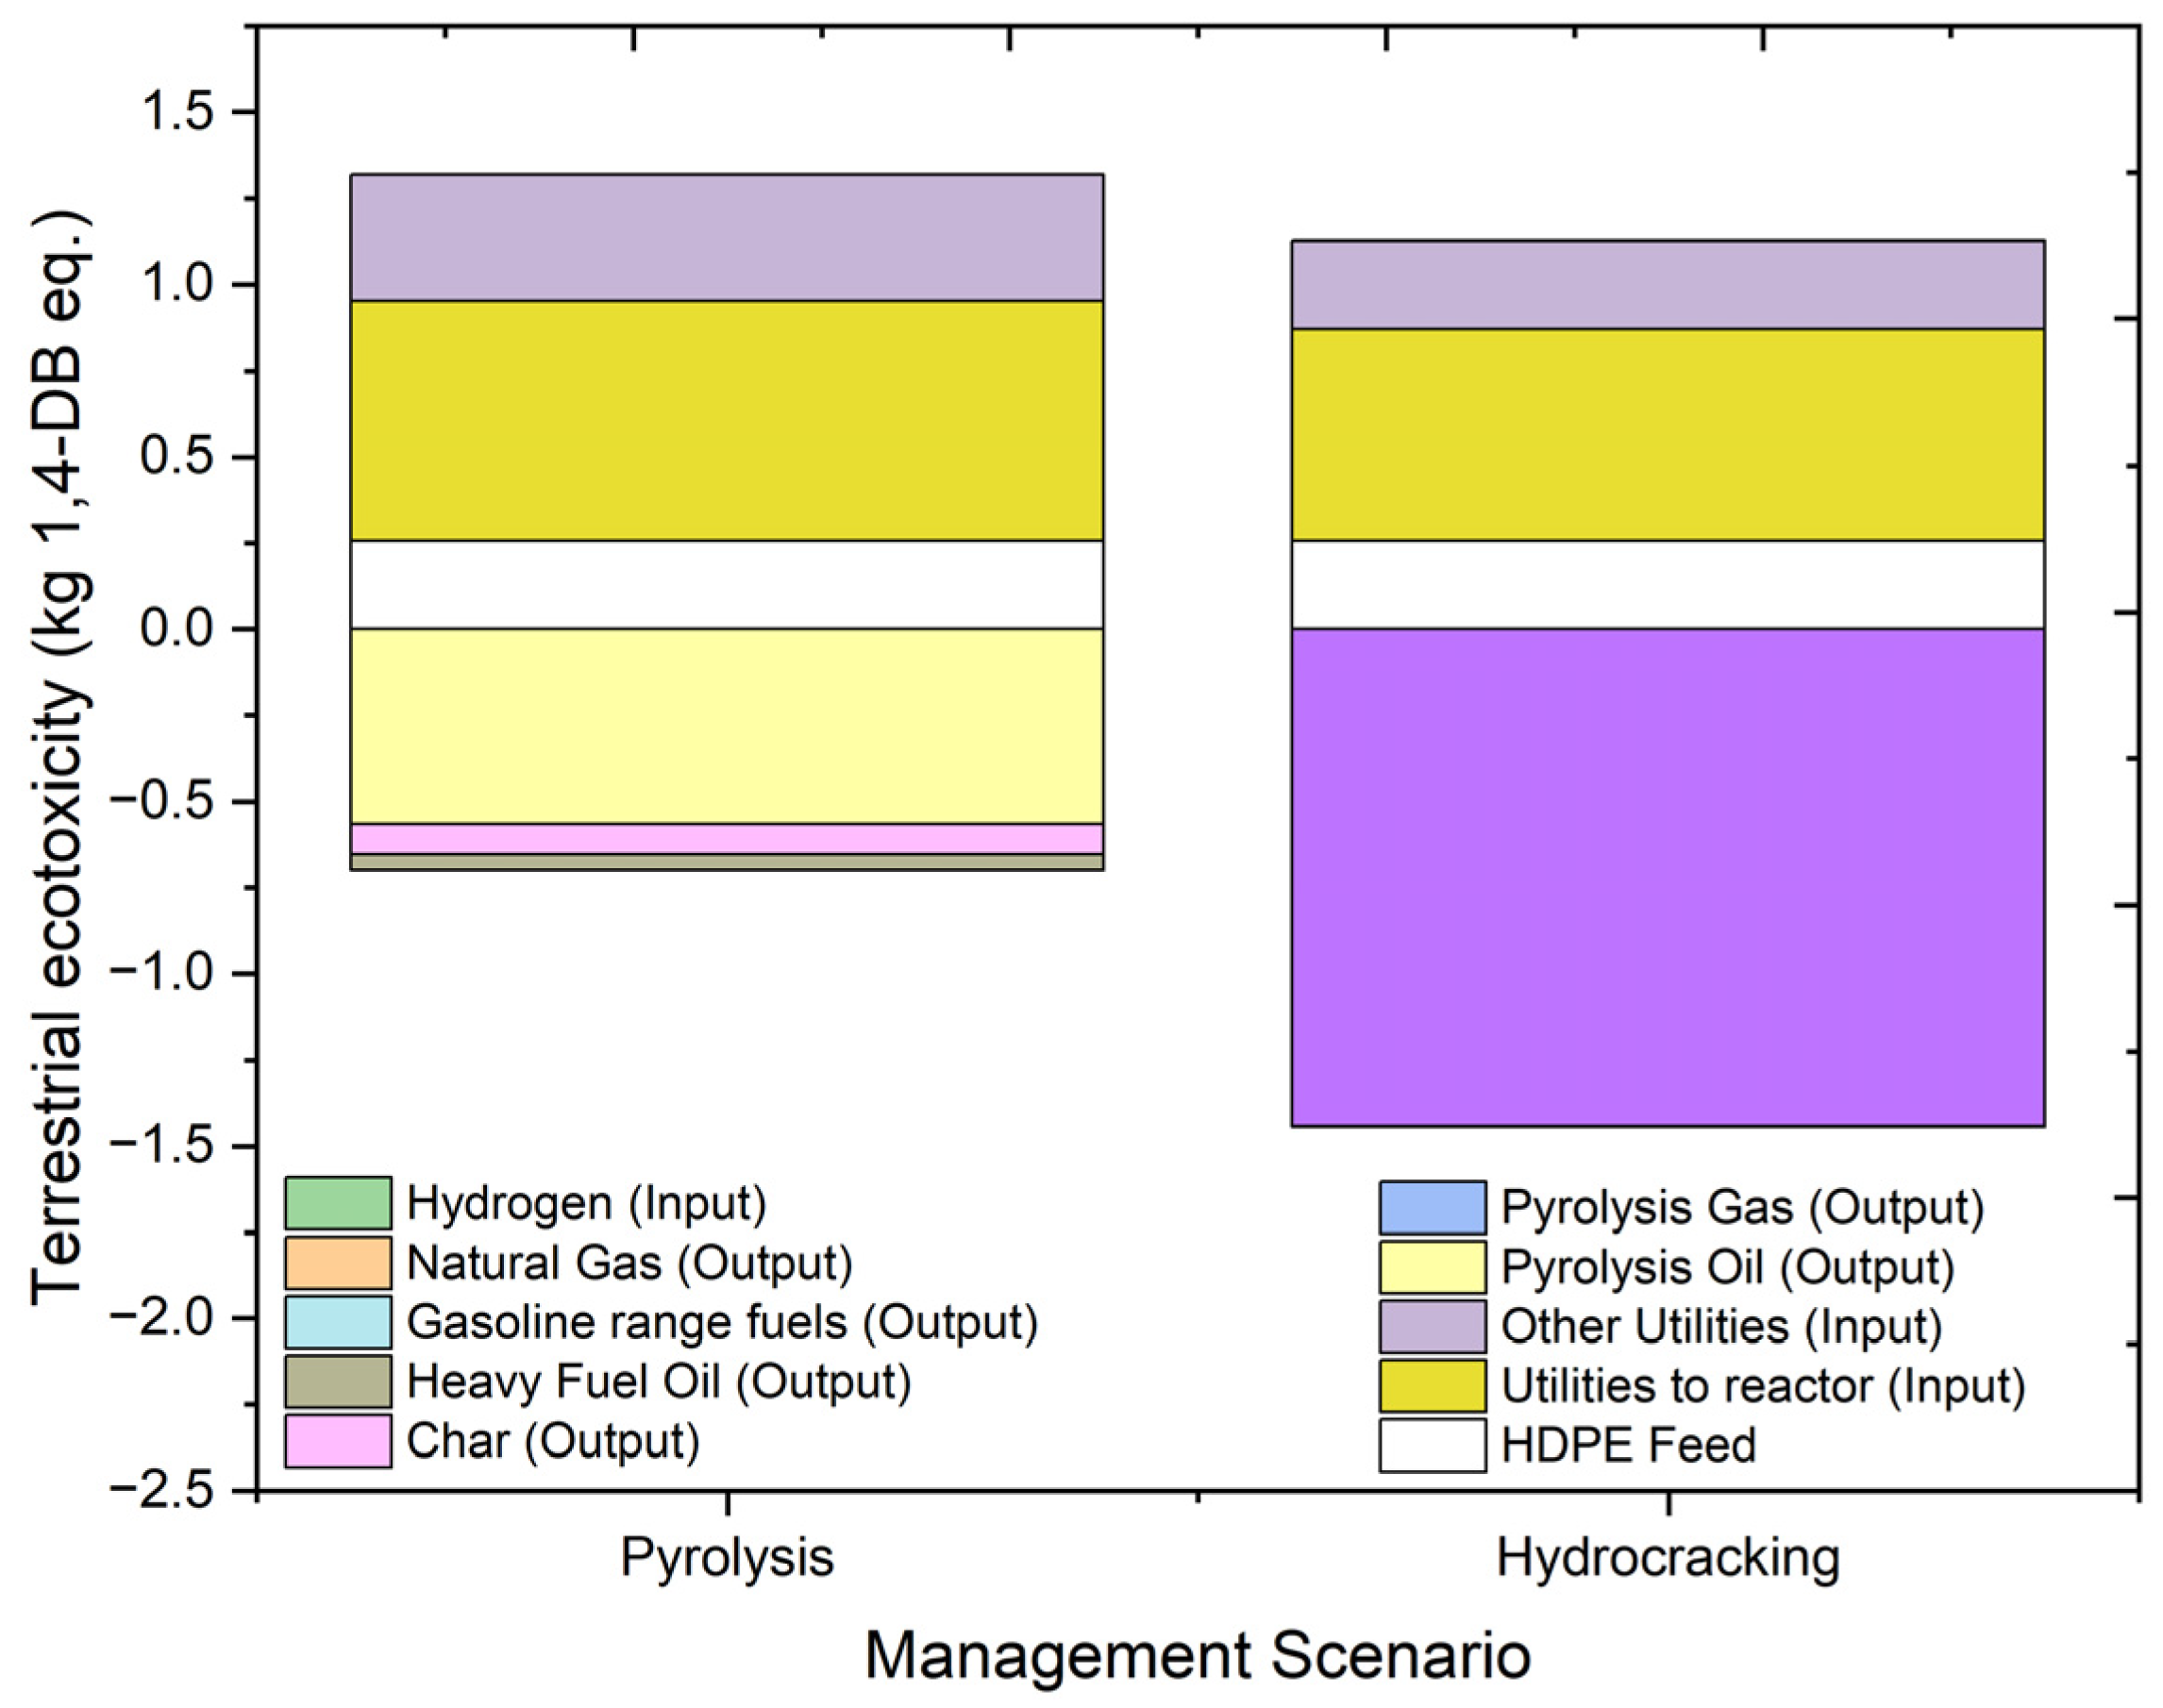
2.4.7. Terrestrial Ecotoxicity (TAETP)
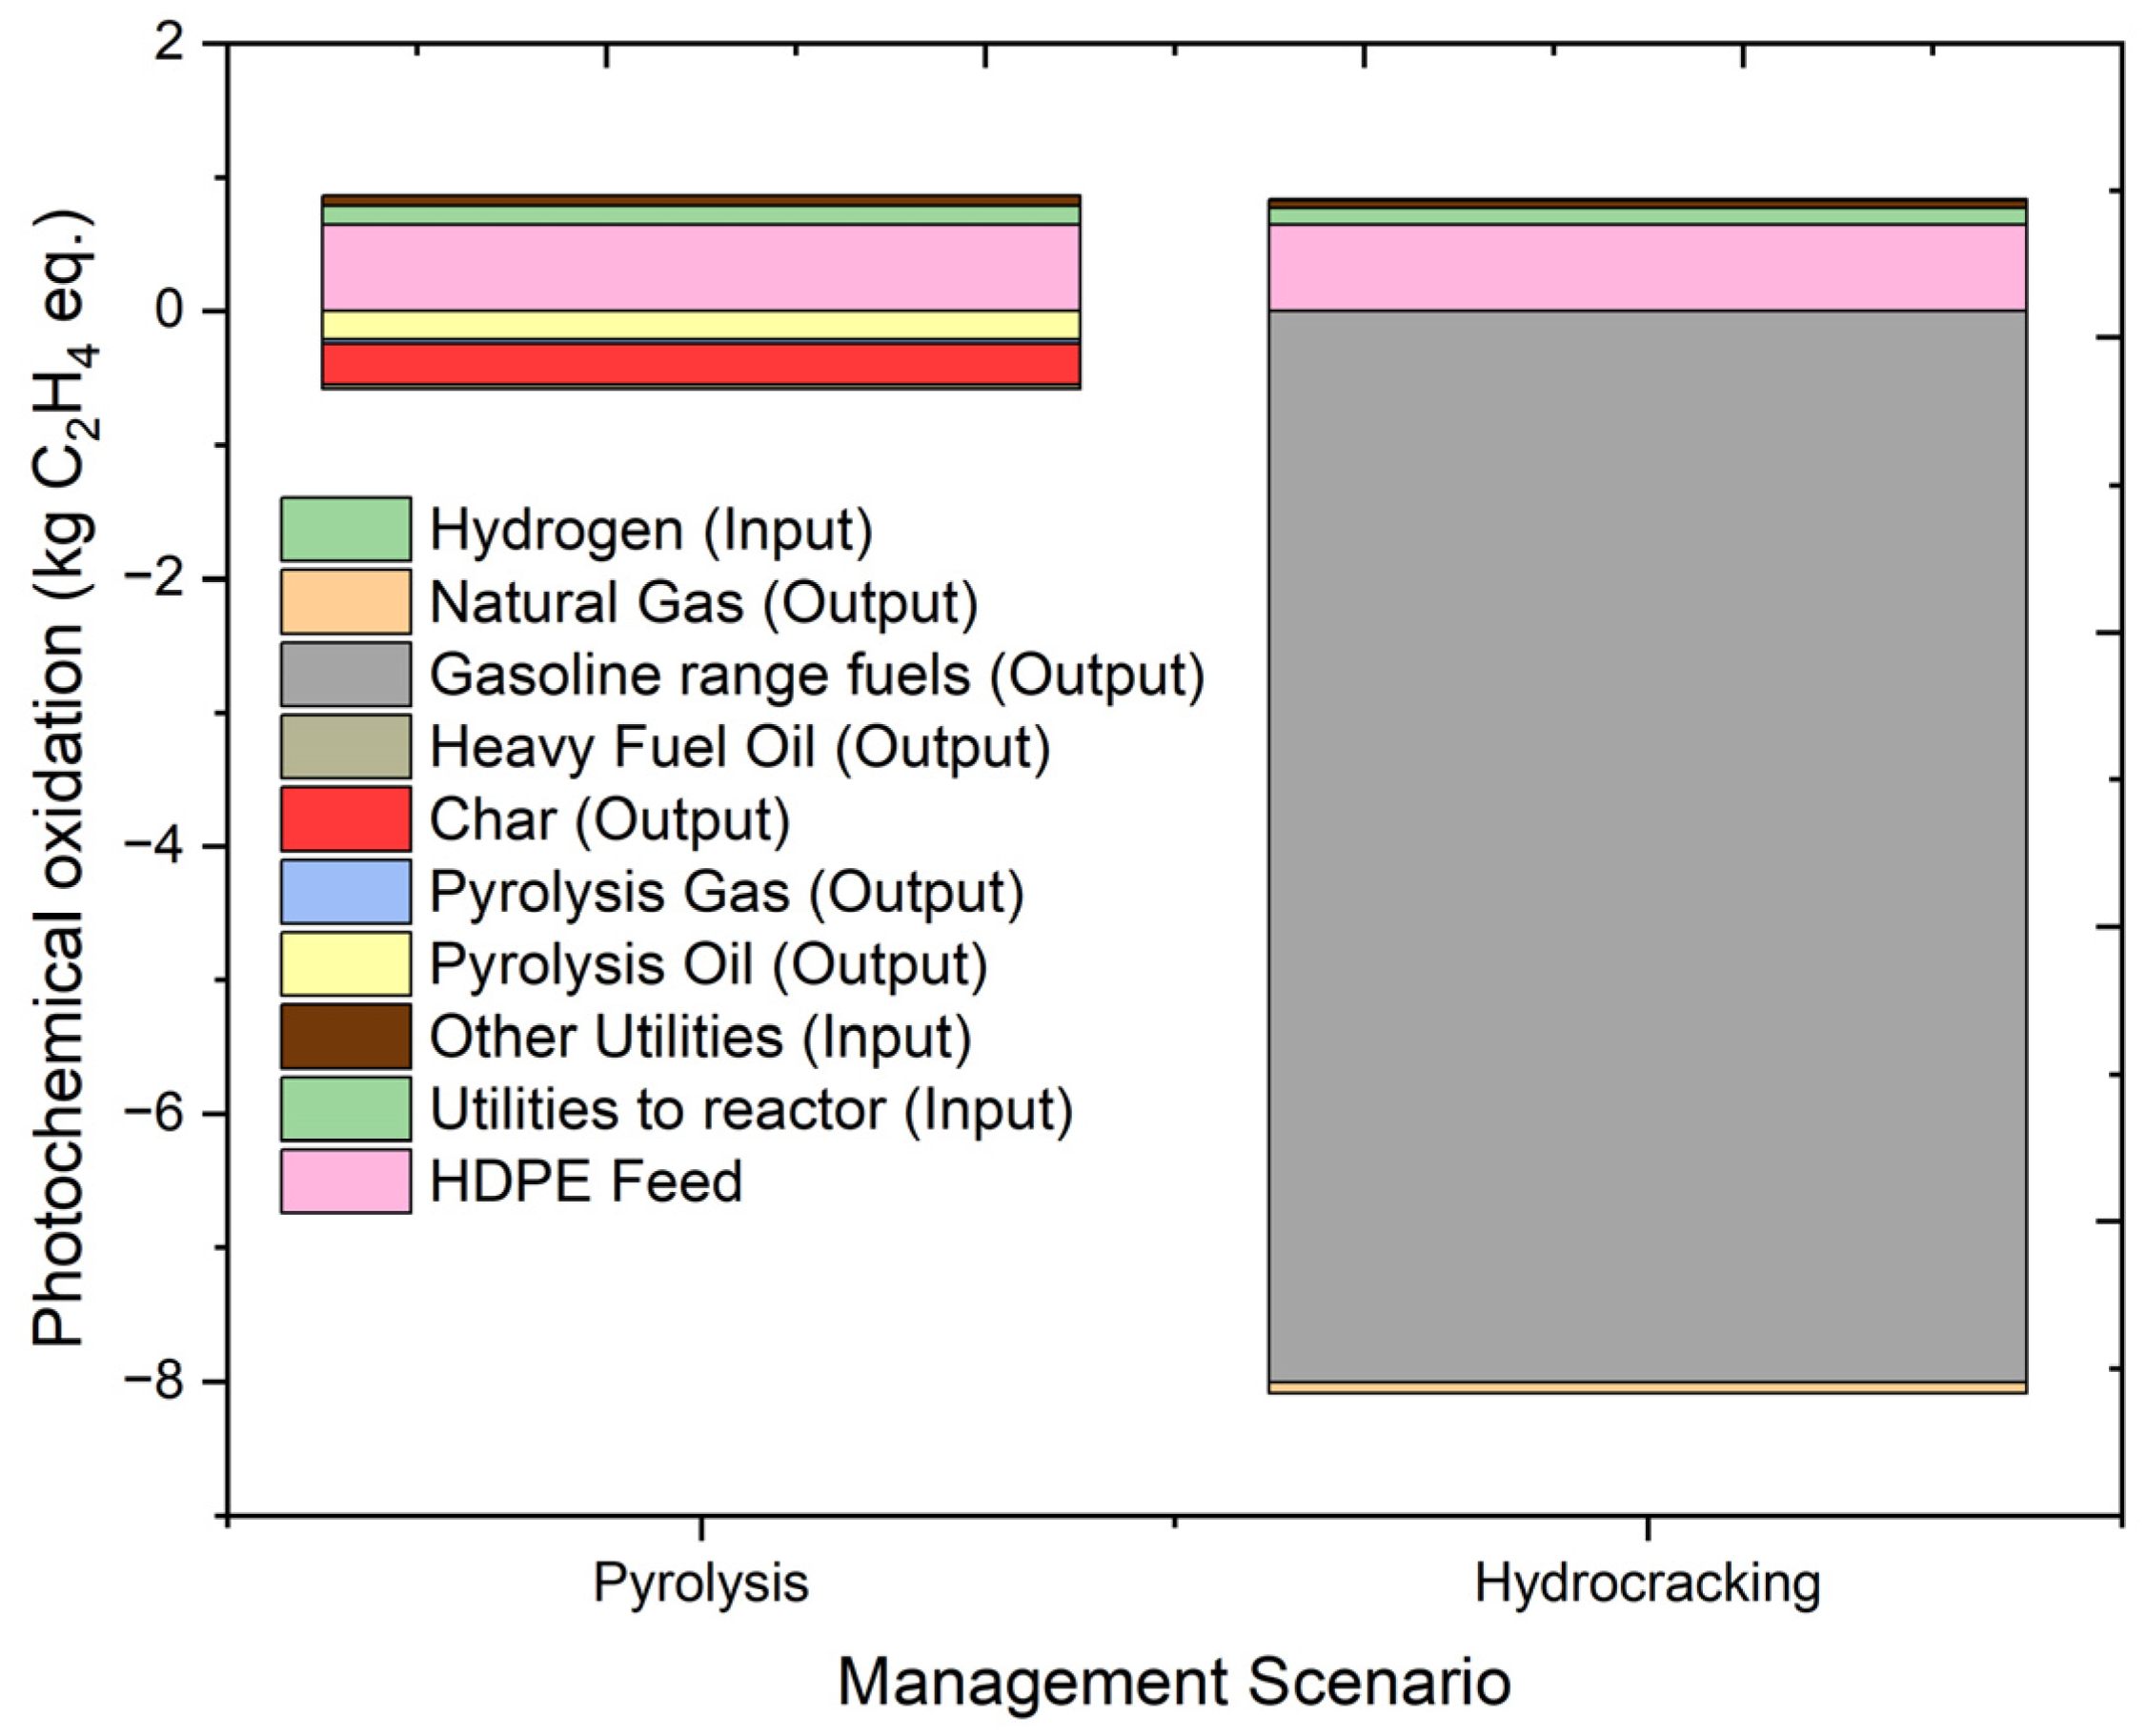
2.4.8. Photochemical Oxidation Potential
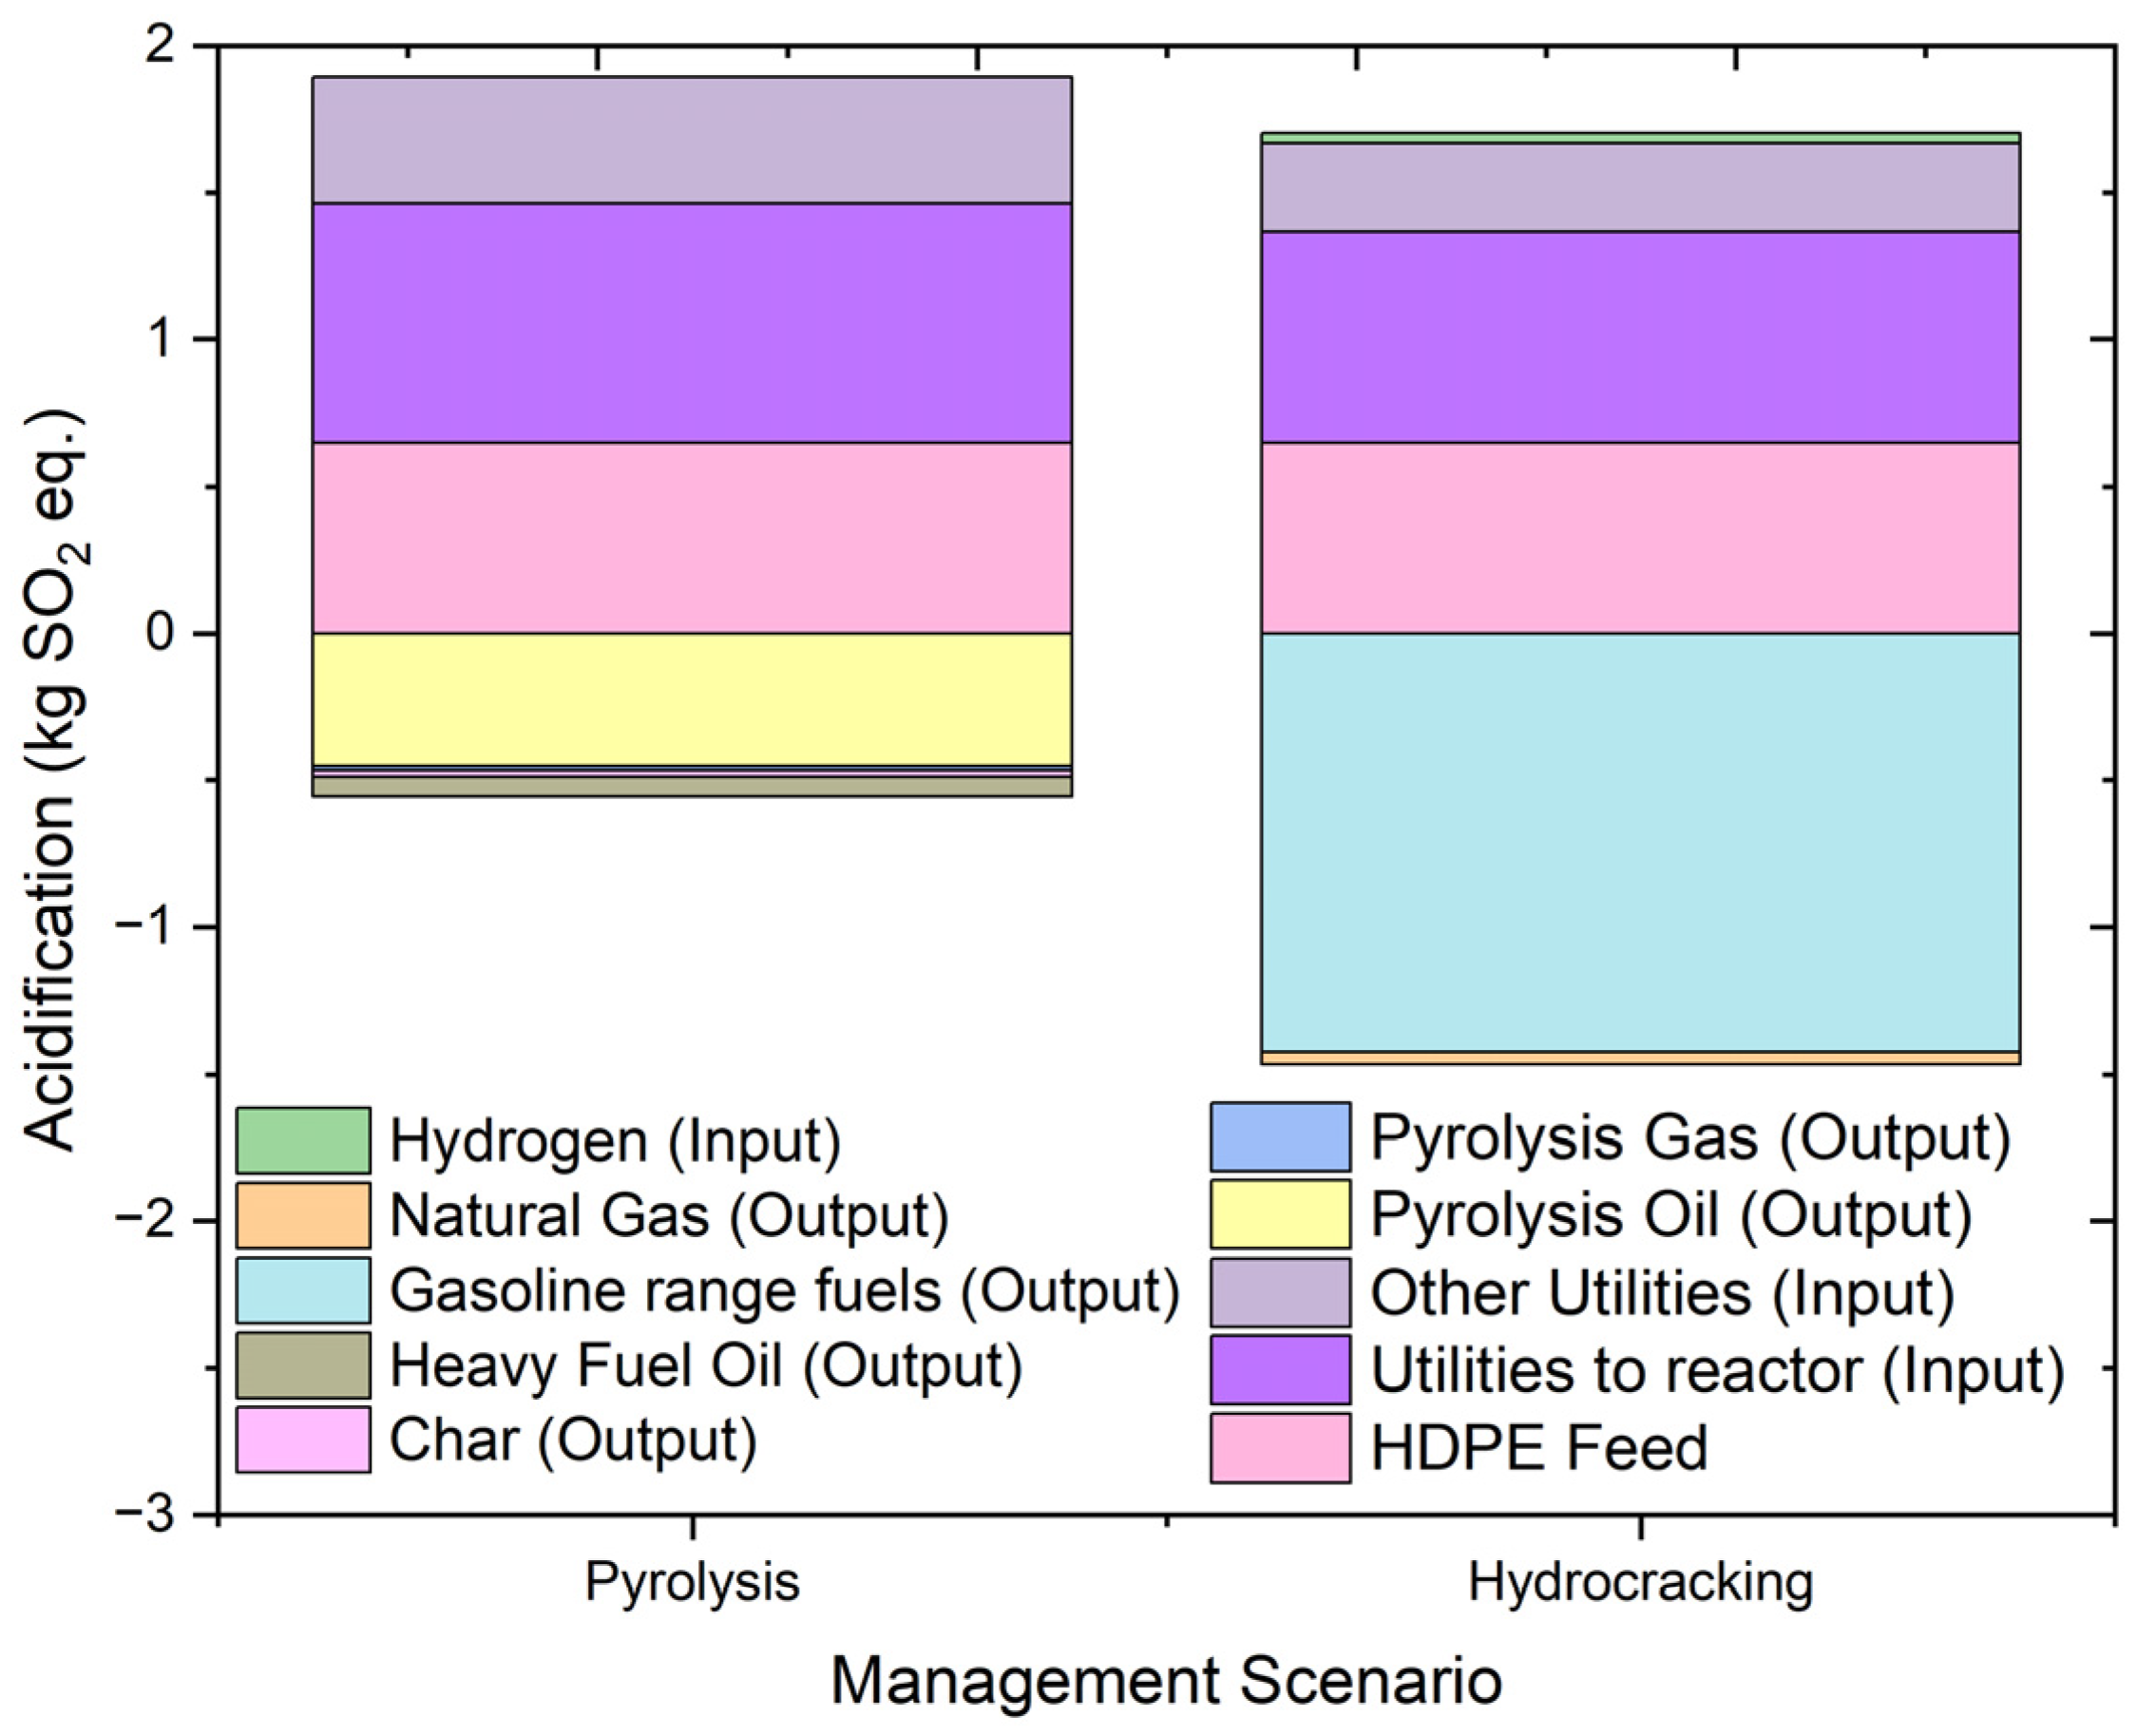
2.4.9. Acidification Potential
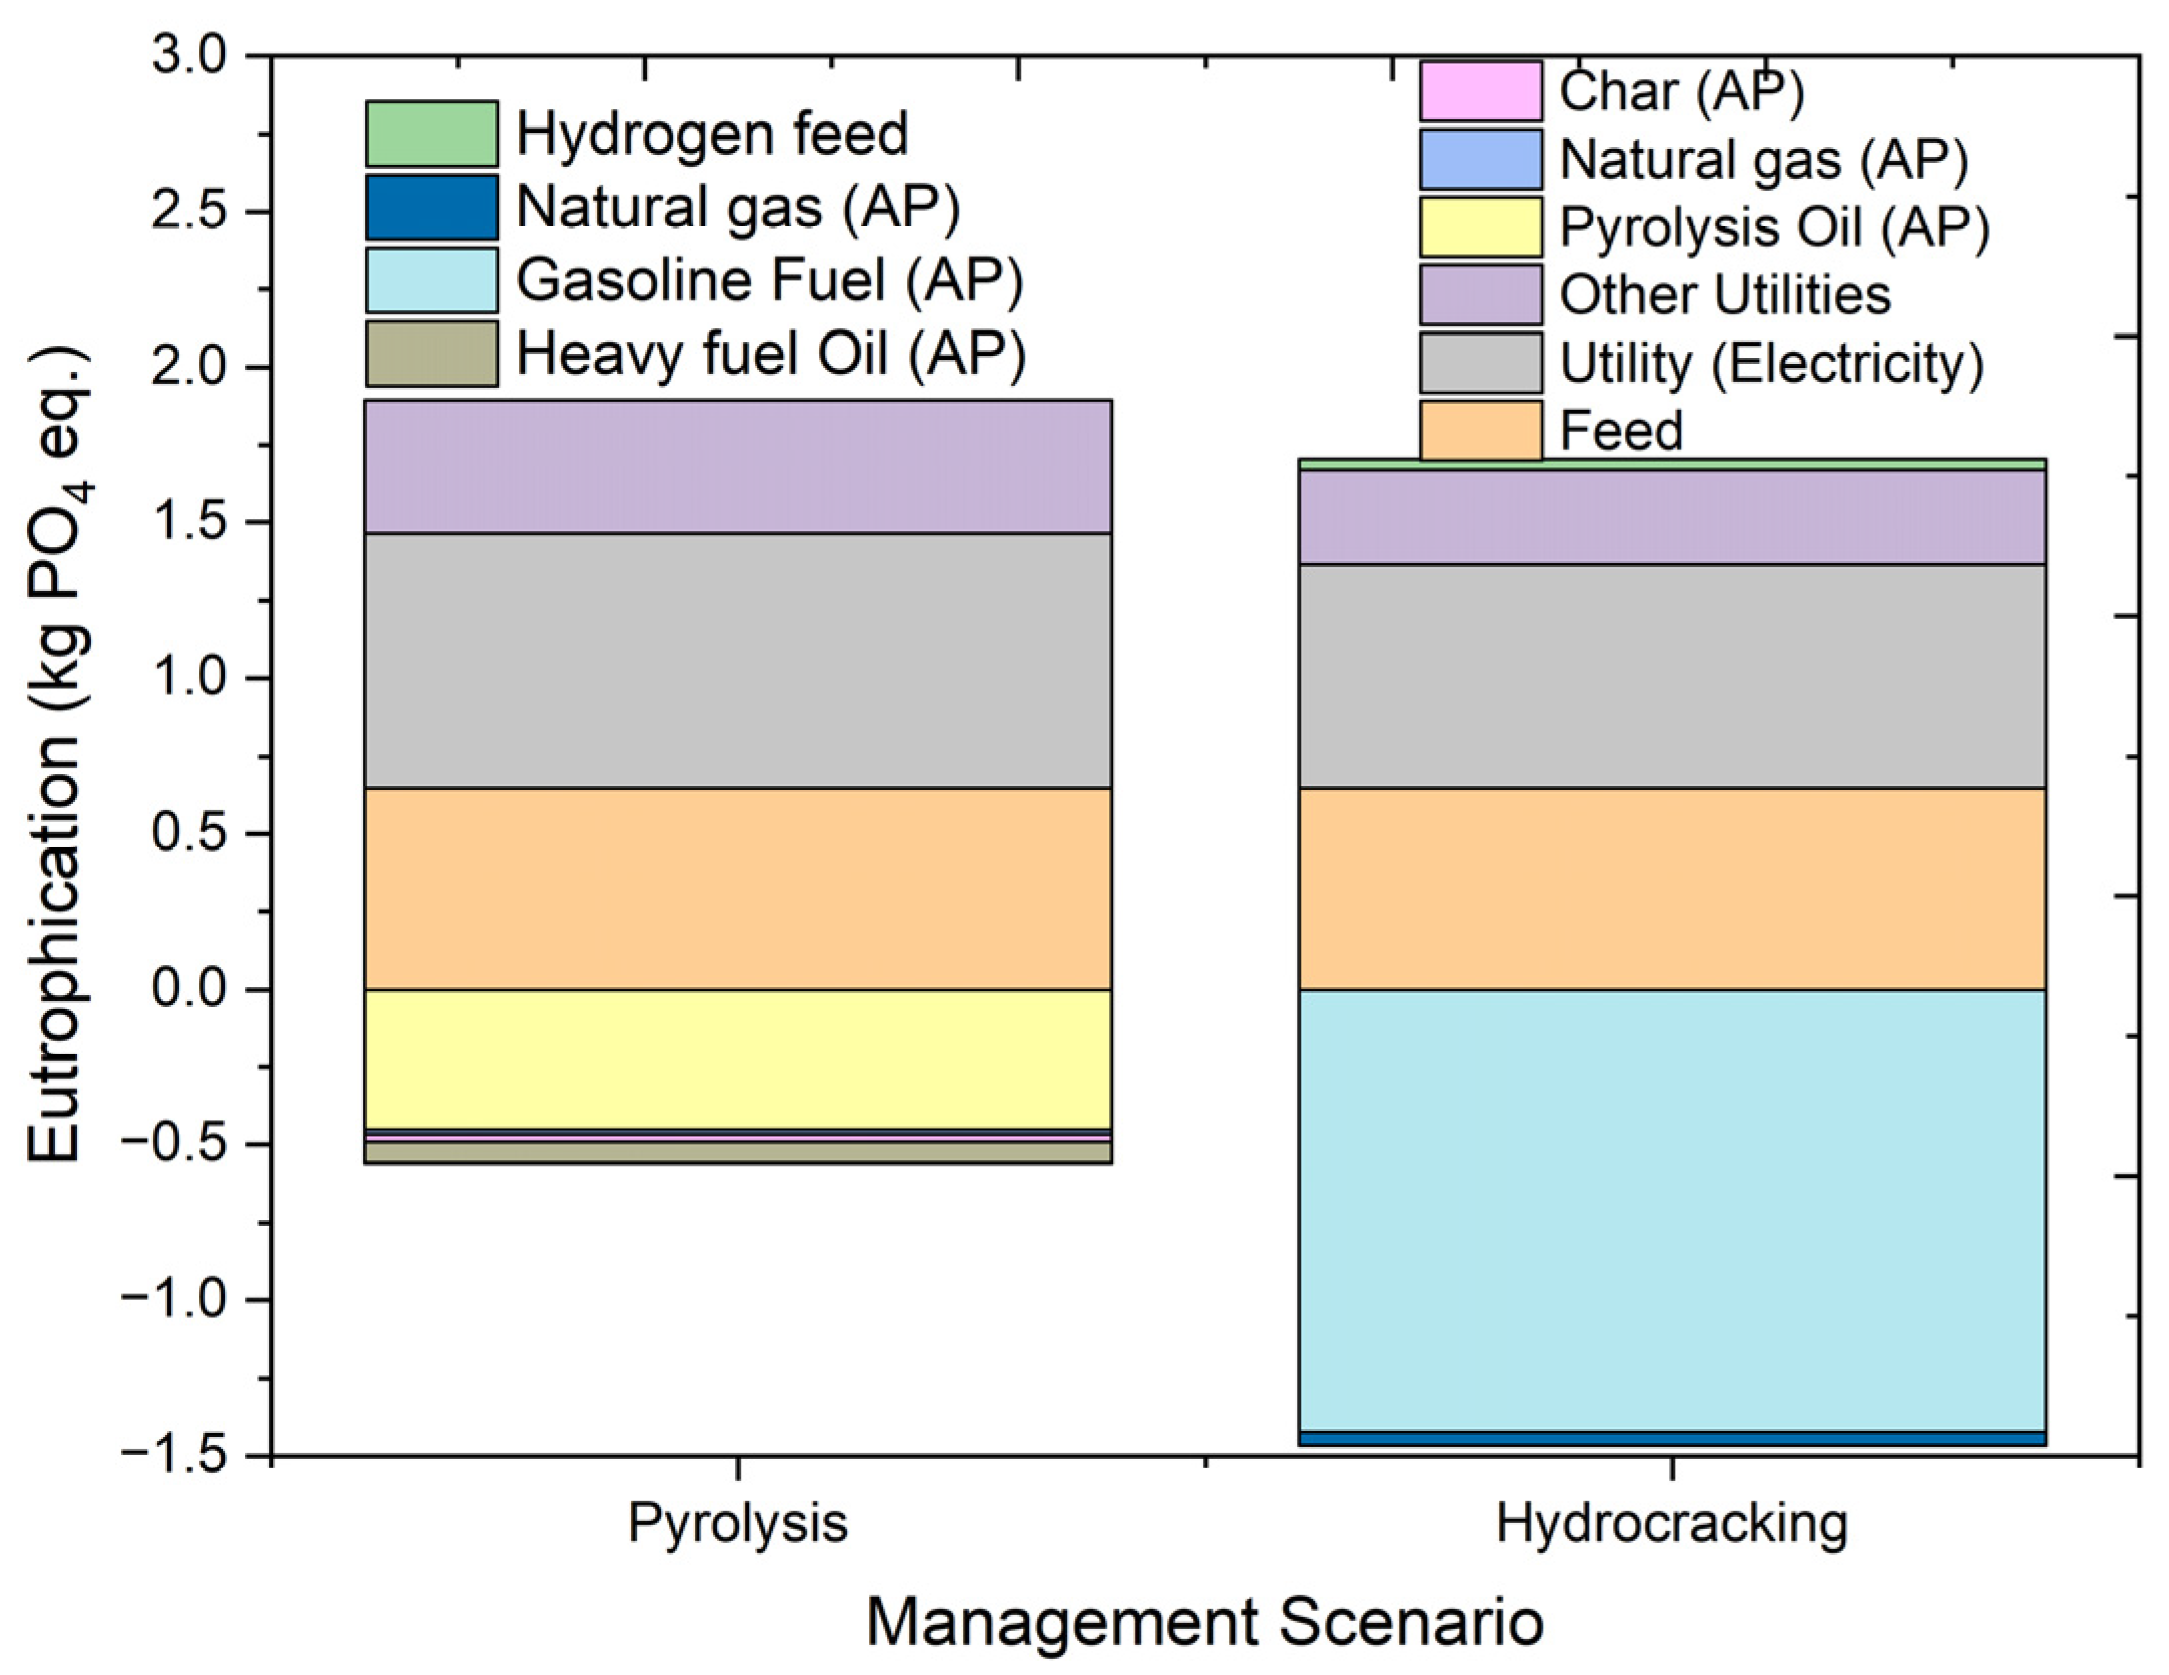
2.4.10. Eutrophication Potential
3. Materials and Methods
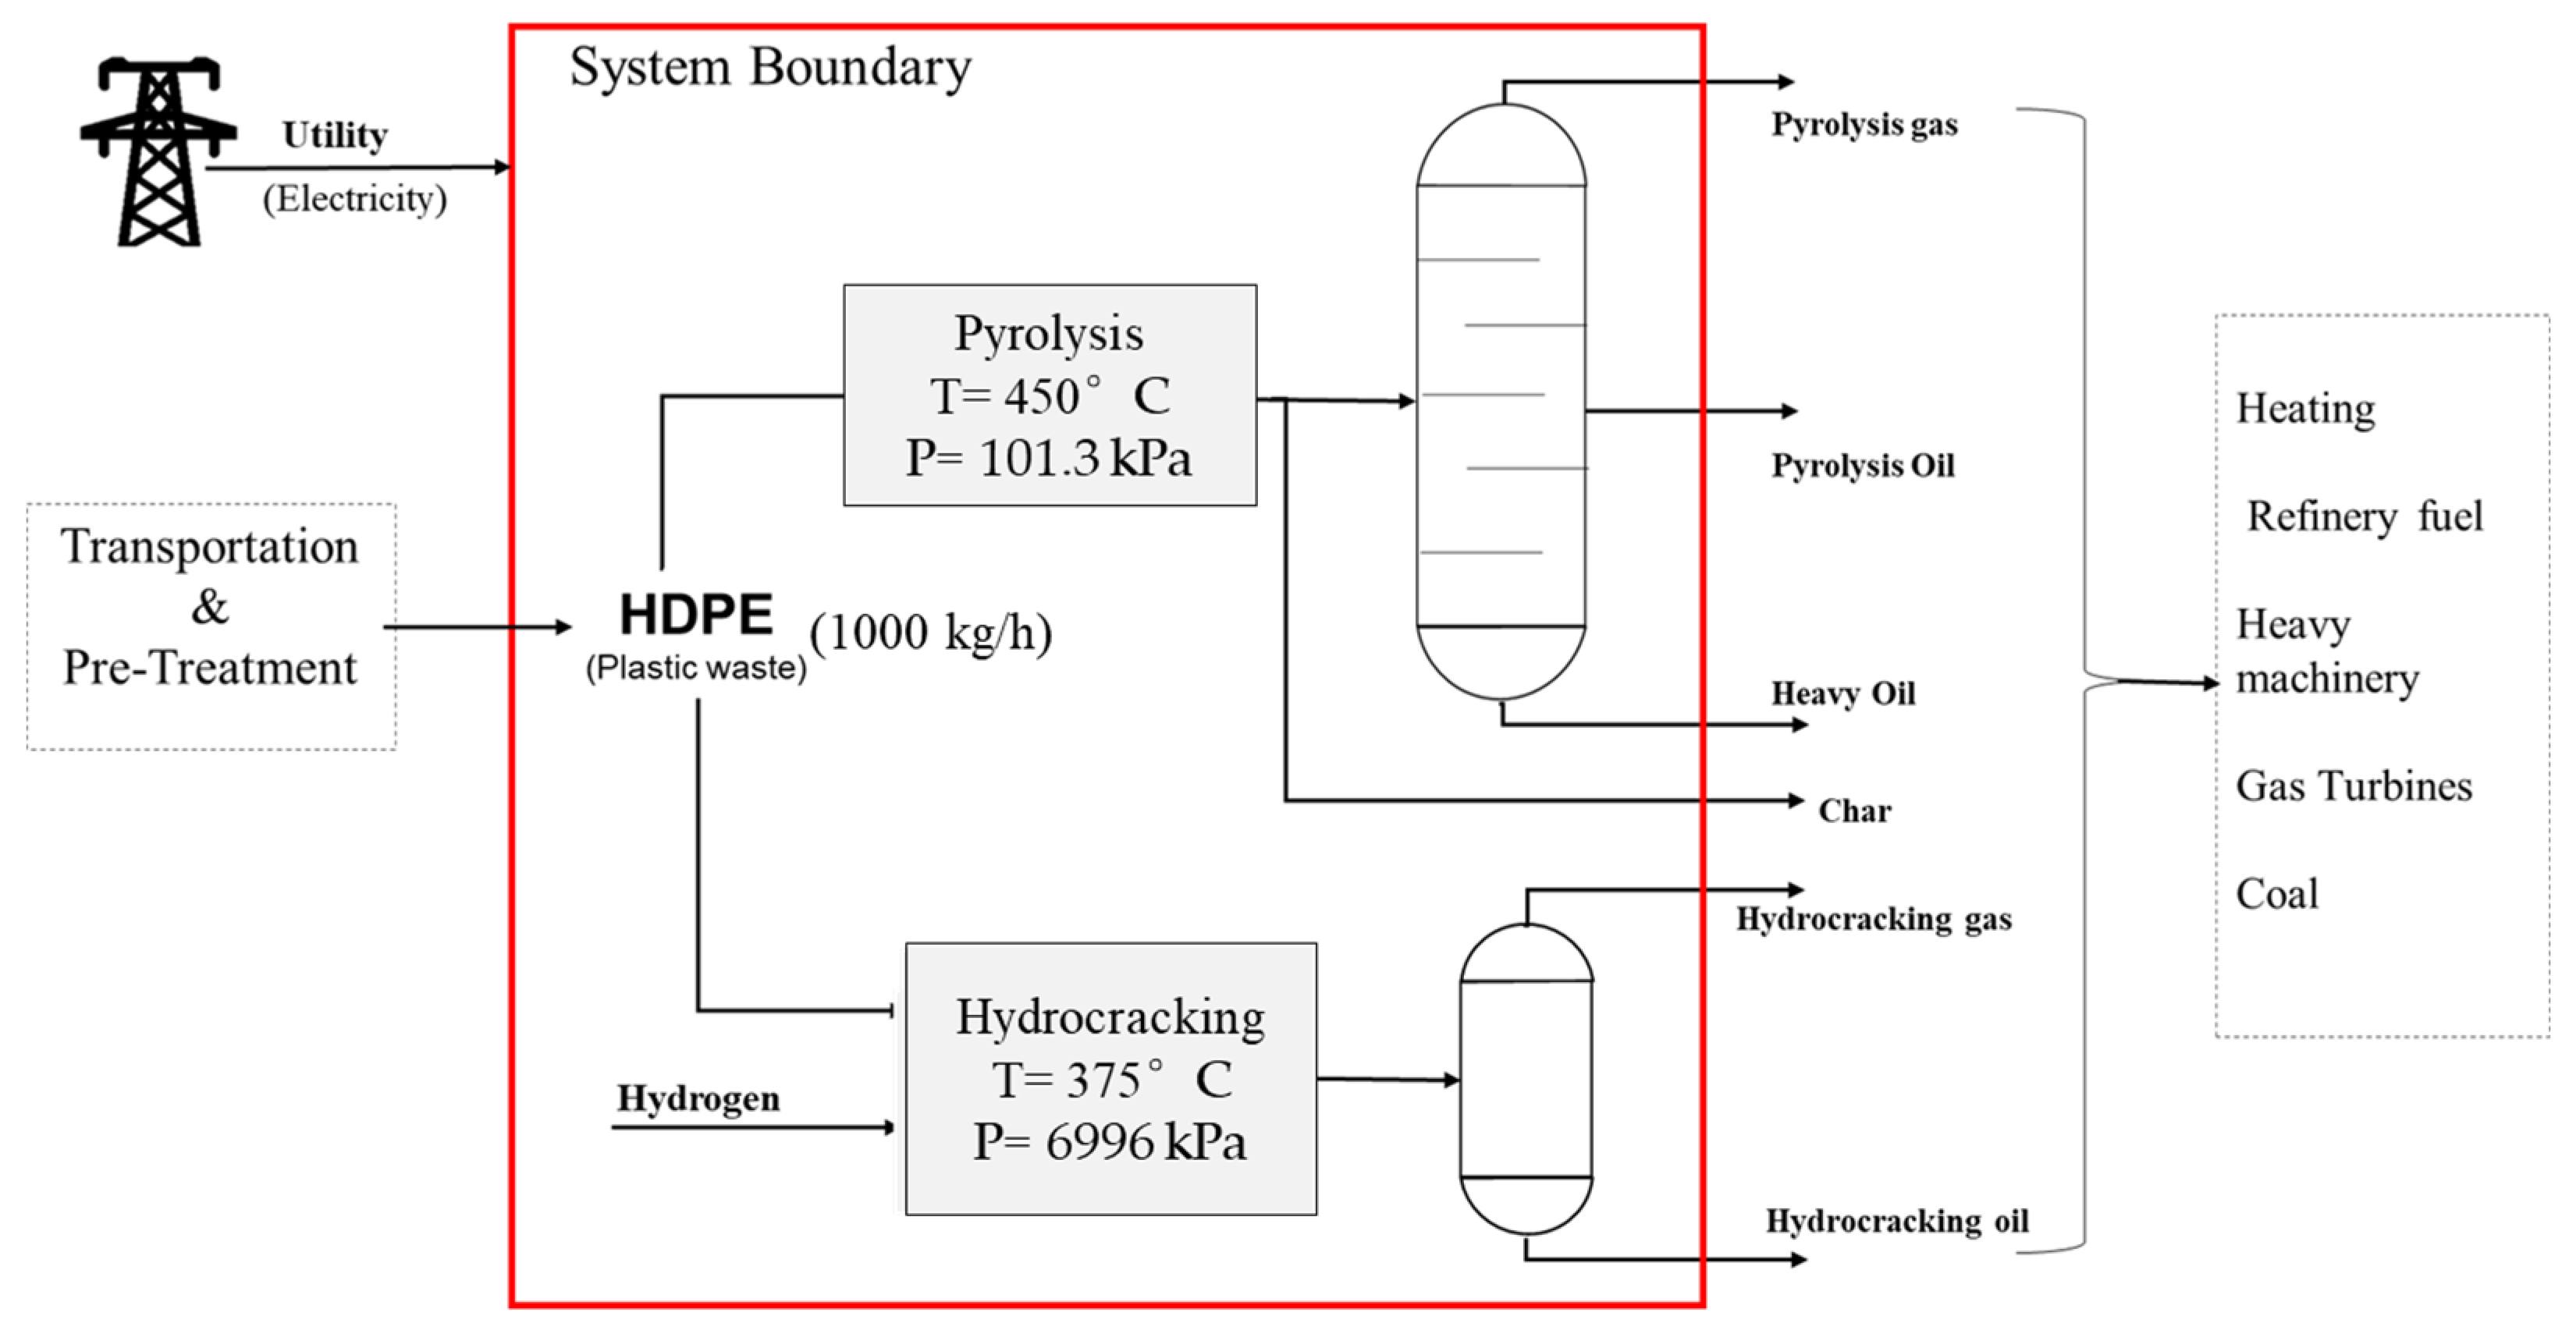
3.1. Comparative Analysis of Pyrolysis and Hydrocracking

| Catalyst | Reactor | F/C * | T (°C) | Gas Mass % | Oils Mass % | Residue Mass % | Comments | Ref |
|---|---|---|---|---|---|---|---|---|
| Spent FCC | Semi-batch | 10:1 | 400 | 16 | 82 | 2 | Spent FCC catalyst as supplied by SK Co. Ltd was utilized for the pyrolysis of HDPE at 400 °C. The results showed around 80% of olefins in the oily products due to the catalytic degradation. However, these olefinic intermediates were unchangeable to paraffins by the hydrogenation reaction. | [46] |
| FCC ** | Semi-batch | 5:1 | 420 | 6.7 | 89.1 | 4.2 | HDPE degradation experiment was performed in a 1 L reactor at different reaction temperatures using FCC as a catalyst. The optimized reaction temperature with minimal coke formation was 420 °C. At this temperature, 73% of the liquids showed olefinic composition with a maximum composition of C5–C9 products. | [47] |
| 450 | 4.7 | 91.2 | 4.7 | |||||
| 480 | 8.8 | 85.3 | 5.9 | |||||
| 510 | 12.9 | 79.5 | 7.6 | |||||
| Thermal/No catalyst | Batch | - | 450 | 5.8 | 74.5 | 19.7 | The pyrolysis of HDPE was studied at 450 °C using a range of catalysts. As compared to thermal run, all the catalyst showed significant decomposition. Also, the addition of catalyst narrower to the carbon number distribution of liquids along with an increase in yield of gasoline and kerosene-range products. The effect of catalysts followed the decreasing trend of ZSM-5 > FCC > NCM. | [48] |
| NCM *** | 33:1 | 6.3 | 78.5 | 15.2 | ||||
| FCC | 6.3 | 82.5 | 11.2 | |||||
| ZSM-5 | 15.1 | 81 | 3.9 | |||||
| Thermal/No catalyst | Mini bench top reactor | - | 500 | 7 | 93 | 0 | 100% cracking of HDPE was thermally conducted at 500 °C for 1 h. Gaseous products mainly contained methane, ethane, propane, and butane. Similarly, oils showed maximum selectivity towards aromatics. | [59] |
| Thermal/No catalyst | Batch | - | 440 | 17 | 74 | 9 | Thermal pyrolysis of grocery bags followed by fractional distillation was conducted in order to produce diesel-range fuels with a maximum selectivity of aliphatic paraffinic hydrogens and a small amount of aliphatic olefinic hydrogens and aromatic hydrogens. | [60] |
| HZSM-5 | Conical spouted bed | 30:1 | 500 | 58 | 41.93 | 0.06 | Catalytic pyrolysis of HDPE was conducted using zeolite-based catalysts at 500 °C. HZSM-5 produced a large quantity of light olefins because of the small pore size of the material, whereas Hβ showed a maximum yield due to its larger pore size as compared to HY and HZSM-5. | [44] |
| HY | 20 | 79.8 | 0.2 | |||||
| Hβ | 25 | 74.8 | 0.2 | |||||
| Hβ | Batch Reactor | 100:1 | 380 | 9.28 | 45.1 | 45.7 | Hierarchical Hβ was prepared and utilized for the cracking of HDPE at mild conditions. Compared to the commercial Hβ, hierarchical Hβ showed better conversion with a maximum productivity of gasoline in olefins-range fuels. | [45] |
| Hβ (CTAB) | 17.02 | 50.27 | 32.7 | |||||
| Hβ (PHAPTMS) | 15.13 | 81.86 | 3 | |||||
| Al-MCM-41 | - | - | >95 | |||||
| Thermal/No catalyst | Fluidized Bed | - | 650 | 31.5 | 68.5 | - | The pyrolysis of HDPE was investigated, and the impact of temperature and residence time on the product distribution was examined. An elevation in the reaction temperature significantly shifted the oils to gaseous products. Similarly, an increase in residence time had an influence on the gas composition, and it became more significant as the reaction temperature increased. | [49] |
| 650 | 22.1 | 72.3 | - | |||||
| 780 | 78.8 | 15.3 | - | |||||
| 780 | 85.6 | 9.6 | - | |||||
| 850 | 75.1 | 11.4 | - | |||||
| 850 | 64.5 | 12.2 | - |
| Process/Catalyst | T (°C) | t (min) | PH2 ¤ (MPa) | F/C ** | Gas Mass % | Oils Mass % | Liquids Mass % | Conversion Mass % | Summary | Ref |
|---|---|---|---|---|---|---|---|---|---|---|
| No catalyst/Thermal | 375 | 60 | 7 | - | 0.17 | 2.22 | - | 2.39 | Addition of bifunctional catalysts significantly increased the conversion of HDPE cracking. Similarly, Ni/HSiAl showed the maximum conversion due to its metal sulfide–acid balance. An increase in catalyst loading showed enhanced conversion with a notable increase in gas yields. In terms of product distribution, both KC-2600 and Ni/HSiAl produced better-quality liquids with more iso-paraffins and less aromatics. | [37] |
| KC-2600 * | 375 | 60 | 7 | 1.5:1 | 57.2 | 32.8 | 90 | |||
| HSiAl | 375 | 60 | 7 | 1.5:1 | - | - | - | 66 | ||
| Ni/HSiAl | 375 | 60 | 7 | 1.5:1 | 57.6 | 42 | 99.6 | |||
| NiMo/HSiAl | 375 | 60 | 7 | 1.5:1 | 54.1 | 45.2 | 99.3 | |||
| KC-2600 | 375 | 60 | 7 | 4:1 | 24.4 | 40.1 | 64.5 | |||
| Ni/HSiAl | 375 | 60 | 7 | 4:1 | 38.9 | 42.8 | 81.7 | |||
| NiMo/HSiAl | 375 | 60 | 7 | 4:1 | 22.7 | 42.6 | 65.3 | |||
| No catalyst/Thermal | 400 | 60 | 5 | - | 12.9 | - | 86.6 | 100 | At lower temperature, HDPE was converted to waxy compounds. An increase in temperature significantly enhanced the gas yield with a decrease in the liquid products. Temperature was maintained at 425 °C and considered as the optimal temperature for the hydro-liquefication of HDPE. The naphtha obtained over HYDROBON showed a low olefin content, whereas DHC-8 has a high olefin content and should be hydrogenated before use. | [62] |
| No catalyst/Thermal | 425 | 60 | 5 | - | 17.0 | - | 81.5 | 98.9 | ||
| No catalyst/Thermal | 450 | 60 | 5 | - | 18.4 | - | 77.6 | 96.5 | ||
| DHC-8 *** | 400 | 60 | 5 | 20:1 | 10.3 | - | 85.5 | 96.8 | ||
| HYDROBON | 400 | 60 | 5 | 20:1 | 4 | - | 93.1 | 98.1 | ||
| 50% DHC-8 + 50% HYDROBON | 400 | 60 | 5 | 20:1 | 10.5 | - | 87.0 | 98 | ||
| DHC-8 | 425 | 60 | 5 | 20:1 | 19.0 | - | 79.5 | 97.8 | ||
| HYDROBON | 425 | 60 | 5 | 20:1 | 13.5 | - | 85.8 | 99.9 | ||
| 50% DHC-8 + 50% HYDROBON | 425 | 60 | 5 | 20:1 | 18.9 | - | 80.2 | 99.7 | ||
| DHC-8 | 450 | 60 | 5 | 20:1 | 26.7 | - | 67.1 | 94.8 | ||
| HYDROBON | 450 | 60 | 5 | 20:1 | 20.5 | - | 76.9 | 96.9 | ||
| DHC-32 | 430 | 60 | 8.3 | - | 8.5 | 35.2 | 43.6 | ZSM-5 showed the maximum conversion and productivity of liquids due to high acidic characteristics and the surface area of the catalyst. | [63] | |
| FCC **** | 430 | 60 | 8.3 | - | 7.5 | 37.5 | 45 | |||
| NiMo/γ-Al2O3 | 430 | 60 | 8.3 | - | 9.6 | 40.2 | 50 | |||
| ZSM-5 | 430 | 60 | 8.3 | - | 7.2 | 50.4 | 57.3 | |||
| BC27 | 400 | 60 | 2 | 20:1 | 32 | 68 | 98 | Both mesoporous BC27 and BC48 catalysts showed a maximum conversion of 98% with a liquid yield above 68 wt.%. In terms of product distribution, both catalysts exhibited a maximum selectivity towards gasoline-range fuels. This was because of the high external SA of the synthesized catalysts. | [64] | |
| BC48 | 400 | 60 | 2 | 20:1 | 38 | 68 | 98 | |||
| Low Alumina FCC (with solvent) | 440 | 30 | 5.6 | 4:1 | 6.2 | 74.1 | 80.3 | The addition of solvent significantly affected the cracking of HDPE with both FCC and zeolite-based catalysts. An increase in the reaction temperature to 440 °C notably promoted the overall conversion. However, product distribution followed the gaseous-range fuels. | [61] | |
| Low Alumina FCC (without solvent) | 440 | 30 | 5.6 | 4:1 | 11.1 | 82.2 | 93.3 | |||
| HZSM-5 (with solvent) | 400 | 30 | 5.6 | 4:1 | 18.3 | 17.9 | 36.1 | |||
| HZSM-5 (with solvent) | 440 | 30 | 5.6 | 4:1 | 61.5 | 37.9 | 99.4 | |||
| No catalyst/Thermal | 500 | 60 | 1 | 5 | 95.0 | 100 | A 100% hydro-liquification of HDPE was achieved at 500 °C with an enhanced productivity of oily products with a significant amount of double-ring aromatics. | [52] |
3.2. Process Simulation
3.2.1. Pyrolysis
3.2.2. Hydrocracking
3.3. Life Cycle Assessment
3.3.1. Goal and Scope
3.3.2. Life Cycle Inventory
4. Conclusions
Author Contributions
Funding
Institutional Review Board Statement
Informed Consent Statement
Data Availability Statement
Conflicts of Interest
Abbreviation
| USD | United states dollar |
| MT | million metric ton |
| HDPE | High density polyethylene |
| EOL | End of life |
| CV | Calorific value |
| PET | polyethylene terephthalate |
| LDPE | low density polyethylene |
| PVC | Poly vinyl chloride |
| PP | Polypropylene |
| PS | Polystyrene |
| LCA | Life cycle assessment |
| UK | United Kingdom |
| ISO | International Organization for Standardization |
| AD | Abiotic depletion |
| FF | Fossil Fuels |
| GWP | Global warming potential |
| ODP | Ozone layer depletion |
| AP | Avoided Products |
| FAETP | Fresh water ecotoxicity |
| MAETP | Marine aquatic ecotoxicity |
| TAETP | Terrestrial ecotoxicity |
| VOC | volatile organic compounds |
| EOS | equation of state |
| PR | Peng-Robinson |
References
- Geyer, R.; Jambeck, J.R.; Law, K.L. Production, use, and fate of all plastics ever made. Sci. Adv. 2017, 3, 1700782. [Google Scholar] [CrossRef] [PubMed] [Green Version]
- Plastics—The Facts 2021. Available online: https://plasticseurope.org/knowledge-hub/plastics-the-facts-2021/ (accessed on 9 October 2022).
- Saleh, Y. Comparative life cycle assessment of beverages packages in Palestine. J. Clean. Prod. 2016, 131, 28–42. [Google Scholar] [CrossRef]
- Solis, M. Potential of Chemical Recycling to Improve the Recycling of Plastic Waste. Master’s Thesis, School of Industrial Engineering and Management (ITM), Energy Technology, Energy and Climate Studies, ECS, Stockholm, Sweden, 2018. [Google Scholar]
- Dogu, O.; Pelucchi, M.; Van de Vijver, R.; Van Steenberge, P.H.; D’hooge, D.R.; Cuoci, A.; Van Geem, K.M. The chemistry of chemical recycling of solid plastic waste via pyrolysis and gasification: State-of-the-art, challenges, and future directions. PECS 2018, 84, 100901. [Google Scholar] [CrossRef]
- Plastic Pollution—Our World in Data. Available online: https://ourworldindata.org/plastic-pollution (accessed on 23 June 2021).
- Ronkay, F.; Molnar, B.; Gere, D.; Czigany, T. Plastic waste from marine environment: Demonstration of possible routes for recycling by different manufacturing technologies. J. Waste Manag. 2021, 119, 101–110. [Google Scholar] [CrossRef]
- Lebreton, L.; Van Der Zwet, J.; Damsteeg, J.W.; Slat, B.; Andrady, A.; Reisser, J. River plastic emissions to the world’s oceans. Nat. Commun. 2017, 8, 1–10. [Google Scholar] [CrossRef] [Green Version]
- Beaumont, N.J.; Aanesen, M.; Austen, M.C.; Börger, T.; Clark, J.R.; Cole, M.; Wyles, K.J. Global ecological, social and economic impacts of marine plastic. Mar. Pollut. Bull. 2019, 142, 189–195. [Google Scholar] [CrossRef]
- Global Plastic Production Rises, Recycling Lags. Available online: https://www.environmentalleader.com/2015/01/plastic-production-rises-recycling-lags/ (accessed on 9 October 2022).
- Panda, A.K.; Singh, R.K.; Mishra, D.K. Thermolysis of waste plastics to liquid fuel: A suitable method for plastic waste management and manufacture of value added products—A world prospective. Renew. Sustain. Energy Rev. 2010, 14, 233–248. [Google Scholar] [CrossRef]
- Otoma, S.; Mori, Y.; Terazono, A.; Aso, T.; Sameshima, R. Estimation of energy recovery and reduction of CO2 emissions in municipal solid waste power generation. Resour. Conserv. Recycl. 1997, 20, 95–117. [Google Scholar] [CrossRef]
- Hou, P.; Xu, Y.; Taiebat, M.; Lastoskie, C.; Miller, S.A.; Xu, M. Life cycle assessment of end-of-life treatments for plastic film waste. J. Clean. Prod. 2018, 201, 1052–1060. [Google Scholar] [CrossRef]
- Khoo, H.H. LCA of plastic waste recovery into recycled materials, energy and fuels in Singapore. Resour. Conserv. Recycl. 2019, 145, 67–77. [Google Scholar] [CrossRef]
- Vollmer, I.; Jenks, M.J.; Roelands, M.C.; White, R.J.; van Harmelen, T.; de Wild, P.; Weckhuysen, B.M. Beyond mechanical recycling: Giving new life to plastic waste. Angew. Chem. Int. Ed. 2020, 59, 15402–15423. [Google Scholar] [CrossRef] [PubMed] [Green Version]
- Munir, D.; Irfan, M.F.; Usman, M.R. Hydrocracking of virgin and waste plastics: A detailed review. Renew. Sustain. Energy Rev. 2018, 90, 490–515. [Google Scholar] [CrossRef]
- 100+ Plastic in the Ocean Statistics & Facts. Available online: https://www.condorferries.co.uk/plastic-in-the-ocean-statistics (accessed on 9 October 2021).
- Martínez, L.; Aguado, A.; Moral, A.; Irusta, R. Fluidized bed pyrolysis of HDPE: A study of the influence of operating variables and the main fluidynamic parameters on the composition and production of gases. FPT 2011, 92, 221–228. [Google Scholar] [CrossRef]
- Merrild, H.; Larsen, A.W.; Christensen, T.H. Assessing recycling versus incineration of key materials in municipal waste: The importance of efficient energy recovery and transport distances. J. Waste Manag. 2012, 32, 1009–1018. [Google Scholar] [CrossRef]
- Gamble, A. Ullmann’s encyclopedia of industrial chemistry. Charlest. Advis. 2019, 20, 46–50. [Google Scholar] [CrossRef]
- Zannikos, F.; Kalligeros, S.; Anastopoulos, G.; Lois, E. Converting biomass and waste plastic to solid fuel briquettes. J. Renew. Energy 2013, 2013, 360368. [Google Scholar] [CrossRef] [Green Version]
- Ahmad, I.; Khan, M.I.; Ishaq, M.; Khan, H.; Gul, K.; Ahmad, W. Catalytic efficiency of some novel nanostructured heterogeneous solid catalysts in pyrolysis of HDPE. Polym. Degrad. Stab. 2013, 98, 2512–2519. [Google Scholar] [CrossRef]
- Park, S.S.; Seo, D.K.; Lee, S.H.; Yu, T.U.; Hwang, J. Study on pyrolysis characteristics of refuse plastic fuel using lab-scale tube furnace and thermogravimetric analysis reactor. JAAP 2012, 97, 29–38. [Google Scholar] [CrossRef]
- Heikkinen, J.M.; Hordijk, J.D.; de Jong, W.; Spliethoff, H. Thermogravimetry as a tool to classify waste components to be used for energy generation. JAAP 2004, 71, 883–900. [Google Scholar] [CrossRef]
- Jung, S.H.; Cho, M.H.; Kang, B.S.; Kim, J.S. Pyrolysis of a fraction of waste polypropylene and polyethylene for the recovery of BTX aromatics using a fluidized bed reactor. FPT 2010, 91, 277–284. [Google Scholar] [CrossRef]
- Abnisa, F.; Daud, W.W.; Sahu, J.N. Pyrolysis of mixtures of palm shell and polystyrene: An optional method to produce a high-grade of pyrolysis oil. Environ. Prog. Sustain. 2014, 33, 1026–1033. [Google Scholar] [CrossRef]
- Fivga, A.; Dimitriou, I. Pyrolysis of plastic waste for production of heavy fuel substitute: A techno-economic assessment. Energy 2018, 149, 865–874. [Google Scholar] [CrossRef]
- Almohamadi, H.; Alamoudi, M.; Ahmed, U.; Shamsuddin, R.; Smith, K. Producing hydrocarbon fuel from the plastic waste: Techno-economic analysis. Korean J. Chem. Eng. 2021, 38, 2208–2216. [Google Scholar] [CrossRef]
- Selvaganapathy, T.; Muthuvelayudham, R.; Kumar, M.J. Simulation of waste plastic pyrolysis process using aspen hysys V9 simulator under steady state operating condition. Emerg. Trends Eng. Res. Technol. 2020, 2, 108–118. [Google Scholar]
- Costa, C.S.; Muñoz, M.; Ribeiro, M.R.; Silva, J.M. H-USY and H-ZSM-5 zeolites as catalysts for HDPE conversion under a hydrogen reductive atmosphere. Sustain. Energy Fuels 2021, 5, 1134–1147. [Google Scholar] [CrossRef]
- Muñoz, M.; Morales, I.; Costa, C.S.; Multigner, M.; De La Presa, P.; Alonso, J.M.; Rams, J. Local Induction Heating Capabilities of Zeolites Charged with Metal and Oxide MNPs for Application in HDPE Hydrocracking: A Proof of Concept. Materials 2021, 14, 1029. [Google Scholar] [CrossRef]
- Pyra, K.; Tarach, K.A.; Śrębowata, A.; Melián-Cabrera, I.; Góra-Marek, K. Pd-modified beta zeolite for modulated hydro-cracking of low-density polyethylene into a paraffinic-rich hydrocarbon fuel. Appl. Catal. B 2020, 277, 119070. [Google Scholar] [CrossRef]
- Utami, M.; Wijaya, K.; Trisunaryanti, W. Pt-promoted sulfated zirconia as catalyst for hydrocracking of LDPE plastic waste into liquid fuels. Mater. Chem. Phys. 2018, 213, 548–555. [Google Scholar] [CrossRef]
- Wijaya, K.; Kurniawan, M.A.; Saputri, W.D.; Trisunaryanti, W.; Mirzan, M.; Hariani, P.L.; Tikoalu, A.D. Synthesis of nickel catalyst supported on ZrO2/SO4 pillared bentonite and its application for conversion of coconut oil into gasoline via hydrocracking process. J. Environ. Chem. Eng. 2021, 9, 105399. [Google Scholar] [CrossRef]
- Uemichi, Y.; Hattori, M.; Itoh, T.; Nakamura, J.; Sugioka, M. Deactivation behaviors of zeolite and silica− alumina catalysts in the degradation of polyethylene. Ind. Eng. Chem. Res. 1998, 37, 867–872. [Google Scholar] [CrossRef]
- Venkatesh, K.R.; Hu, J.; Tierney, J.W.; Wender, I. Hydrocracking of polyolefins to liquid fuels over strong solid acid catalysts. 1995. Available online: https://www.osti.gov/biblio/462530 (accessed on 9 October 2022).
- Ding, W.; Liang, J.; Anderson, L.L. Hydrocracking and hydroisomerization of high-density polyethylene and waste plastic over zeolite and silica-alumina-supported Ni and Ni−Mo sulfides. Energy Fuels 1997, 11, 1219–1224. [Google Scholar] [CrossRef]
- LCIA Methods Impact Assessment Methods in Life Cycle Assessment and Their Impact Categories. Available online: https://www.openlca.org/wp-content/uploads/2015/11/LCIA-METHODS-v.1.5.4.pdf (accessed on 9 October 2022).
- Life Cycle Assessment of Chemical Recycling for Food Grade Film. Available online: https://www.theconsumergoodsforum.com/wp-content/uploads/2022/04/Life-Cycle-Assessment-of-Chemical-Recycling-for-Food-Grade-Film.pdf (accessed on 9 October 2022).
- AR5 Climate Change 2013: The Physical Science Basis—IPCC. Available online: https://www.ipcc.ch/report/ar5/wg1/ (accessed on 22 August 2022).
- Li, D.; Lei, S.; Wang, P.; Zhong, L.; Ma, W.; Chen, G. Study on the pyrolysis behaviors of mixed waste plastics. Renew. Energy 2021, 173, 662–674. [Google Scholar] [CrossRef]
- González, Y.S.; Costa, C.; Márquez, M.C.; Ramos, P. Thermal and catalytic degradation of polyethylene wastes in the presence of silica gel, 5A molecular sieve and activated carbon. J. Hazard. Mater. 2011, 187, 101–112. [Google Scholar] [CrossRef] [PubMed]
- Harussani, M.M.; Sapuan, S.M.; Rashid, U.; Khalina, A.; Ilyas, R.A. Pyrolysis of polypropylene plastic waste into carbonaceous char: Priority of plastic waste management amidst COVID-19 pandemic. Sci. Total Environ. 2022, 803, 149911. [Google Scholar] [CrossRef] [PubMed]
- Elordi, G.; Olazar, M.; Lopez, G.; Amutio, M.; Artetxe, M.; Aguado, R.; Bilbao, J. Catalytic pyrolysis of HDPE in continuous mode over zeolite catalysts in a conical spouted bed reactor. JAAP 2009, 85, 345–351. [Google Scholar] [CrossRef]
- Caldeira, V.P.; Peral, A.; Linares, M.; Araujo, A.S.; Garcia-Muñoz, R.A.; Serrano, D.P. Properties of hierarchical Beta zeolites prepared from protozeolitic nanounits for the catalytic cracking of high density polyethylene. Appl. Catal. A Gen. 2017, 531, 187–196. [Google Scholar] [CrossRef]
- Lee, K.H.; Noh, N.S.; Shin, D.H.; Seo, Y. Comparison of plastic types for catalytic degradation of waste plastics into liquid product with spent FCC catalyst. Polym. Degrad. Stab. 2002, 78, 539–544. [Google Scholar] [CrossRef]
- Abbas-Abadi, M.S.; Haghighi, M.N.; Yeganeh, H. Evaluation of Pyrolysis Product of Virgin High Density Polyethylene Degradation Using Different Process Parameters in a Stirred Reactor. FPT 2013, 109, 90–95. [Google Scholar] [CrossRef]
- Miskolczi, N.; Bartha, L.; Deák, G.; Jóver, B.; Kalló, D. Thermal and Thermo-Catalytic Degradation of High-Density Polyethylene Waste. J. Anal. Appl. Pyrolysis 2004, 72, 235–242. [Google Scholar] [CrossRef]
- Mastral, F.J.; Esperanza, E.; Garciía, P.; Juste, M. Pyrolysis of High-Density Polyethylene in a Fluidised Bed Reactor. Influence of the Temperature and Residence Time. J. Anal. Appl. Pyrolysis 2002, 63, 1–15. [Google Scholar] [CrossRef]
- Bhutani, N.; Ray, A.K.; Rangaiah, G.P. Modeling, Simulation, and Multi-Objective Optimization of an Industrial Hydrocracking Unit. Ind. Eng. Chem. Res. 2006, 45, 1354–1372. [Google Scholar] [CrossRef]
- Ostroumova, V.A.; Severina, V.A.; Maksimov, A.L. Application of Ni-W Sulfide Catalysts Prepared in Situ from Embryonic and Highly Crystalline ZSM-5 Zeolites in Hydrocracking Reaction of 1-Methylnaphthalene. Pet. Chem. 2021, 61, 341–349. [Google Scholar] [CrossRef]
- Scherzer, J.; Gruia, A.J. Hydrocracking Science and Technology, 1st ed.; CRC Press: Boca Raton, FL, USA; London, UK; New York, NY, USA, 1996. [Google Scholar]
- Brems, A.; Baeyens, J.; Dewil, R. Recycling and Recovery of Post-Consumer Plastic plastic solid waste in a European context. Therm. Sci. 2012, 16, 669–685. [Google Scholar] [CrossRef]
- Liu, S.; Kots, P.A.; Vance, B.C.; Danielson, A.; Vlachos, D.G. Plastic Waste to Fuels by Hydrocracking at Mild Conditions. Sci. Adv. 2021, 7, 8283–8304. [Google Scholar] [CrossRef] [PubMed]
- Vela, F.J.; Palos, R.; Trueba, D.; Bilbao, J.; Arandes, J.M.; Gutiérrez, A. Different Approaches to Convert Waste Polyolefins into Automotive Fuels via Hydrocracking with a NiW/HY Catalyst. FPT 2021, 220, 106891. [Google Scholar] [CrossRef]
- Abdulridha, S.; Zhang, R.; Xu, S.; Tedstone, A.; Ou, X.; Gong, J.; Mao, B.; Frogley, M.; Bawn, C.; Zhou, Z. An Efficient Microwave-Assisted Chelation (MWAC) Post-Synthetic Modification Method to Produce Hierarchical Y Zeolites. Microporous Mesoporous Mater. 2021, 311, 110715. [Google Scholar] [CrossRef]
- Reina, T.R.; Odriozola, J.A. Heterogeneous Catalysis for Energy Applications. In Energy and Environmental Series; Royal Society of Chemistry: London, UK, 2020. [Google Scholar]
- Pan, Z.; Xue, X.; Zhang, C.; Wang, D.; Xie, Y.; Zhang, R. Production of aromatic hydrocarbons by hydro-liquefaction of high-density polyethylene (HDPE) over Ni/HZSM-5. JAAP 2018, 136, 208–214. [Google Scholar] [CrossRef]
- Williams, P.T.; Slaney, E. Analysis of Products from the Pyrolysis and Liquefaction of Single Plastics and Waste Plastic Mixtures. Resour. Conserv. Recycl. 2007, 51, 754–769. [Google Scholar] [CrossRef]
- Sharma, B.K.; Moser, B.R.; Vermillion, K.E.; Doll, K.M.; Rajagopalan, N. Production, Characterization and Fuel Properties of Alternative Diesel Fuel from Pyrolysis of Waste Plastic Grocery Bags. FPT 2014, 122, 79–90. [Google Scholar] [CrossRef]
- Luo, M.; Curtis, C.W. Effect of Reaction Parameters and Catalyst Type on Waste Plastics Liquefaction and Coprocessing with Coal. FPT 1996, 49, 177–196. [Google Scholar] [CrossRef]
- Metecan, I.H.; Ozkan, A.R.; Isler, R.; Yanik, J.; Saglam, M.; Yuksel, M. Naphtha Derived from Polyolefins. Fuel 2005, 84, 619–628. [Google Scholar]
- Ali, M.F.; Nahid, M.; Redhwi, S.S.H.H. Study on the Conversion of Waste Plastics/Petroleum Resid Mixtures to Transportation Fuels. J. Mater. Cycles Waste Manag. 2004, 6, 27–34. [Google Scholar]
- Munir, D.; Amer, H.; Aslam, R.; Bououdina, M.; Usman, M.R. Composite Zeolite Beta Catalysts for Catalytic Hydrocracking of Plastic Waste to Liquid Fuels. Mater. Renew. Sustain. Energy 2020, 9, 1–13. [Google Scholar] [CrossRef]
- Adeniyi, A.G.; Eletta, O.A.A.; Ighalo, J.O. Computer Aided Modelling of Low Density Polyethylene Pyrolysis to Produce Synthetic Fuels. Niger. J. Technol. 2018, 37, 945–949. [Google Scholar] [CrossRef]
- ISO 14040:2006; Environmental Management Life Cycle Assessment—Principles and Framework. ISO: Geneva, Switzerland, 2006. Available online: https://www.iso.org/standard/37456.html (accessed on 22 August 2022).
- ISO 14044:2006/Amd 2:2020; Environmental Management—Life Cycle Assessment—Requirements and Guidelines—Amendment 2. ISO: Geneva, Switzerland, 2006. Available online: https://www.iso.org/standard/76122.html (accessed on 22 August 2022).
- Ekvall, T.; Assefa, G.; Björklund, A.; Eriksson, O.; Finnveden, G. What Life-Cycle Assessment Does and Does Not Do in Assessments of Waste Management. Waste Manag. 2007, 27, 989–996. [Google Scholar] [CrossRef] [PubMed]
- Czajczyńska, D.; Anguilano, L.; Ghazal, H.; Krzyżyńska, R.; Reynolds, A.J.; Spencer, N.; Jouhara, H. Potential of Pyrolysis Processes in the Waste Management Sector. Therm. Sci. Eng. Prog. 2017, 3, 171–197. [Google Scholar] [CrossRef]


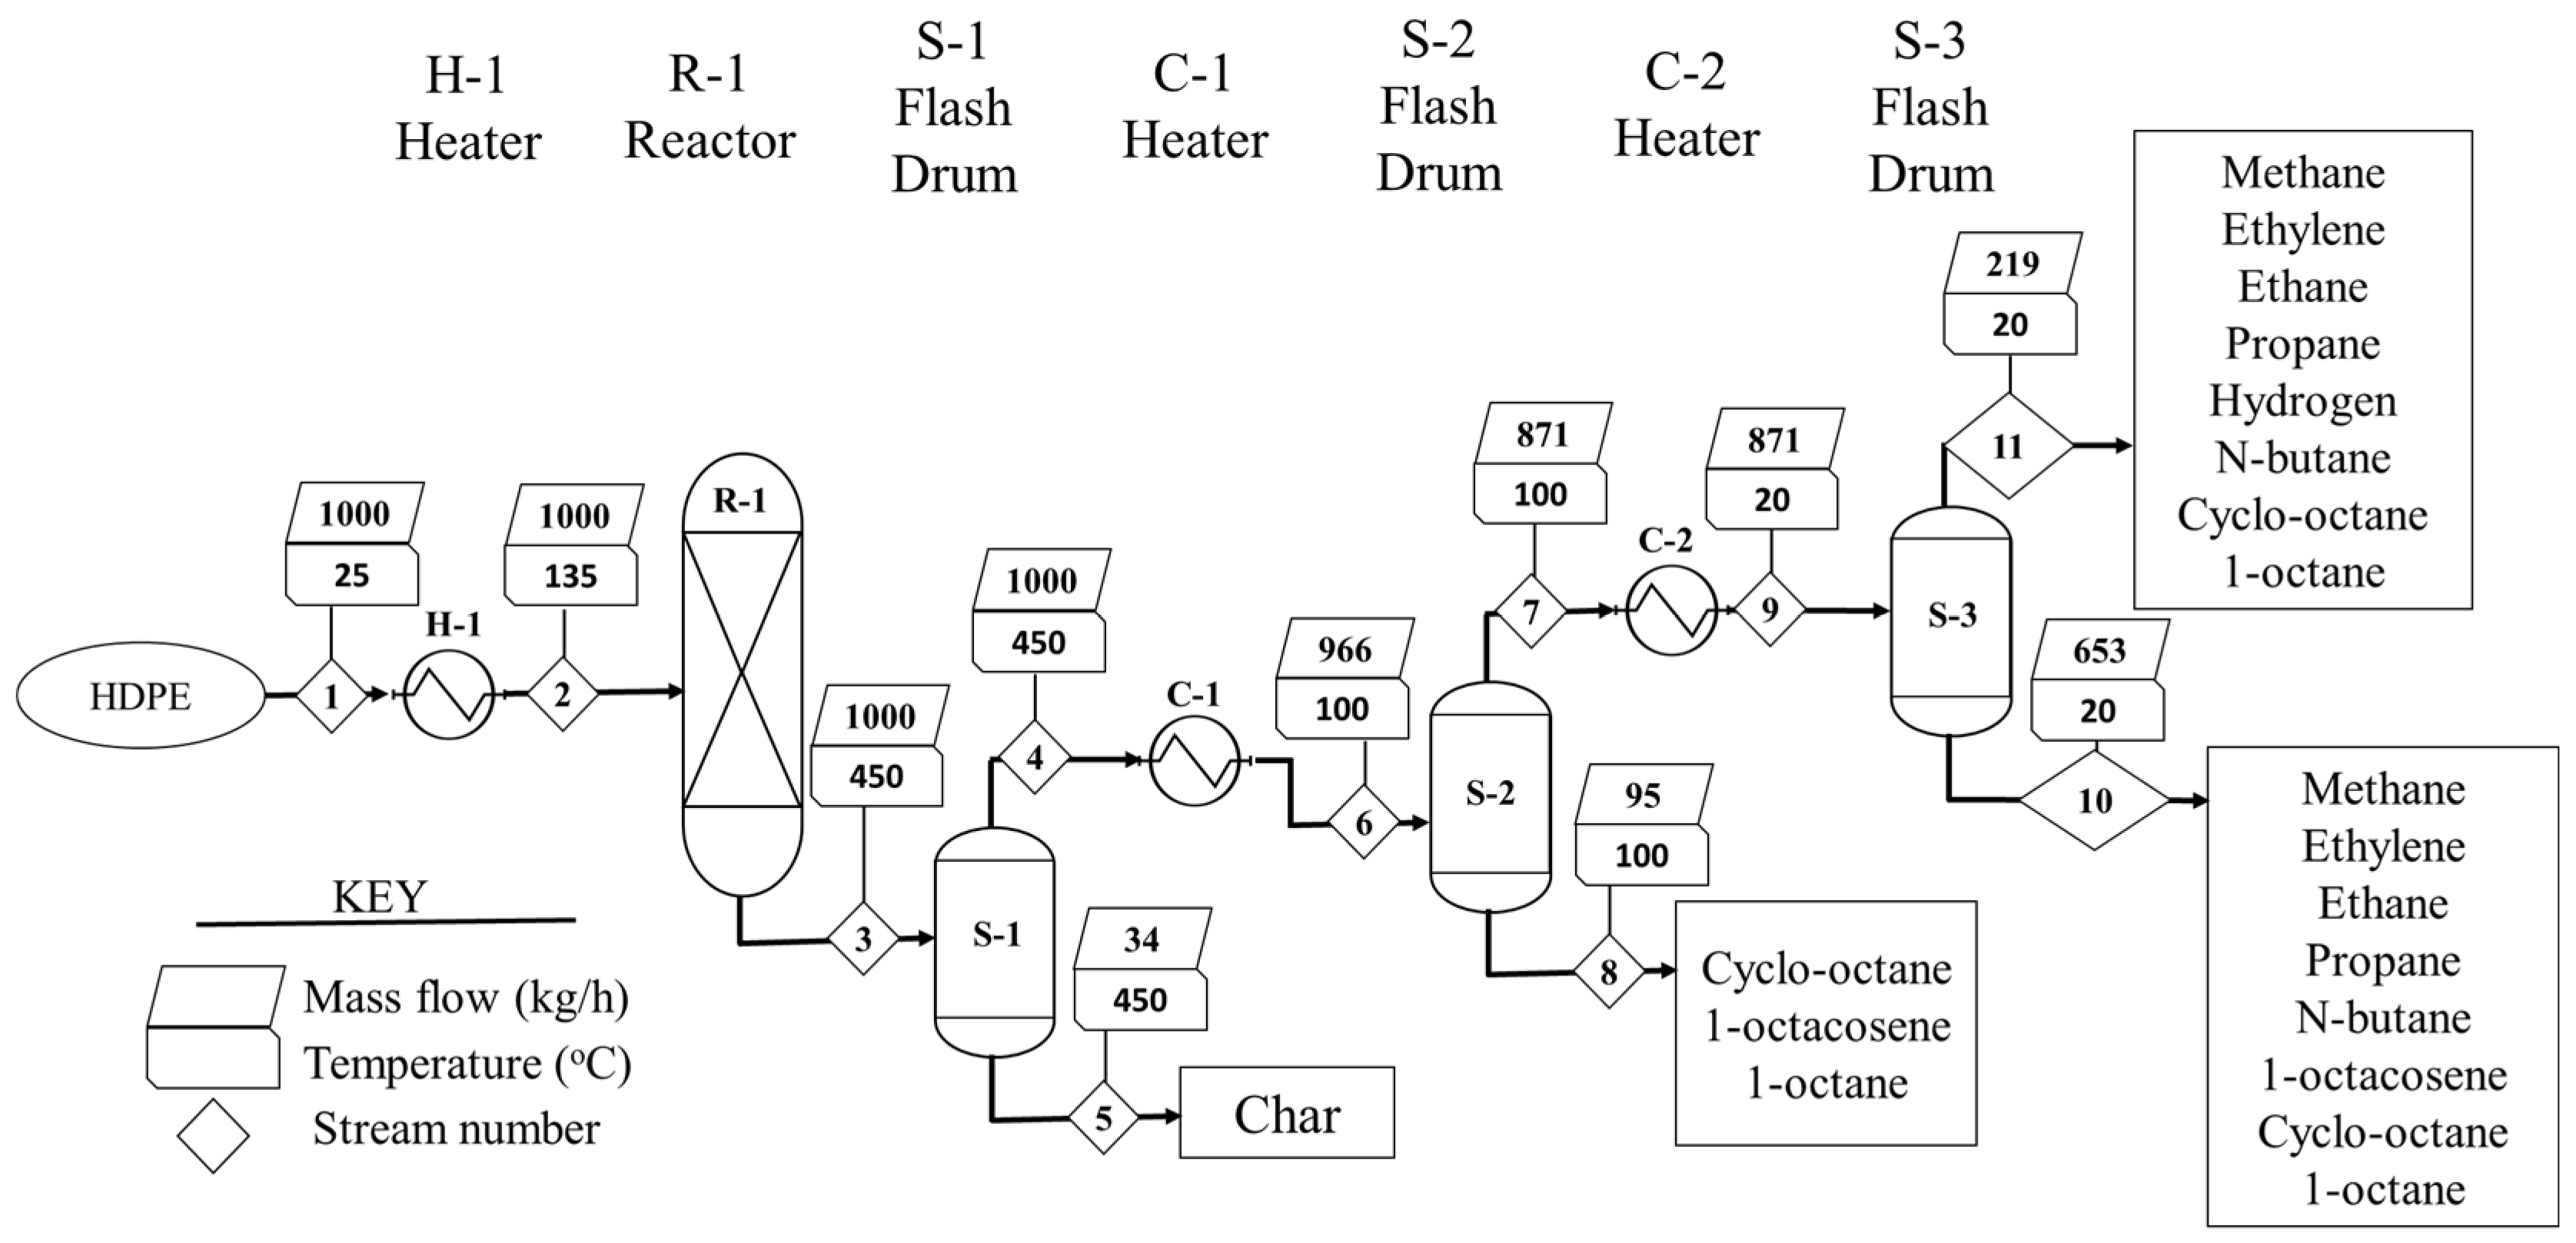
| Stream | Units | 1 | 2 | 3 | 4 | 5 | 6 | 7 | 8 | 9 | 10 | 11 |
|---|---|---|---|---|---|---|---|---|---|---|---|---|
| From | ° | HDPE | H-1 | R-1 | S-1 | S-1 | C-1 | S-2 | S-2 | C-2 | S-3 | S-3 |
| To | H-1 | R-1 | S-1 | C-1 | Bottom | S-2 | C-2 | Bottom | S-3 | Bottom | Top | |
| T | °C | 25 | 135 | 450 | 450 | 450 | 100 | 100 | 100 | 20 | 20 | 20 |
| P | kPa | 101.3 | 101.3 | 101.3 | 101.3 | 101.3 | 101.3 | 101.3 | 101.3 | 101.3 | 101.3 | 101.3 |
| Mass Flow | kg/h | 1000 | 1000 | 1000 | 966.22 | 33.77 | 966.22 | 871.26 | 94.97 | 871.26 | 652.54 | 218.71 |
| Mass flow of HDPE | kg/h | 1000 | 1000 | 0 | 0 | 0 | 0 | 0 | 0 | 0 | 0 | 0 |
| Methane | kg/h | 0 | 0 | 43.4 | 43.4 | 0 | 43.4 | 43.4 | 0 | 43.4 | 0.03 | 43.37 |
| Ethylene | kg/h | 0 | 0 | 6.68 | 6.68 | 0 | 6.68 | 6.68 | 0 | 6.68 | 0.02 | 6.66 |
| Ethane | kg/h | 0 | 0 | 22.7 | 22.7 | 0 | 22.7 | 22.7 | 0 | 22.7 | 0.09 | 22.61 |
| Propane | kg/h | 0 | 0 | 0.8 | 0.8 | 0 | 0.8 | 0.8 | 0 | 0.8 | 0.01 | 0.79 |
| Hydrogen | kg/h | 0 | 0 | 86.8 | 86.8 | 0 | 86.8 | 86.8 | 0 | 86.8 | 0 | 86.8 |
| n-butane | Kg/h | 0 | 0 | 0.42 | 0.42 | 0 | 0.42 | 0.42 | 0 | 0.42 | 0.02 | 0.4 |
| Cyclooctane | kg/h | 0 | 0 | 401.93 | 401.93 | 0 | 401.93 | 396 | 5.93 | 396 | 373.7 | 22.3 |
| 1-octacosene | kg/h | 0 | 0 | 85.5 | 85.5 | 0 | 85.5 | 0.01 | 85.5 | 0.01 | 0 | 0 |
| Char | kg/h | 0 | 0 | 33.78 | 0 | 33.77 | 0 | 0 | 0 | 0 | 0.01 | 0 |
| 1-octane | kg/h | 0 | 0 | 317.99 | 317.99 | 0 | 317.99 | 314.45 | 3.54 | 314.45 | 278.66 | 35.79 |
| LHV | MJ/kg | - | - | 50.55 | 51.17 | 32.79 | 51.17 | 52.04 | 43.15 | 52.04 | 44.06 | 75.86 |
| H | kW | −1463.7 | - | - | - | −274.84 | - | - | −37.56 | - | −323.66 | −92.26 |
| Equipment | Utility | Value | Heat Duty (kW) |
|---|---|---|---|
| H-1 (Preheater) | Medium Pressure steam (Inlet Temp: 175 °C, Outlet temp: 174 °C) | 186.24 kg/h | 105.27 |
| R-1 (Reactor) | Electricity (US-EPA-Rule-E9-5711) | 1096.68 kW | 1096.68 |
| C-1 (Cooler-1) | Cooling water (Inlet Temp: 20 °C, Outlet temp: 25 °C) | 60,476.5 kg/h | −351.08 |
| C-2 (Cooler-2) | Refrigerant 1 (Inlet Temp: −25 °C, Outlet temp: −24 °C) | 109,325 kg/h | −121.47 |
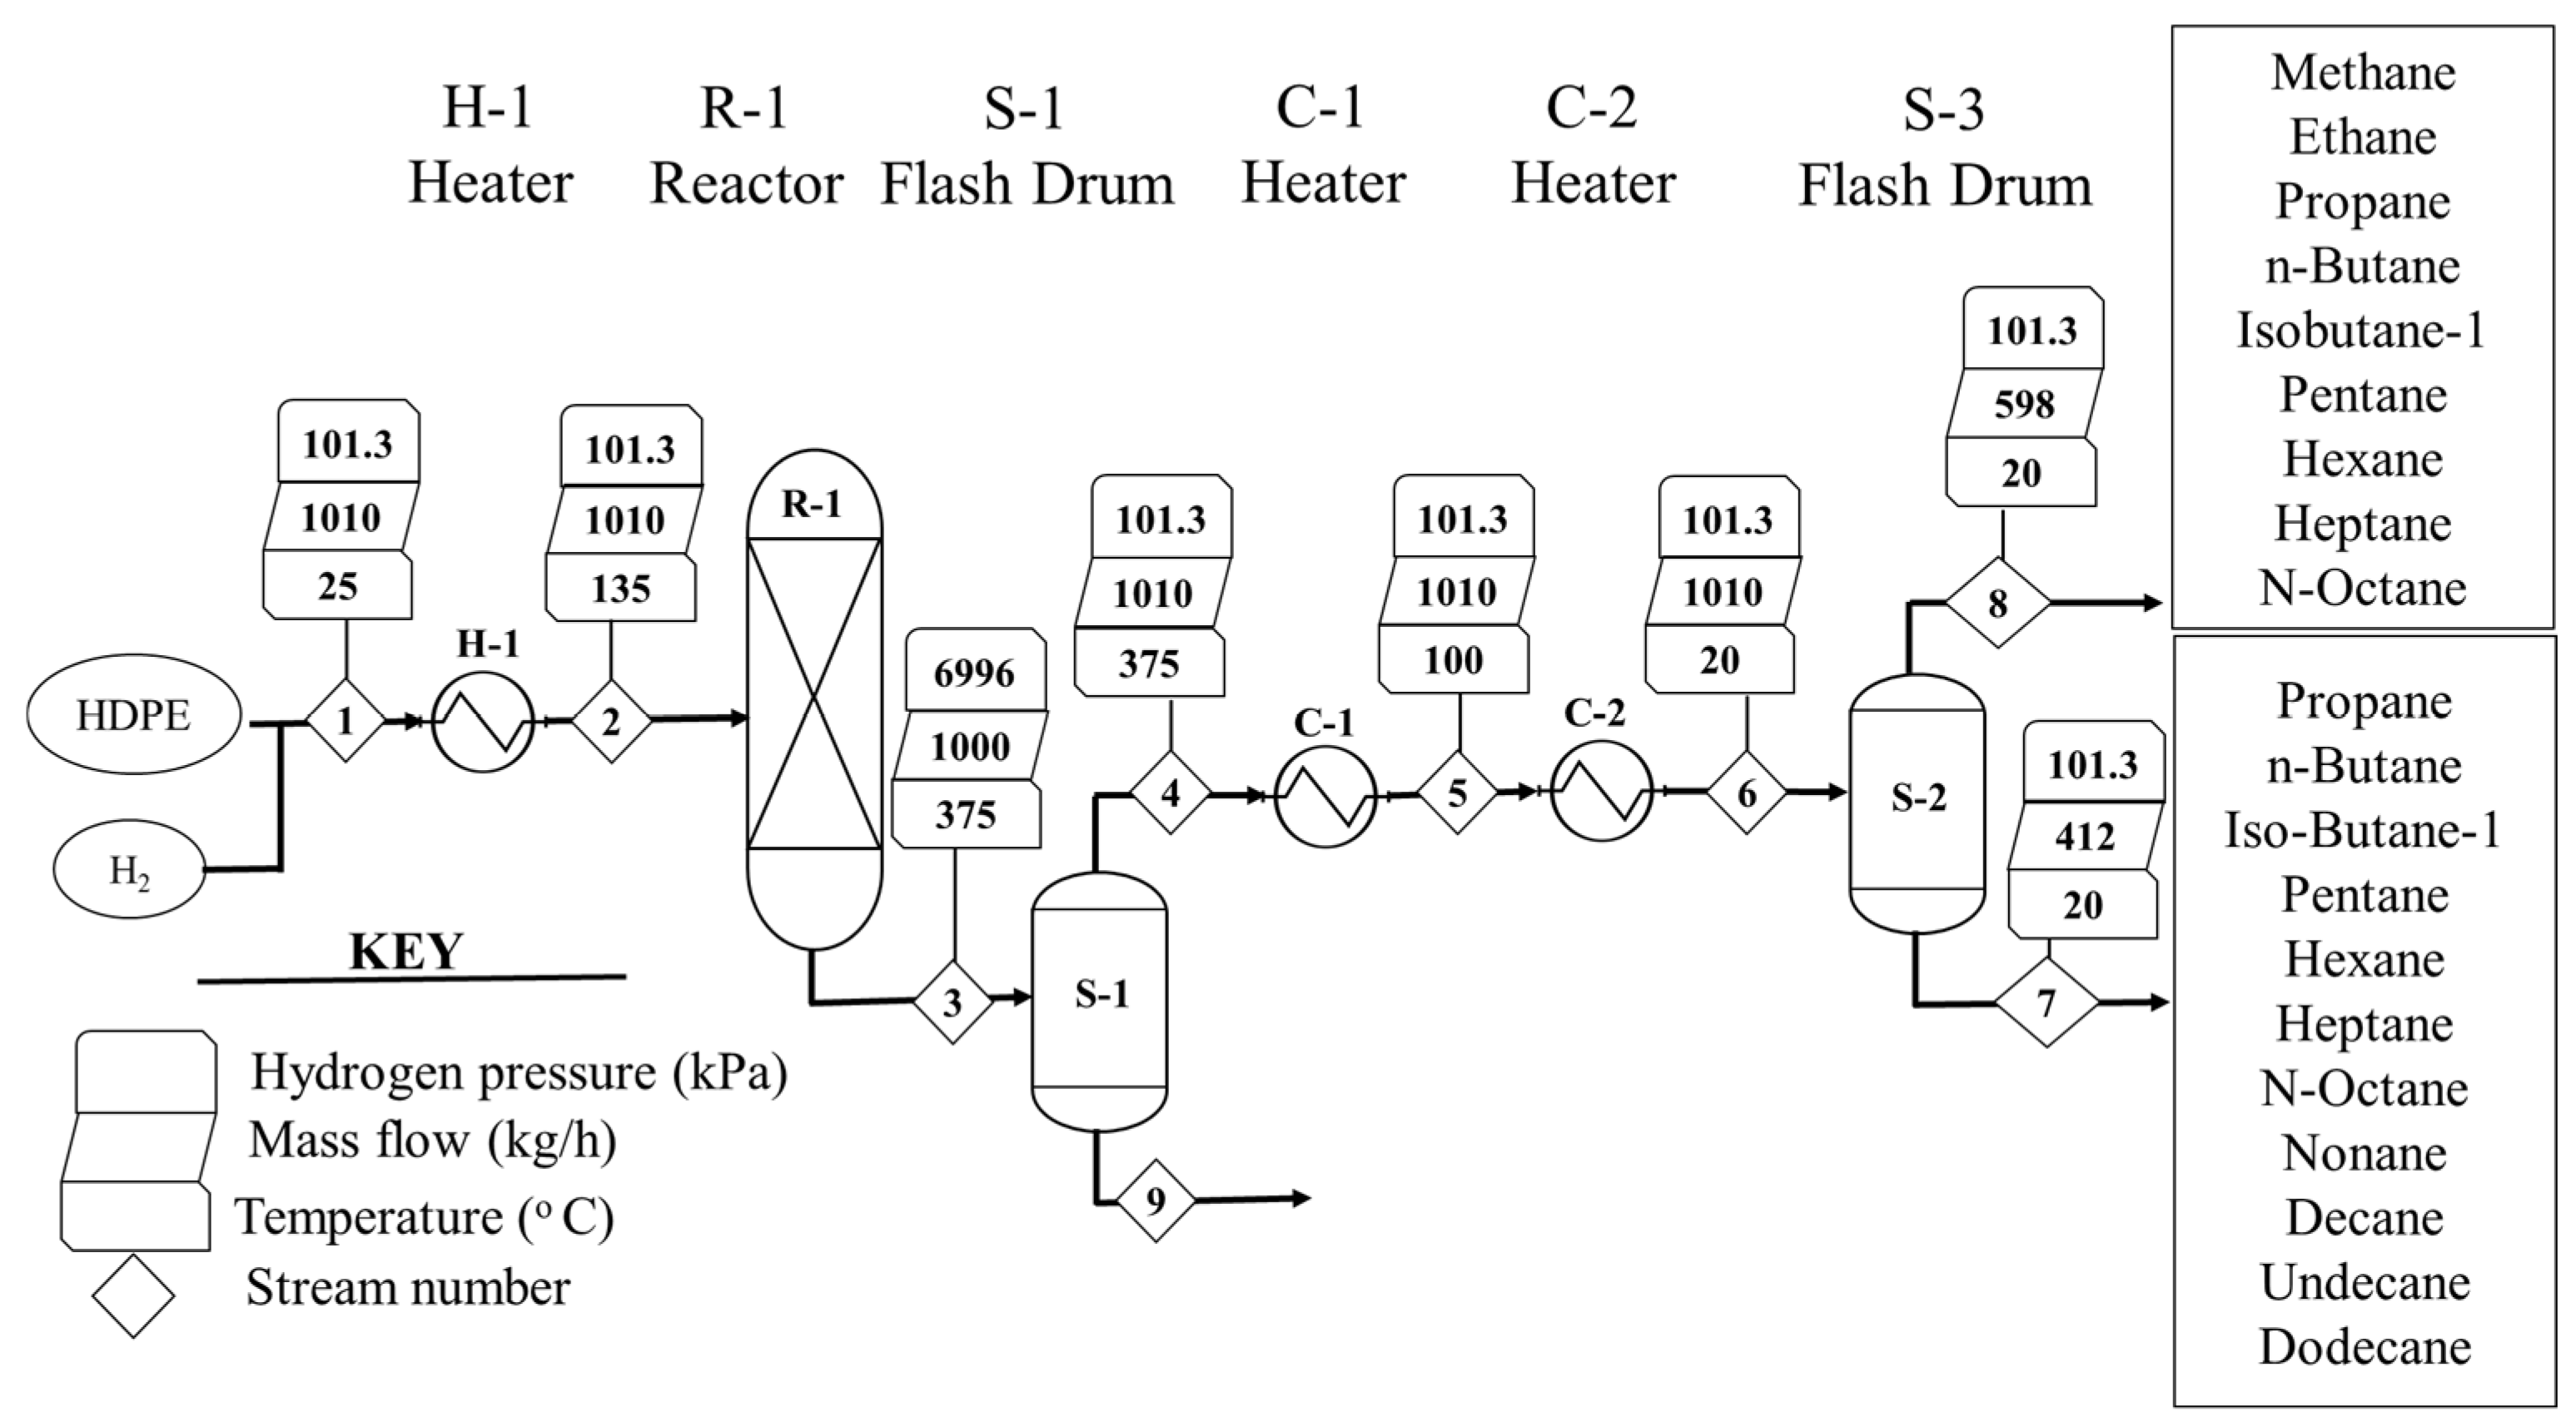
| Units | 1 | 2 | 3 | 4 | 5 | 6 | 7 | 8 | |
|---|---|---|---|---|---|---|---|---|---|
| From | H-1 | R-1 | S-1 | C-1 | C-2 | S-2 | S-2 | ||
| To | H-1 | R-1 | S-1 | C-1 | C-2 | S-2 | Bottom | Top | |
| T | °C | 25 | 135 | 375 | 375 | 80 | 15 | 15 | 15 |
| P | kPa | 101.3 | 101.3 | 6996 | 101.3 | 101.3 | 101.3 | 101.3 | 101.3 |
| Mass flow | kg/h | 1010 | 1010 | 1010 | 1010 | 1010 | 1010 | 412.04 | 597.96 |
| PE | kg/h | 1000 | 1000 | 0 | 0 | 0 | 0 | 0 | 0 |
| Methane | kg/h | 0 | 0 | 5.44 | 5.44 | 5.44 | 5.44 | 0.01 | 5.43 |
| Ethane | kg/h | 0 | 0 | 24.58 | 24.58 | 24.58 | 24.58 | 0.42 | 24.16 |
| Propane | kg/h | 0 | 0 | 211.13 | 211.13 | 211.13 | 211.13 | 12.74 | 198.39 |
| Hydrogen | kg/h | 10 | 10 | 0 | 0 | 0 | 0 | 0 | 0 |
| n-Butane | kg/h | 0 | 0 | 73.83 | 73.83 | 73.83 | 73.83 | 14.82 | 59.01 |
| n-Octane | kg/h | 0 | 0 | 50.26 | 50.26 | 50.26 | 50.26 | 48.92 | 1.34 |
| Isobu-01 | kg/h | 0 | 0 | 230.67 | 230.67 | 230.67 | 230.67 | 34.29 | 196.38 |
| Pentane | kg/h | 0 | 0 | 110.20 | 110.20 | 110.20 | 110.20 | 51.91 | 58.29 |
| Hexane | kg/h | 0 | 0 | 218.18 | 218.18 | 218.18 | 218.18 | 166.14 | 52.04 |
| Heptane | kg/h | 0 | 0 | 30.72 | 30.72 | 30.72 | 30.72 | 28.17 | 2.55 |
| Nonane | kg/h | 0 | 0 | 38.28 | 38.28 | 38.28 | 38.28 | 37.95 | 0.33 |
| Decane | kg/h | 0 | 0 | 14.30 | 14.30 | 14.30 | 14.30 | 14.26 | 0.04 |
| Undecane | kg/h | 0 | 0 | 1.81 | 1.81 | 1.81 | 1.81 | 1.81 | 0 |
| Dodecane | kg/h | 0 | 0 | 0.60 | 0.60 | 0.60 | 0.60 | 0.60 | 0 |
| LHV | MJ/kg | - | 119.96 | - | - | - | - | 44.81 | 45.82 |
| H | kW | −1463.7 | 5.01 | - | - | - | - | −268.97 | −385.50 |
| Equipment | Utility | Value | Heat Duty (kW) |
|---|---|---|---|
| H-1 (Preheater) | Medium Pressure steam (Inlet Temp: 175 °C, Outlet temp: 174 °C) | 186.24 kg/h | 105.27 |
| R-1 (Reactor) | Electricity (US-EPA-Rule-E9-5711) | 965.71 kW/h | 965.71 |
| C-1 (Cooler-1) | Cooling water (Inlet Temp: 20 °C, Outlet temp: 25 °C) | 36217.7 kg/h | −210.02 |
| C-2 (Cooler-2) | Refrigerant 1 (Inlet Temp: −25 °C, Outlet temp: −24 °C) | 6653.4 kg/h | −73.97 |
| Product | Composition | Mass Flow Rate (kg/h) | CV (MJ/kg) | Mass % |
|---|---|---|---|---|
| Pyrolysis oil | C5–C8 | 652.54 | 44.06 | 65.25 |
| Heavy oil (Pyrolysis) | C20+ | 94.97 | 43.15 | 9.5 |
| Pyrolysis gas | C1–C4+ Hydrogen | 218.71 | 75.86 | 21.8 |
| Char | Carbon | 33.77 | 32.79 | 3.37 |
| Products | Main Composition | Mass Flow Rate (kg/h) | CV (MJ/kg) | Mass % |
|---|---|---|---|---|
| Liquid fuel | C4–C12 | 412.04 | 44.81 | 41.2 |
| Gaseous Products | C1–C5 | 597.96 | 45.82 | 59.8 |
| Impact Assessment of Pyrolysis Scenario | |||||||||
|---|---|---|---|---|---|---|---|---|---|
| Impact Category | Unit | Total | Feed | Utility (Electricity) | Other Utilities | Pyrolysis Oil (AP) | Natural Gas (AP) | Char (AP) | Heavy Fuel Oil (AP) |
| AD | kg Sb eq. | 0.00017 | 0.000227 | 0.00011 | 5.79 × 10⁻⁵ | −0.00017 | −1.1 × 10⁻⁷ | −3.1 × 10⁻⁵ | −2.5 × 10⁻⁵ |
| AD (FF) | MJ | 29,901.52 | 72,773.53 | 7799.18 | 4116.629 | −36652.5 | −12581.8 | −259.8 | −5293.71 |
| GWP100a | kg CO2 eq. | 2557.997 | 2079.367 | 667.0891 | 352.1086 | −309.6 | −127.437 | −57.2218 | −46.3102 |
| ODP | kg CFC-11 eq. | −0.00044 | 1.48 × 10⁻⁵ | 3.75 × 10⁻⁵ | 1.98 × 10⁻⁵ | −0.00044 | 0 | −2.6 × 10⁻⁶ | −6.4 × 10⁻⁵ |
| Human toxicity | kg 1,4-DB eq. | 208.9515 | 114.9086 | 134.73 | 71.11432 | −91.9663 | −0.63464 | −5.39463 | −13.8059 |
| FAETP. | kg 1,4-DB eq. | 204.0771 | 73.29645 | 119.5066 | 63.07899 | −42.9163 | −0.0007 | −2.64205 | −6.24587 |
| MAETP | kg 1,4-DB eq. | 1,309,682 | 358,565.9 | 755073.6 | 398549.3 | −165002 | −5941.07 | −8967.17 | −22,595.8 |
| TAETP | kg 1,4-DB eq. | 0.620252 | 0.255168 | 0.696081 | 0.367412 | −0.56392 | −0.00116 | −0.04524 | −0.08809 |
| Photochemical oxidation | kg C2H4 eq. | 0.281434 | 0.644181 | 0.142009 | 0.074957 | −0.2152 | −0.03066 | −0.30283 | −0.03103 |
| Acidification | kg SO2 eq. | 7.820713 | 7.030695 | 3.420981 | 1.805691 | −3.53334 | −0.30266 | −0.09266 | −0.50799 |
| Eutrophication | kg PO4 eq. | 1.336317 | 0.647215 | 0.815912 | 0.430661 | −0.45225 | −0.01586 | −0.02251 | −0.06685 |
| Impact Assessment of Hydrocracking Scenario | |||||||||
| Impact Category | Unit | Total | Feed | Utility (Electricity) | Other Utilities | Gasoline Fuel (AP) | Natural Gas (AP) | Hydrogen Feed | |
| AD | kg Sb eq. | 0.000143 | 0.000227 | 9.66 × 10⁻⁵ | 4.07 × 10⁻⁵ | −0.00023 | −2.9 × 10⁻⁷ | 5.94 × 10⁻⁶ | |
| AD (FF) | MJ | 24,528.46 | 72,773.52 | 6871.96 | 2892.67 | −24,380.7 | −34,399 | 769.9084 | |
| GWP100a | kg CO2 eq. | 1049.399 | 2079.367 | 587.781 | 247.4194 | −1598.73 | −348.416 | 81.97481 | |
| ODP | kg CFC-11 eq. | −0.00023 | 1.48 × 10⁻⁵ | 3.3 × 10⁻⁵ | 1.39 × 10⁻⁵ | −0.00029 | 0 | 0 | |
| Human toxicity | kg 1,4-DB eq. | −7194.09 | 114.9086 | 118.7124 | 49.97057 | −7476.35 | −1.73513 | 0.411386 | |
| FAETP | kg 1,4-DB eq. | 188.8607 | 73.29645 | 105.2988 | 44.32431 | −34.0578 | −0.00191 | 0.000792 | |
| MAETP | kg 1,4-DB eq. | 1,156,427 | 358,565.9 | 665,305.2 | 280,052.4 | −132,047 | −16,243.1 | 793.1172 | |
| TAETP | kg 1,4-DB eq. | −0.31712 | 0.255168 | 0.613326 | 0.258173 | −1.44141 | −0.00316 | 0.000789 | |
| Photochemical oxidation | kg C2H4 eq. | −7.25243 | 0.644181 | 0.125126 | 0.05267 | −8.00329 | −0.08383 | 0.012712 | |
| Acidification | kg SO2 eq. | 3.593768 | 7.030695 | 3.014272 | 1.268822 | −7.10891 | −0.82748 | 0.216369 | |
| Eutrophication | kg PO4 eq. | 0.236964 | 0.647215 | 0.718911 | 0.302617 | −1.42326 | −0.04336 | 0.034842 | |
| AP = Avoided Products | |||||||||
| Parameter | Pyrolysis | Hydrocracking |
|---|---|---|
| ṁHDPE | 1000 kg/h | 1000 kg/h |
| ṁH2 | 0 | 10 kg/h |
| * TF | 25 °C | 25 °C |
| ** ρ | 967 kg/m3 | 967 kg/m3 |
| *** TR | 450 °C | 375 °C |
| **** PR | 100.1 kPa | 6996 kPa |
| Equipment | Description | Aspen Model |
|---|---|---|
| H-1 | Temperature 135 °C Pressure 100.3 kPa | HEATER |
| R-1 | Temperature 450 °C Pressure 101.3 kPa HDPE flow rate 1000 kg/h | RYield |
| S-1 | Temperature 450 °C Pressure 100.3 kPa | FLASH 2 |
| C -1 | Temperature 100 °C Pressure 100.3 kPa | HEATER |
| S-2 | Temperature 100 °C Pressure 100.3 kPa | FLASH 2 |
| C-2 | Temperature 20 °C Pressure 100.3 kPa | HEATER |
| S-3 | Temperature 20 °C Pressure 100.3 kPa | FLASH 2 |
| Thermodynamic package: Peng Robinson | ||
| Equipment | Description | Aspen Model |
|---|---|---|
| H-1 | Temperature 135 °C Pressure 100.3 kPa | HEATER |
| R-1 | Temperature 375 °C Pressure 6996 kPa HDPE flow rate 1000 kg/h | RYield |
| S-1 | Temperature 375 °C Pressure 100.3 kPa | FLASH 2 |
| C -1 | Temperature 100 °C Pressure 100.3 kPa | HEATER |
| C-2 | Temperature 15 °C Pressure 100.3 kPa | HEATER |
| S-2 | Temperature 15 °C Pressure 100.3 kPa | FLASH 2 |
| Thermodynamic package: Peng-Robinson | ||
| Input. | |||||
|---|---|---|---|---|---|
| No. | Quantity | Remarks | Respective GWP100a (kg CO2 eq.) | ||
| 1 | Electricity | 1674.5 kW | Electricity, high voltage GB Data | 0.609/kWh | |
| 2 | HDPE | 1000 kg/h | Polyethylene, high density, granulate | 2.08/kg | |
| Output | |||||
| Quantity | CV (MJ/kg) | Substitute | Avoided GWP100a (kg CO2 eq.) | ||
| 1 | Gaseous Products | 218.72 kg/h | 75.86 | Natural gas | −0.583/kg |
| 2 | Char | 33.7 kg/h | 32.79 | Char coal | −1.69/kg |
| 3 | Pyrolysis Oil | 652.55 kg/h | 44.056 | Naphtha, petroleum refinery operations | −0.474/kg |
| 4 | Heavy Oil | 94.97 kg/h | 43.15 MJ/kg | Heavy fuel oil | −0.488/kg |
| Input | |||||
|---|---|---|---|---|---|
| No | Quantity | Remarks | Respective GWP100a (kg CO2 eq.) | ||
| 1 | Electricity | 1372.2 kW | Electricity, high voltage GB Data | 0.609/kWh | |
| 2 | Mass flow of HDPE | 1000 kg/h | Polyethylene, high density, granulate | 2.08/kg | |
| 3 | Mass flow of H2 | 10 kg/h | Hydrogen reforming | 8.19/kg | |
| Output | |||||
| Quantity | CV (MJ/kg) | Substitution | Avoided GWP100a (kg CO2 eq.) | ||
| 4 | Liquids | 412 kg/h | 44.81 | Petrol, unleaded | −3.88/kg |
| 5 | Gaseous Products | 598 kg/h | 45.8 | Natural gas E | −0.583/kg |
Publisher’s Note: MDPI stays neutral with regard to jurisdictional claims in published maps and institutional affiliations. |
© 2022 by the authors. Licensee MDPI, Basel, Switzerland. This article is an open access article distributed under the terms and conditions of the Creative Commons Attribution (CC BY) license (https://creativecommons.org/licenses/by/4.0/).
Share and Cite
Azam, M.U.; Vete, A.; Afzal, W. Process Simulation and Life Cycle Assessment of Waste Plastics: A Comparison of Pyrolysis and Hydrocracking. Molecules 2022, 27, 8084. https://doi.org/10.3390/molecules27228084
Azam MU, Vete A, Afzal W. Process Simulation and Life Cycle Assessment of Waste Plastics: A Comparison of Pyrolysis and Hydrocracking. Molecules. 2022; 27(22):8084. https://doi.org/10.3390/molecules27228084
Chicago/Turabian StyleAzam, Muhammad Usman, Akshay Vete, and Waheed Afzal. 2022. "Process Simulation and Life Cycle Assessment of Waste Plastics: A Comparison of Pyrolysis and Hydrocracking" Molecules 27, no. 22: 8084. https://doi.org/10.3390/molecules27228084