
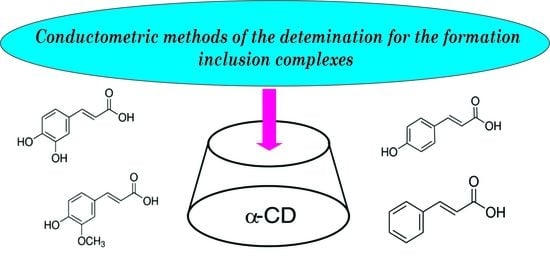
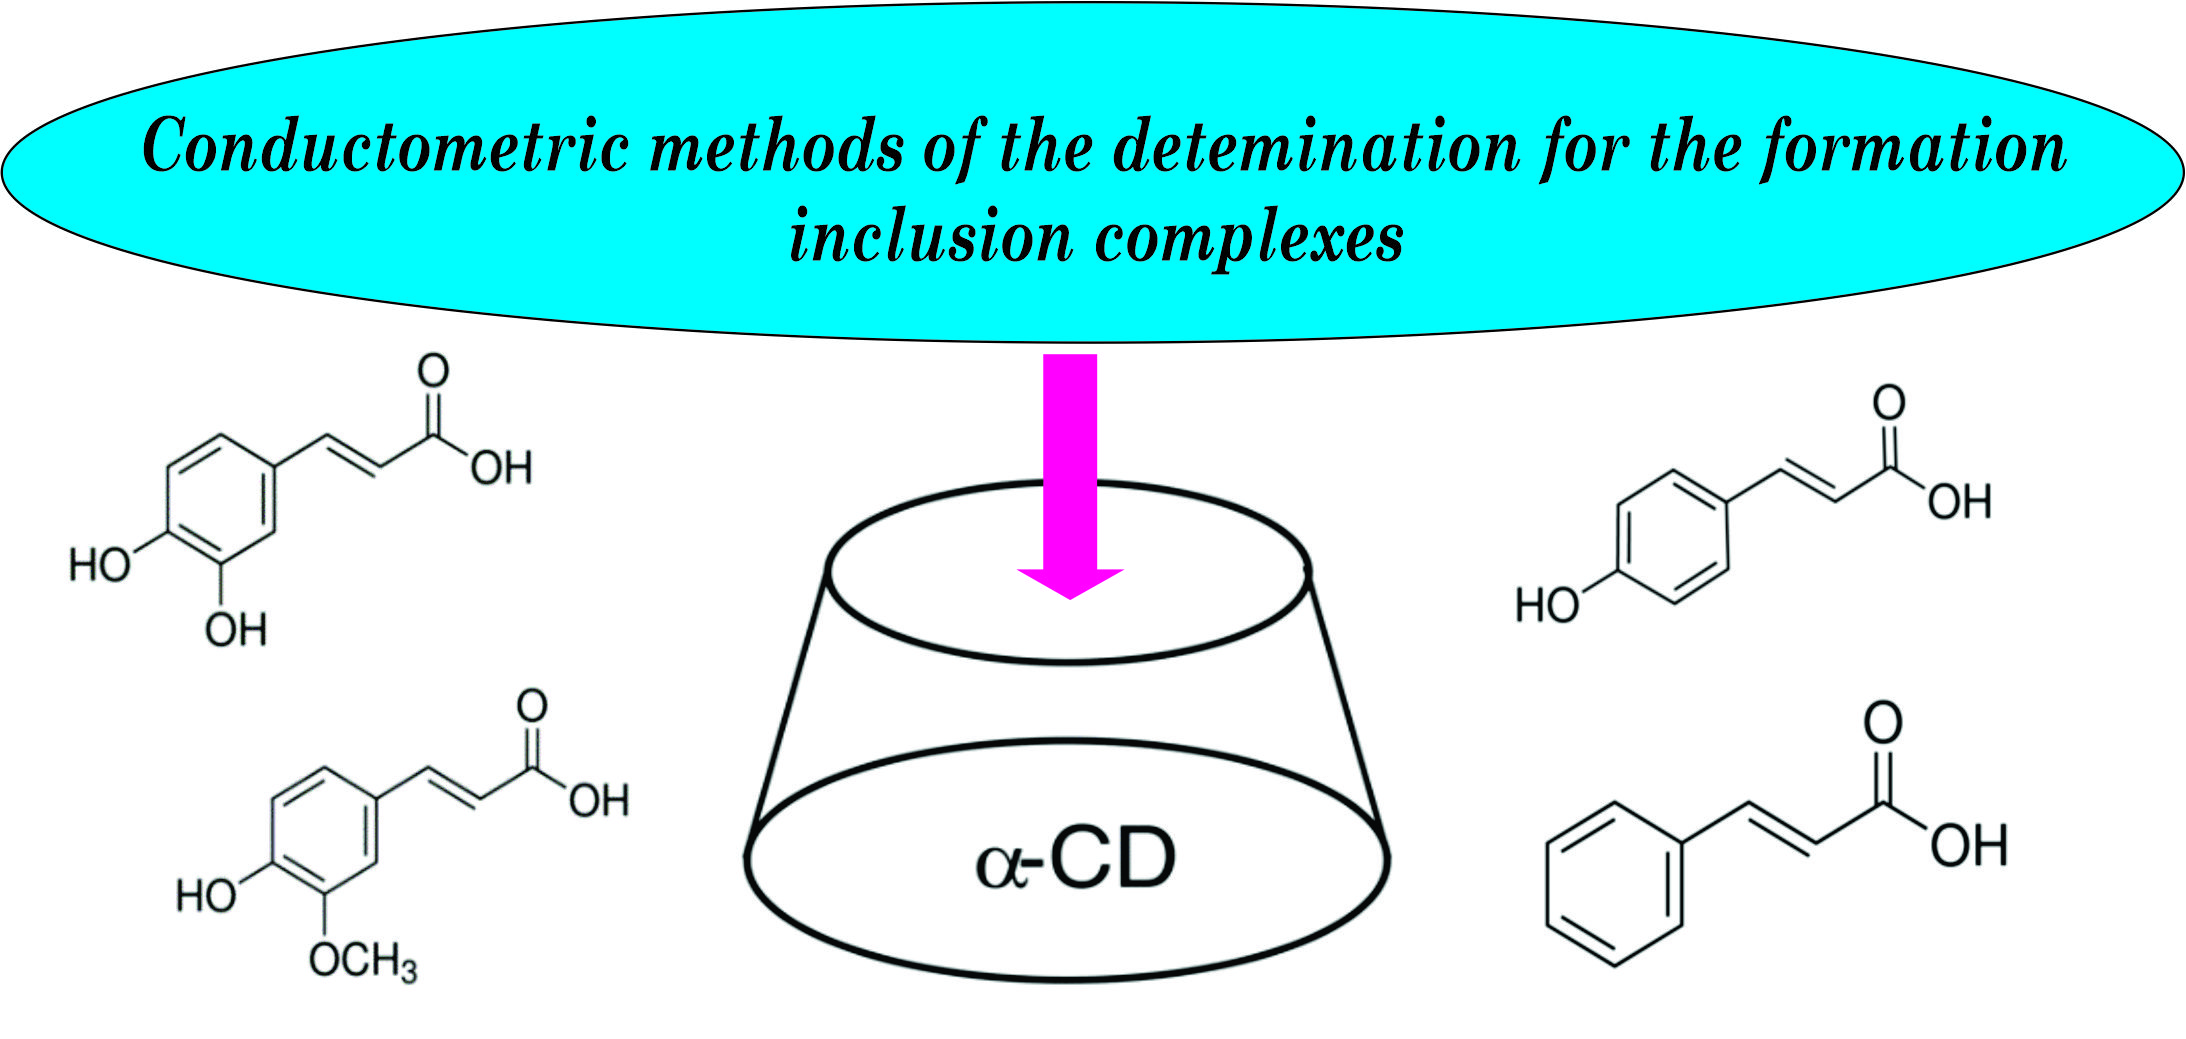
Studies of the Formation of Inclusion Complexes Derivatives of Cinnamon Acid with α-Cyclodextrin in a Wide Range of Temperatures Using Conductometric Methods


Abstract
:
1. Introduction
2. Materials and Methods
2.1. Materials
2.2. Characterization Methods
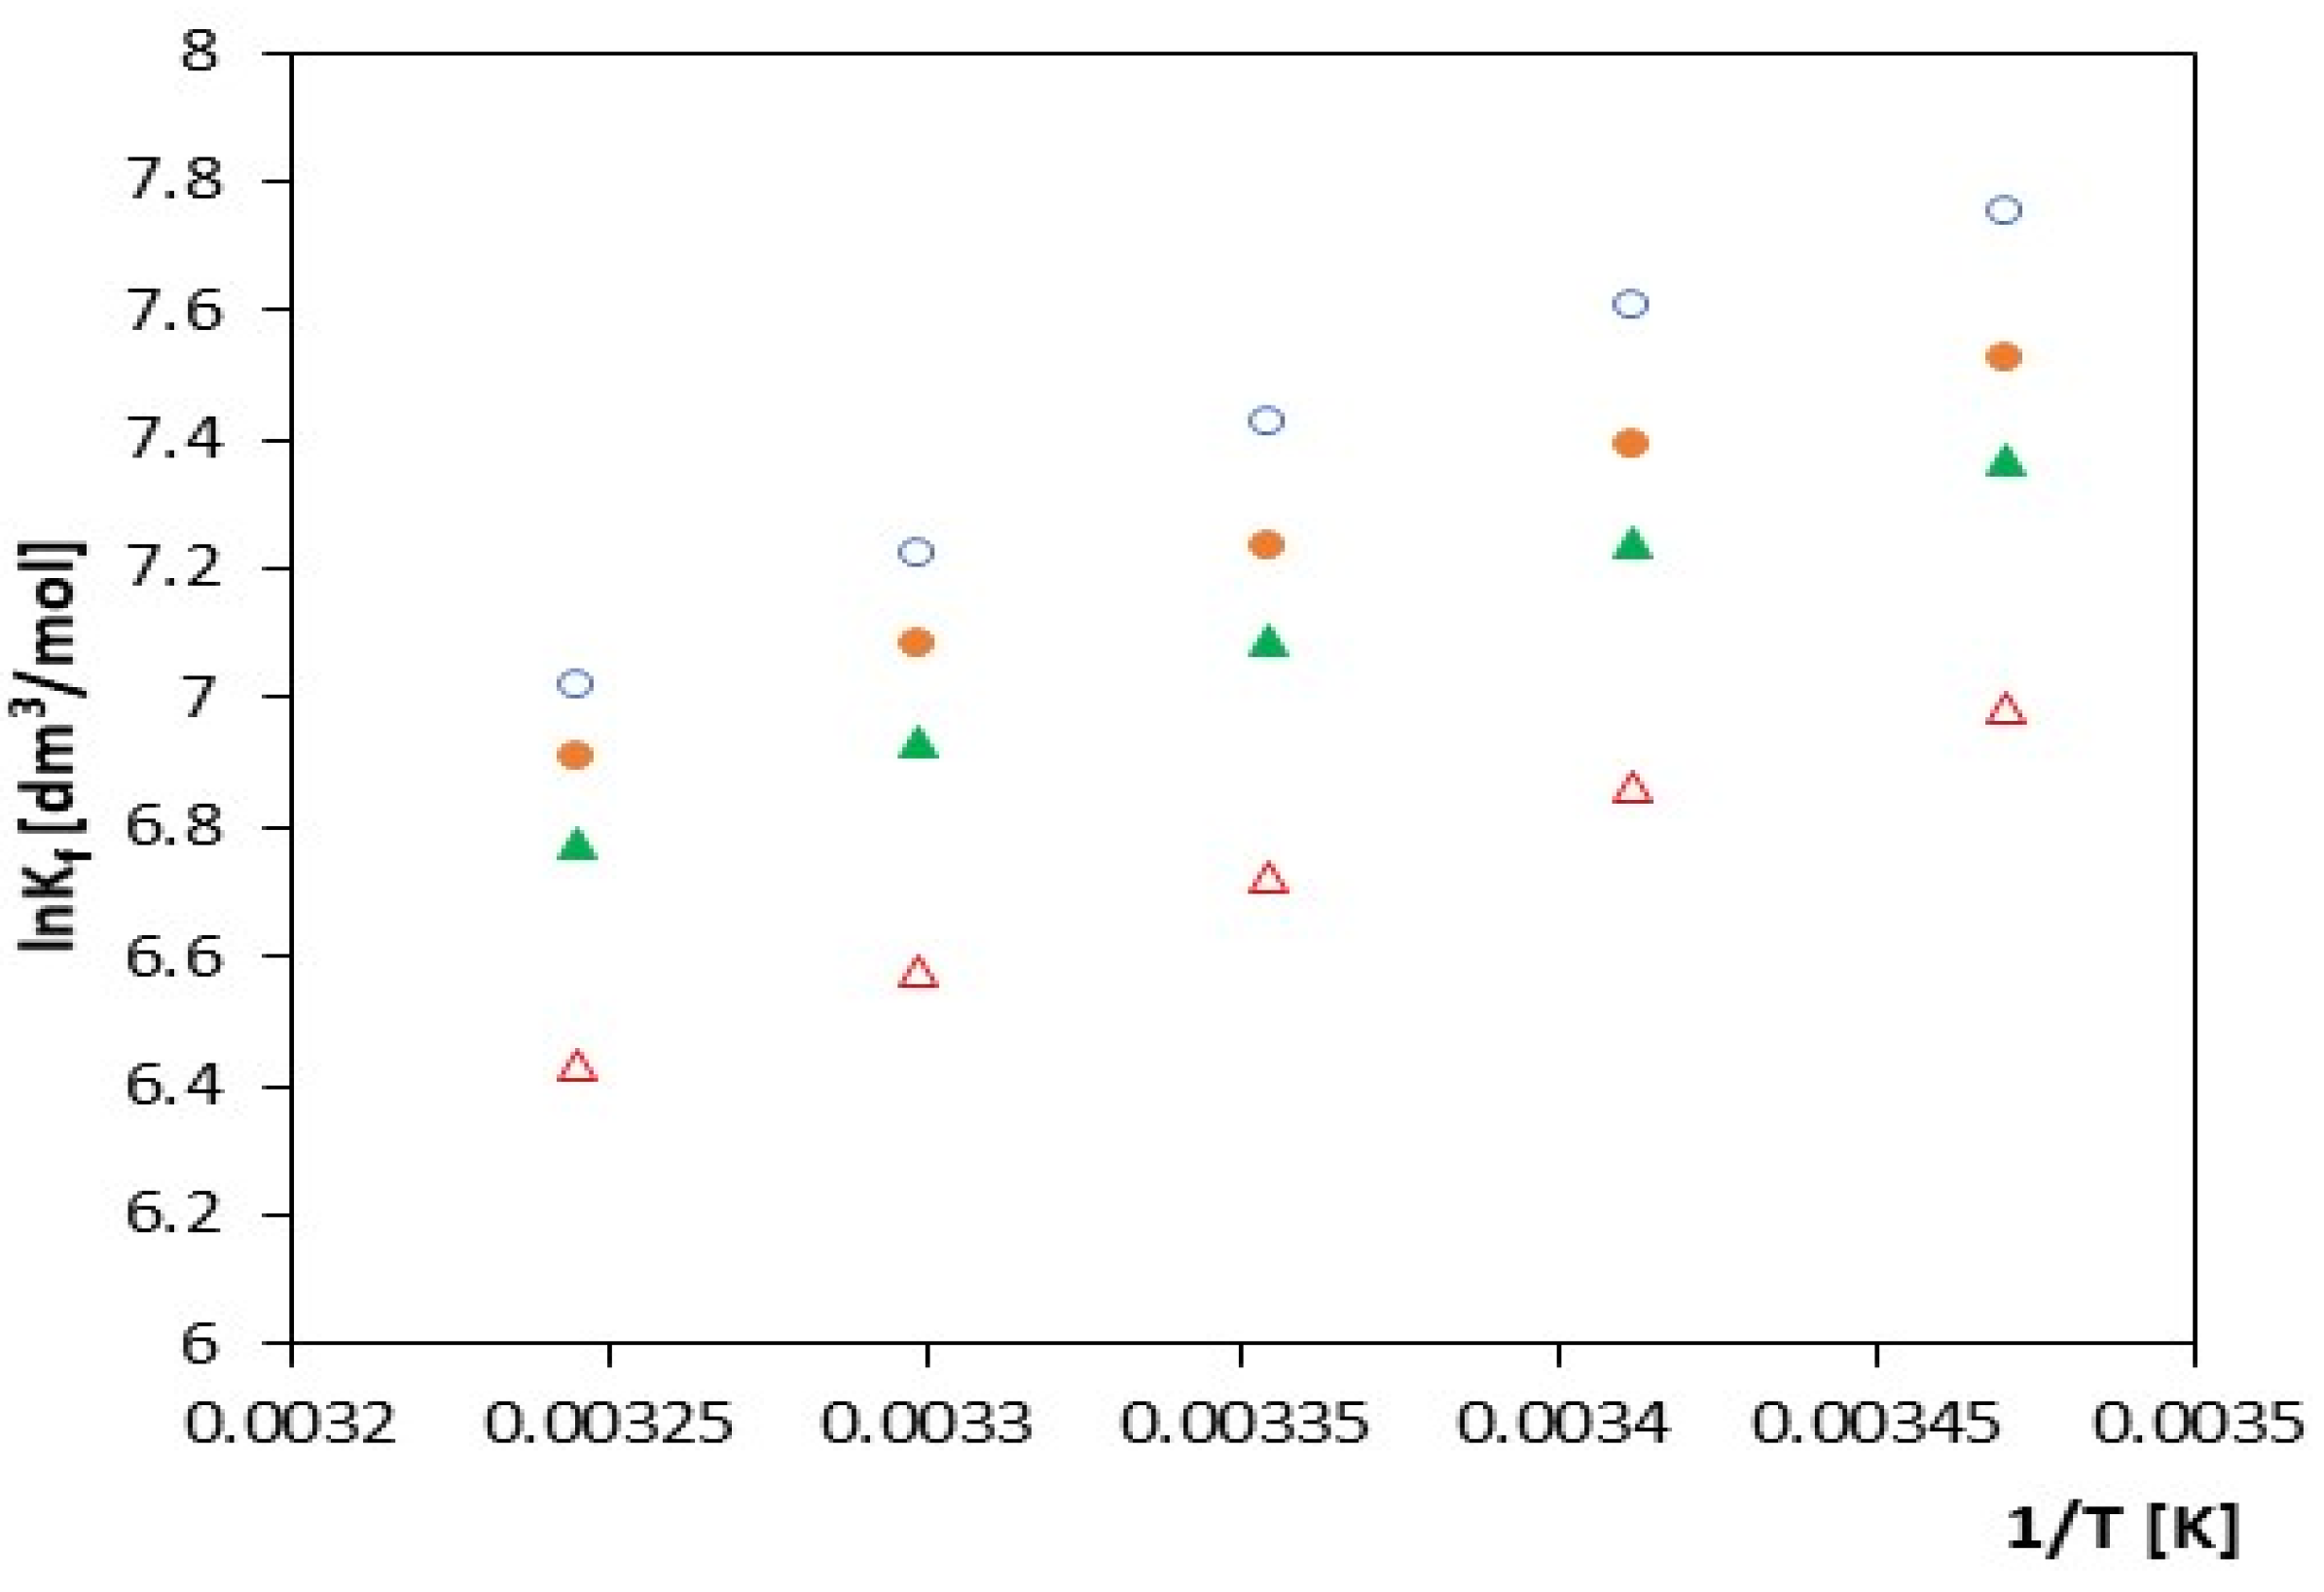
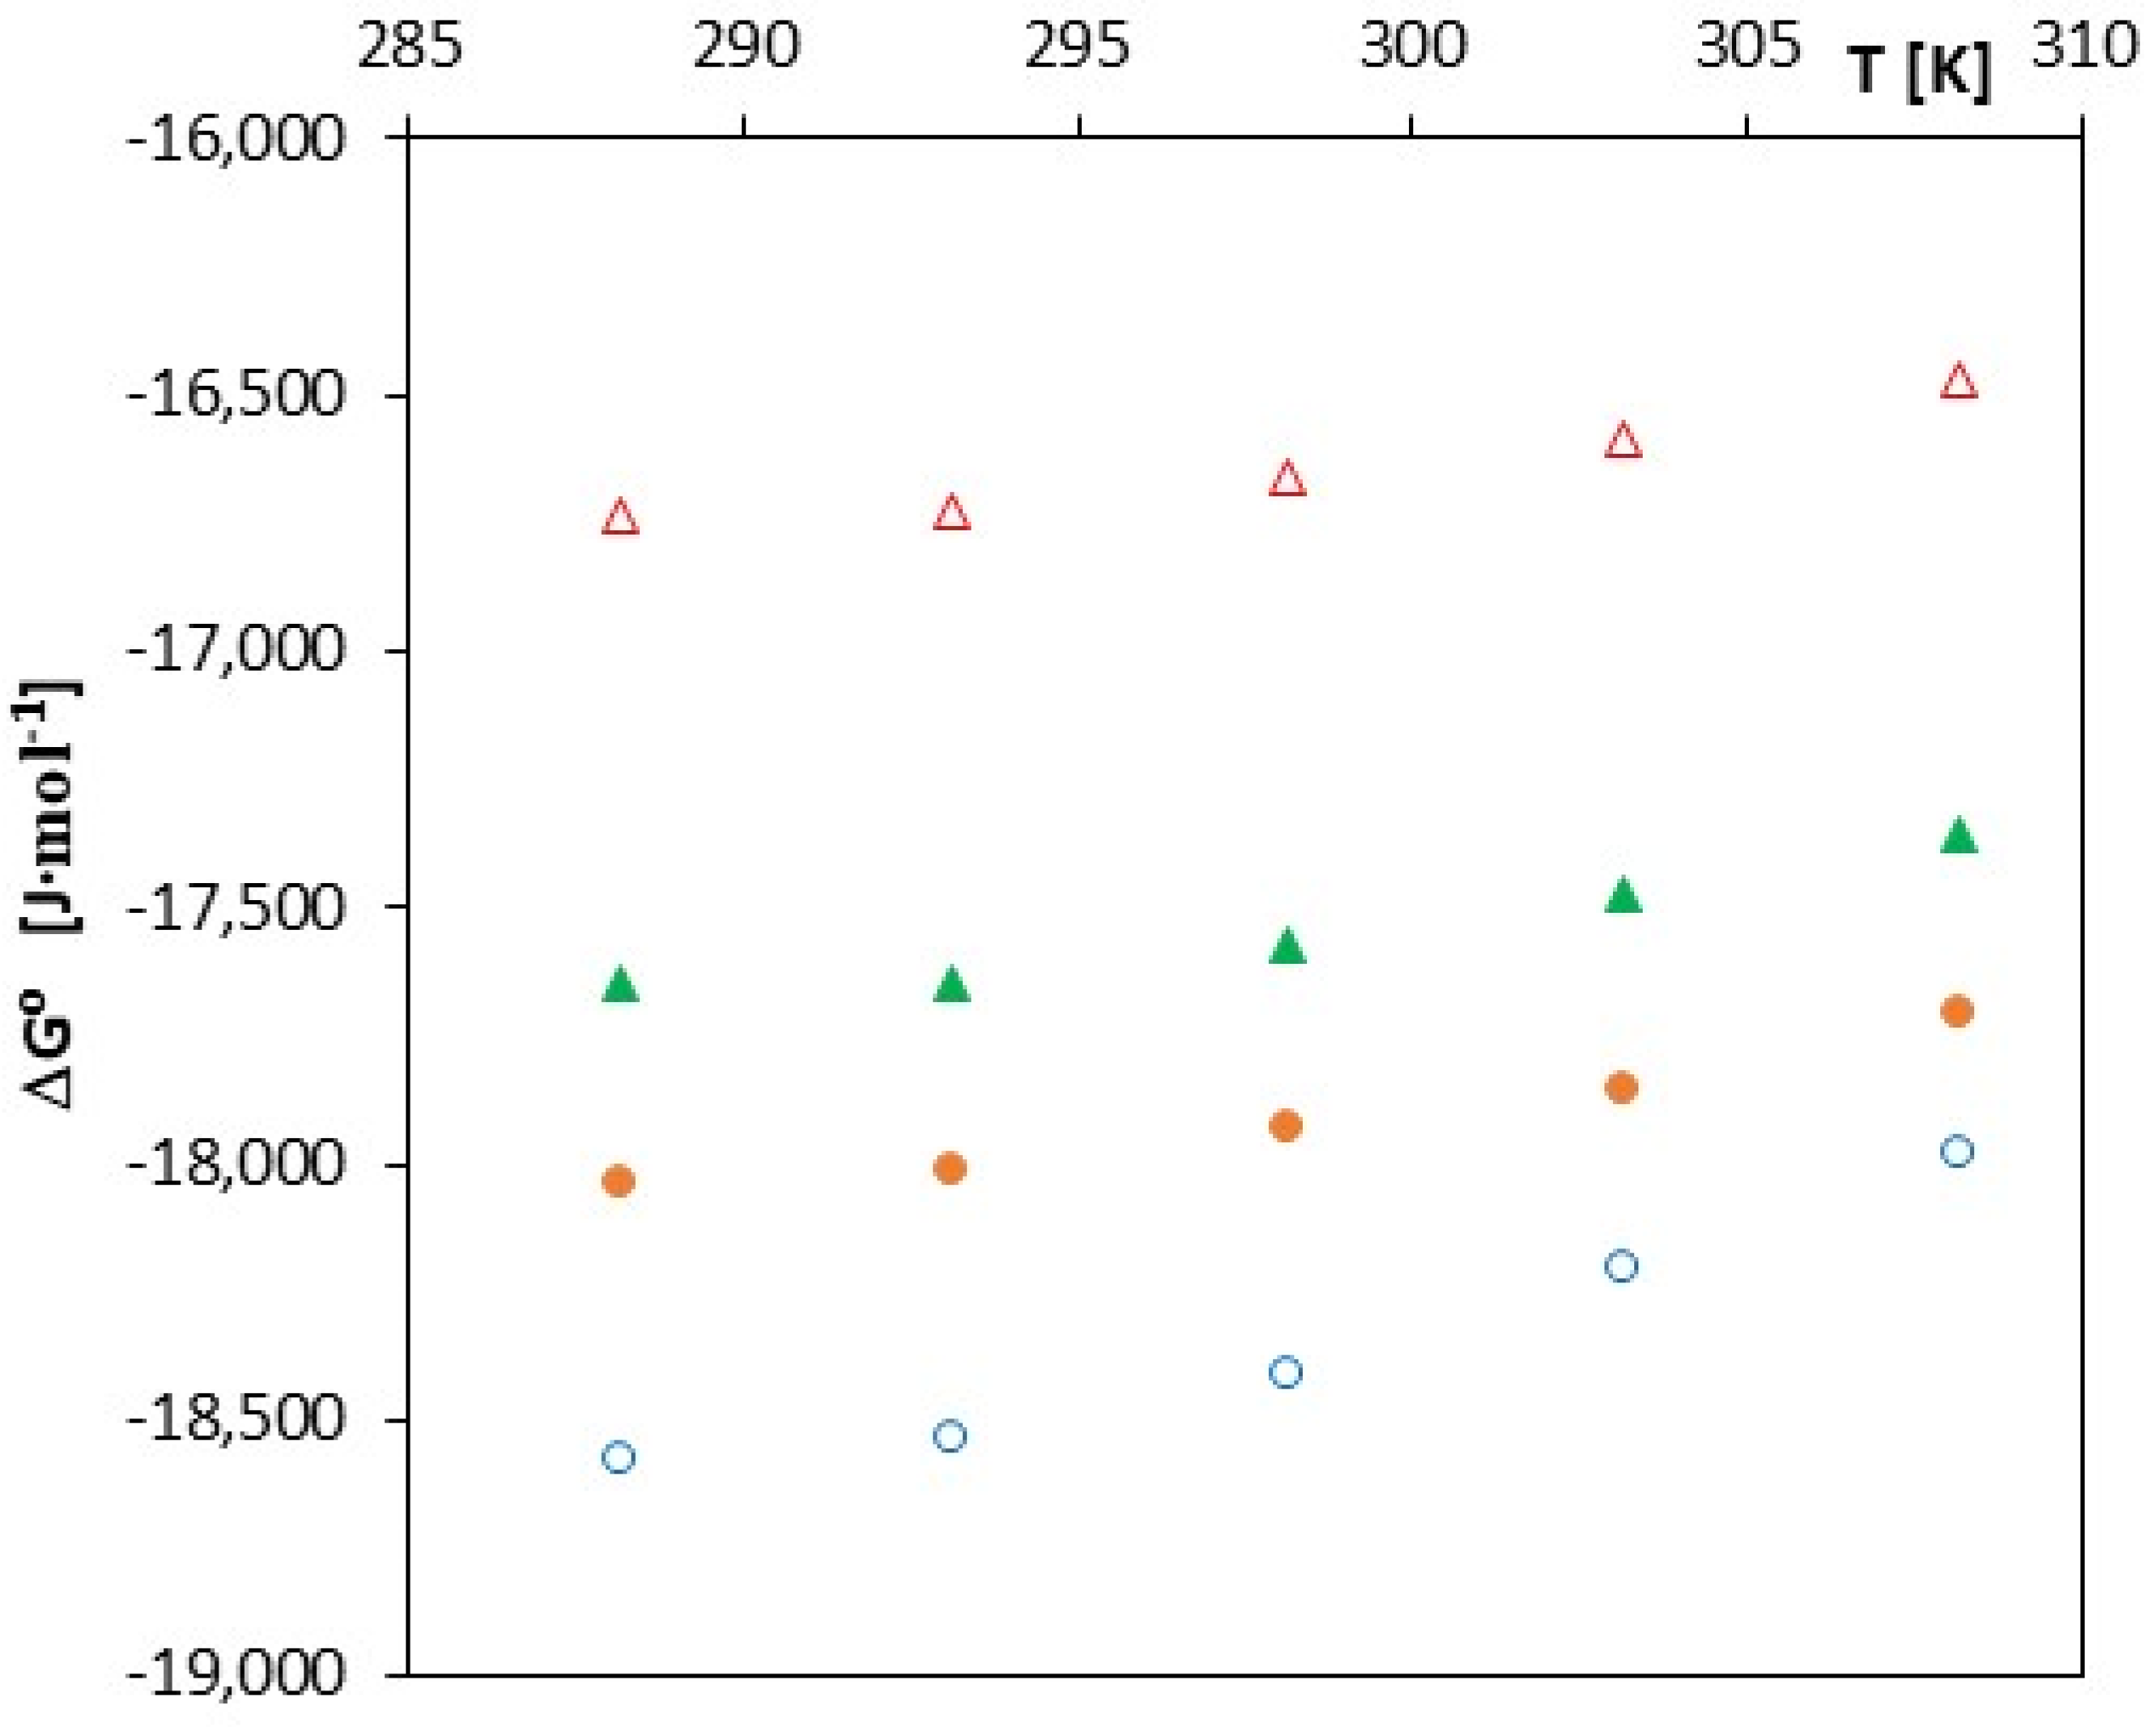
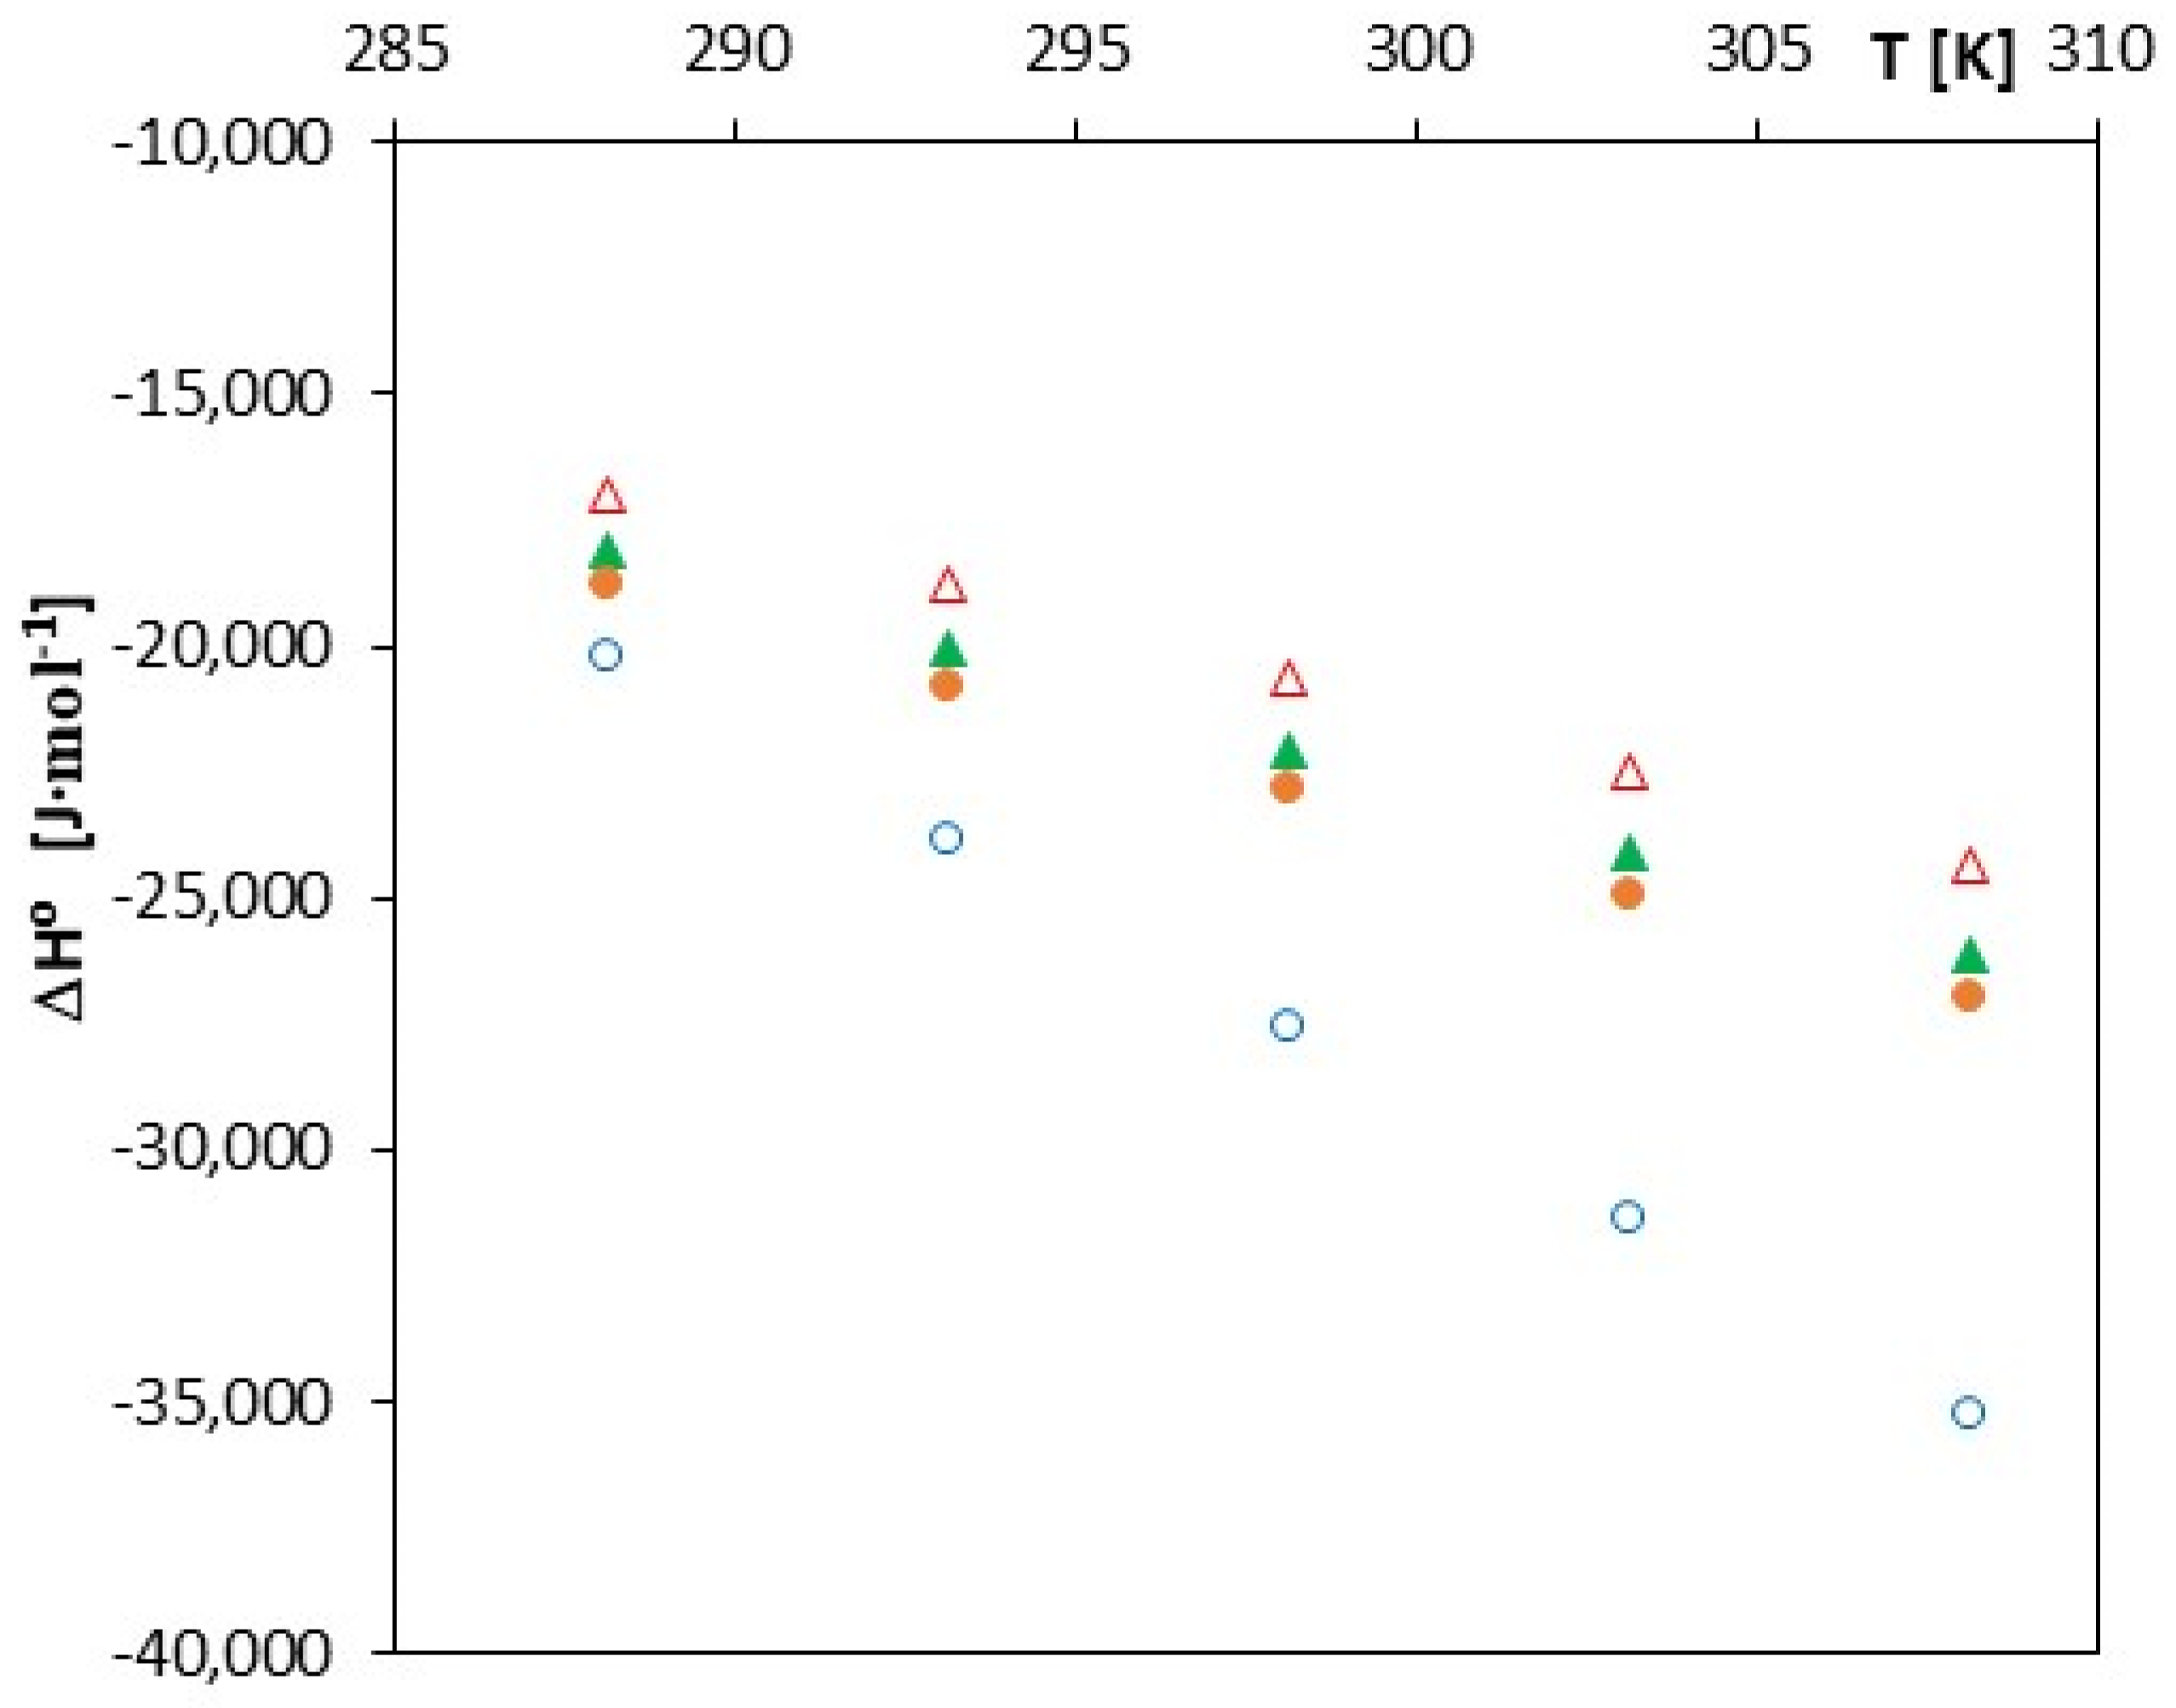
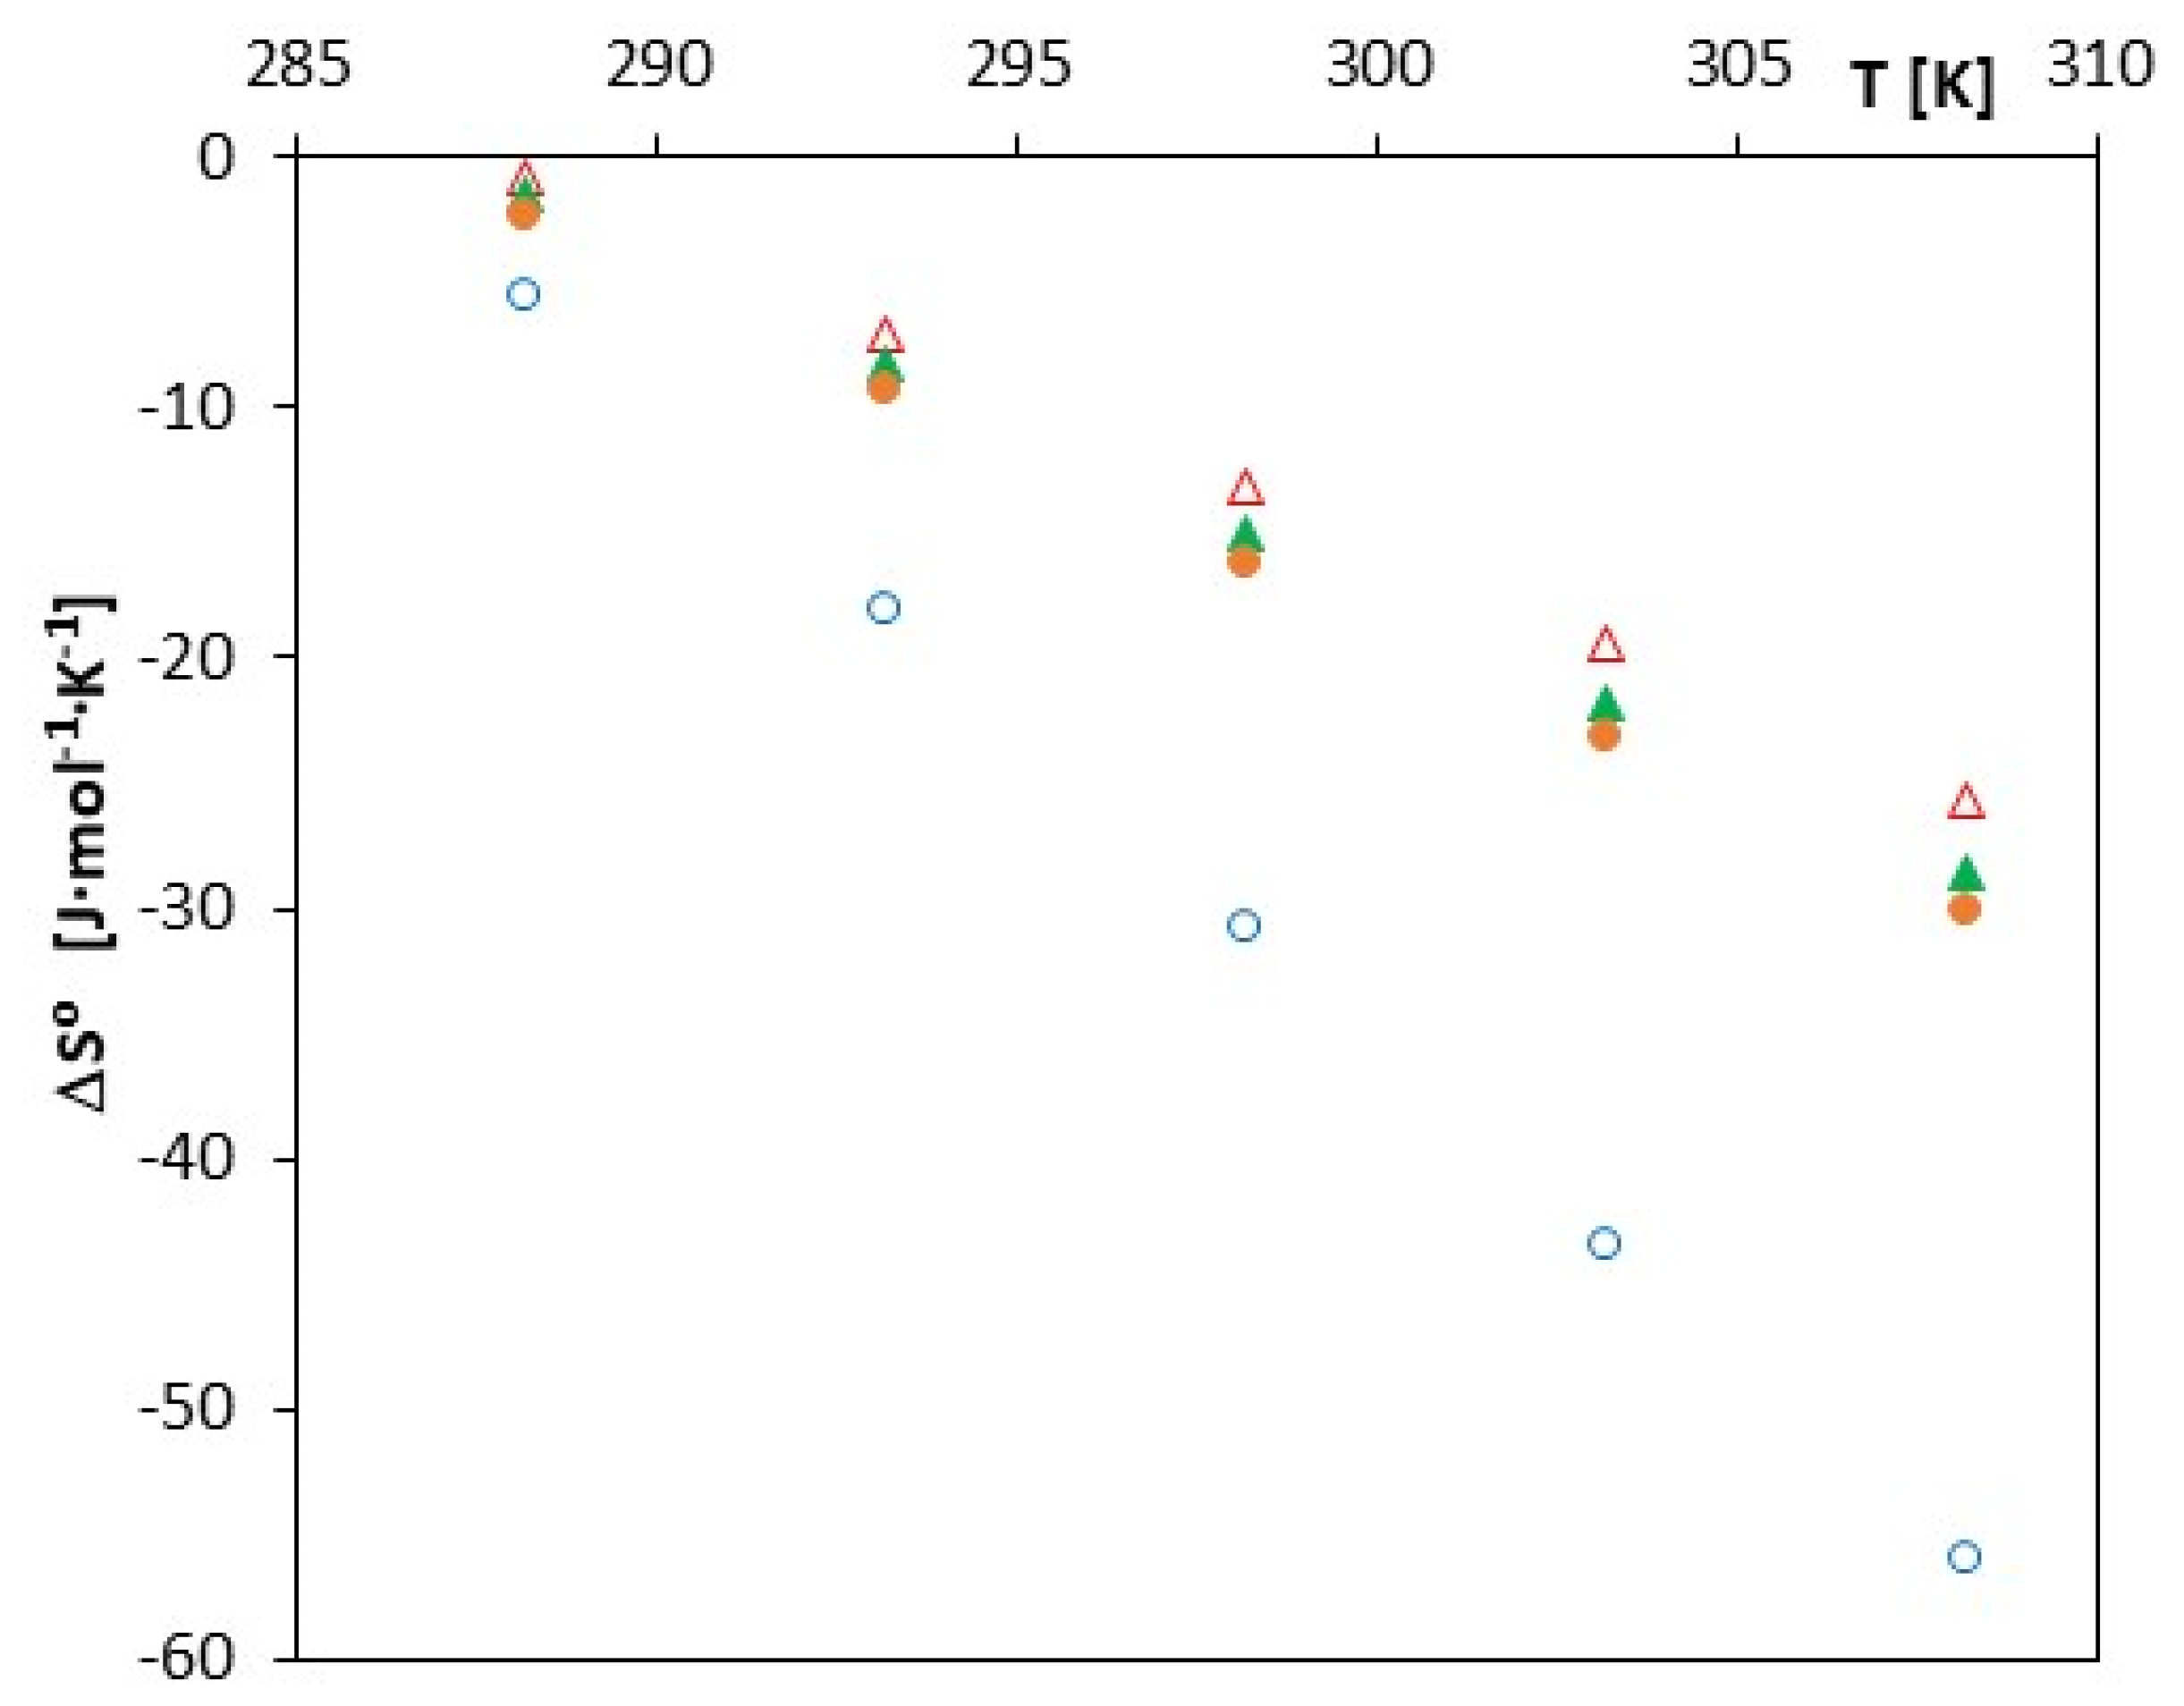
3. Results
4. Discussion
5. Conclusions
Supplementary Materials
Author Contributions
Funding
Institutional Review Board Statement
Informed Consent Statement
Data Availability Statement
Conflicts of Interest
References
- Abarca, R.L.; Rodriguez, F.J.; Guarda, A.; Galotto, M.J.; Bruna, J.E. Characterization of beta-cyclodextrin inclusion complexes containing an essential oil component. Food Chem. 2016, 196, 968–975. [Google Scholar] [CrossRef] [PubMed]
- Wang, S.-Y.; Li, L.; Xiao, Y.; Wang, Y. Recent advances in cyclodextrins-based chiral-recognizing platforms. Trends Anal. Chem. 2019, 121, 115691. [Google Scholar] [CrossRef]
- Jambhekar, S.S.; Breen, P. Cyclodextrin in pharmaceutical formulations I: Structure and physicochemical properties, formation of complexes and types of complex. Drug Discov. Today 2016, 21, 356–362. [Google Scholar] [CrossRef]
- Chaudhari, P.; Vivek, M.; Lewis, S.A. Diversity, safety and applications in ocular therapeutics. Exp. Eye Res. 2019, 189, 107829. [Google Scholar] [CrossRef]
- Szejtli, J. Cycodextrin and their inclusion complexes. Akad. Kiado 1982, 25, 296. [Google Scholar]
- Dodziuk, H. (Ed.) Cyclodextrin and Their Complexes; John Wiley & Sons: Hoboken, NJ, USA, 2006; pp. 17–21. [Google Scholar]
- Liu, K.; Ma, C.; Wu, T.; Qi, W.; Yan, Y.; Huang, J. Recent advances in assemblies of cyclodextrins and amphiphiles: Construction and regulation. Curr. Opin. Coll. Interface Sci. 2020, 45, 44–56. [Google Scholar] [CrossRef]
- Saokham, P.; Loftsson, T. γ-Cyclodextrin. Int. J. Pharm. 2017, 516, 278–292. [Google Scholar] [CrossRef]
- Kurkov, S.V.; Loftsson, T. Cyclodextrins. Int. J. Pharm. 2013, 453, 167–180. [Google Scholar] [CrossRef]
- Loftsson, T.; Duchêne, D. Cyclodextrins and their pharmaceutical applications. Int. J. Pharm. 2007, 329, 1–11. [Google Scholar] [CrossRef]
- Granata, G.; Consoli, G.M.L.; Nigrob, R.L.; Geraci, C. Hydroxycinnamic acids loaded in lipid-core nanocapsules. Food Chem. 2018, 245, 551–556. [Google Scholar] [CrossRef]
- Stachlewska, M.A. Inhibitory properties of lithium, sodium and potassium o-, m- and p-coumarates against Escherichia coli O157:H7. Acta Sci. Technol. Aliment. 2015, 14, 77–84. [Google Scholar] [CrossRef] [Green Version]
- Cabezas-Pizarro, J.; Redondo-Solano, M.; Umaña-Gamboa, C.; Arias-Eschandi, M.L. Antimicrobal activity of different sodium and potassium salts of carboxylic acid against some common foodborne pathogens and spoilage-associated bacteria. Rev. Avgent Microbiol. 2018, 50, 56–61. [Google Scholar]
- Marković, S.; Tošovic, J. Comparative study of the antioxidative activities of caffeoylquinic and caffeic acids. Food Chem. 2016, 210, 585–592. [Google Scholar] [CrossRef]
- Dorantesa, L.; Apariciob, G.; Ramirez, A. Improving water solubility of natural antibacterials to inhibit important bacteria in meat products. Procedia Food Sci. 2011, 1, 173–177. [Google Scholar] [CrossRef] [Green Version]
- Kinart, Z.; Tomaš, R. Conductivity properties of selected aliphatic monocarboxylic acid anions in water at 298.15 K. Int. J. Electrochem. Sci. 2020, 15, 10007–10027. [Google Scholar] [CrossRef]
- Bešter-Rogač, M.; Neueder, R.; Barthel, J.; Appeblat, A. Conductivity studies on aqueous solutions of stereoisomers of tartaric acids and tartrates. Part III. Acidic tartrates. J. Solut. Chem. 1998, 27, 299–307. [Google Scholar] [CrossRef]
- Barthel, J.; Feuerlein, F.; Neueder, R.; Wachter, R. Calibration of conductance cells at various temperatures. J. Solut. Chem. 1980, 9, 209–219. [Google Scholar] [CrossRef]
- Matejczyk, M.; Świsłocka, R.; Golonko, A.; Lewandowski, W.; Hawrylik, E. Cytotoxic, genotoxic and antimicrobial activity of caffeic and rosmarinic acids and their lithium, sodium and potassium salts as potential anticancer compounds. Adv. Med. Sci. 2018, 63, 14–21. [Google Scholar] [CrossRef]
- Świsłocka, R. Spectroscopic (FT-IR, FT-Raman, UV absorption, 1H and 13C NMR) and theoretical (in B3LYP/6-311++G** level) studies on alkalimetal salts of caffeic acid. Spectrochim. Acta A 2013, 100, 21–30. [Google Scholar] [CrossRef]
- Świsłocka, R.; Kowczyk-Sadowy, M.; Kalinowska, M.; Lewandowski, W. Spectroscopic (FT-IR, FT-Raman, 1H and 13C NMR) and theoretical studies of p-coumaric acid and alkali metal p-coumarates. Spectroscopy 2012, 27, 35–48. [Google Scholar] [CrossRef]
- Woranuch, S.; Yoksan, R. Preparation, characterization and antioxidant property of water-soluble ferulic acid grafted chitosan. Carbohydr. Polym. 2013, 96, 495–502. [Google Scholar] [CrossRef] [PubMed]
- Salomon, M.; Hefter, G.T. Mobilities of cation-macrocyclic ligand complexes. Pure App. Chem. 1993, 65, 1533–1540. [Google Scholar] [CrossRef] [Green Version]
- Salomon, M. Conductometric study of cationic and anionic complexes in propylene carbonate. J. Solut. Chem. 1990, 19, 1225–1236. [Google Scholar] [CrossRef]
- Connors, K.A. The stability of cyclodextrin complexes in solution. Chem. Rev. 1997, 97, 1325–1357. [Google Scholar] [CrossRef] [PubMed]
- Loftsson, T.; Brewster, M.E. Pharmaceutical applications of cyclodextrins. 1. Drug solubilization and stabilization. J. Pharm. Sci. 1996, 85, 1017–1025. [Google Scholar] [CrossRef] [PubMed]
- Kfoury, M.; Landy, D.; Ruellan, S.; Auezova, L.; Greige-Gerges, H.; Fourmentin, S.; Beilstein, K. Determination of formation constants and structural characterization of cyclodextrin inclusion complexes with two phenolic isomers: Carvacrol and thymol. J. Org. Chem. 2016, 12, 29–42. [Google Scholar]
- Ikeda, N.; Inoue, Y.; Ogata, Y.; Murata, I.; Meiyan, X.; Takayama, J.; Sakamoto, T.; Okazaki, M.; Kanamoto, J. Improvement of the solubility and evaluation of the physical properties of an inclusion complex formed by a new ferulic acid derivative and γ-Cyclodextrin. ACS Omega 2020, 21, 12073–12080. [Google Scholar] [CrossRef]
- Barão, C.E.; Pinheiro, K.H.; Valarini Junior, O.; Zanin, G.M.; De Moraes, F.F. Determination of the association constant of alpha and beta cyclodextrins using methyl orange. Ind. Biotechnol. 2016, 12, 317–322. [Google Scholar] [CrossRef]


| Chemical Name | Chemical Formula | Chemical Formula | Source | CAS No | Mass Fraction Purity |
|---|---|---|---|---|---|
| trans-ferulic acid | C10H10O4 |  | TCI * | 537-98-4 | ≥0.998 |
| trans-caffeic acid | C9H8O4 |  | TCI * | 331-39-5 | ≥0.998 |
| trans-p-coumaric acid | C9H8O3 |  | TCI * | 501-98-4 | ≥0.998 |
| trans-cinnamic acid | C9H8O2 |  | TCI * | 140-10-3 | ≥0.998 |
| α-Cyclodextrin | C36H60O30 |  | TCI * | 10016-20-3 | ≥0.998 |
| Sodium hydroxide micropills | NaOH | Avantor | 1310-73-2 | ≥0.998 |
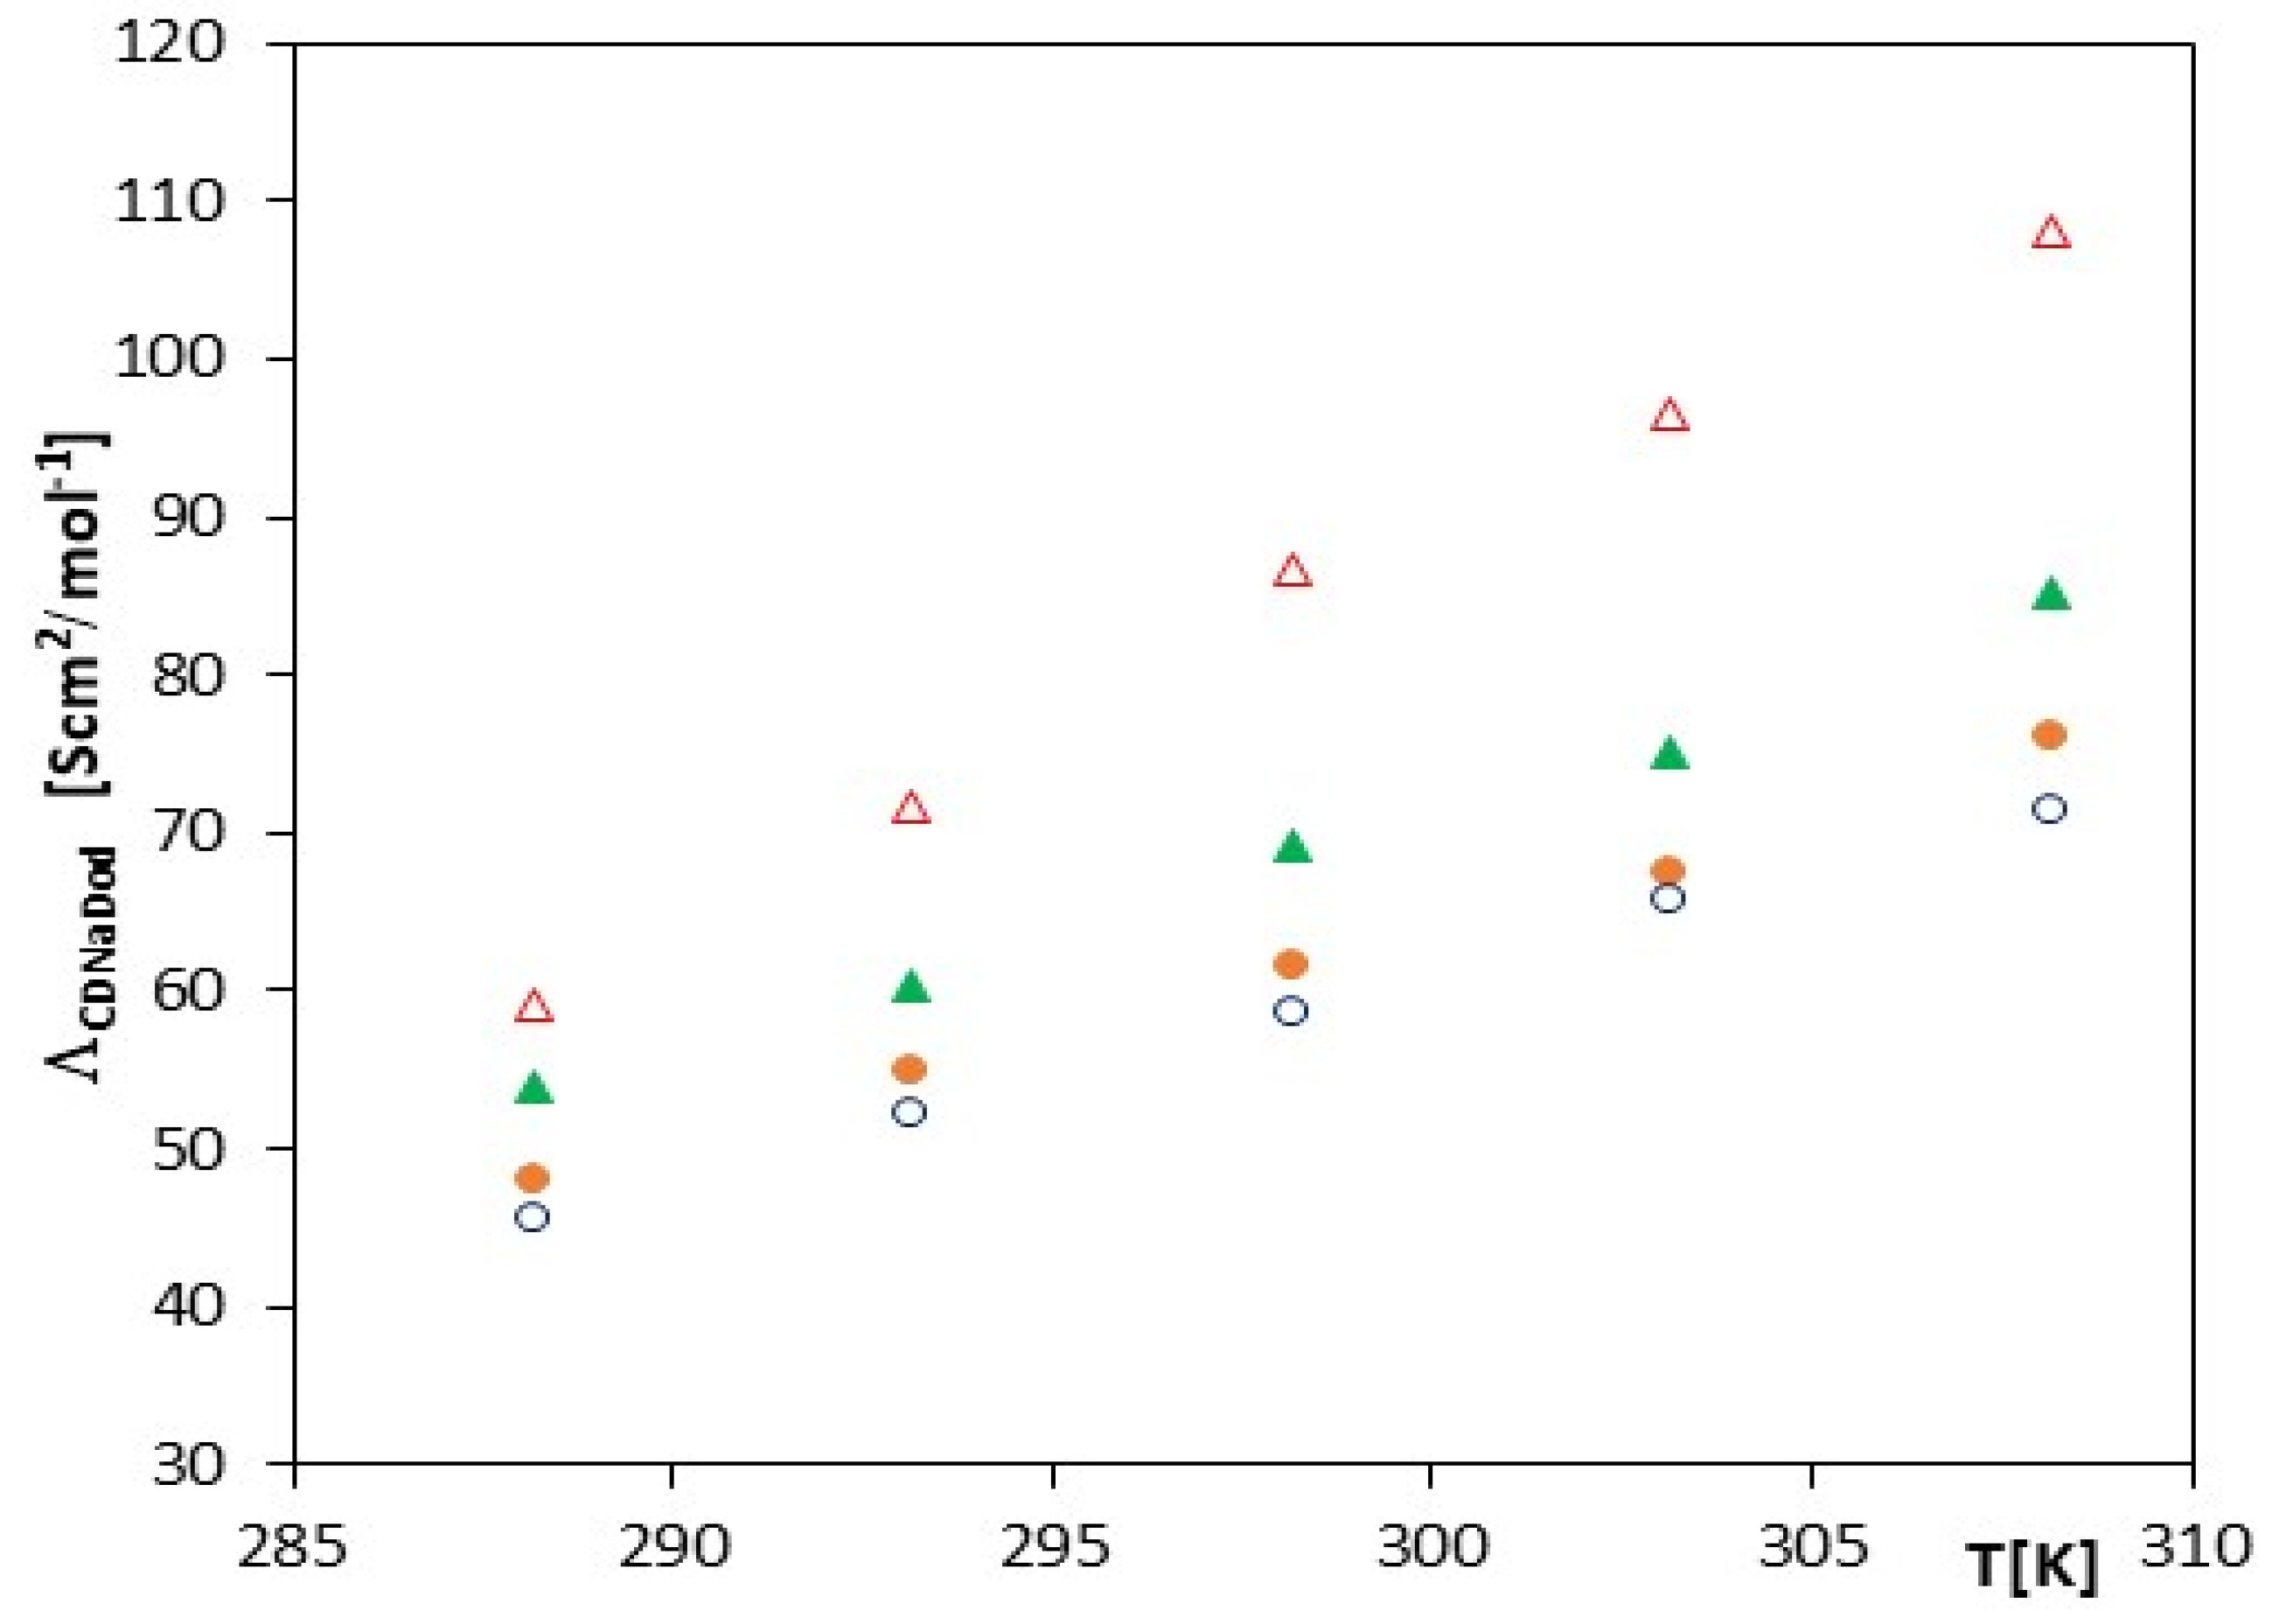
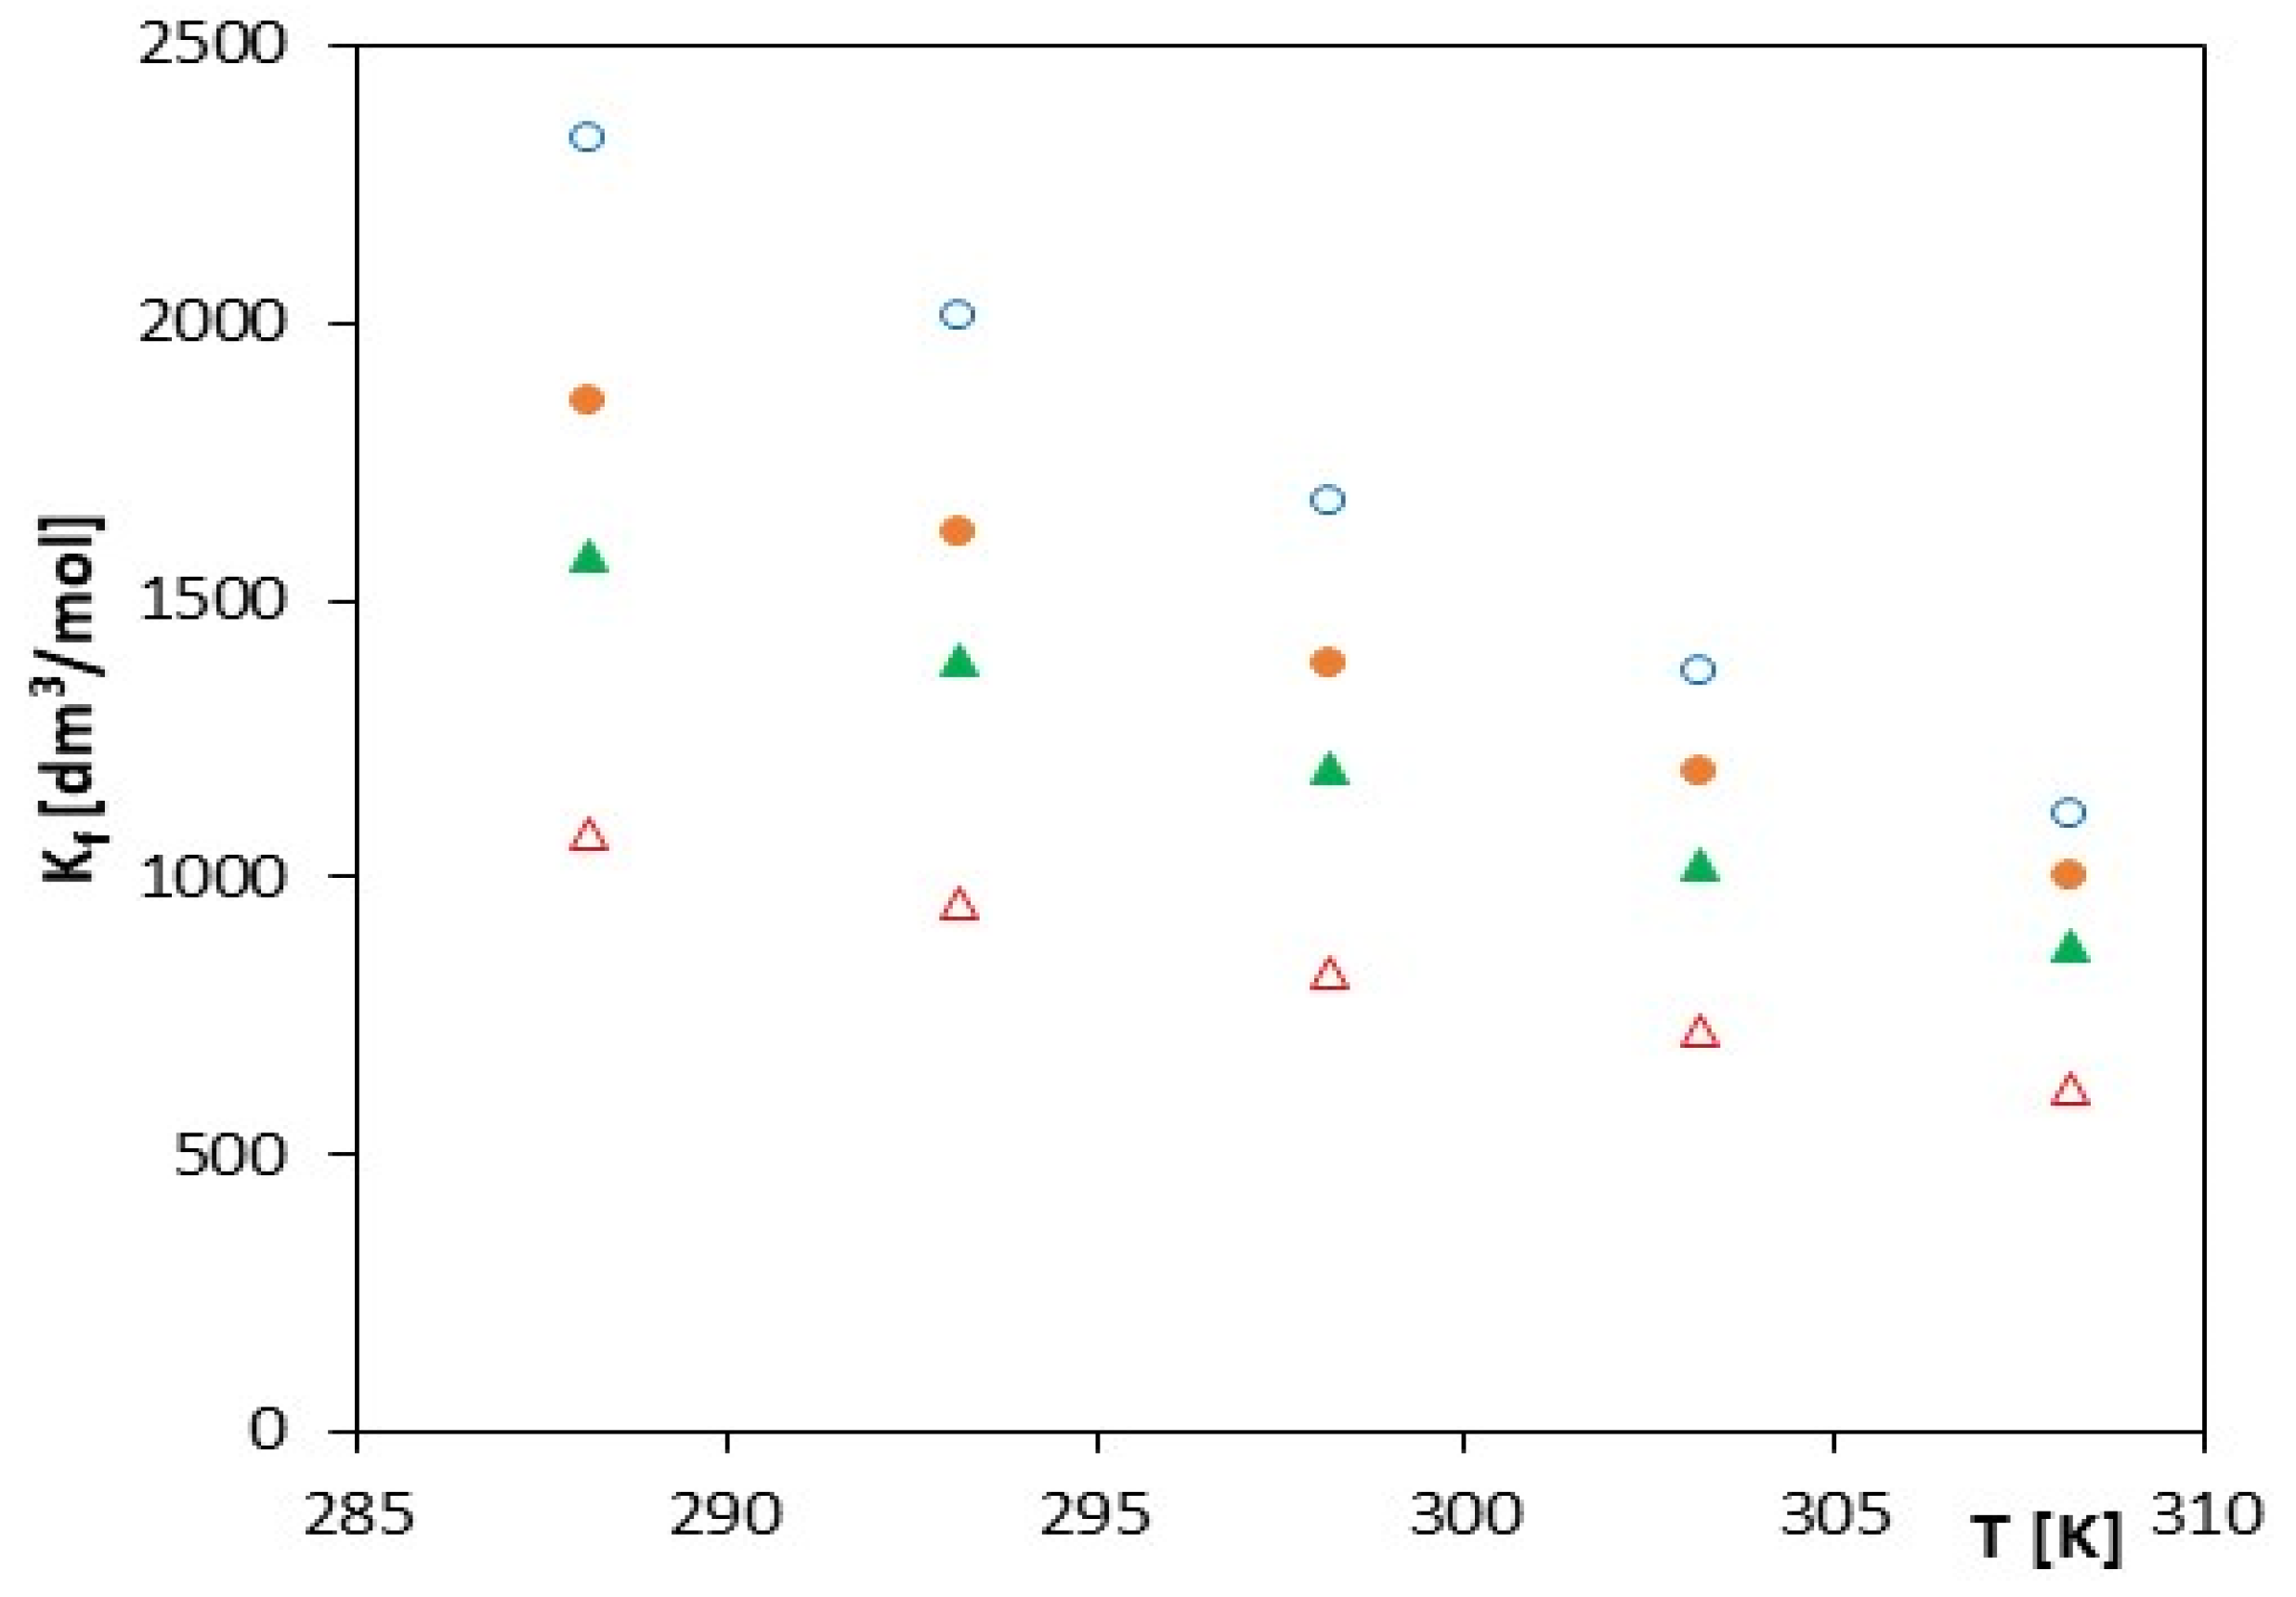
| T (K) | Kf (dm3/mol) | lnKf (dm3/mol) | ΛCDNaDod (S∙cm2/mol−1) | (J∙mol−1) | (J∙mol−1∙K−1) | (J∙mol−1) | σ (Λ) |
|---|---|---|---|---|---|---|---|
| 288.15 | 1080 ± 7 | 6.9847 | 59.23 ± 0.01 | −16,733 | −0.8350 | −16,974 | 0.03 |
| 293.15 | 955 ± 3 | 6.8617 | 71.73 ± 0.01 | −16,724 | −7.0270 | −18,784 | 0.02 |
| 298.15 | 830 ± 2 | 6.7214 | 86.62 ± 0.02 | −16,661 | −13.2190 | −20,602 | 0.01 |
| 303.15 | 720 ± 2 | 6.5793 | 96.67 ± 0.01 | −16,582 | −19.4110 | −22,467 | 0.01 |
| 308.15 | 620 ± 0.9 | 6.4297 | 108.24 ± 0.01 | −16,473 | −25.6030 | −24,362 | 0.02 |
| T (K) | Kf (dm3/mol) | lnKf (dm3/mol) | ΛCDNaDod (S∙cm2/mol−1) | (J∙mol−1) | (J∙mol−1∙K−1) | (J∙mol−1) | σ (Λ) |
|---|---|---|---|---|---|---|---|
| 288.15 | 1583 ± 5 | 7.3671 | 54.04 ± 0.01 | −17,649 | −1.4670 | −18,072 | 0.01 |
| 293.15 | 1395 ± 3 | 7.2406 | 60.44 ± 0.01 | −17,647 | −8.2319 | −20,060 | 0.02 |
| 298.15 | 1197 ± 2 | 7.0876 | 69.12 ± 0.01 | −17,569 | −14.9970 | −22,040 | 0.02 |
| 303.15 | 1025 ± 2 | 6.9324 | 75.12 ± 0.01 | −17,472 | −21.7620 | −24,070 | 0.01 |
| 308.15 | 877 ± 0.8 | 6.7765 | 85.12 ± 0.01 | −17,361 | −28.5270 | −26,152 | 0.02 |
| T (K) | Kf (dm3/mol) | lnKf (dm3/mol) | ΛCDNaDod (S∙cm2/mol−1) | (J∙mol−1) | (J∙mol−1∙K−1) | (J∙mol−1) | σ (Λ) |
|---|---|---|---|---|---|---|---|
| 288.15 | 1860 ± 8 | 7.5283 | 47.97 ± 0.02 | −18,035 | −2.3946 | −18,725 | 0.02 |
| 293.15 | 1620 ± 6 | 7.3902 | 54.96 ± 0.01 | −18,012 | −9.3336 | −20,748 | 0.02 |
| 298.15 | 1386 ± 2 | 7.2342 | 61.50 ±0.02 | −17,932 | −16.2726 | −22,784 | 0.01 |
| 303.15 | 1192 ± 1 | 7.0834 | 67.54 ± 0.01 | −17,853 | −23.2116 | −24,889 | 0.02 |
| 308.15 | 1004 ± 1 | 6.9117 | 76.13 ± 0.01 | −17,708 | −30.1506 | −26,999 | 0.01 |
| T (K) | Kf (dm3/mol) | lnKf (dm3/mol) | ΛCDNaDod (S∙cm2/mol−1) | (J∙mol−1) | (J∙mol−1∙K−1) | (J∙mol−1) | σ(Λ) |
|---|---|---|---|---|---|---|---|
| 288.15 | 2335 ± 4 | 7.7558 | 45.68 ± 0.01 | −18,580 | −5.5348 | −20,175 | 0.02 |
| 293.15 | 2010 ± 3 | 7.6059 | 52.23 ± 0.02 | −18,537 | −18.1488 | −23,858 | 0.01 |
| 298.15 | 1680 ± 1 | 7.4265 | 58.67 ± 0.01 | −18,409 | −30.7628 | −27,581 | 0.01 |
| 303.15 | 1370 ± 1 | 7.2226 | 65.68 ± 0.01 | −18,204 | −43.3768 | −31,353 | 0.03 |
| 308.15 | 1116 ± 1 | 7.0175 | 71.52 ± 0.01 | −17,979 | −55.9908 | −35,232 | 0.02 |
Publisher’s Note: MDPI stays neutral with regard to jurisdictional claims in published maps and institutional affiliations. |
© 2022 by the authors. Licensee MDPI, Basel, Switzerland. This article is an open access article distributed under the terms and conditions of the Creative Commons Attribution (CC BY) license (https://creativecommons.org/licenses/by/4.0/).
Share and Cite
Kinart, Z.; Tomaš, R. Studies of the Formation of Inclusion Complexes Derivatives of Cinnamon Acid with α-Cyclodextrin in a Wide Range of Temperatures Using Conductometric Methods. Molecules 2022, 27, 4420. https://doi.org/10.3390/molecules27144420
Kinart Z, Tomaš R. Studies of the Formation of Inclusion Complexes Derivatives of Cinnamon Acid with α-Cyclodextrin in a Wide Range of Temperatures Using Conductometric Methods. Molecules. 2022; 27(14):4420. https://doi.org/10.3390/molecules27144420
Chicago/Turabian StyleKinart, Zdzisław, and Renato Tomaš. 2022. "Studies of the Formation of Inclusion Complexes Derivatives of Cinnamon Acid with α-Cyclodextrin in a Wide Range of Temperatures Using Conductometric Methods" Molecules 27, no. 14: 4420. https://doi.org/10.3390/molecules27144420