
Antioxidant and Antimicrobial Activities of Erodium arborescens Aerial Part Extracts and Characterization by LC-HESI-MS2 of Its Acetone Extract

 ,
,  and
and
Abstract
:1. Introduction
2. Results and Discussions
2.1. Extraction
2.2. Chemical Composition
2.3. Antioxidant Activity
2.3.1. Radical-Scavenging Activity (DPPH) Assay
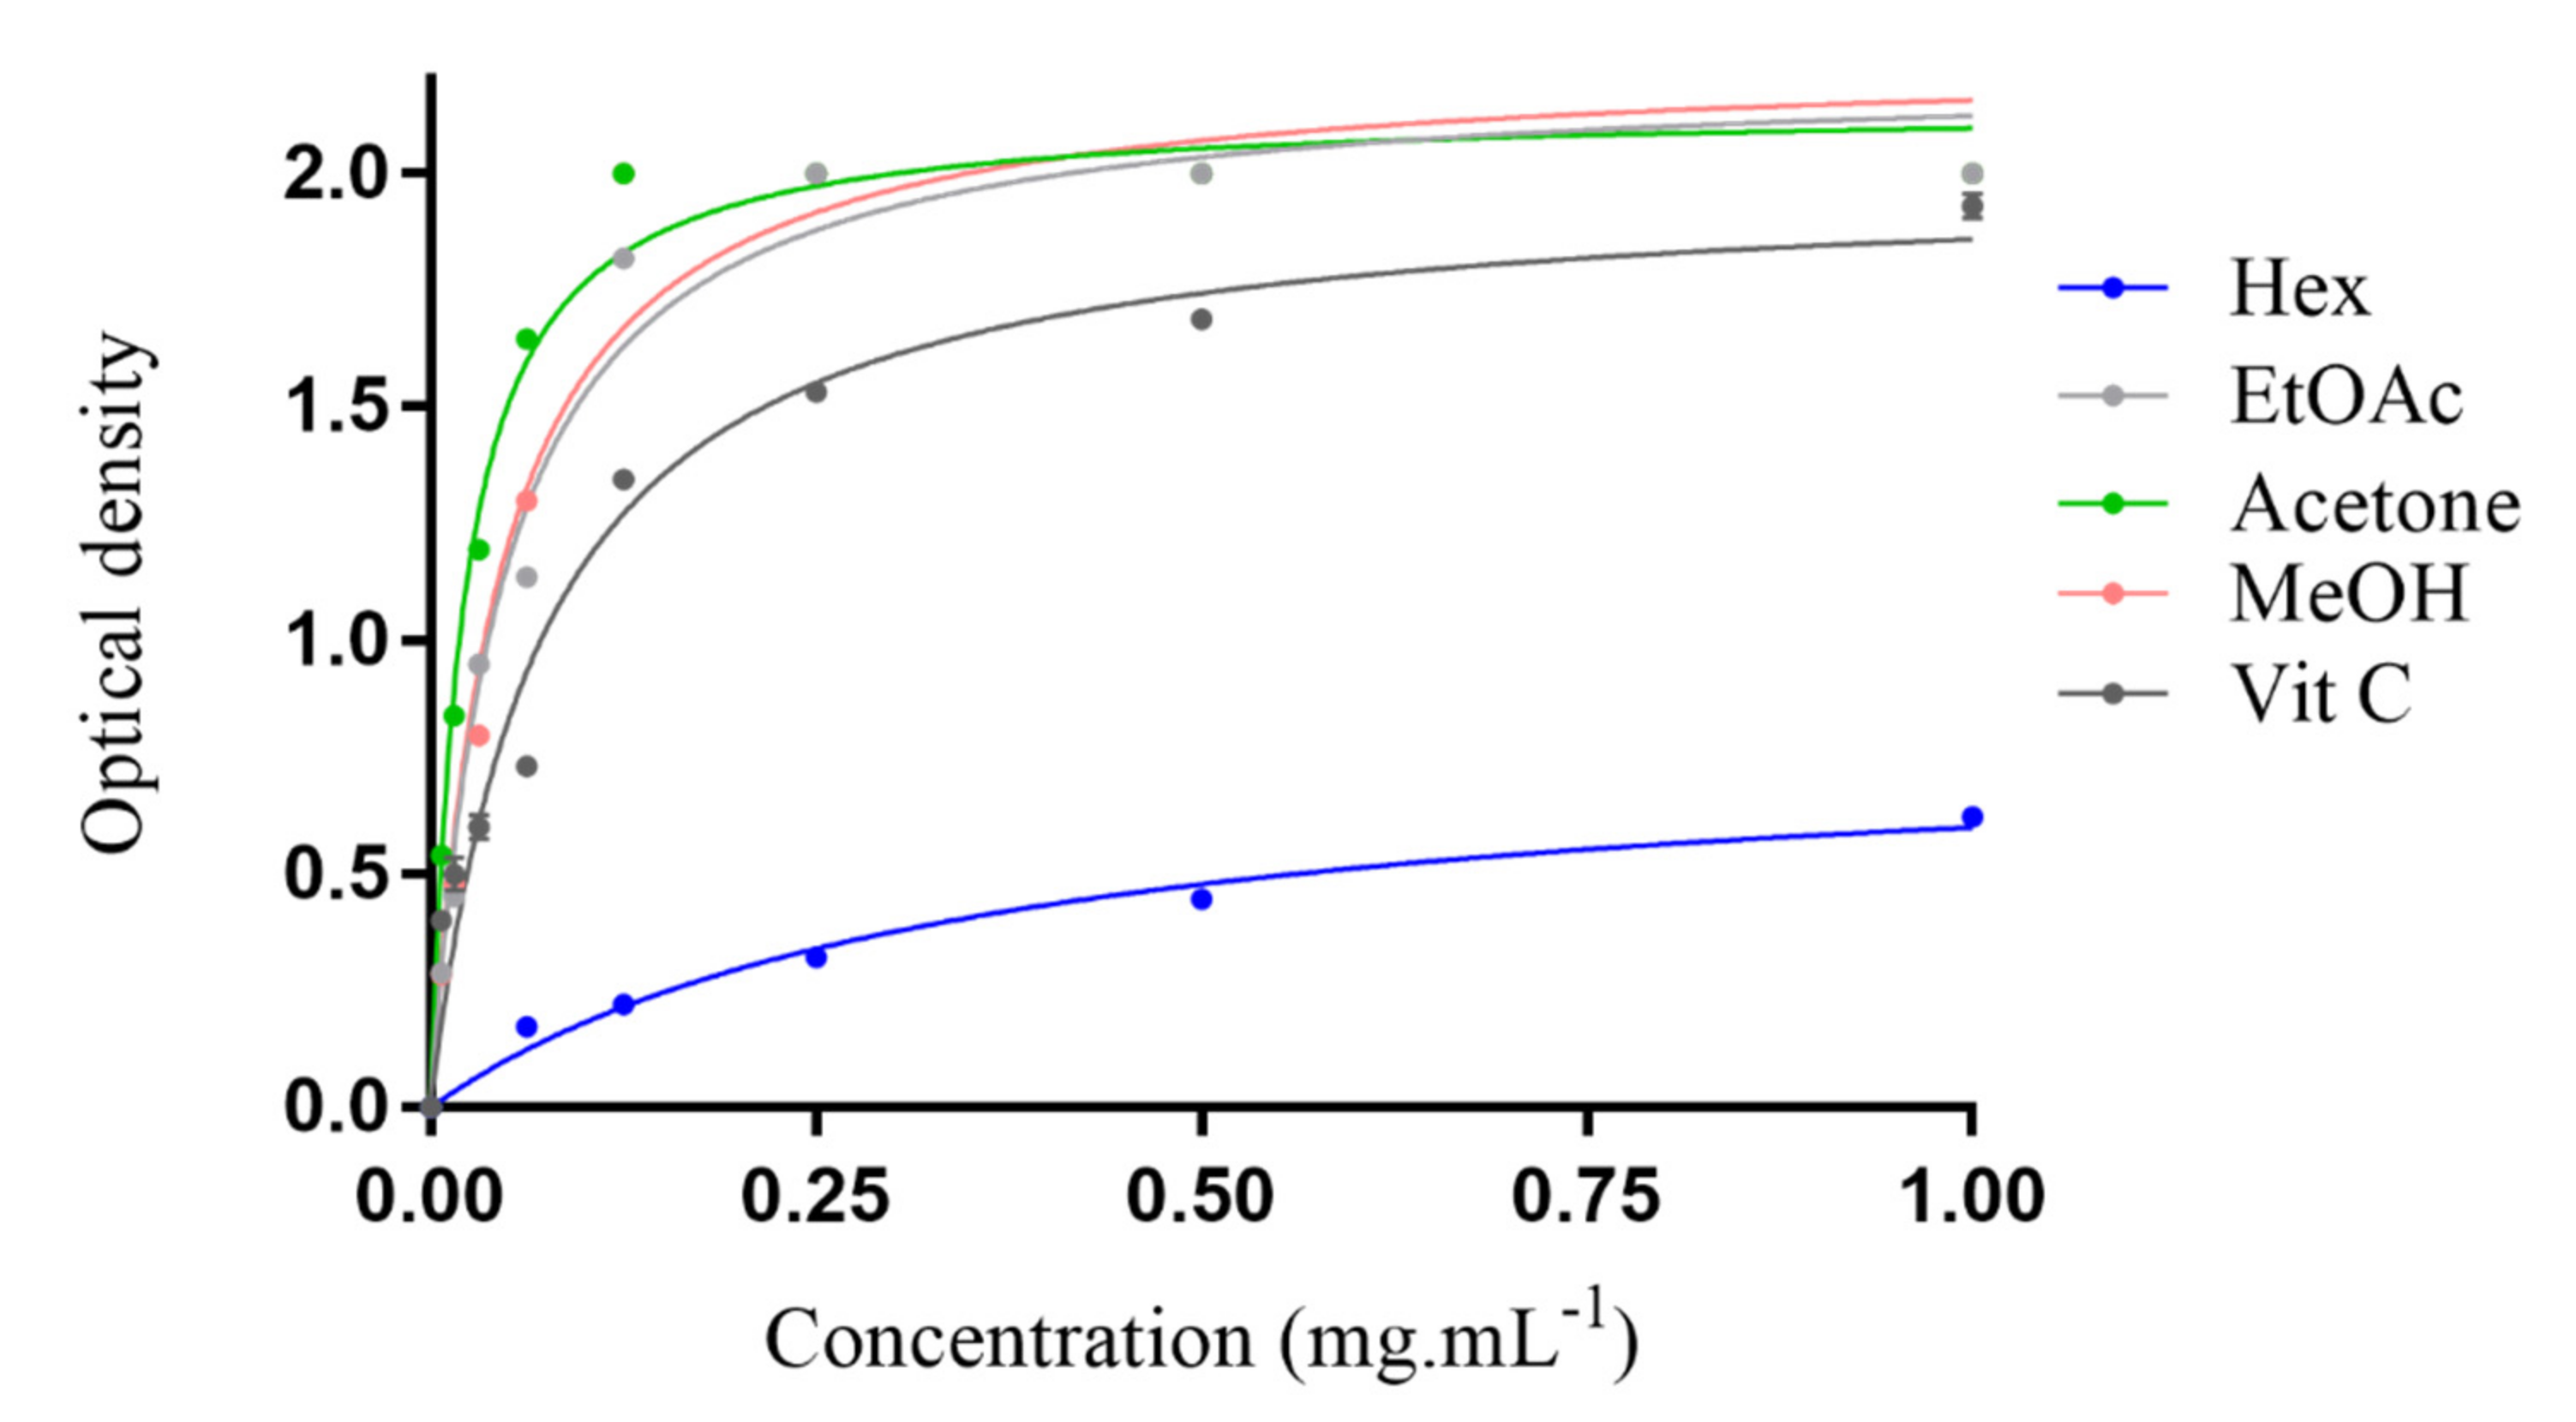
2.3.2. Ferric Reducing Antioxidant Power (FRAP)
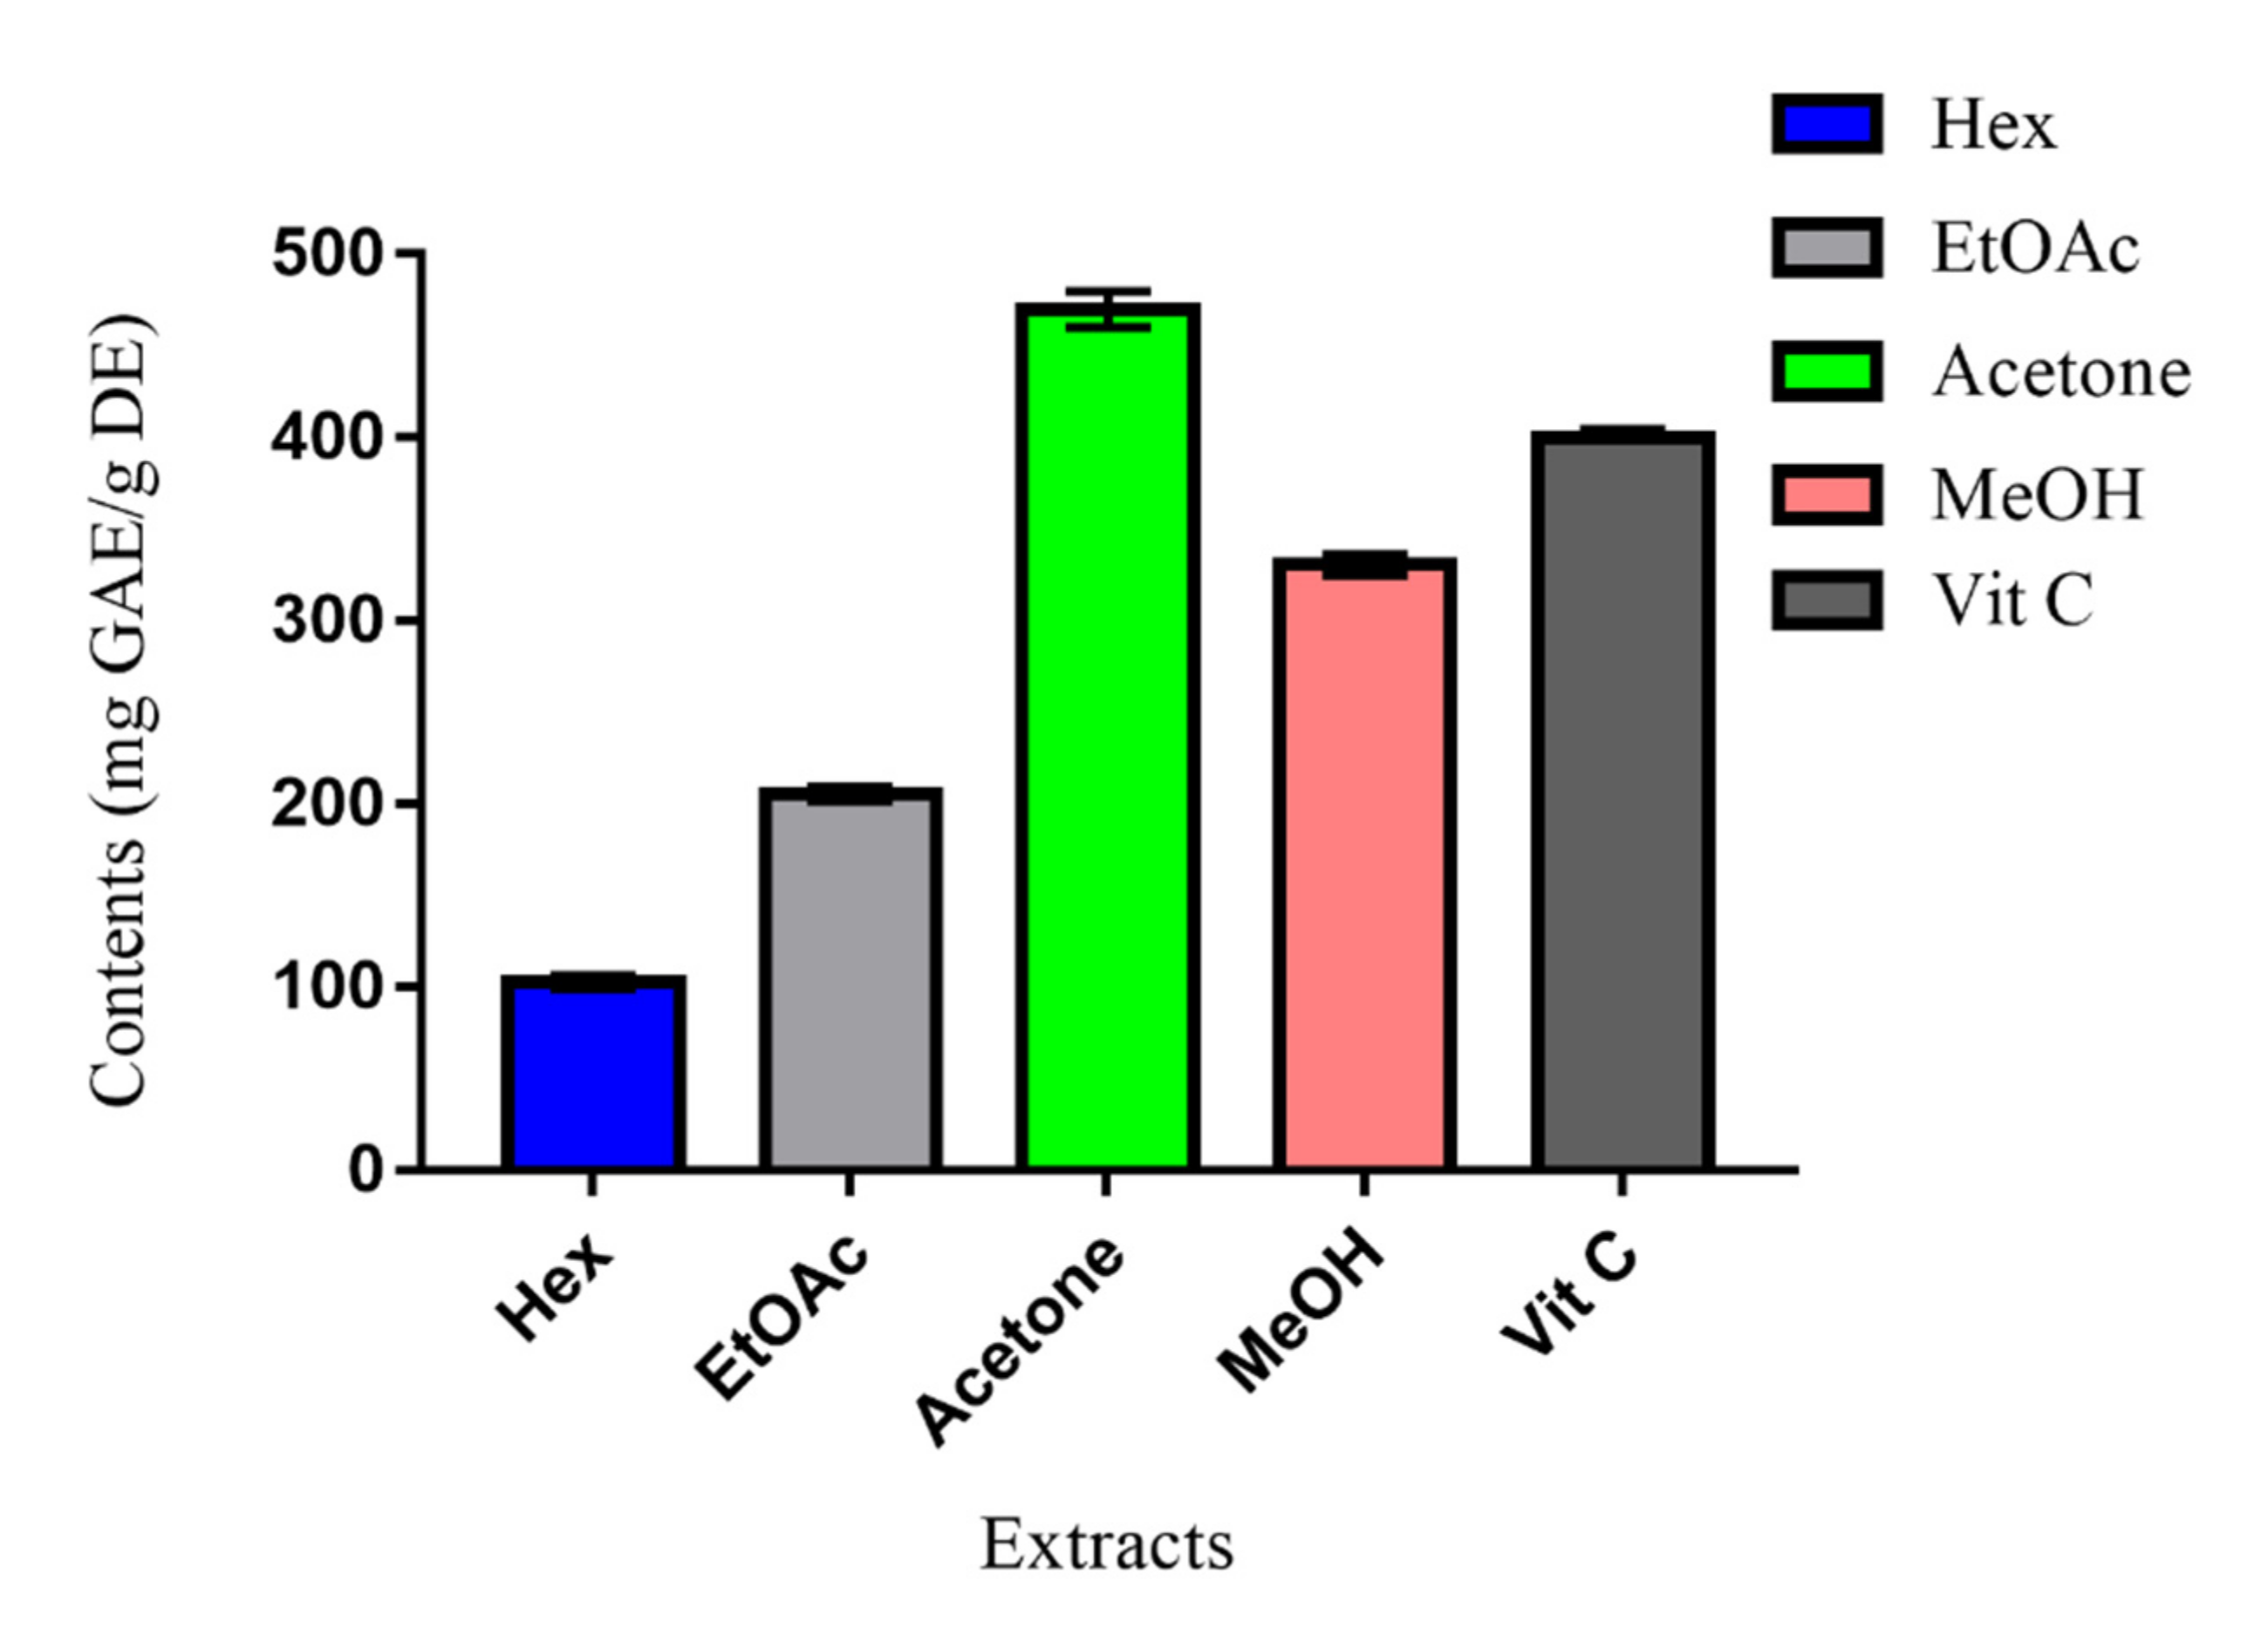
2.3.3. Total Antioxidant Activity
2.4. Correlations between TFC, TPC and Antioxidant Activity
2.5. Antimicrobial Activity
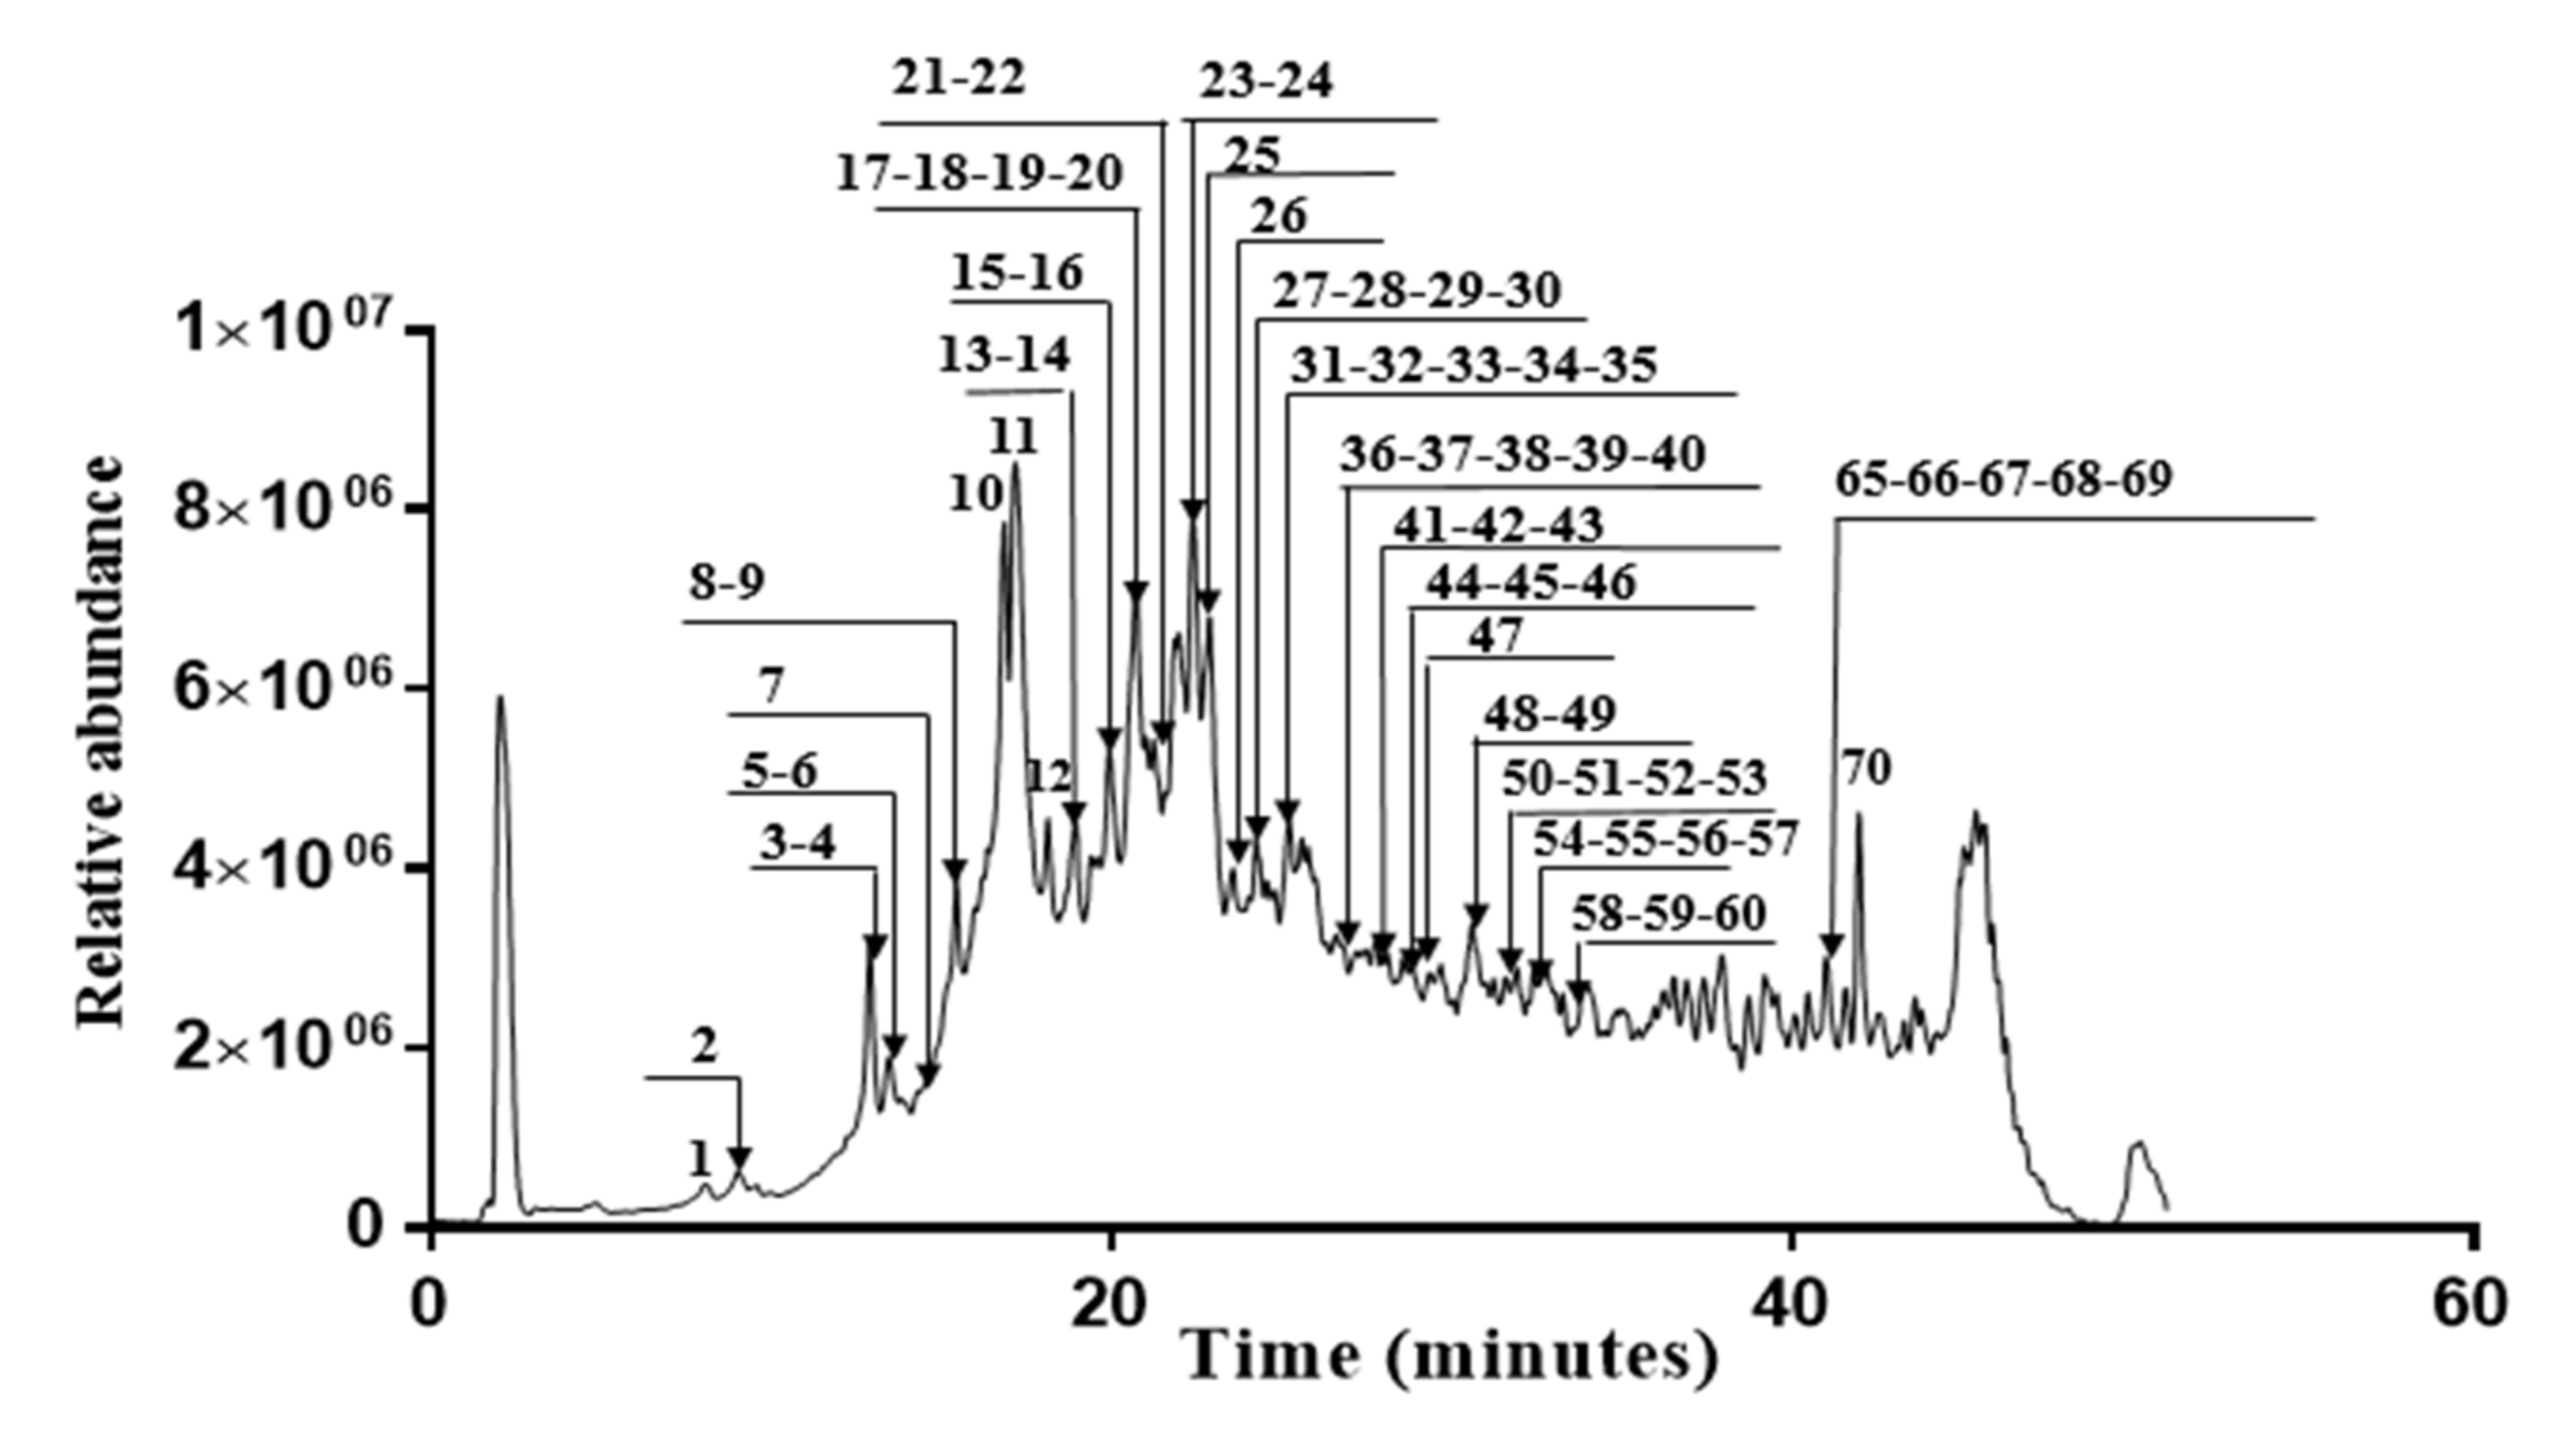
2.6. Identification of Polyphenols in Acetone Extract
2.6.1. Characterization of Ellagitannins
- The precursor ion at m/z 495 of peak 4 detected at TR = 12.88 min was consistent with the presence of 3,5-di-O-galloylquinic acid [26]. The fragmentation of this precursor ion produced ions at m/z 343 due to the loss of galloyl moiety and at m/z 325 due to the elimination of a gallic acid molecule.
- Peak 1 gave the deprotonated molecule [M-H]−/z 169 at TR = 8.08 min. The major and only fragment was m/z 125 [M-CO2-H]− corresponding to the loss of a carbon dioxide moiety [28].
- Peak 11 mass spectrum shows an ion at m/z 951 [M-H]− at TR = 17.20 min and, on the basis of the fragmentation pattern and literature data, it was identified as Geraniin [29]. Its MS2 spectrum yielded fragments at m/z 933 due to dehydration [M-H-18], at m/z 479 due to a loss of HHDP-galloyl moiety and finally at m/z 301 corresponding to ellagic acid.
- Corilagin at peak 10 has been already well characterized in previous studies [27]. This compound is a complex ellagitannin containing glucose, gallic acid and HHDP. Corilagin was detected in the TIC chromatogram at TR = 16.84 min. Its precursor [M-H]− was m/z 633 which gave two main fragments at m/z 463 and 301 due to consecutive losses of gallic acid and galloyl, supporting the identity of this compound.
- Peak 9 had the precursor ion m/z 247 at TR = 15.51 min and has been tentatively proposed as brevifolin carboxylate [30]. The product ion at m/z 219 may result from the cleavage of the ester bond and subsequent loss of the CO group from brevifolin carboxylate.
- Another peak 16 was proposed as methyl brevifolin carboxylate [27] with a molecular ion m/z 305 at TR = 19.93 min. Its MS2 spectrum showed a fragment ion at m/z 273, suggesting the loss of CH3OH.
- Peak 19 was observed with m/z 953 [M-H]− at TR = 20.36 min and the following fragmentations were: m/z 935 (dehydration), m/z 633 (loss of HHDP group), m/z 463 (combined losses of HHDP and galloyl groups) and m/z 301 (HHDP residue). It can be ascribed, however, to geraniinic acid A [31].
- Peak 26, generating a molecular ion [M-H]− at m/z 983, was eluted at TR = 23.80 min and gave one fragment at m/z 633, indicating the presence of a corilagin unit. It also showed fragments at m/z 939 due to the loss of CO2, and at m/z 769 due to the loss of gallic acid. Based on fragmentation data, this compound was tentatively identified as a corilagin derivative.
- Peak 36 at TR = 26.08 min can be identified as punicatannin A/B [32]. This identification was confirmed due to its pseudo molecular ion m/z 997. The MS2 spectrum of this compound product ions at m/z 633 and 301 supported the existence of a corilagin unit.
- Peak 14 has a molecular ion [M H]− at m/z 925 at TR = 18.94 min, which is tentatively assigned to phyllanthusiin C [33], whereas the product fragment at m/z 907 is due to water loss, which produced the fragment at m/z 605 after the further loss of HDDP. The fragment at m/z 435 is the result of the removal of a galloyl group. The peak at m/z 301 shows the ionized HDDP unit.
- Another peak 15 corresponding to phyllanthusiin G [34] with a deprotonated ion [M-H]− at m/z 969 at TR = 19.37 min was detected. The MS2 spectra generated fragments at m/z 925 due to the loss of CO2 and at m/z 633 which indicated the presence of a corilagin unit. The aglycone fragment at m/z 301 confirms the presence of an ellagic acid. Typical losses during fragmentation are galloyl (152 amu), HHDP (302 amu), galloyl glucose (332 amu), HHDP glucose (482 amu) and galloyl-HHDP-glucose (634 amu) [35].
- A precursor ion m/z 987 (peak 39) at TR = 26.67 min was fragmented to give an intense fragment at m/z 955 by losing a CH3OH unit (−32 amu), and a fragment at m/z 653 by removing a HHDP unit. After sequential removal of gallic acid (−170 amu), the remaining fragment was HHDP glucose (m/z 483). Based on these fragmentations, we note that compound 39 has the same base molecule as ellagitannins and it was thus suggested as an ellagitannin derivative.
- Peak 35 at TR = 25.98 min exhibited an ion [M-H]− at m/z 965. Its MS2 spectrum shows produced fragments at m/z 933 and m/z 795 due to the loss of water and gallic acid moieties, respectively, and one major fragment at m/z 301 which is typical for castalagin [36]. Based on its MS2 spectrum, this compound was identified as a castalagin derivative.
2.6.2. Characterization of Flavonoids
- Peaks 33 and 55 have mono-charged molecular ion m/z 271 at TR = 25.74 and 32.76 min, respectively. Their MS2 gave fragments at m/z 151 and m/z 165 produced through retro Diels-Alder reactions by breaking two C-C bonds of the C-ring, which gave structurally informative ions of A-ring and B-ring. However, it should be noted that the two compounds exhibited significantly different retention times. According to these findings, it may be possible to attribute these two compounds to isomeric forms of naringenin [37].
- Peak 20 exhibited the [M-H]− ion at m/z 595 at TR = 20.69 min with its MS2 fragment at m/z 343 due to a loss of a pentose (−132 amu) and a part of hexose moiety (−120 amu), and another fragment at m/z 301 completing the loss of hexose, indicating that this compound is a quercetin diglycoside [30].
- Peak 54 at TR = 32.61 min, obtained with a molecular ion at m/z 301, corresponds to quercetin aglycone [37]. Its MS2 spectrum gave fragments at m/z 273 and 257, due to consecutive losses of CO and CO2, respectively. Fragments at m/z 179 and m/z 151 resulted from breaking two C-C of C-ring, retro cyclisation and the loss of CO, respectively.
- Peak 31 was identified to kaempferol-O-glucoside [38]. Its MS2 spectrum gave fragments 327 [M-H-120]− and 285 [M-H-162]−.
- Peak 46 had a quasi-molecular ion m/z 489 at TR = 28.89 min giving a fragment at m/z 285, probably owing to the removal of acetylhexoside group (204 amu). Kaempferol acetylhexoside [39] might be identified with this molecule. Despite the loss of the acetylhexoside group, which was the most predominant fragment, a small fragment at m/z 327 was also discovered. In agreement with this hypothesis, we can conclude that the m/z 327 fragment can be produced as a result of the sugar cleavage. Furthermore, the presence of a fragment at m/z 285 indicates the presence of the aglycone kaempferol.
- Peak 25 gave [M-H]− at m/z 579 at TR = 22.89 min. In its MS2 spectrum, the ion at m/z 285 [M-H-(162 + 132)]− was the only one observed, suggesting the presence of hexose and pentose moiety. This compound was attributed to kaempferol-O-pentosyl-O-hexoside [40].
- Peak 68 produced the deprotonated aglycone at m/z 315 at TR = 41.42 min. The characteristic product ions at m/z 300, 271, 255 and 227 led to its identification as isorhamnetin aglycone [41].
- Peak 29 produced a [M-H]− at m/z 623 at TR = 24.29 min. In its MS2 spectrum, a predominant fragment at m/z 315 [M-H-308]− was observed due to the loss of 308 amu (162 + 146) indicating that a hexose and a deoxyhexose are linked at the same position of the isorhamnetin aglycone. Isorhamnetin [42] as aglycone was confirmed by the presence of fragment at m/z 271.
- Isorhamnetin-O-glucuronide [43] was identified (peak 45) with a molecular ion m/z 491 at TR = 28.60 min. Its MS2 spectrum showed fragments at m/z 459 and 323, due to successive losses of CH3OH and glucuronide moiety, respctively. The loss of a glucuronic acid from the fragment at m/z 491 resulted in m/z 315 as the base peak.
- Peak 58 at TR = 33.28 min was proposed to be an isorhamnetin-O-pentosyl-hexoside [44] with m/z 609. Its MS2 showed a fragment at m/z 477 corresponding to the loss of pentoside [M-H-132]− and a fragment at m/z 315 which is the result of glucoside loss [M-H-132-162]−. The fragment at m/z 301 represents the loss of CH3.
- According to the fragmentation of [M-H]− ion at m/z 563 and the retention times 18.83 and 20.28 min, peaks 13 and 18 were identified as 6-C-arabinosyl-8-C-glucosyl apigenin [45]. Their MS2 data showed fragments at m/z 473 [M-H-90]− and 443 [M-H-120]−, indicating the presence of a C-hexosyl unit. Another fragment was observed at m/z 503 [M-H-60]− corresponding to the fragmentation of pentose. The base peak at m/z 473 [M-H-90]− and the high abundance of the fragment at m/z 503 [M-H-60]− revealed the presence of a 6-C-pentosyl unit.
- Peak 34 at TR = 25.89 min was identified as apigenin-O-hexoside [46] showing an [M-H]− ion at m/z 431. Its MS2 spectrum gave a fragment at m/z 269 typical to apigenin aglycone, after sequential loss of hexose unit.
- Peak 61 had a molecular ion at m/z 285 with TR = 37.29 min. Its MS2 spectrum showed exhibition of neutral losses of CO (m/z 257) and CO2 (m/z 241) probably owing to the C ring. Another neutral loss concerns the C2H2O (m/z 199), in which cleavage occurs mainly on the C ring followed by a new cyclization implying the B ring. Moreover, the presence of a fragment at m/z 175 results from the losses of C3O2 then C2H2O, and supports the C-ring-localized cleavage for the C2H2O loss from the [M-H]− ion. This pattern of fragmentation is in concordance with that of luteolin [37].
- Peak 28 at TR= 24.23 min showing m/z 593 was identified as luteolin-O-rutinoside [47]. Its MS2 spectrum produced an ion at m/z 285, characteristic of the aglycone (luteolin) and due to a loss of hexoside and pentoside units.
- Peak 70 had a molecular ion at m/z 313 at TR = 41.95 min. Its MS2 spectrum gave a major ion at m/z 298, corresponding to luteolin genine. This compound was suggested as dimethoxyluteolin [48].
- Peak 49 showed [M-H]− at m/z 283 at TR = 30.60 min which yielded only a predominant fragment at m/z 239 due to a loss of CH3 and owing to the formation of a very stable anion radical structure. This phenolic compound was described previously and attributed to acacetin [41].
2.6.3. Characterization of Other Phenolic Compounds
- Peak 2 exhibited a molecular ion at m/z 325 and has been tentatively proposed as galloyl shikimic acid [49]. The MS2 spectrum of this compound generated a fragment at m/z 169, corresponding to the loss of shikimate moiety and the appearance of gallic acid.
- Peak 5 at TR = 13.42 min was identified as dihydroxyl glucosyl cyclohexane [50] with a molecular ion at m/z 293 and MS2 fragments at m/z: 173 [M-H-120]− (fragmentation in position 1–4 of the glycoside), 131 [M-H-C2H2O−] (the rest of sugar moiety) and 113 [M-H-18]− (dehydration), respectively.
- Peak 6 (TR = 13.69 min) assigned to a galloyl ester [51] generated a molecular ion at m/z 605. Its MS2 spectrum revealed a major fragment at m/z 453 [M-H-152]− (loss of galloyl) and a minor fragment at m/z 291 [M-H-162]− (loss of hexoside).
- Another peak 16 was proposed as methyl brevifolincarboxylate [27] at m/z 305. Its MS2 spectrum showed a fragment at m/z 273 suggesting the loss of CH3OH.
- Peaks 62 and 64 presented a molecular ion m/z 329 at TR = 39.54 and 39.83 min, respectively, and their MS2 fragment ions were m/z 311, 293, 229, 211, 171. Comparing with published data, these two compounds were identified as tricin. It is worth noting that these two compounds appeared at two different retention times, which allow us to suggest that they are two isomers of tricin [52].

| Retention Time TR(Min) | Area (%) | [M-H]− | MS2 | Structure | Reference | |
|---|---|---|---|---|---|---|
| 1. | 8.08 | 0.04 | 169 | 125 | Gallic acid | [28] |
| 2. | 9.05 | 0.34 | 325 | 307/281/169(100)/125 | Galloyl shikimic acid I | [49] |
| 3. | 12.23 | 0.25 | 357 | 169(100)/125 | Unknown gallotannin | [54] |
| 4. | 12.88 | 1.51 | 495 | 343(100)/325 | 3,5-di-O-galloyl quinic acid | [26] |
| 5. | 13.42 | 1.66 | 293 | 131(100)/113/101 | Dihydroxyl glucosyl cyclohexane | [50] |
| 6. | 13.69 | 0.37 | 605 | 453(100)/435/393/291/273/247 | Galloyl ester | [51] |
| 7. | 14.55 | 0.51 | 631 | 613(100)/603/461 | Unidentified | |
| 8. | 15.47 | 2.19 | 291 | 247 | Brevifolin carboxylic acid | [31] |
| 9. | 15.51 | 2.181 | 247 | 247(100)/219 | Brevifolin carboxylate | |
| 10. | 16.84 | 10.28 | 633 | 463/301(100)/275 | Corilagin | [27] |
| 11. | 17.20 | 15.46 | 951 | 933(100) | Geraniin | [27,29] |
| 12. | 18.14 | 1.94 | 1109 | 1049(100)/973/935 | Ascorgeraniin | [1] |
| 13. | 18.83 | 1.96 | 563 | 545/503/473/443(100)/383/353 | 6-C-arabinosyl-8-C-glucosyl apigenin | [45] |
| 14. | 18.94 | 2.33 | 925 | 907/605/435/301(100) | Phyllanthusiin B/C | [33] |
| 15. | 19.37 | 1.13 | 969 | 951/925(100)/895/877/755/633/301 | Phyllanthusiin G | [1,34] |
| 16. | 19.93 | 3.10 | 305 | 273 | Methyl brevifolin carboxylate | [27] |
| 17. | 20.07 | 1.36 | 739 | 593 | Kaempferol-O-hexosyl-dirhamnoside | [40] |
| 18. | 20.28 | 0.62 | 563 | 545/503/473/443(100)/383/353 | 6-C-arabinosyl-8-C-glucosyl apigenin | [45] |
| 19. | 20.36 | 1.21 | 953 | 935(100)/909/801/651/633/463/301 | Geraniinic acid | [1,31] |
| 20. | 20.69 | 1.15 | 595 | 343/301(100) | Quercetin-O-arabinopyranosyl-galactopyranoside | [30] |
| 21. | 21.01 | 2.76 | 769 | 623 | Isorhamnetin-glycosyl-dirhamnoside | [55] |
| 22. | 21.22 | 1.71 | 965 | 933(100)/613/301 | Castalagin derivative | [36] |
| 23. | 22.37 | 14.99 | 991 | 973/933(100)/907/825/689/519/353/301 | Castalagin derivative | |
| 24. | 22.70 | 3.22 | 907 | 755/737/633(100)/587/435/291 | HDDP-decarboxy-valoneoyl-glucoside | [31] |
| 25. | 22.89 | 5.59 | 579 | 285 | Kaempferol-O-pentosyl-O-hexoside | [40] |
| 26. | 23.80 | 0.29 | 983 | 965/939(100)/911/769/681/633/493/467/301 | Corilagin derivative | |
| 27. | 24.03 | 0.43 | 963 | 945/878/811(100)/793/605/435/291 | Unidentified | |
| 28. | 24.23 | 1.23 | 593 | 285 | Luteolin-O-rutinoside | [56] |
| 29. | 24.29 | 0.77 | 623 | 357/315(100)/300/271 | Isorhamnetin-O-rutinoside | [57] |
| 30. | 24,59 | 0.44 | 917 | 873/721/445/301(100) | Unidentified | |
| 31. | 25.23 | 1.78 | 447 | 327/285(100)/255 | Kaempferol-O-glucoside | [38] |
| 32. | 25.59 | 1.32 | 951 | 907/737/649/587/479/435/335/301(100) | Geraniinic acid B/C (HHDP-valoneoyl-glucoside isomer) | [31] |
| 33. | 25.74 | 0.65 | 271 | 177/165/151(100) | Naringenin | [37,58] |
| 34. | 25.89 | 0.75 | 431 | 269 | Apigenin-O-hexoside | [46] |
| 35. | 25.98 | 0.36 | 965 | 933/795(100)/301 | Castalagin derivatives | [36] |
| 36. | 26.08 | 0.16 | 997 | 633(100)/363/301 | Punicatannin A/B | [32] |
| 37. | 26.33 | 0.38 | 909 | 877/739/615/437/301(100) | Unidentified | |
| 38. | 26.59 | 0.32 | 553 | 509/401(100) | 2,3-dihydro biapigenin methyl ether | [59] |
| 39. | 26.67 | 0.24 | 987 | 955(100)/653/483/301 | Ellagitannin derivative | |
| 40. | 26.84 | 0.47 | 923 | 879/825/621/577/451/407/353/301(100) | Unidentified | |
| 41. | 27.48 | 0.43 | 521 | 331(100)/271 | Unidentified | |
| 42. | 27.75 | 0.35 | 965 | 921/795(100)/493/301 | Unidentified | |
| 43. | 27.99 | 0.14 | 539 | 377(100)/307/275 | Oleuropein | [60] |
| 44. | 28.18 | 0.25 | 1005 | 973/915/301(100) | Unidentified | |
| 45. | 28.60 | 0.54 | 491 | 459/323/315(100) | Isorhamnetin-O-glucuronide | [43] |
| 46. | 28.89 | 0.22 | 489 | 327/285 (100)/255 | Kaempferol acetyl-hexoside | [39] |
| 47. | 29.69 | 0.67 | 523 | 523(100)/361/313//271/169 | Unidentified | |
| 48. | 30.44 | 0.16 | 987 | 943/685/641/515/301(100) | Unidentified | |
| 49. | 30.60 | 0.66 | 283 | 283(100)/239 | Acacetin | [41] |
| 50. | 31.24 | 0.07 | 679 | 517(100)/355 | Polysaccharide: Glc1 → 4Hex1 → 6Hex1 → 6Hex | [61] |
| 51. | 31.55 | 0.26 | 299 | 299/284(100)/271/255/240 | Rhamnocitrin | [58] |
| 52. | 31.73 | 0.24 | 965 | 795/301(100) | Unidentified | |
| 53. | 31.92 | 0.70 | 565 | 550/337/193(100)/175 | Unidentified | |
| 54. | 32.61 | 0.43 | 301 | 301(100)/273/257/179/151 | Quercetin dehydrate | [37] |
| 55. | 32.76 | 0.17 | 271 | 177/151(100) | Naringenin | [37] |
| 56. | 32.85 | 0.20 | 473 | 455/379/269(100) | Unidentified | |
| 57. | 32.95 | 0.12 | 461 | 446/315(100) | Dimethyl ellagic acid pentoside | [39] |
| 58. | 33.28 | 0.24 | 609 | 477/315(100)/301 | Isorhamnetin-O-pentosyl-hexoside | [44] |
| 59. | 33.80 | 0.47 | 605 | 452(100)/329/271 | Unidentified | |
| 60. | 33.99 | 0.21 | 563 | 548/518/337/235/193(100)/175 | Unidentified | |
| 61. | 37.29 | 0.29 | 285 | 257/241(100)/199/189/175 | Luteolin | [37] |
| 62. | 39.54 | 0.04 | 329 | 311/293/229(100)/211/171 | Tricin | [52] |
| 63. | 39.69 | 0.10 | 301 | 301/283/257/191/151/137(100) | Ellagic acid | [48]] |
| 64. | 39.83 | 0.15 | 329 | 311/293/229(100)/211/171 | Tricin | [52] |
| 65. | 40.46 | 0.85 | 357 | 357/339/285/151/109 | Unidentified | |
| 66. | 41.00 | 0.79 | 282 | No fragmentation | Unidentified | |
| 67. | 41.28 | 0.18 | 441 | 371(100)/369 | Unidentified | |
| 68. | 41.42 | 0.14 | 315 | 315/300(100)/271 | Isorhamnetin | [41,48] |
| 69. | 41.59 | 0.69 | 299 | No fragmentation | Unidentified | |
| 70. | 41.95 | 2.42 | 313 | 313/298(100) | Dimethoxyluteolin | [48] |
3. Materials and Methods
3.1. Collection of Plant Material
3.2. Extraction
3.3. Chemical Composition
3.3.1. Determination of Total Phenolic Contents (TPC)
3.3.2. Determination of Total Flavonoid Contents (TF)
3.4. Antioxidant Activity
3.4.1. DPPH Antiradical Activity
- AAI < 0.5: poor antioxidant activity
- 0.5 ≤ AAI ≤ 1: moderate antioxidant activity
- 1.0 ≤ AAI ≤ 2.0: strong antioxidant activity
- AAI > 2.0: very strong antioxidant activity
- DPPH and IC50 are expressed in µg·mL−1.
3.4.2. Reducing Power Assay
3.4.3. Total Antioxidant Capacity
3.5. Analysis of Individual Phenolic Compounds by Analytical LC–HESI–MS
3.6. Antimicrobial Activity
3.6.1. Microorganisms, Media and Growth Conditions
3.6.2. Agar Well Diffusion Method
3.6.3. Minimum Inhibitory Concentrations (MICs)
4. Statistical Analysis
5. Conclusions
Author Contributions
Funding
Institutional Review Board Statement
Informed Consent Statement
Data Availability Statement
Acknowledgments
Conflicts of Interest
References
- Tuominen, A. Tannins and other polyphenols in Geranium sylvaticum: Identification, intraplant distribution and biological activity. In Turun Yliopiston Julkaisuja—Annales Universitatis Turkuensi; Yliopisto: Turku, Finland, 2017; Volume 569, ISBN 978-951-29-7050-6. ISSN 2343-3175. [Google Scholar]
- Cheynier, V.; Tomas-Barberan, F.A.; Yoshida, K. Polyphenols: From plants to a variety of food and nonfood uses. J. Agric. Food Chem. 2015, 63, 7589–7594. [Google Scholar] [CrossRef]
- Nikitina, V.S.; Kuz, L.Y.; Melent, A.I.; Shendel, G.V. Antibacterial activity of polyphenolic compounds isolated from plants of Geraniaceae and Rosaceae families. Appl. Biochem. Microbiol. 2007, 43, 629–634. [Google Scholar] [CrossRef]
- Chen, S.L.; Yu, H.; Luo, H.M.; Wu, Q.; Li, C.F.; Steinmetz, A. Conservation and sustainable use of medicinal plants: Problems, progress, and prospects. Chin. Med. 2016, 11, 37. [Google Scholar] [CrossRef] [PubMed] [Green Version]
- Naggar, S.M.E. Numerical taxonomy of the genus Erodium L’Hérit. (Geraniaceae) in Egypt. Feddes Repert. 1991, 7–8, 535–540. [Google Scholar] [CrossRef]
- Hadidi, M.E.; Fayed, A.A.; Naggar, S.E. Systematic revision of Erodium (Geraniaceae) in Egypt. Plant Syst. Evol. 1984, 144, 307–314. [Google Scholar] [CrossRef]
- Munekata, P.E.S.; Alcántara, C.; Collado, M.C.; Garcia-Perez, J.V.; Saraiva, J.A.; Lopes, R.P.; Barbae, F.J.; Silva, L.d.P.; Sant’Ana, A.S.; Fierro, E.M.; et al. Ethnopharmacology, phytochemistry and biological activity of Erodium species: A review. Food Res. Int. 2019, 126, 108659. [Google Scholar] [CrossRef]
- Sultana, B.; Anwar, F.; Ashraf, M. Effect of extraction solvent/technique on the antioxidant activity of selected medicinal plant extracts. Molecules 2009, 14, 2167–2180. [Google Scholar] [CrossRef]
- Yeddes, N.; Chérif, J.K.; Guyot, S.; Sotin, H.; Ayadi, M.T. Comparative study of antioxidant power, polyphenols, flavonoids and betacyanins of the peel and pulp of three Tunisian Opuntia forms. Antioxidants 2013, 2, 37–51. [Google Scholar] [CrossRef] [Green Version]
- Singh, R.; Singh, S.; Kumar, S.; Arora, S. Evaluation of antioxidant potential of ethyl acetate extract/fractions of Acacia auriculiformis A. Cunn. Food Chem. Toxicol. 2007, 45, 1216–1223. [Google Scholar] [CrossRef]
- Firuzi, O.; Lacanna, A.; Petrucci, R.; Marrosu, G.; Saso, L. Evaluation of the antioxidant activity of flavonoids by “ferric reducing antioxidant power” assay and cyclic voltammetry. Biochim. Biophys. Acta Gen. Subj. 2005, 1721, 174–184. [Google Scholar] [CrossRef]
- Mustafa, Ö.; Mustafa, B.; Kubilay, G.; Reşat, A. Antioxidant/antiradical properties of microwave-assisted extracts of three wild edible mushrooms. Food Chem. 2014, 157, 323–331. [Google Scholar] [CrossRef]
- Bouzayani, B.; Koubaa, I.; Frikha, D.; Samet, S.; Ben Younes, A.; Chawech, R.; Maalej, S.; Allouche, N.; Mezghani Jarraya, R. Spectrometric analysis, phytoconstituents isolation and evaluation of in vitro antioxidant and antimicrobial activities of Tunisian Cistanche violacea (Desf). Chem. Pap. 2022, 76, 3031–3050. [Google Scholar] [CrossRef]
- Goebel, W.; Gonza, B.; Domi, G.; De Patoge, G. The objectives of the business intelligence project inetSoft webinar clin. Microbiol. Rev. 2013, 14, 584–640. [Google Scholar] [CrossRef]
- Jarraud, S. Relationships between Staphylococcus aureus genetic background, virulence factors, agr groups (alleles), and human disease. Infect. Immun. 2002, 70, 631–641. [Google Scholar] [CrossRef] [Green Version]
- Moradali, M.F.; Ghods, S.; Rehm, B.H.A. Pseudomonas aeruginosa lifestyle: A paradigm for adaptation, survival, and persistence. Front. Cell. Infect. Microbiol. 2017, 7, 39. [Google Scholar] [CrossRef] [Green Version]
- John, E.D.M.; Crump, A.; Luby, S.P. The global burden of typhoid fever. Bull. World Health Organ. 2004, 82, 346–353. [Google Scholar] [CrossRef]
- Kaper, J.B.; Nataro, J.P.; Mobley, H.L.T. Pathogenic Escherichia coli. Nat. Rev. Microbiol. 2004, 2, 123–140. [Google Scholar] [CrossRef]
- Kim, J.; Sudbery, P. Candida albicans, a major human fungal pathogen. J. Microbiol. 2011, 49, 171–177. [Google Scholar] [CrossRef]
- Doerrler, W.T. Lipid trafficking to the outer membrane of Gram-negative bacteria. Mol. Microbiol. 2006, 60, 542–552. [Google Scholar] [CrossRef]
- El-Chaghaby, G.A.; Ahmad, A.F.; Ramis, E.S. Evaluation of the antioxidant and antibacterial properties of various solvents extracts of Annona squamosa L. leaves. Arab. J. Chem. 2014, 7, 227–233. [Google Scholar] [CrossRef] [Green Version]
- Nikaido, H.; Vaara, M. Molecular basis of bacterial outer membrane permeability. Microbiol. Rev. 1985, 49, 1–32. [Google Scholar] [CrossRef]
- Adesina, S.K.; Idowu, O.; Ogundaini, A.O.; Oladimeji, H.; Olugbade, T.A.; Onawunmi, G.O.; Pais, M. Antimicrobial constituents of the leaves of Acalypha wilkesiana and Acalypha hispida. Phytother. Res. 2000, 14, 371–374. [Google Scholar] [CrossRef]
- Li, N.; Luo, M.; Fu, Y.; Zu, Y.; Wang, W.; Zhang, L.; Yao, L.P.; Zhao, C.J.; Sun, Y. Effect of corilagin on membrane permeability of Escherichia coli, Staphylococcus aureus and Candida albicans. Phytother. Res. 2012, 27, 1517–1523. [Google Scholar] [CrossRef]
- Haddock, E.A.; Gupta, R.K.; AL-ShafI, S.M.K.; Layden, K.; Haslam, E. The metabolism of gallic acid and hexahydroxydiphenic acid in plants. Part 2.1 Esters of (S)-hexahydroxydiphenic acid with D-glucopyranose (4C1). J. Chem. Soc. Perkin Trans. 1982, 21, 2525–2534. [Google Scholar] [CrossRef]
- Maldini, M.; Montoro, P.; Pizza, C. Phenolic compounds from Byrsonima crassifolia L. bark: Phytochemical investigation and quantitative analysis by LC-ESI MS/MS. J. Pharm. Biomed. Anal. 2011, 56, 1–6. [Google Scholar] [CrossRef]
- Kumar, S.; Chandra, P.; Bajpai, V.; Singh, A.; Srivastava, M.; Mishra, D.K.; Kumar, B. Rapid qualitative and quantitative analysis of bioactive compounds from Phyllanthus amarus using LC/MS/MS techniques. Ind. Crops Prod. 2015, 69, 143–152. [Google Scholar] [CrossRef]
- Sprenger, R.; Da, F.; Cass, Q.B. Characterization of four Phyllanthus species using liquid chromatography coupled to tandem mass spectrometry. J. Chromatogr. A 2013, 1291, 97–103. [Google Scholar] [CrossRef]
- Swilam, N.; Nematallah, K.A. Polyphenols profile of pomegranate leaves and their role in green synthesis of silver nanoparticles. Sci. Rep. 2020, 10, 14851. [Google Scholar] [CrossRef]
- Zhu, M.Z.; Wu, W.; Jiao, L.L.; Yang, P.F.; Guo, M.Q. Analysis of flavonoids in lotus (Nelumbo nucifera) leaves and their antioxidant activity using macroporous resin chromatography coupled with LC-MS/MS and antioxidant biochemical assays. Molecules 2015, 20, 10553–10565. [Google Scholar] [CrossRef] [Green Version]
- Roxo, M.; Peixoto, H.; Wetterauer, P.; Lima, E.; Wink, M.; Soković, M. Piquiá Shells (Caryocar villosum): A fruit by-product with antioxidant and antiaging properties in Caenorhabditis elegans. Oxid. Med. Cell. Longev. 2020, 2020, 7590707. [Google Scholar] [CrossRef]
- Liu, Y.; Seeram, N.P. Liquid chromatography coupled with time-of-flight tandem mass spectrometry for comprehensive phenolic characterization of pomegranate fruit and flower extracts used as ingredients in botanical dietary supplements. J. Sep. Sci. 2018, 41, 3022–3033. [Google Scholar] [CrossRef] [PubMed]
- Navarro, M.; Moreira, I.; Arnaez, E.; Quesada, S.; Azofeifa, G.; Vargas, F.; Alvarado, D.; Chen, P. Flavonoids and ellagitannins characterization, antioxidant and cytotoxic activities of Phyllanthus acuminatus Vahl. Plants 2017, 6, 62. [Google Scholar] [CrossRef] [PubMed] [Green Version]
- Kähkönen, M.; Kylli, P.; Ollilainen, V.; Salminen, J.P.; Heinonen, M. Antioxidant activity of isolated ellagitannins from red raspberries and cloudberries. J. Agric. Food Chem. 2012, 60, 1167–1174. [Google Scholar] [CrossRef] [PubMed]
- Dincheva, I.; Badjakov, I.; Kondakova, V.; Dobson, P.; McDougall, G.; Stewart, D. Identification of the phenolic components in bulgarian raspberry cultivars by LC-MS. Int. J. Agric. Sci. Res. 2013, 3, 127–138. [Google Scholar]
- Abid, M.; Yaich, H.; Cheikhrouhou, S.; Khemakhem, I.; Bouaziz, M.; Attia, H.; Ayadi, M.A. Antioxidant properties and phenolic profile characterization by LC–MS/MS of selected Tunisian pomegranate peels. J. Food Sci. Technol. 2017, 54, 2890–2901. [Google Scholar] [CrossRef]
- Fabre, N.; Rustan, I.; De Hoffmann, E.J.Q.-L. Determination of flavone, flavonol and flavanone aglycones by negative ion liquid chromatography electrospray ion trap mass spectrometry. J. Am. Soc. Mass Spectrom. 2001, 12, 707–715. [Google Scholar] [CrossRef] [Green Version]
- Ibrahim, R.M.; El-Halawany, A.M.; Saleh, D.O.; Naggar, E.M.B.E.; El-Shabrawy, A.E.R.O.; El-Hawary, S.S. HPLC-DAD-MS/MS profiling of phenolics from Securigera securidaca flowers and its anti-hyperglycemic and anti-hyperlipidemic activities. Rev. Bras. Farm. 2015, 25, 134–141. [Google Scholar] [CrossRef] [Green Version]
- Bubba, M.D.; Checchini, L.; Chiuminatto, U. Liquid chromatographic/electrospray ionization tandem mass spectrometric study of polyphenolic composition of four cultivars of Fragaria vesca L. berries and their comparative evaluation. J. Mass Spectrom. 2012, 47, 1207–1220. [Google Scholar] [CrossRef]
- Lorenz, P.; Bunse, M.; Klaiber, I.; Conrad, J.; Laumann-Lipp, T.; Stintzing, F.C.; Kammerer, D.R. Comprehensive phytochemical characterization of herbal parts from kidney vetch (Anthyllis vulneraria L.) by LC/MSn and GC/MS. Chem. Biodivers. 2020, 17, e2000485. [Google Scholar] [CrossRef]
- Justesen, U. Collision-induced fragmentation of deprotonated methoxylated flavonoids, obtained by electrospray ionization mass spectrometry. J. Mass Spectrom. 2001, 36, 169–178. [Google Scholar] [CrossRef]
- Li, J.; Kuang, G.; Chen, X.; Zeng, R. Identification of chemical composition of leaves and flowers from Paeonia rockii by UHPLC-Q-Exactive Orbitrap HRMS. Molecules 2016, 21, 947. [Google Scholar] [CrossRef] [Green Version]
- Carazzone, C.; Mascherpa, D.; Gazzani, G.; Papetti, A. Identification of phenolic constituents in red chicory salads (Cichorium intybus) by high-performance liquid chromatography with diode array detection and electrospray ionisation tandem mass spectrometry. Food Chem. 2013, 138, 1062–1071. [Google Scholar] [CrossRef]
- Csepregi, R.; Temesfői, V.; Das, S.; Alberti, Á.; Tóth, C.A.; Herczeg, R.; Papp, N.; Kőszegi, T. Cytotoxic, antimicrobial, antioxidant properties and effects on cell migration of phenolic compounds of selected transylvanian medicinal plants. Antioxidants 2020, 9, 166. [Google Scholar] [CrossRef] [Green Version]
- Dou, J.; Lee, V.S.Y.; Tzen, J.T.C.; Lee, M.R. Identification and comparison of phenolic compounds in the preparation of Oolong tea manufactured by semifermentation and drying processes. J. Agric. Food Chem. 2007, 55, 7462–7468. [Google Scholar] [CrossRef]
- Spínola, V.; Pinto, J.; Castilho, P.C. Identification and quantification of phenolic compounds of selected fruits from Madeira Island by HPLC-DAD-ESI-MSn and screening for their antioxidant activity. Food Chem. 2015, 173, 14–30. [Google Scholar] [CrossRef]
- Parejo, I.; Jauregui, O.; Sánchez-Rabaneda, F.; Viladomat, F.; Bastida, J.; Codina, C. Separation and characterization of phenolic compounds in fennel (Foeniculum vulgare) using liquid chromatography−negative electrospray ionization tandem mass spectrometry. J. Agric. Food Chem. 2004, 52, 3679–3687. [Google Scholar] [CrossRef]
- Fathoni, A.; Saepudin, E.; Cahyana, A.H.; Rahayu, D.U.C.; Haib, J. Identification of nonvolatile compounds in clove (Syzygium aromaticum) from Manado. AIP Conf. Proc. 2017, 1862, 030079. [Google Scholar] [CrossRef] [Green Version]
- Abu-reidah, I.M.; Ali-shtayeh, M.S. HPLC–DAD–ESI-MS/MS screening of bioactive components from Rhus coriaria L. (Sumac) fruits. Food Chem. 2015, 166, 179–191. [Google Scholar] [CrossRef] [Green Version]
- Chua, L.S.; Yap, K.C.; Jaganath, I.B. Comparison of total phenolic content, scavenging activity and HPLC-ESI-MS/MS profiles of both young and mature leaves and stems of Andrographis paniculata. Nat. Prod. Commun. 2013, 8, 1725–1729. [Google Scholar] [CrossRef] [Green Version]
- Fraternale, D.; Ricci, D.; Verardo, G.; Gorassini, A.; Stocchi, V.; Sestili, P. Activity of Vitis vinifera tendrils extract against phytopathogenic fungi. Nat. Prod. Commun. 2015, 10, 1037–1042. [Google Scholar] [CrossRef] [Green Version]
- Agalar, H.G.; Çiftçi, A.G.; Göger, F.; Kırımer, N. Activity guided fractionation of Arum italicum miller tubers and the LC/MS-MS profiles. Rec. Nat. Prod. 2018, 12, 64–75. [Google Scholar] [CrossRef]
- Quideau, S.; Deffieux, D.; Douat-Casassus, C.; Pouységu, L. Plant polyphenols: Chemical properties, biological activities and synthesis. Angew. Chem. Int. Ed. 2011, 50, 586–621. [Google Scholar] [CrossRef]
- Simirgiotis, M.J.; Bórquez, J.; Schmeda-Hirschmann, G. Antioxidant capacity, polyphenolic content and tandem HPLC-DAD-ESI/MS profiling of phenolic compounds from the South American berries Luma apiculata and L. chequén. Food Chem. 2013, 139, 289–299. [Google Scholar] [CrossRef]
- Simirgiotis, M.J.; Schmeda-Hirschmann, G. Direct identification of phenolic constituents in Boldo Folium (Peumus boldus Mol.) infusions by high-performance liquid chromatography with diode array detection and electrospray ionization tandem mass spectrometry. J. Chromatogr. A 2010, 1217, 443–449. [Google Scholar] [CrossRef]
- Parejo, I.; Jáuregui, O.; Viladomat, F.; Bastida, J.; Codina, C. Characterization of acylated flavonoid-O-glycosides and methoxylated flavonoids from Tagetes maxima by liquid chromatography coupled to electrospray ionization tandem mass spectrometry. Rapid Commun. Mass Spectrom. 2004, 18, 2801–2810. [Google Scholar] [CrossRef]
- Li, Z.H.; Guo, H.; Xu, W.B.; Ge, J.; Li, X.; Alimu, M.; He, D.J. Rapid identification of flavonoid constituents directly from PTP1B inhibitive extract of raspberry (Rubus idaeus L.) leaves by HPLC–ESI–QTOF–MS-MS. J. Chromatogr. Sci. 2016, 54, 805–810. [Google Scholar] [CrossRef] [Green Version]
- Chen, G.; Li, X.; Saleri, F.; Guo, M. Analysis of flavonoids in Rhamnus davurica and its antiproliferative activities. Molecules 2016, 21, 1275. [Google Scholar] [CrossRef]
- Yao, H.; Chen, B.; Zhang, Y.; Ou, H.; Li, Y.; Li, S.; Shi, P.; Lin, X. Analysis of the total biflavonoids extract from Selaginella doederleinii by HPLC-QTOF-MS and its in vitro and in vivo anticancer effects. Molecules 2017, 22, 325. [Google Scholar] [CrossRef] [Green Version]
- Cardoso, S.M.; Falcão, S.I.; Peres, A.M.; Domingues, M.R.M. Oleuropein/ligstroside isomers and their derivatives in Portuguese olive mill wastewaters. Food Chem. 2011, 129, 291–296. [Google Scholar] [CrossRef]
- Xia, Y.; Yu, L.; Liang, J.; Yang, B.; Kuang, H. Chromatography and mass spectrometry-based approaches for perception of polysaccharides in wild and cultured fruit bodies of Auricularia auricular-judae. Int. J. Biol. Macromol. 2019, 137, 1232–1244. [Google Scholar] [CrossRef]
- Tawaha, K.; Alali, F.Q.; Gharaibeh, M.; Mohammad, M.; El-Elimat, T. Antioxidant activity and total phenolic content of selected Jordanian plant species. Food Chem. 2007, 104, 1372–1378. [Google Scholar] [CrossRef]
- Li, J.E.; Fan, S.T.; Qiu, Z.H.; Li, C.; Nie, S.P. Total flavonoids content, antioxidant and antimicrobial activities of extracts from Mosla chinensis Maxim. cv. Jiangxiangru. LWT Food Sci. Technol. 2015, 64, 1022–1027. [Google Scholar] [CrossRef]
- Mhalla, D.; Bouassida, K.Z.; Chawech, R.; Bouaziz, A.; Makni, S.; Jlail, L.; Tounsi, S.; Mezghani Jarraya, R.; Trigui, M. Antioxidant, hepatoprotective and antidepression effects of Rumex tingitanus extracts and identification of a novel bioactive compound. Biomed. Res. Int. 2018, 2018, 7295848. [Google Scholar] [CrossRef] [PubMed] [Green Version]
- Ferreira, I.C.F.R.; Baptista, P.; Vilas-Boas, M.; Barros, L. Free-radical scavenging capacity and reducing power of wild edible mushrooms from northeast Portugal: Individual cap and stipe activity. Food Chem. 2007, 100, 1511–1516. [Google Scholar] [CrossRef]
- Prieto, P.; Pineda, M.; Aguilar, M. Spectrophotometric quantitation of antioxidant capacity through the formation of a phosphomolybdenum complex: Specific application to the determination of vitamin E. Anal. Biochem. 1999, 269, 337–341. [Google Scholar] [CrossRef]
- Affes, S.; Ben Younes, A.; Frikha, D.; Allouche, N.; Treilhou, M.; Tene, N.; Mezghani-Jarraya, R. ESI-MS/MS analysis of phenolic compounds from Aeonium arboreum leaf extracts and evaluation of their antioxidant and antimicrobial activities. Molecules 2021, 26, 4338. [Google Scholar] [CrossRef]
- Güven, K.; Yücel, E.; Cetintaş, F. Antimicrobial activities of fruits of Crataegus and Pyrus species. Pharm. Biol. 2006, 44, 79–83. [Google Scholar] [CrossRef]
- Sellem, I.; Kaaniche, F.; Mtibaa, A.C.; Mellouli, L. Anti-oxidant, antimicrobial and anti-acetylcholinesterase activities of organic extracts from aerial parts of three tunisian plants and correlation with polyphenols and flavonoids contents. Bangladesh J. Pharmacol. 2016, 11, 531–544. [Google Scholar] [CrossRef] [Green Version]


| Extracts | Yields (%) |
|---|---|
| Hex | 0.92 |
| EtOAc | 0.59 |
| Acetone | 1.77 |
| MeOH | 2.66 |
| Extracts | TPC (mg GAE/g DE) | TFC (mg QE/g DE) |
|---|---|---|
| Hex | 205.92 ± 4.20 d | 13.03 ± 0.23 d |
| EtOAc | 266.20 ± 4.17 c | 26.38 ± 0.51 c |
| Acetone | 895.54 ± 5.01 a | 36.39 ± 0.43 a |
| MeOH | 382.42 ± 8.57 b | 29.85 ± 0.40 b |
| Extract/Vit C | IC50 (mg·mL−1) | AAI |
|---|---|---|
| Hex | 0.109 ± 0.001 c | 0.36 |
| EtOAc | 0.039 ± 0.001 b | 1.02 |
| Acetone | 0.030 ± 0.002 a | 1.33 |
| MeOH | 0.030 ± 0.001 a | 1.33 |
| Vit C | 0.029 ± 0.002 | 1.37 |
| Extract | Hex | EtOAc | Acetone | MeOH | Vit C |
|---|---|---|---|---|---|
| TAC (mg GAE/g DE) | 103.03 ± 1.99 d | 205.47 ± 2.31 c | 470.09 ± 5.66 a | 330.59 ± 3.25 b | 400 ± 1.25 |
| Extract | TPC | TFC | DPPH | FRAP | TAC |
|---|---|---|---|---|---|
| TPC | 1 | 0.805 ** | 0.549 | 0.505 | 0.922 ** |
| TFC | 1 | 0.933 ** | 0.915 ** | 0.945 ** | |
| DPPH | 1 | 0.994 ** | 0.798 ** | ||
| FRAP | 1 | 0.756 ** | |||
| TAC | 1 |
| Microorganism/ Extract | L. monocytogenes | S. aureus | P. aeruginosa | S. enterica typhimurium | E. coli | C. albicans |
|---|---|---|---|---|---|---|
| Hex | 12 | - | 14 | 12 | 12 | - |
| EtOAc | 20 | 20 | 28 | 22 | 25 | 22 |
| Acetone | 26 | 22 | 30 | 24 | 26 | 24 |
| MeOH | - | - | 26 | 28 | 20 | 26 |
| Extracts and Standards | Microorganisms | |||
|---|---|---|---|---|
| L. monocytogenes | S. aureus | S. enterica- typhimurium | C. albicans | |
| Hex | 62.50 | - | 62.50 | - |
| EtOAc | 6.25 | 15.60 | 6.25 | 6.25 |
| Acetone | 3.90 | 6.25 | 6.25 | 2.50 |
| MeOH | - | - | 3.90 | 1.25 |
| Ampicillin | 3.90 | 1.95 | 3.90 | - |
| Kanamycin | 12.50 | 6.25 | 12.50 | - |
| Fluconazole | - | - | - | 1.25 |
Publisher’s Note: MDPI stays neutral with regard to jurisdictional claims in published maps and institutional affiliations. |
© 2022 by the authors. Licensee MDPI, Basel, Switzerland. This article is an open access article distributed under the terms and conditions of the Creative Commons Attribution (CC BY) license (https://creativecommons.org/licenses/by/4.0/).
Share and Cite
Samet, S.; Ayachi, A.; Fourati, M.; Mallouli, L.; Allouche, N.; Treilhou, M.; Téné, N.; Mezghani-Jarraya, R. Antioxidant and Antimicrobial Activities of Erodium arborescens Aerial Part Extracts and Characterization by LC-HESI-MS2 of Its Acetone Extract. Molecules 2022, 27, 4399. https://doi.org/10.3390/molecules27144399
Samet S, Ayachi A, Fourati M, Mallouli L, Allouche N, Treilhou M, Téné N, Mezghani-Jarraya R. Antioxidant and Antimicrobial Activities of Erodium arborescens Aerial Part Extracts and Characterization by LC-HESI-MS2 of Its Acetone Extract. Molecules. 2022; 27(14):4399. https://doi.org/10.3390/molecules27144399
Chicago/Turabian StyleSamet, Sonda, Amani Ayachi, Mariam Fourati, Lotfi Mallouli, Noureddine Allouche, Michel Treilhou, Nathan Téné, and Raoudha Mezghani-Jarraya. 2022. "Antioxidant and Antimicrobial Activities of Erodium arborescens Aerial Part Extracts and Characterization by LC-HESI-MS2 of Its Acetone Extract" Molecules 27, no. 14: 4399. https://doi.org/10.3390/molecules27144399