Computer Modeling of Alzheimer’s Disease—Simulations of Synaptic Plasticity and Memory in the CA3-CA1 Hippocampal Formation Microcircuit


Abstract
:1. Introduction
2. Materials and Methods
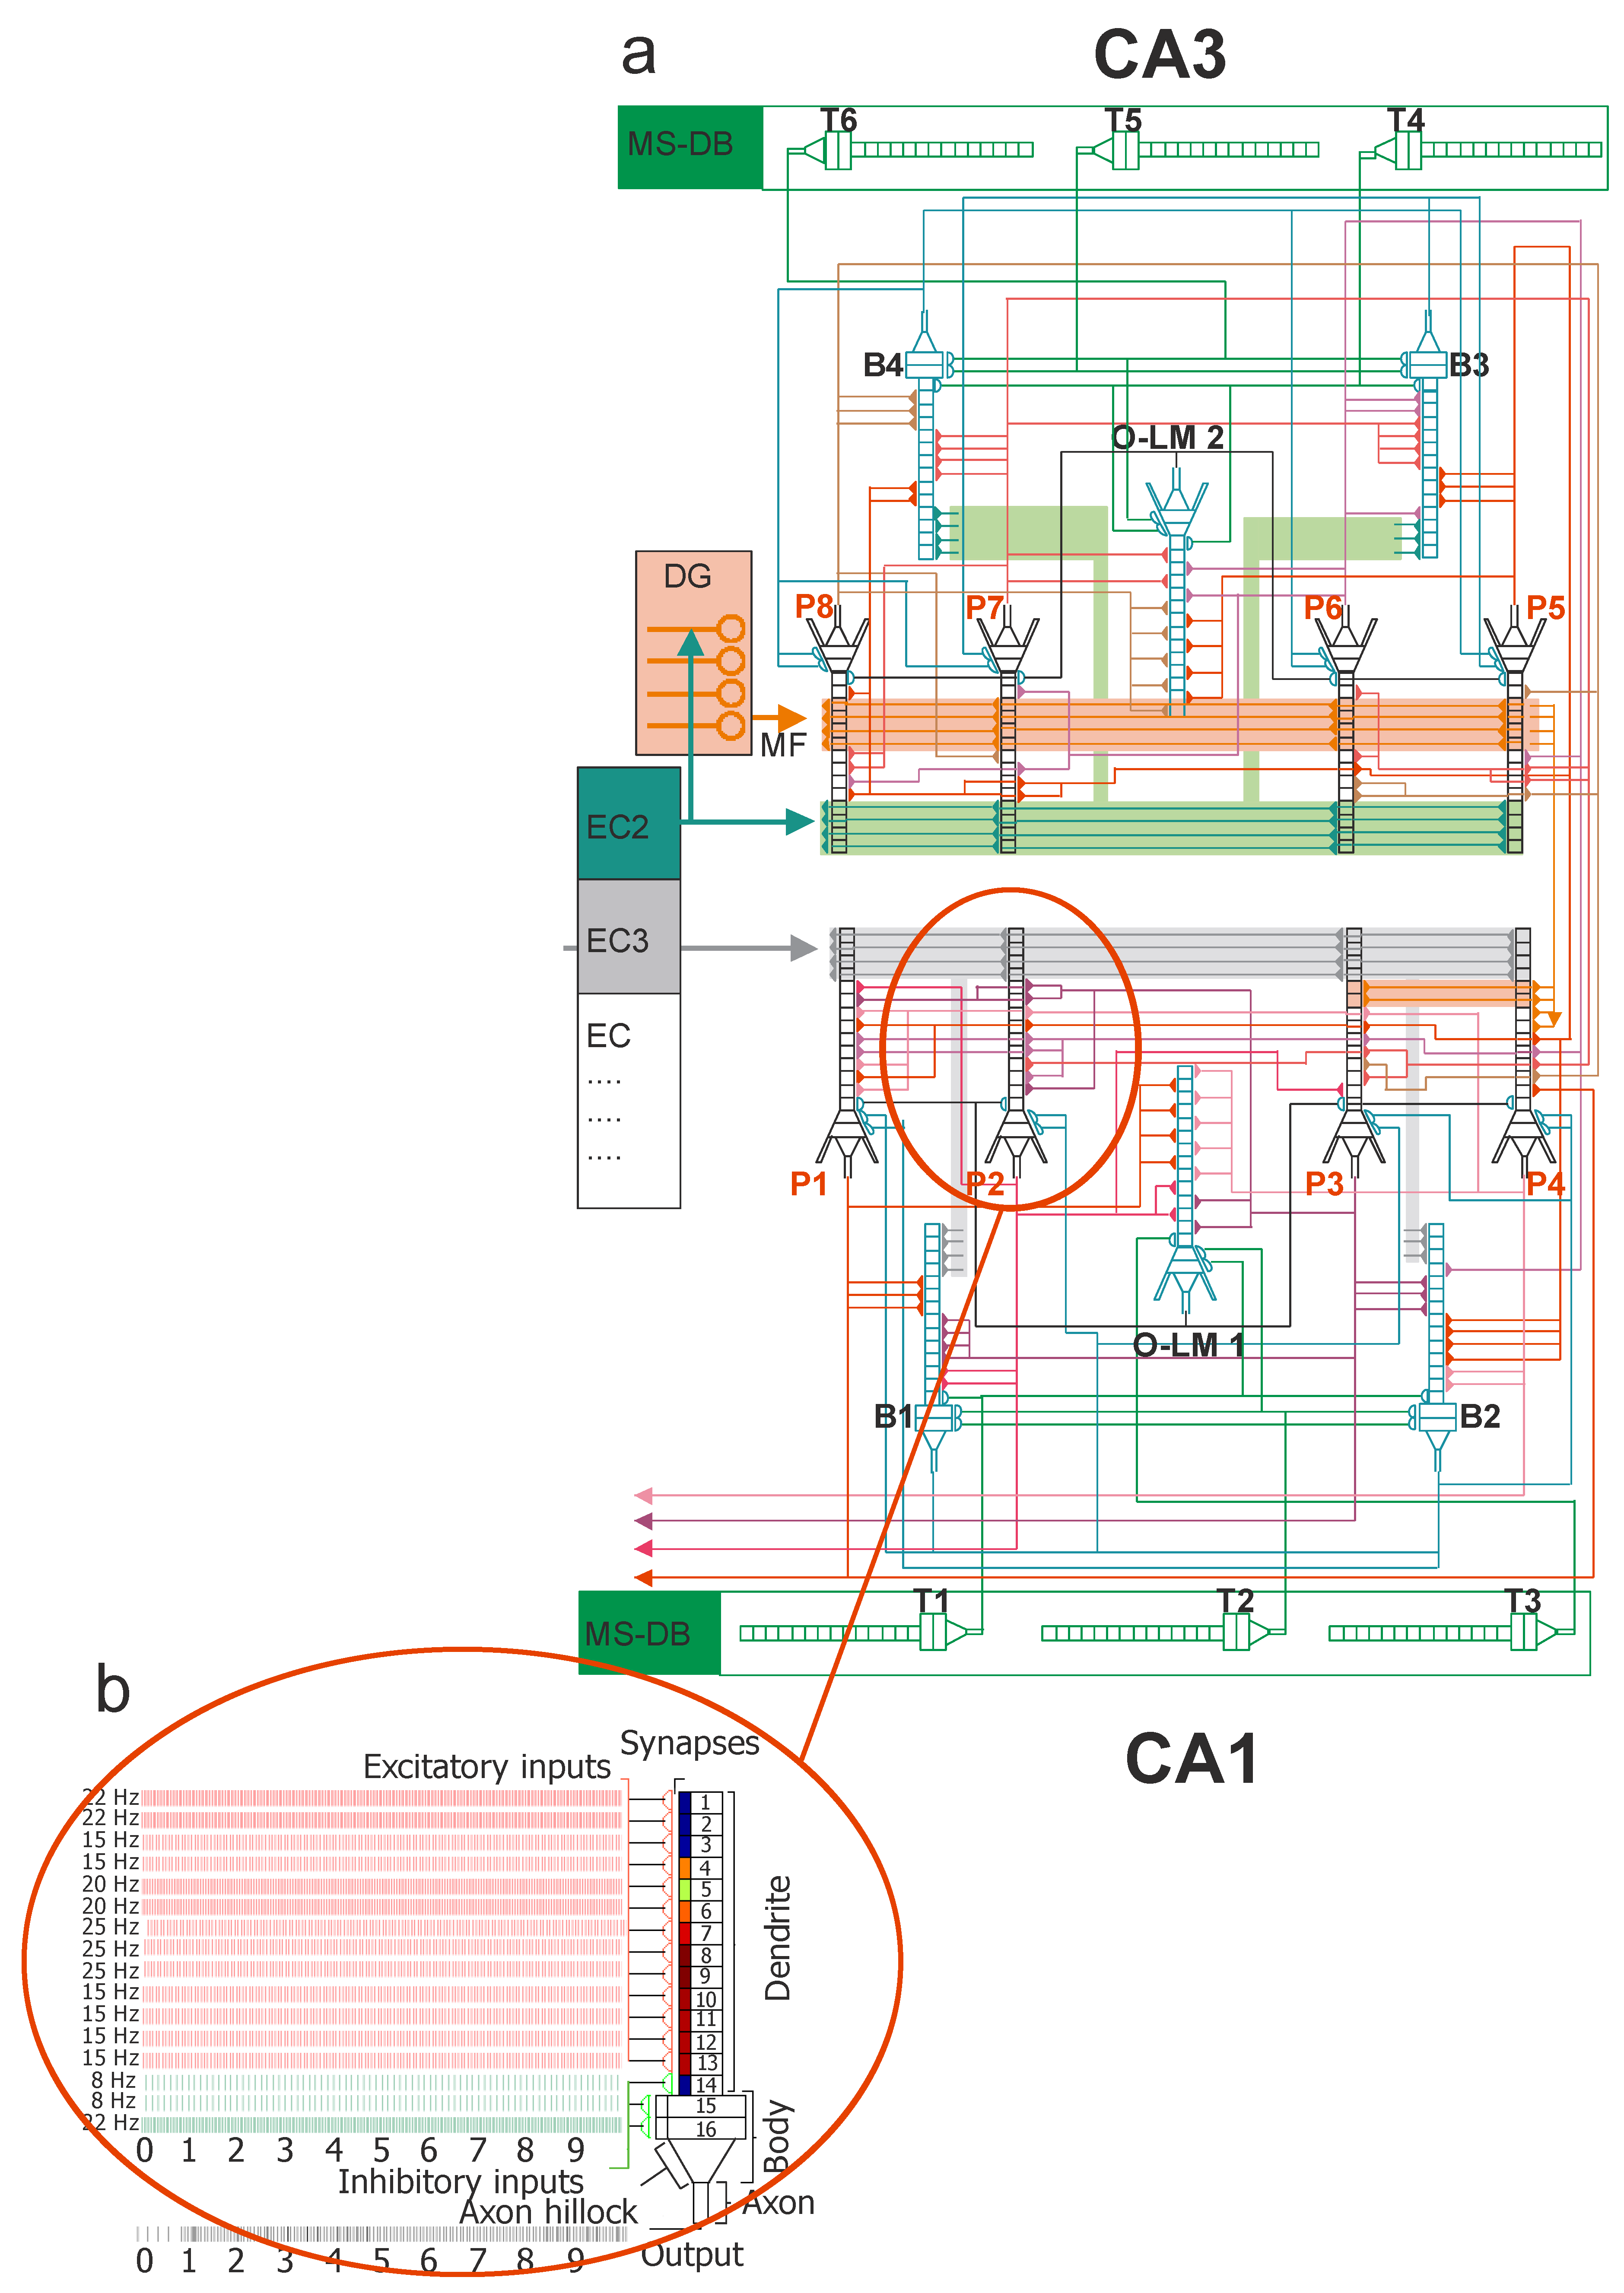
2.1. CA3 Cells
2.2. CA1 Cells
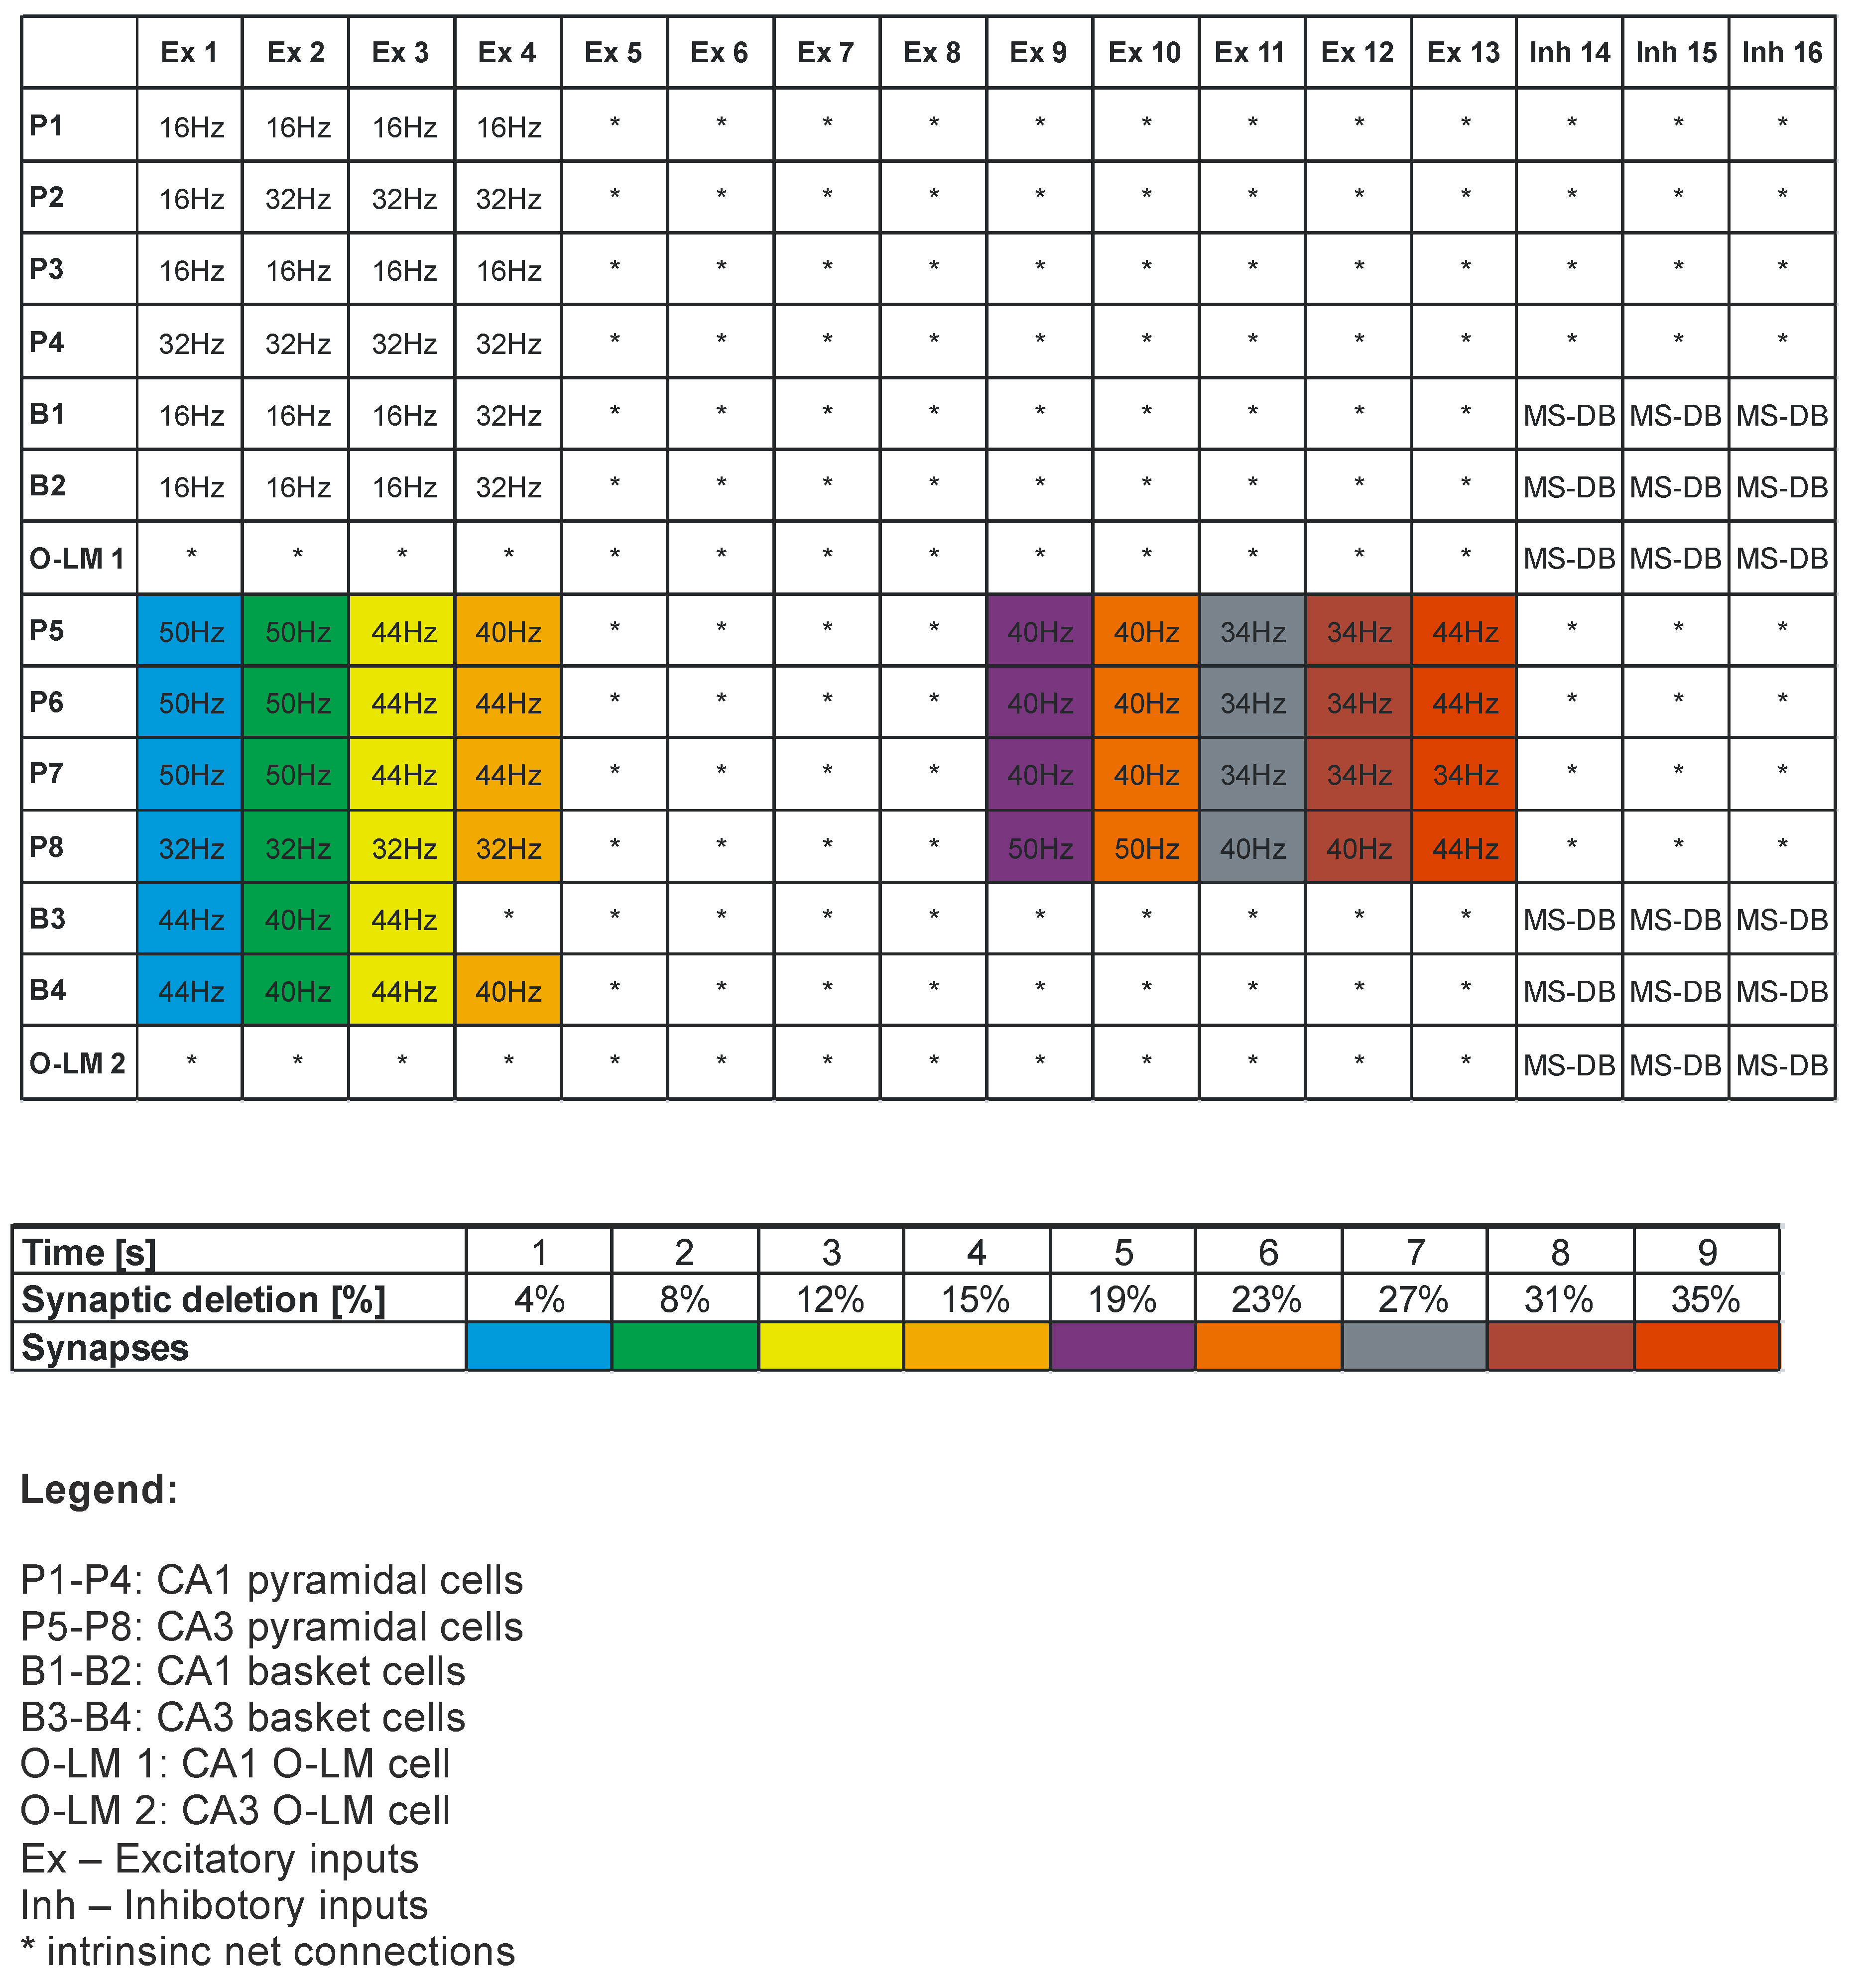
2.3. Model Inputs
2.4. Synaptic Properties
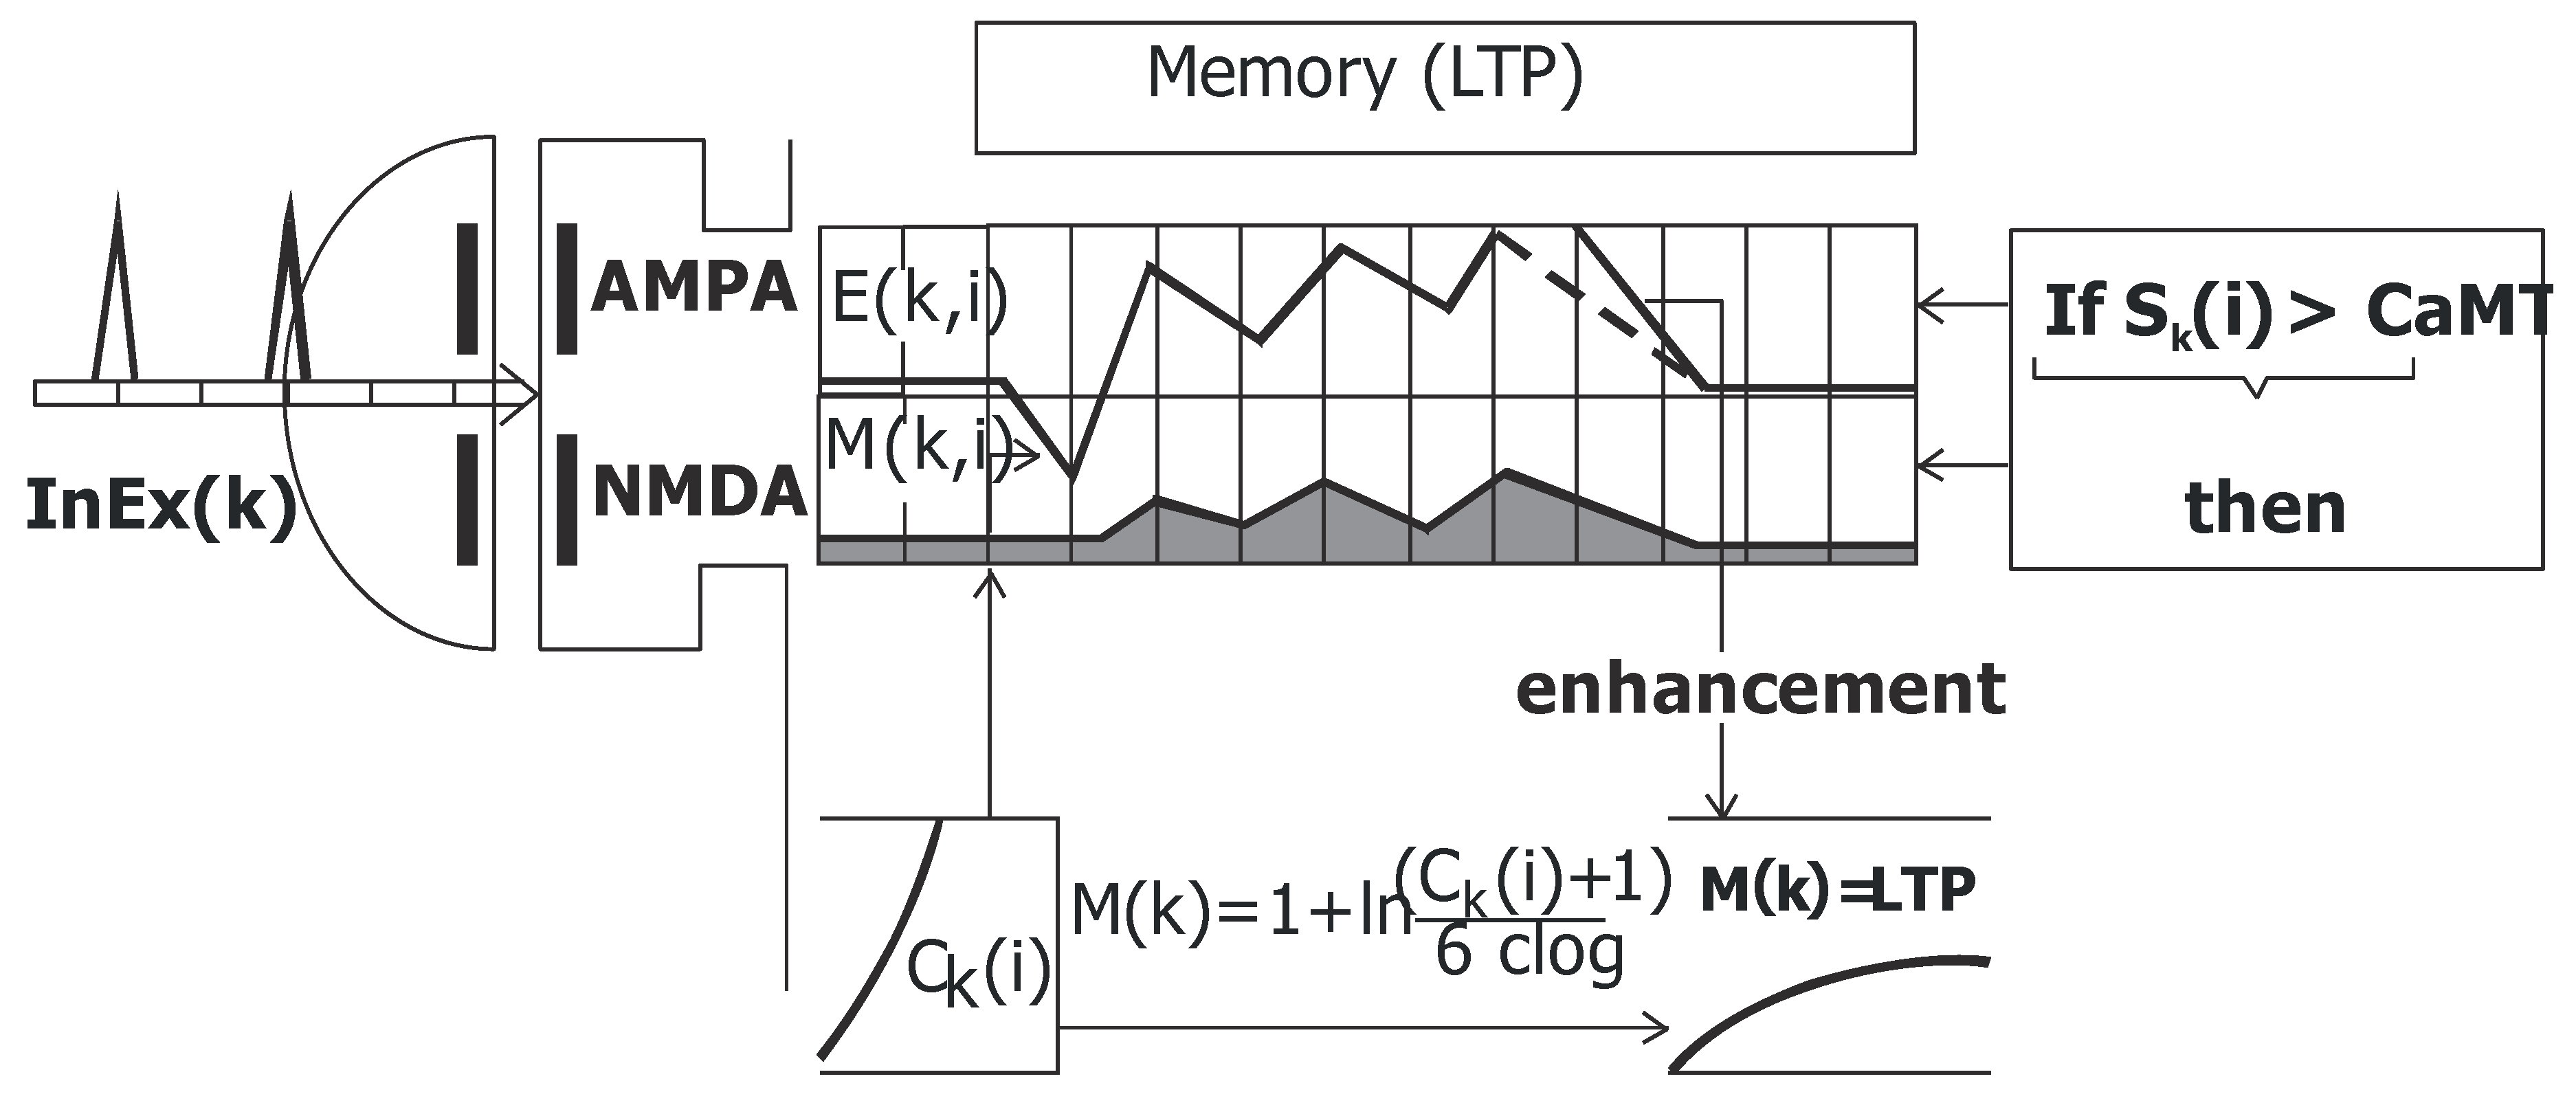
2.5. Memory (LTP)
- (1)
- If Sk(i) > CaMT then (2)(CaMT = −68mV threshold for remove of Mg ion block)
- (2)
- Time of duration of memory:Mk,0- actual value of synaptic function for EPSP (NMDA) in register M.ReP = −80mV (resting potential).FQ-forgetting coefficient not below 1.
- (3)
- Memory (LTP)Ck(i) time of memory for compartment (k), clog parameter = 2.3026
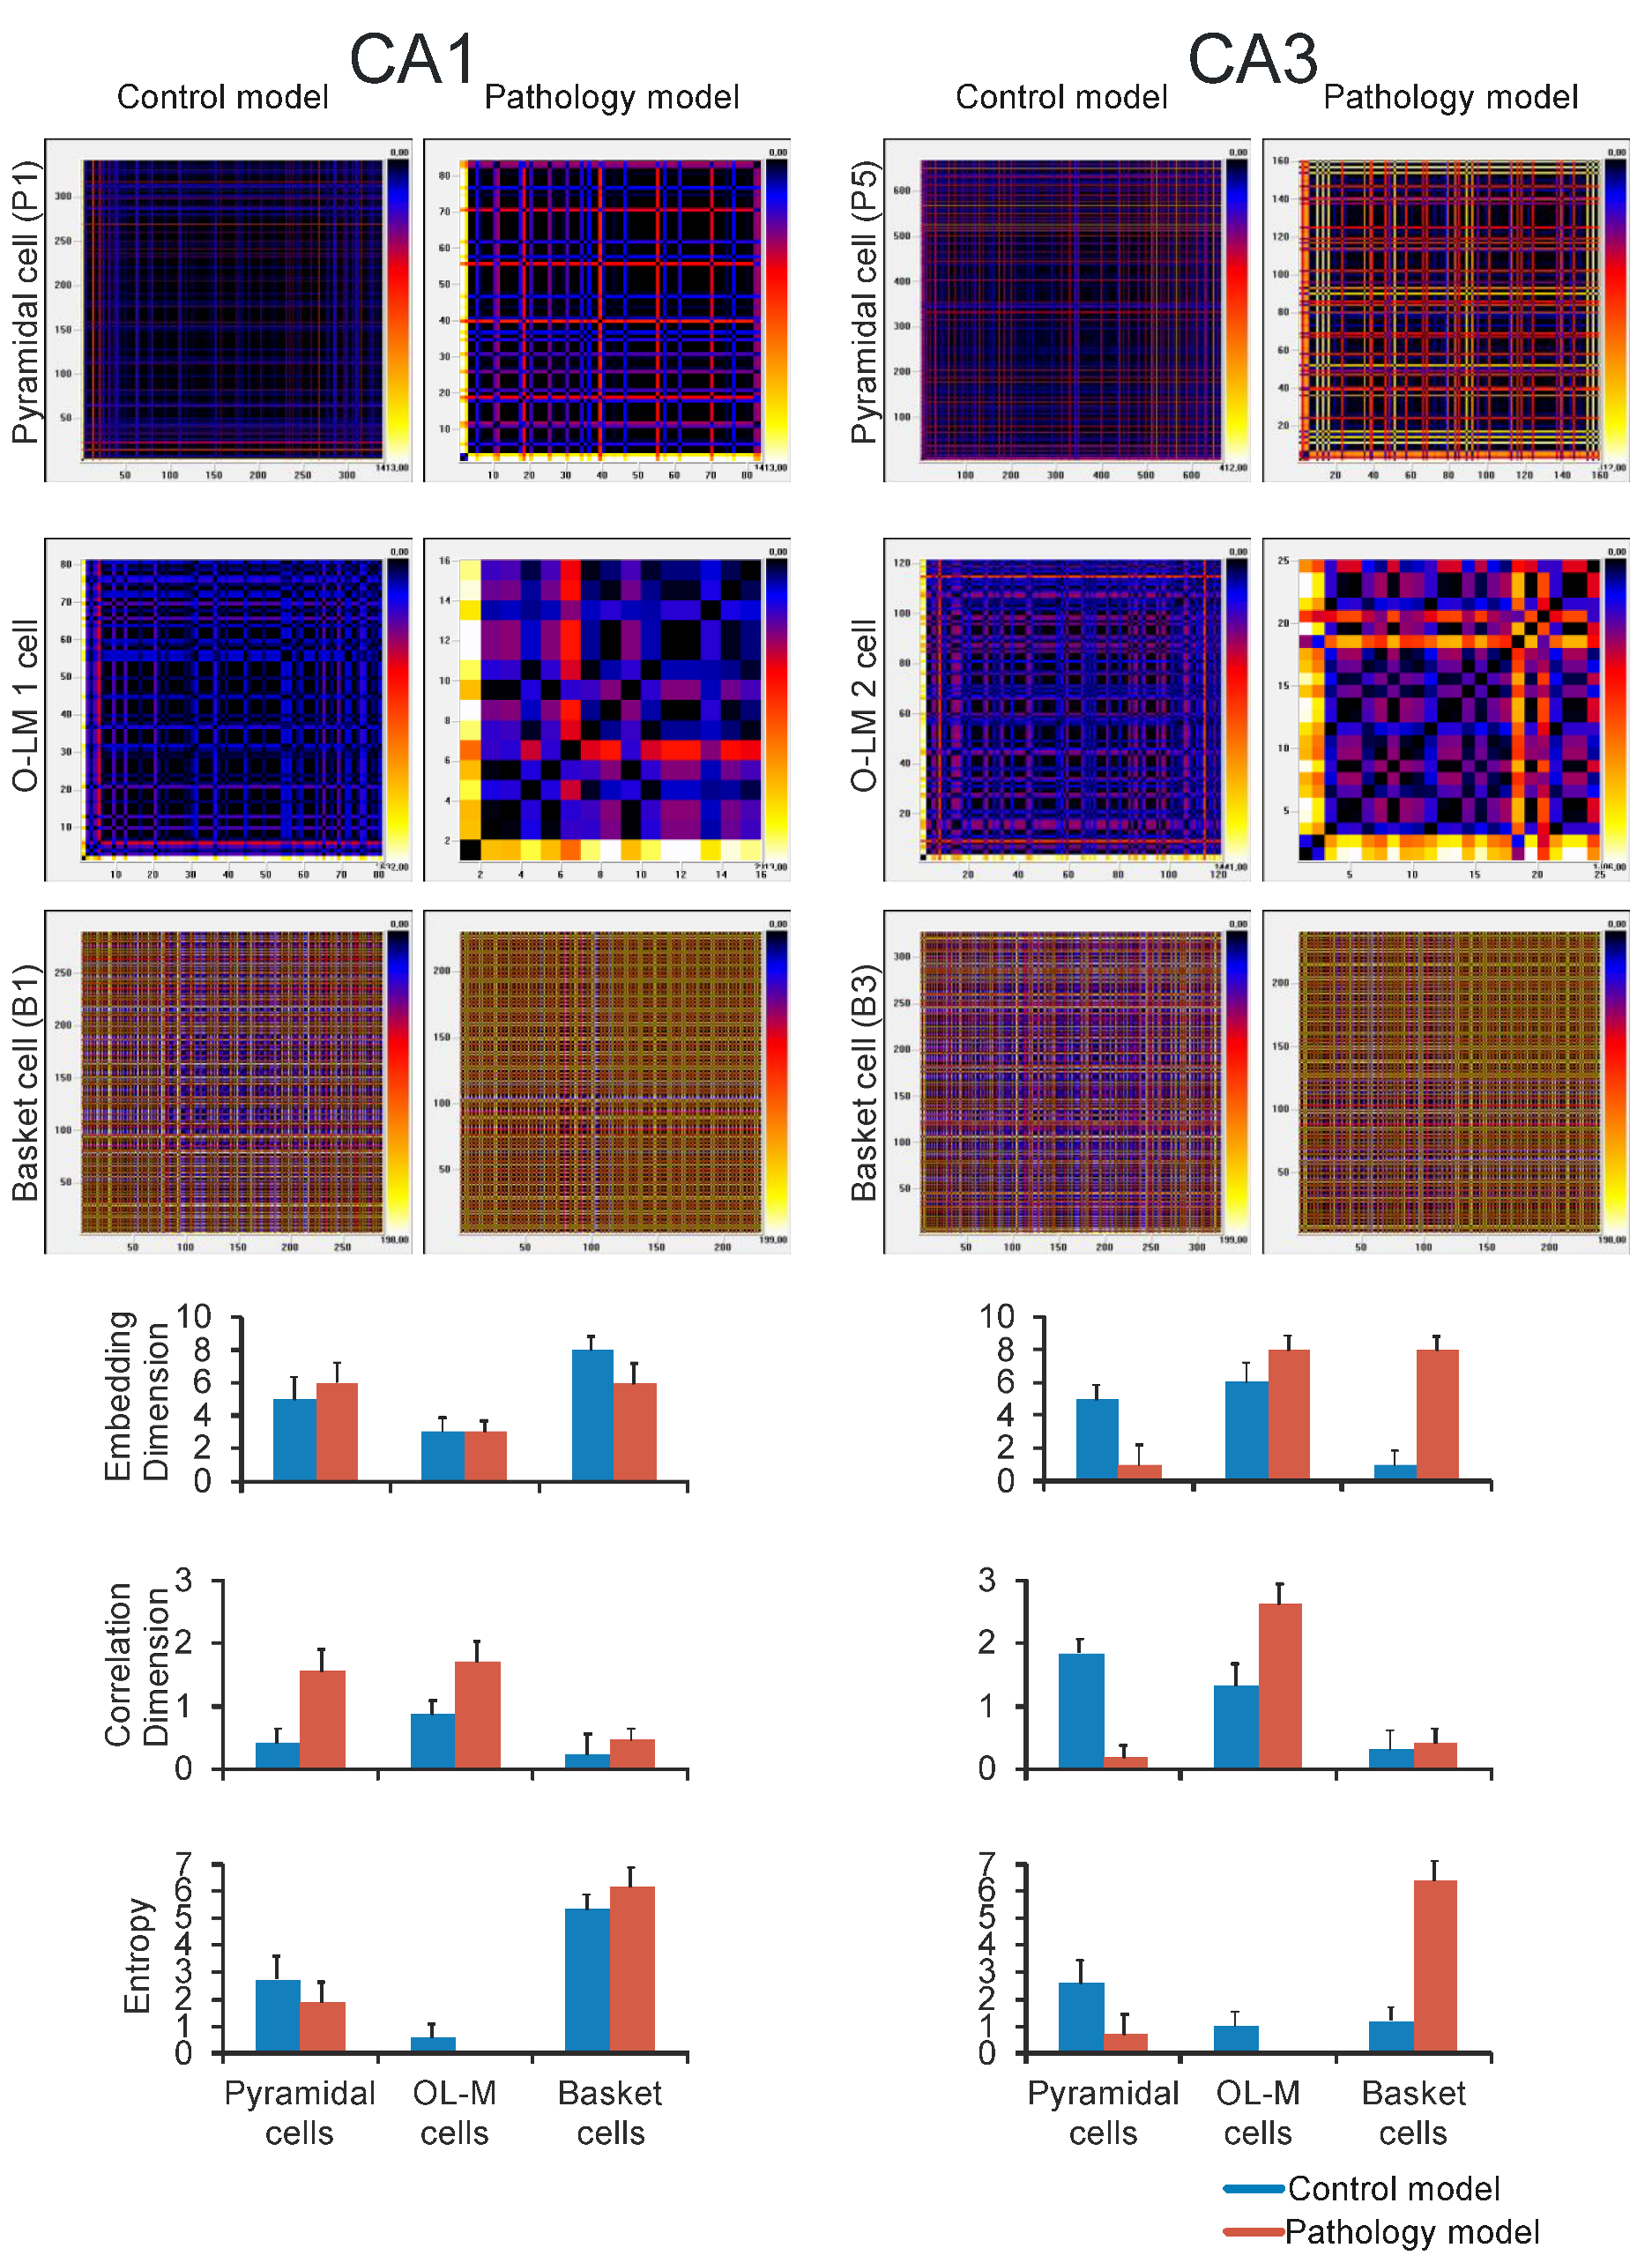
2.6. Correlation Dimension, Shannon Entropy, and Embedding Dimension
2.7. Statistical Methods
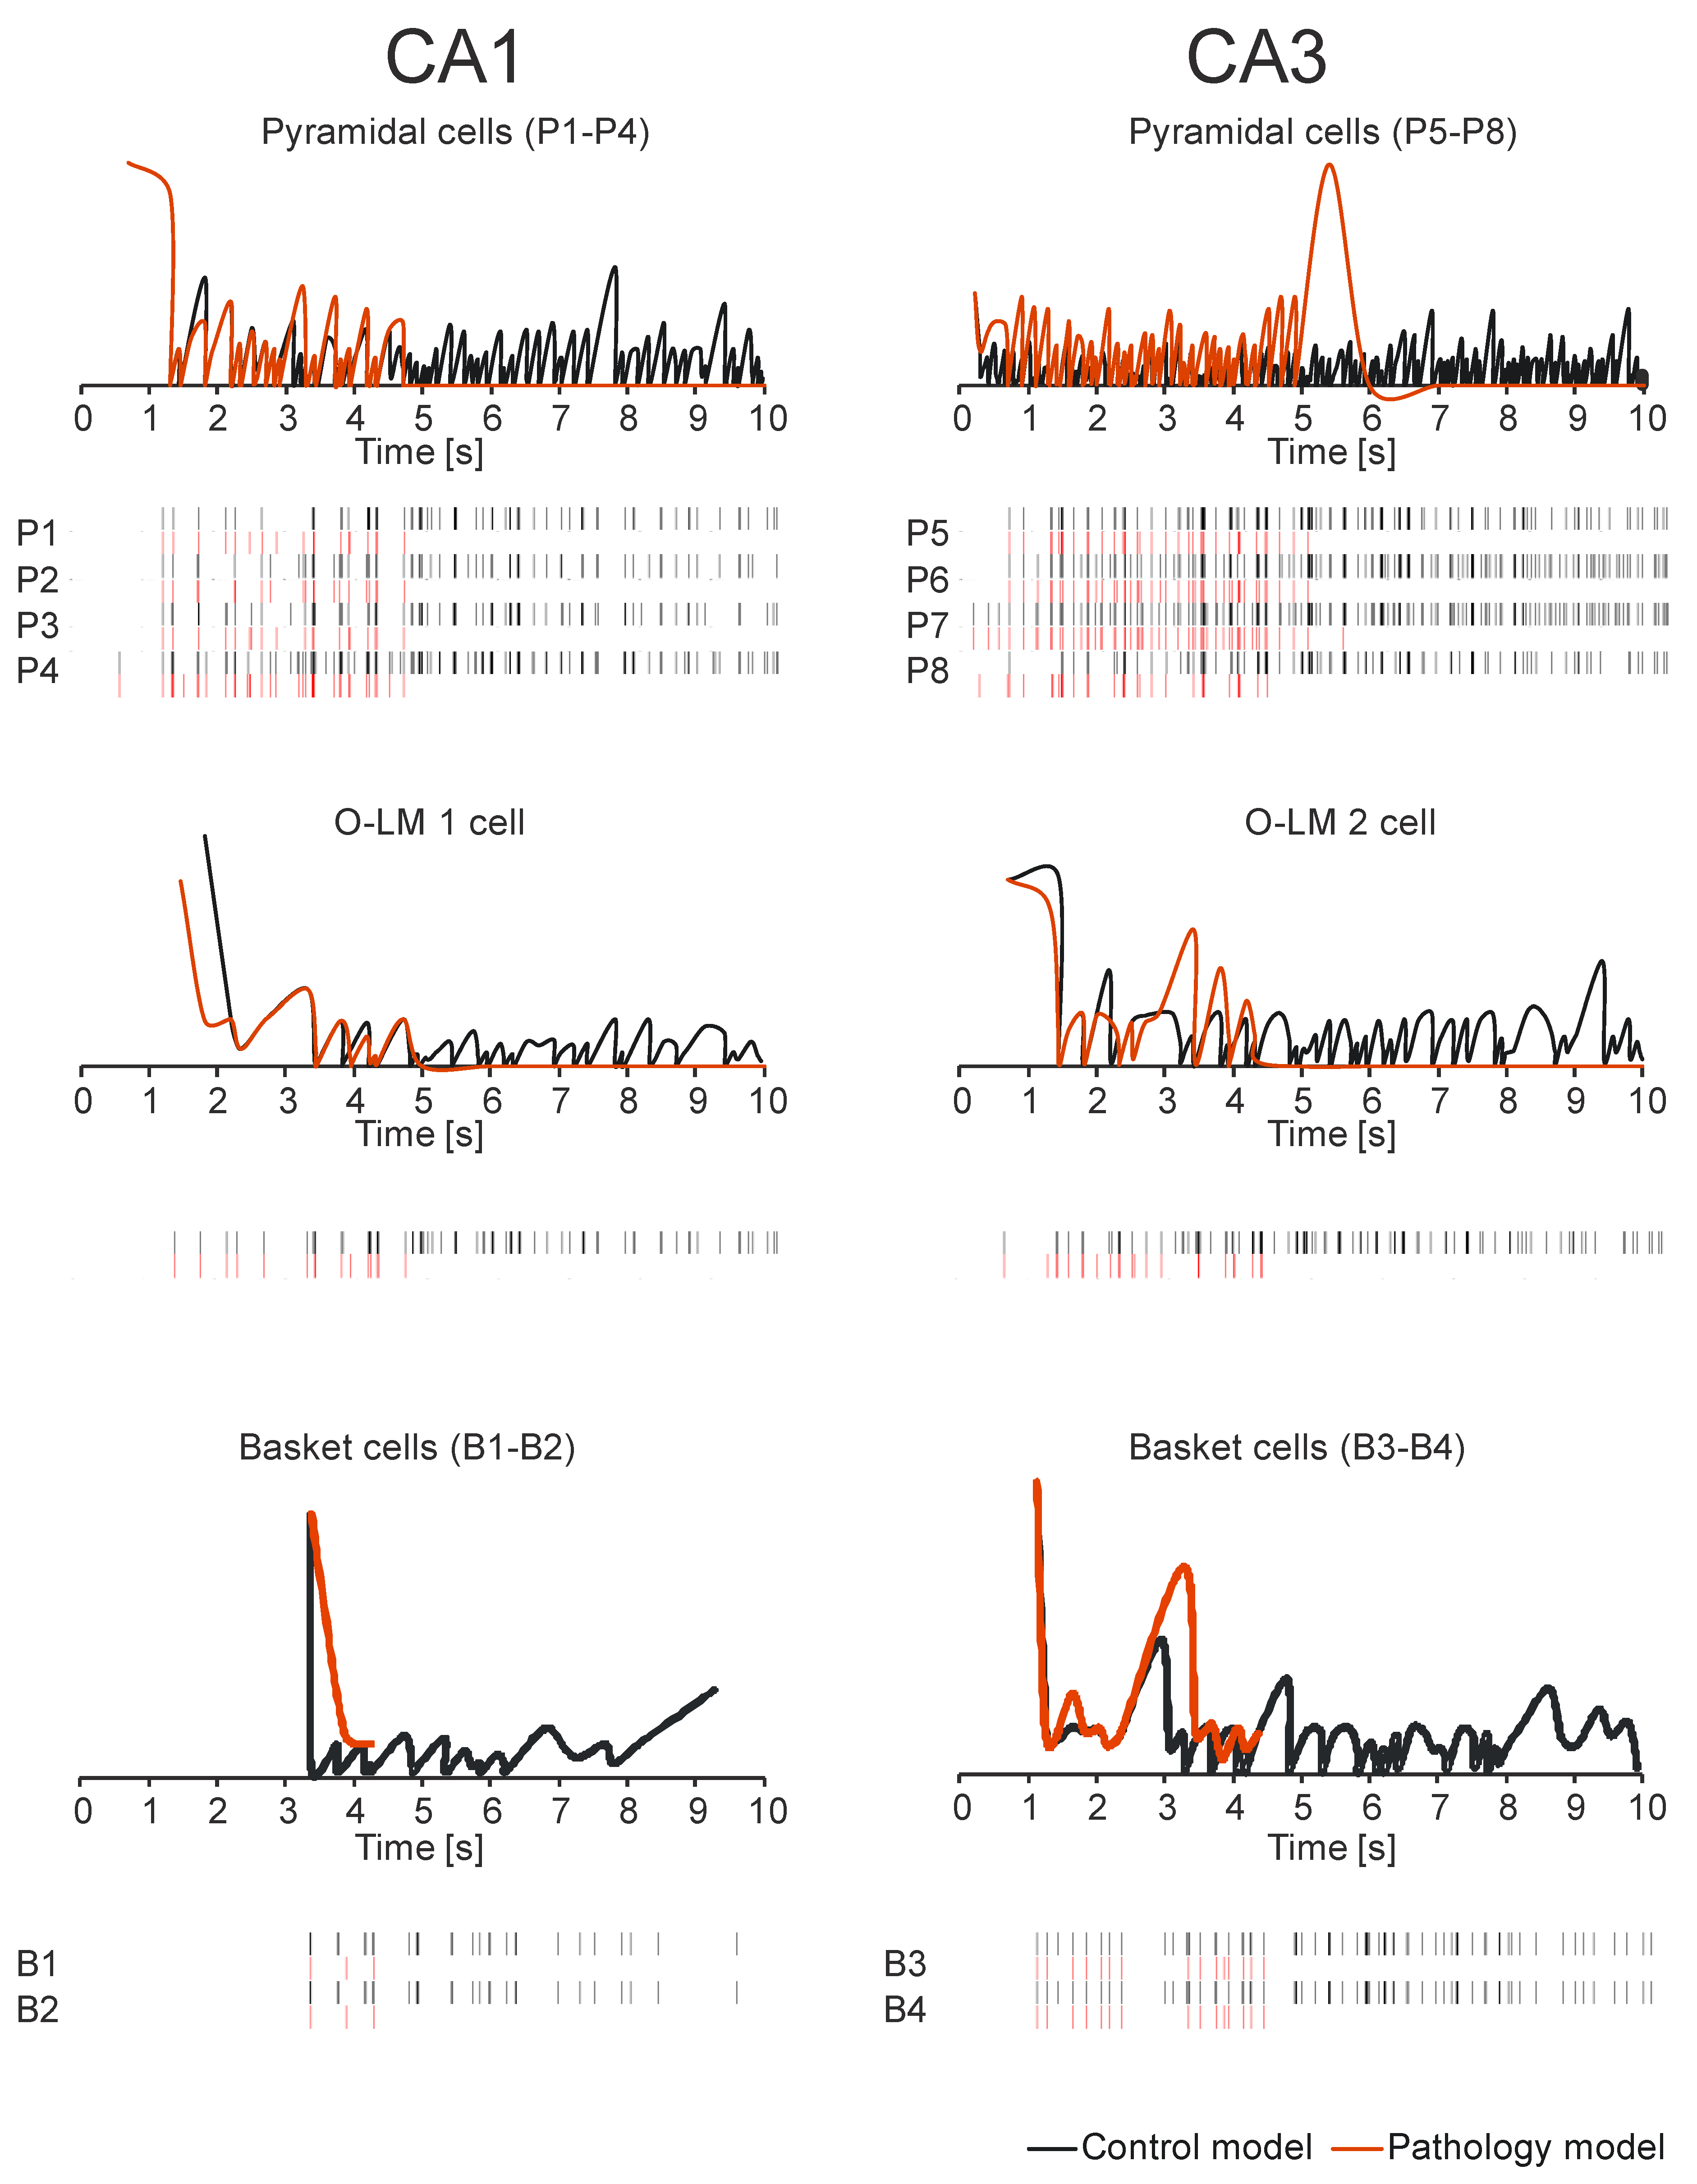
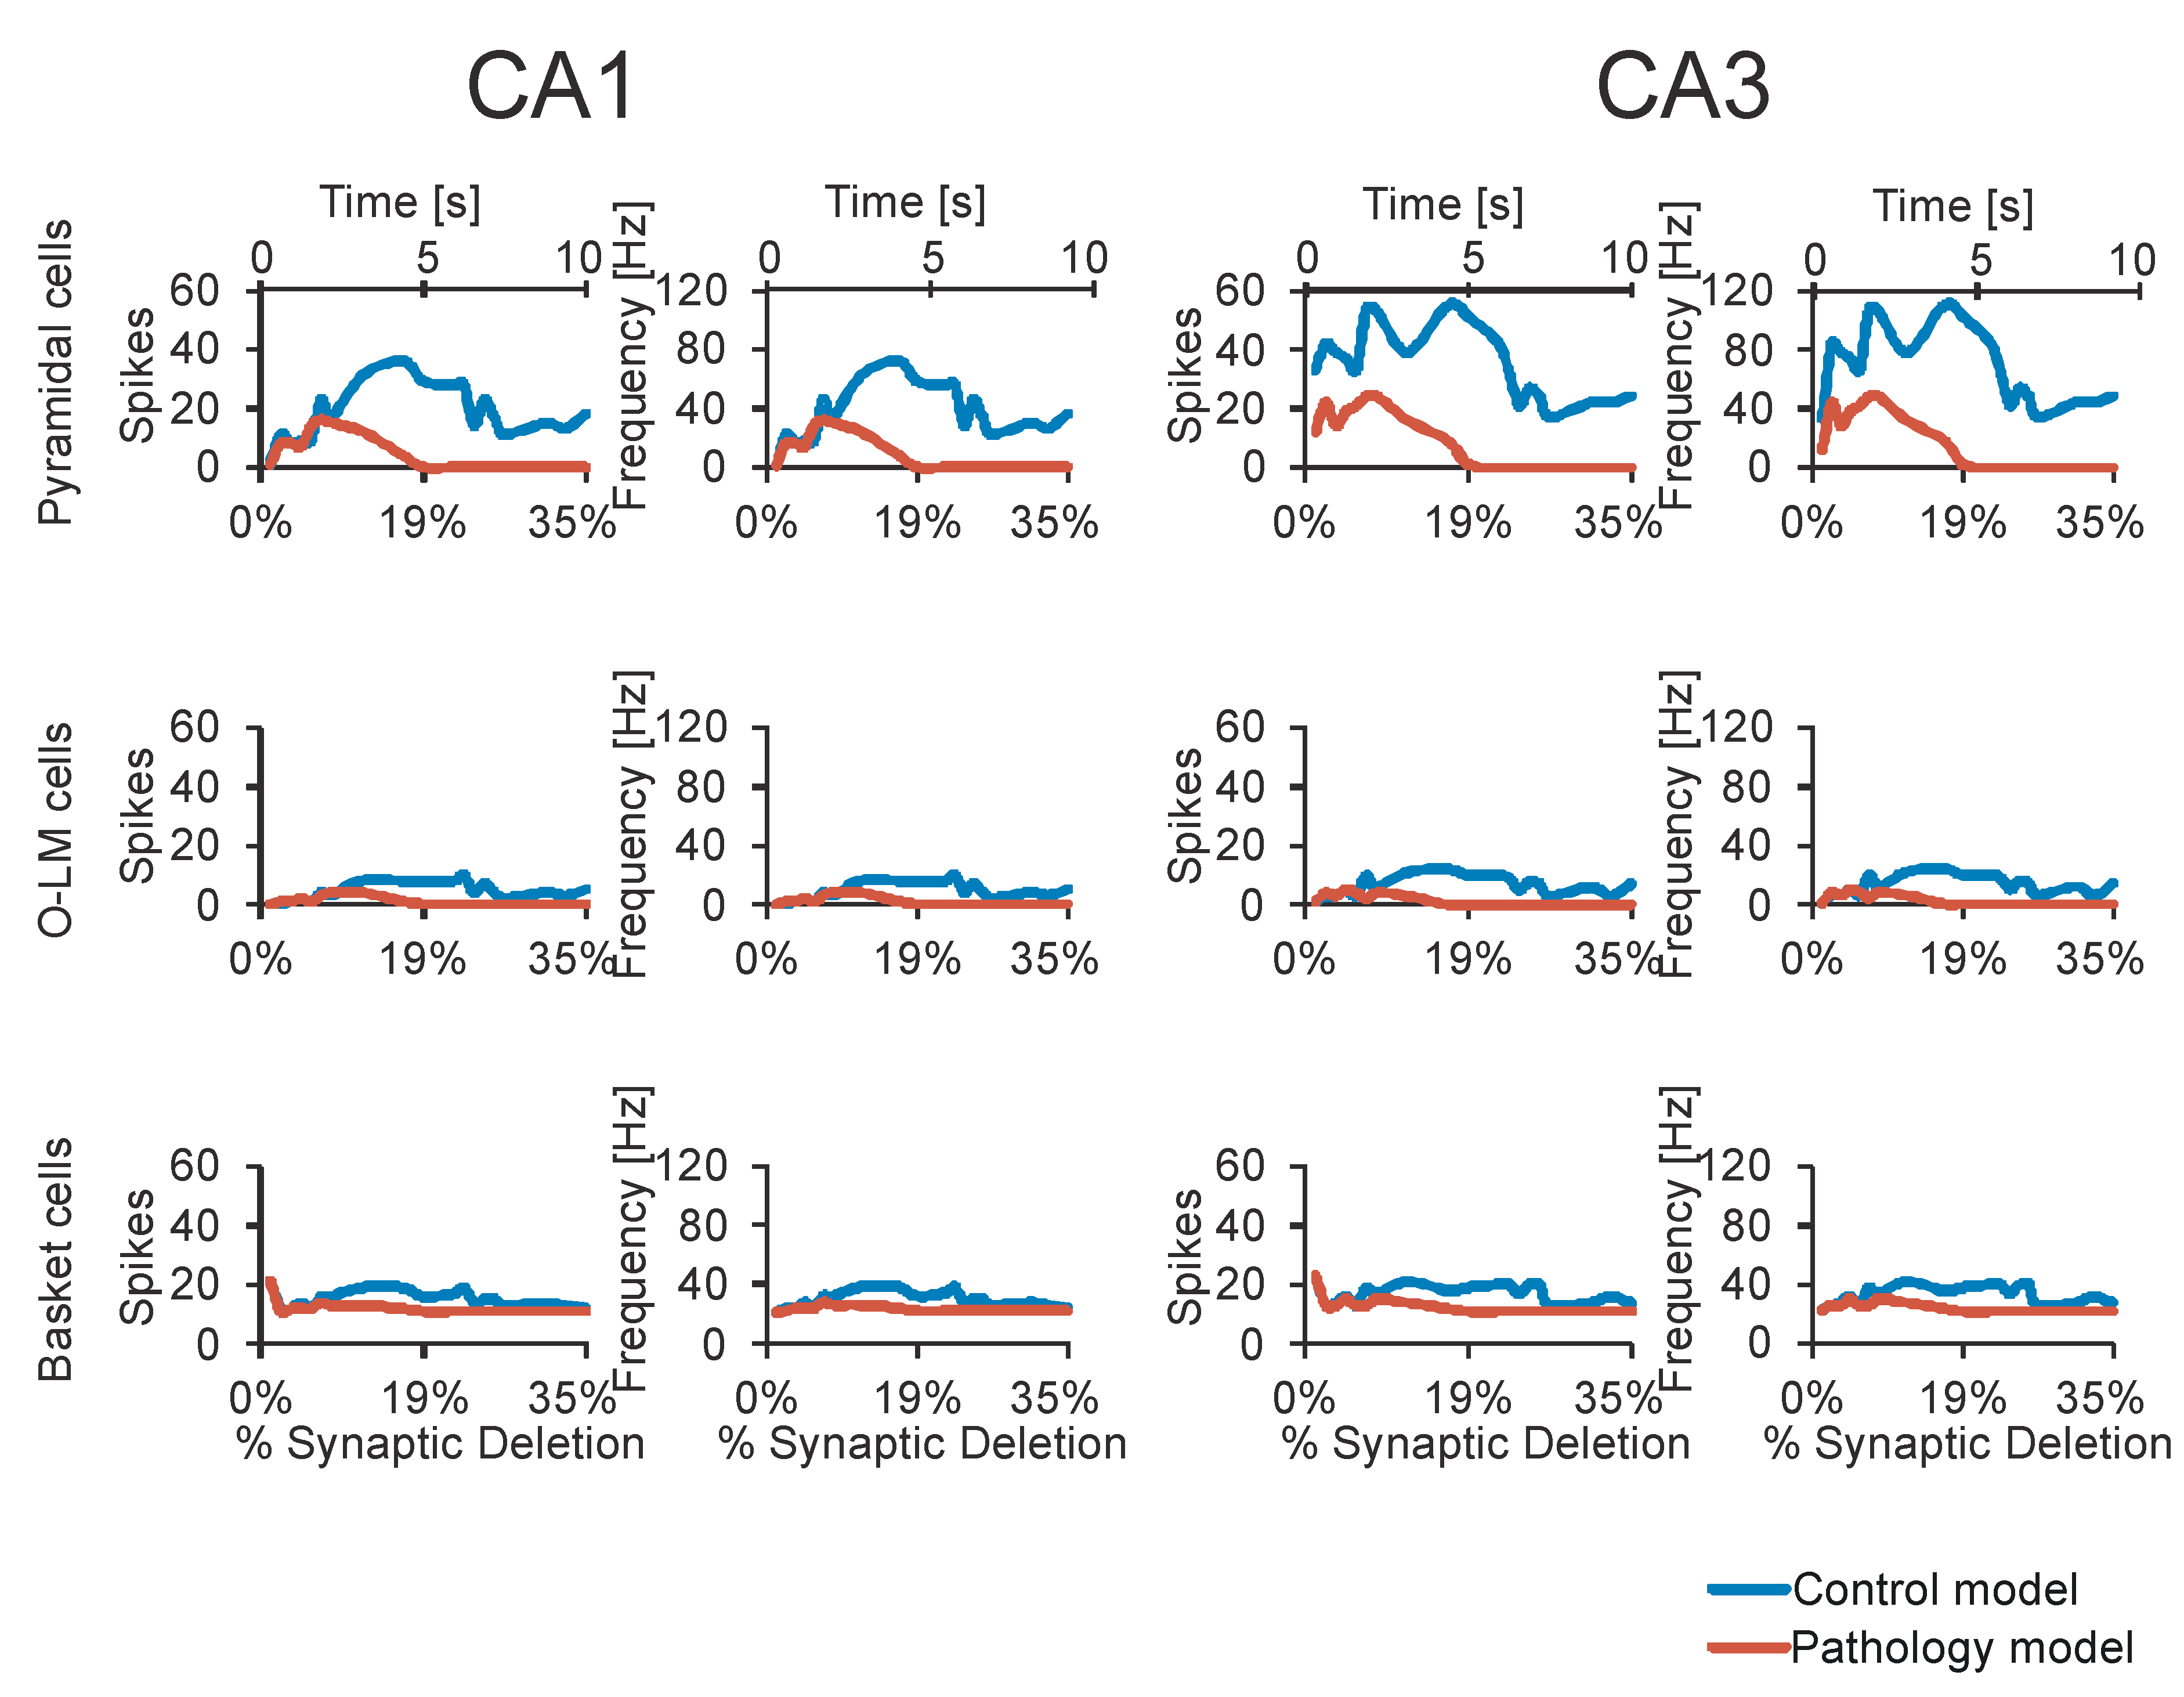
3. Results
4. Discussion
Supplementary Materials
Author Contributions
Funding
Conflicts of Interest
References
- Finkel, L. Neuroengineering models of brain disease. Ann. Rev. Biomed. Eng. 2000, 2, 577–606. [Google Scholar] [CrossRef] [PubMed]
- Hasselmo, M.; McClelland, J.L. Neural models of memory. Curr. Opin. Neurobiol. 1999, 9, 184–188. [Google Scholar] [CrossRef]
- Duch, W. Therapeutic implications of computer models of brain activity for Alzheimer disease. J. Med. Inform. Technol. 2000, 5, 27–34. [Google Scholar]
- Migliore, M.; Cook, E.P.; Jaffe, D.B.; Turner, D.A.; Johnston, D. Computer simulations of morphologically reconstructed CA3 hippocampal neurons. J. Neurophysiol. 1995, 73, 1157–1168. [Google Scholar] [CrossRef]
- Pinsky, P.; Rinzel, J. Intrinsic and network rhythmogenesis in a reduced traub model for CA3 neurons. J. Comput. Neurosci. 1994, 1, 39–60. [Google Scholar] [CrossRef] [PubMed]
- Traub, R.; Jefferys, J.; Miles, R.; Whittington, M.; Toth, K. A branching dendritic model of a rodent CA3 pyramidal neuron. J. Physiol. 1994, 481, 79–95. [Google Scholar] [CrossRef] [PubMed]
- Traub, R.; Wong, R.; Mile, S.R.; Michelson, H. A model of a CA3 hippocampal pyramidal neuron incorporating voltage-clamp data on intrinsic conductances. J. Neurophysiol. 1991, 66, 635–650. [Google Scholar] [CrossRef] [PubMed]
- Wang, X.; Buzsaki, G. Gamma oscillation by synaptic inhibition in a hippocampal interneuronal network model. J. Neurosci. 1996, 16, 6402–6413. [Google Scholar] [CrossRef]
- Menschik, E.; Yen, S.-C.; Finkel, L. Model and scale-independent performance of a hippocampal CA3 network architecture. Neurocomputing 1999, 26–27, 443–453. [Google Scholar] [CrossRef]
- Menschik, E.; Finkel, L. Neuromodulatory control of hippocampal function: Towards a model of Alzheimer’s disease. Artif. Intell. Med. 1998, 13, 99–121. [Google Scholar] [CrossRef]
- Menschik, E.; Finkel, L. Cholinergic neuromodulation of an anatomically reconstructed hippocampal CA3 pyramidal cell. Neurocomput 2000, 32–33, 197–205. [Google Scholar] [CrossRef]
- Świetlik, D.; Białowąs, J.; Moryś, J.; Kusiak, A. Computer Model of Synapse Loss During an Alzheimer’s Disease-like Pathology in Hippocampal Subregions DG, CA3 and CA1—the Way to Chaos and Information Transfer. Entropy 2019, 21, 408. [Google Scholar] [CrossRef]
- Świetlik, D.; Białowąs, J. Application of Artificial Neural Networks to Identify Alzheimer’s Disease Using Cerebral Perfusion SPECT Data. Int. J. Environ. Res. Public Health 2019, 16, 1303. [Google Scholar] [CrossRef]
- Świetlik, D.; Białowąs, J.; Kusiak, A.; Cichońska, D. Memory and forgetting processes with the firing neuron model. Folia Morphol. 2018, 77, 221–233. [Google Scholar] [CrossRef]
- Świetlik, D.; Białowąs, J.; Kusiak, A.; Cichońska, D. A computational simulation of long-term synaptic potentiation inducing protocol processes with model of CA3 hippocampal microcircuit. Folia Morphol. 2018, 77, 210–220. [Google Scholar] [CrossRef]
- Świetlik, D. Simulations of Learning, Memory, and Forgetting Processes with Model of CA1 Region of the Hippocampus. Complexity 2018. [Google Scholar] [CrossRef]
- Bliss, T.V.P.; Collingridge, G.L. A synaptic model of memory: long-term potentiation in the hippocampus. Nature 1993, 361, 31–39. [Google Scholar] [CrossRef] [PubMed]
- Raymond, C.R. LTP forms 1, 2 and 3: different mechanisms for the ‘long’ in long-term potentiation. Trends Neurosci. 2007, 30, 167–175. [Google Scholar] [CrossRef] [PubMed]
- Massey, P.V.; Bashir, Z.I. Long-term depression: multiple forms and implications for brain function. Trends Neurosci. 2007, 30, 176–184. [Google Scholar] [CrossRef] [PubMed]
- Shouval, H.Z.; Bear, M.F.; Cooper, L.N. A unified model of NMDA receptor-dependent bidirectional synaptic plasticity. Proc. Natl. Acad. Sci. U.S.A. 2002, 6, 10831–10836. [Google Scholar] [CrossRef]
- Castellani, C.C.; Oquinlan, E.M.; Bersani, F.; Cooper, L.N.; Shouval, H.Z. A model of bidirectional synaptic plasticity: From signaling network to channel conductance. Learn Mem. 2005, 12, 423–432. [Google Scholar] [CrossRef] [Green Version]
- Earnshaw, B.A.; Bressloff, P. C: Biophysical Model of AMPA Receptor Trafficking and Its Regulation during Long-Term Potentiation/Long-Term Depression. J. Neurosci. 2006, 26, 12362–12373. [Google Scholar] [CrossRef]
- Gerstner, W.; Kistler, W.M. Spiking Neuron Models. Single Neurons, Populations, Plasticity; Cambridge University Press: Cambridge, UK, 2002. [Google Scholar]
- Nowotny, T.; Rabinovich, M.I.; Abarbanel, H.D.I. Spatial representation of temporal information through spike timing dependent plasticity. Phys. Rev. E 2003. [Google Scholar] [CrossRef] [PubMed]
- Benuskova, L.; Kasabow, N. Modeling L-LTP based on changes in concentration of pCREB transcription factor. Neurocomputing 2007, 70, 2035–2040. [Google Scholar] [CrossRef] [Green Version]
- Aradi, I.; Holmes, W. Role of multiple calcium and calcium-dependent conductances in regulation of hippocampal dentate granule cell excitability. J. Comput. Neurosci. 1999, 6, 215–235. [Google Scholar] [CrossRef]
- Poirazi, P.; Brannon, T.; Mel, B.W. Arithmetic of subthreshold synaptic summation in a model CA1 pyramidal cell. Neuron 2003, 37, 977–987. [Google Scholar] [CrossRef]
- Poirazi, P.; Brannon, T.; Mel, B.W. Pyramidal neuron as two-layer neural network. Neuron 2003, 37, 989–999. [Google Scholar] [CrossRef]
- Santhakumar, V. Role of Mossy Fiber Sprouting and Mossy Cell Loss in Hyperexcitability: A Network Model of the Dentate Gyrus Incorporating Cell Types and Axonal Topography. J. Neurophysiol. 2004, 93, 437–453. [Google Scholar] [CrossRef]
- Saraga, F.; Wu, C.P.; Zhang, L.; Skinner, F.K. Active dendrites and spike propagation in multi-compartment models of oriens-lacunosum/moleculare hippocampal interneurons. J. Physiol. 2003, 552, 673–689. [Google Scholar] [CrossRef]
- Klausberger, T.; Somogyi, P. Neuronal diversity and temporal dynamics: The unity of hippocampal circuit operations. Science 2008, 321, 53–57. [Google Scholar] [CrossRef] [PubMed]
- Somogyi, P.; Katona, L.; Klausberger, T.; Lasztoczi, B.; Viney, T. Temporal redistribution of inhibition over neuronal subcellular domains underlies statedependent rhythmic change of excitability in the hippocampus. Philos. Trans. R Soc. Lond. B Biol. Sci. 2013, 369, 20120518. [Google Scholar] [CrossRef]
- Tukker, J.; Lasztoczi, B.; Katona, L. Distinct Dendritic Arborization and In Vivo Firing Patterns of Parvalbumin-Expressing Basket Cells in the Hippocampal Area CA3. J. Neurosci. 2013, 33, 6809–6825. [Google Scholar] [CrossRef] [Green Version]
- Witter, M. Connectivity of the Hippocampus. Hippocampal Microcircuits: A Computational Modeler’s Resource Book; Springer: New York, NY, YSA, 2010. [Google Scholar]
- Eckman, J.P.; Ruelle, D. Ergodic theory of chaos and strange attractor. Rev. Moder Phys. 1985. [Google Scholar] [CrossRef]
- Packard, N.H.; Crutchfield, J.P.; Farmer, J.D.; Shaw, R.S. Geometry from a Time Series. Phys. Rev. Lett. 1980, 45, 712–716. [Google Scholar] [CrossRef]
- Farmer, J.D.; Ott, E.; Yorke, J.A. The dimension of chaotic attractors. Phys. D. 1983, 7, 153–180. [Google Scholar] [CrossRef]
- Kennel, M.; Brown, R.; Abarbanel, H. Determining embedding dimension for phase-space reconstruction using a geometrical construction. Phys. Rev. A 1992, 45, 3403–3411. [Google Scholar] [CrossRef]
- Marwan, N.; Romano, M.C.; Thiel, M.; Kurths, J. Recurrence plots for the analysis of complex systems. Phys. Rep. 2007, 438, 237–329. [Google Scholar] [CrossRef]
- Cutsuridis, V.; Hasselm, M. GABAergic modulation of gating, timing and theta phase precession of hippocampal neuronal activity during theta oscillations. Hippocampus 2012, 22. [Google Scholar] [CrossRef] [PubMed]
- Cutsuridis, V.; Cobb, S.; Graham, B. Encoding and retrieval in the hippocampal CA1 microcircuit model. Hippocampus 2010, 20, 423–446. [Google Scholar] [CrossRef]
- Cutsuridis, V.; Graham, B.; Cobb, S.R.; Vida, I. Hippocampal Microcircuits: A Computational Modelers’ Resource Book; Springer: New York, NY, YSA, 2010. [Google Scholar] [CrossRef]
- Viney, T.; Lasztoczi, B.; Katona, L. Network state-dependent inhibition of identified hippocampal CA3 axo-axonic cells in vivo. Nat. Neurosci. 2013, 16, 1802–1811. [Google Scholar] [CrossRef] [Green Version]
- Price, D. Aging of the brain and dementia of the Alzheimer type. In Principles of Neural Science; McGraw-Hill: New York, NY, USA, 2000. [Google Scholar]
- Horn, D.; Levy, N.; Ruppin, E. Neuronal-based synaptic compensation: A computational study in Alzheimer’s disease. Neural Comput. 1996, 8, 1227. [Google Scholar] [CrossRef]
- Horn, D.; Ruppin, E.; Usher, M.; Herrmann, M. Neural network modeling of memory deterioration in Alzheimer’s disease. Neural Comput. 1993, 5, 736–749. [Google Scholar] [CrossRef]
- Reggia, J.; Ruppin, E.; Berndt, R. Computer models: A new approach to the investigation of disease. M.D. Comput.: Comput. Med. Pract. 1997, 14, 160–168. [Google Scholar]
- Ruppin, E.; Reggia, J. A neural model of memory impairment in diffuse cerebral atrophy. Br. J. Psychiatry 1995, 166, 19–28. [Google Scholar] [CrossRef] [PubMed]
- Hasselmo, M. Runaway synaptic modification in models of cortex: Implications for Alzheimer’s disease. Neural Netw. 1994, 7, 13–40. [Google Scholar] [CrossRef]
- Hasselmo, M. Neuromodulation and cortical function: Modeling the physiological basis of behavior. Behav. Brain Res. 1995, 67, 1–27. [Google Scholar] [CrossRef]
- Siegle, G.; Hasselmo, M. Using connectionist models to guide assessment of psychological disorder. Psychol. Assess 2002, 14, 263–278. [Google Scholar] [CrossRef]
- Izhikevich, E.M. Simple model of spiking neurons. IEEE Trans Neural Netw. 2003, 14, 1569–1572. [Google Scholar] [CrossRef] [PubMed] [Green Version]
- Haeusler, S.; Maass, W. A statistical analysis of information-processing properties of lamina-specific cortical microcircuit models. Cereb. Cortex 2007, 17, 149–162. [Google Scholar] [CrossRef]
- Hines, M. A program for simulation of nerve equations with branching geometries. Int. J. Biomed. Comput. 1989, 24, 55–68. [Google Scholar] [CrossRef]
- Bower, J.M.; Beeman, D. The Book of GENSIS: Exploring Realistic Neural Models with the GEneral NEural SImulation System, 2nd ed.; Springer: New York, NY, USA, 1998. [Google Scholar]
- Traub, R.D.; Contreras, D.; Cunningham, M.O. Single-Column Thalamocortical Network Model Exhibiting Gamma Oscillations, Sleep Spindles, and Epileptogenic Bursts. J. Neurophysiol. 2005, 93, 2194–2223. [Google Scholar] [CrossRef] [PubMed]
- Elias, J.G.; Northmore, D.P.M. Building Silicon Nervous Systems with Dendritic Tree Neuromorphs. In Pulsed Neural Networks; Maass, W., Bishop, C.M., Eds.; MIT Press: Cambridge, UK, 1998; pp. 135–156. [Google Scholar]
- Arthur, J.V.; Boahen, K. Recurrently Connected Silicon Neurons with Active Dendrites for One-Shot Learning. Proc. IEEE Int. Jt. Conf. Neural Netw. 2004. [Google Scholar] [CrossRef]
- Indiveri, G.; Chicca, E.; Douglas, R.A. VLSI array of low-power spiking neurons and bistable synapses with spike-timing dependent plasticity. IEEE Trans. Neural Netw. 2006, 17, 211–221. [Google Scholar] [CrossRef] [PubMed]
- Morie, T.; Matsuura, T.; Nagata, M. A multinanodot floating-gate MOSFET circuit for spiking neuron models. TNANO 2003, 2, 158–164. [Google Scholar] [CrossRef]
Sample Availability: Samples of the compounds are available from the authors. |


| CA1 Cells | LSW | EPSPd [mV] | IPSPd [mV] |
|---|---|---|---|
| Pyramidal cell (P1) | 0.2 | 4.5 | −6 |
| Pyramidal cell (P2) | 0.2 | 4.5 | −6 |
| Pyramidal cell (P3) | 0.2 | 4.5 | −6 |
| Pyramidal cell (P4) | 0.2 | 4.5 | −6 |
| Basket cell (B1) | 1 | 4 | −4.5 |
| Basket cell (B2) | 1 | 4 | −5.5 |
| O-LM 1 cell | 0.6 | 4 | −4 |
| CA3 Cells | LSW | EPSPd [mV] | IPSPd [mV] |
|---|---|---|---|
| Pyramidal cell (P5) | 0.6 | 4.5 | −6 |
| Pyramidal cell (P6) | 0.6 | 4.5 | −6 |
| Pyramidal cell (P7) | 0.6 | 4.5 | −6 |
| Pyramidal cell (P8) | 0.6 | 4.5 | −6 |
| Basket cell (B3) | 1 | 4 | −4.5 |
| Basket cell (B4) | 1 | 4 | −5.5 |
| O-LM 2 cell | 0.6 | 4 | −4 |
© 2019 by the authors. Licensee MDPI, Basel, Switzerland. This article is an open access article distributed under the terms and conditions of the Creative Commons Attribution (CC BY) license (http://creativecommons.org/licenses/by/4.0/).
Share and Cite
Świetlik, D.; Białowąs, J.; Moryś, J.; Klejbor, I.; Kusiak, A. Computer Modeling of Alzheimer’s Disease—Simulations of Synaptic Plasticity and Memory in the CA3-CA1 Hippocampal Formation Microcircuit. Molecules 2019, 24, 1909. https://doi.org/10.3390/molecules24101909
Świetlik D, Białowąs J, Moryś J, Klejbor I, Kusiak A. Computer Modeling of Alzheimer’s Disease—Simulations of Synaptic Plasticity and Memory in the CA3-CA1 Hippocampal Formation Microcircuit. Molecules. 2019; 24(10):1909. https://doi.org/10.3390/molecules24101909
Chicago/Turabian StyleŚwietlik, Dariusz, Jacek Białowąs, Janusz Moryś, Ilona Klejbor, and Aida Kusiak. 2019. "Computer Modeling of Alzheimer’s Disease—Simulations of Synaptic Plasticity and Memory in the CA3-CA1 Hippocampal Formation Microcircuit" Molecules 24, no. 10: 1909. https://doi.org/10.3390/molecules24101909