
An Integrated Experimental/Theoretical Study of Structurally Related Poly-Thiophenes Used in Photovoltaic Systems


 , and
, and 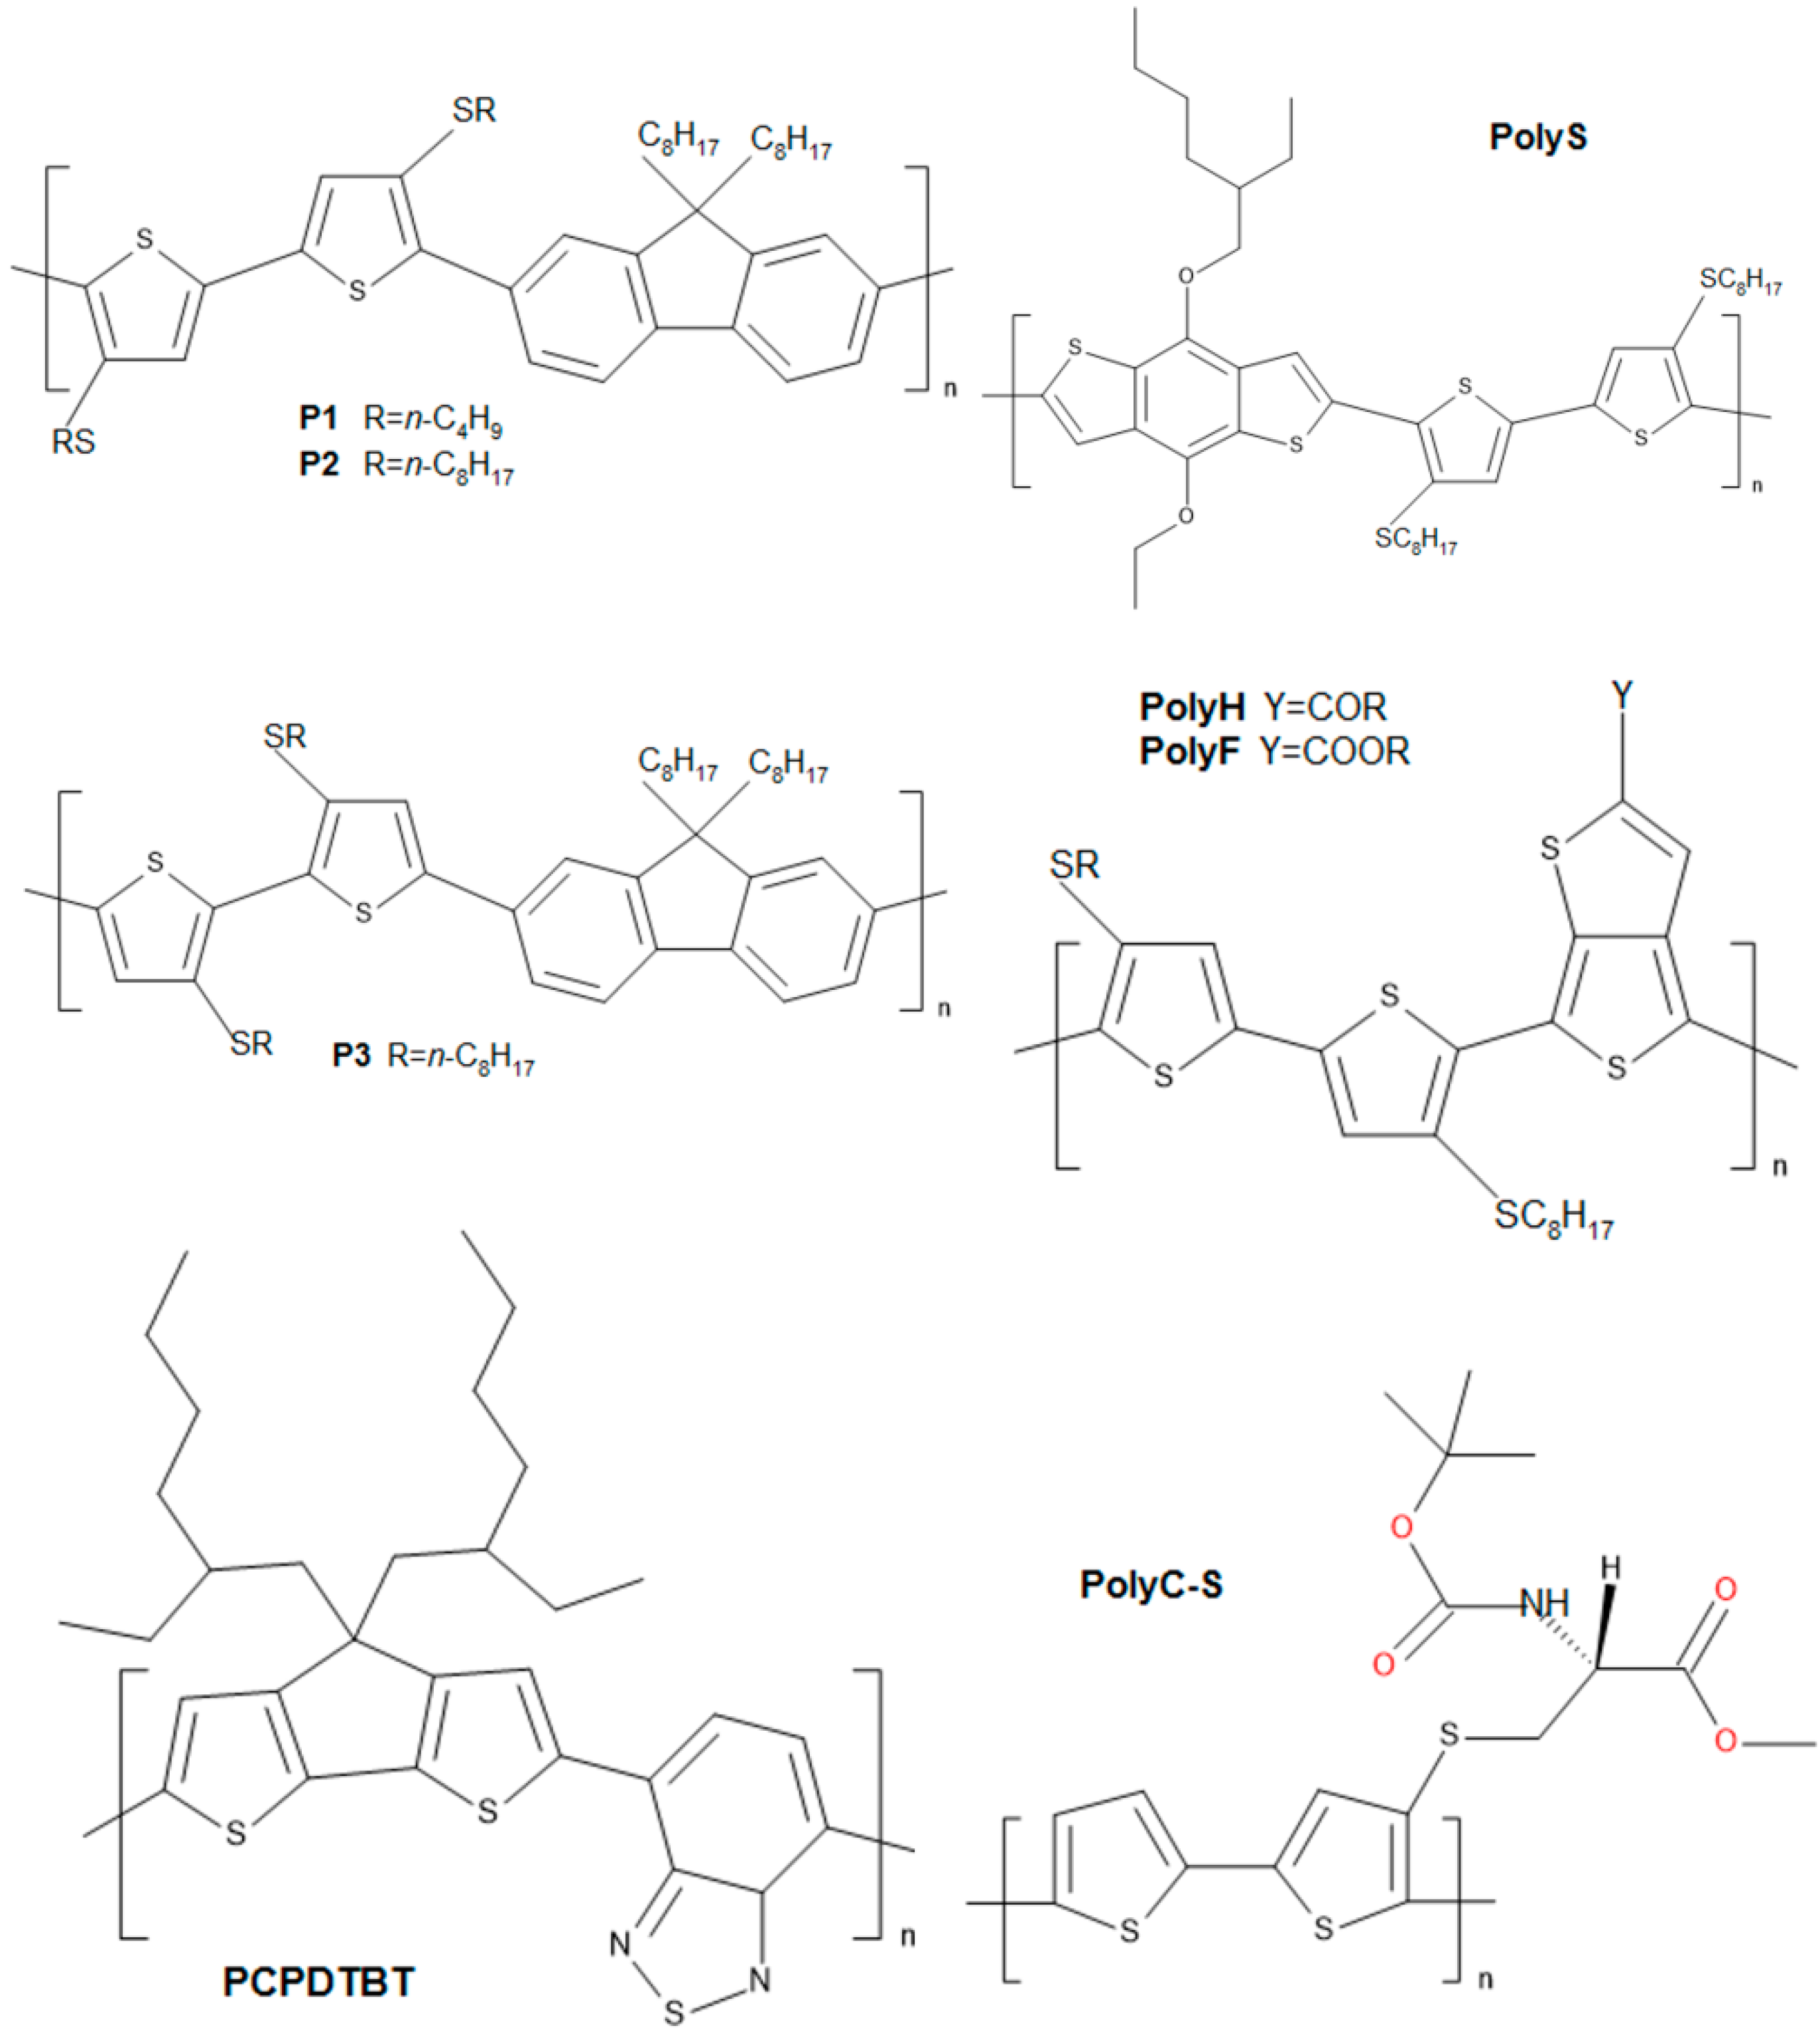
Abstract
:1. Introduction

2. Semiconductive Polythiophene Structures
3. Experimental Setup


4. Computational Details
5. Theoretical Background
5.1. Orbital Energies: DFT vs. HF
5.2. Computing the Band Gaps
5.3. Optical and Electrochemical Band Gaps

6. Results


7. Conclusions
- (1)
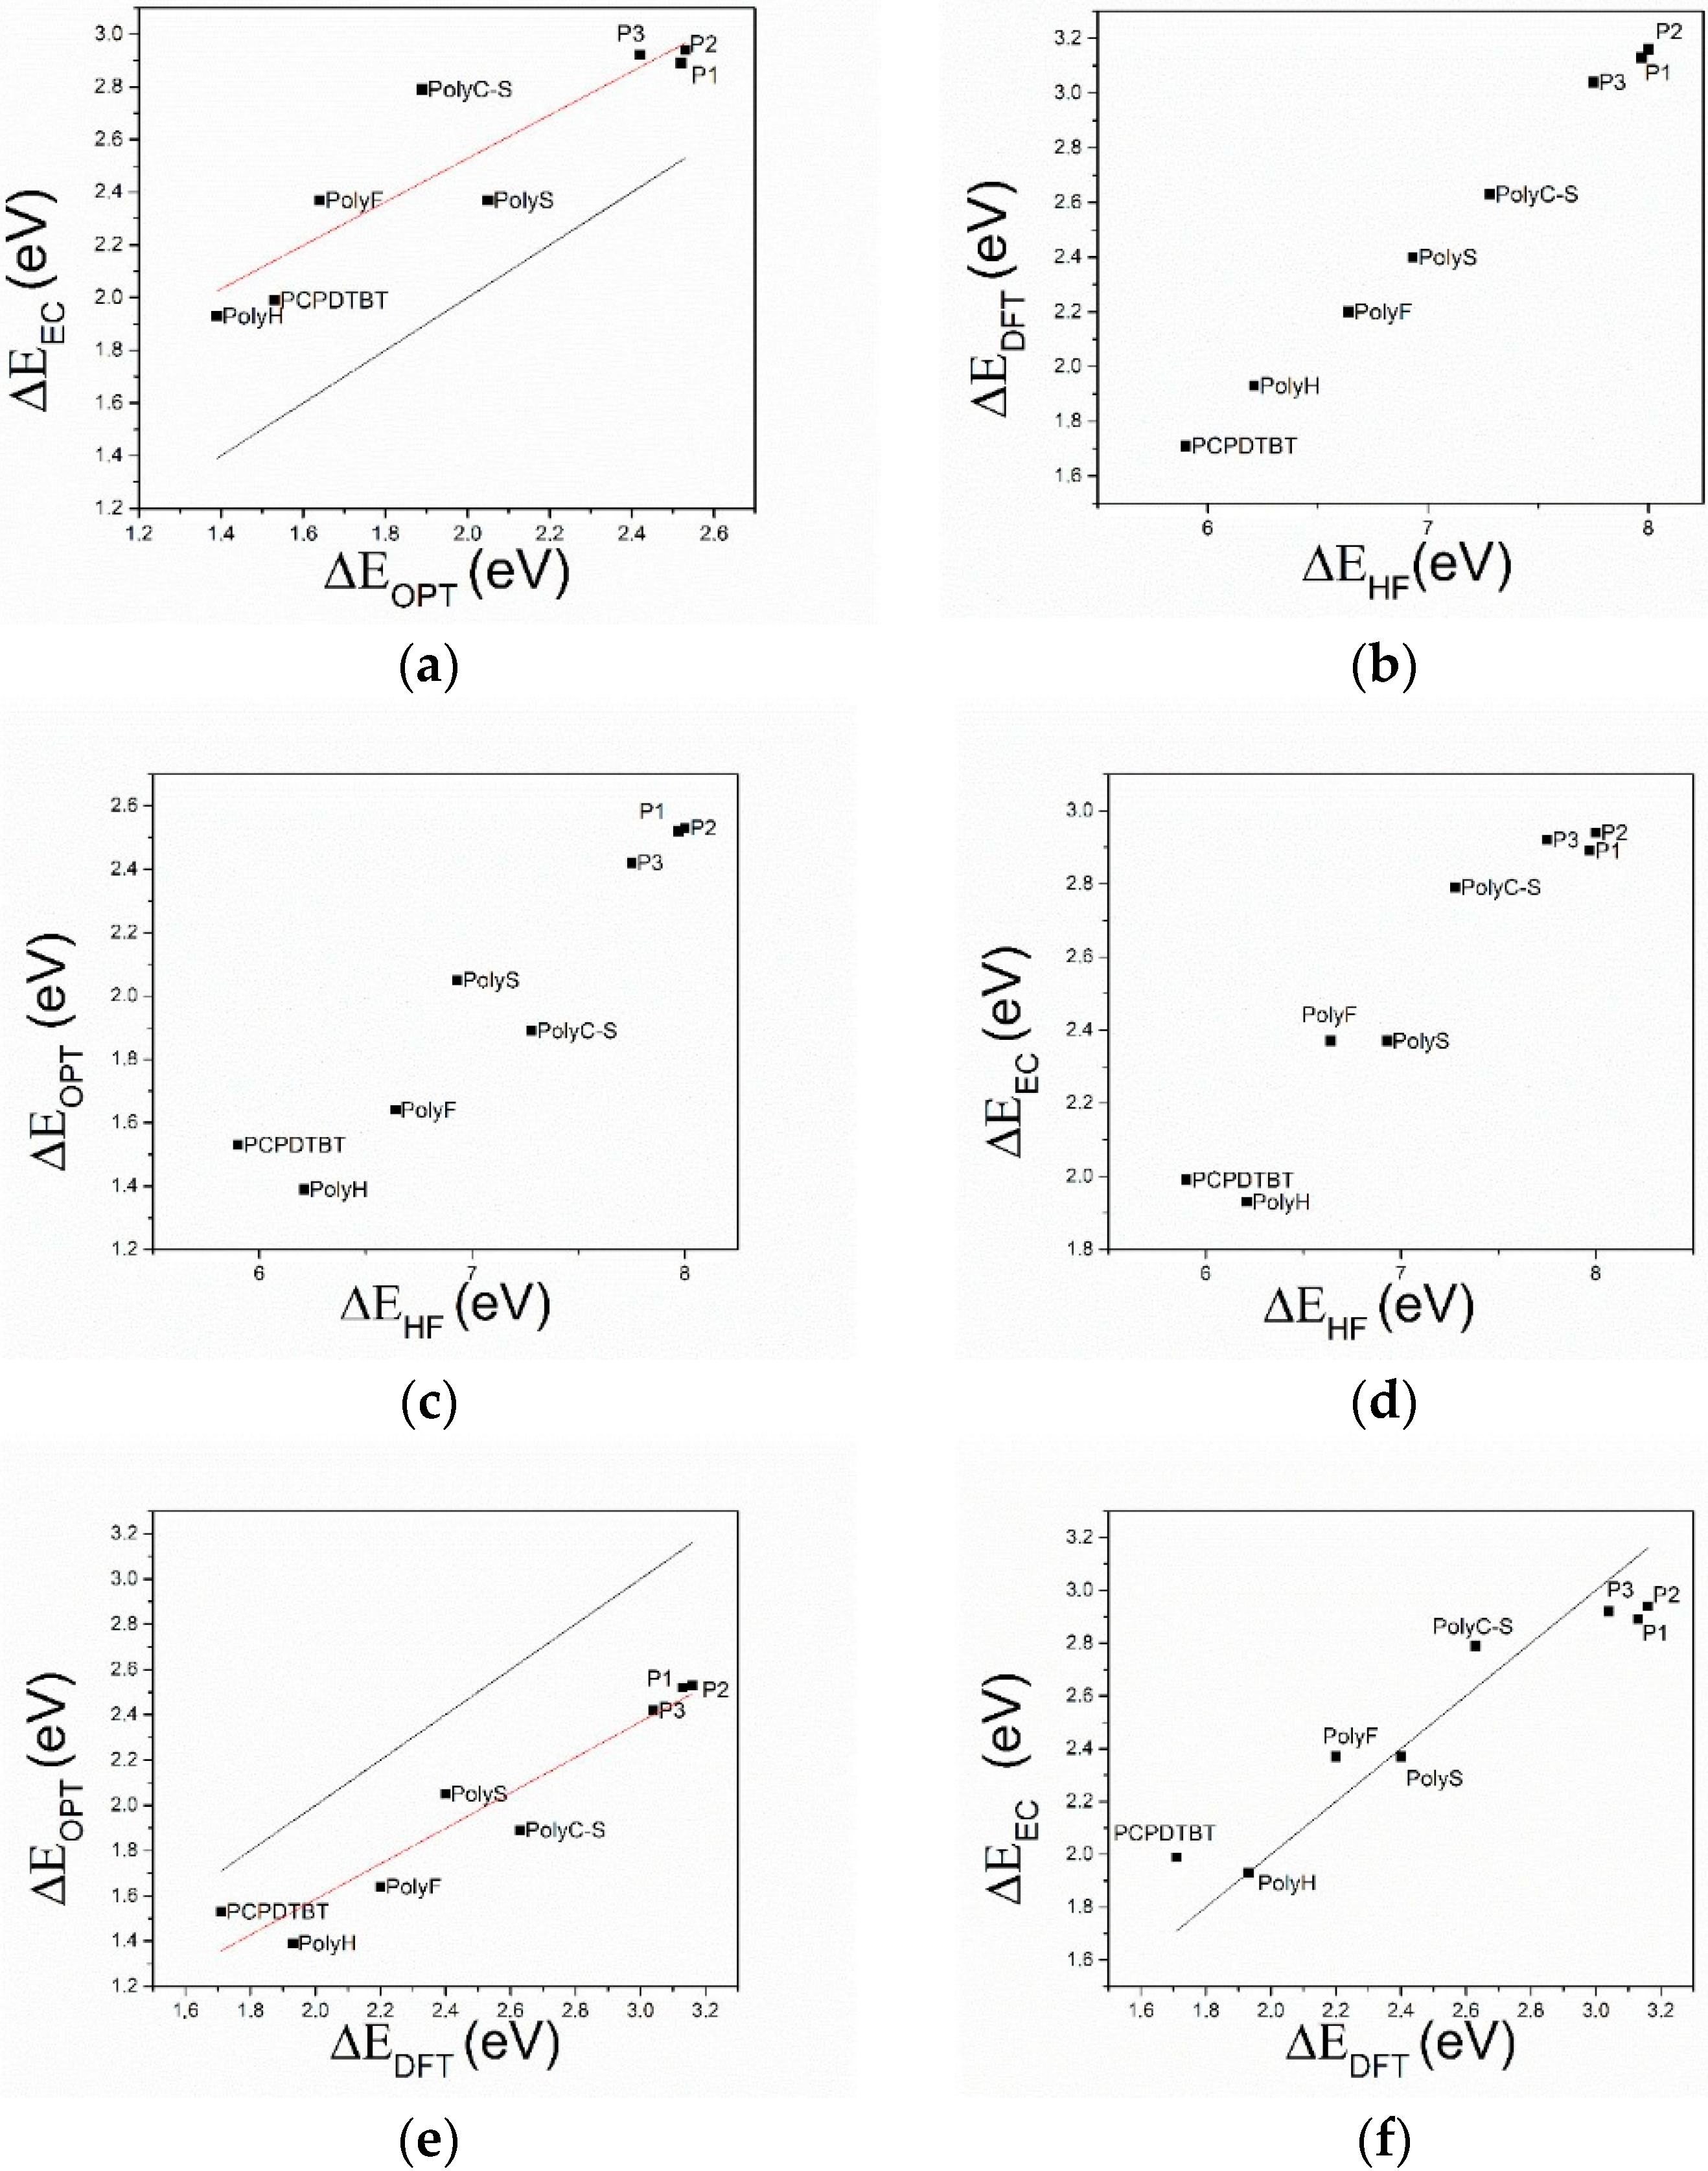
- The comparison of HF and DFT theoretical data, with both electrochemical and spectroscopic experimental band gap values, shows that the HF approach provides a dramatic overestimation of the band gap. The exchange-correlation and electron-correlation cannot be neglected; they have to be taken into account to assess the correct band gap energy. Indeed, ΔEDFT values definitively show a better quantitative match with both the electrochemical and spectroscopic band gap values, as it is shown in Figure 5 and Figure 6.
- (2)
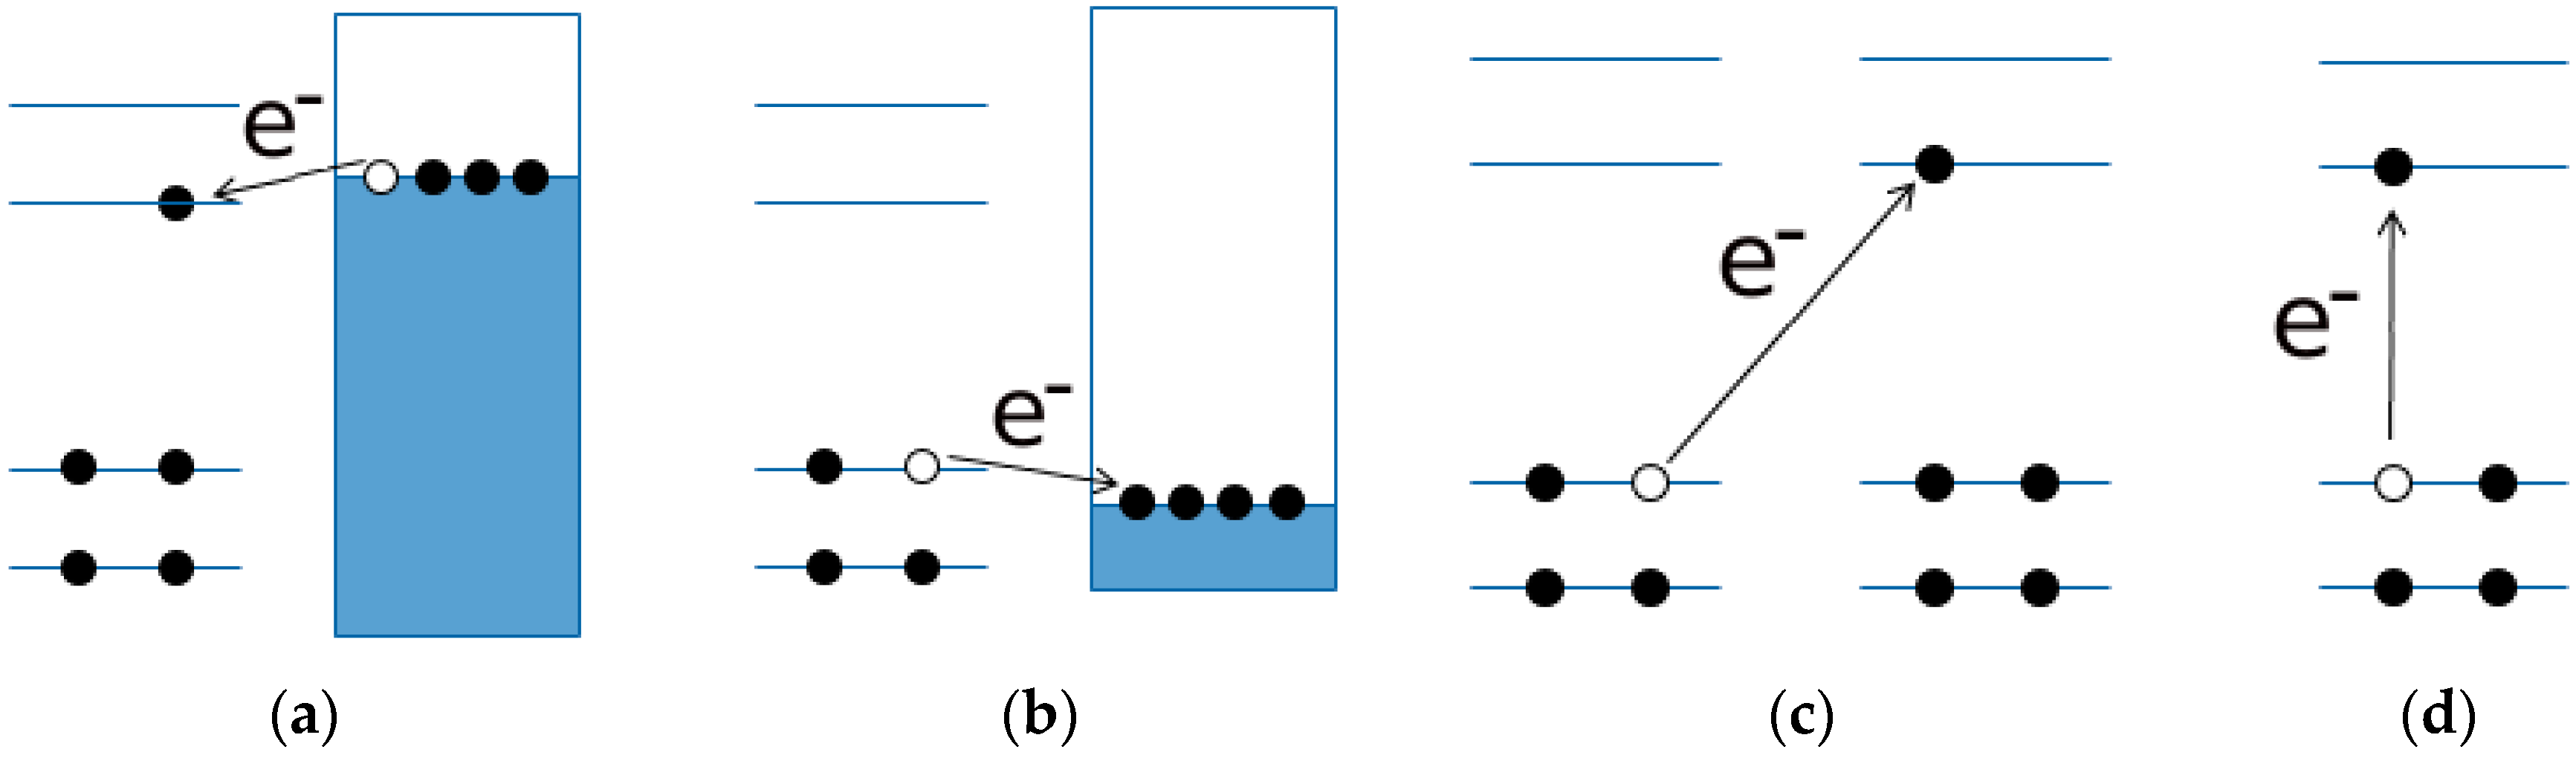
- Arguments, based both on the purely modelistic (Figure 4) and on the comparison between DFT and experimental data (Figure 5 and Figure 6), show that the most effective approach to be used when assessing the band gap characteristics for photovoltaic materials is to make a reference to both the DFT and electrochemical methods to determine the HOMO-LUMO band gap.
- (3)
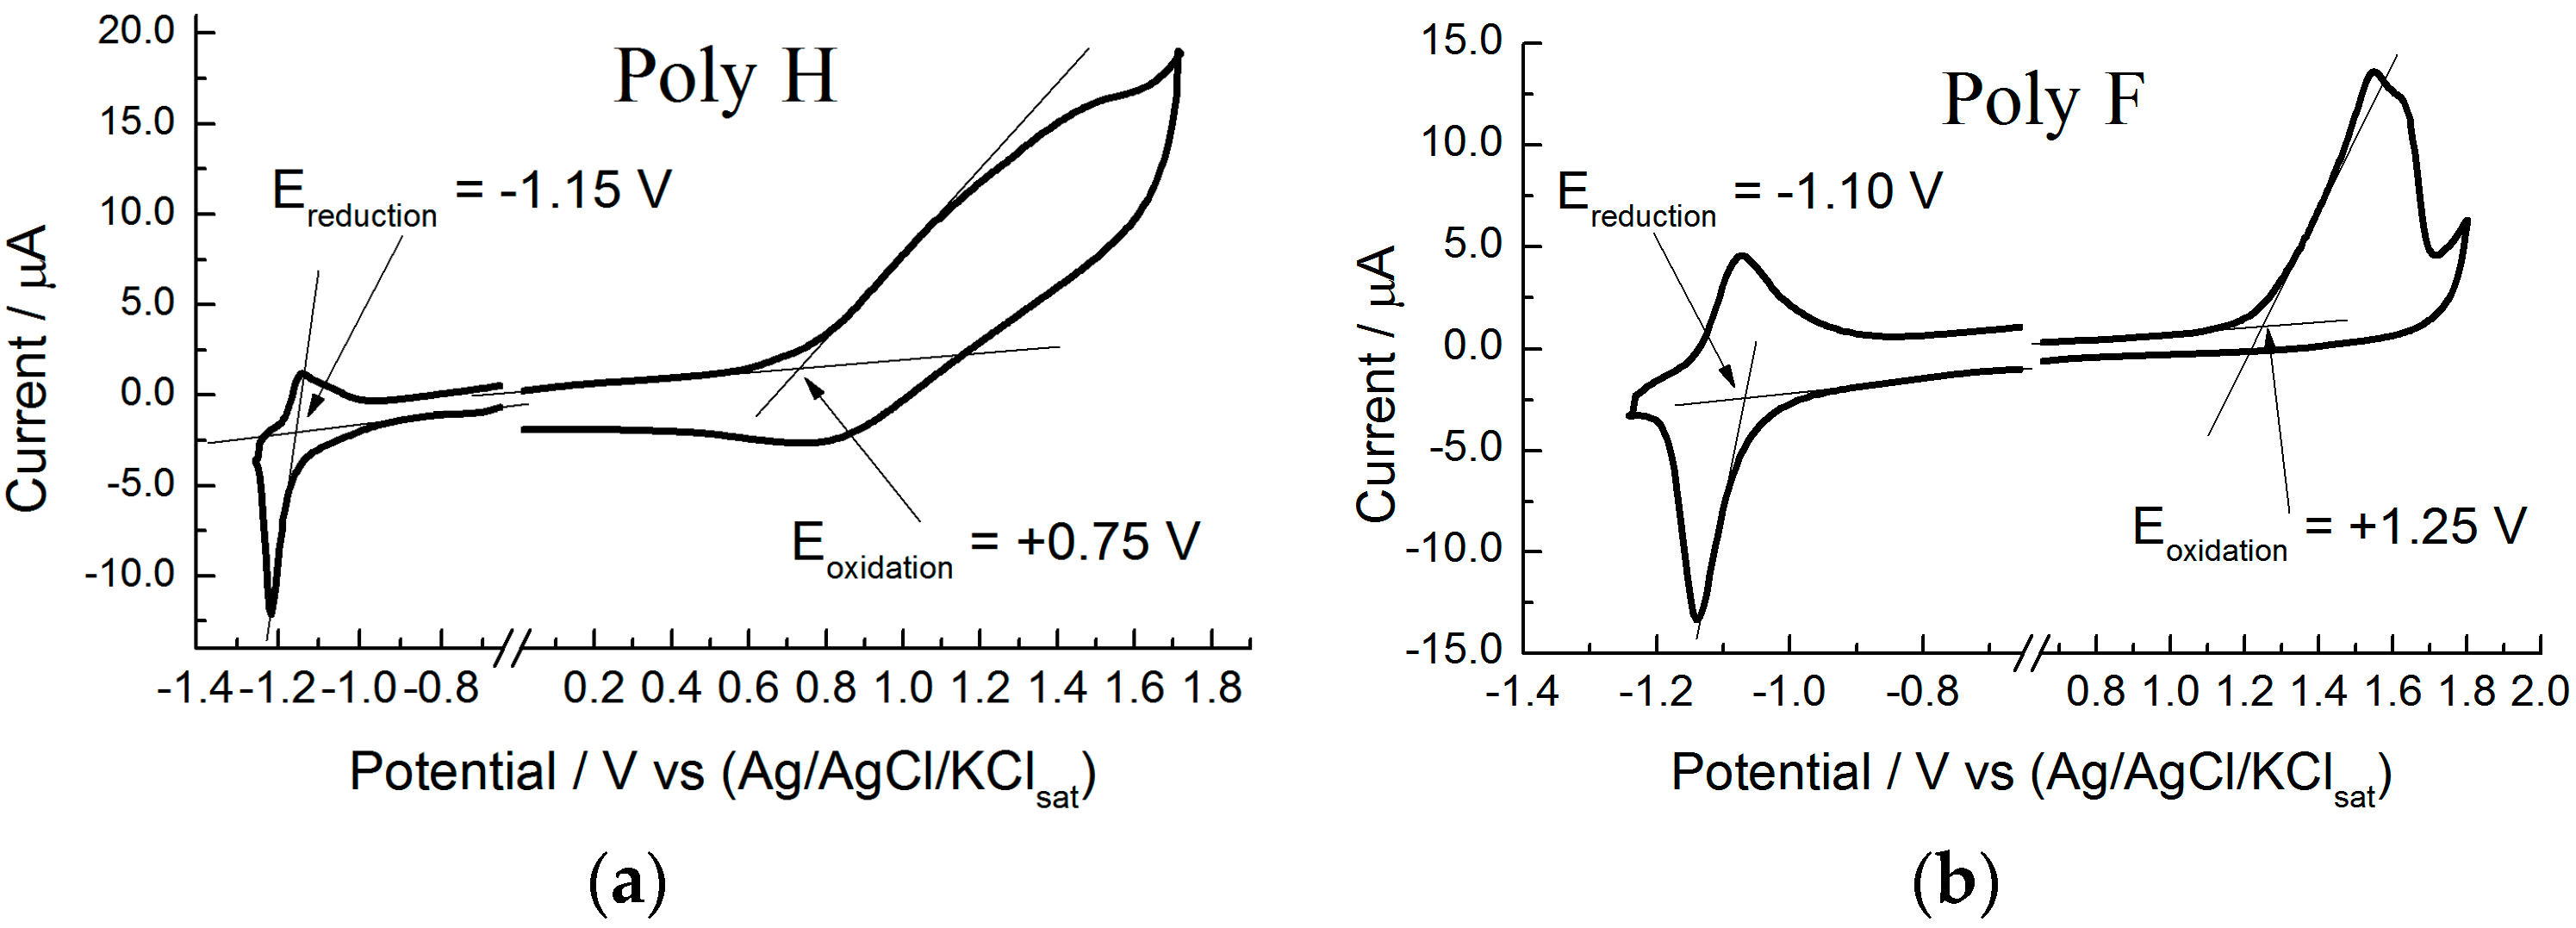
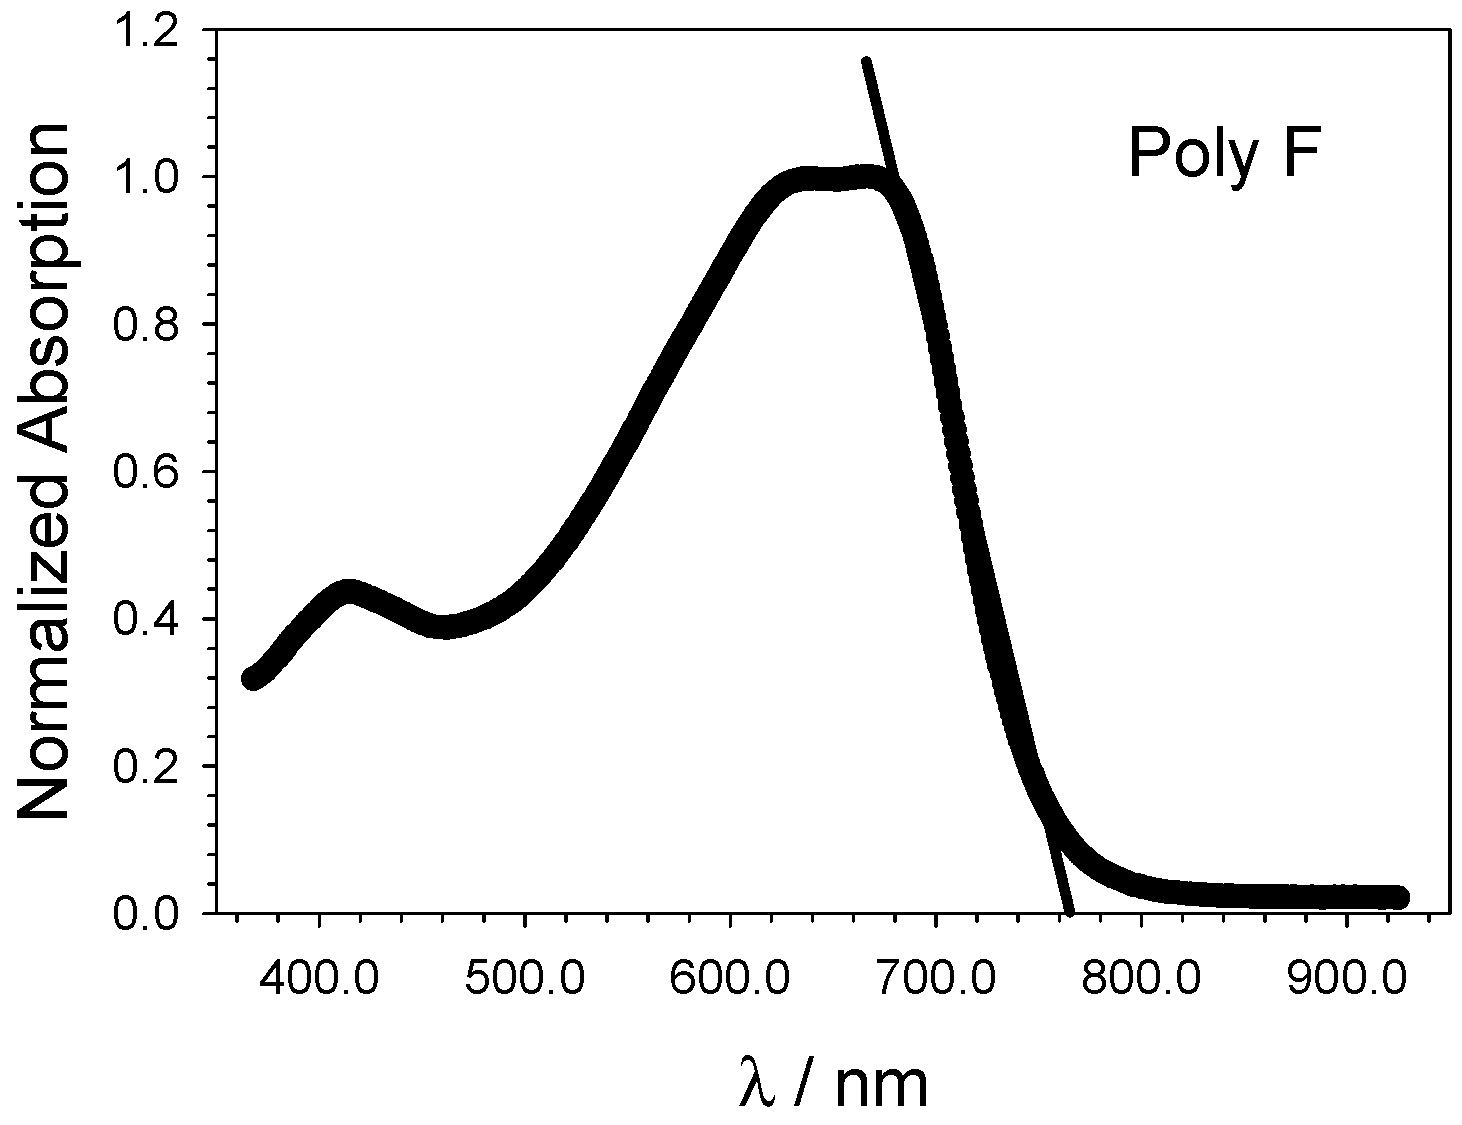
- Eventually, an empirical quantitative value can be determined for the exciton stabilization energy (), vide infra relation 8. The close comparison of the physics underlying absorption in electronic spectra (Figure 4d) and reduction/oxidation current peaks in cyclic voltammetry measurements (Figure 4a,b) together with the systematic difference observed in Figure 5a (the least square fit yields ΔEEC = 0.53 + 0.99 ΔEOPT) allow us to propose a value of about 0.5 eV (the intercept of the least square fit) as an average value for the exciton stabilization energy [30,32]. Such an estimate is further supported by the systematic shift observed in Figure 6 between the ΔEOPT vs. ΔEDFT pattern (red line represents the least square fitting of the ΔEOPT vs. ΔEDFT data) and the relevant equivalence line.
Acknowledgments
Author Contributions
Conflicts of Interest
References and Notes
- Tung, R.T. Chemical Bonding and Fermi Level Pinning at Metal-Semiconductor Interfaces. Phys. Rev. Lett. 2000, 84, 6078–6081. [Google Scholar] [CrossRef] [PubMed]
- Mohilner, D.M. The electrical double layer, part I: Elements of double-layer theory. In Electroanalytical Chemistry: A Series of Advances; Bard, A.J., Ed.; CRC Press: Boca Raton, FL, USA, 1996; Volume 1. [Google Scholar]
- Bard, A.J.; Faulkner, L.R. Electrochemical Methods: Fundamentals and Applications, 2nd ed.; Wiley: New York, NY, USA, 1980. [Google Scholar]
- Bredas, J.L.; Street, G.B. Polarons, bipolarons, and solitons in conducting polymers. Acc. Chem. Res. 1985, 18, 309–315. [Google Scholar] [CrossRef]
- Brédas, J.L.; Wudl, F.; Heeger, A.J. Polarons and bipolarons in doped polythiophene: A theoretical investigation. Solid State Commun. 1987, 63, 577–580. [Google Scholar] [CrossRef]
- Roncali, J. Synthetic Principles for Bandgap Control in Linear π-Conjugated Systems. Chem. Rev. 1997, 97, 173–206. [Google Scholar] [CrossRef] [PubMed]
- Pesant, S.; Boulanger, P.; Côté, M.; Ernzerhof, M. Ab initio study of ladder-type polymers: Polythiophene and polypyrrole. Chem. Phys. Lett. 2008, 450, 329–334. [Google Scholar] [CrossRef]
- Lan, Y.-K.; Yang, C.H.; Yang, H.-C. Theoretical investigations of electronic structure and charge transport properties in polythiophene-based organic field-effect transistors. Polym. Int. 2010, 59, 16–21. [Google Scholar] [CrossRef]
- Rawson, J.; Angiolillo, P.J.; Therien, M.J. Extreme electron polaron spatial delocalization in π-conjugated materials. PNAS 2015, 112, 13779–13783. [Google Scholar] [CrossRef] [PubMed]
- Joseph Kline, R.; McGehee, M.D.; Toney, M.F. Highly oriented crystals at the buried interface in polythiophene thin-film transistors. Nat. Mater. 2006, 5, 222–228. [Google Scholar] [CrossRef]
- Di Nuzzo, D.; Fontanesi, C.; Jones, R.; Allard, S.; Dumsch, I.; Scherf, U.; von Hauff, E.; Schumacher, S.; da Como, E. How intermolecular geometrical disorder affects the molecular doping of donor-acceptor copolymers. Nat. Commun. 2015, 6. [Google Scholar] [CrossRef] [PubMed] [Green Version]
- Hallermann, M.; Como, E.D.; Feldmann, J.; Izquierdo, M.; Filippone, S.; Martín, N.; Jüchter, S.; von Hauff, E. Correlation between charge transfer exciton recombination and photocurrent in polymer/fullerene solar cells. Appl. Phys. Lett. 2010, 97, 023301. [Google Scholar] [CrossRef]
- Veysel Tunc, A.; de Sio, A.; Riedel, D.; Deschler, F.; da Como, E.; Parisi, J.; von Hauff, E. Molecular doping of low-bandgap-polymer:fullerene solar cells: Effects on transport and solar cells. Org. Electron. 2012, 13, 290–296. [Google Scholar] [CrossRef]
- Li, Y. Molecular Design of Photovoltaic Materials for Polymer Solar Cells: Toward Suitable Electronic Energy Levels and Broad Absorption. Acc. Chem. Res. 2012, 45, 723–733. [Google Scholar] [CrossRef] [PubMed]
- Li, Y.; Calder, S.; Yaffe, O.; Cahen, D.; Haick, H.; Kronik, L.; Zuilhof, H. Hybrids of Organic Molecules and Flat, Oxide-Free Silicon: High-Density Monolayers, Electronic Properties, and Functionalization. Langmuir 2012, 28, 9920–9929. [Google Scholar] [CrossRef] [PubMed]
- Parenti, F.; Morvillo, P.; Bobeico, E.; Diana, R.; Lanzi, M.; Fontanesi, C.; Tassinari, F.; Schenetti, L.; Mucci, A. (Alkylsulfanyl)bithiophene-alt-Fluorene: π-Conjugated Polymers for Organic Solar Cells. Eur. J. Org. Chem. 2011, 2011, 5659–5667. [Google Scholar] [CrossRef]
- Morvillo, P.; Parenti, F.; Diana, R.; Fontanesi, C.; Mucci, A.; Tassinari, F.; Schenetti, L. A novel copolymer from benzodithiophene and alkylsulfanyl-bithiophene: Synthesis, characterization and application in polymer solar cells. Sol. Energy Mater. Sol. Cells 2012, 104, 45–52. [Google Scholar] [CrossRef]
- Morvillo, P.; Diana, R.; Fontanesi, C.; Ricciardi, R.; Lanzi, M.; Mucci, A.; Tassinari, F.; Schenetti, L.; Minarini, C.; Parenti, F. Low band gap polymers for application in solar cells: Synthesis and characterization of thienothiophene-thiophene copolymers. Polym. Chem. 2014, 5, 2391–2400. [Google Scholar] [CrossRef]
- Parenti, F.; Ricciardi, R.; Diana, R.; Morvillo, P.; Fontanesi, C.; Tassinari, F.; Schenetti, L.; Minarini, C.; Mucci, A. Polymers for application in organic solar cells: Bithiophene can work better than thienothiophene when coupled to benzodithiophene. J. Polym. Sci. A Polym. Chem. 2015. [Google Scholar] [CrossRef]
- Fontanesi, C.; Tassinari, F.; Parenti, F.; Cohen, H.; Mondal, P.C.; Kiran, V.; Giglia, A.; Pasquali, L.; Naaman, R. New One-Step Thiol Functionalization Procedure for Ni by Self-Assembled Monolayers. Langmuir 2015, 31, 3546–3552. [Google Scholar] [CrossRef] [PubMed]
- Mishra, D.; Markus, T.Z.; Naaman, R.; Kettner, M.; Gohler, B.; Zacharias, H.; Friedman, N.; Sheves, M.; Fontanesi, C. Spin-dependent electron transmission through bacteriorhodopsin embedded in purple membrane. Proc. Natl. Acad. Sci. USA 2013, 110, 14872–14876. [Google Scholar] [CrossRef] [PubMed]
- Mondal, P.C.; Kantor-Uriel, N.; Mathew, S.P.; Tassinari, F.; Fontanesi, C.; Naaman, R. Chiral Conductive Polymers as Spin Filters. Adv. Mater. 2015, 27, 1924–1927. [Google Scholar] [CrossRef] [PubMed]
- Granovsky, A.A. Firefly Version 8.0.0. Available online: http://classic.chem.msu.su/gran/firefly/index.html (accessed on 18 January 2016).
- Data available upon request to the corresponding author.
- Koch, W.; Holthausen, M.C. A Chemist’s Guide to Density Functional Theory, 2nd ed.; Wiley-VCH: New York, NY, USA, 1989. [Google Scholar]
- Martin, R.M. Electronic Structure: Basic Theory and Practical Methods; Cambridge University Press: Cambridge, UK, 2004. [Google Scholar]
- Szabo Ostlund Modern Quantum Chemistry Intro to Advanced Electronic Structure Theory 481s. Available online: http://www.scribd.com/doc/38501522/Szabo-Ostlund-Modern-Quantum-Chemistry-Intro-to-Advanced-Electronic-Structure-Theory-481s (accessed on 15 July 2013).
- Ullrich, C.A. Time-Dependent Density-Functional Theory: Concepts and Applications; Oxford University Press: Oxford, UK, 2011. [Google Scholar]
- Giuliani, G.; Vignale, G. Quantum Theory of the Electron Liquid. Available online: http://www.cambridge.org/us/academic/subjects/physics/condensed-matter-physics-nanoscience-and-mesoscopic-physics/quantum-theory-electron-liquid?format=PB (accessed on 22 December 2015).
- Amelia, M.; Lincheneau, C.; Silvi, S.; Credi, A. Electrochemical properties of CdSe and CdTe quantum dots. Chem. Soc. Rev. 2012, 41, 5728–5743. [Google Scholar] [CrossRef] [PubMed]
- Trasatti, S. The “absolute” electrode potential—The end of the story. Electrochim. Acta 1990, 35, 269–271. [Google Scholar] [CrossRef]
- Strinati, G. Application of the Green’s functions method to the study of the optical properties of semiconductors. Riv. Nuovo Cim. 2008, 11, 1–86. [Google Scholar] [CrossRef]
- Sample Availability: Samples of the compounds are not available from the authors.
© 2016 by the authors. Licensee MDPI, Basel, Switzerland. This article is an open access article distributed under the terms and conditions of the Creative Commons by Attribution (CC-BY) license ( http://creativecommons.org/licenses/by/4.0/).
Share and Cite
Vanossi, D.; Cigarini, L.; Giaccherini, A.; Da Como, E.; Fontanesi, C. An Integrated Experimental/Theoretical Study of Structurally Related Poly-Thiophenes Used in Photovoltaic Systems. Molecules 2016, 21, 110. https://doi.org/10.3390/molecules21010110
Vanossi D, Cigarini L, Giaccherini A, Da Como E, Fontanesi C. An Integrated Experimental/Theoretical Study of Structurally Related Poly-Thiophenes Used in Photovoltaic Systems. Molecules. 2016; 21(1):110. https://doi.org/10.3390/molecules21010110
Chicago/Turabian StyleVanossi, Davide, Luigi Cigarini, Andrea Giaccherini, Enrico Da Como, and Claudio Fontanesi. 2016. "An Integrated Experimental/Theoretical Study of Structurally Related Poly-Thiophenes Used in Photovoltaic Systems" Molecules 21, no. 1: 110. https://doi.org/10.3390/molecules21010110