
Identifying Key Factors of Hazardous Materials Transportation Accidents Based on Higher-Order and Multilayer Networks


Abstract
:1. Introduction
2. Related Works
3. Materials and Methods
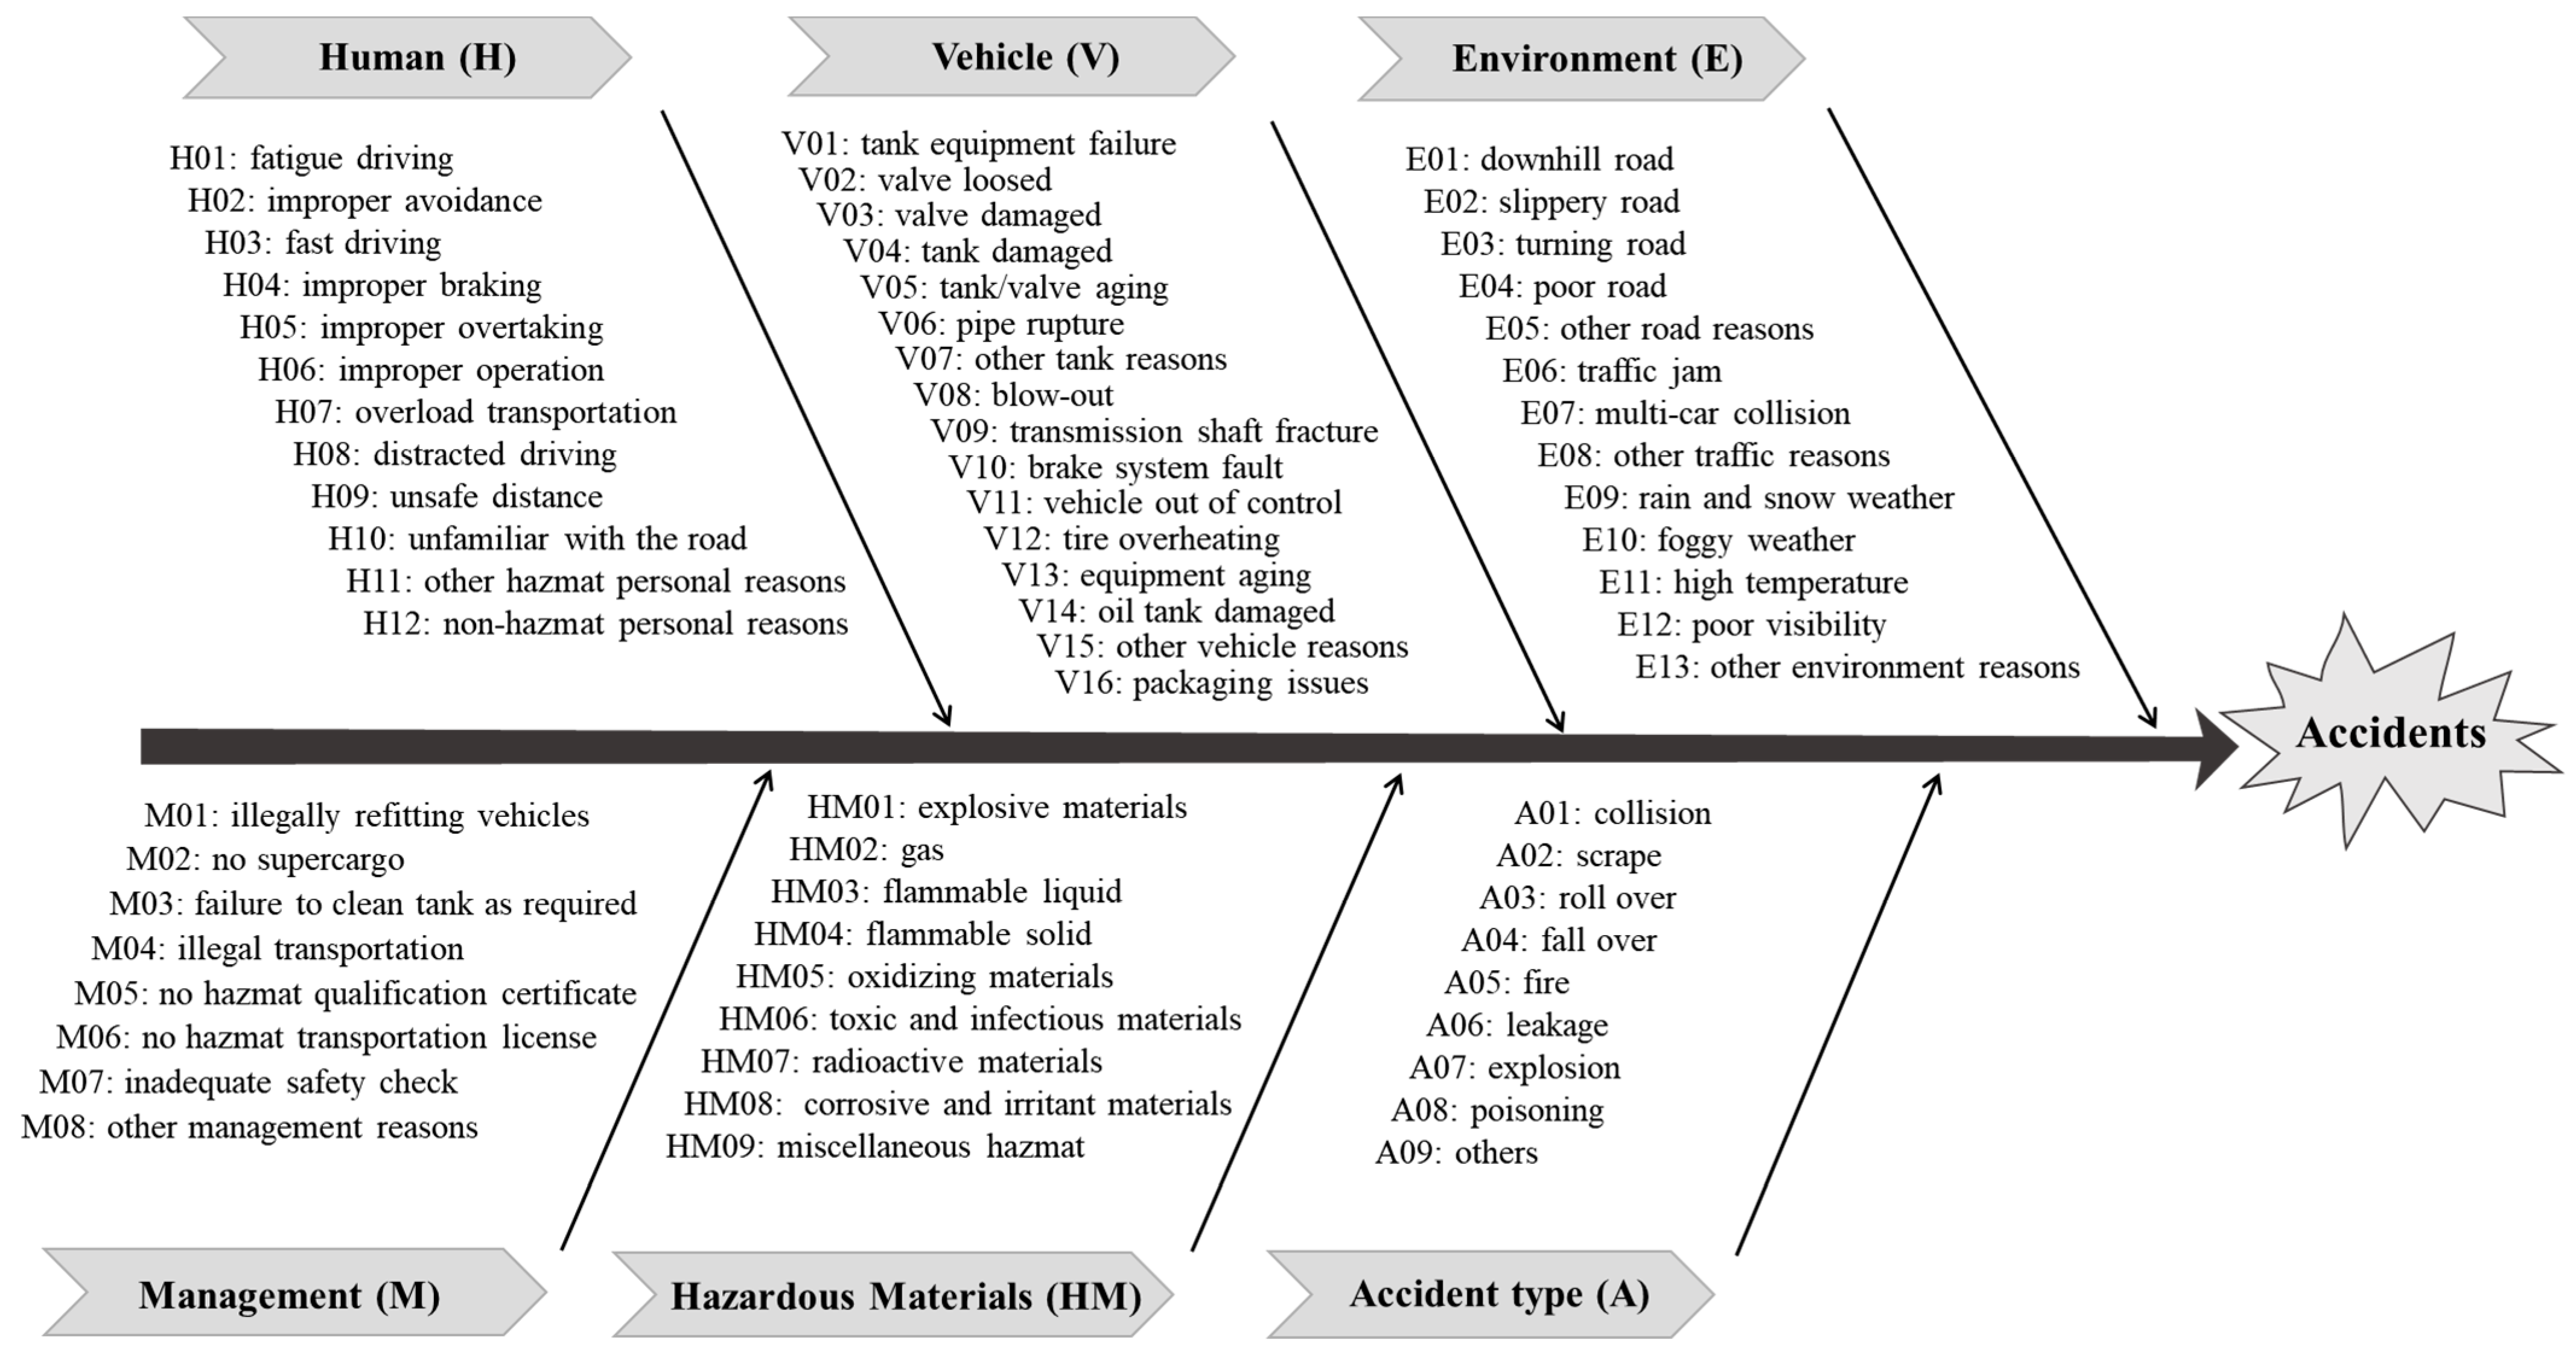
3.1. Research Data
3.2. Modeling HMTACN
3.3. Measurements in HMTACN Analysis
3.3.1. Degree and Strength
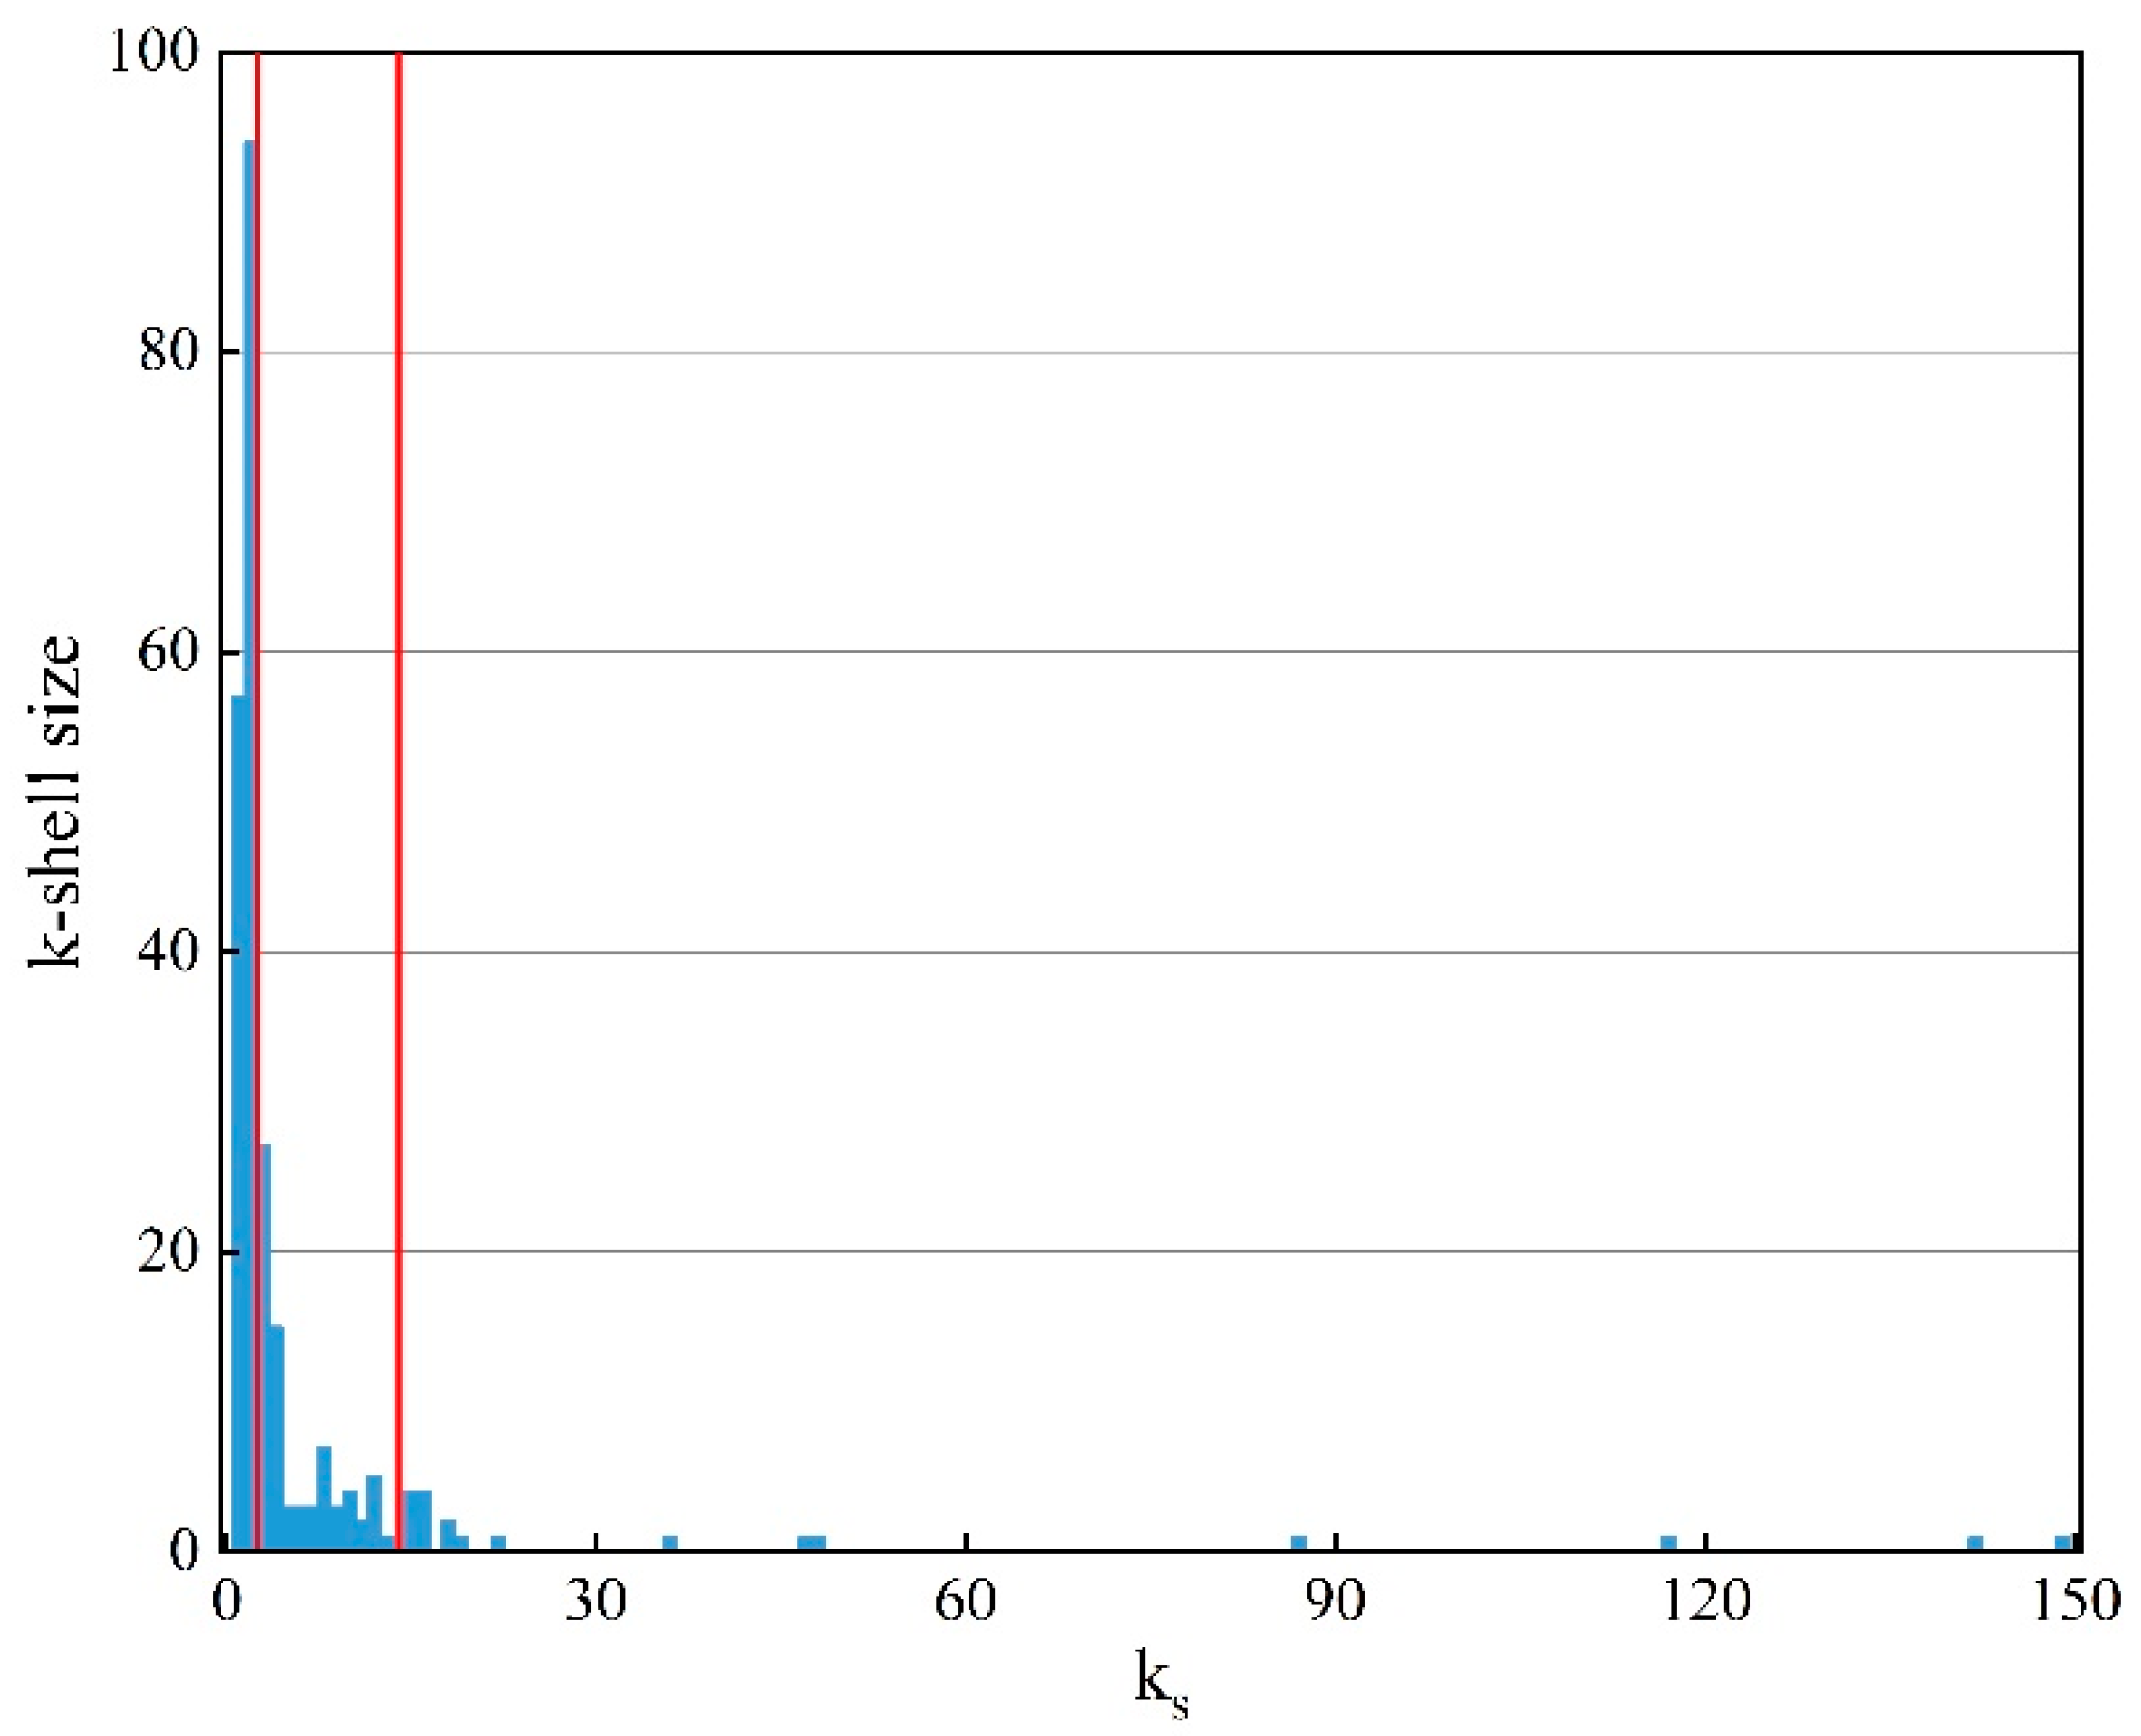
3.3.2. Weighted k-Core Decomposition
3.3.3. Measurements in HMTACN
- (1)
- Layer-degree:
- (2)
- Layer-strength:
- (3)
- Layer-:
- (4)
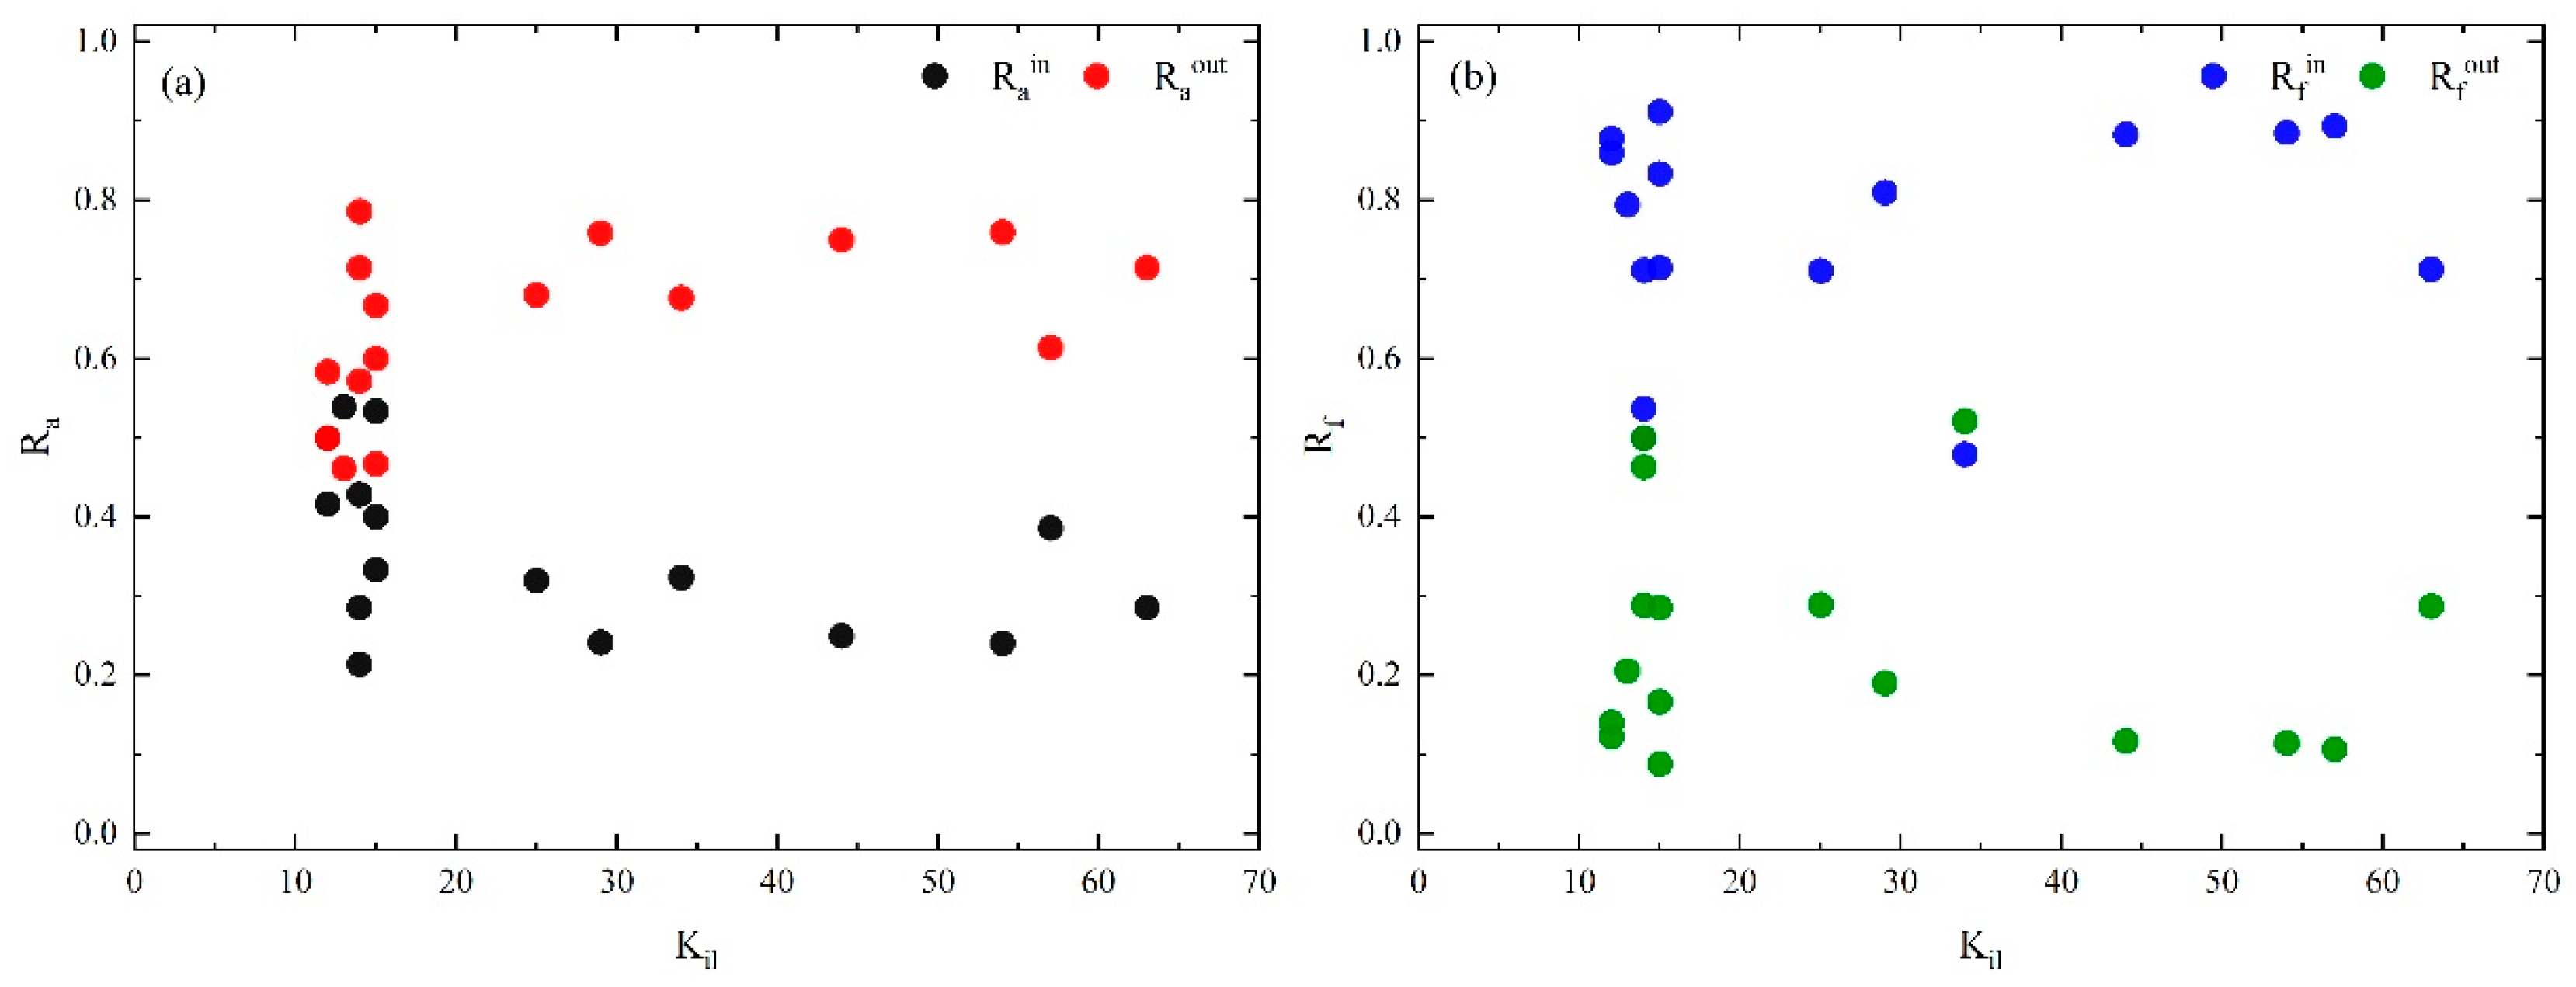
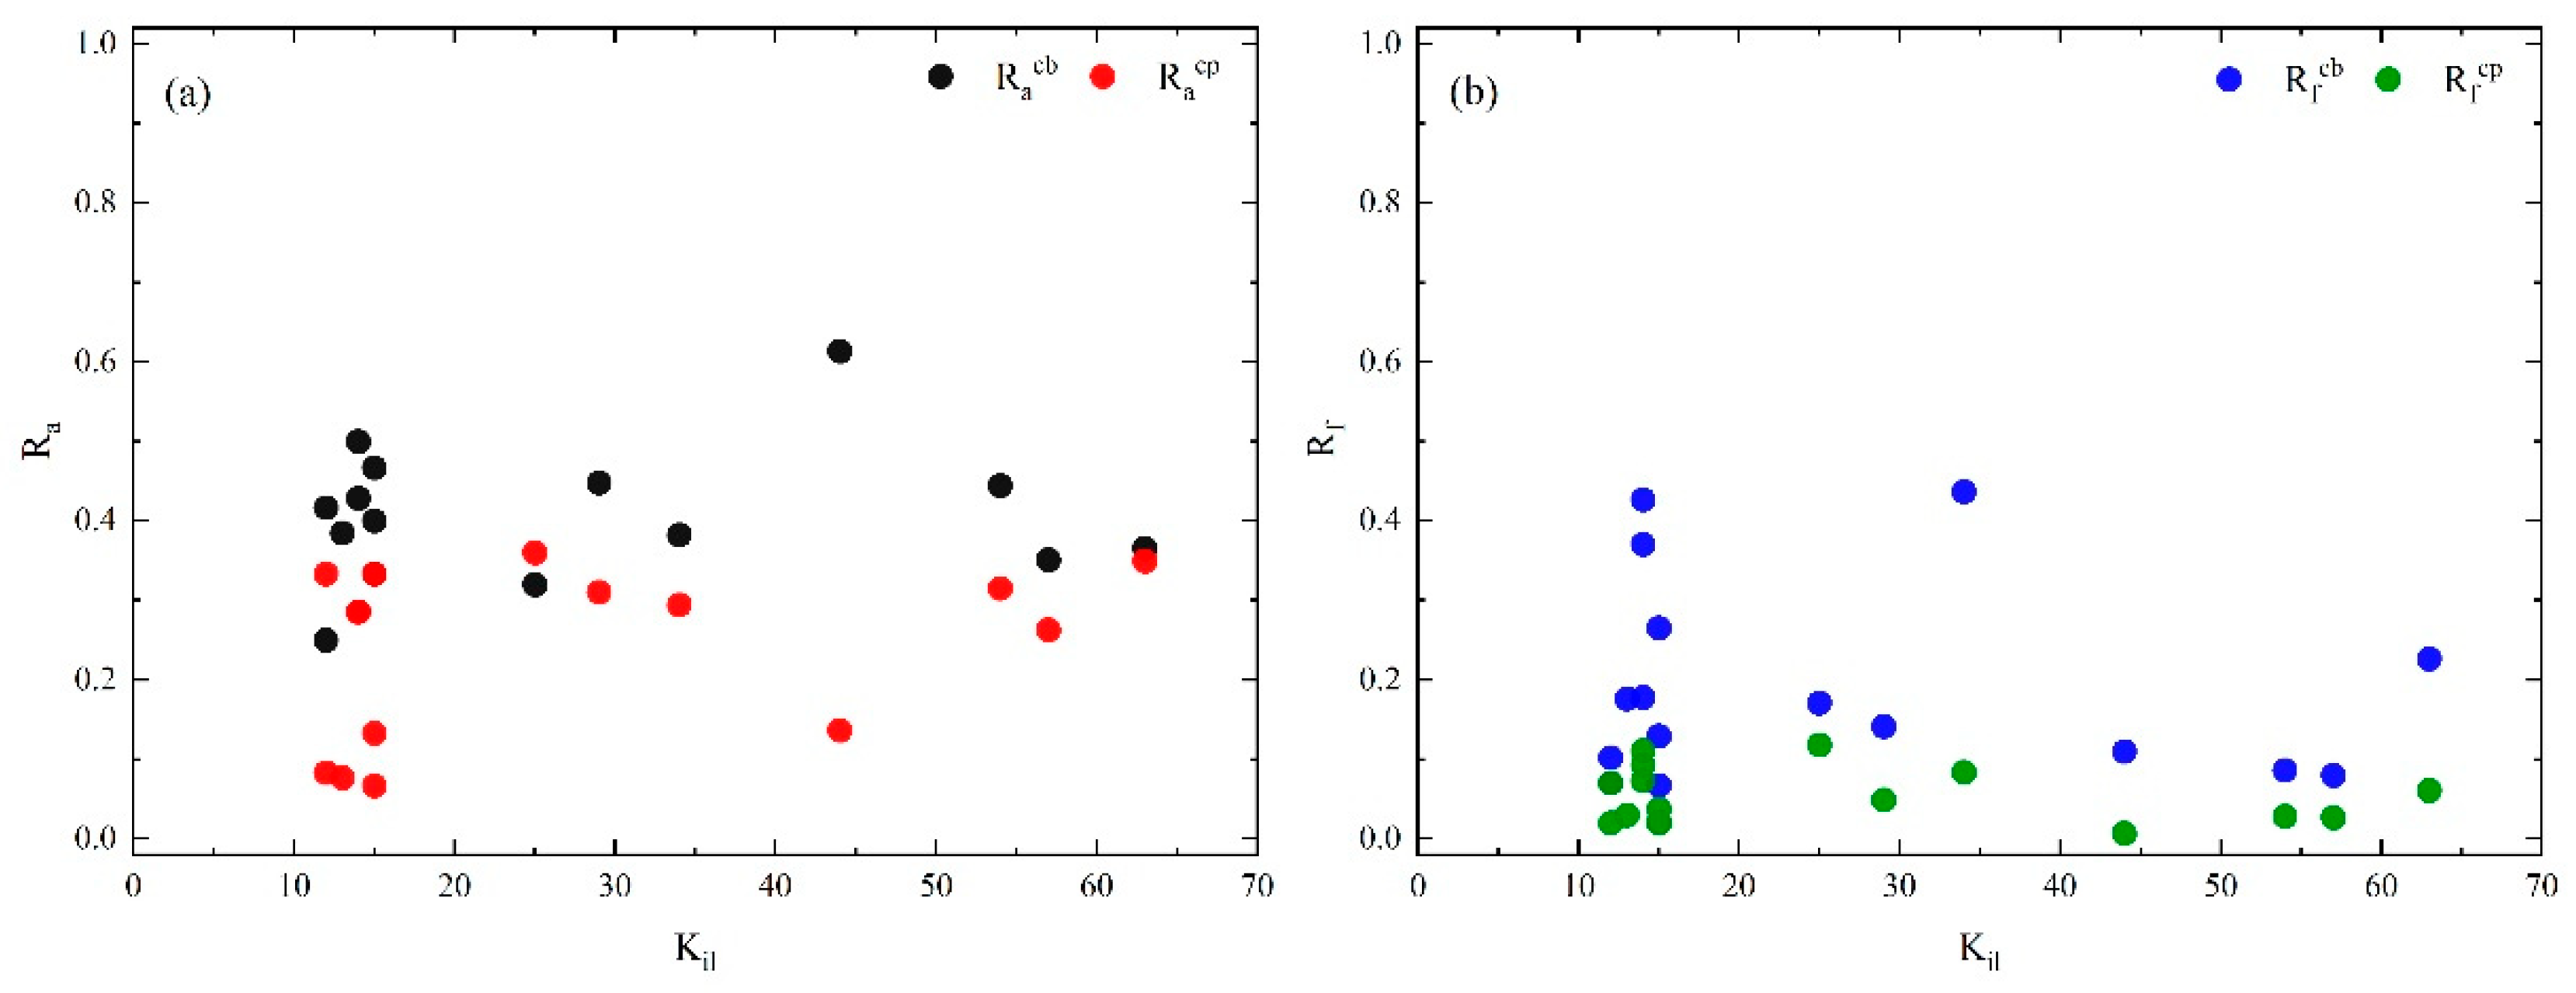
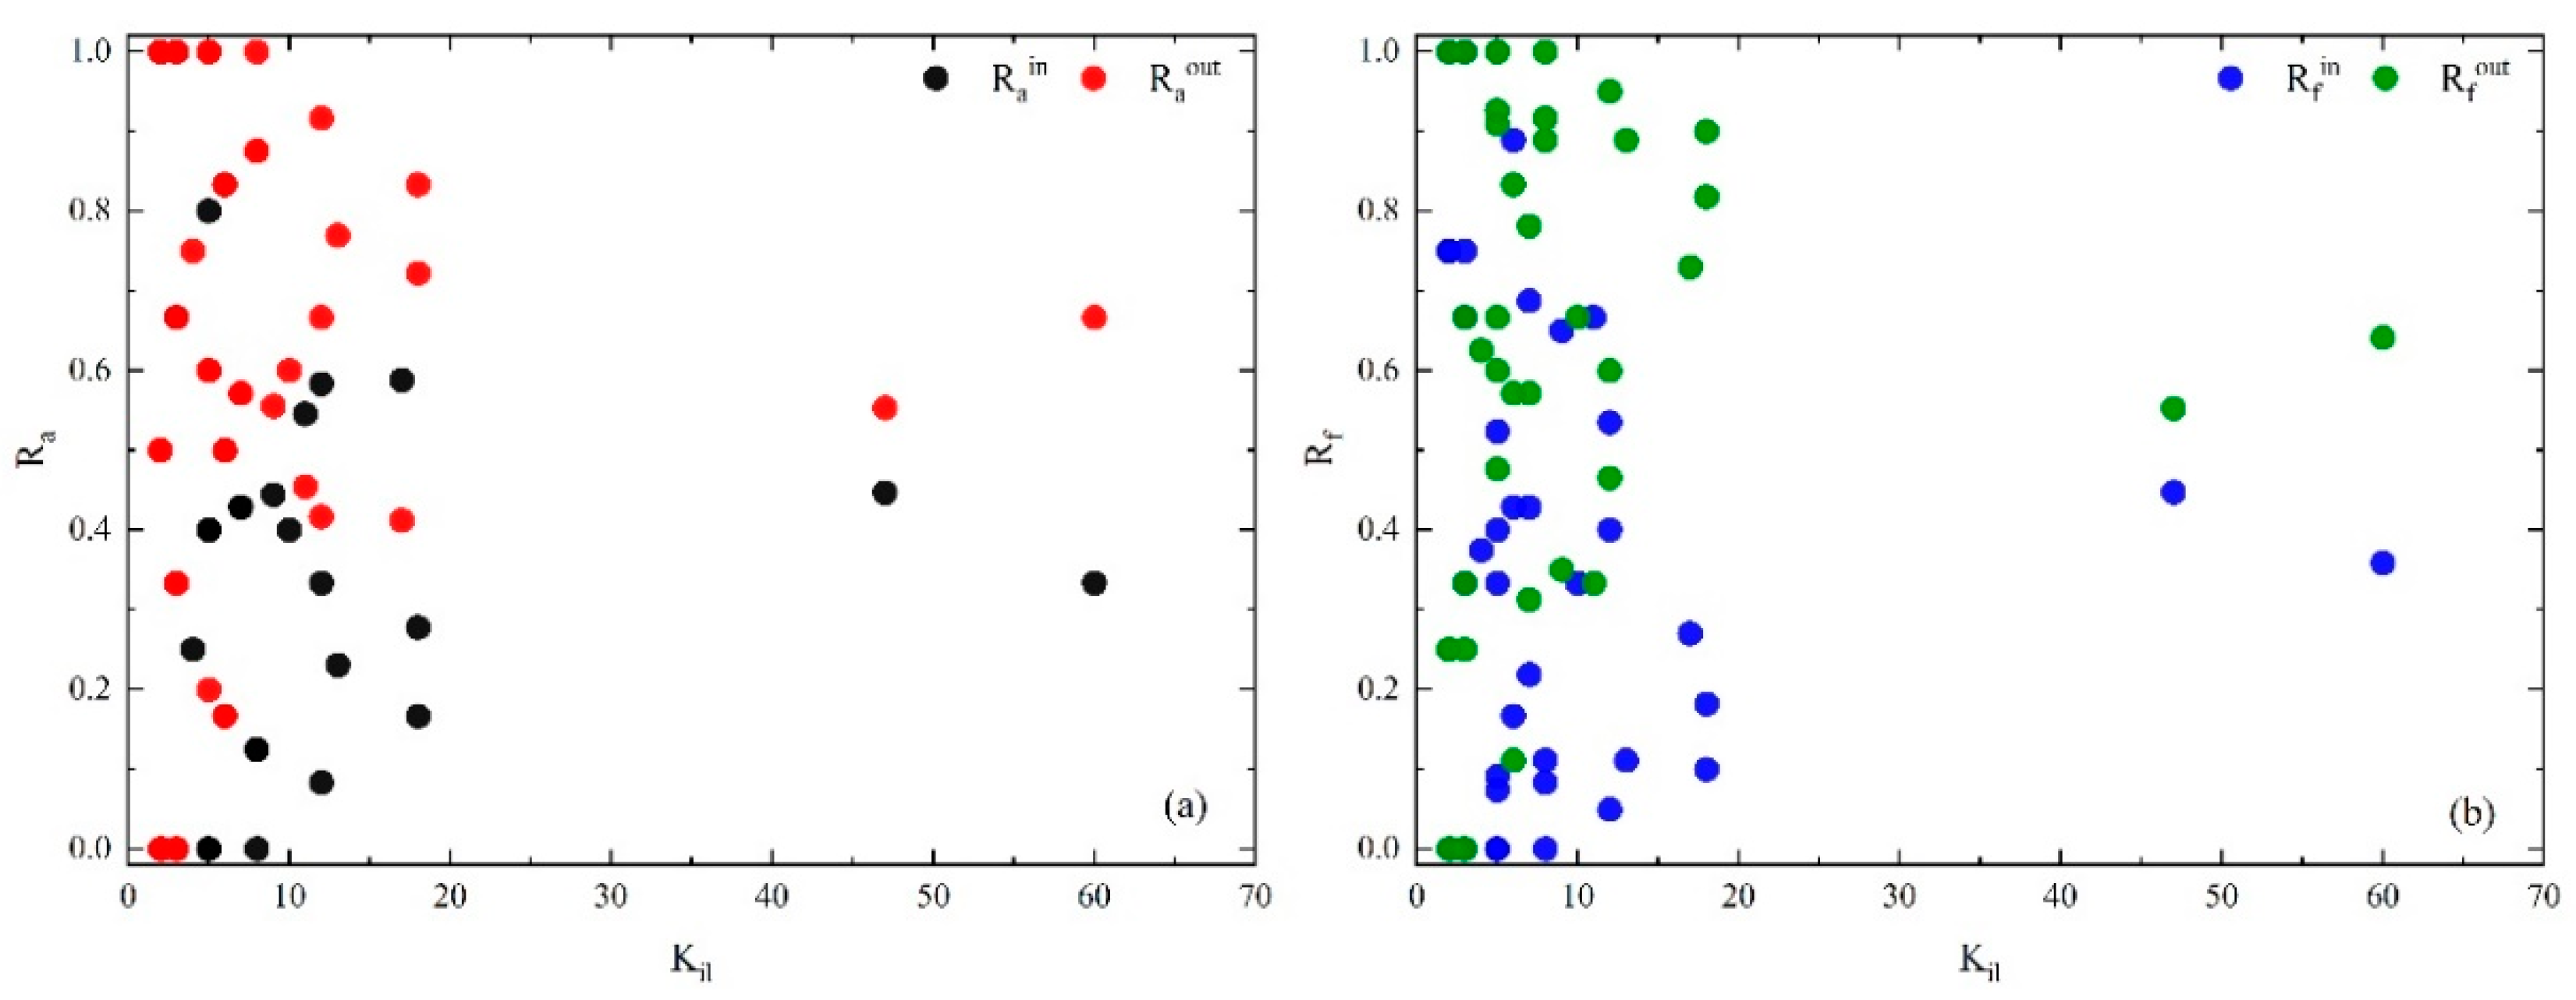
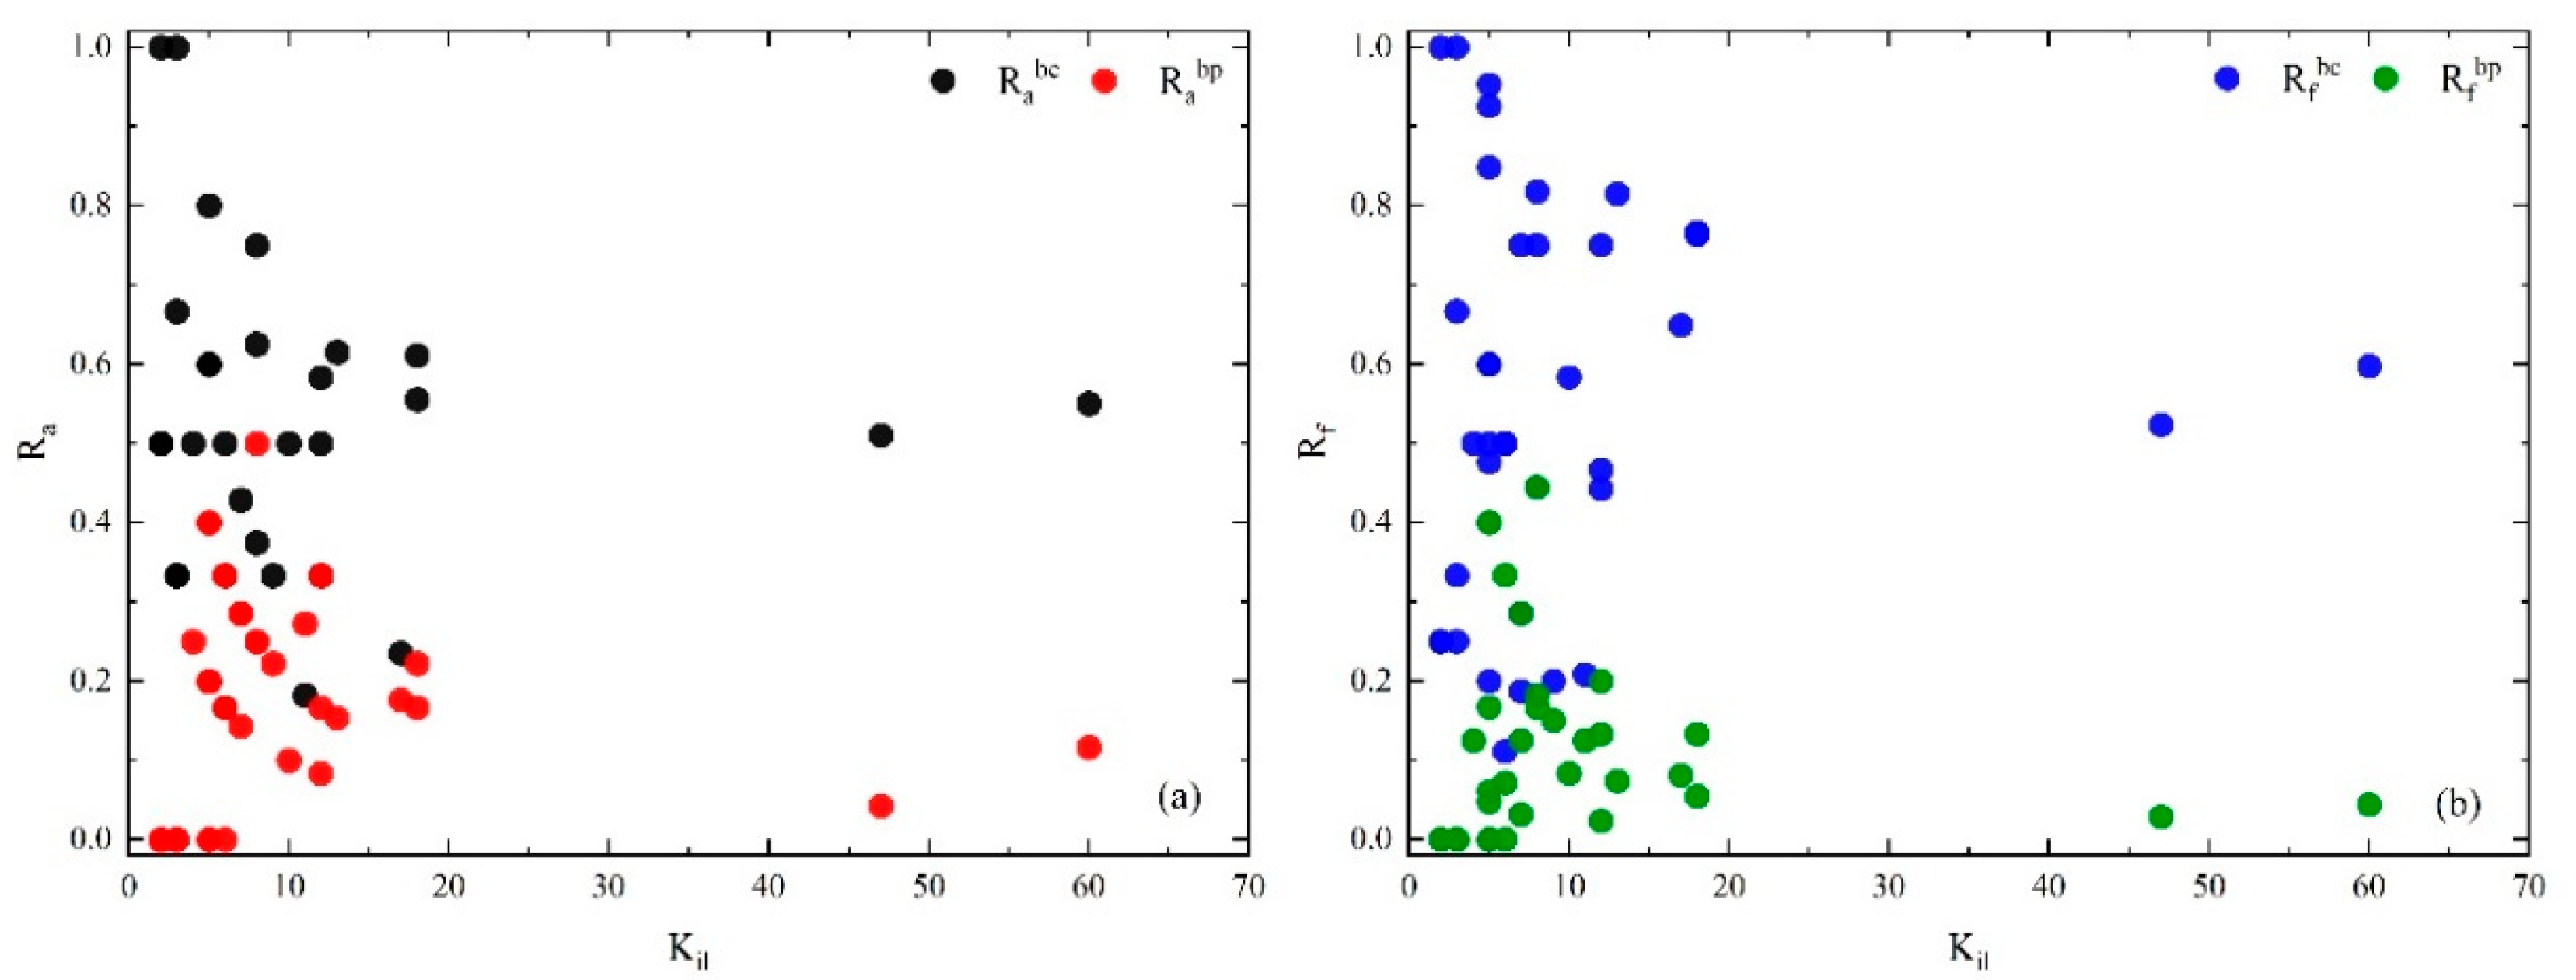
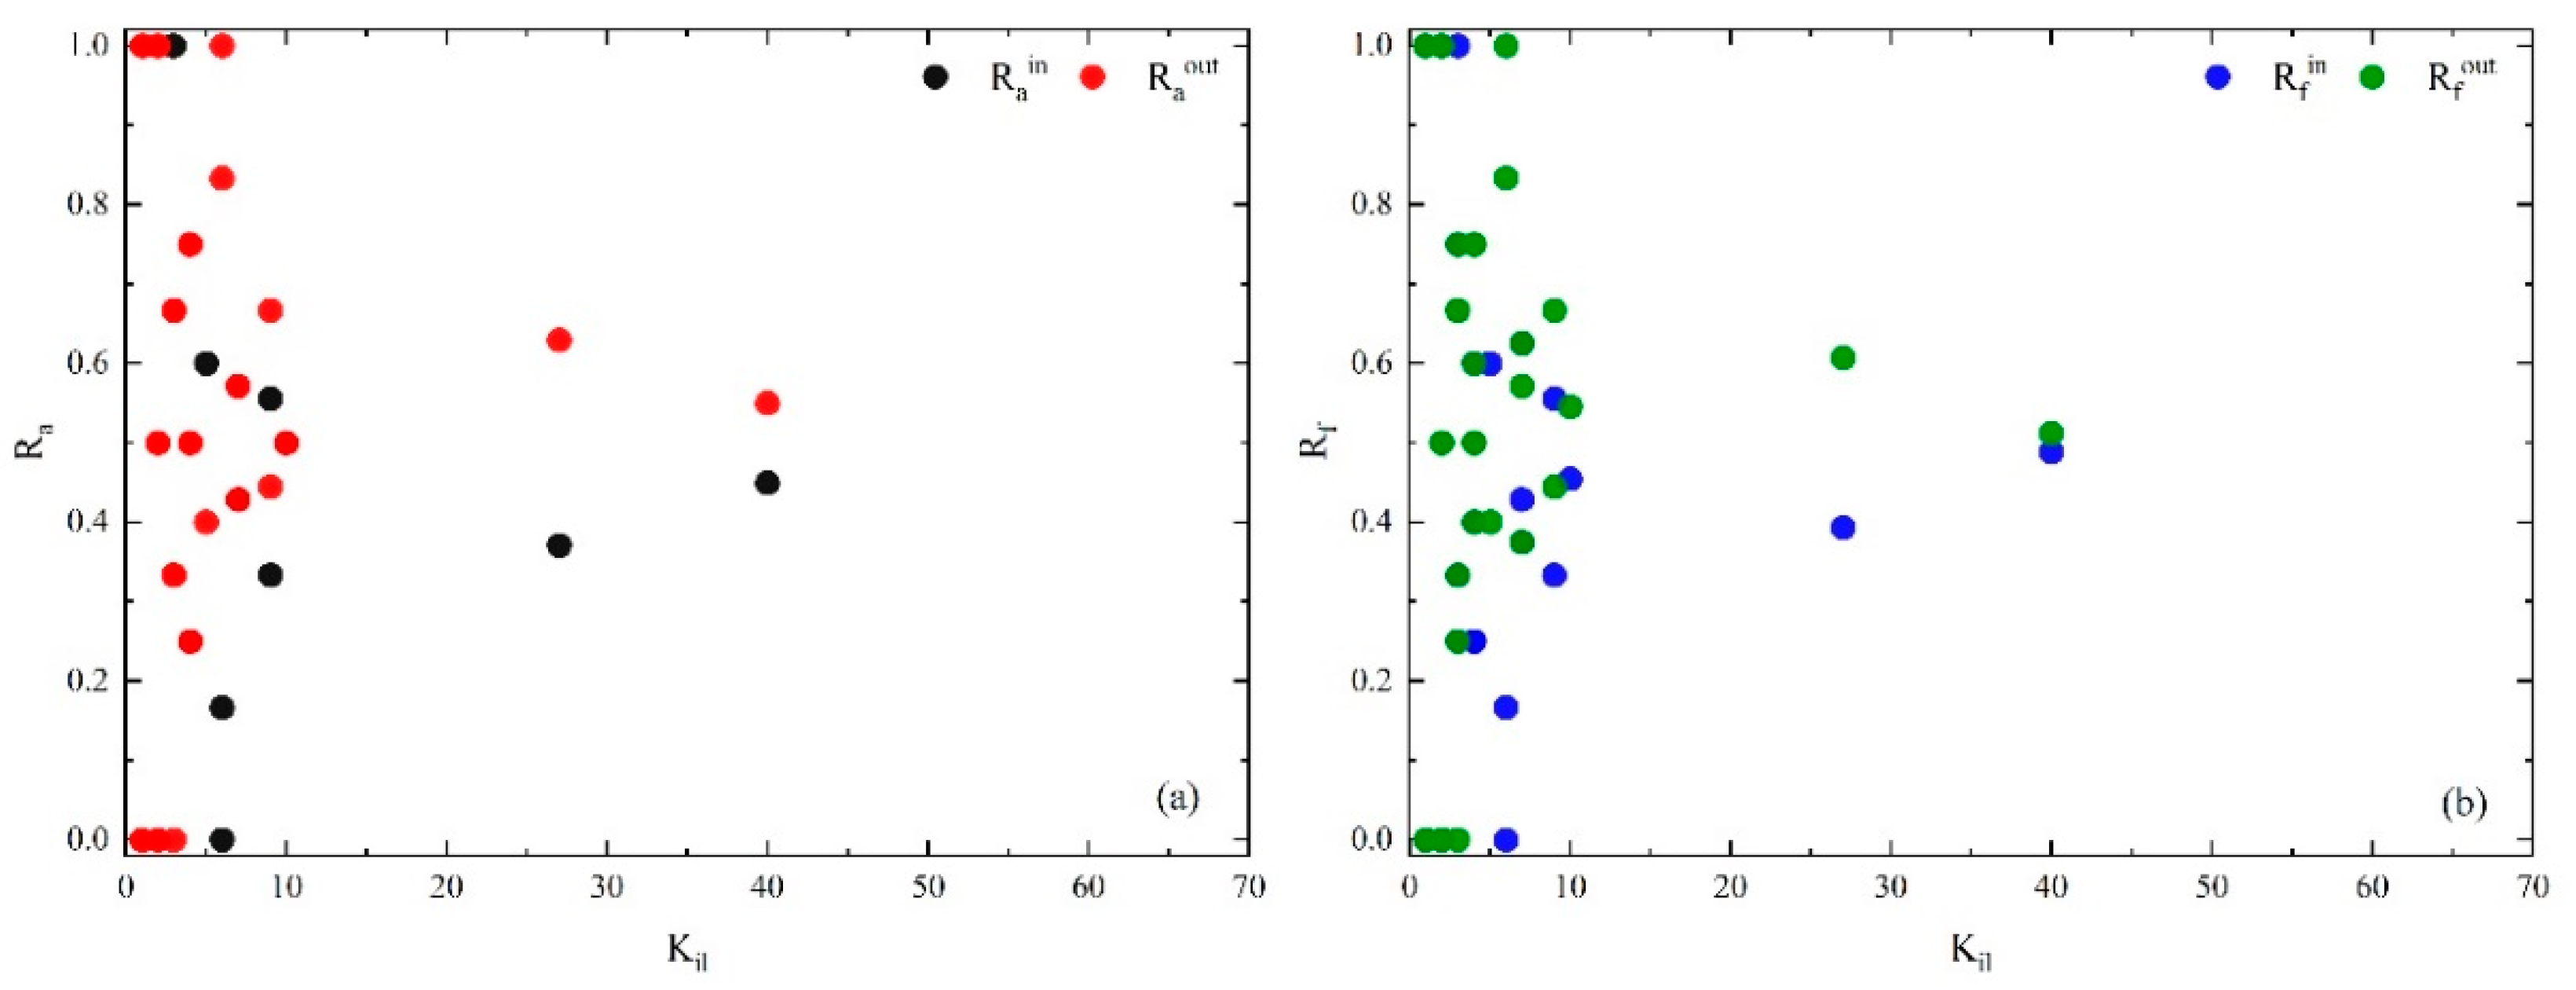
- The ratio of causal node connection and causal flow within and between the layers
4. The Multilayer Properties of HMTACN
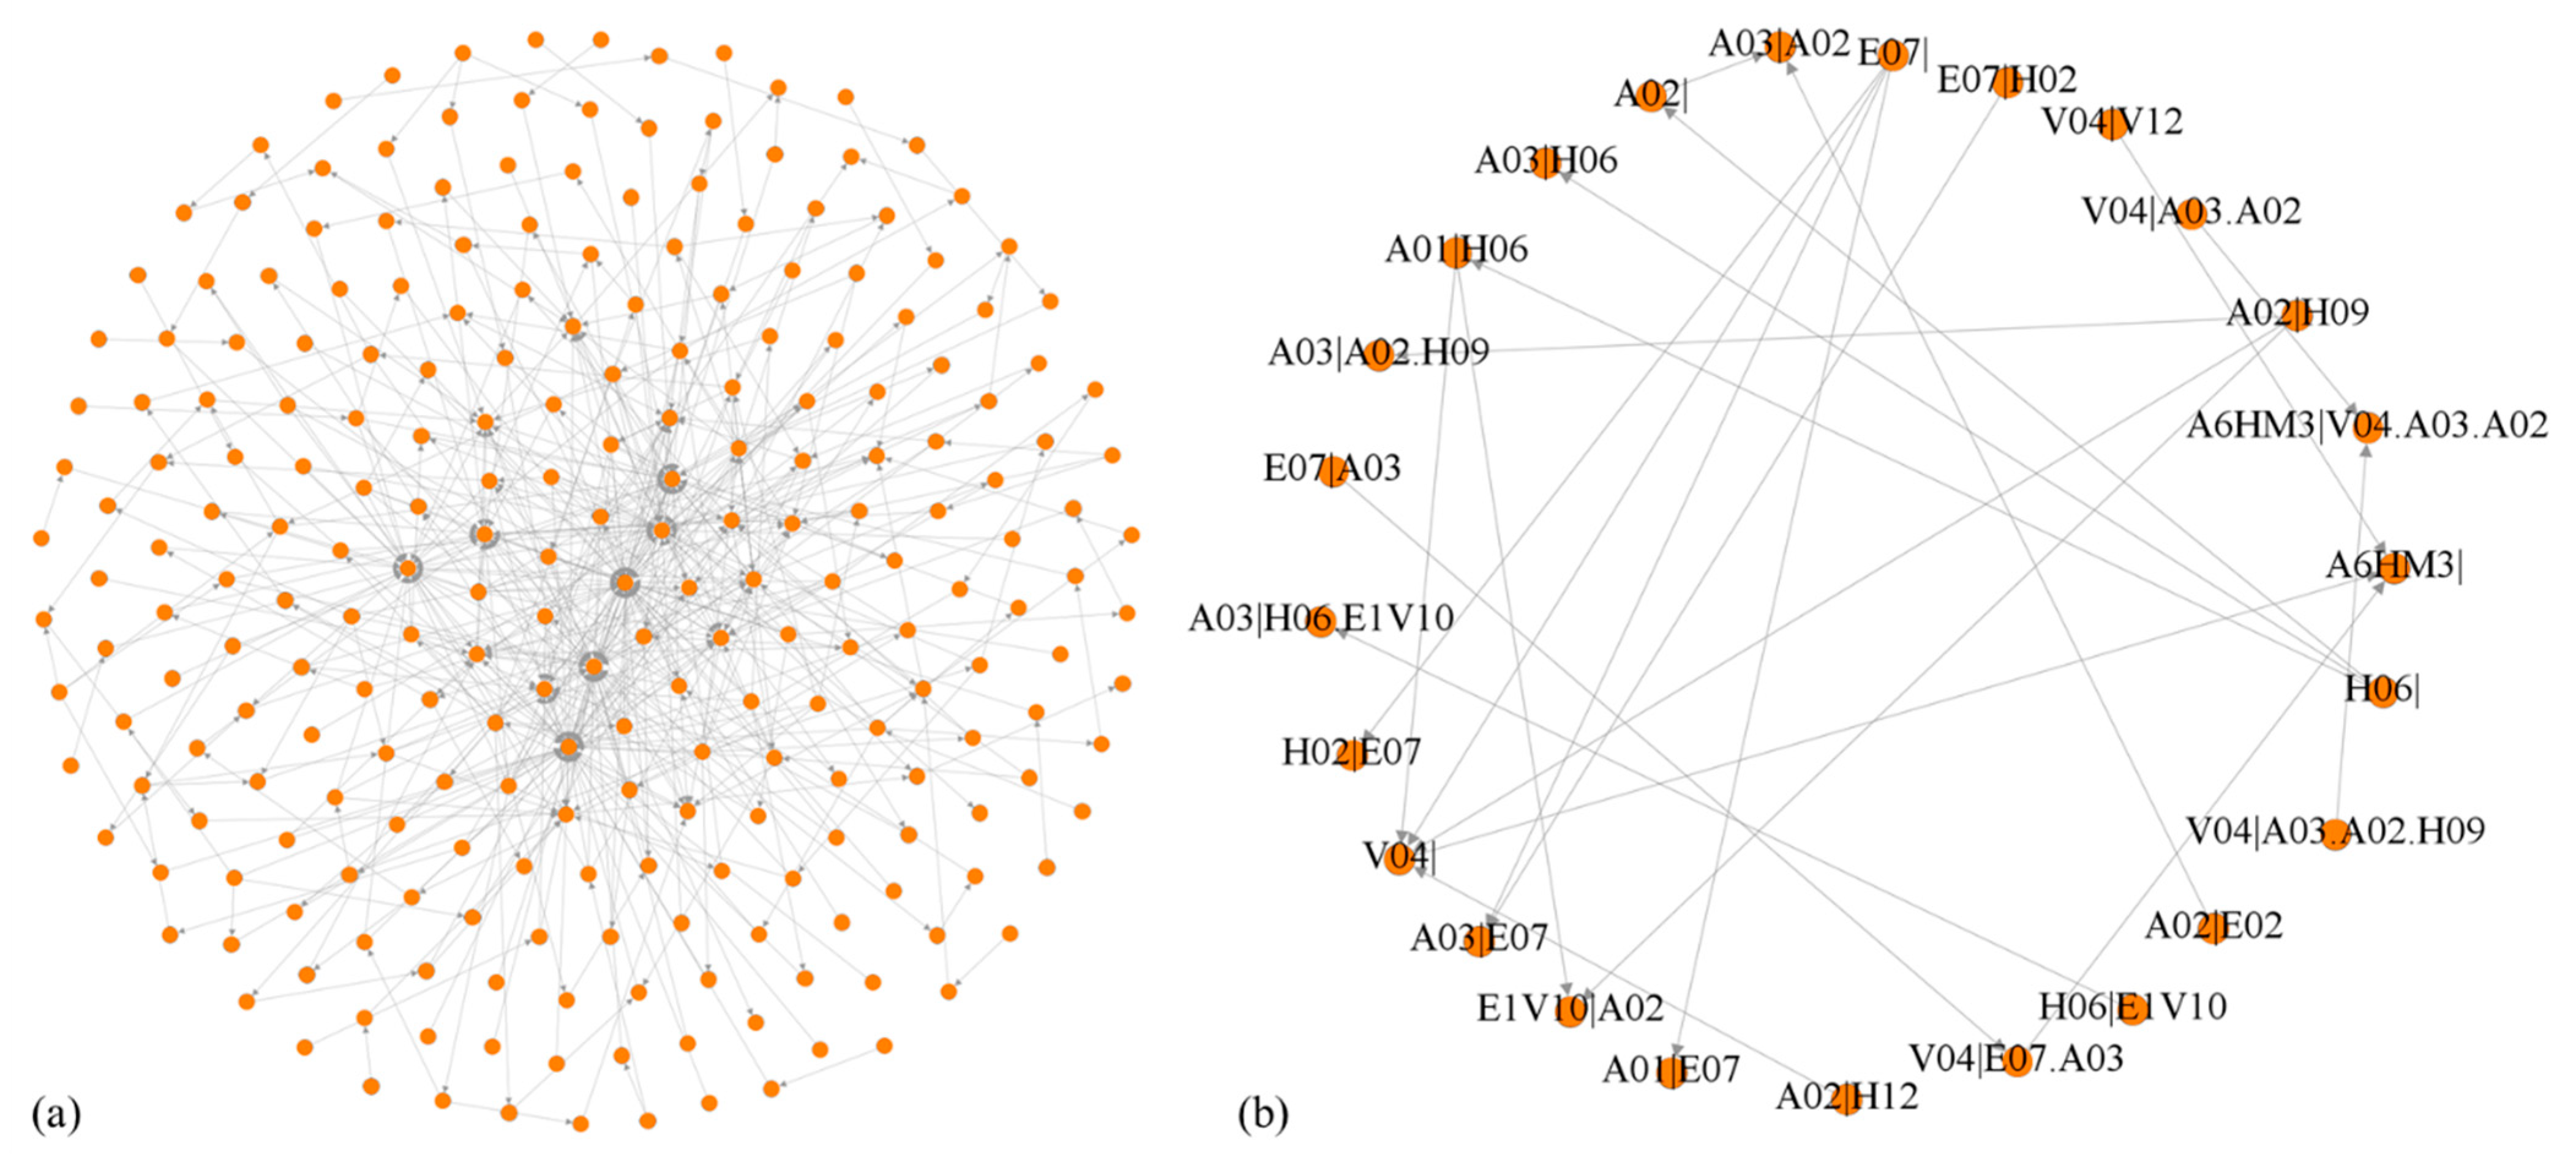
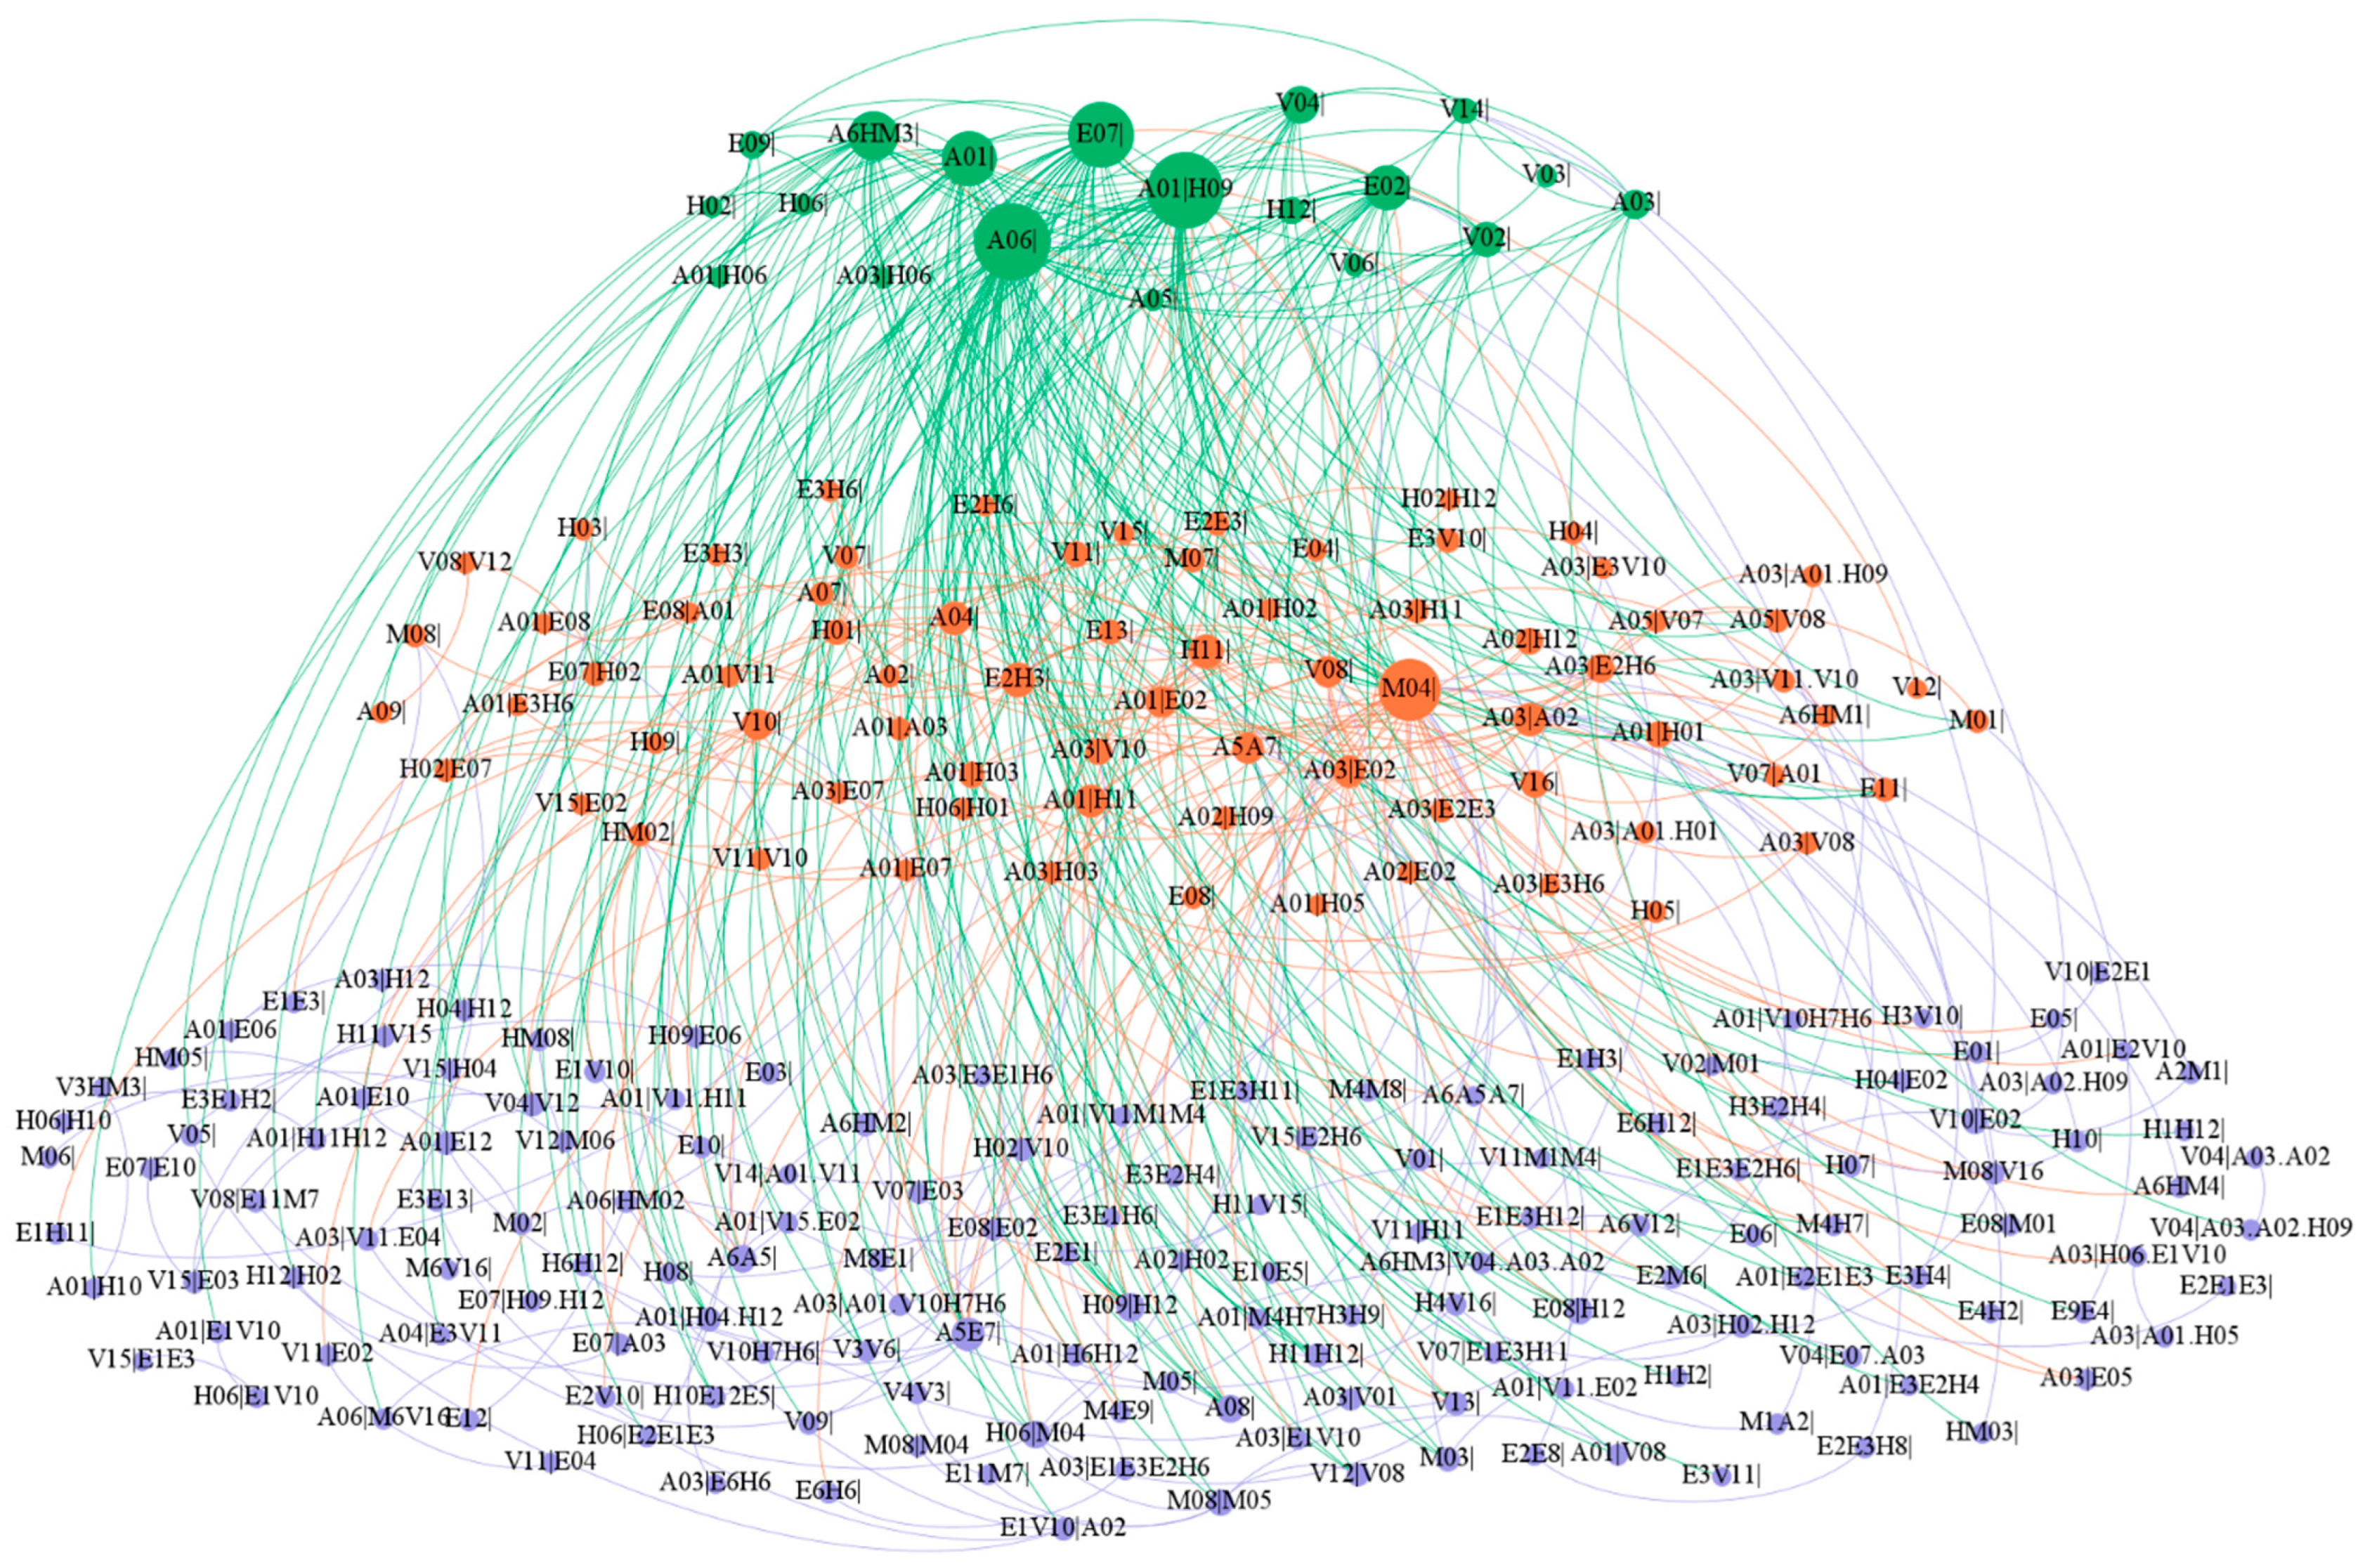
4.1. Multilayered Structure of HMTACN
4.2. Importance of Causes and Links in HMTACN
4.2.1. Importance of Causes in HMTACN
4.2.2. Importance of Links in HMTACN
4.3. Analysis of Causes and Links in Different Layers
4.3.1. Core Layer
4.3.2. Bridge Layer
4.3.3. Periphery Layer
5. Discussion
6. Conclusions
Author Contributions
Funding
Institutional Review Board Statement
Informed Consent Statement
Data Availability Statement
Conflicts of Interest
References
- Welle, B.; Sharpin, A.; Adriazola-Steil, C.; Bhatt, A.; Alveano, S.; Obelheiro, M.; Bose, D. Sustainable and Safe: A vision and Guidance for Zero Road Deaths; The World Resources Institute: Washington, DC, USA, 2018. [Google Scholar]
- Office of the State Council Safety Committee. The “14th Five-Year Plan” National Road Safety Plan. 2022. Available online: http://www.gov.cn/zhengce/zhengceku/2022-07/29/content_5703363.htm (accessed on 21 October 2022).
- Xiao-Ping, B.; Wei-Hua, S. Research on safety risk of dangerous chemicals road transportation based on dynamic fault tree and bayesian network hybrid method. Int. J. Eng. 2017, 30, 1144–1151. [Google Scholar]
- Yang, J.; Li, F.; Zhou, J.; Zhang, L.; Huang, L.; Bi, J. A survey on hazardous materials accidents during road transport in China from 2000 to 2008. J. Hazard. Mater. 2010, 184, 647–653. [Google Scholar] [CrossRef]
- Zhu, S.; Zhang, S.; Lang, H.; Jiang, C.; Xing, Y. The situation of hazardous materials accidents during road transportation in China from 2013 to 2019. Int. J. Environ. Res. Public Health 2022, 19, 9632. [Google Scholar] [CrossRef]
- Meng, F.; Xu, P.; Song, C.; Gao, K.; Zhou, Z.; Yang, L. Influential factors associated with consecutive crash severity: A two-level logistic modeling approach. Int. J. Environ. Res. Public Health 2020, 17, 5623. [Google Scholar] [CrossRef] [PubMed]
- Jiang, W.; Han, W.; Zhou, J.; Huang, Z. Analysis of human factors relationship in hazardous chemical storage accidents. Int. J. Environ. Res. Public Health 2020, 17, 6217. [Google Scholar] [CrossRef]
- Li, K.; Wang, S. A network accident causation model for monitoring railway safety. Saf. Sci. 2018, 109, 398–402. [Google Scholar] [CrossRef]
- Zhou, Z.; Irizarry, J.; Li, Q. Using network theory to explore the complexity of subway construction accident network (SCAN) for promoting safety management. Saf. Sci. 2014, 64, 127–136. [Google Scholar] [CrossRef]
- Fu, G.; Xie, X.; Jia, Q.; Li, Z.; Chen, P.; Ge, Y. The development history of accident causation models in the past 100 years: 24Model, a more modern accident causation model. Process Saf. Environ. Prot. 2020, 134, 47–82. [Google Scholar] [CrossRef]
- Liu, J.; Schmid, F.; Zheng, W.; Zhu, J. Understanding railway operational accidents using network theory. Reliab. Eng. Syst. Saf. 2019, 189, 218–231. [Google Scholar] [CrossRef]
- Li, Q.; Zhang, Z.; Peng, F. Causality-network-based critical hazard identification for railway accident prevention: Complex network-based model development and comparison. Entropy 2021, 23, 864. [Google Scholar] [CrossRef]
- Scholtes, I.; Wider, N.; Pfitzner, R.; Garas, A.; Tessone, C.; Schweitzer, F. Causality-driven slow-down and speed-up of diffusion in non-Markovian temporal networks. Nat. Commun. 2014, 5, 5024. [Google Scholar] [CrossRef] [PubMed] [Green Version]
- Battiston, F.; Cencetti, G.; Iacopini, I.; Latora, V.; Lucas, M.; Patania, A.; Young, J.-G.; Petri, G. Networks beyond pairwise interactions: Structure and dynamics. Phys. Rep. 2020, 874, 1–92. [Google Scholar] [CrossRef]
- Ferry, T. Modern Accident Investigation and Analysis; John Wiley & Sons: Hoboken, NJ, USA, 1988. [Google Scholar]
- Reason, J.; Hollnagel, E.; Paries, J. Revisiting the Swiss cheese model of accidents. J. Clin. Eng. 2006, 27, 110–115. [Google Scholar]
- Leveson, N. A new accident model for engineering safer systems. Saf. Sci. 2004, 42, 237–270. [Google Scholar] [CrossRef] [Green Version]
- Zhang, Y.; Dong, C.; Guo, W.; Dai, J.; Zhao, Z. Systems theoretic accident model and process (STAMP): A literature review. Saf. Sci. 2022, 152, 105596. [Google Scholar] [CrossRef]
- Zhou, Z.; Irizarry, J.; Guo, W. A network-based approach to modeling safety accidents and causations within the context of subway construction project management. Saf. Sci. 2021, 139, 105261. [Google Scholar] [CrossRef]
- Ding, S.; Pan, X.; Zuo, D.; Zhang, W.; Sun, L. Uncertainty analysis of accident causality model using Credal Network with IDM method: A case study of hazardous material road transportation accidents. Process Saf. Environ. Prot. 2022, 158, 461–473. [Google Scholar] [CrossRef]
- Qiu, Z.; Liu, Q.; Li, X.; Zhang, J.; Zhang, Y. Construction and analysis of a coal mine accident causation network based on text mining. Process Saf. Environ. Prot. 2021, 153, 320–328. [Google Scholar] [CrossRef]
- Rosvall, M.; Esquivel, A.; Lancichinetti, A.; West, J.; Lambiotte, R. Memory in network flows and its effects on spreading dynamics and community detection. Nat. Commun. 2014, 5, 4630. [Google Scholar] [CrossRef] [Green Version]
- Xu, J.; Wickramarathne, T.; Chawla, N. Representing higher-order dependencies in networks. Sci. Adv. 2016, 2, e1600028. [Google Scholar] [CrossRef] [Green Version]
- Lotito, Q.; Musciotto, F.; Montresor, A.; Battiston, F. Higher-order motif analysis in hypergraphs. Commun. Phys. 2022, 5, 79. [Google Scholar] [CrossRef]
- Battiston, F.; Amico, E.; Barrat, A.; Bianconi, G.; Ferraz de Arruda, G.; Franceschiello, B.; Petri, G. The physics of higher-order interactions in complex systems. Nat. Phys. 2021, 17, 1093–1098. [Google Scholar] [CrossRef]
- Lambiotte, R.; Rosvall, M.; Scholtes, I. From networks to optimal higher-order models of complex systems. Nat. Phys. 2019, 15, 313–320. [Google Scholar] [CrossRef] [PubMed]
- Saebi, M.; Xu, J.; Kaplan, L.; Ribeiro, B.; Chawla, N. Efficient modeling of higher-order dependencies in networks: From algorithm to application for anomaly detection. EPJ Data Sci. 2020, 9, 15. [Google Scholar] [CrossRef]
- Aktas, M.; Nguyen, T.; Jawaid, S.; Riza, R.; Akbas, E. Identifying critical higher-order interactions in complex networks. Sci. Rep. 2021, 11, 21288. [Google Scholar] [CrossRef]
- Xie, F.; Ma, M.; Ren, C. Research on multilayer network structure characteristics from a higher-order model: The case of a Chinese high-speed railway system. Phys. A Stat. Mech. Its Appl. 2022, 586, 126473. [Google Scholar] [CrossRef]
- Vasilyeva, E.; Kozlov, A.; Alfaro-Bittner, K.; Musatov, D.; Raigorodskii, A.; Perc, M.; Boccaletti, S. Multilayer representation of collaboration networks with higher-order interactions. Sci. Rep. 2021, 11, 5666. [Google Scholar] [CrossRef]
- Aleta, A.; Moreno, Y. Multilayer networks in a nutshell. Annu. Rev. Condens. Matter Phys. 2019, 10, 45–62. [Google Scholar] [CrossRef] [Green Version]
- Hong, C.; Zhang, J.; Cao, X.; Du, W. Structural properties of the Chinese air transportation multilayer network. Chaos Solitons Fractals 2016, 86, 28–34. [Google Scholar] [CrossRef]
- Du, W.; Zhou, X.; Lordan, O.; Wang, Z.; Zhao, C.; Zhu, Y. Analysis of the Chinese Airline Network as multi-layer networks. Transp. Res. Part E Logist. Transp. Rev. 2016, 89, 108–116. [Google Scholar] [CrossRef] [Green Version]
- Wang, W.; Cai, K.; Du, W.; Wu, X.; Tong, L.C.; Zhu, X.; Cao, X. Analysis of the Chinese railway system as a complex network. Chaos Solitons Fractals 2020, 130, 109408. [Google Scholar] [CrossRef]
- Zheng, Z.; Huang, Z.; Zhang, F.; Wang, P. Understanding coupling dynamics of public transportation networks. EPJ Data Sci. 2018, 7, 23. [Google Scholar] [CrossRef] [Green Version]
- Gu, Y.; Wang, Y. Using weighted multilayer networks to uncover scaling of public transport system. Environ. Plan. B Urban Anal. City Sci. 2022, 49, 1631–1645. [Google Scholar] [CrossRef]
- Ren, C.; Chen, B.; Xie, F.; Zhao, X.; Zhang, J.; Zhou, X. Understanding hazardous materials transportation accidents based on higher-order network theory. Int. J. Environ. Res. Public Health 2022, 19, 13337. [Google Scholar] [CrossRef]
- Garas, A.; Schweitzer, F.; Havlin, S. A k-shell decomposition method for weighted networks. New J. Phys. 2012, 14, 083030. [Google Scholar] [CrossRef]
- Ma, C.; Zhou, J.; Yang, D. Causation analysis of hazardous material road transportation accidents based on the ordered logit regression model. Int. J. Environ. Res. Public Health 2020, 17, 1259. [Google Scholar] [CrossRef] [Green Version]
- Oggero, A.; Darbra, R.; Munoz, M.; Planas, E.; Casal, J. A survey of accidents occurring during the transport of hazardous substances by road and rail. J. Hazard. Mater. 2006, 133, 1–7. [Google Scholar] [CrossRef]


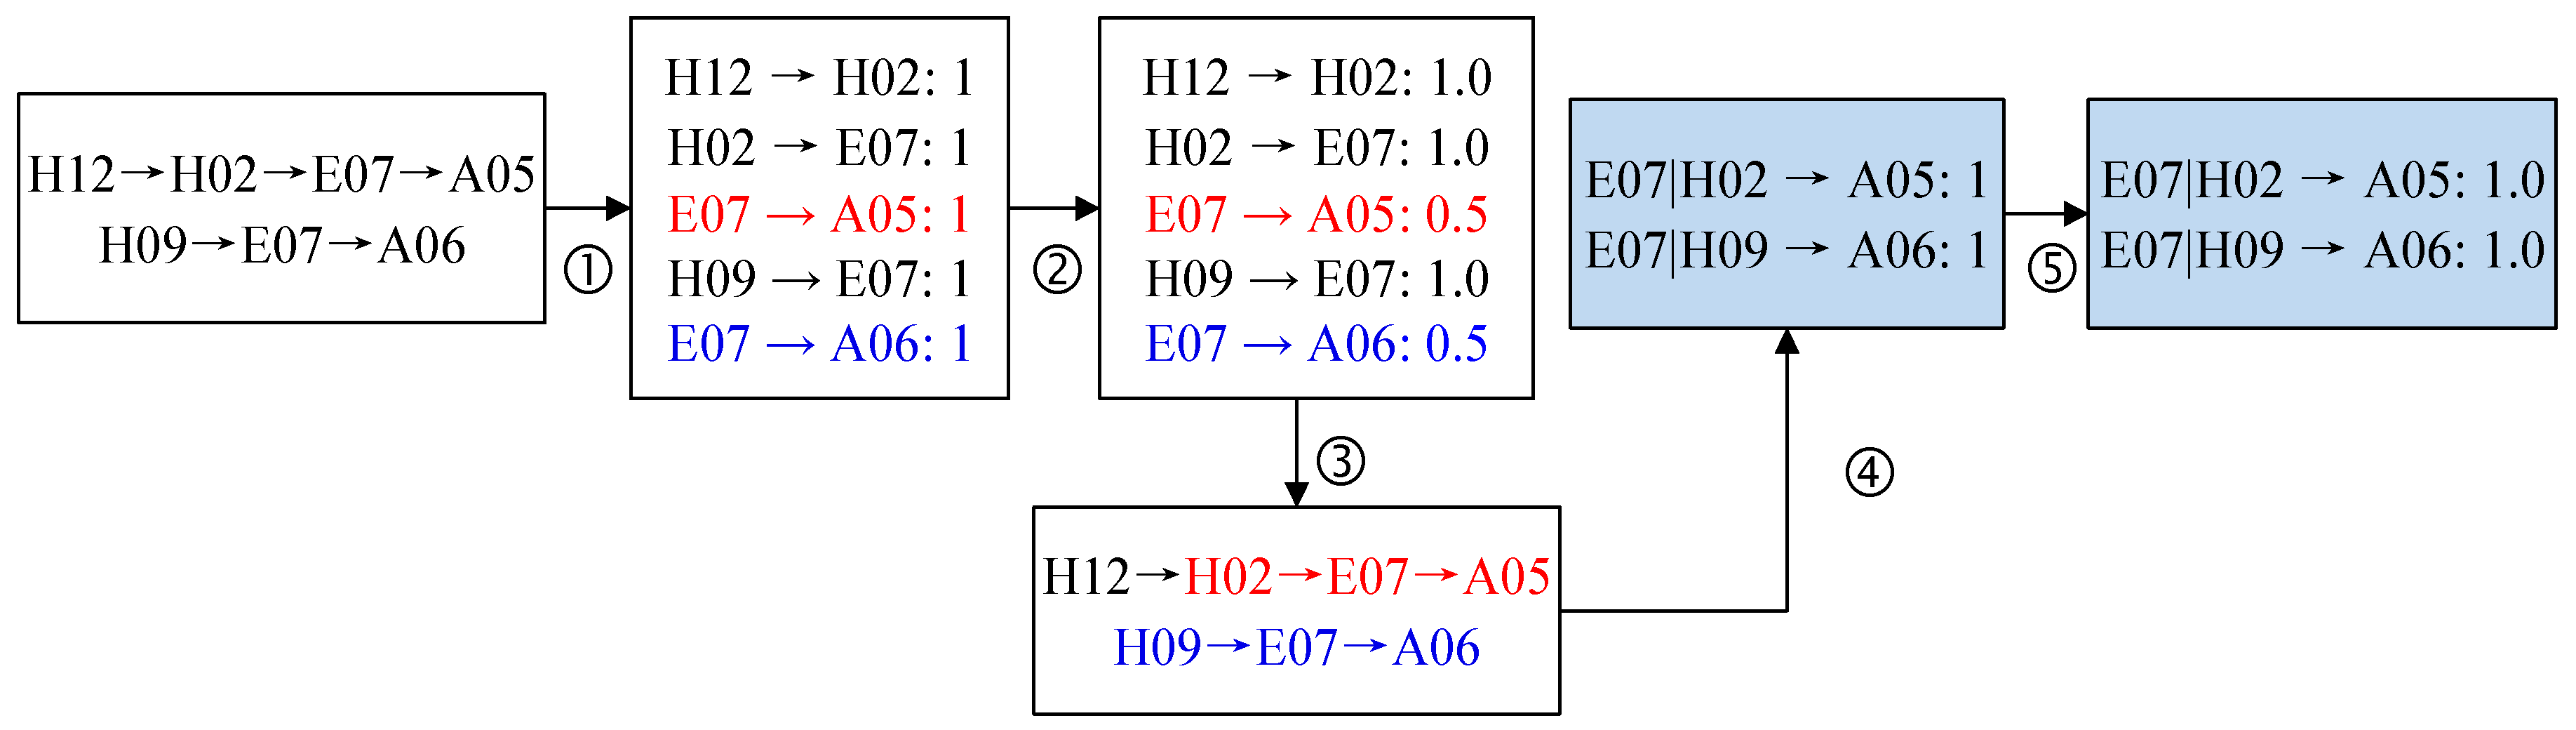
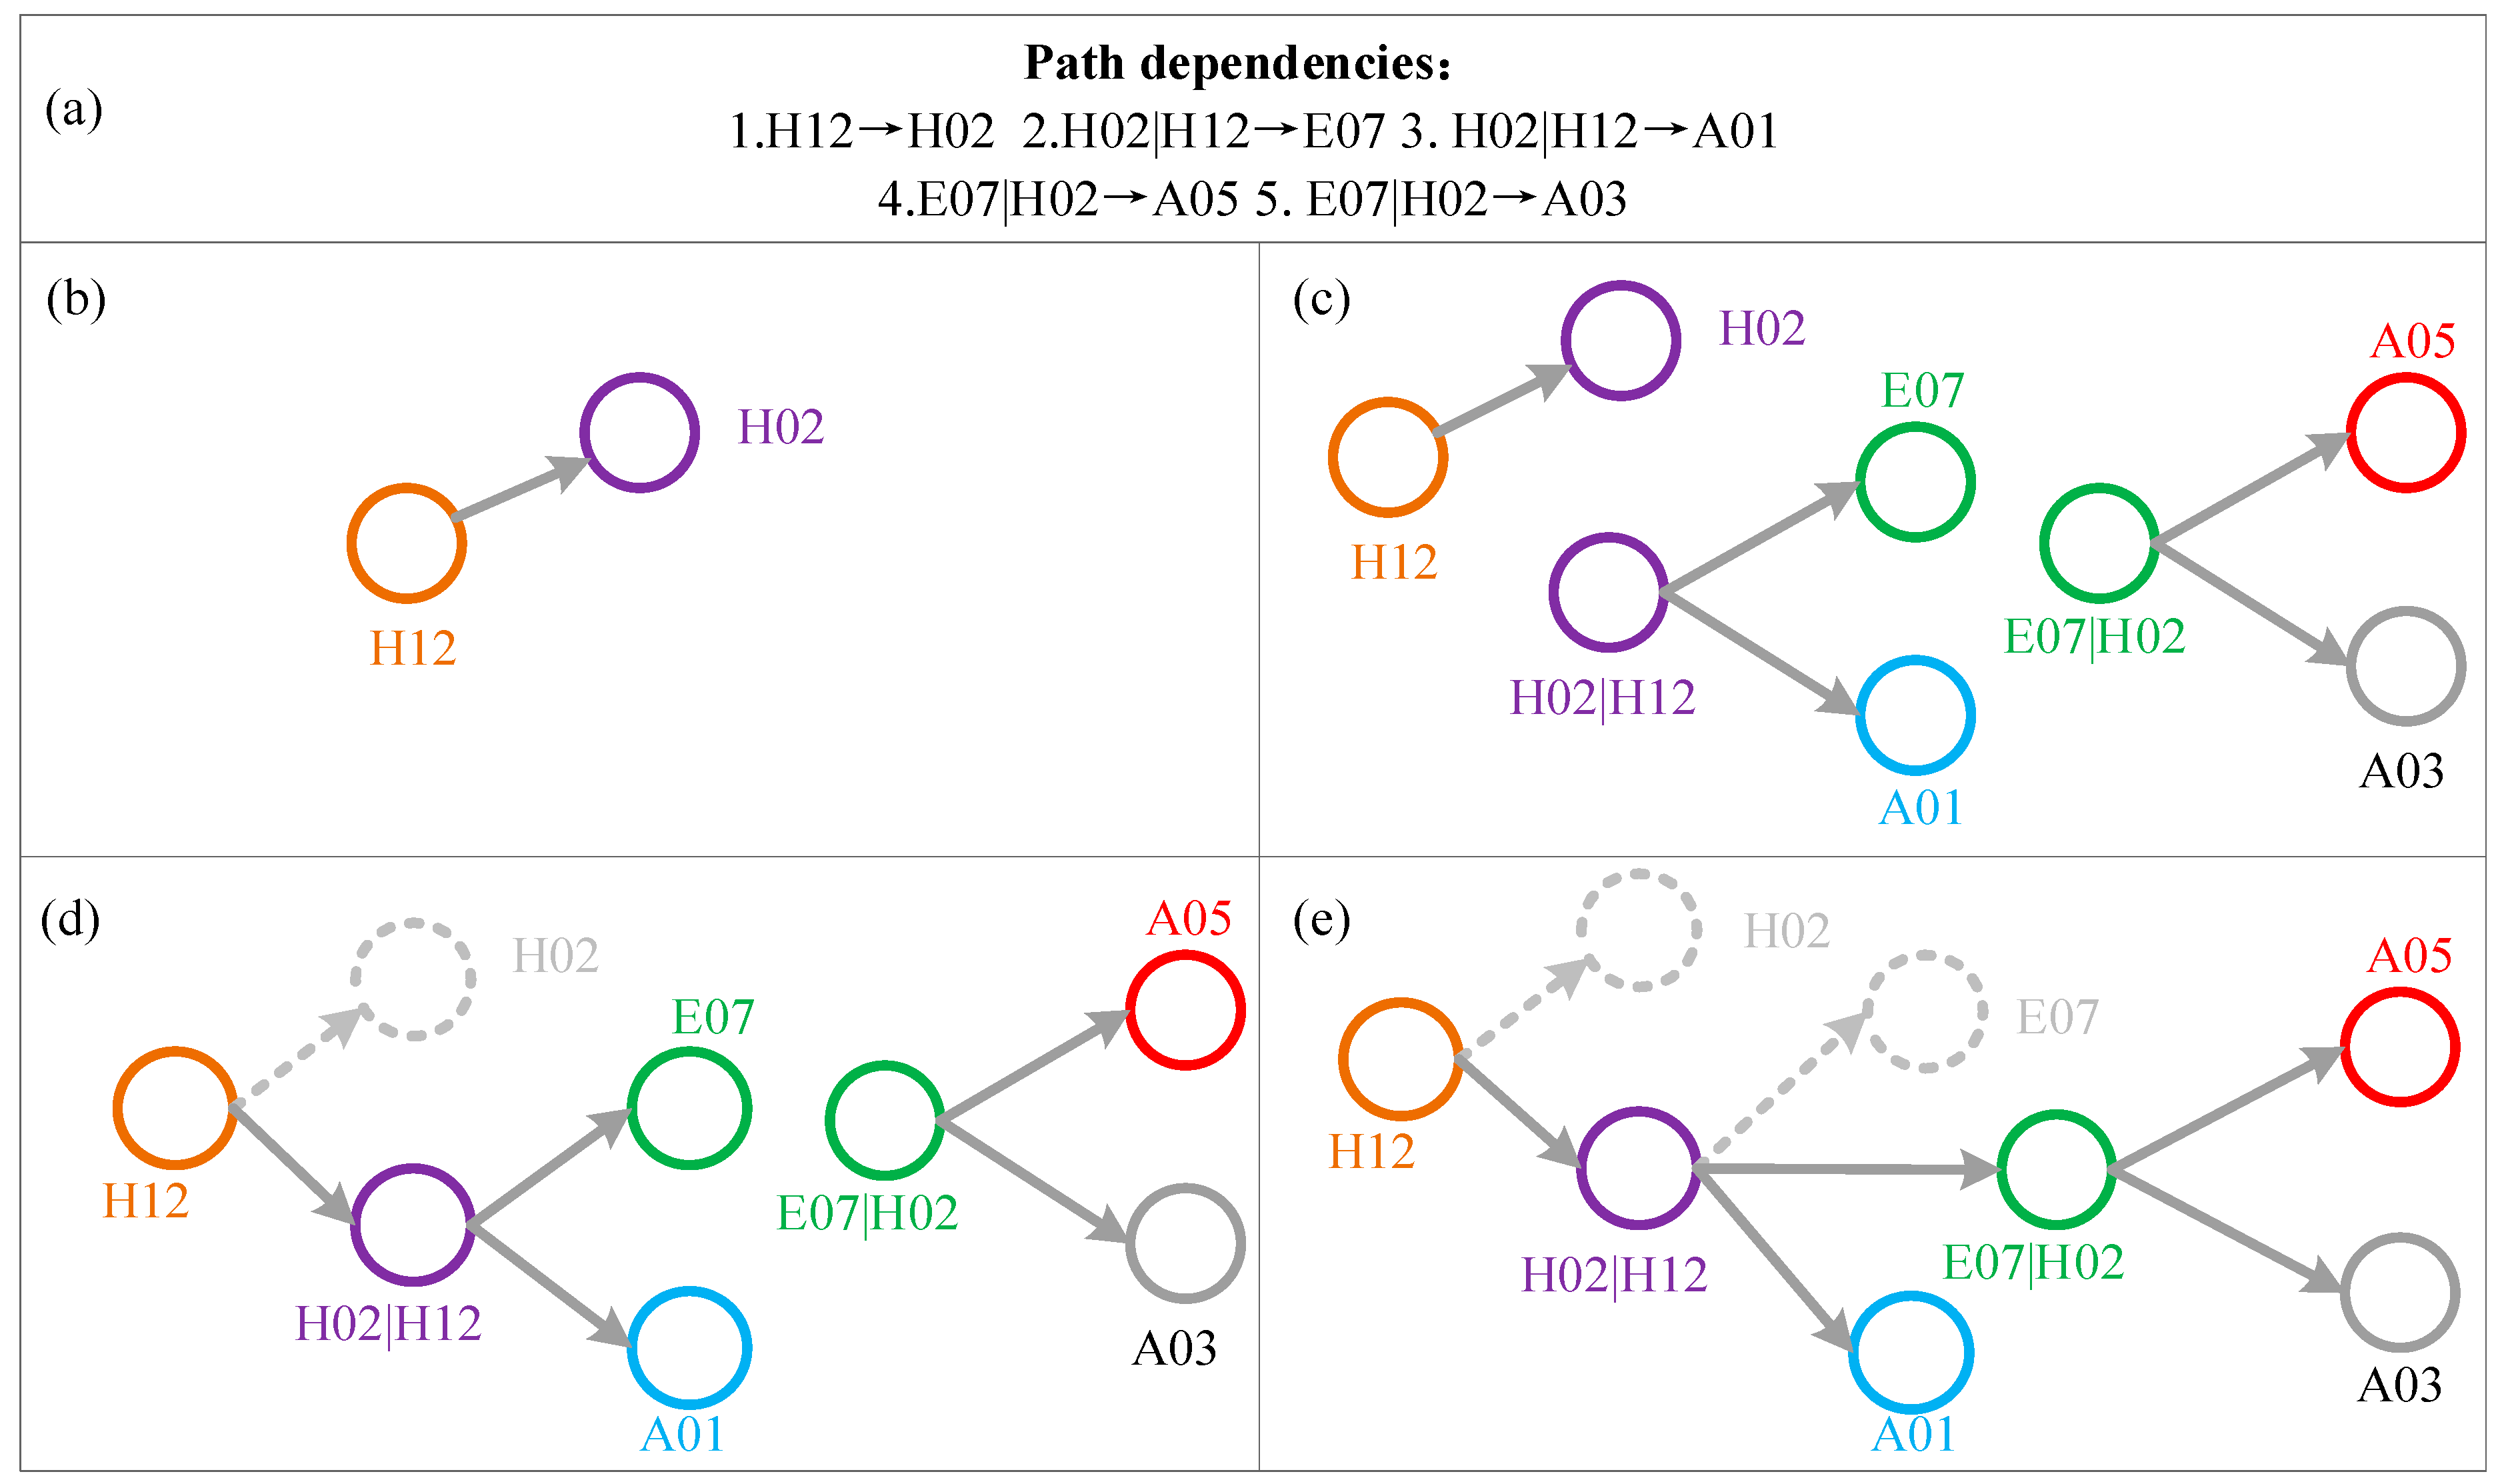
| No. | Description of Accident | Relationship | Accident Chain |
|---|---|---|---|
| 1 | 1 January 2021, in Panjin Dawei District, a tanker carrying 28 tons of oil products was driving normally. Suddenly, from the left side of the road, a car appeared crossing the road. The tanker could not avoid it, then hit the opposite lane of trucks. Finally, three cars burst into flames. | Non-hazmat personal reasons → improper avoidance → multi-car collision → fire | H12 → H02 → E07 → A05 |
| 2 | At 2:00 a.m. on 9 May 2018, two cars driving on Provincial Road 321 with close distance, which lead to collisions of cars. This violent collision led to the leakage of concentrated sulfuric acid from a hazardous materials vehicle. | Unsafe distance → multi-car collision → leakage | H09 → E07 → A06 |
| The Ratio of Causal Node Connection | The Ratio of Causal Flow | |||
|---|---|---|---|---|
| Intra-layer | (10) | (11) | ||
| Inter-layer | (12) | (13) | ||
| (14) | (15) | |||
| (16) | (17) | |||
| (18) | (19) | |||
| (20) | (21) | |||
| Layer | Number of Nodes | Number of Causes | Number of Edges | |||
|---|---|---|---|---|---|---|
| Core | 19 | 16 | 43.53 | 34–846 | 70 | 21.59 |
| Bridge | 73 | 40 | 5.66 | 3–37 | 67 | 2.13 |
| Periphery | 151 | 98 | 1.62 | 1–5 | 57 | 1.07 |
| Core-bridge | - | - | - | - | 176 | 2.82 |
| Core-periphery | - | - | - | - | 114 | 1.10 |
| Bridge-periphery | - | - | - | - | 61 | 1.03 |
| Layers of Causes | Level | Number | P (%) | Examples of Causes | |
|---|---|---|---|---|---|
| Belonging to core, bridge and periphery layers | 102.6 | I | 5 | 4.03 | H02, H06, E07, A01, etc. |
| Only belonging to core and bridge layers | 42 | II | 1 | 0.81 | A05 |
| Only belonging to core and periphery layers | 68.83 | III | 6 | 4.84 | H12, V04, A06, A6HM3, etc. |
| Only belonging to core layer | 24.5 | IV | 4 | 3.23 | E02, E09, V03, V06 |
| Only belonging to bridge and periphery layers | 15.62 | V | 13 | 10.48 | H09, V07, M08, A02, etc. |
| Only belonging to bridge layer | 5.14 | VI | 21 | 16.94 | H01, V16, E04, A6HM1, etc. |
| Only belonging to periphery layer | 1.46 | VII | 74 | 59.68 | H07, V01, A5E7, E1H3, etc. |
| Layers of Causal Links | Level | Number | Examples of Causal Links | |
|---|---|---|---|---|
| The core layer | 21.59 | I | 70 | H02 → A03, A01|H04-V06, etc. |
| Between the core and the bridge layer | 2.82 | II | 176 | E02 → A04, A3|H06 → V07, etc. |
| The bridge layer | 2.13 | III | 67 | E04 → V16, E07|H02 → A03|E07, etc. |
| Between the core and the periphery layer | 1.10 | IV | 114 | A01|E06 → V03, A01|H6H12 → V05, etc. |
| The periphery layer | 1.07 | V | 57 | A03|A02.H09 → V04|A03.A02.H09, etc. |
| Between the bridge and the periphery layer | 1.03 | VI | 61 | A03|E02 → E07|A03, etc. |
| Cause Type | Links | Specific | w | P (%) |
|---|---|---|---|---|
| Vehicle | V04 → A06 | tank damaged → leakage | 369 | 24.42 |
| V03 → A06 | valve damaged → leakage | 92 | 6.09 | |
| V02 → A06 | valve loosed → leakage | 36 | 2.38 | |
| Accident | A01 → V04 | collision → tank damaged | 216 | 14.30 |
| A03 → V04 | roll over → tank damaged | 98 | 6.49 | |
| A03 → A06 | roll over → leakage | 49 | 3.24 | |
| Human | H12 → A01 | non-hazmat personal reasons → collision | 210 | 13.90 |
| H02 → A03 | improper avoidance → roll over | 27 | 1.79 | |
| H06 → A03|H06 | improper operation → roll over | 20 | 1.32 | |
| Environment | E09 → E02 | rain and snow weather → slippery road | 25 | 1.65 |
| E07 → V04 | multi-car collision → tank damaged | 17 | 1.13 | |
| E02 → E07 | slippery road → multi-car collision | 7 | 0.46 |
| Type | Factor | |||||||||
|---|---|---|---|---|---|---|---|---|---|---|
| Accident | A03 | 63 | 0.286 | 0.714 | 0.365 | 0.349 | 0.712 | 0.288 | 0.226 | 0.061 |
| A01 | 57 | 0.386 | 0.614 | 0.351 | 0.263 | 0.893 | 0.107 | 0.080 | 0.027 | |
| A06 | 54 | 0.241 | 0.759 | 0.444 | 0.315 | 0.885 | 0.115 | 0.087 | 0.028 | |
| A05 | 34 | 0.324 | 0.676 | 0.382 | 0.294 | 0.479 | 0.521 | 0.437 | 0.084 | |
| Vehicle | V04 | 44 | 0.250 | 0.750 | 0.614 | 0.136 | 0.883 | 0.117 | 0.110 | 0.007 |
| V03 | 29 | 0.241 | 0.759 | 0.448 | 0.310 | 0.810 | 0.190 | 0.141 | 0.049 | |
| V02 | 25 | 0.320 | 0.680 | 0.320 | 0.360 | 0.711 | 0.289 | 0.171 | 0.118 | |
| V06 | 15 | 0.400 | 0.600 | 0.467 | 0.133 | 0.833 | 0.167 | 0.130 | 0.037 | |
| V14 | 13 | 0.538 | 0.462 | 0.385 | 0.077 | 0.794 | 0.206 | 0.176 | 0.029 | |
| Human | H12 | 15 | 0.333 | 0.667 | 0.333 | 0.333 | 0.911 | 0.089 | 0.068 | 0.021 |
| H02 | 14 | 0.214 | 0.786 | 0.500 | 0.286 | 0.537 | 0.463 | 0.370 | 0.093 | |
| H06 | 12 | 0.500 | 0.500 | 0.417 | 0.083 | 0.878 | 0.122 | 0.102 | 0.020 | |
| Environment | E07 | 15 | 0.533 | 0.467 | 0.400 | 0.067 | 0.714 | 0.286 | 0.265 | 0.020 |
| E02 | 14 | 0.286 | 0.714 | 0.429 | 0.286 | 0.500 | 0.500 | 0.426 | 0.074 | |
| E09 | 14 | 0.429 | 0.571 | 0.286 | 0.286 | 0.711 | 0.289 | 0.178 | 0.111 | |
| Multi-factor | A6HM3 | 12 | 0.417 | 0.583 | 0.250 | 0.333 | 0.860 | 0.140 | 0.070 | 0.070 |
| Factor | |||||||||
|---|---|---|---|---|---|---|---|---|---|
| E2H1 | 3 | 0.000 | 1.000 | 0.000 | 1.000 | 1.000 | 0.000 | 1.000 | 0.000 |
| E13 | 2 | 0.000 | 1.000 | 0.000 | 1.000 | 1.000 | 0.000 | 1.000 | 0.000 |
| M07 | 5 | 0.000 | 1.000 | 0.000 | 1.000 | 0.800 | 0.200 | 0.952 | 0.048 |
| M08 | 8 | 0.000 | 1.000 | 0.000 | 1.000 | 0.750 | 0.250 | 0.818 | 0.182 |
| A6HM1 | 3 | 0.333 | 0.667 | 0.333 | 0.667 | 0.667 | 0.000 | 0.667 | 0.000 |
| H04 | 8 | 0.125 | 0.875 | 0.083 | 0.917 | 0.625 | 0.250 | 0.750 | 0.167 |
| V15 | 13 | 0.231 | 0.769 | 0.111 | 0.889 | 0.615 | 0.154 | 0.815 | 0.074 |
| V07 | 18 | 0.167 | 0.833 | 0.100 | 0.900 | 0.611 | 0.222 | 0.767 | 0.133 |
| E11 | 5 | 0.000 | 1.000 | 0.000 | 1.000 | 0.600 | 0.400 | 0.600 | 0.400 |
| M01 | 5 | 0.000 | 1.000 | 0.000 | 1.000 | 0.600 | 0.400 | 0.600 | 0.400 |
| E3H3 | 5 | 0.400 | 0.600 | 0.074 | 0.926 | 0.600 | 0.000 | 0.926 | 0.000 |
| A07 | 12 | 0.083 | 0.917 | 0.050 | 0.950 | 0.583 | 0.333 | 0.750 | 0.200 |
| A02 | 18 | 0.278 | 0.722 | 0.182 | 0.818 | 0.556 | 0.167 | 0.764 | 0.055 |
| A01 | 60 | 0.333 | 0.667 | 0.358 | 0.642 | 0.550 | 0.117 | 0.597 | 0.044 |
| Factor | ||||||||||||
|---|---|---|---|---|---|---|---|---|---|---|---|---|
| V16 | 17 | 37 | 13 | 4 | 0.588 | 0.412 | 0.270 | 0.730 | 0.235 | 0.176 | 0.649 | 0.081 |
| V12 | 5 | 33 | 2 | 3 | 0.400 | 0.600 | 0.091 | 0.909 | 0.200 | 0.400 | 0.848 | 0.061 |
| H09 | 7 | 32 | 3 | 4 | 0.429 | 0.571 | 0.219 | 0.781 | 0.429 | 0.143 | 0.750 | 0.031 |
Disclaimer/Publisher’s Note: The statements, opinions and data contained in all publications are solely those of the individual author(s) and contributor(s) and not of MDPI and/or the editor(s). MDPI and/or the editor(s) disclaim responsibility for any injury to people or property resulting from any ideas, methods, instructions or products referred to in the content. |
© 2023 by the authors. Licensee MDPI, Basel, Switzerland. This article is an open access article distributed under the terms and conditions of the Creative Commons Attribution (CC BY) license (https://creativecommons.org/licenses/by/4.0/).
Share and Cite
Ren, C.; Chen, B.; Xie, F. Identifying Key Factors of Hazardous Materials Transportation Accidents Based on Higher-Order and Multilayer Networks. Entropy 2023, 25, 1036. https://doi.org/10.3390/e25071036
Ren C, Chen B, Xie F. Identifying Key Factors of Hazardous Materials Transportation Accidents Based on Higher-Order and Multilayer Networks. Entropy. 2023; 25(7):1036. https://doi.org/10.3390/e25071036
Chicago/Turabian StyleRen, Cuiping, Bianbian Chen, and Fengjie Xie. 2023. "Identifying Key Factors of Hazardous Materials Transportation Accidents Based on Higher-Order and Multilayer Networks" Entropy 25, no. 7: 1036. https://doi.org/10.3390/e25071036