

MSIA-Net: A Lightweight Infrared Target Detection Network with Efficient Information Fusion


Abstract
:1. Introduction
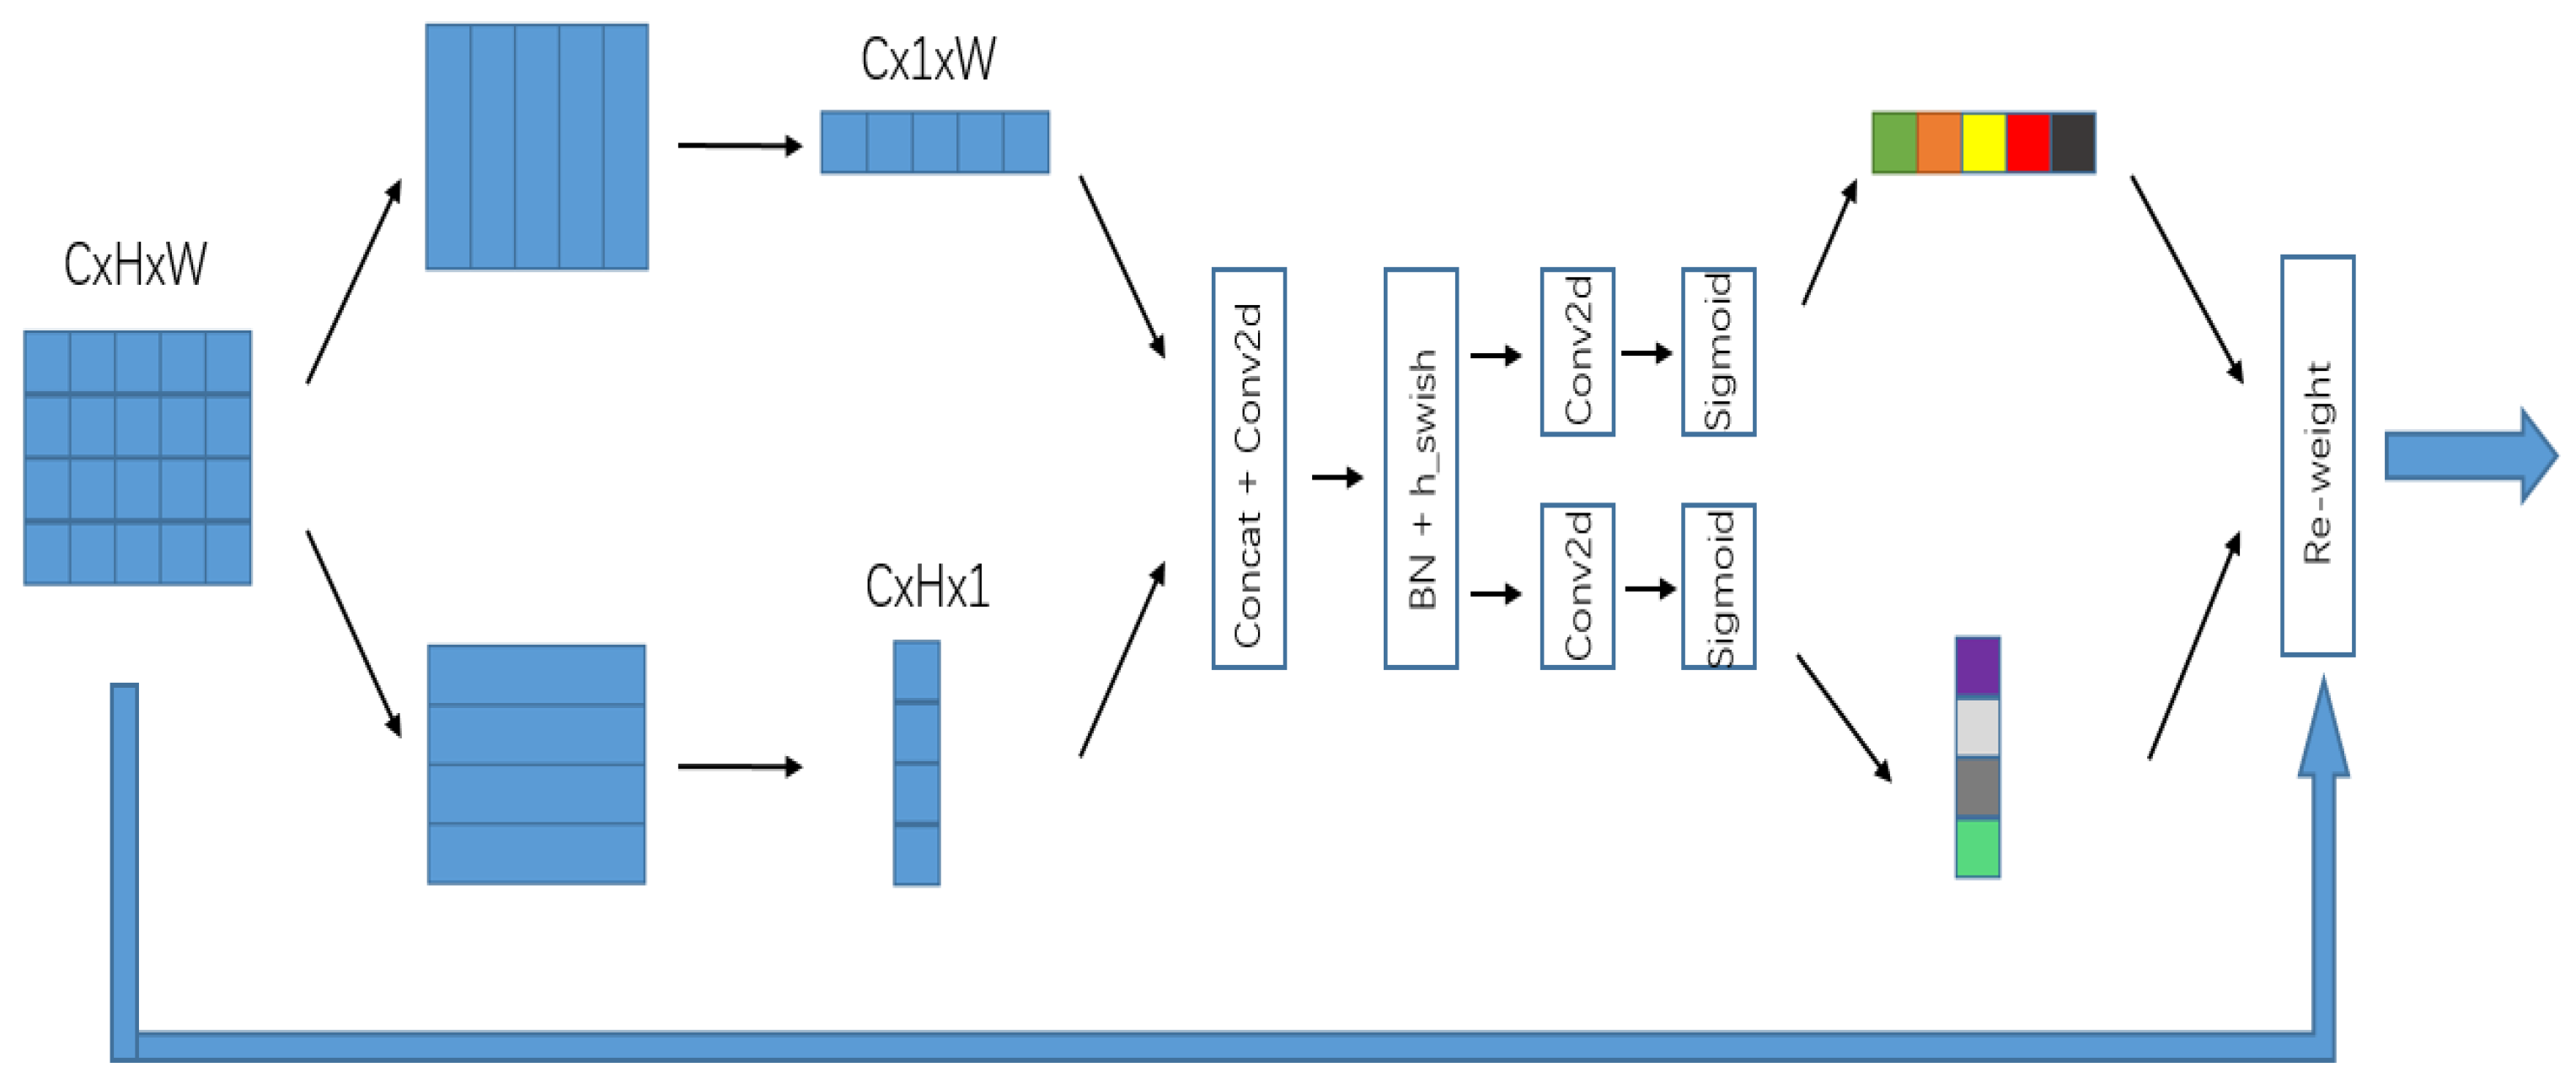
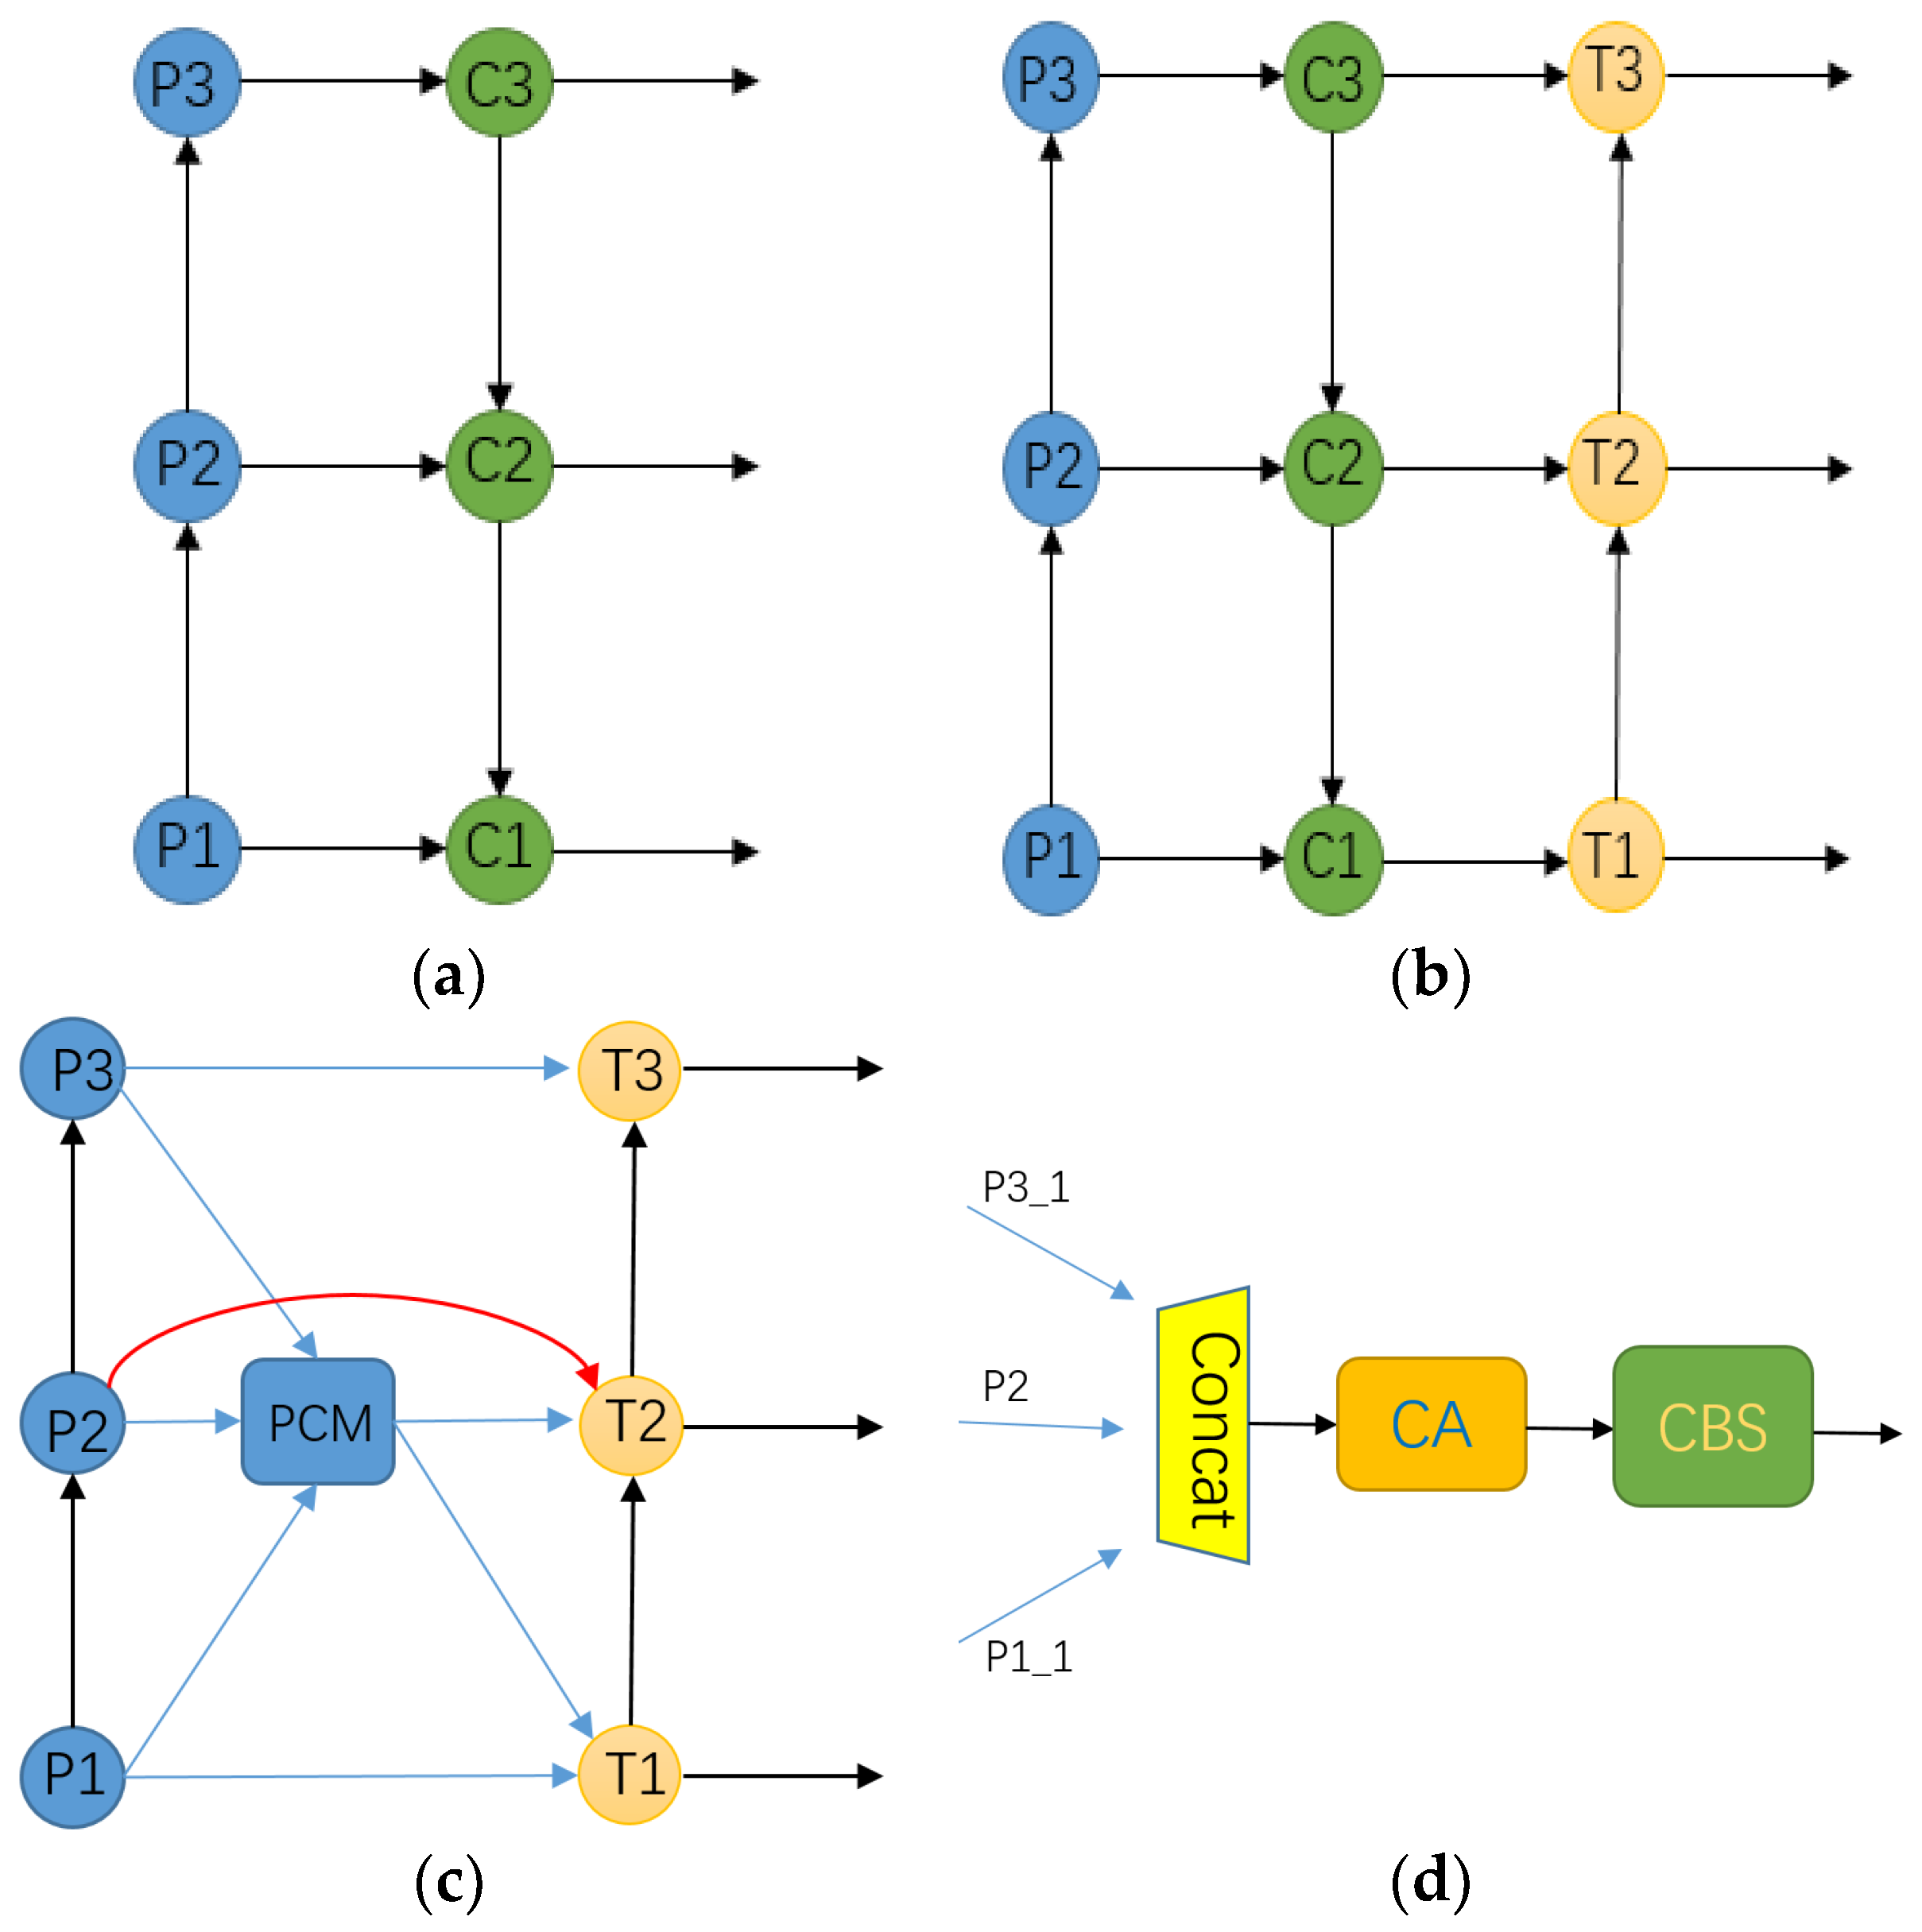
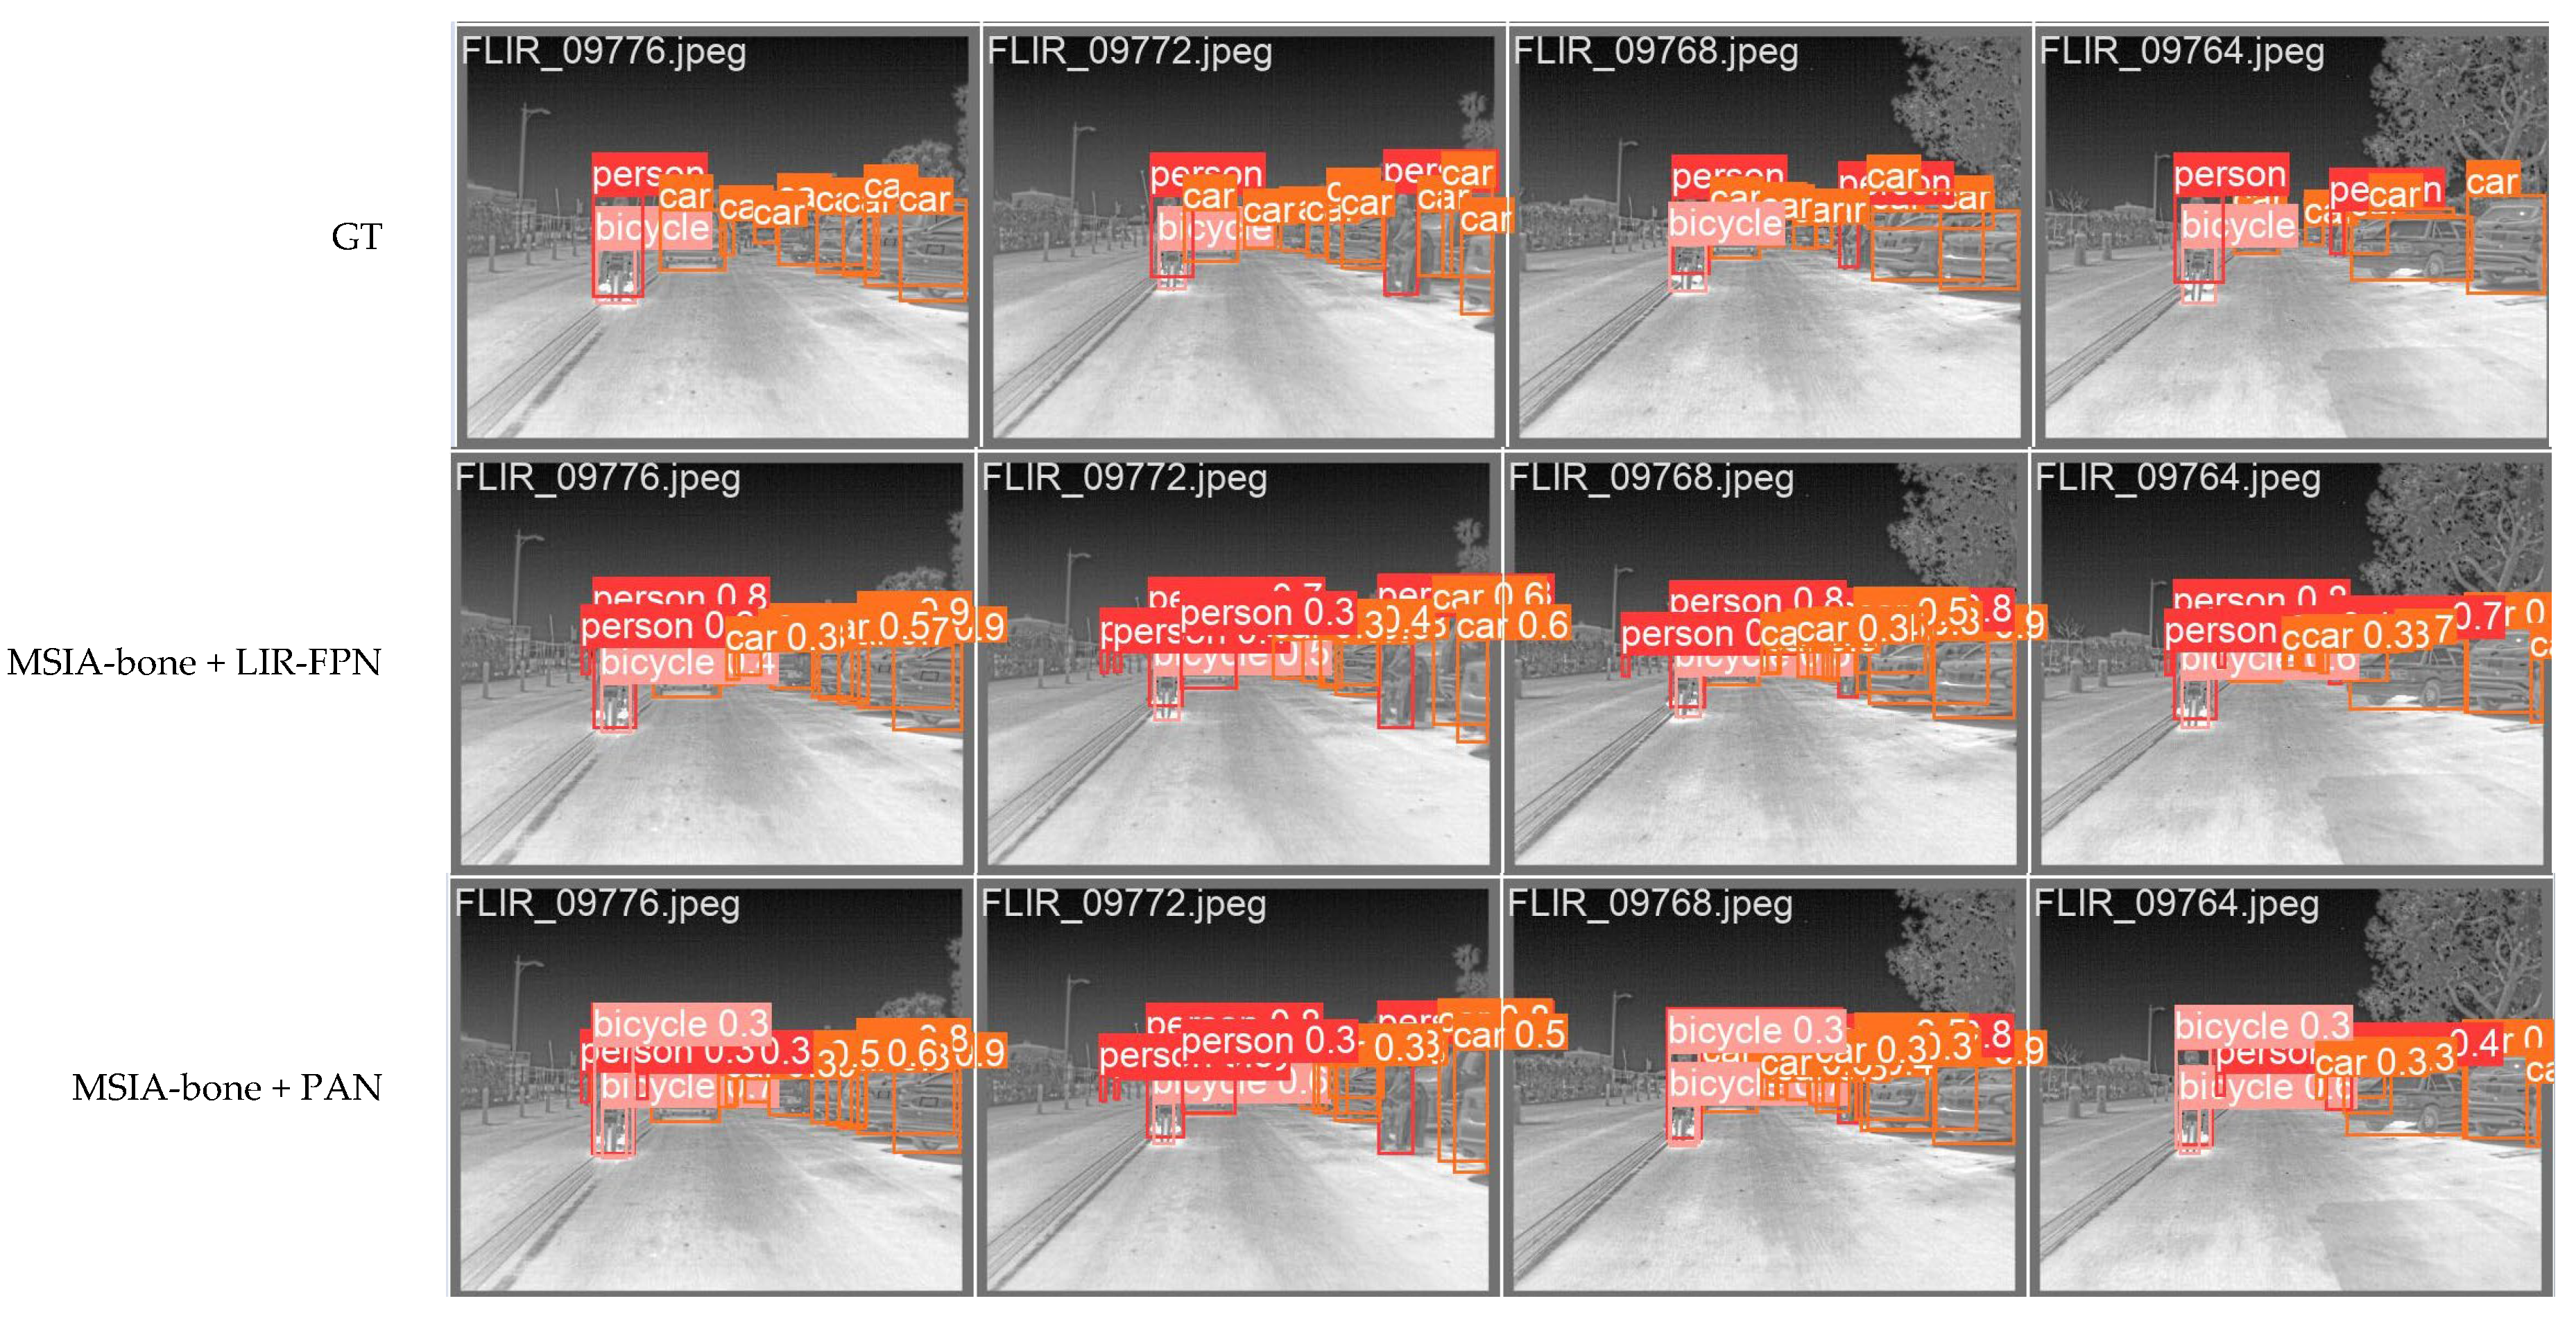
- A new feature fusion network, LIR-FPN, is proposed to shorten the transmission path of infrared target feature information and reduce the noise of infrared target feature fusion. The addition of location attention can allow better use of the precise location information in the underlying feature map to be made, more efficient feature fusion to be achieved, and the model reasoning speed to be improved.
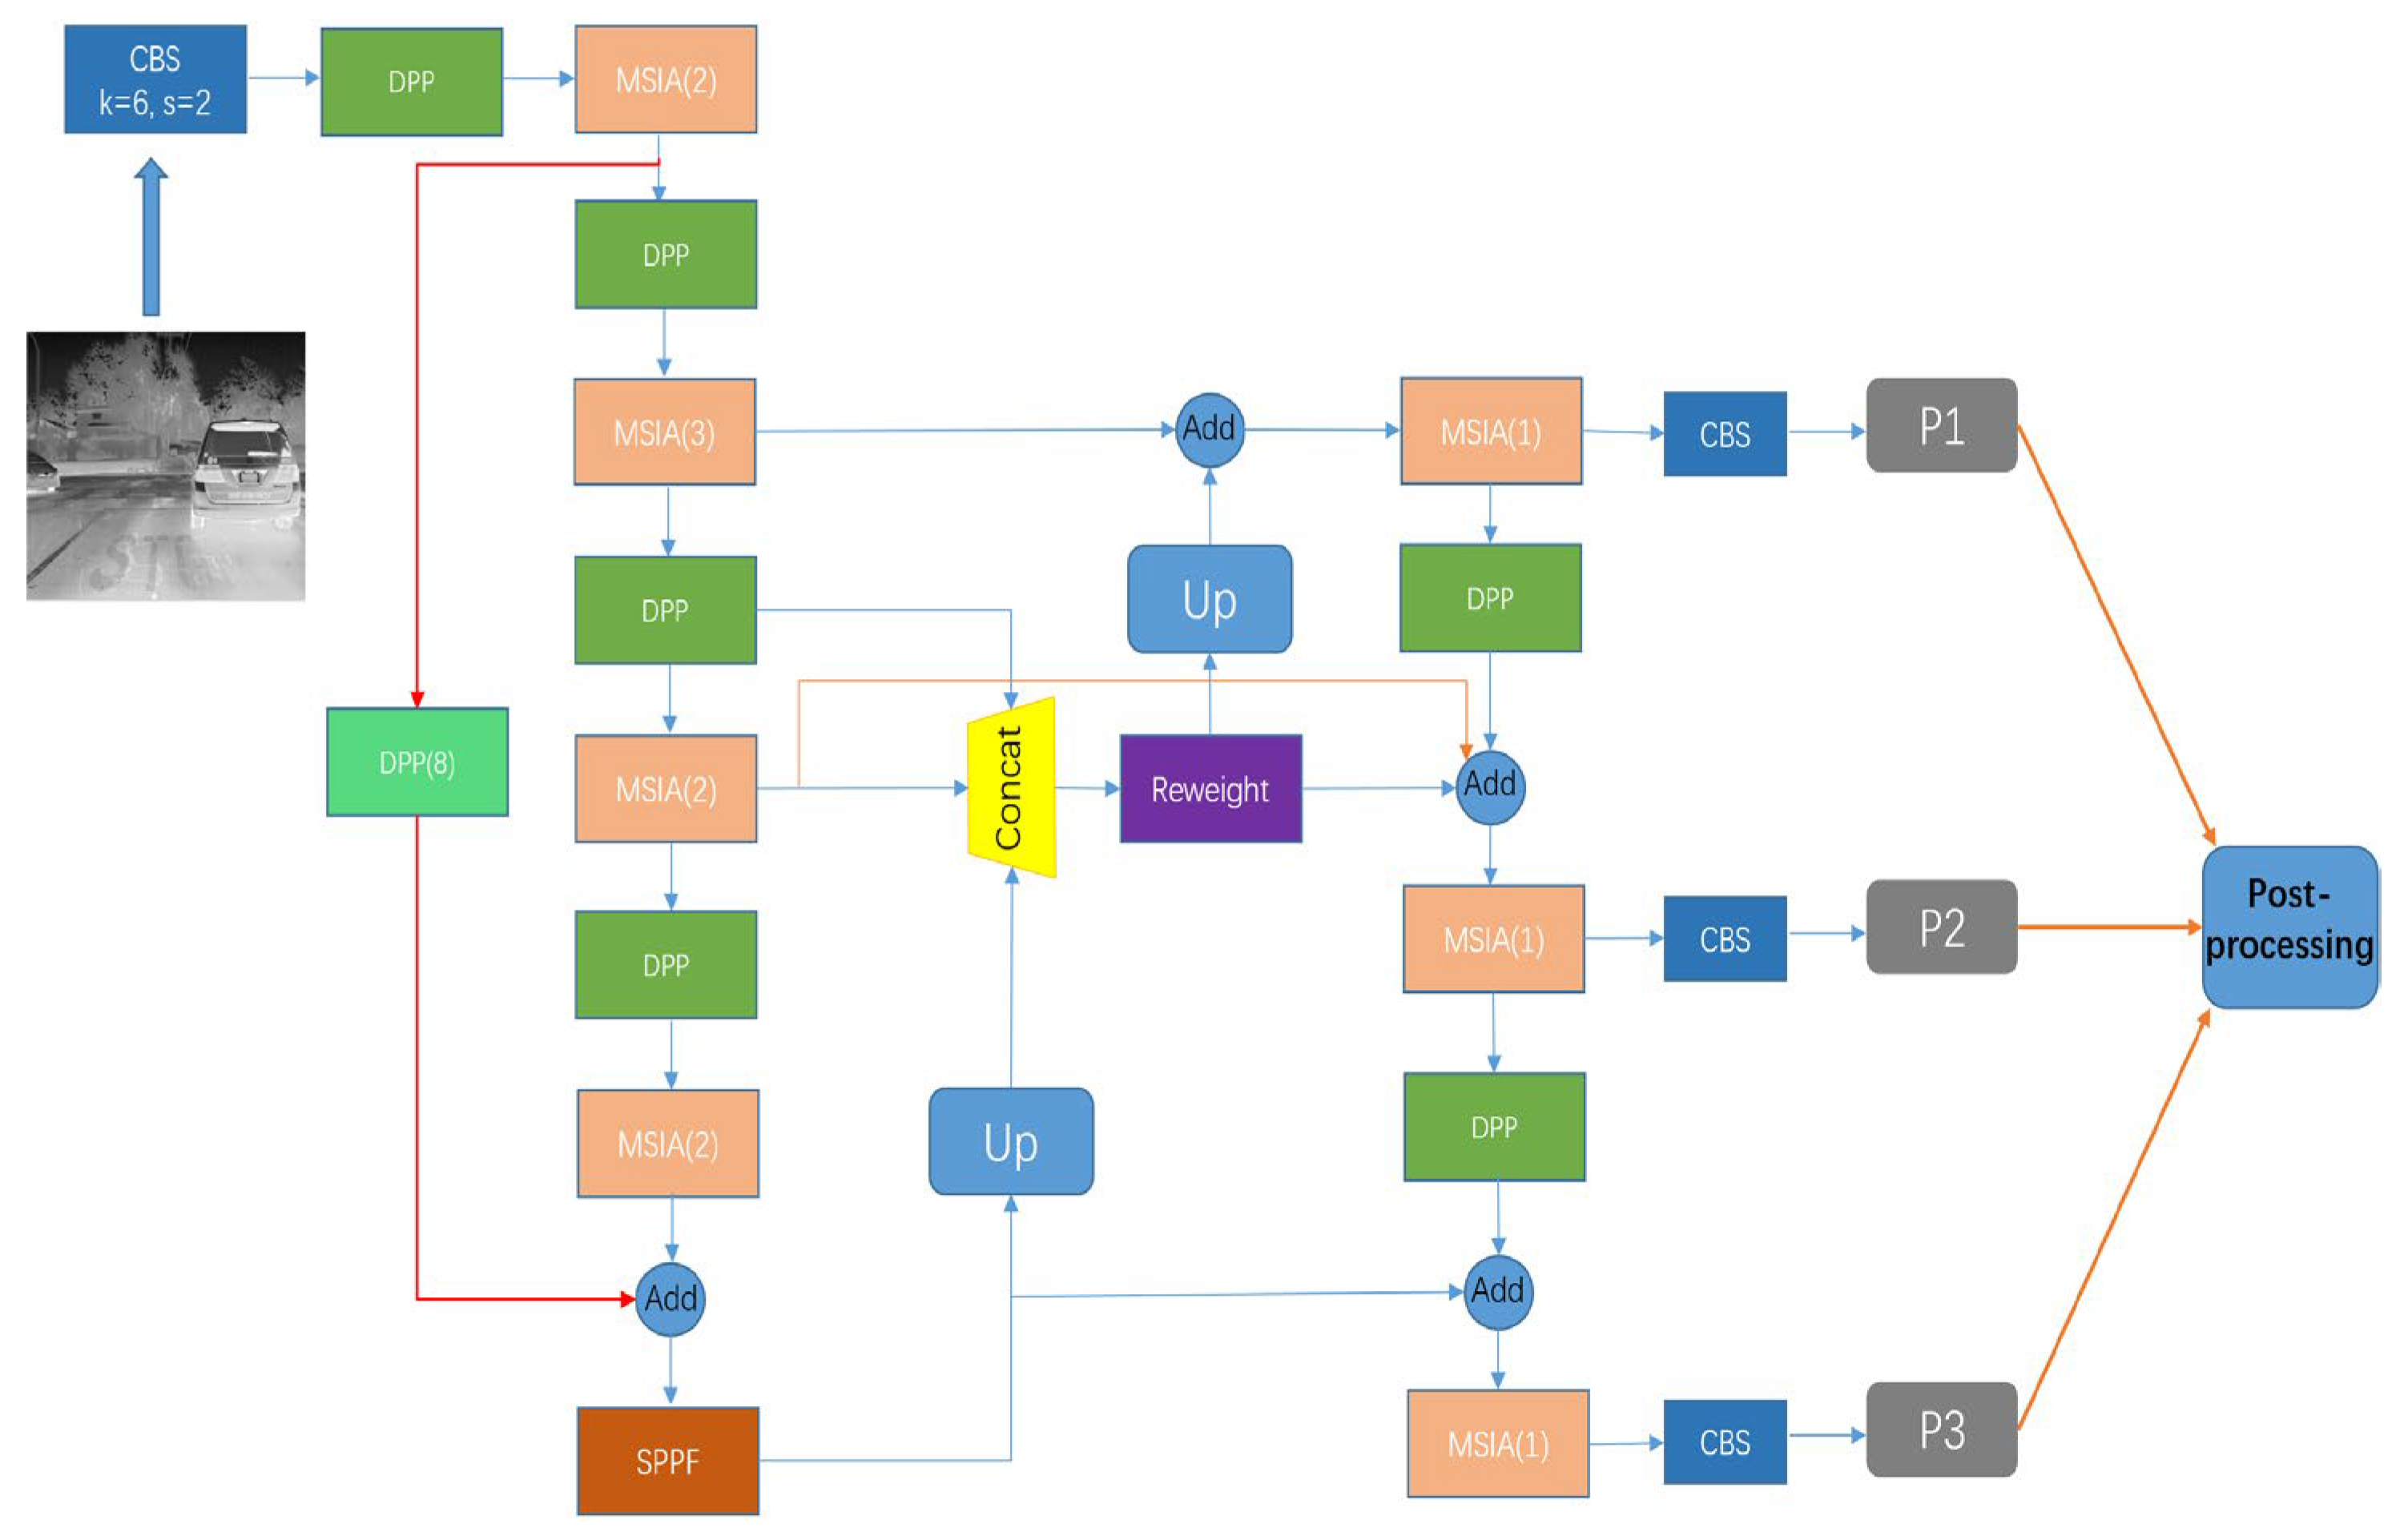
- A lightweight detection network based on MSIA, DPP, SPPF, and LIR-FPN is designed, and it can better detect targets in infrared scenes. Using the K-means clustering algorithm to get the anchor boxes again can be more suitable for infrared target detection.
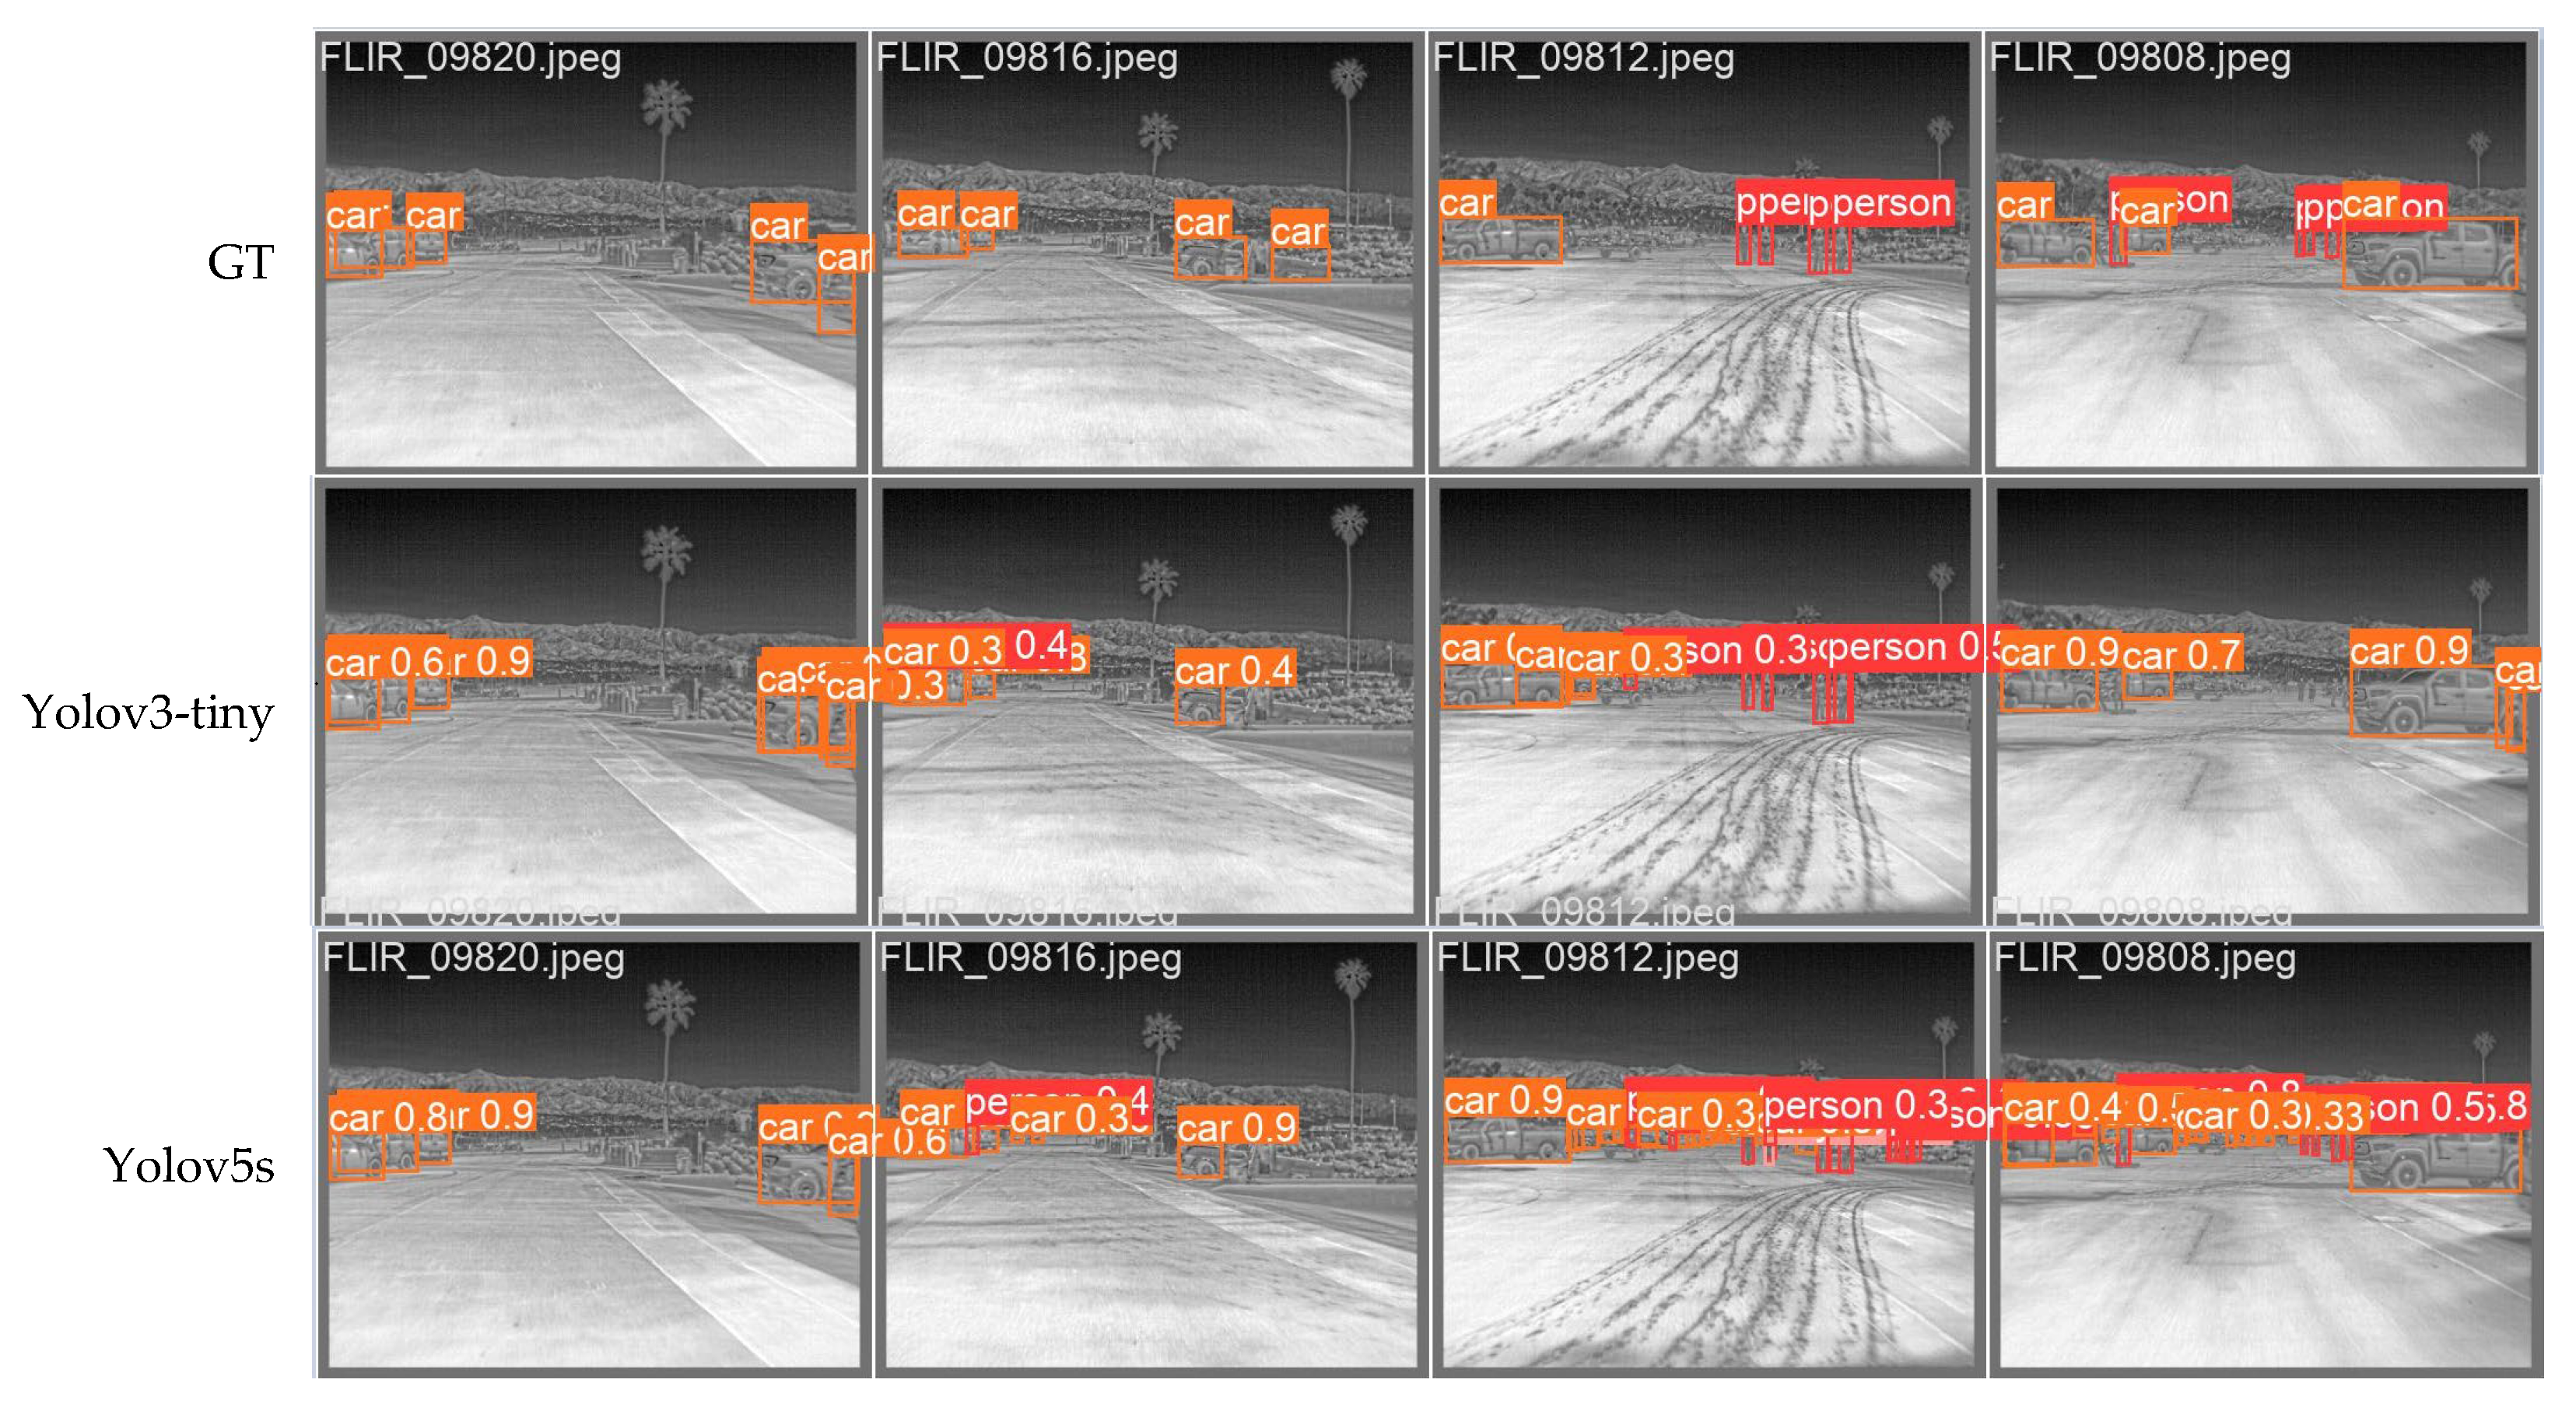
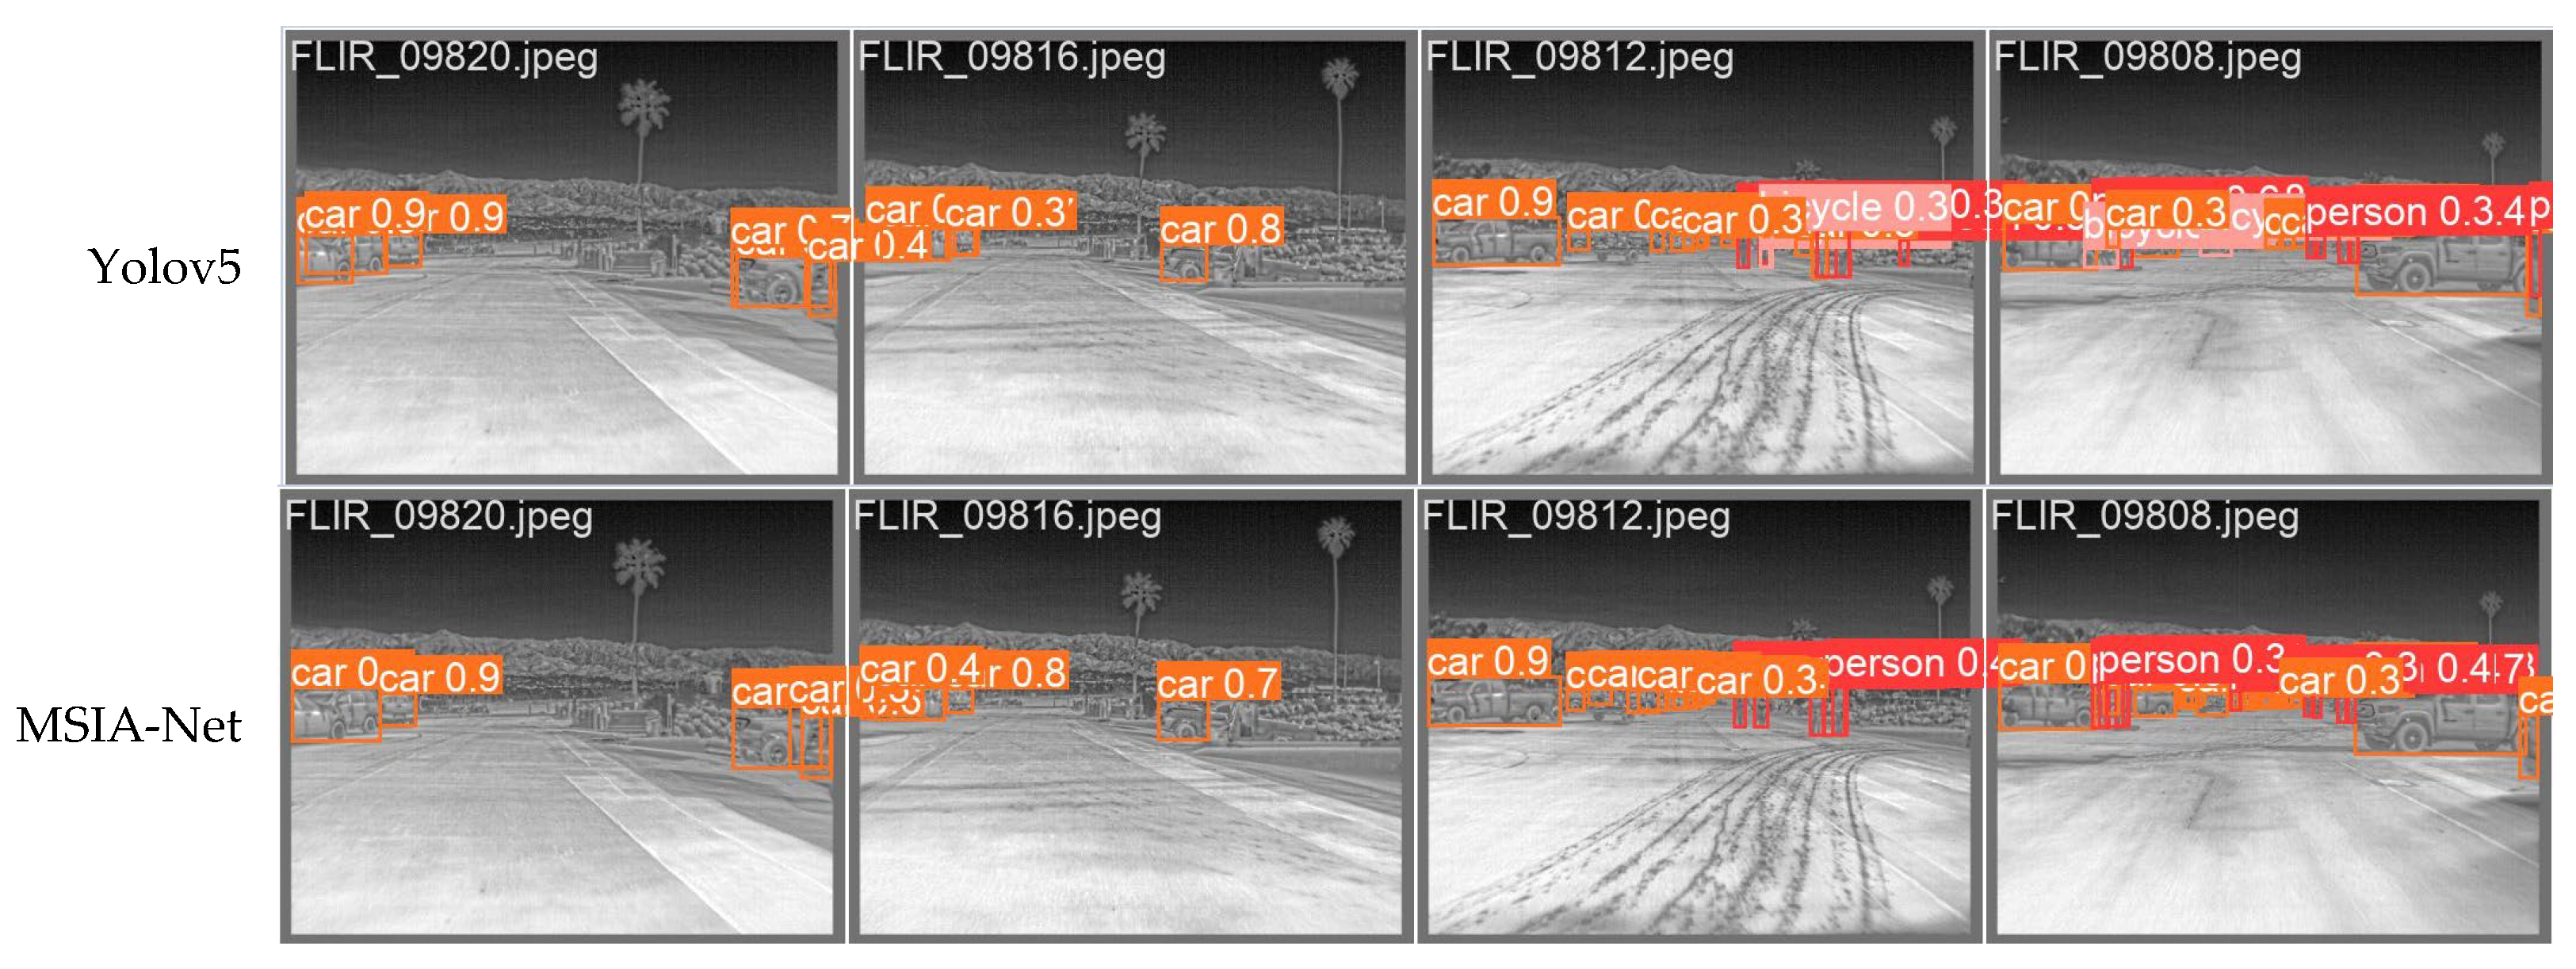
- In a comparison with SOTA target detection algorithms, such as Yolov3-tiny, FS-Yolov5s [16], Yolov5 [25], and Yolov7-tiny [26], on FLIR infrared image datasets, by using various indexes, such as the mAP, precision, recall, and F1 score, the model proposed in this paper was proven to be effective for infrared image target detection.
2. Materials and Methods
2.1. Backbone Network
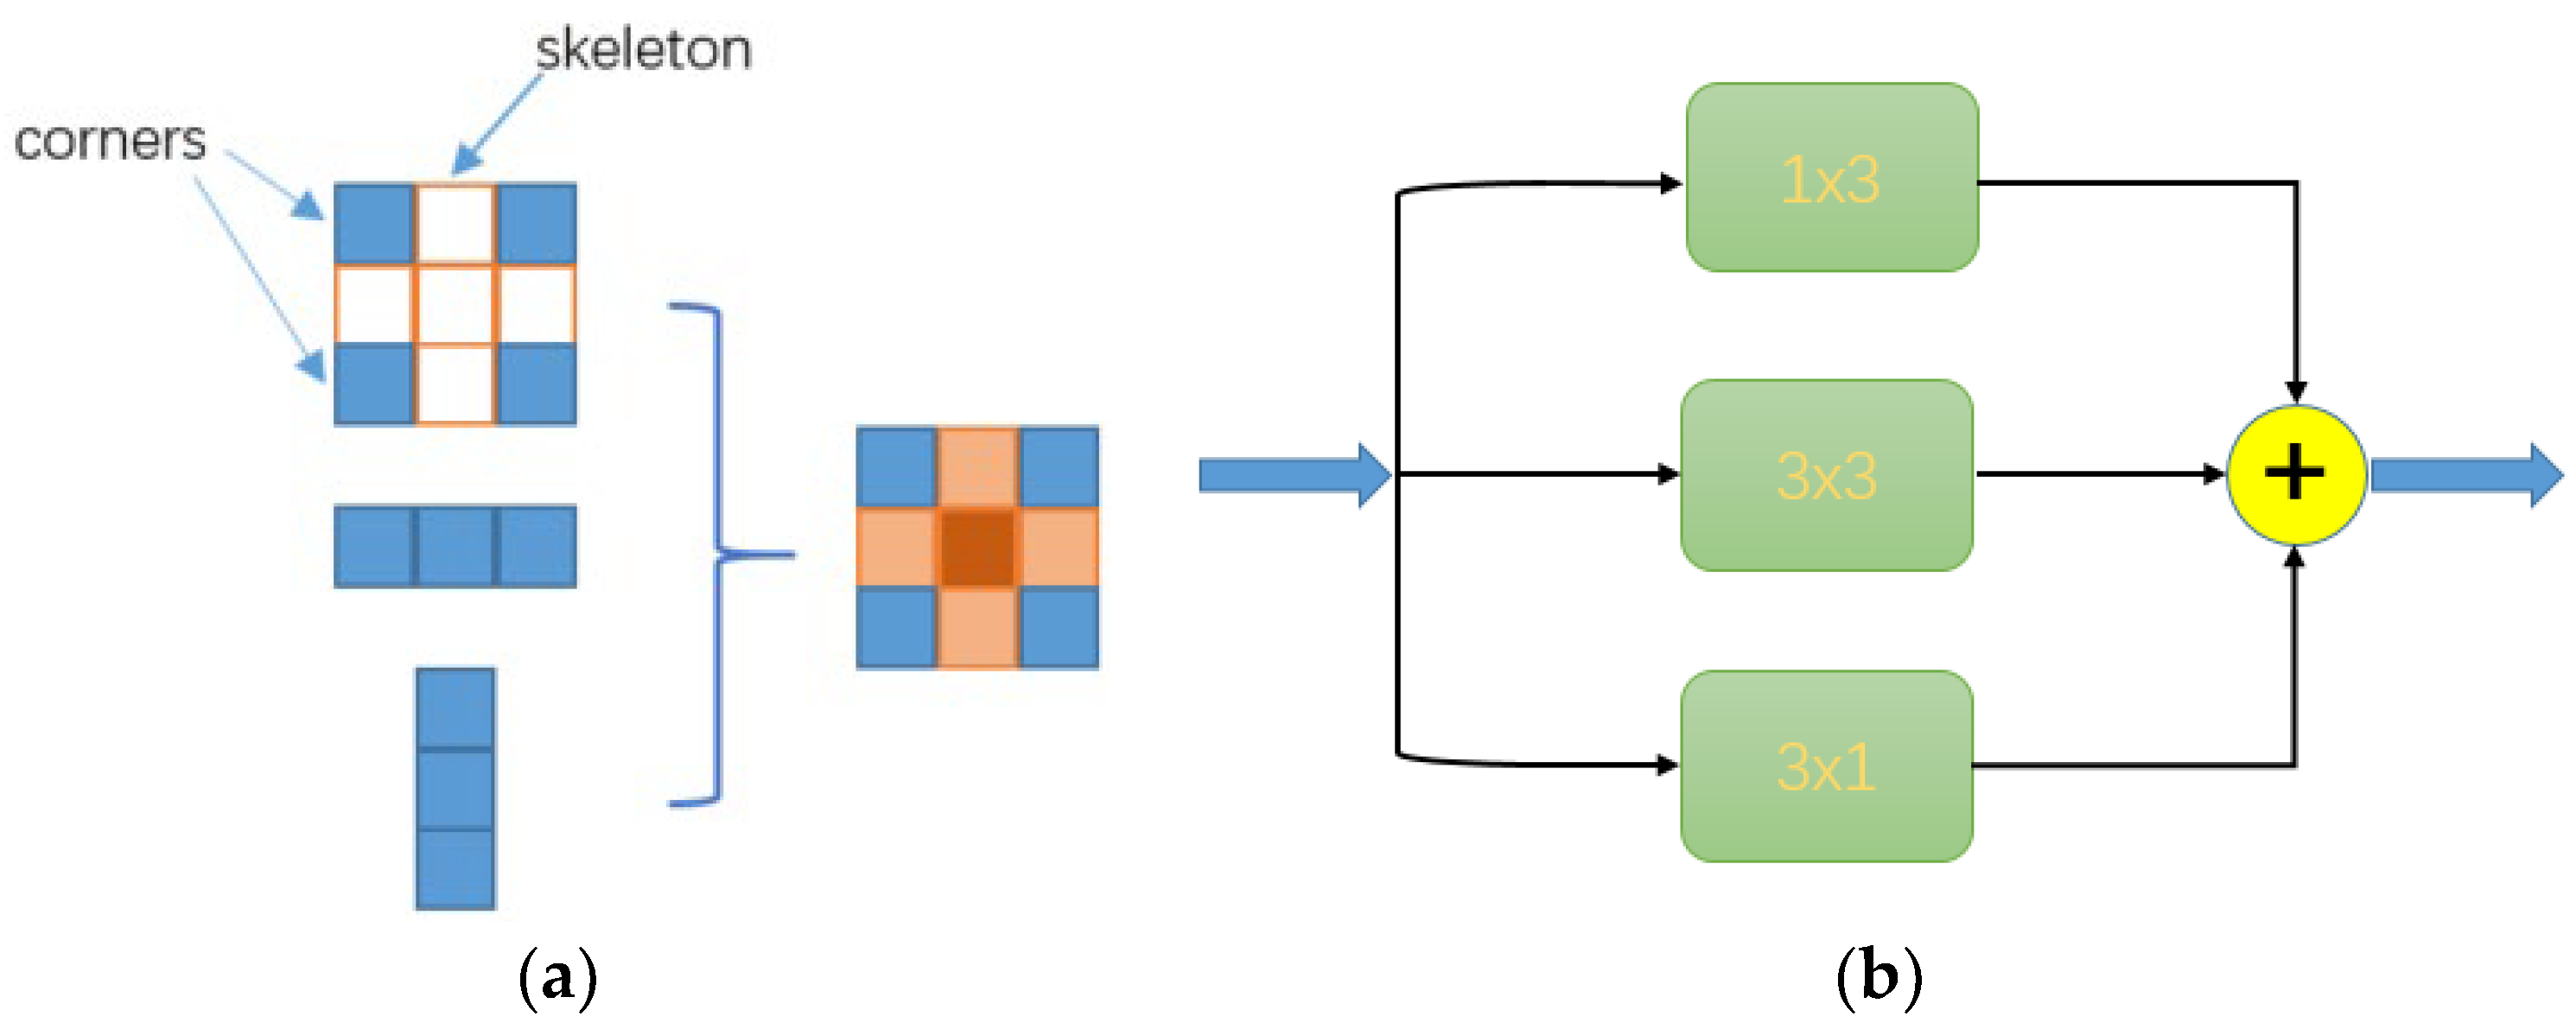
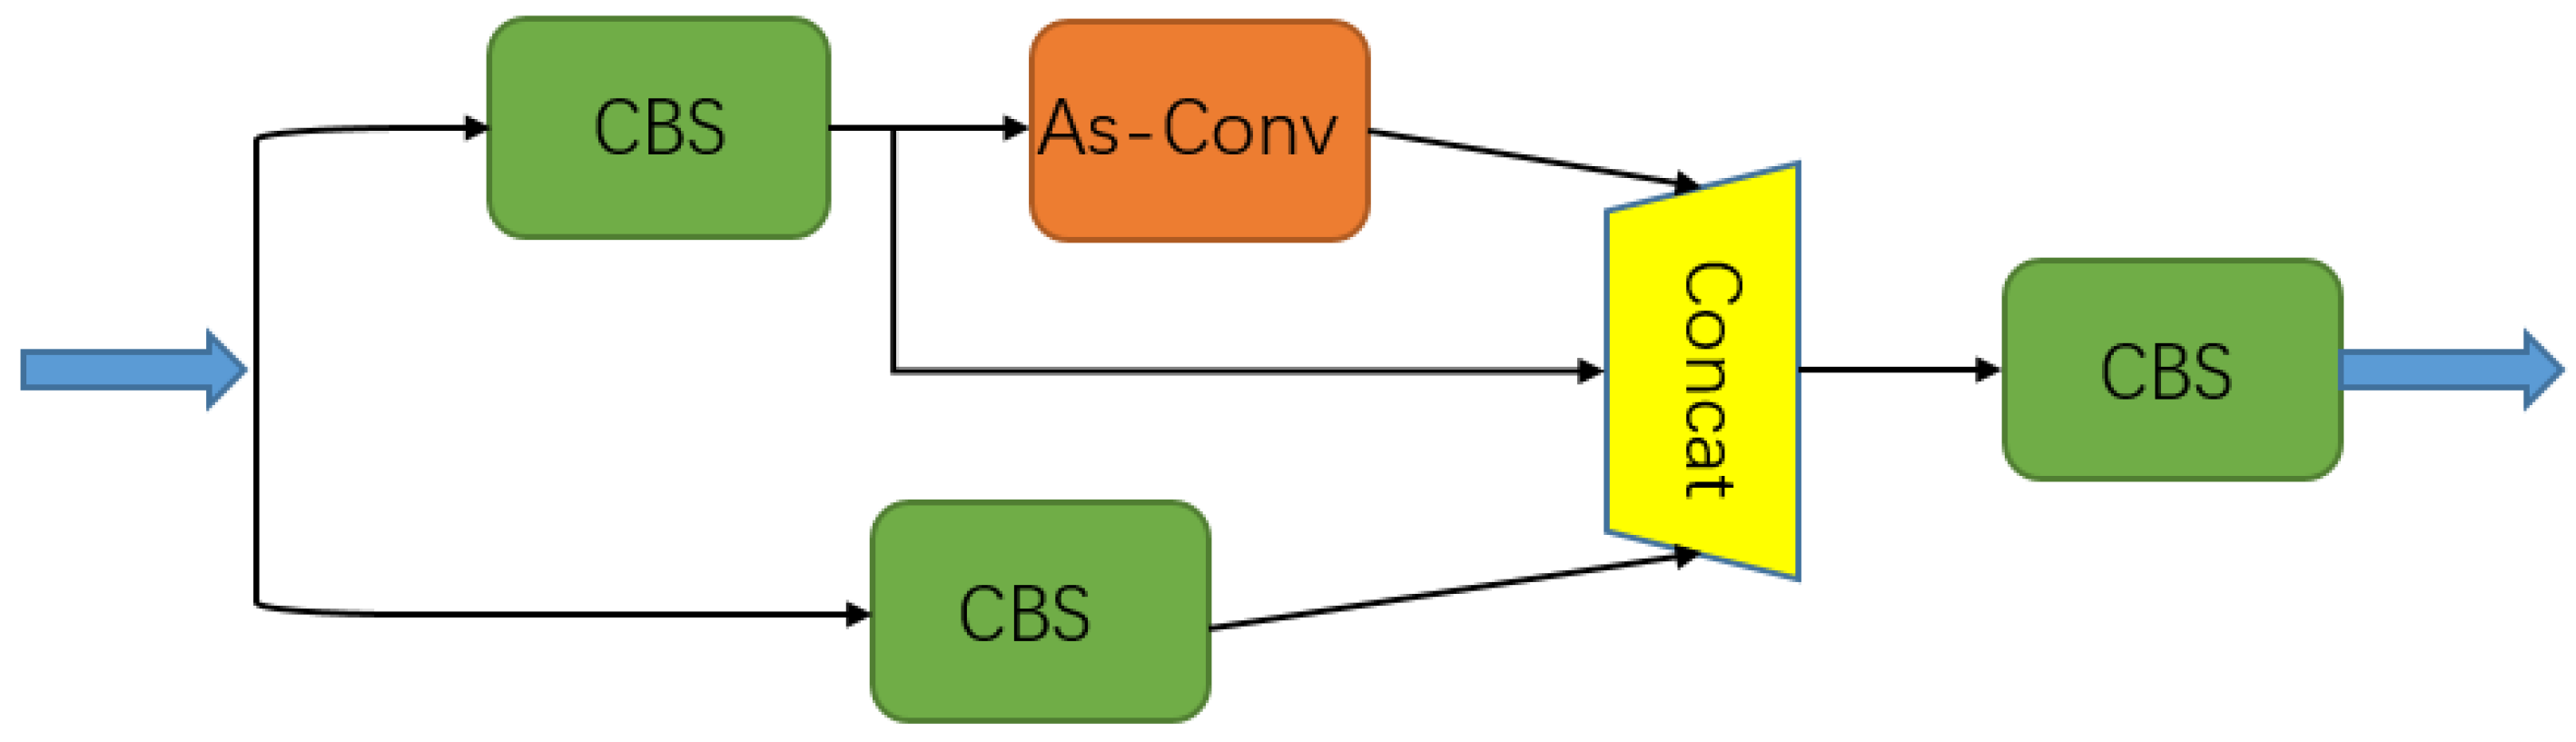
2.1.1. MSIA Module
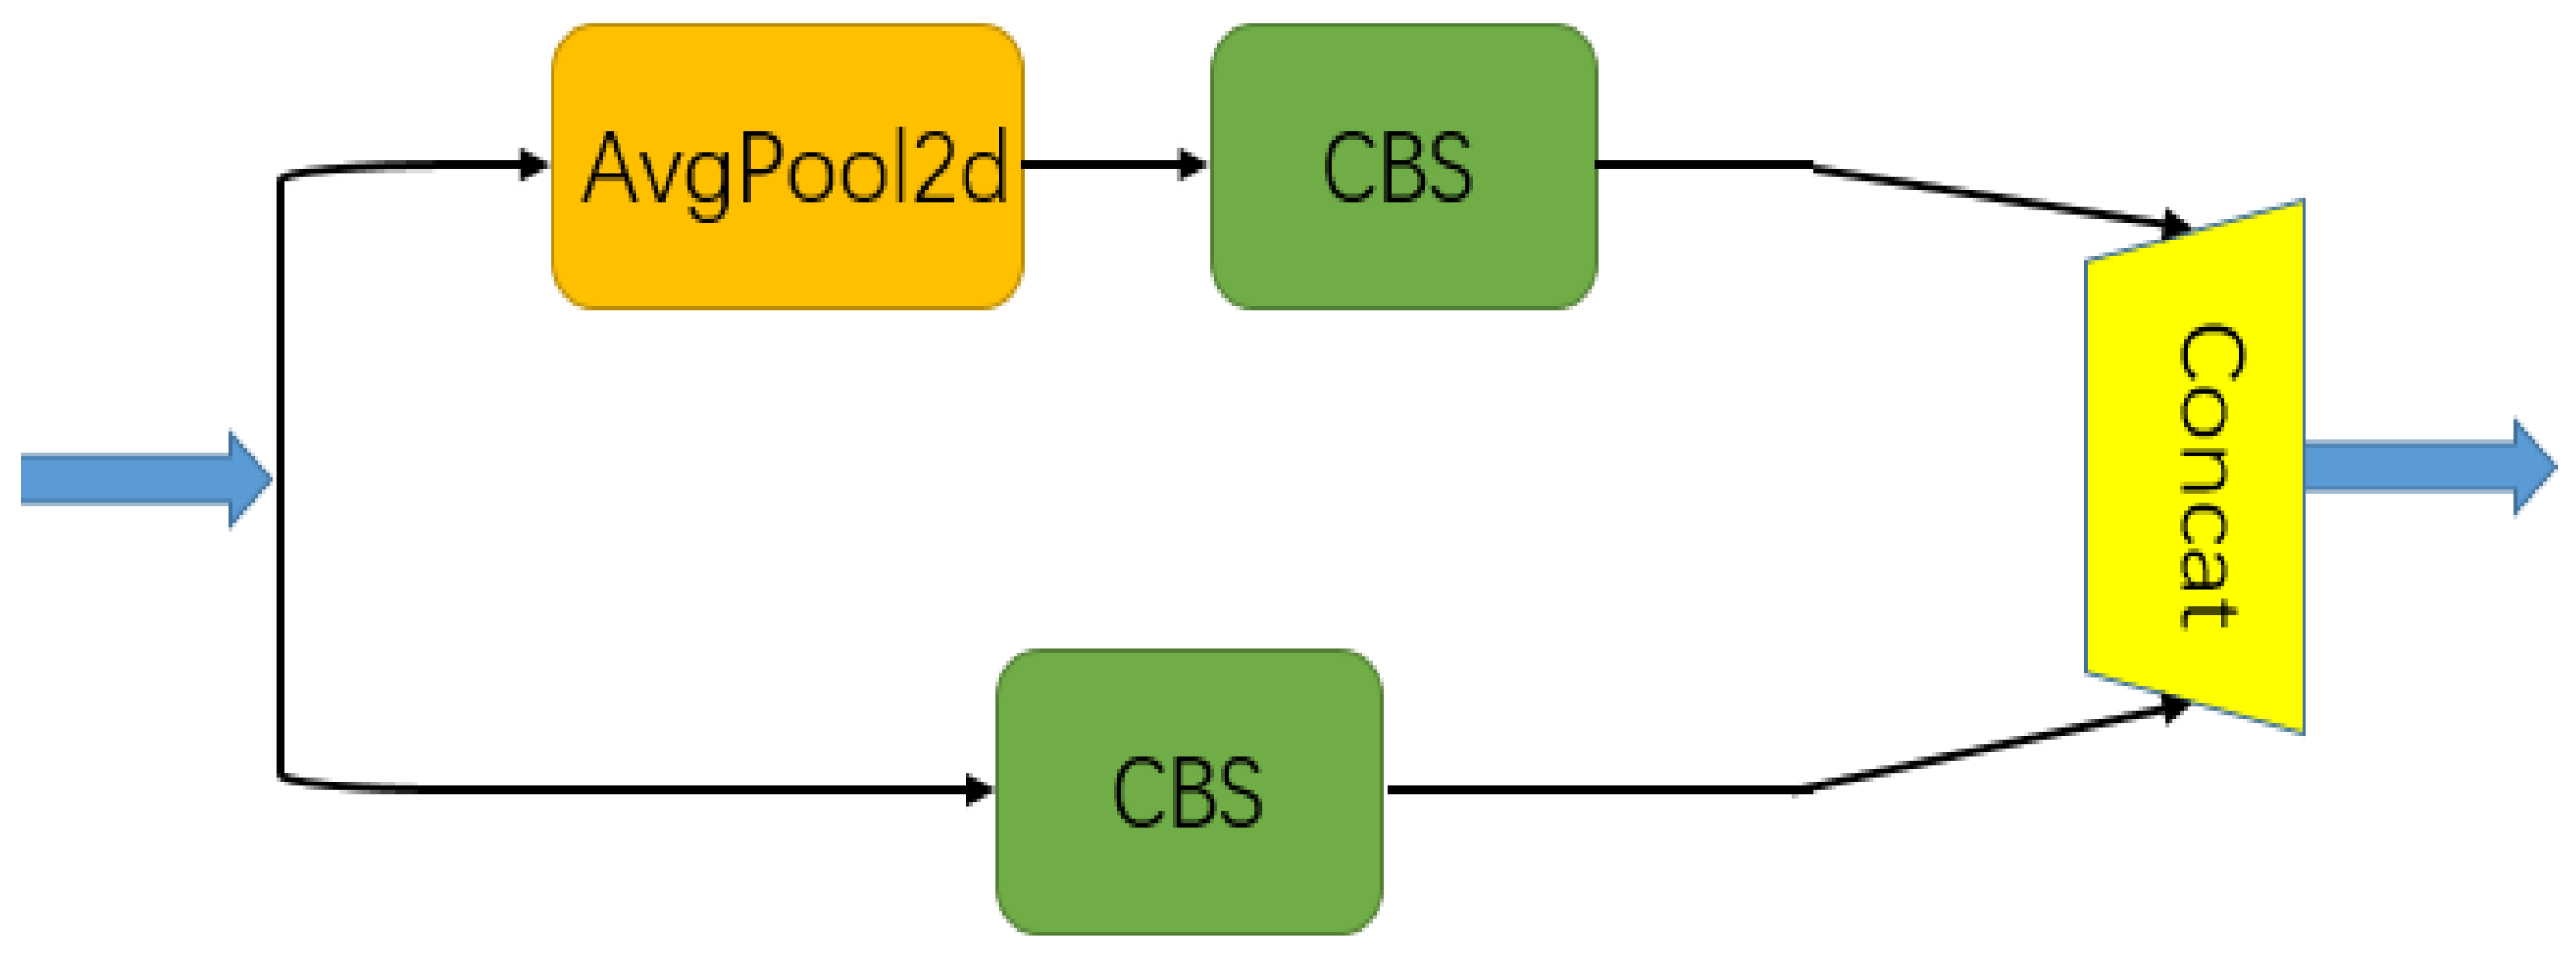
2.1.2. DPP
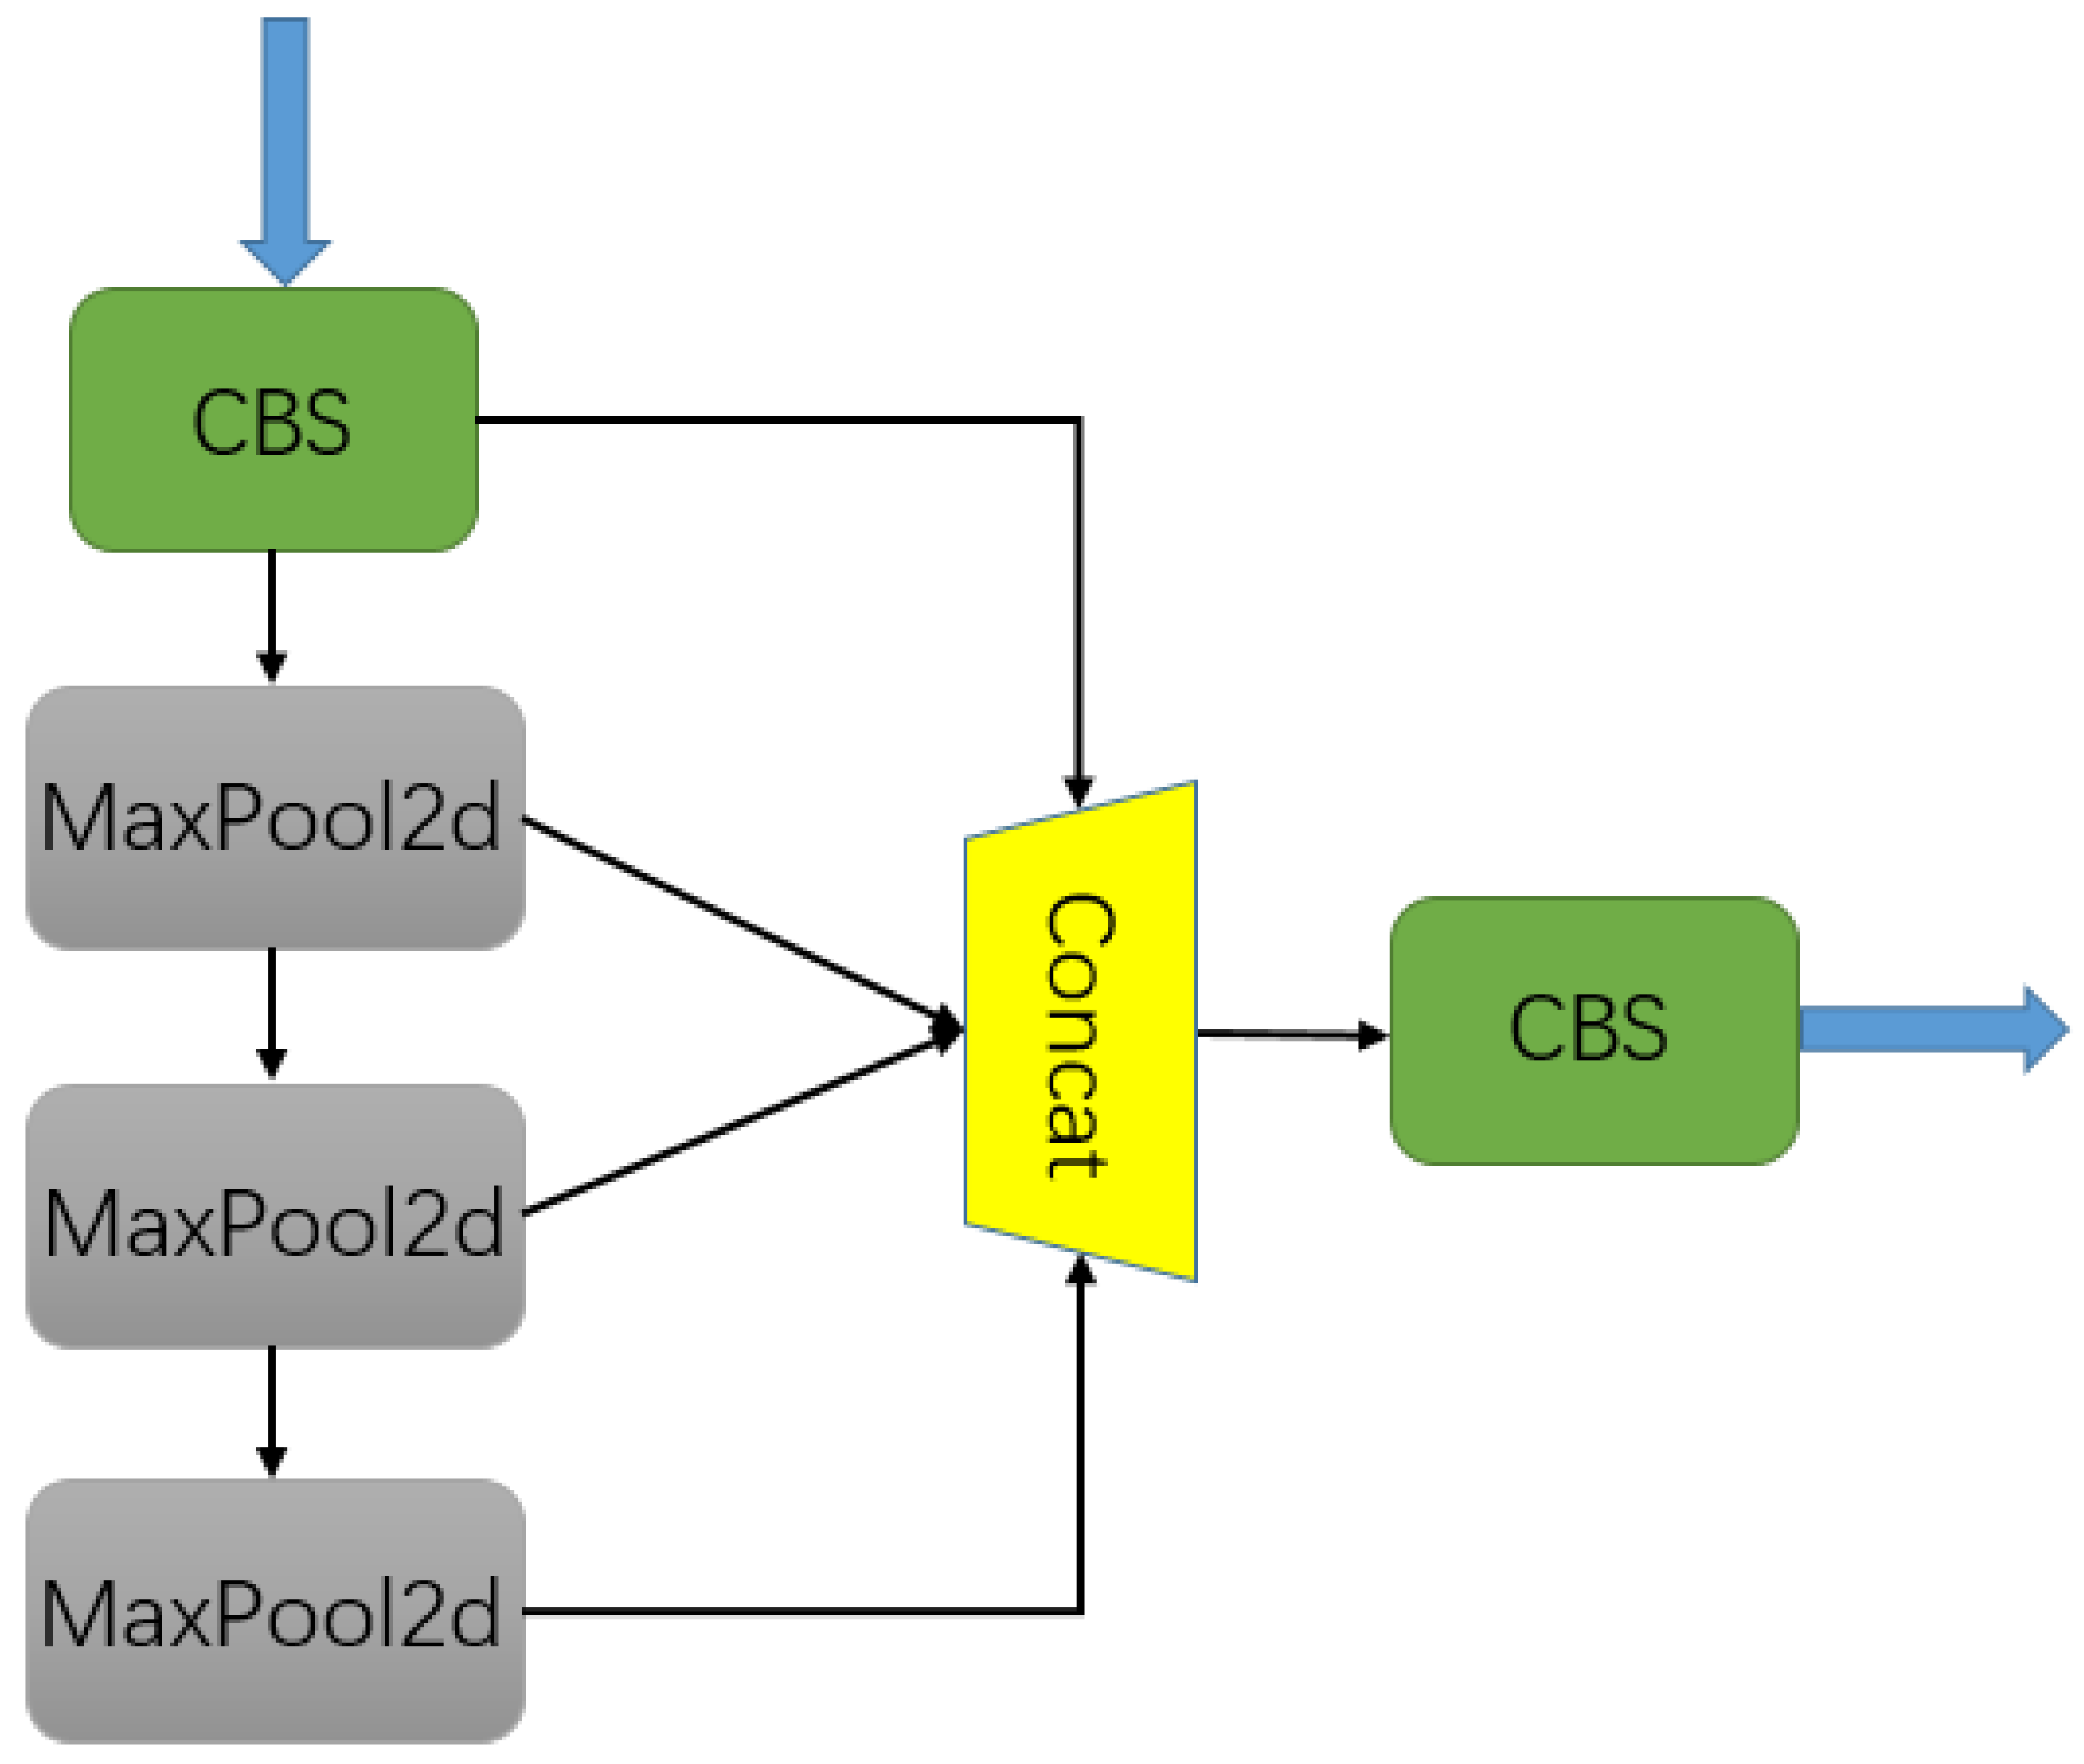
2.1.3. SPPF
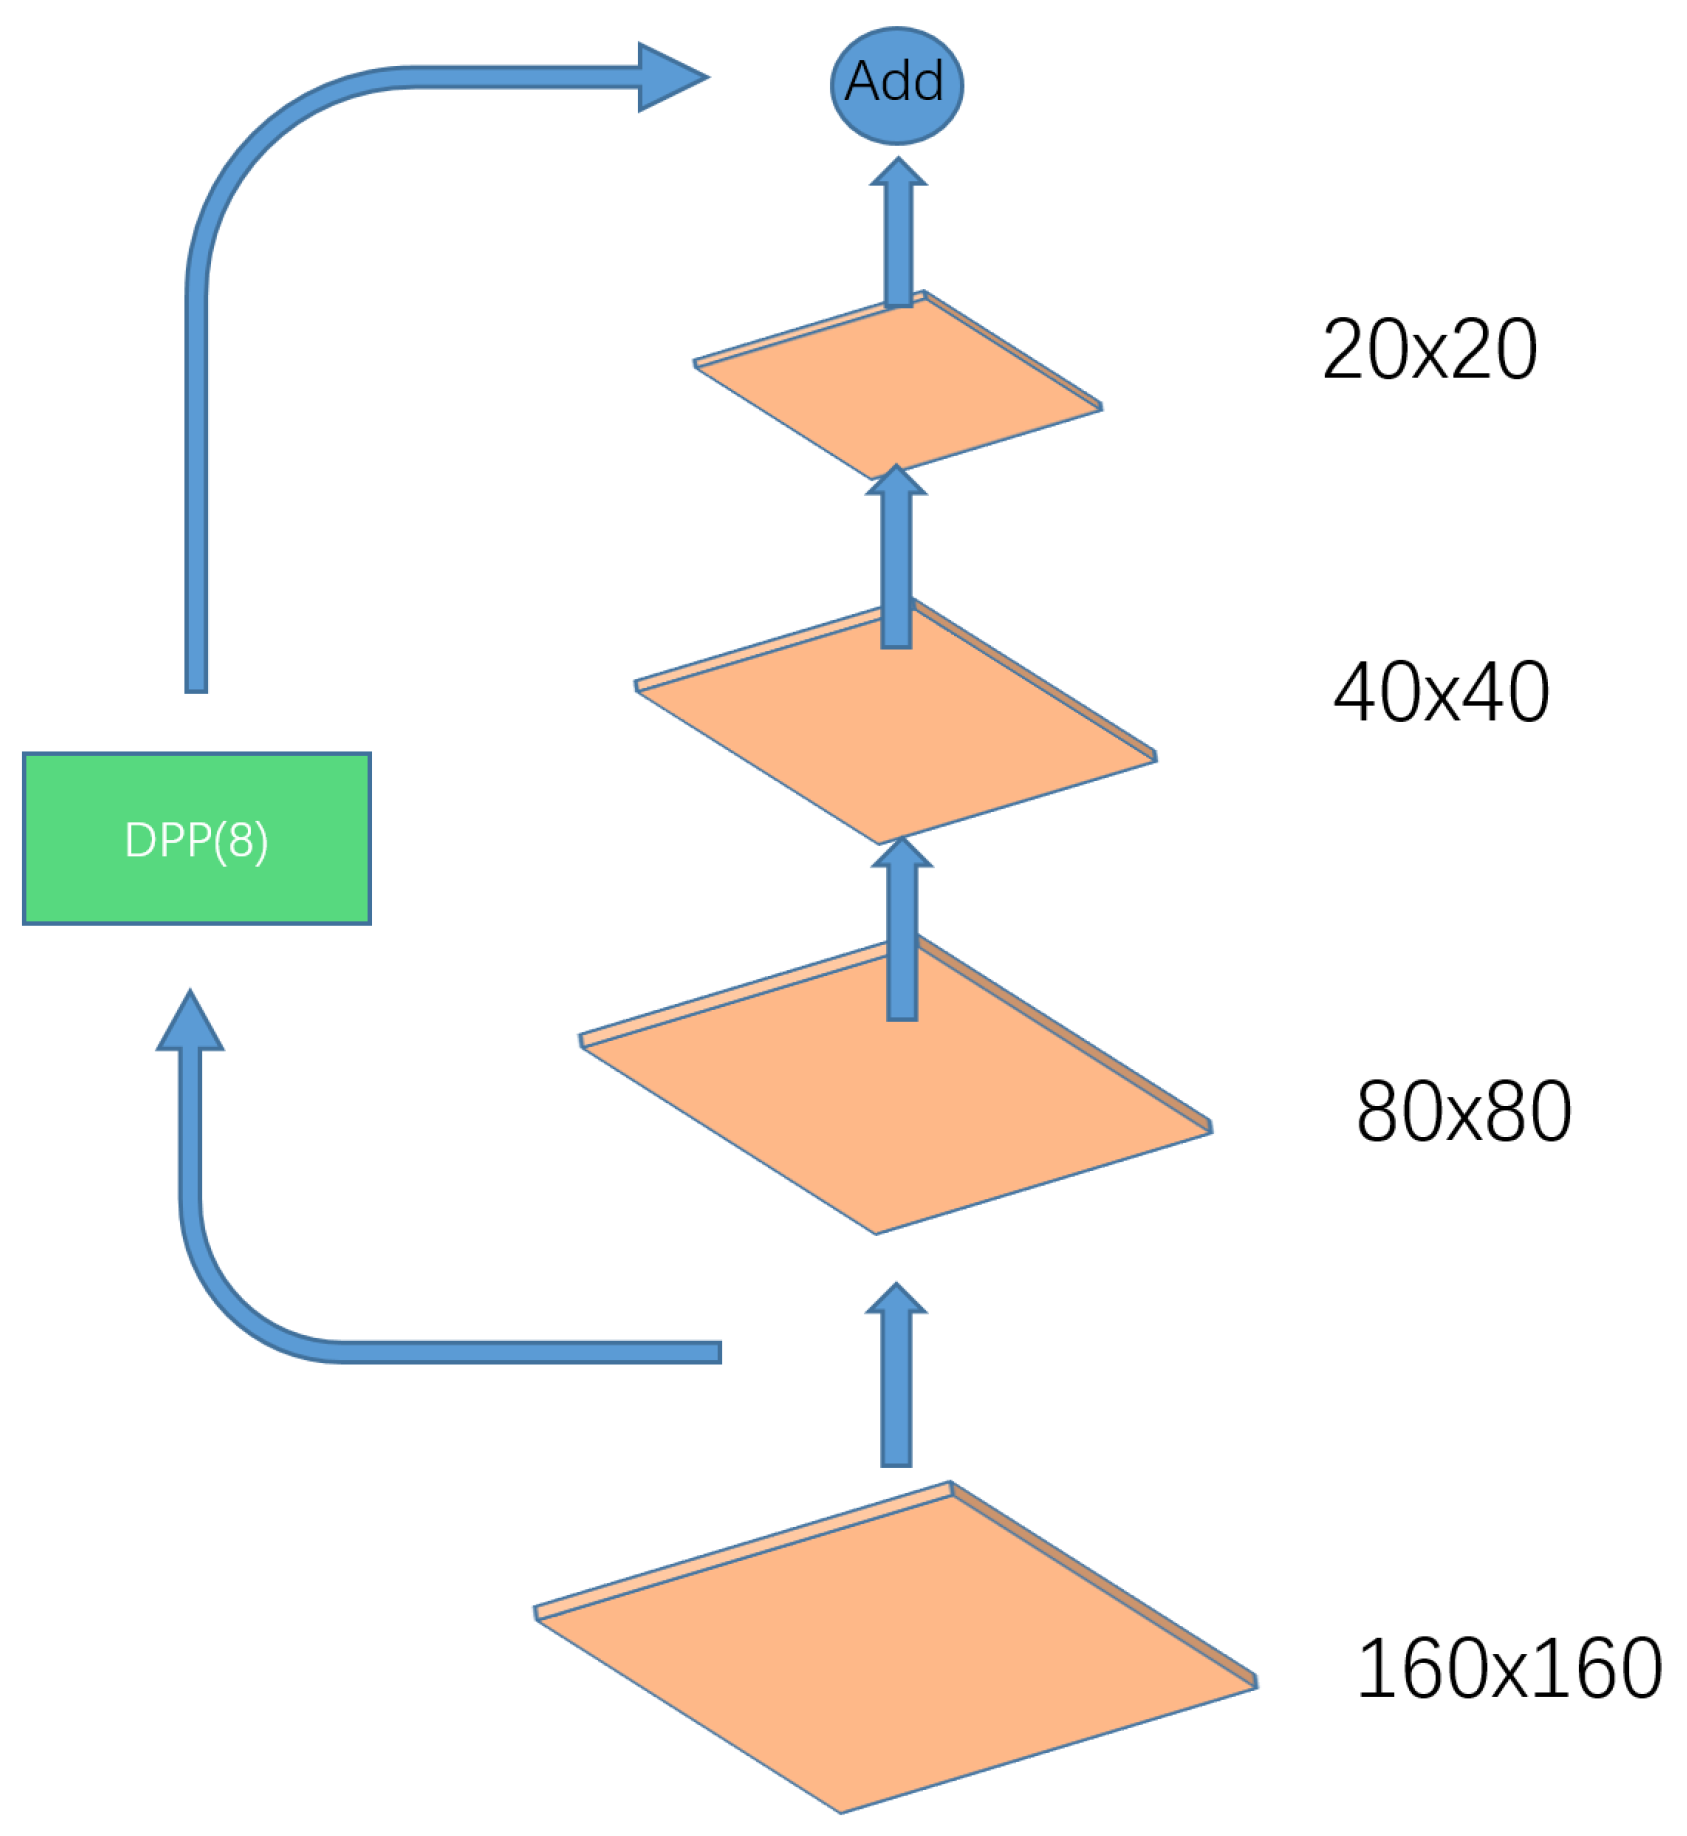
2.1.4. Information Compensation Branch
2.2. Bottleneck Network vs. Prediction Network
2.3. MSIA-Net’s Network Architecture
3. Experiments and Results
3.1. Datasets and Evaluation Metrics
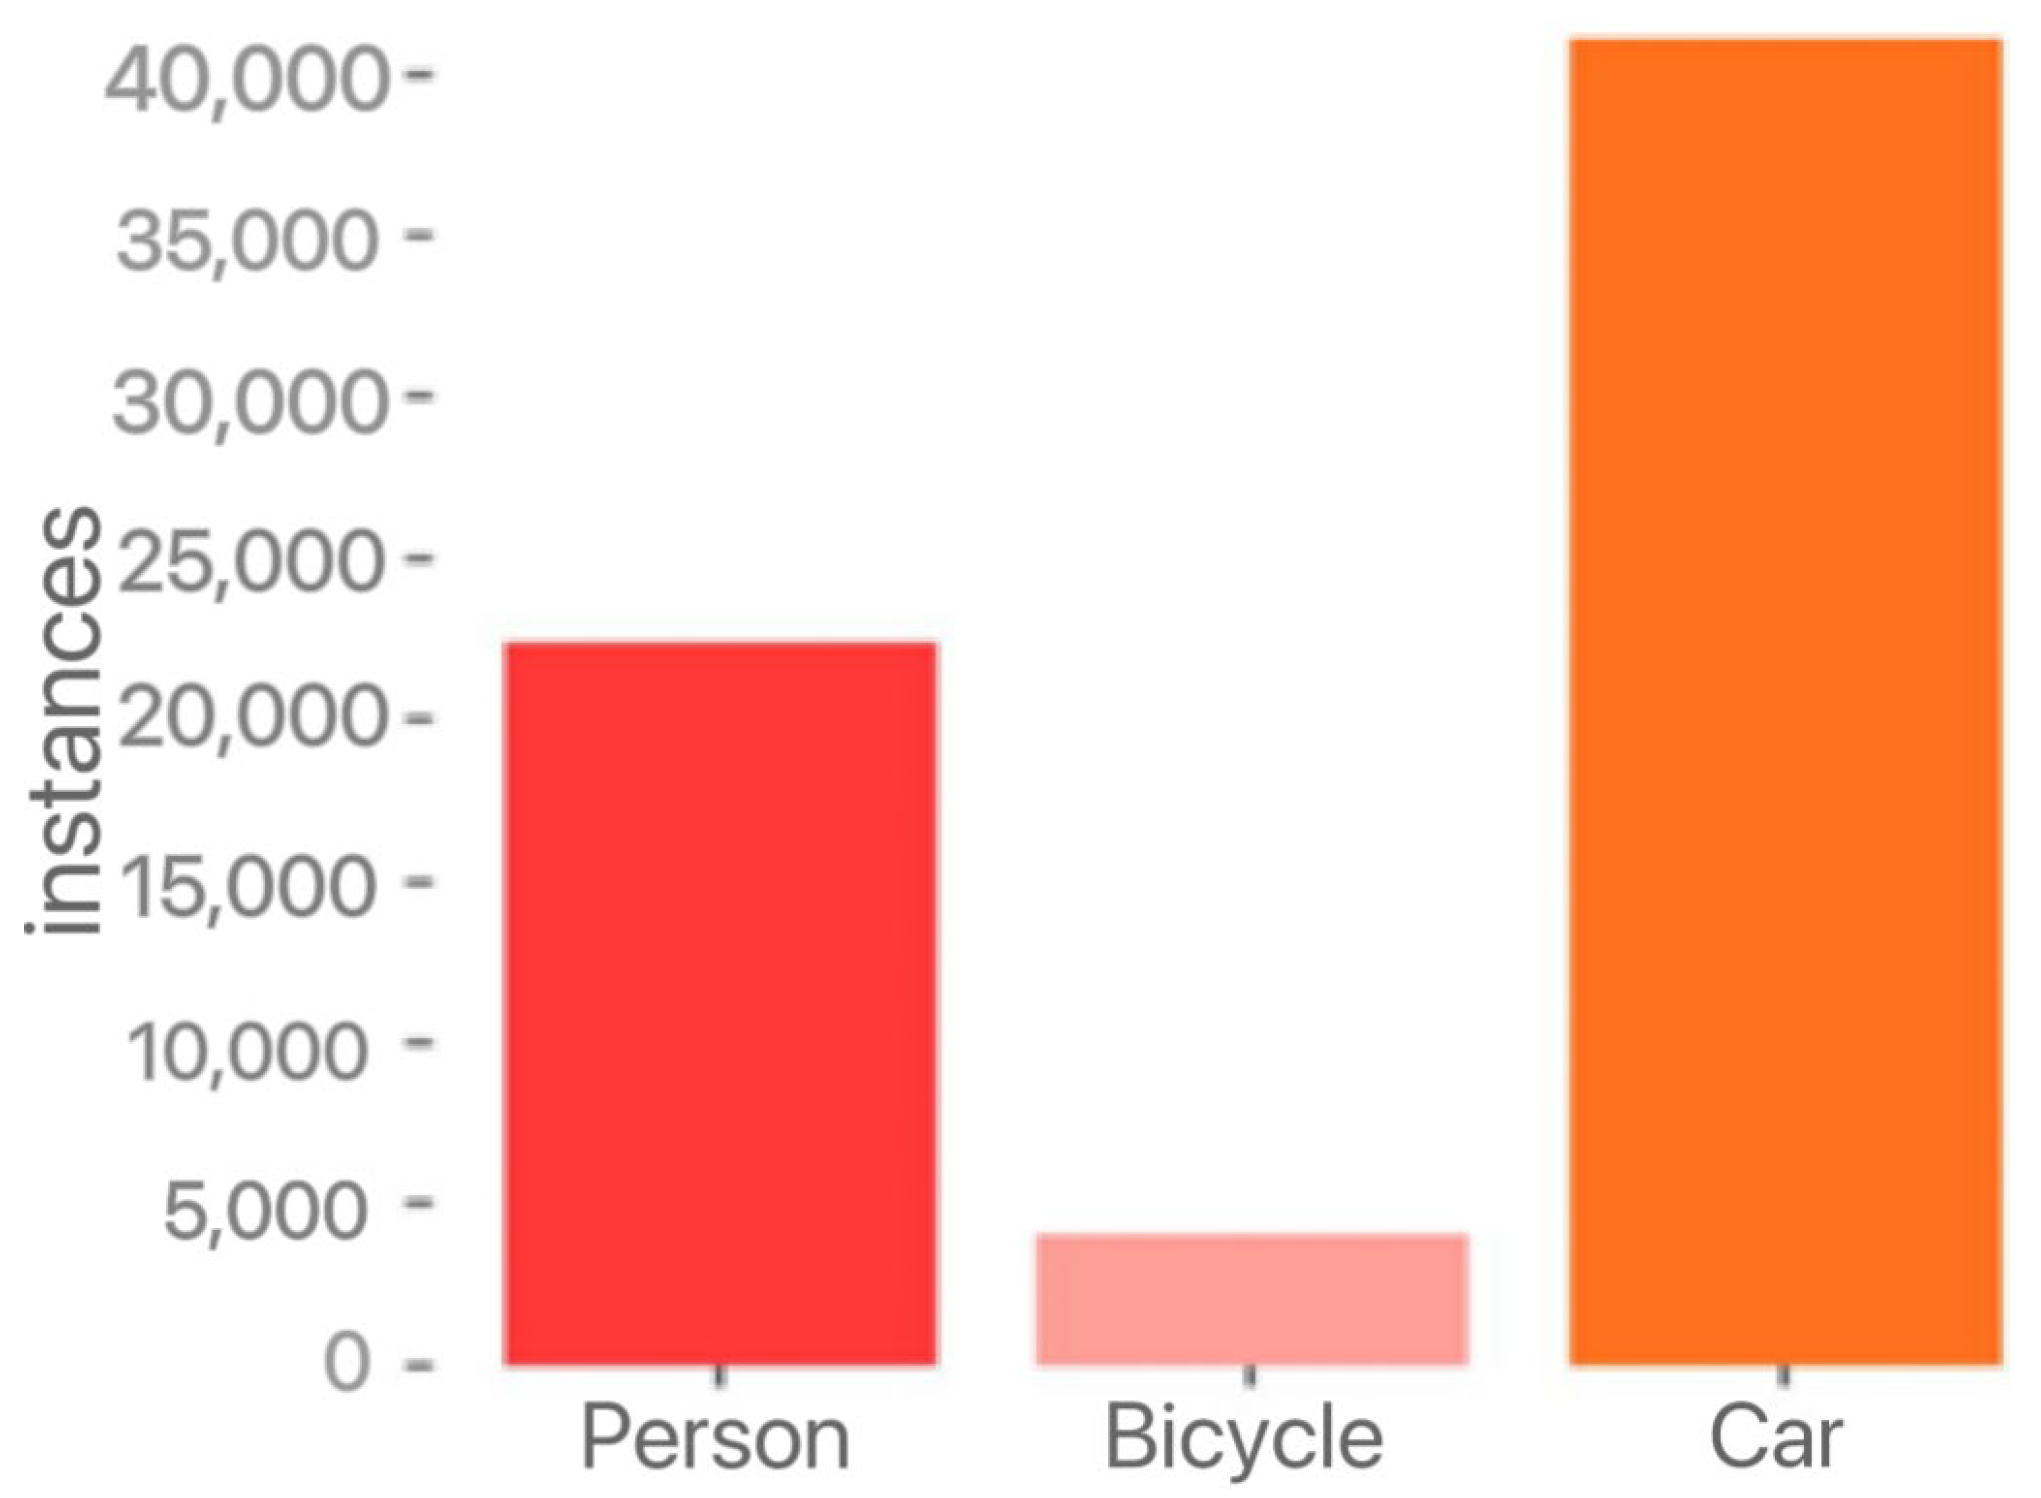
3.1.1. Datasets
3.1.2. Data Augmentation
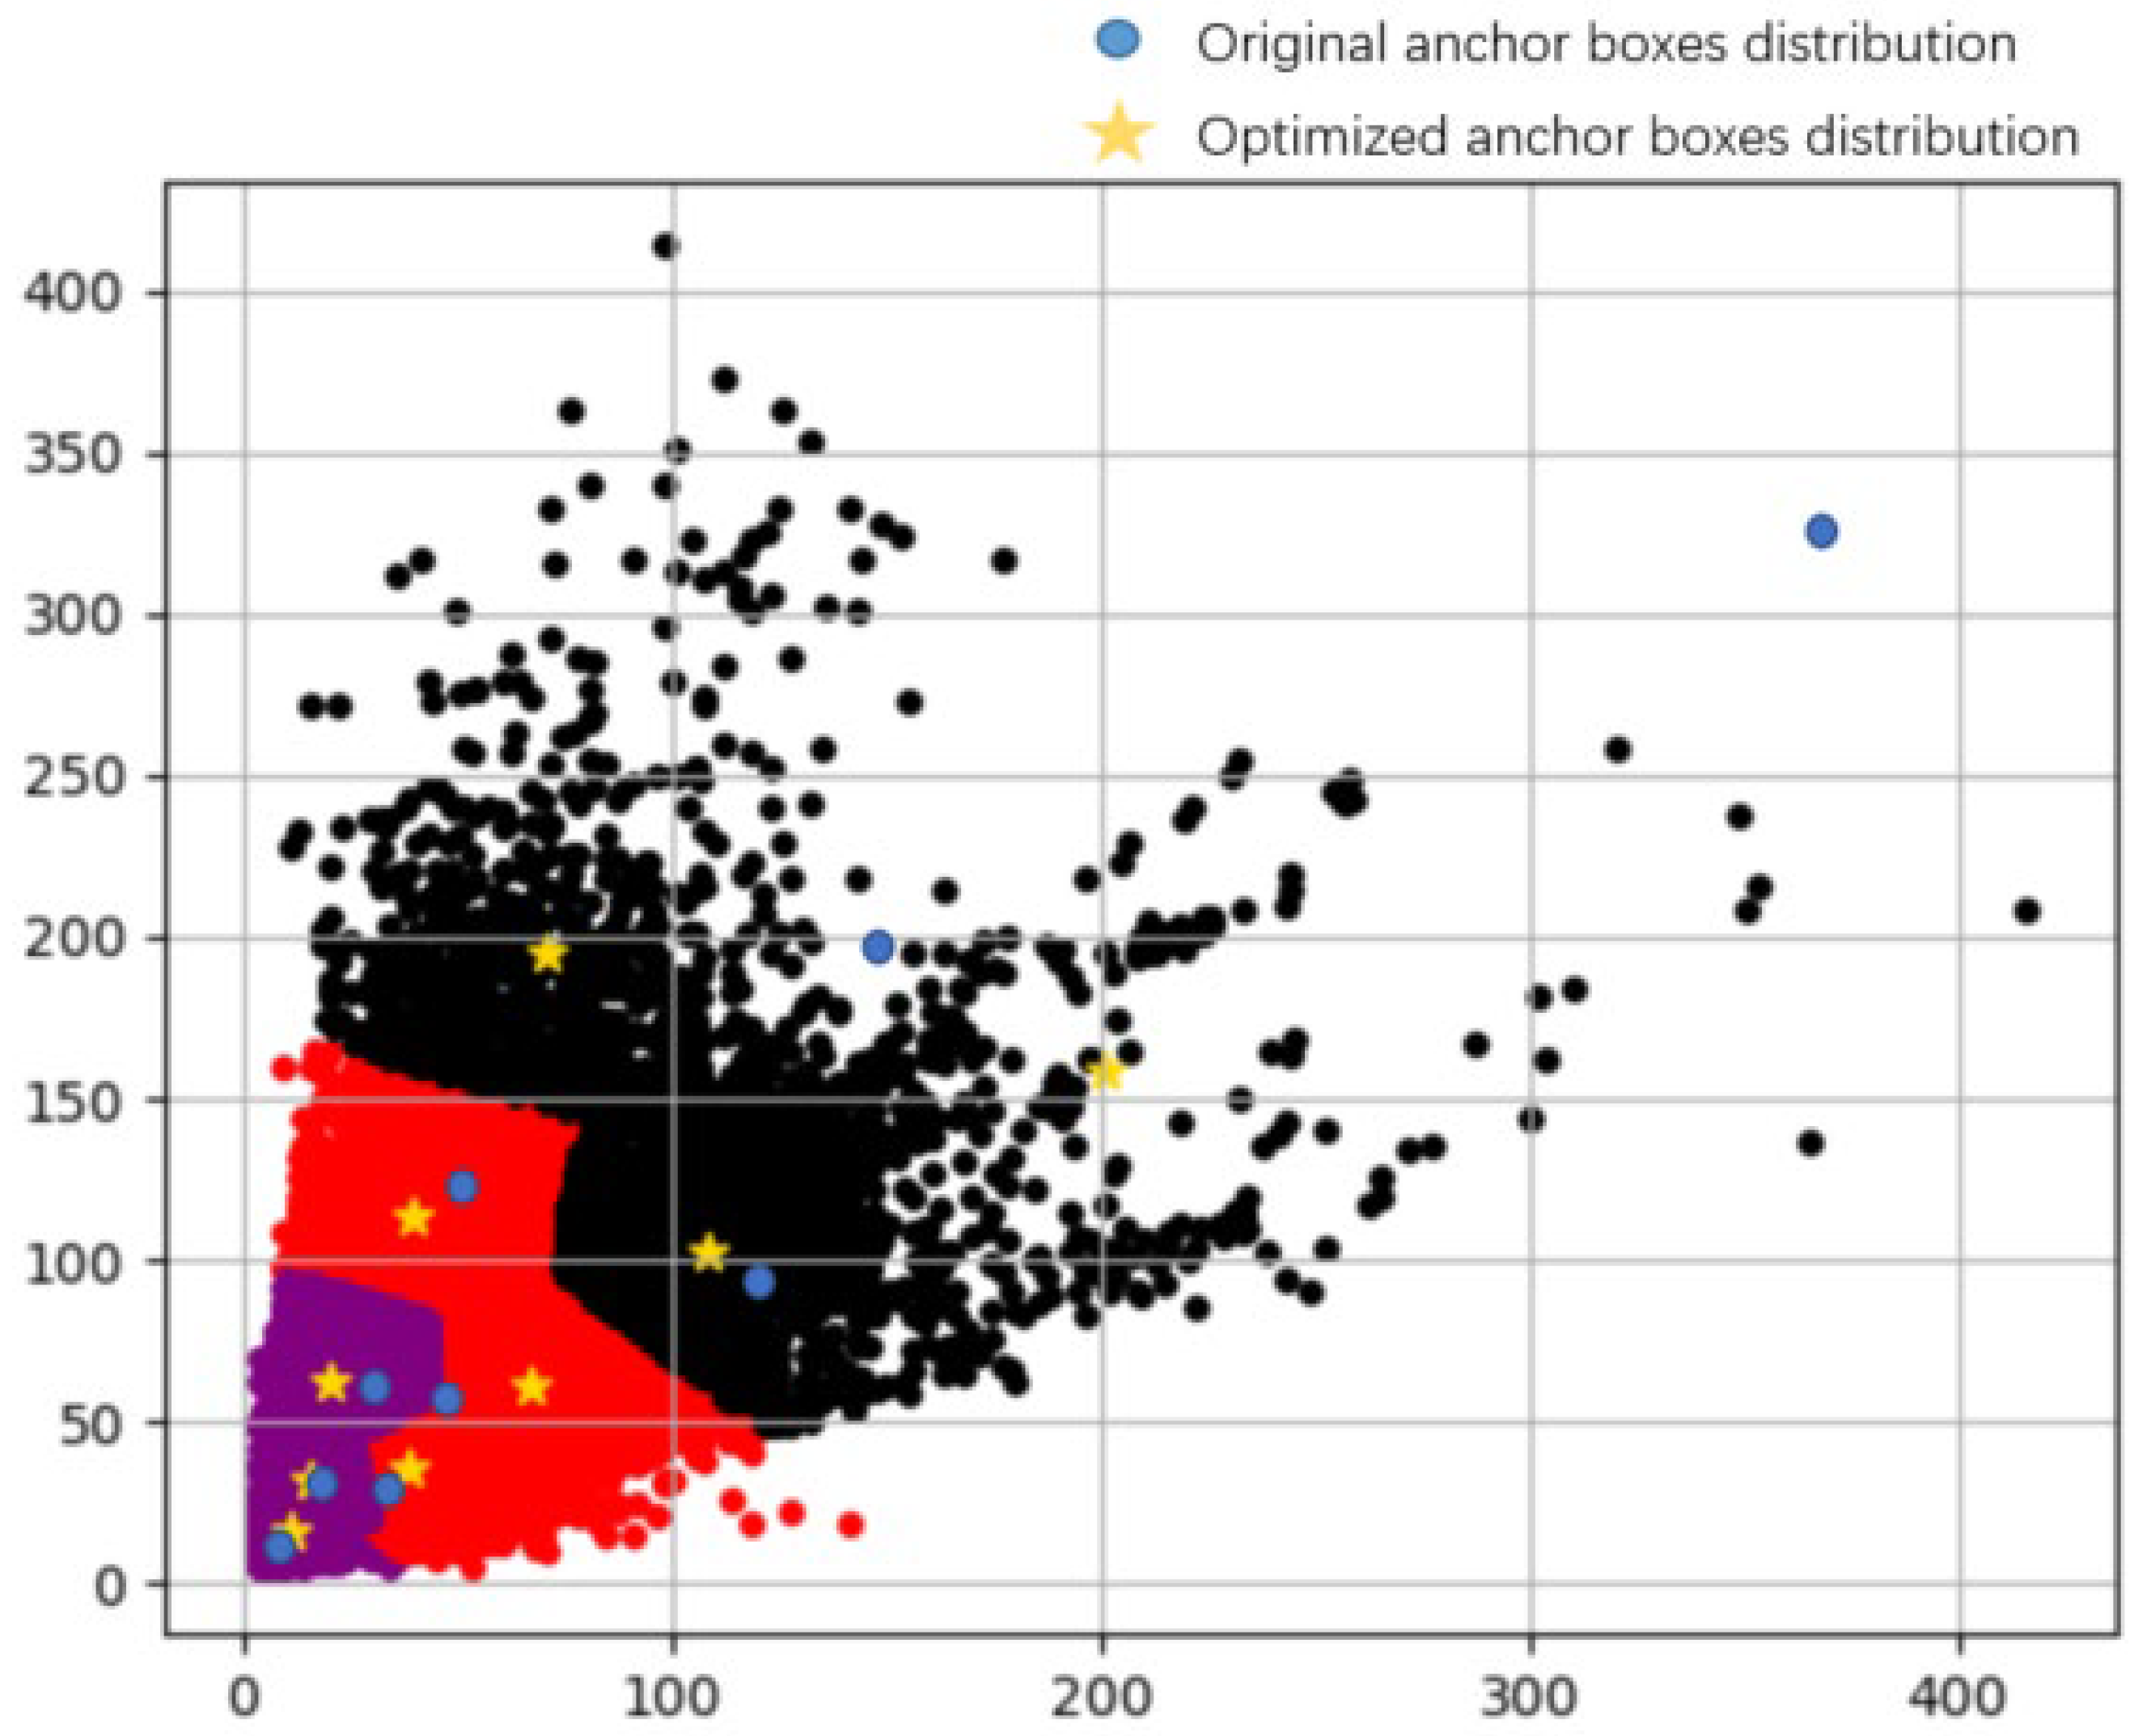
3.1.3. K-Means Clustering Algorithm
3.1.4. Evaluation Criteria
3.2. Loss Function Calculation
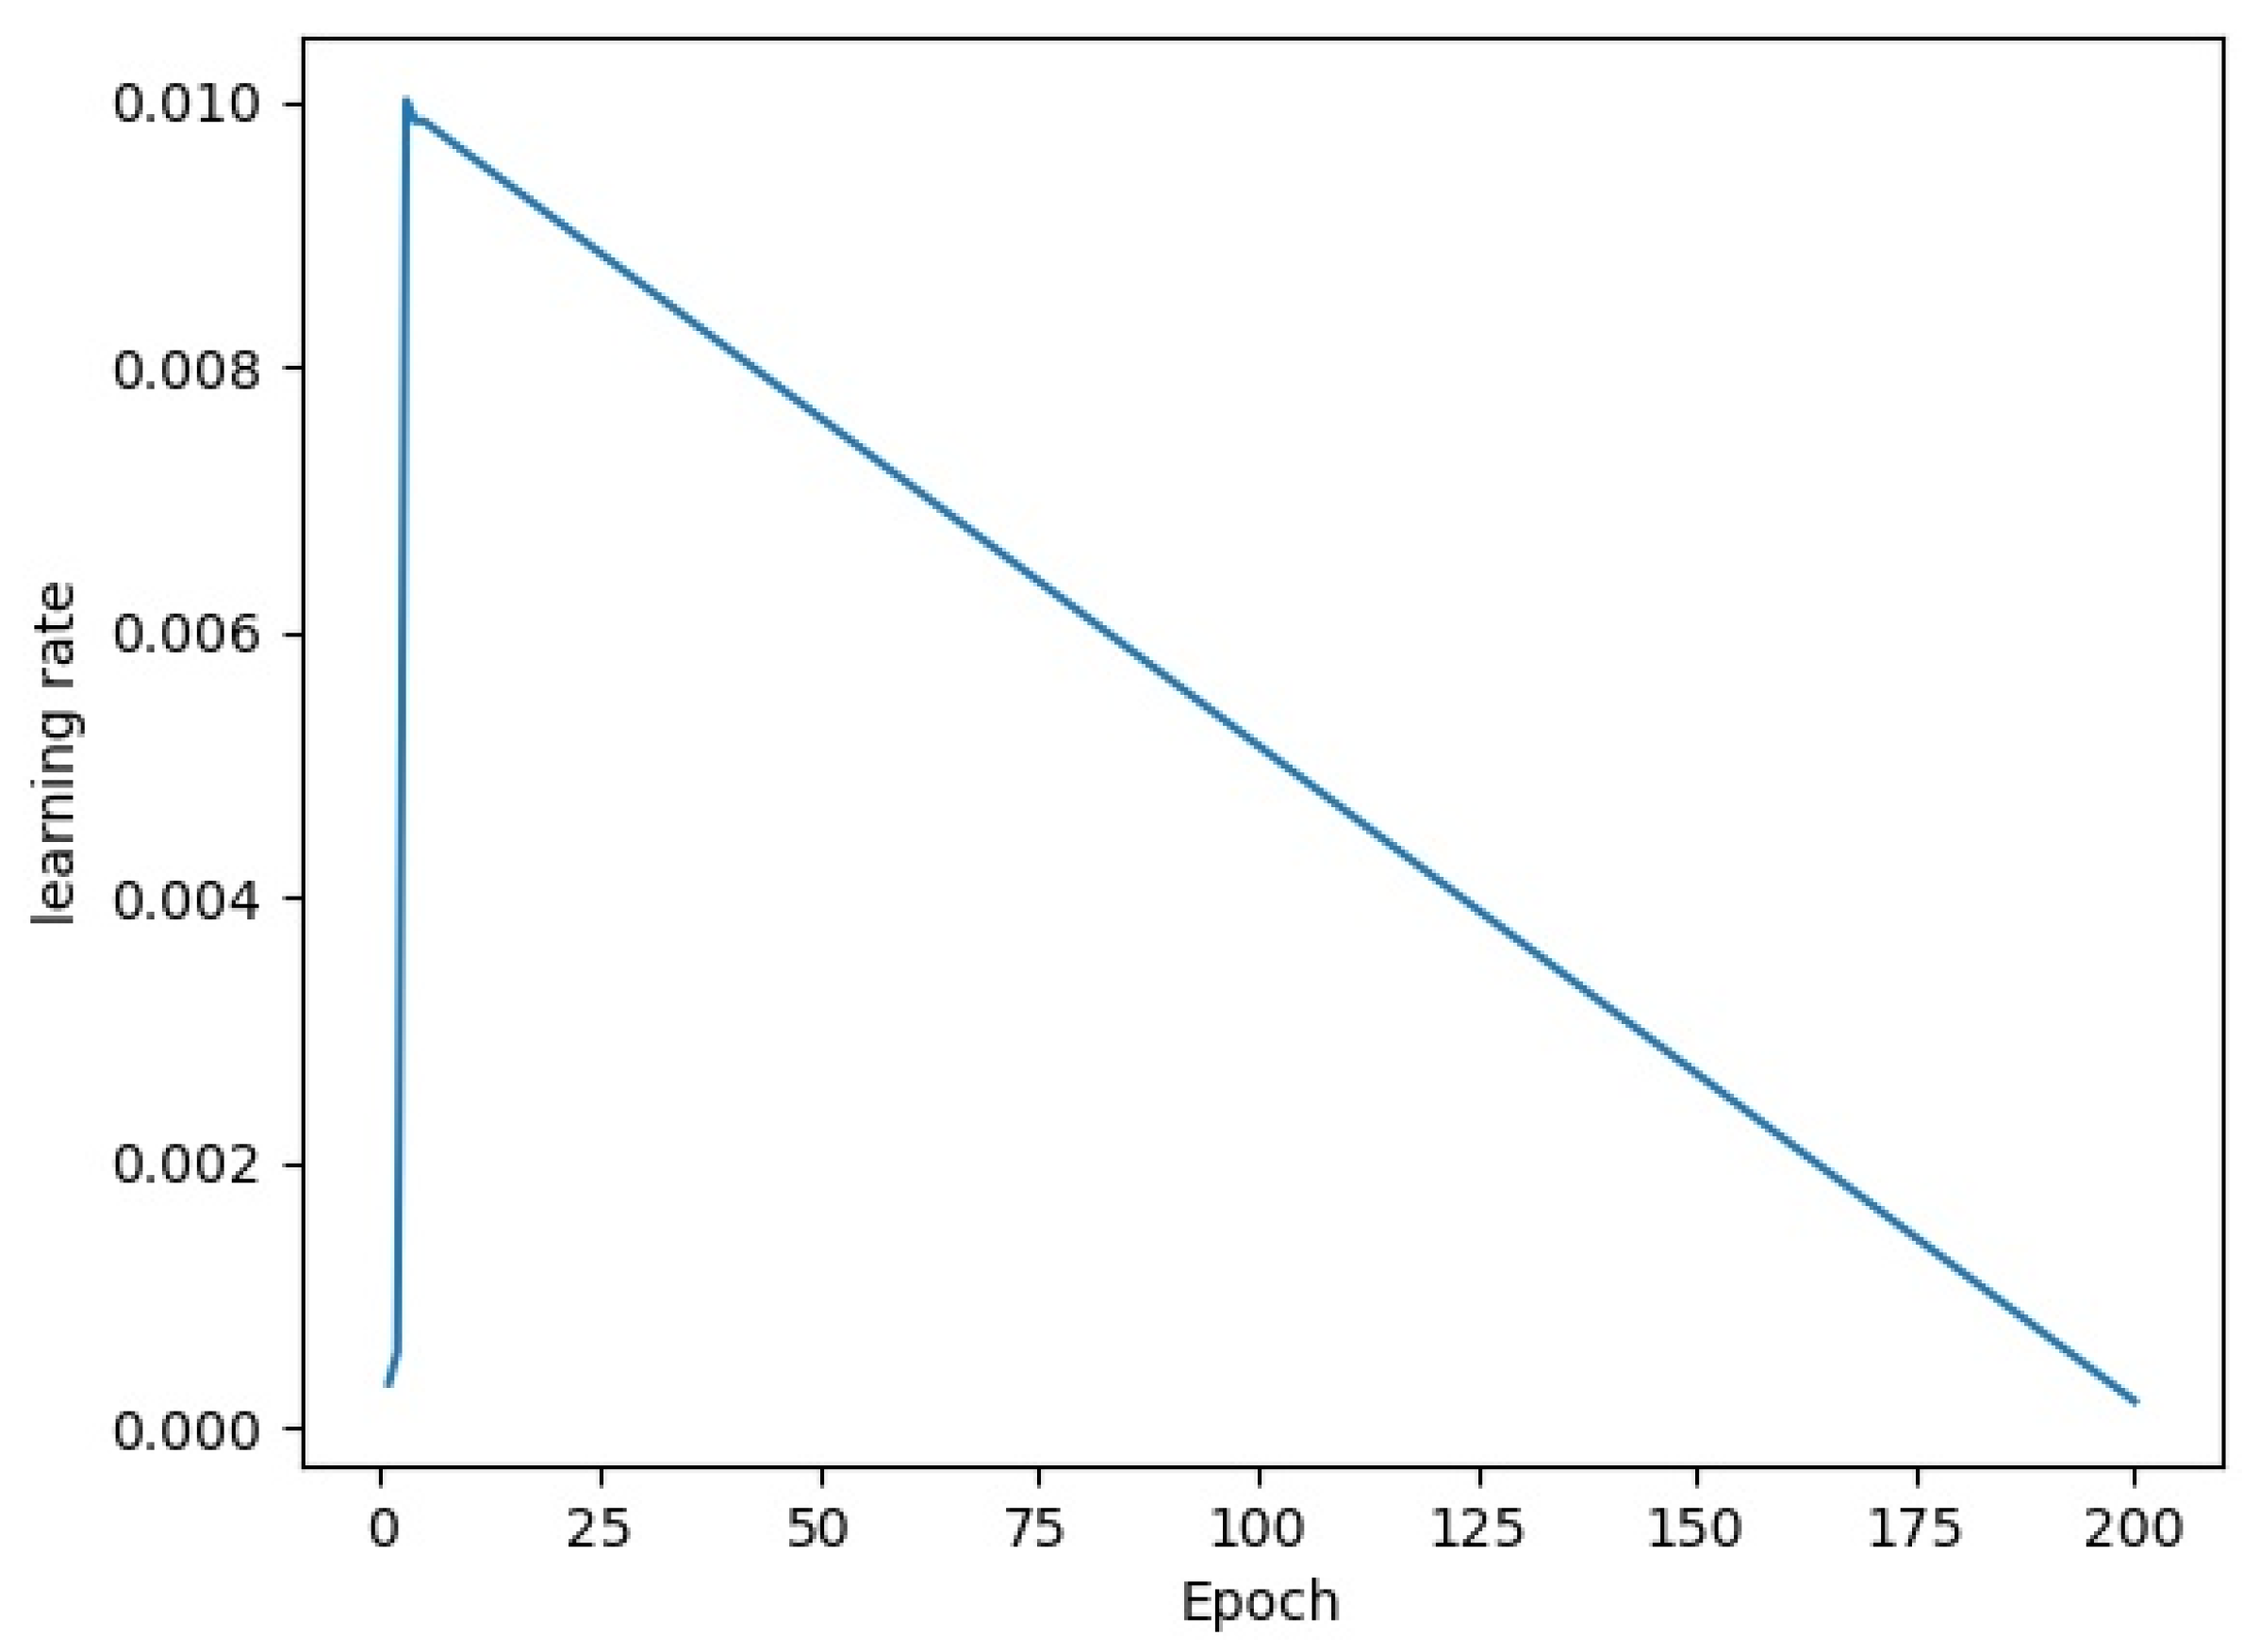
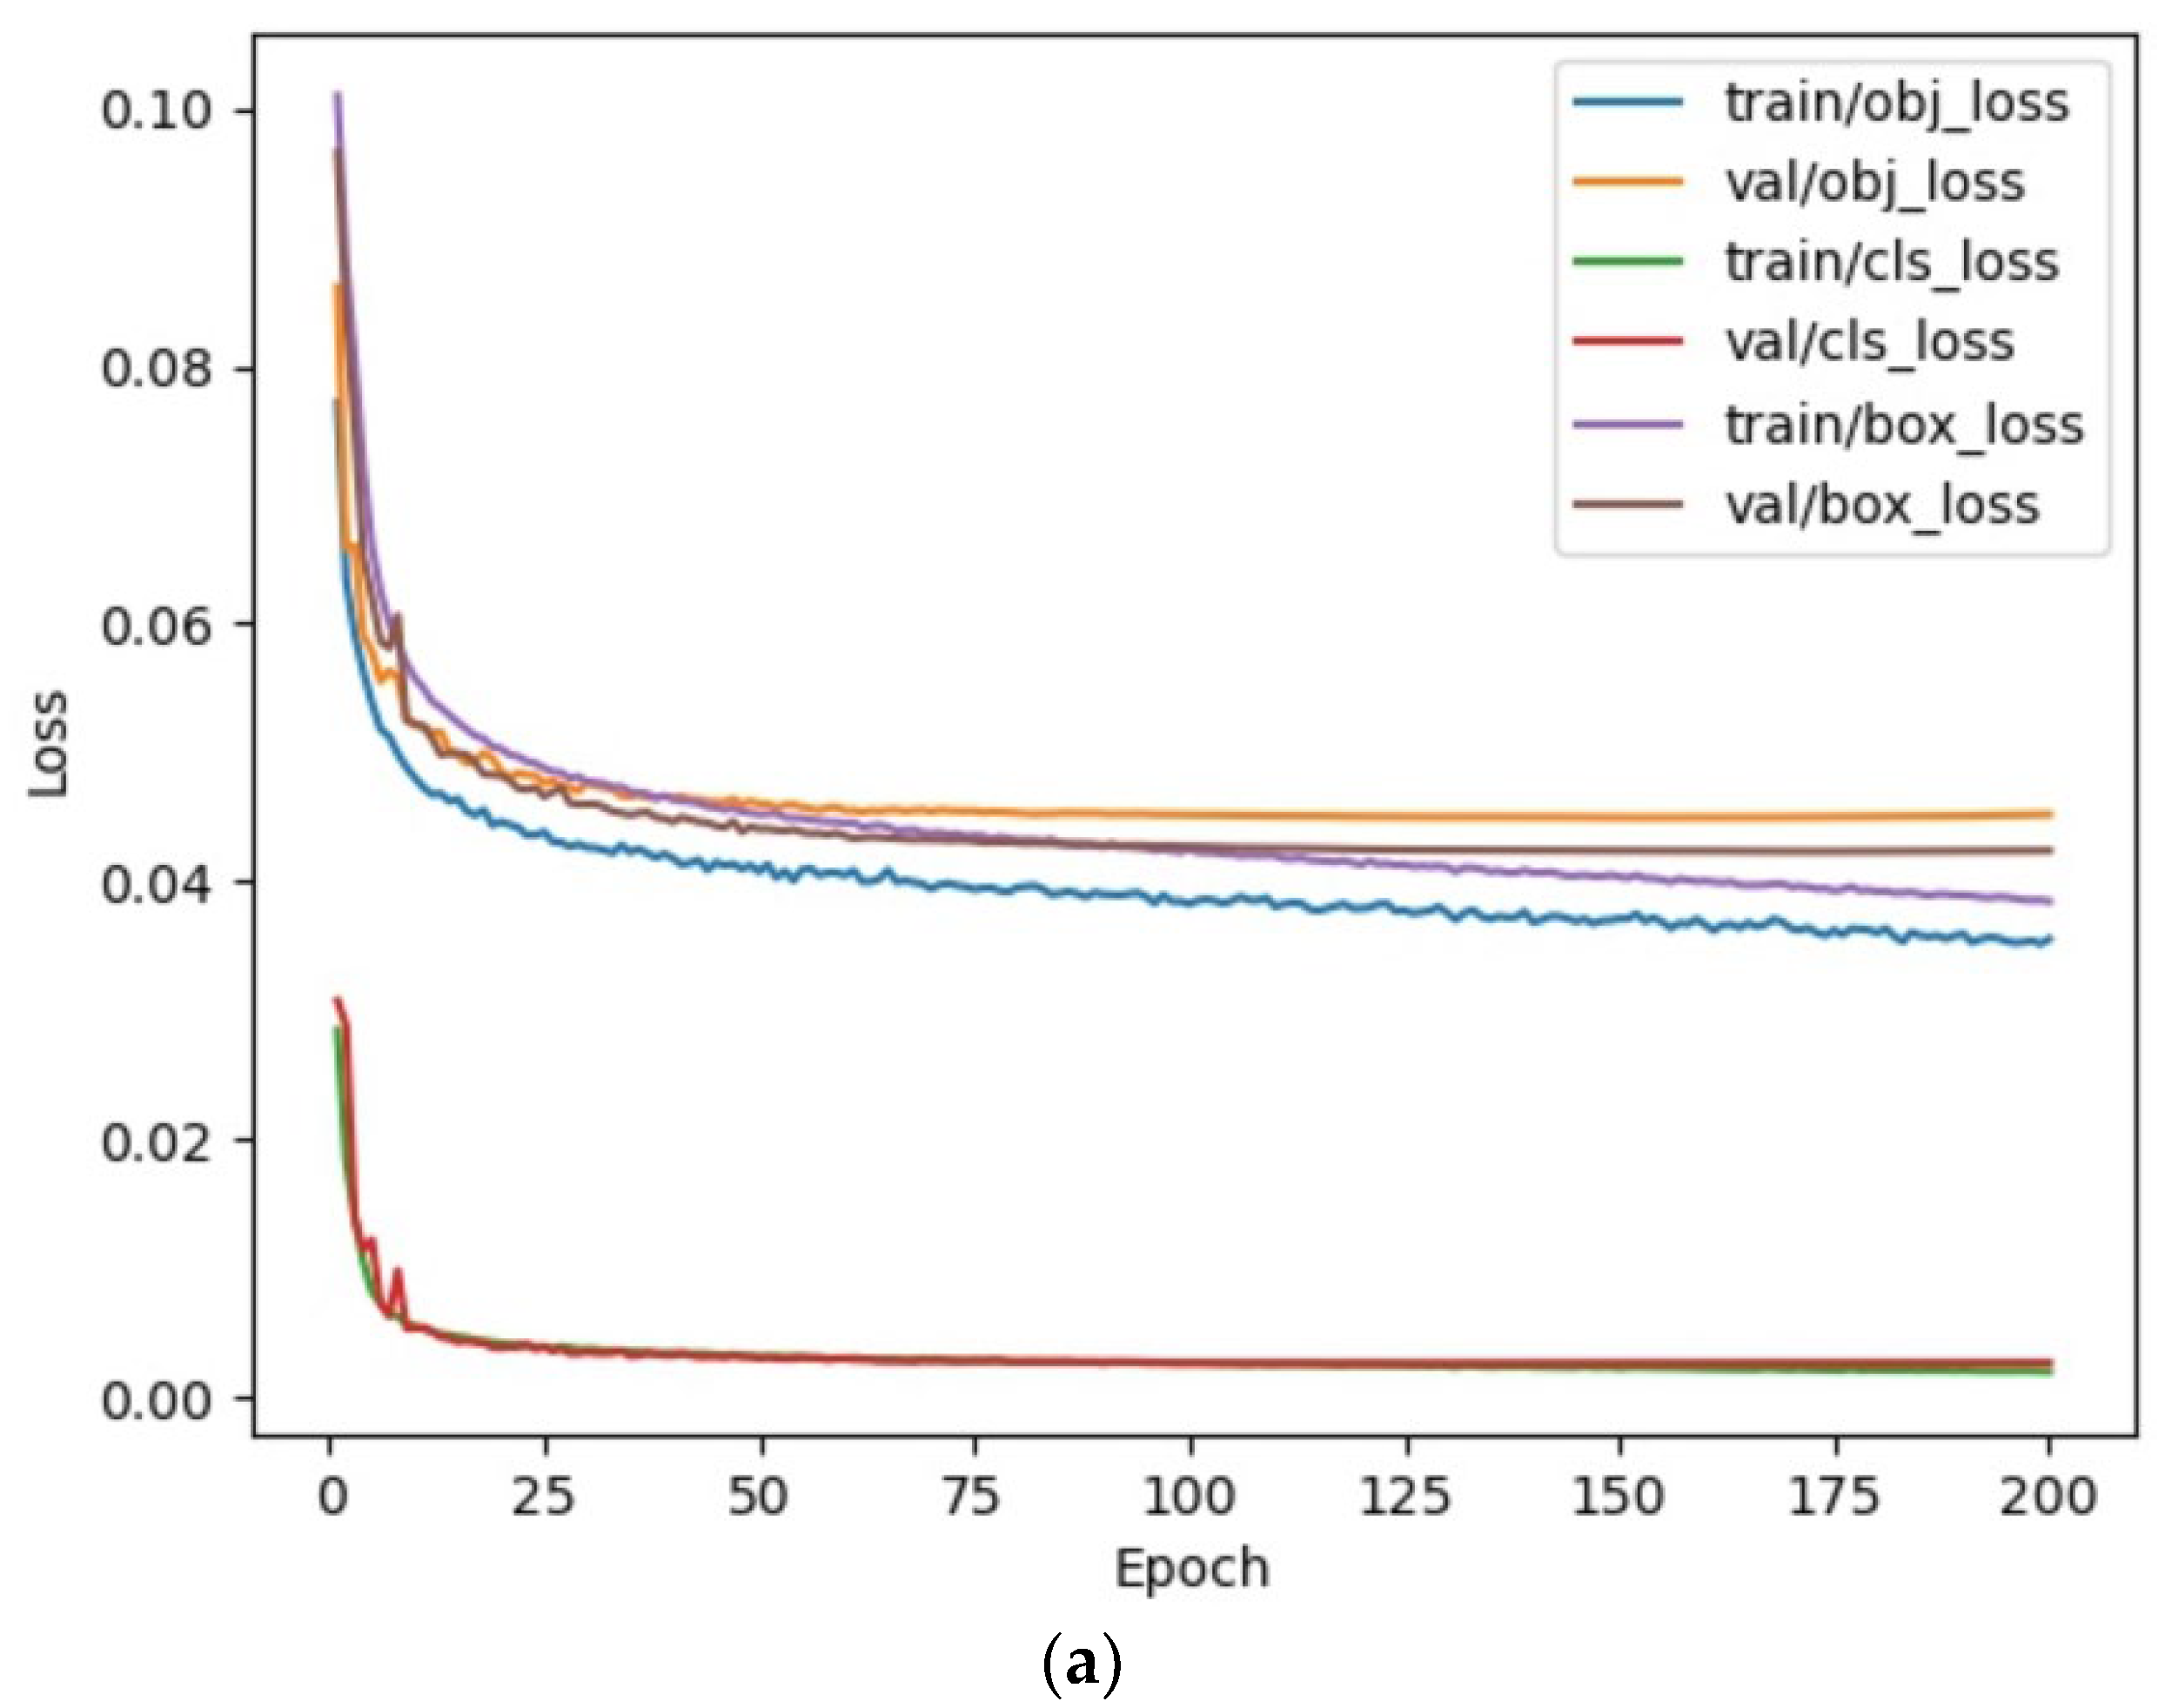
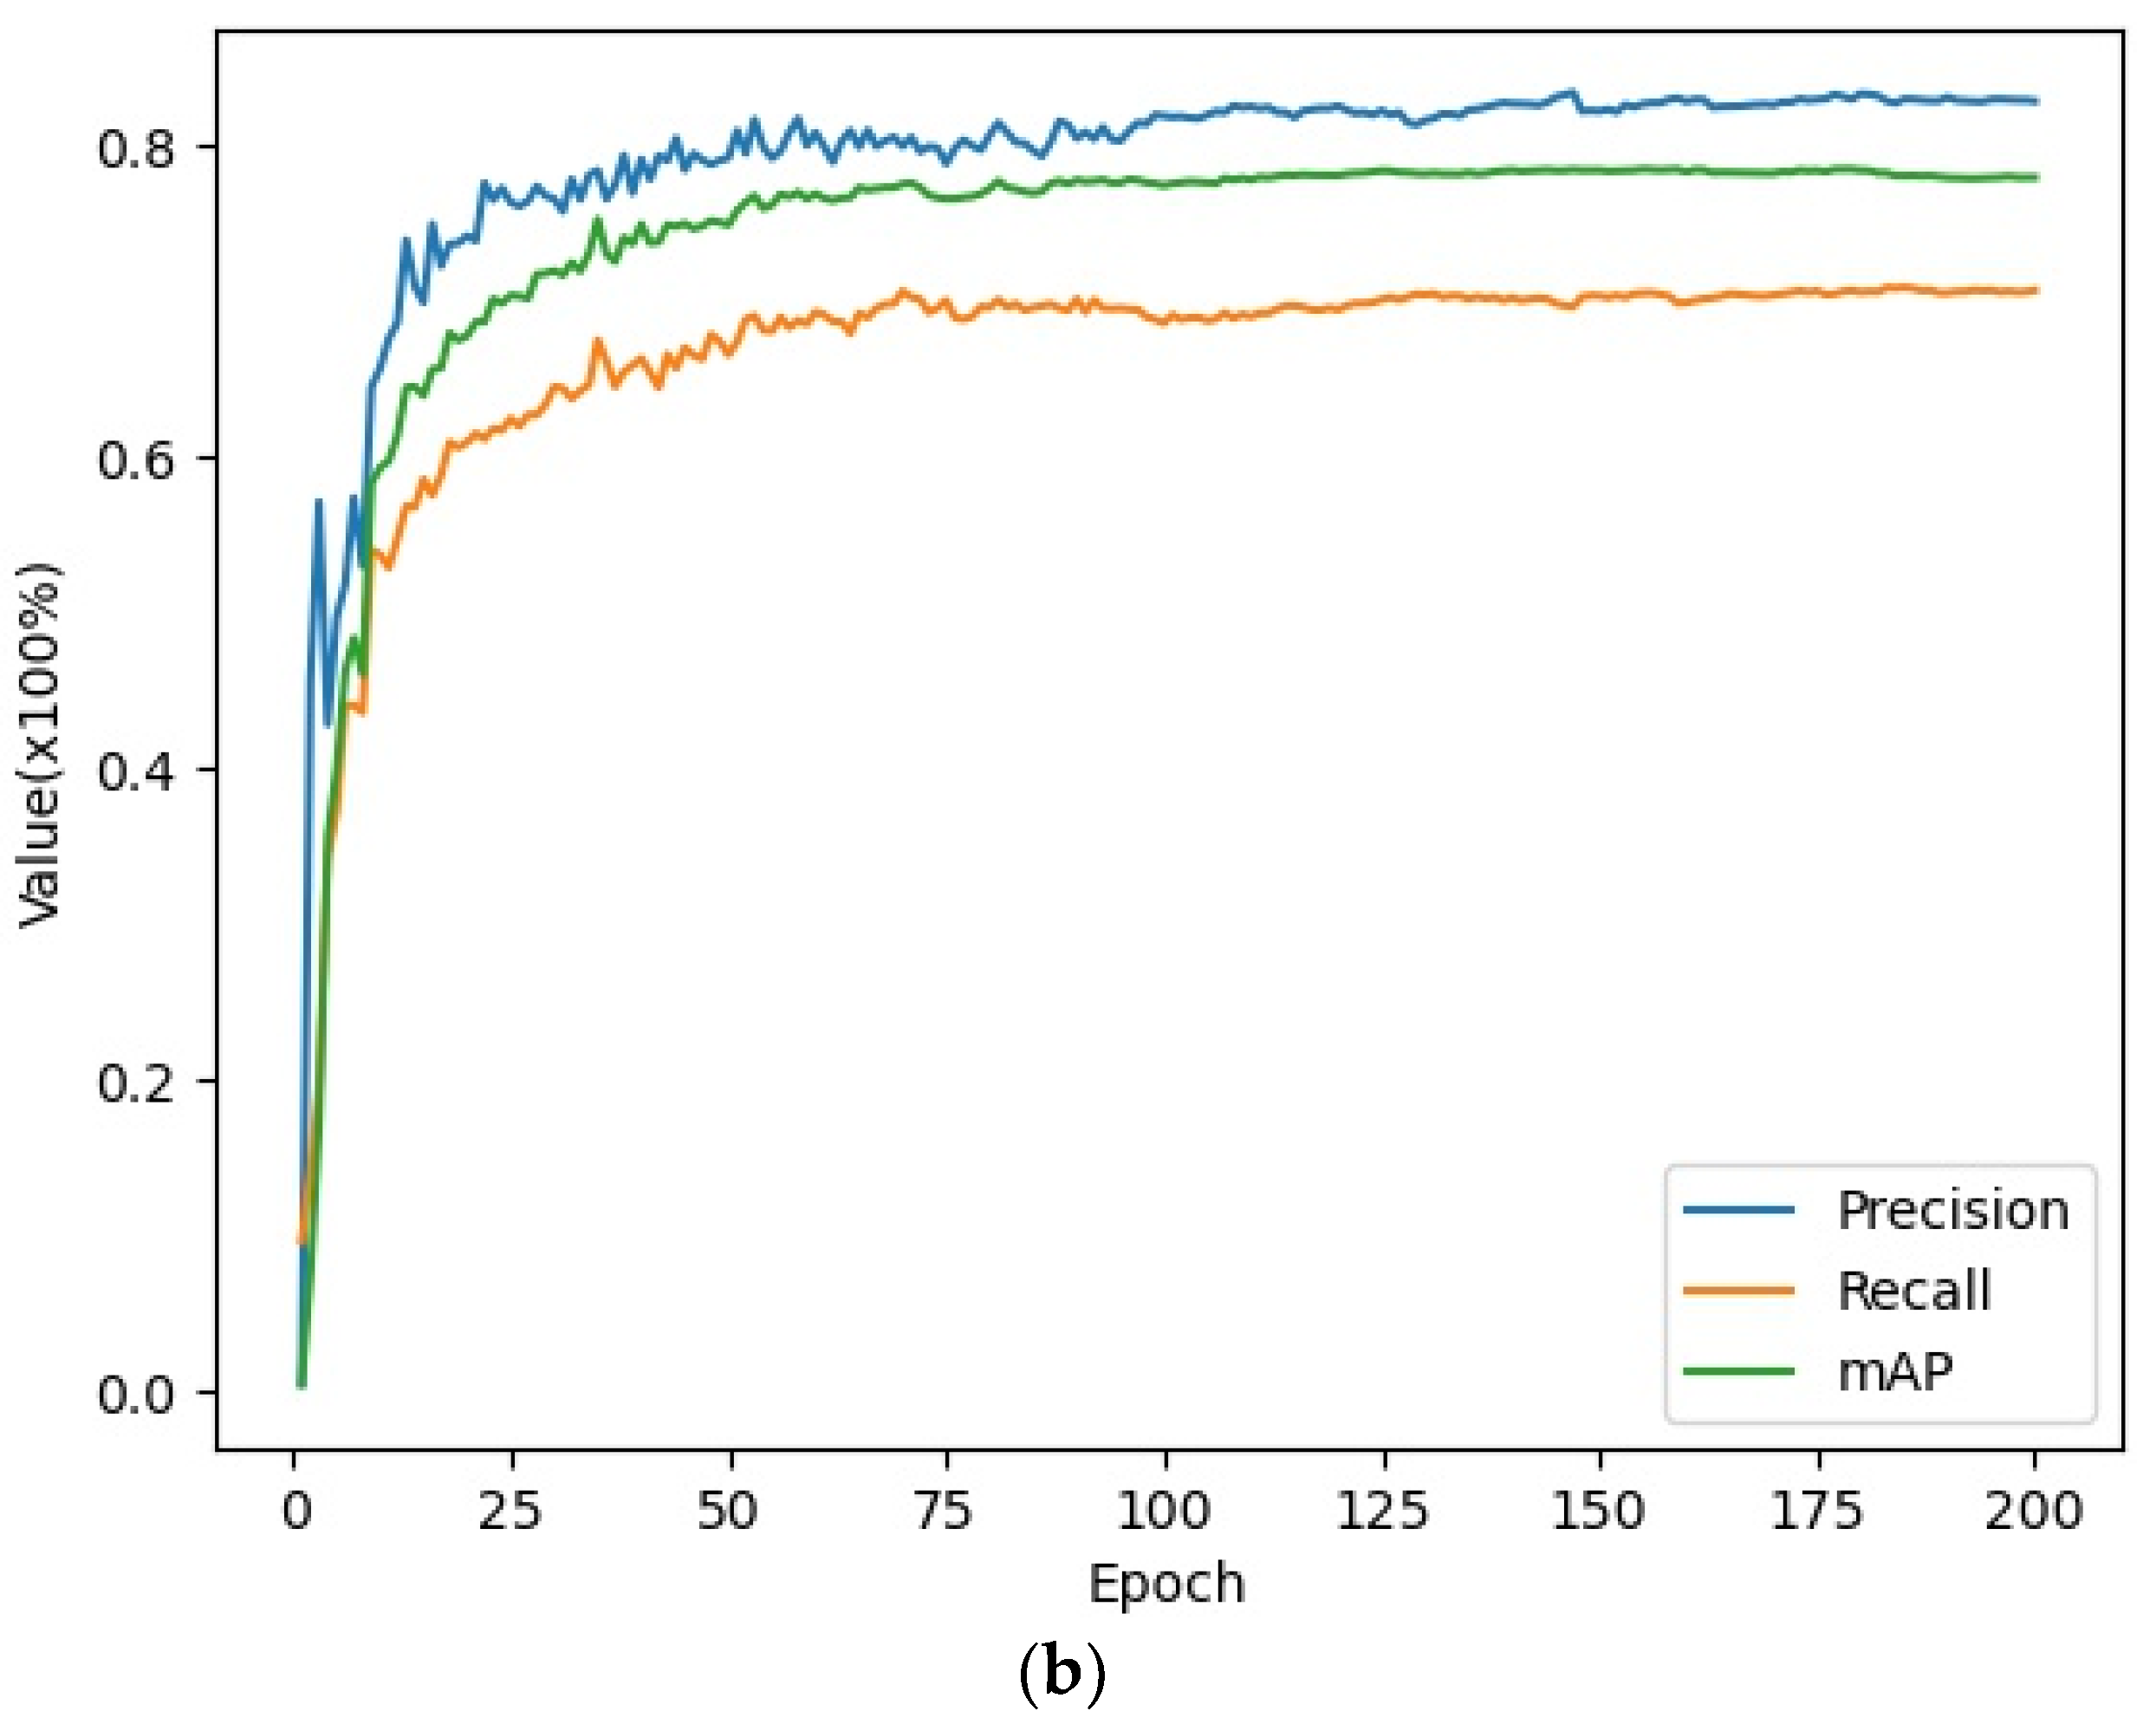
3.3. Training of MSIA-Net
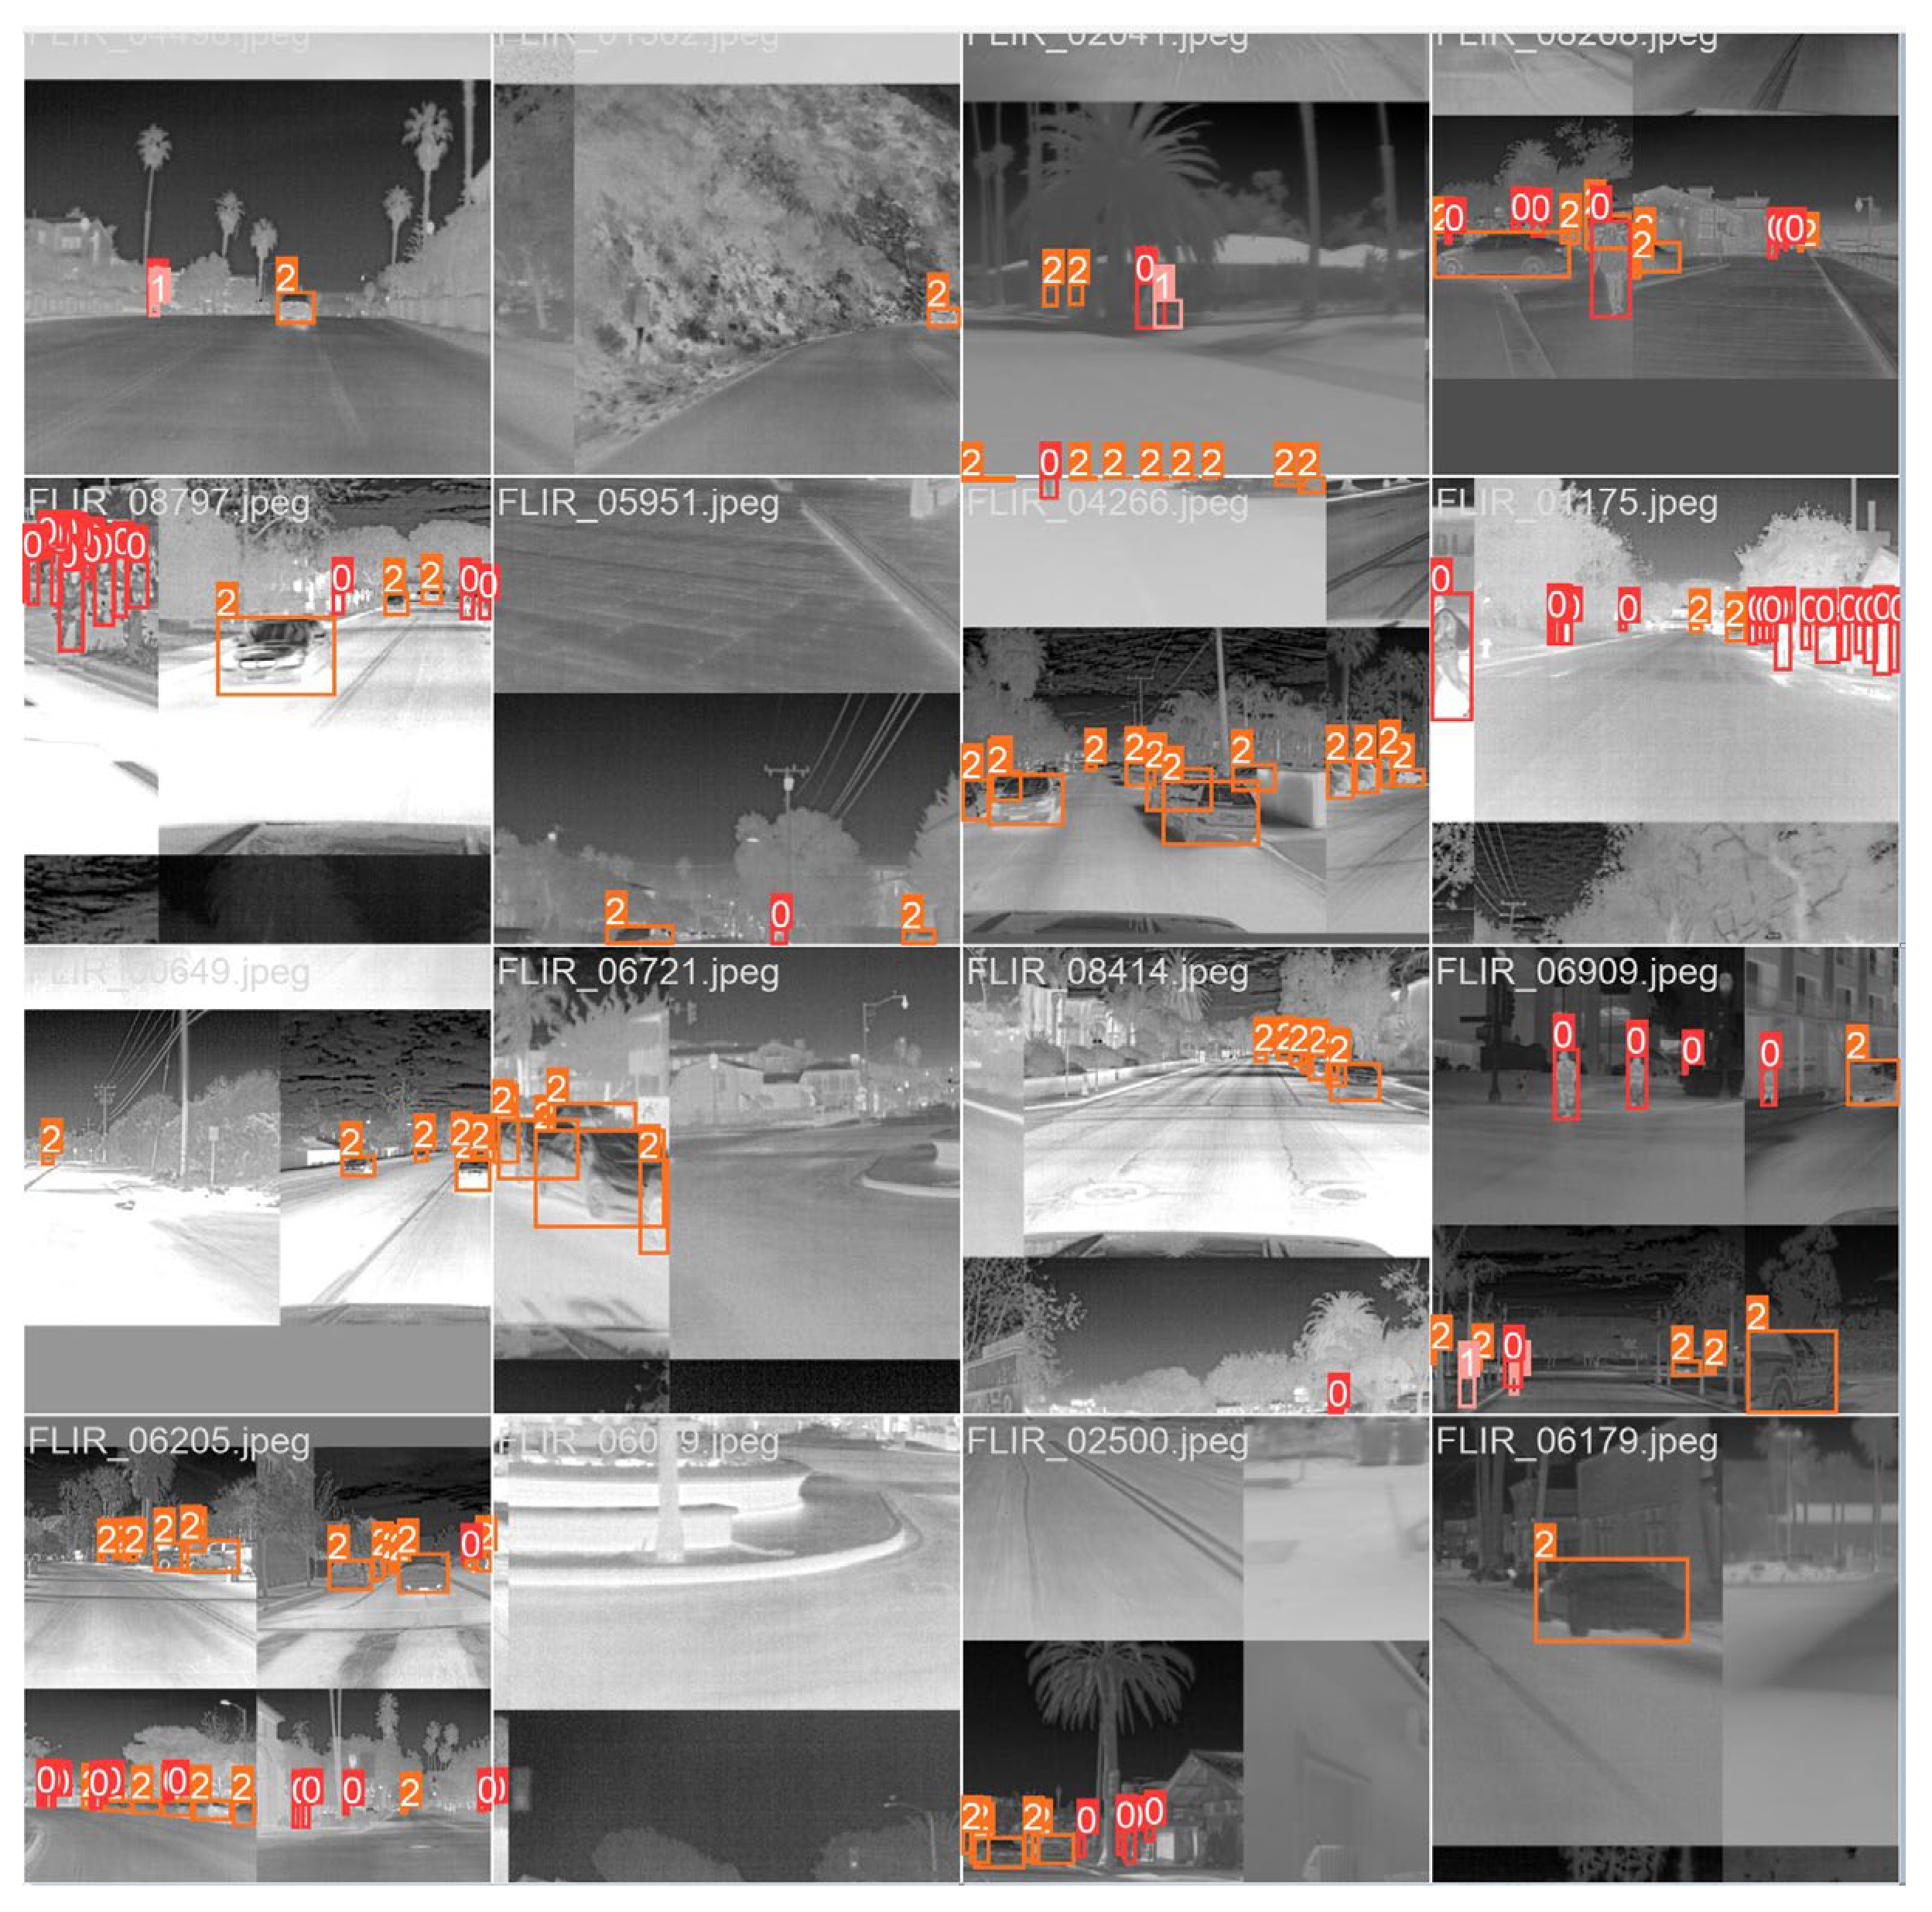
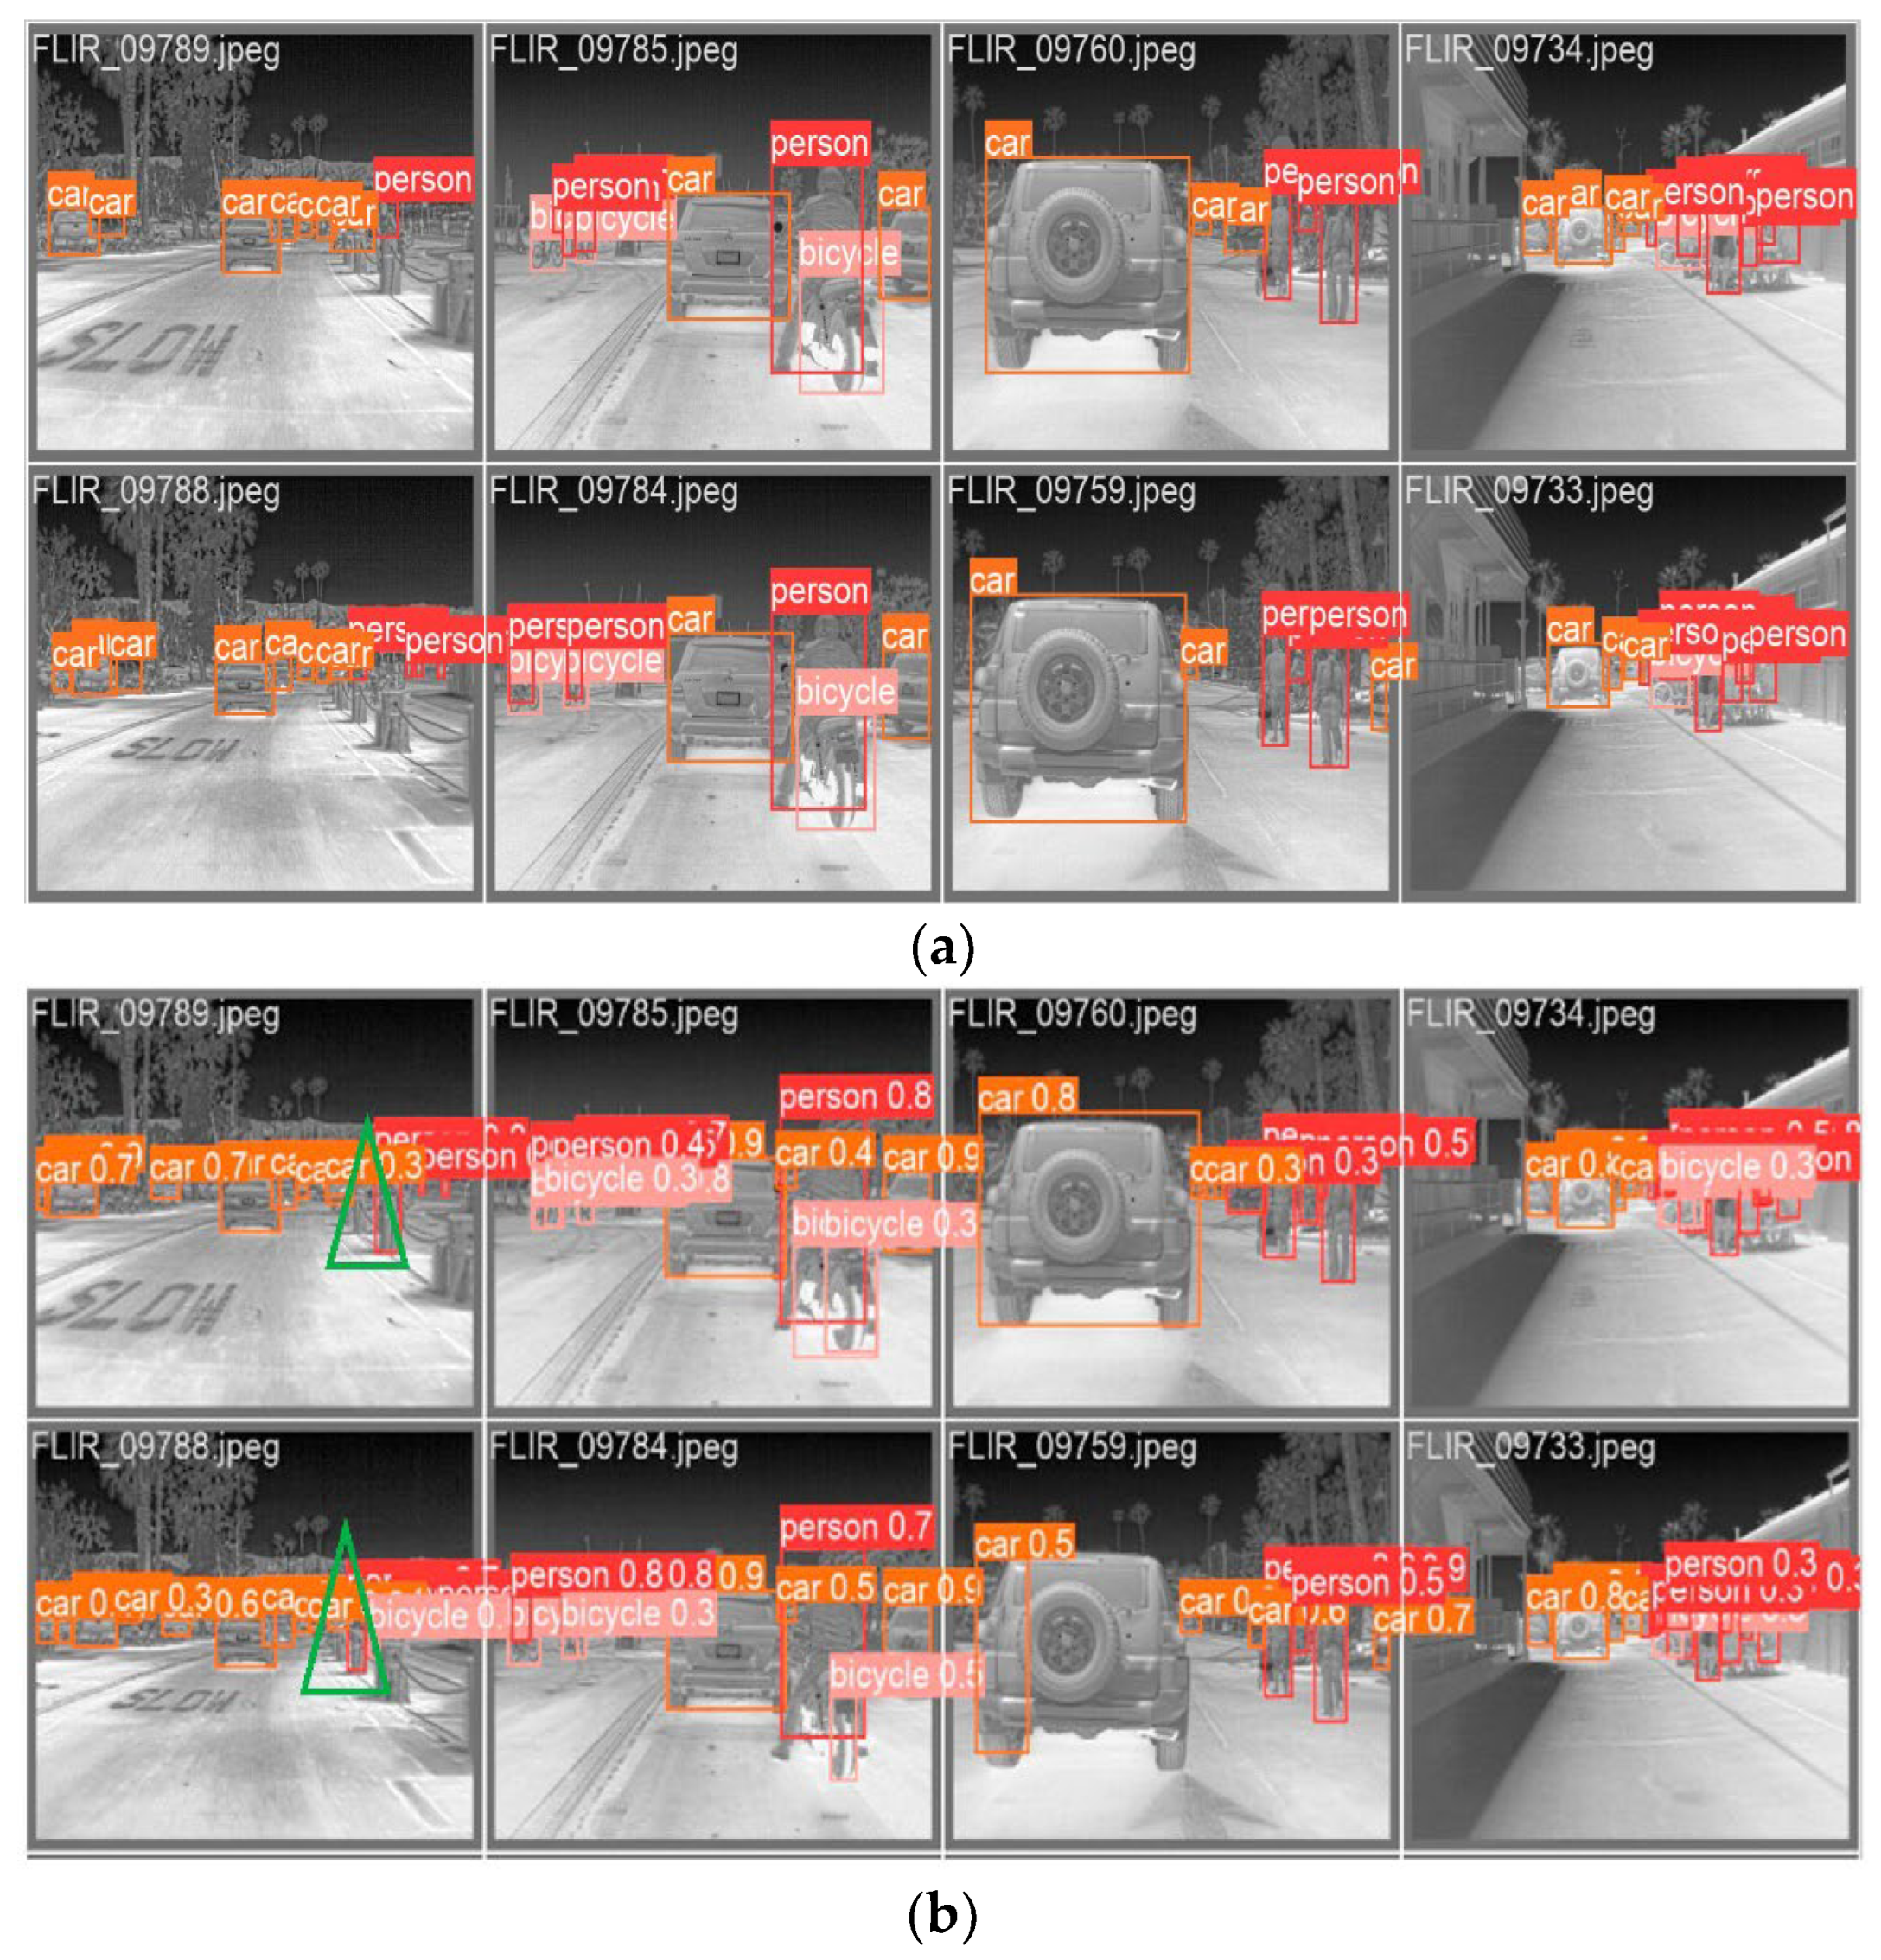
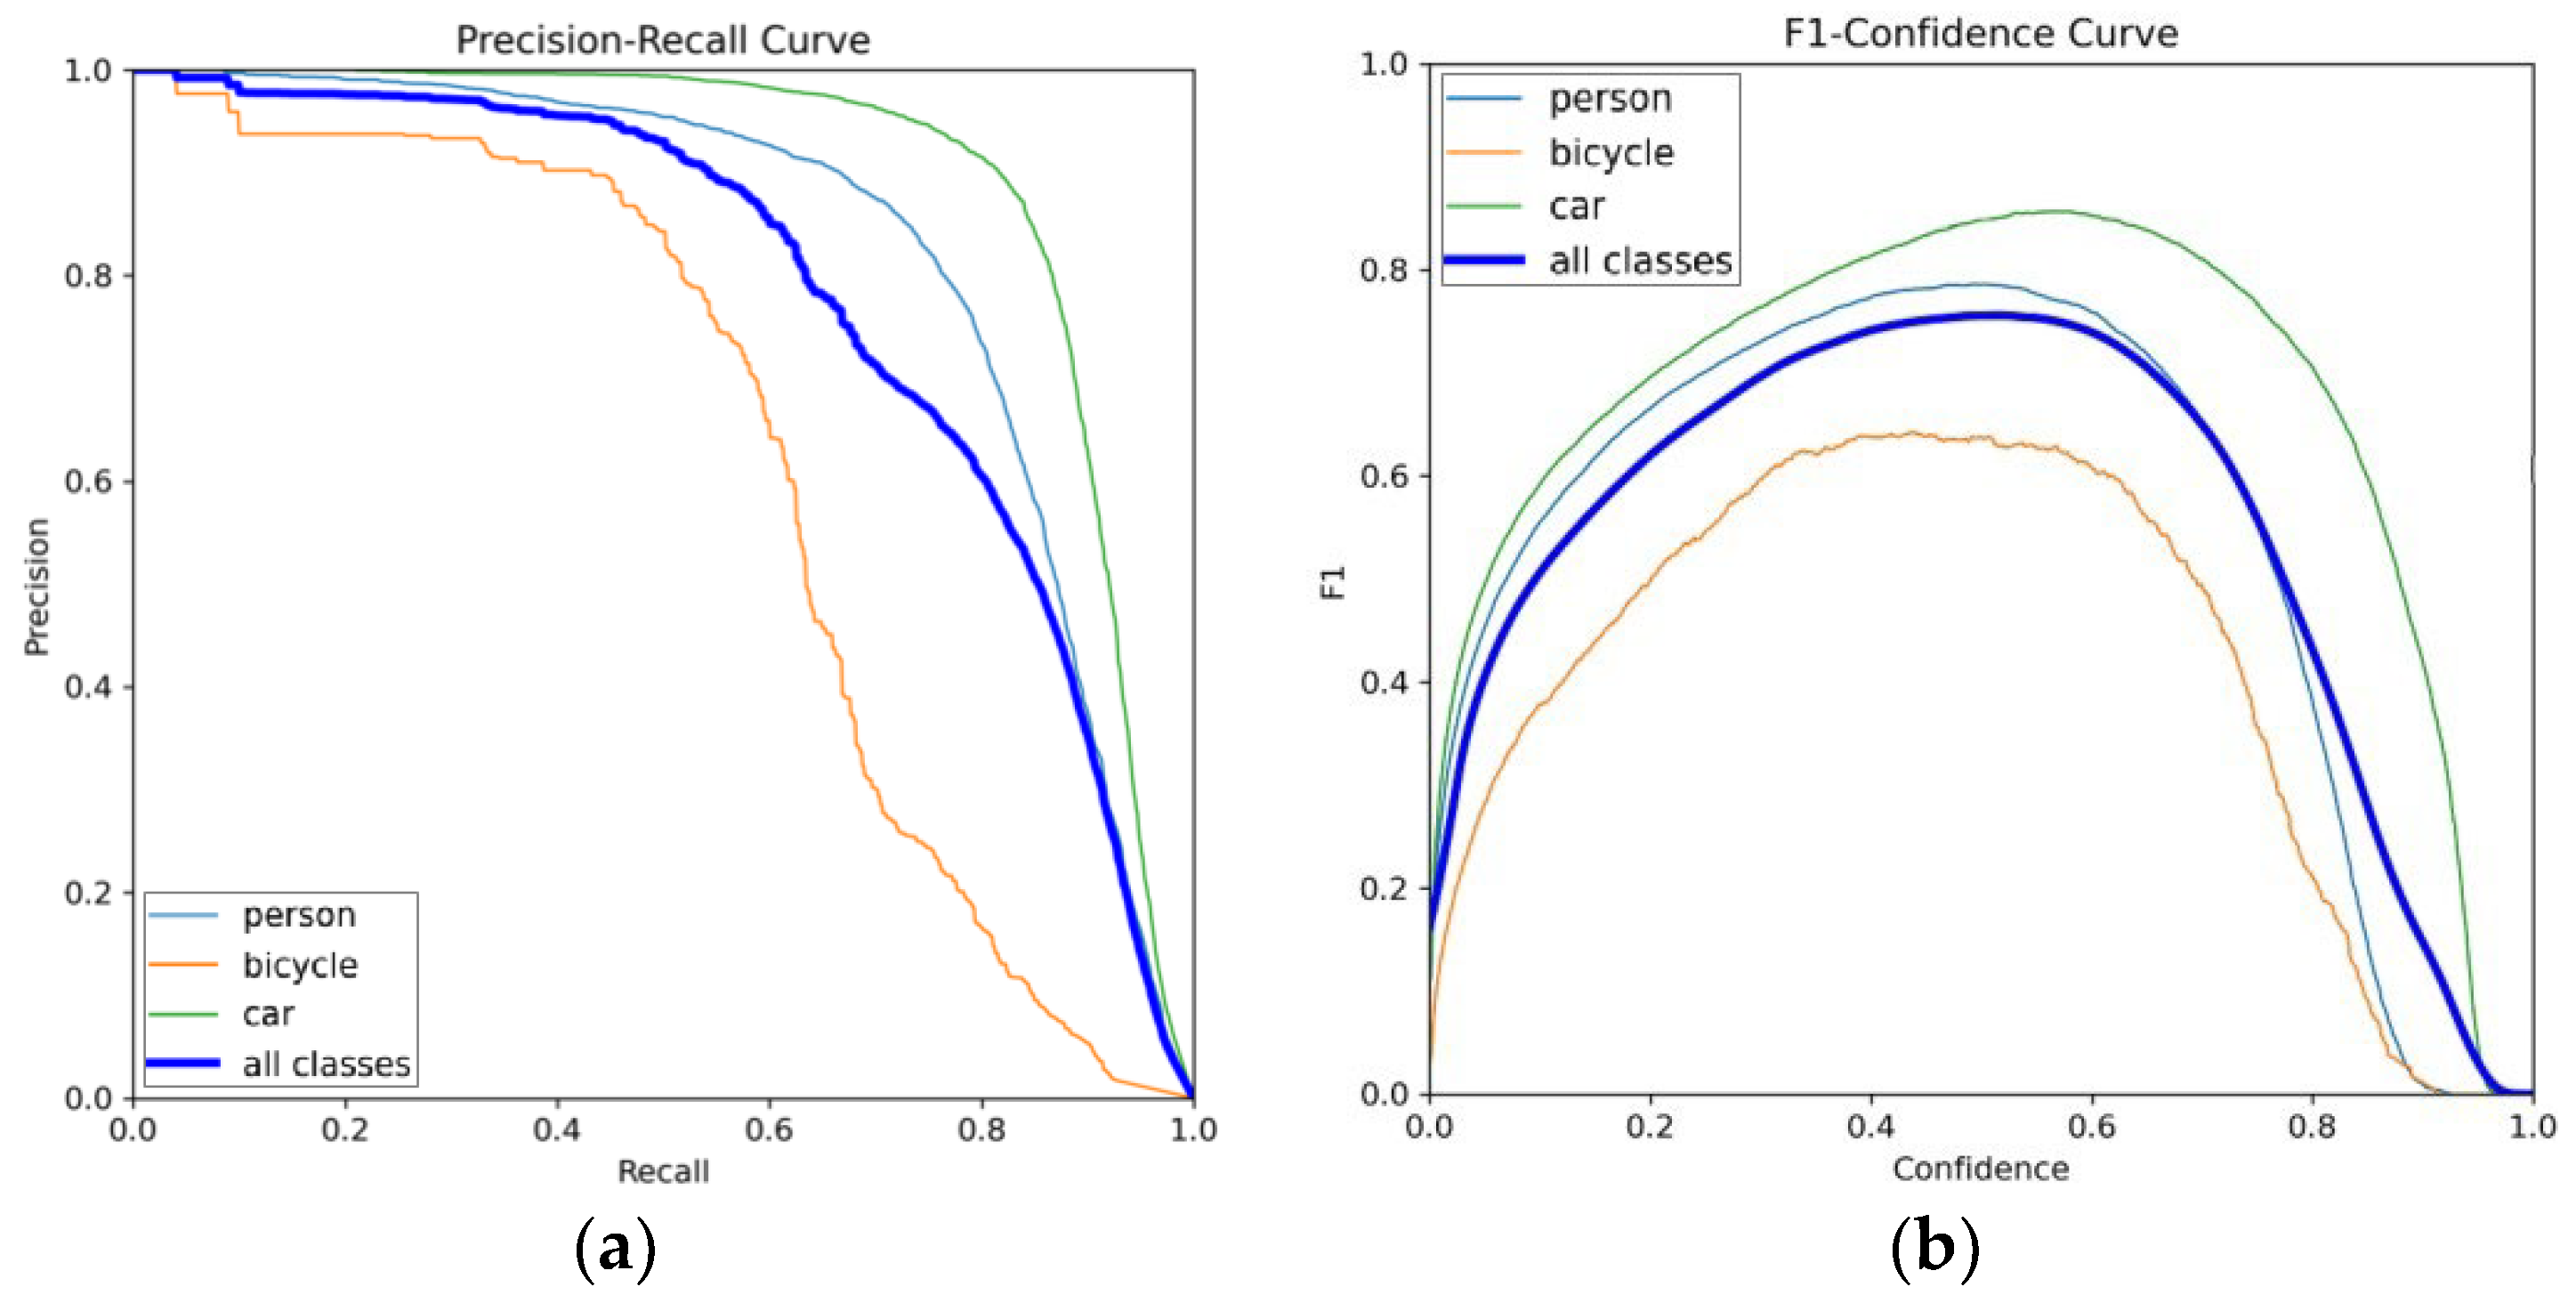
3.4. Detection Results on the FLIR Dataset
4. Discussion
5. Conclusions
Author Contributions
Funding
Institutional Review Board Statement
Informed Consent Statement
Data Availability Statement
Acknowledgments
Conflicts of Interest
References
- Zhang, D.H.; Sun, Y.F.; Wang, J.Y.; Xu, S.L. Development of shipborne infrared search and tracking system. Ship Electron. Eng. 2008, 3, 29–32+178. [Google Scholar]
- Liu, R.M.; Lu, Y.H.; Gong, C.L.; Liu, Y. Infrared point target detection with improved template matching. Infrared Phys. Technol. 2012, 55, 380–387. [Google Scholar] [CrossRef]
- Zhang, G.Y.; Li, B.; Luo, J. A Self-Adaptive Wildfire Detection Algorithm with Two-Dimensional Otsu Optimization. Math. Probl. Eng. 2020, 2020, 3735262. [Google Scholar] [CrossRef]
- Yin, J.L.; Liu, L.; Li, H.; Liu, Q. The infrared moving target detection and security detection related algorithms based on W4 and frame difference. Infrared Phys. Technol. 2016, 77, 302–315. [Google Scholar] [CrossRef]
- Girshick, R.; Donahue, J.; Darrell, T.; Malik, J. Rich Feature Hierarchies for Accurate Target Detection and Semantic Segmentation. In Proceedings of the 2014 IEEE Conference on Computer Vision and Pattern Recognition, Columbus, OH, USA, 23–28 June 2014; IEEE Press: New York, NY, USA, 2014; pp. 580–587. [Google Scholar]
- Ren, S.; He, K.; Girshick, R.; Malik, J. Faster R-CNN: Towards real-time target detection with region proposal networks. IEEE Trans. Pattern Anal. Mach. Intell. 2017, 39, 1137–1149. [Google Scholar] [CrossRef]
- Liu, W.; Anguelov, D.; Erhan, D.; Szegedy, C.; Reed, S.; Fu, C.-Y.; Berg, A.C. SSD: Single Shot Multi-Box Detector. In Proceedings of the IEEE European Conference on Computer Vision, Amsterdam, The Netherlands, 11–14 October 2016; Springer: Cham, Switzerland; pp. 21–37. [Google Scholar]
- Redmon, J.; Divvala, S.; Girshick, R.; Szegedy, C.; Reed, S.; Fu, C.-Y.; Berg, A.C. You Only Look Once: Unified, Real-Time Target Detection. In Proceedings of the 2016 IEEE Conference on Computer Vision and Pattern Recognition, Las Vages, NV, USA, 27–30 June 2016; IEEE Press: New York, NY, USA, 2016; pp. 779–788. [Google Scholar]
- Redmon, J.; Farhadi, A. YOLO9000: Better, faster, stronger. In Proceedings of the IEEE Conference on Computer Vision and Pattern Recognition, Honolulu, HI, USA, 21–26 July 2017; pp. 7263–7271. [Google Scholar]
- Rezatofifighi, H.; Tsoi, N.; Gwak, J.; Sadeghian, A.; Reid, I.; Savarese, S. Generalized intersection over union: A metric and a loss for bounding box regression. In Proceedings of the IEEE/CVF Conference on Computer Vision and Pattern Recognition, Long Beach, CA, USA, 15–20 June 2019; pp. 658–666. [Google Scholar]
- Zheng, Z.; Wang, P.; Liu, W.; Li, J.; Ye, R.; Ren, D. Distance-IoU loss: Faster and better learning for bounding box regression. In Proceedings of the AAAI Conference on Artifificial Intelligence, New York, NY, USA, 7–12 February 2020; Volume 34, pp. 12993–13000. [Google Scholar]
- Cao, H.Y.; Shen, X.L.; Liu, C.M.; Niu, X.T.; Chen, Y. Improved YOLOv3 infrared target detection algorithm. J. Electron. Meas. Instrum. 2020, 34, 188–194. [Google Scholar] [CrossRef]
- Xu, Y.J.; Li, C. Lightweight target detection network based on YOLO optimization. Comput. Sci. 2021, 48, 265–269. [Google Scholar]
- Song, T.; Li, Y.; Wang, J. Vehicle infrared image target detection based on improved Yolov5s. Mod. Comput. 2022, 28, 21–28. [Google Scholar]
- Gu, X.; Zhan, W.D.; Cui, Z.W.; Gui, T.T.; Shi, Y.l.; Hu, J.H. Infrared target detection based on Attention mechanism. Laser Optoelectron. Prog. 2022, 1–14. [Google Scholar]
- Huang, L.; Yang, Y.; Yang, C.; Yang, W.; Li, Y. FS-Yolov5: Lightweight Infrared Target Detection Method. Comput. Eng. Appl. 2023, 59, 215–224. [Google Scholar]
- Sun, M.; Zhang, H.; Huang, Z.; Luo, Y.; Li, Y. Road infrared target detection with I-YOLO. IET Image Process. 2022, 16, 92–101. [Google Scholar] [CrossRef]
- Gao, F.; Yang, X.G.; Lu, R.T.; Wang, S.Y.; Gao, J.A.; Xia, H. Anchor-free Lightweight infrared Target Detection Method. Infrared Laser Eng. 2022, 51, 135–143. (In Chinese) [Google Scholar]
- Bao, C.; Cao, J.; Hao, Q.; Cheng, Y.; Ning, Y.; Zhao, T. Dual-YOLO Architecture from Infrared and Visible Images for Target Detection. Sensors 2023, 23, 2934. [Google Scholar] [CrossRef] [PubMed]
- Dai, Y.; Wu, Y.; Zhou, F.; Barnard, K. Asymmetric contextual modulation for infrared small target detection. In Proceedings of the IEEE/CVF Winter Conference on Applications of Computer Vision, Waikoloa, HI, USA, 3–8 January 2021; pp. 950–959. [Google Scholar]
- Lu, L.; Li, H.; Ding, Z.; Guo, Q. An improved target detection method based on multiscale features fusion. Microw. Opt. Technol. Lett. 2020, 62, 3051–3059. [Google Scholar] [CrossRef]
- Zuo, Z.; Tong, X.; Wei, J.; Su, S.; Wu, P.; Guo, R.; Sun, B. AFFPN: Attention Fusion Feature Pyramid Network for Small Infrared Target Detection. Remote Sens. 2022, 14, 3412. [Google Scholar] [CrossRef]
- Zheng, L.; Zhou, T.; Peng, Y.; Ye, Z. Infrared target detection method using adaptive feature fusion. J. Phys. Conf. Ser. 2022, 2290, 012081. [Google Scholar] [CrossRef]
- Redmon, J.; Farhadi, A. YOLOv 3: An Incremental Improvement. arXiv 2018, arXiv:1804.02767. [Google Scholar]
- Available online: https://github.com/ultralytics/Yolov5 (accessed on 15 May 2023).
- Wang, C.; Bochkovskiy, A.; Liao, H.M. YOLOv7: Trainable bag-of-freebies sets new state-of-the-art for real-time target detectors. arXiv 2022, arXiv:2207.02696. [Google Scholar]
- Ding, X.; Guo, Y.; Ding, G.; Han, J. ACNet: Strengthening the Kernel Skeletons for Powerful CNN via Asymmetric Convolution Blocks. In Proceedings of the 2019 IEEE/CVF International Conference on Computer Vision (ICCV), Seoul, Korea, 27 October–2 November 2019; pp. 1911–1920. [Google Scholar] [CrossRef]
- Krizhevsky, A.; Sutskever, I.; Hinton, G.E. ImageNet classification with deep convolutional neural networks. In Proceedings of the 25th International Conference on Neural Information Processing Systems—(NIPS’12), Lake Tahoe, NV, USA, 3–6 December 2012; Curran Associates Inc.: Red Hook, NY, USA, 2012; Volume 1, pp. 1097–1105. [Google Scholar]
- He, K.; Zhang, X.; Ren, S.; Sun, J. Deep Residual Learning for Image Recognition. In Proceedings of the 2016 IEEE Conference on Computer Vision and Pattern Recognition (CVPR), Las Vegas, NV, USA; 2016; pp. 770–778. [Google Scholar] [CrossRef]
- Howard, A.G.; Zhu, M.; Chen, B.; Kalenichenko, D.; Wang, W.; Weyand, T.; Andreetto, M.; Adam, H. MobileNets: Efficient Convolutional Neural Networks for Mobile Vision Applications. arXiv 2017, arXiv:1704.04861. [Google Scholar]
- He, K.; Zhang, X.; Ren, S.; Sun, J. Spatial Pyramid Pooling in Deep Convolutional Networks for Visual Recognition. IEEE Trans. Pattern Anal. Mach. Intell. 2015, 37, 1904–1916. [Google Scholar] [CrossRef]
- Hou, Q.; Zhou, D.; Feng, J. Coordinate Attention for Efficient Mobile Network Design. In Proceedings of the 2021 IEEE/CVF Conference on Computer Vision and Pattern Recognition (CVPR), Nashville, TN, USA, 20–25 January 2021; pp. 13708–13717. [Google Scholar] [CrossRef]
- Lin, T.Y.; Dollár, P.; Girshick, R.; He, K.; Hariharan, B.; Belongie, S. Feature pyramid networks for target detection. In Proceedings of the IEEE Conference on Computer Vision and Pattern Recognition, Honolulu, HI, USA, 21–26 July 2017; pp. 2117–2125. [Google Scholar]
- Liu, S.; Qi, L.; Qin, H.; Shi, J.; Jia, J. Path Aggregation Network for Instance Segmentation. In Proceedings of the 2018 IEEE/CVF Conference on Computer Vision and Pattern Recognition, Salt Lake City, UT, USA, 18–23 June 2018; pp. 8759–8768. [Google Scholar] [CrossRef]
- Bochkovskiy, A.; Wang, C.Y.; Liao, H.Y.M. Yolov4: Optimal speed and accuracy of object detection. arXiv 2020, arXiv:2004.10934. [Google Scholar]
- Tan, M.; Pang, R.; Le, Q.V. EfficientDet: Scalable and Efficient Target Detection. In Proceedings of the 2020 IEEE/CVF Conference on Computer Vision and Pattern Recognition (CVPR), Seattle, WA, USA, 13–19 June 2020; pp. 10778–10787. [Google Scholar] [CrossRef]


| Layer | Input | Operator | n | c | Output | Parameters |
|---|---|---|---|---|---|---|
| 0 | 3 × 640 × 640 | Conv2d(6,2) | 1 | 32 | 32 × 320 × 320 | 3520 |
| 1 | 32 × 320 × 320 | DPP | 1 | 64 | 64 × 160 × 160 | 10,272 |
| 2 | 64 × 160 × 160 | MSIA | 2 | 64 | 64 × 160 × 160 | 21,888 |
| 3 | 64 × 160 × 160 | DPP(8) | 1 | 256 | 256 × 20 × 20 | 66 |
| 4 | 64 × 160 × 160 | DPP | 1 | 128 | 128 × 80 × 80 | 41,024 |
| 5 | 128 × 80 × 80 | MSIA | 3 | 128 | 128 × 80 × 80 | 127,104 |
| 6 | 128 × 80 × 80 | DPP | 1 | 192 | 192 × 40 × 40 | 122,976 |
| 7 | 192 × 40 × 40 | MSIA | 2 | 192 | 192 × 40 × 40 | 188,544 |
| 8 | 192 × 40 × 40 | DPP | 1 | 256 | 256 × 20 × 20 | 245,888 |
| 9 | 256 × 20 × 20 | MSIA | 2 | 256 | 256 × 20 × 20 | 333,312 |
| 10 | 256 × 20 × 20 | Add(−1,3) | 1 | 256 | 256 × 20 × 20 | 0 |
| 11 | 256 × 20 × 20 | SPPF | 1 | 256 | 256 × 20 × 20 | 164,604 |
| 12 | 256 × 20 × 20 | Up | 1 | 192 | 192 × 40 × 40 | 12,672 |
| 13 | 192 × 40 × 40 | Concat (−1,6,7) | 1 | 576 | 576 × 40 × 40 | 0 |
| 14 | 576 × 40 × 40 | Process | 1 | 192 | 192 × 40 × 40 | 174,444 |
| 15 | 192 × 40 × 40 | Up | 1 | 128 | 128 × 80 × 80 | 6400 |
| 16 | 128 × 80 × 80 | Add(5,−1) | 1 | 128 | 128 × 80 × 80 | 0 |
| 17 | 128 × 80 × 80 | MSIA | 1 | 128 | 128 × 80 × 80 | 42,368 |
| 18 | 128 × 80 × 80 | DPP | 1 | 192 | 192 × 40 × 40 | 122,976 |
| 19 | 192 × 40 × 40 | Add (7,14,−1) | 1 | 192 | 192 × 40 × 40 | 0 |
| 20 | 192 × 40 × 40 | MSIA | 1 | 192 | 192 × 40 × 40 | 94,272 |
| 21 | 192 × 40 × 40 | DPP | 1 | 256 | 256 × 20 × 20 | 245,888 |
| 22 | 256 × 20 × 20 | Add(11,−1) | 1 | 256 | 256 × 20 × 20 | 0 |
| 23 | 256 × 20 × 20 | MSIA | 1 | 256 | 256 × 20 × 20 | 166,656 |
| Layers | Anchor Size |
|---|---|
| P3 | [11, 16], [15, 31], [20, 62] |
| P2 | [39, 35], [66, 61], [39, 113] |
| P1 | [70, 194], [108, 103], [200, 158] |
| Method | P (%) | R (%) | F1 | mAP (%) | Para (106) | Size (MB) |
|---|---|---|---|---|---|---|
| SSD(VGG16) | 69.8 | 66.2 | 67.9 | 67.94 | 91.7 | 181.3 |
| Yolov3-tiny | 78 ± 1.4 | 61.5 ± 1.1 | 68.8 ± 0.4 | 68.4 ± 0.5 | 8.7 | 17.4 |
| FS-Yolov5s | 79.6 | 70.7 | 74.9 | 76.65 | 5.2 | 10.7 |
| Yolov5s | 79.6 ± 1 | 69.7 ± 0.9 | 74.3 ± 0.3 | 76.6 ± 0.2 | 7.03 | 14.4 |
| Yolov5 | 81.3 ± 1.2 | 71.5 ± 0.7 | 76.3 ± 0.4 | 78.8 ± 0.2 | 46.1 | 92.9 |
| Yolov7-tiny | 78.2 ± 2.1 | 71.2 ± 1.4 | 74.5 ± 0.4 | 77.7 ± 0.6 | 6.02 | 12.3 |
| MSIA-Net(ours) | 82.1 ± 0.9 | 70.6 ± 0.5 | 76.2 ± 0.3 | 78.5 ± 0.2 | 2.1 | 4.6 |
| Backbone | FPN+PA | CA | ICB | LIR-FPN | P (%) | R (%) | F1 | mAP (%) |
|---|---|---|---|---|---|---|---|---|
| MSIA-bone | ✓ | ✓ | ✓ | 79.9 ± 1 | 70.1 ± 0.7 | 74.6 ± 0.2 | 77.9 ± 0.4 | |
| MSIA-bone | ✓ | ✓ | ✓ | 82.1 ± 0.9 | 70.6 ± 0.5 | 76.2 ± 0.3 | 78.5 ± 0.2 | |
| MSIA-bone | ✓ | ✓ | 80.5 ± 0.6 | 70.8 ± 0.6 | 75.3 ± 0.6 | 77.9 ± 0.3 | ||
| MSIA-bone | ✓ | ✓ | 80.7 ± 0.8 | 71.4 ± 0.5 | 75.8 ± 0.4 | 78.1 ± 0.3 | ||
| Darknet53 | ✓ | ✓ | 81.3 ± 1.1 | 69.5 ± 0.8 | 74.9 ± 0.3 | 77.4 ± 0.2 |
| Add(a, b, c) | Add the output feature graphs for layers a, b and c. Where a, b and c represent the layers of the network. If the value is negative, the current layer is the 0th layer, and the values from bottom to top are −1, −2, etc. |
| Concat(a, b, c) | The output feature graphs of layers a, b and c are added on channels, for example, H × W × C1 + H × W × C2 = H × W × (C1 + C2), Where H and W are the height and width of the image respectively, and C1 and C2 are the number of channels of the image. The meanings of a, b and c are as above. |
| Feature fusion | Process multiple images using the Add or Concat methods. |
| GT | GT is the label for the target. |
Disclaimer/Publisher’s Note: The statements, opinions and data contained in all publications are solely those of the individual author(s) and contributor(s) and not of MDPI and/or the editor(s). MDPI and/or the editor(s) disclaim responsibility for any injury to people or property resulting from any ideas, methods, instructions or products referred to in the content. |
© 2023 by the authors. Licensee MDPI, Basel, Switzerland. This article is an open access article distributed under the terms and conditions of the Creative Commons Attribution (CC BY) license (https://creativecommons.org/licenses/by/4.0/).
Share and Cite
Yu, J.; Li, S.; Zhou, S.; Wang, H. MSIA-Net: A Lightweight Infrared Target Detection Network with Efficient Information Fusion. Entropy 2023, 25, 808. https://doi.org/10.3390/e25050808
Yu J, Li S, Zhou S, Wang H. MSIA-Net: A Lightweight Infrared Target Detection Network with Efficient Information Fusion. Entropy. 2023; 25(5):808. https://doi.org/10.3390/e25050808
Chicago/Turabian StyleYu, Jimin, Shun Li, Shangbo Zhou, and Hui Wang. 2023. "MSIA-Net: A Lightweight Infrared Target Detection Network with Efficient Information Fusion" Entropy 25, no. 5: 808. https://doi.org/10.3390/e25050808