
Optimization of Three Key Geometries of a Steam Ejector under Varied Primary Nozzle Geometries

1
School of Civil Engineering and Architecture, Southwest University of Science and Technology, Mianyang 621010, China
2
School of Control Science and Engineering, Shandong University, Jinan 250061, China
*
Author to whom correspondence should be addressed.
Entropy 2023, 25(1), 15; https://doi.org/10.3390/e25010015
Submission received: 24 November 2022
/
Revised: 15 December 2022
/
Accepted: 19 December 2022
/
Published: 21 December 2022
(This article belongs to the Special Issue Applied Thermodynamics and Heat Transfer)
Abstract
:In this paper, three key geometrical dimensions such as XL3 (constant pressure mixing chamber length), D5 (diameter of the throat of the ejector), and XL5 (length of the throat of the ejector) were separately or sequentially optimized under different lengths and angles of two sections of the primary nozzle. Furthermore, shock cluster number and shock chain length or area of low static pressure zone were used to analyze the effect of geometries on ejector performance, which is normally indicated by entrainment ratio (ER, or the ratio between the mass flow rate of secondary flow and the mass flow rate of primary flow). The results show that: (1) the improvement of ejector performance with only optimization of the primary nozzle is quite limited, in comparison, the impact of length and angle of nozzle diverging section on ejector performance is higher than that of converging section; (2) the relative sensitivity of ER to three key dimensions is much higher than that to the angles and lengths of the primary nozzle; (3) with the increase of XL3 and D5, ER needs a larger angle and smaller length of nozzle converging section; (4) the impact of key geometries on ejector performance can be analyzed with the help of shock cluster number and shock chain length or area of low static pressure zone.
1. Introduction
Carbon capture used in flue gas emission is one of the most important methods of reducing CO2 [1]. However, the absorption and resolution of CO2 in the process of carbon capture consume a big amount of thermal output of the plant. As a component with simple structure and easy maintenance, the ejector is widely used in hydrogen energy [2], refrigeration, and chemical industry [3,4]. Zhang et al. [5] applied an ejector to collect CO2 from flue gas, which is greatly obvious in reducing energy consumption in the traditional carbon capture process. Moreover, three ways to drive the ejector were used to evaluate the potential energy-saving effect [6].
In this condition, the ejector performance which is based on the optimization of the geometries directly affects the energy-saving effect in the carbon capture system. Sriveerakul et al. [7,8] optimized the ejector primary nozzle with this application, which made it convenient for subsequent researchers to optimize the primary nozzle through CFD simulation. Sun et al. [9] studied the converging and diverging sections of the primary nozzle through CFD simulation, and the entrainment ratio (ER) of the ejector increased by 19.79%. Sheng et al. [10] proposed an improved alternating-lobe nozzle, studied the fluid state of the alternating-lobe nozzle, and claimed that the new nozzle can promote high fluid mixing efficiency in the core area. In addition, Li et al. [11] studied the steam expansion characteristic at the primary nozzle. Yan et al. [12] optimized ejector primary nozzles, and different optimal angles and lengths were in the converging and diverging sections of the primary nozzle. Fu et al. [13] optimized a steam ejector, and the nozzle throat diameter ranging from 4.8 to 4.85 can increase ER by 25%. Thongtip et al. [14] also investigated the throat diameter of the nozzle. Their study showed that different fluid expansion coefficients happened at the nozzle outlet. It was suggested that the throat diameter should be determined according to the actual situation. Fu et al. [15] recommended that the different outlet diameter of the primary nozzle has a certain effect on ER.
In addition, the optimization of other key geometries of the ejector such as nozzle exit position (NXP), and lengths of both constant-pressure and constant-area mixing chambers was investigated by some scholars. Chen et al. [16] identified the relationship between NXP and ER, and results showed that the critical ER is determined by the secondary flow choking. Zohbi et al. [17] found that backflow happened to the ejector when NXP was set at a certain value. Furthermore, Zhu et al. [18] optimized the NXP under different constant area mixing chambers. Meanwhile, Dong et al. [19] optimized the constant area mixing chamber length. Varga [20] optimized the diameter of the constant-area mixing chamber and NXP. Similarly, Reis et al. [21] evaluated the effect of mixing chamber length. Furthermore, our previous research [22] was involved to optimize three key geometries of XL3, XL5, and D5 under various optimization sequences.
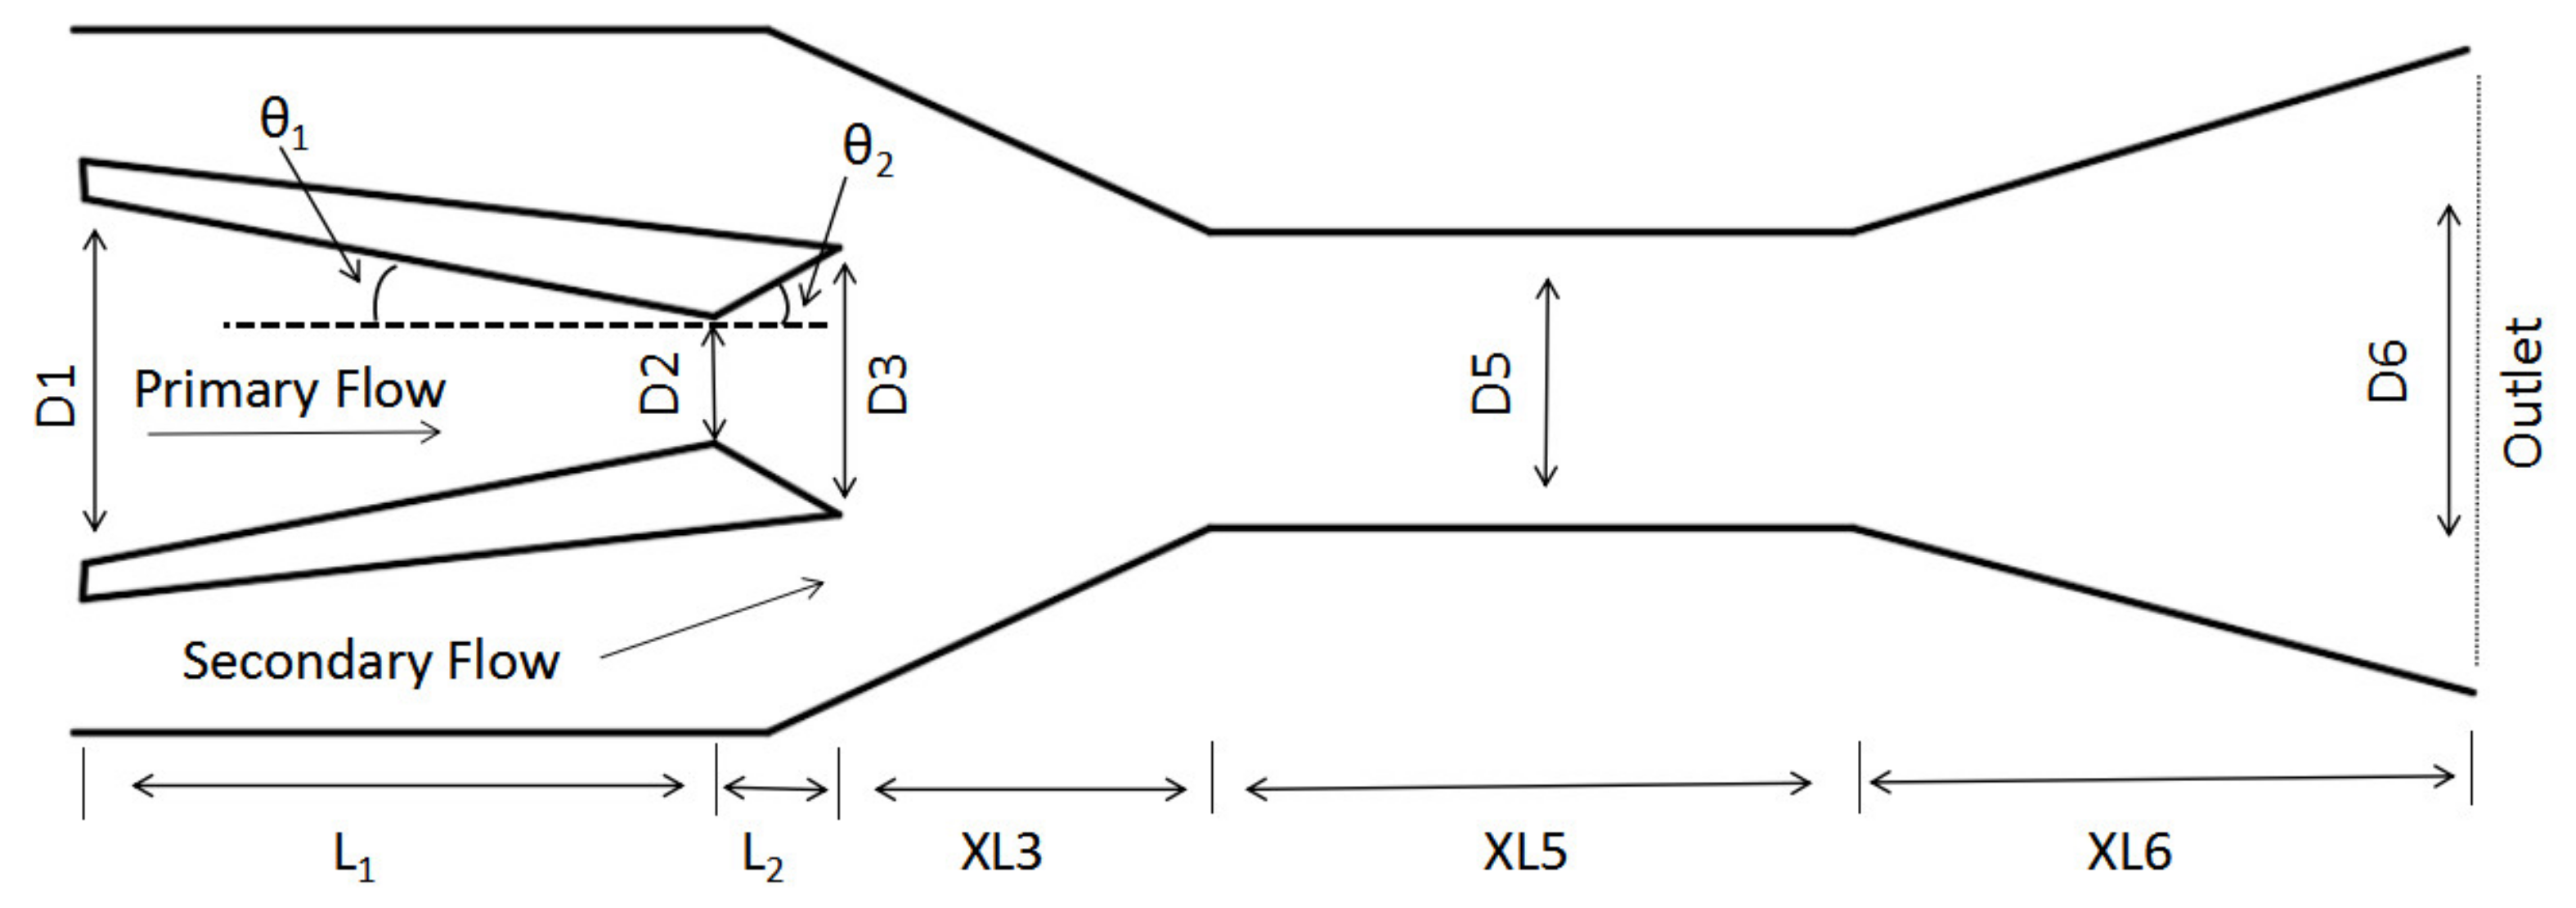
The ejector consists of five parts: nozzle, secondary flow induction chamber, two mixing chambers, and diffuser. The three key geometries largely affect ejector performance [22]. So far, however, the effect of the primary nozzle structure on the optimum of three key geometries of a steam ejector (Figure 1) has not been mentioned. Hence, the following works will be carried out in this study:
- The angle and length of both converging and diverging sections of the primary nozzle are optimized, respectively.
- With the given angle and length of the converging section of the primary nozzle, three key geometries were optimized separately or with the sequence of XL3→D5→XL5. Thus, the optimum of the three key dimensions and the corresponding maximum ER are identified.
- With the given angle and length of the diverging section of the primary nozzle, three key geometries were optimized separately or with the sequence of XL3→D5→XL5. The impact of the angle and length of the diverging section of the primary nozzle on the optimal values of the three key dimensions and relevant maximum ER is determined.
- Relative sensitivity of ejector performance to primary nozzle geometries and the other three key geometries is evaluated.
- The effect of the ejector geometries on ejector performance is analyzed with shock cluster number and shock chain length or area of low static pressure zone inside the ejector.
2. Experimental Rig
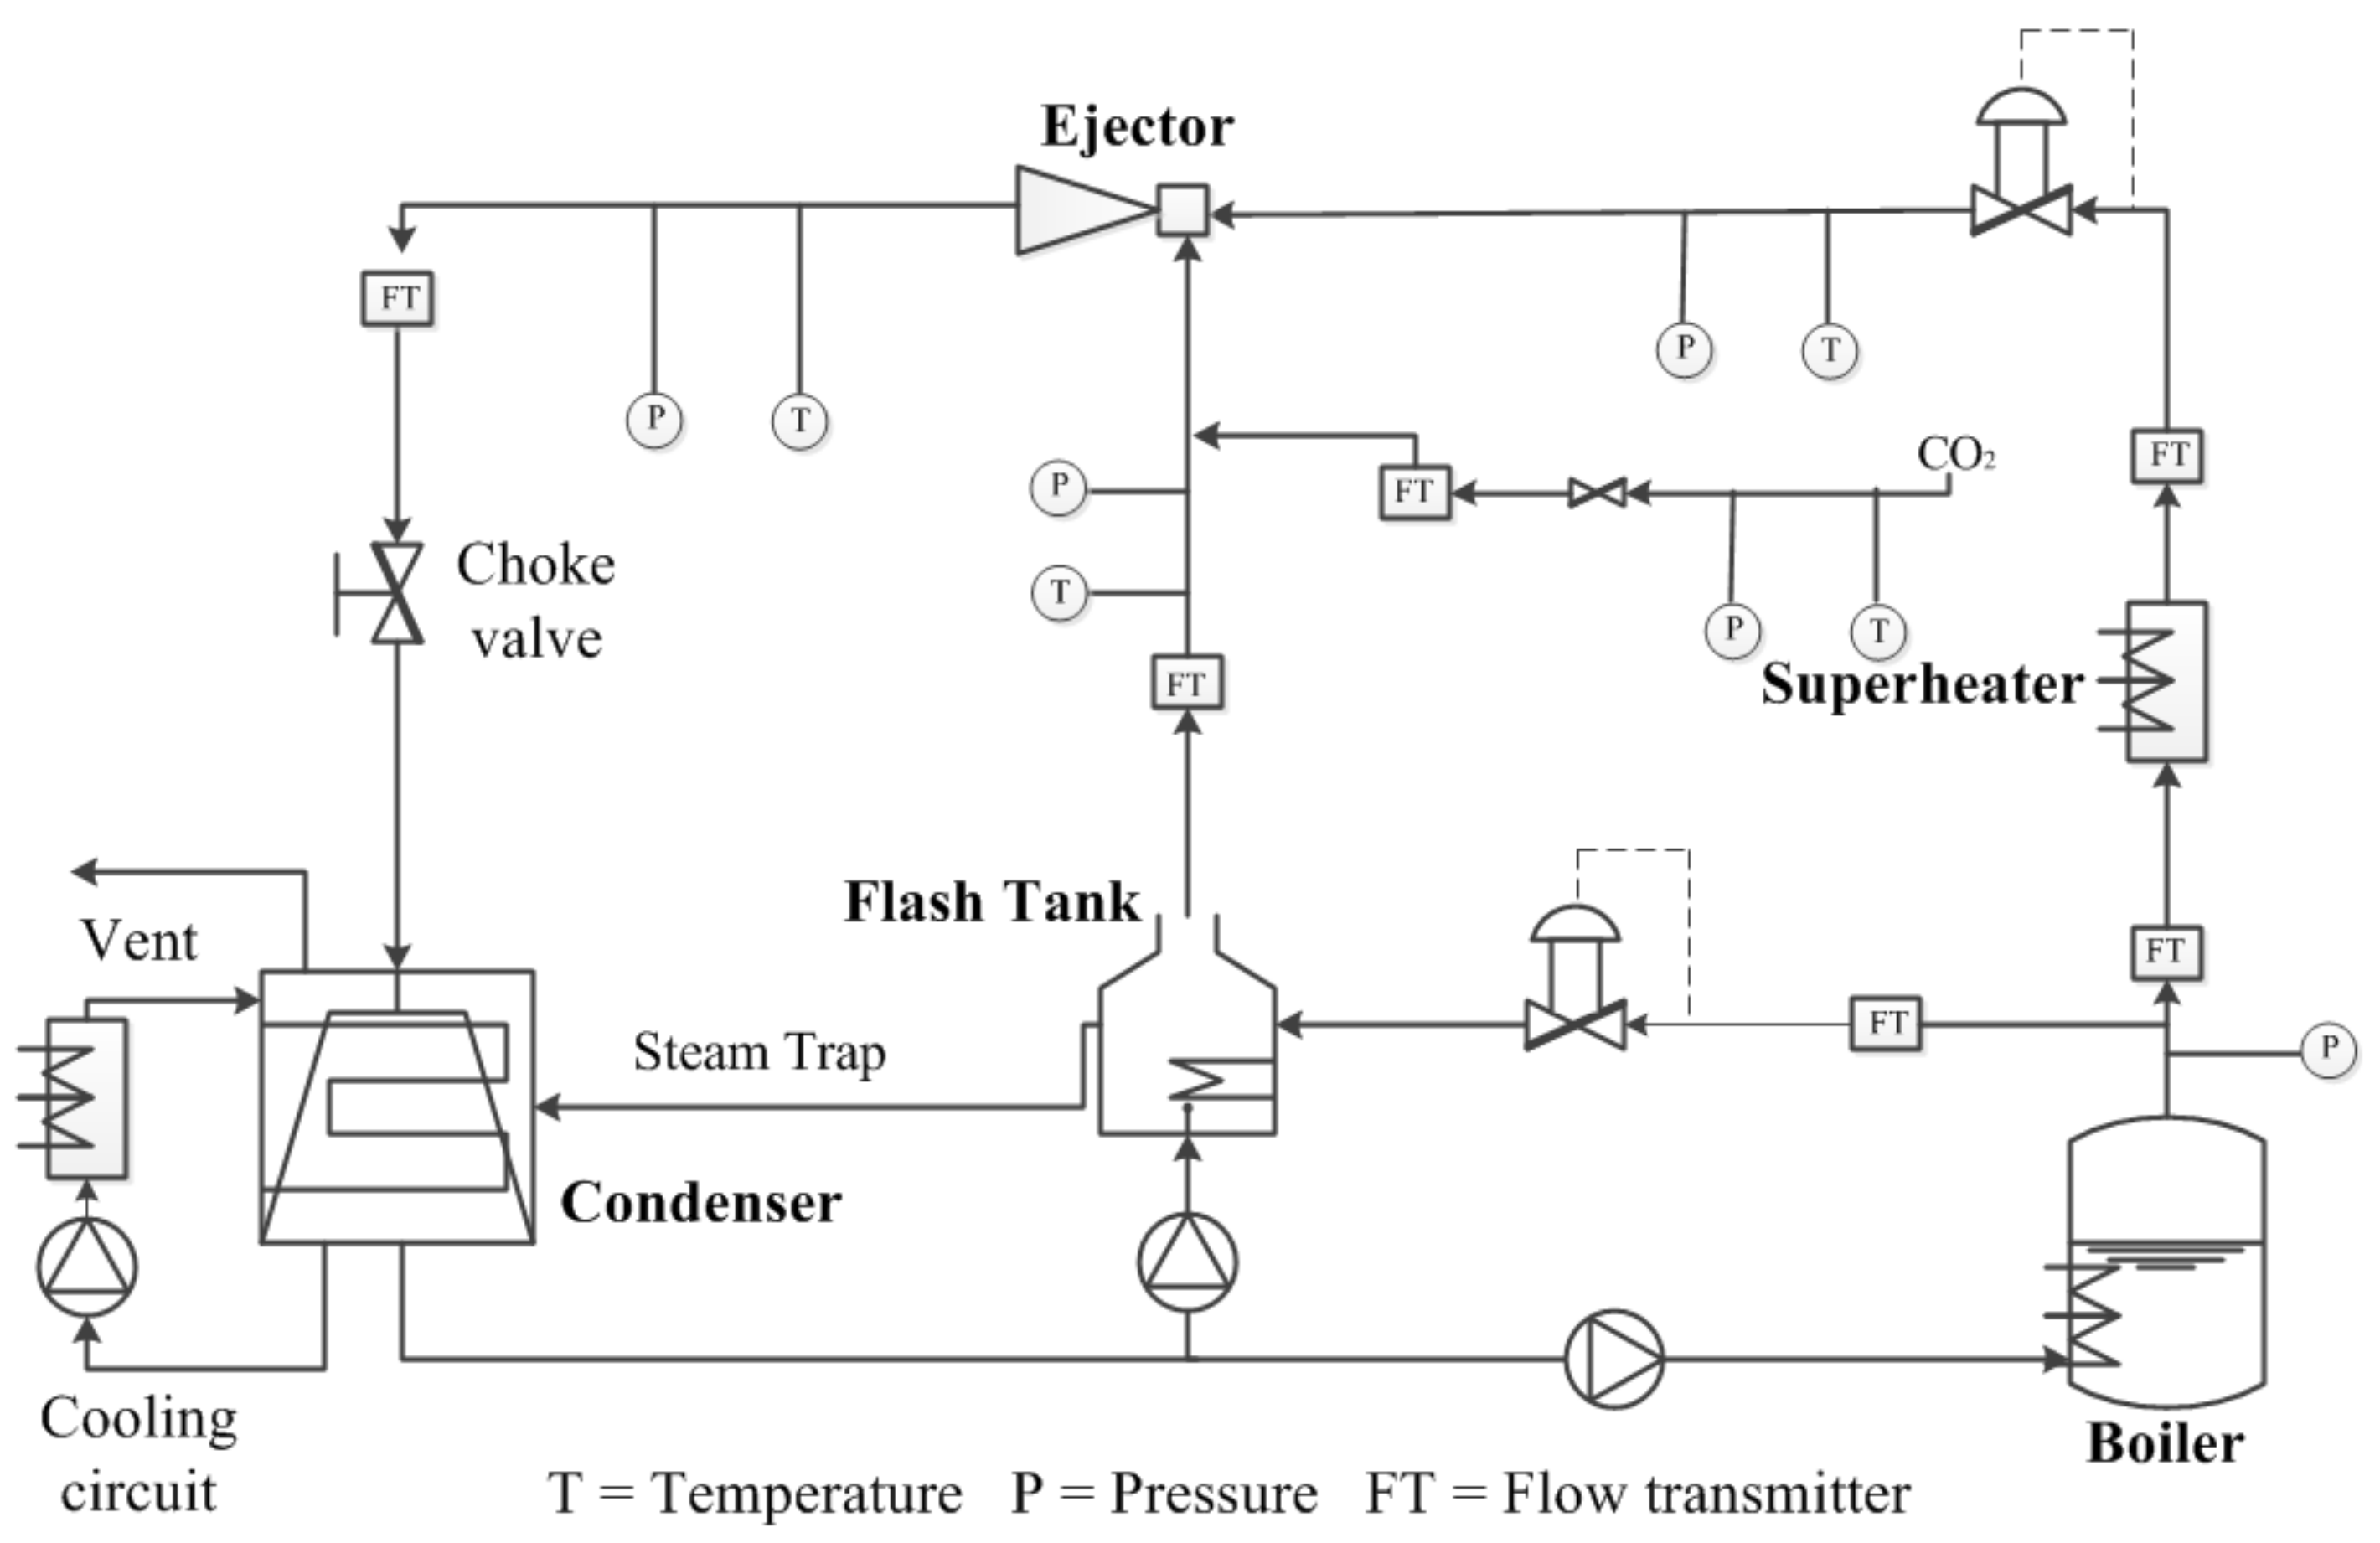
The working principle of the ejector-based carbon capture system can be referred to in Ref. [23], and the initial geometries of the ejector are given in Table 1.
Figure 2 shows the schematic of the ejector-based test bench. The sensors used are as follows: “T” for thermometers; “P” for manometers; and “GF” and “FT” for vortex flowmeters and orifice flowmeters.
3. CFD Modeling and Model Validation
The derivation of conservation equations of energy, mass, and flow related to the calculation is presented in our previous work [22]. A realizable turbulence model with better performance prediction [24,25] is selected in the simulation.
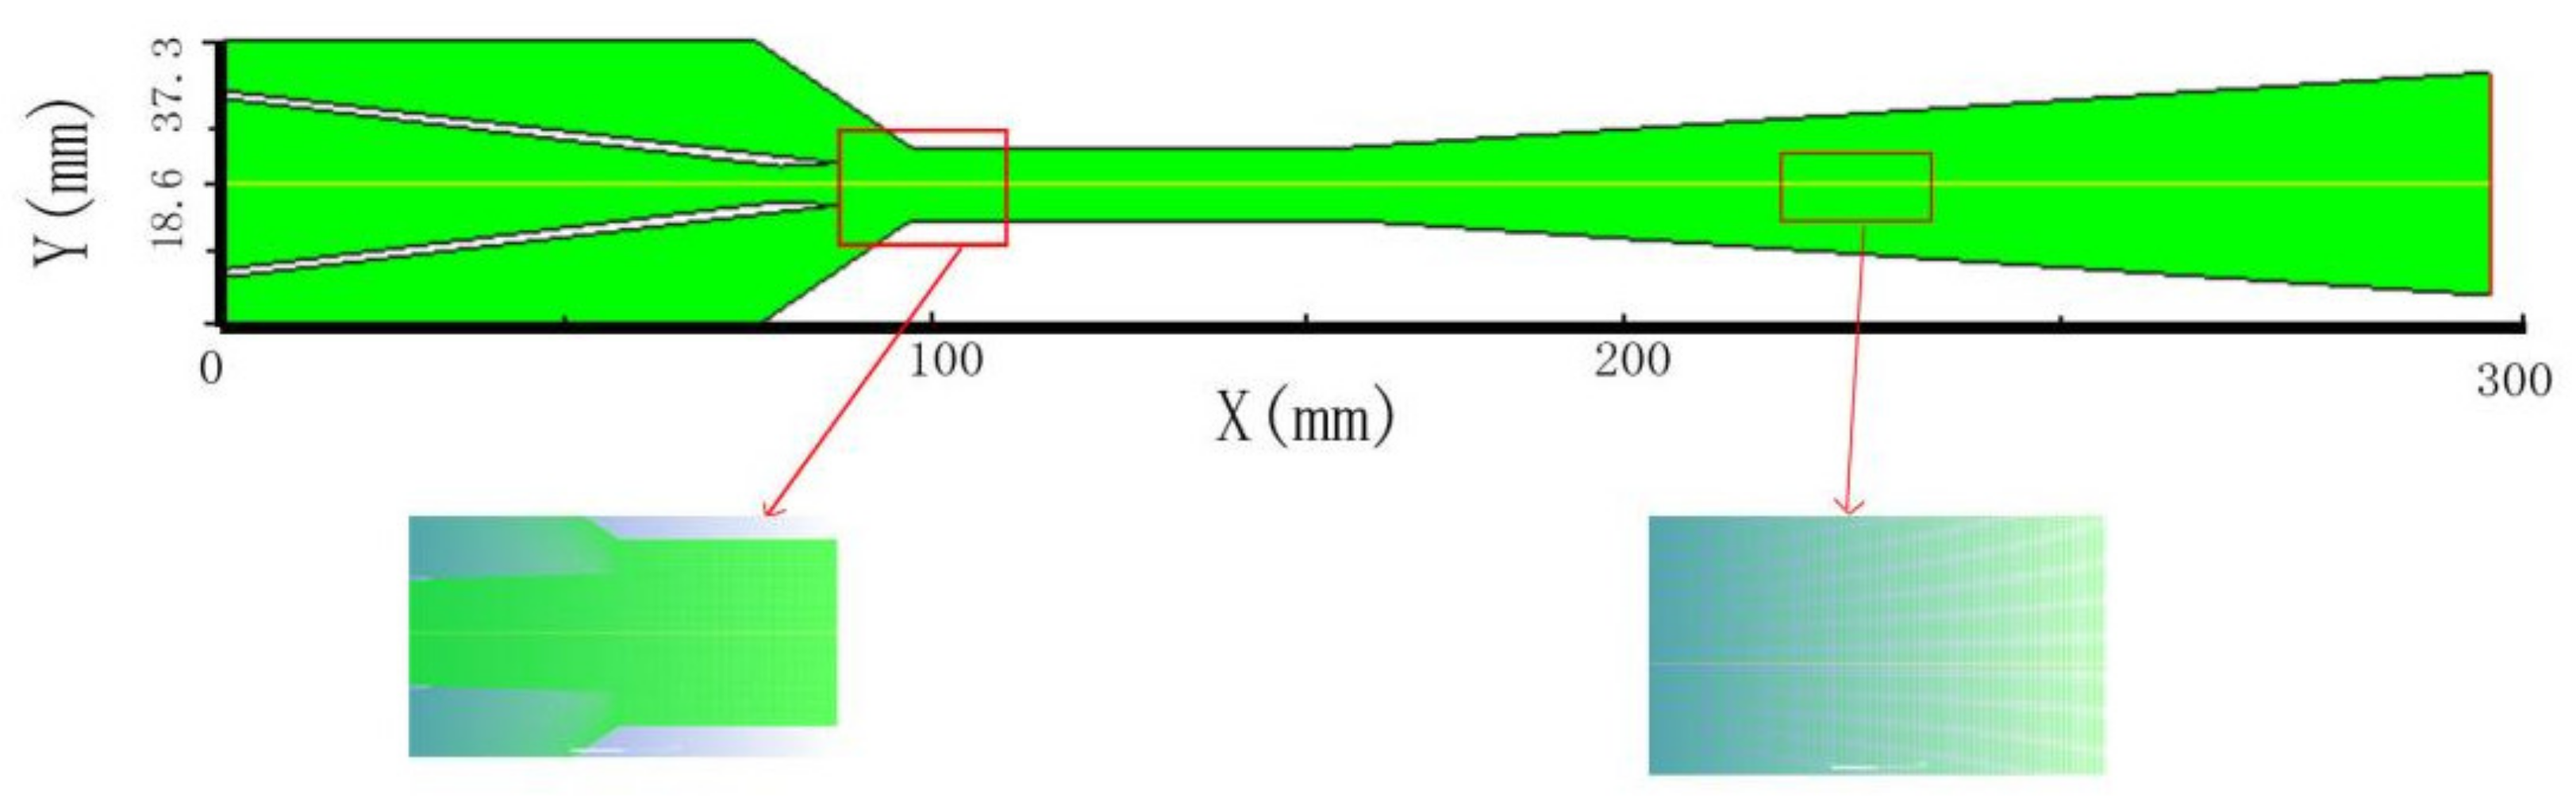
Figure 3 is a structural grid created by using the software Gambit [26]. Fluent 19.0 is used to carry out the CFD simulation. Implicit double precision and second-order upwind discrete schemes are utilized [27]. The energy equation residual is set to less than 10−6, while the rest residuals are less than 10−5. The pressure relaxation factor is set to 0.1 and all others are set to 0.3. Boundary conditions are illustrated in Table 2.
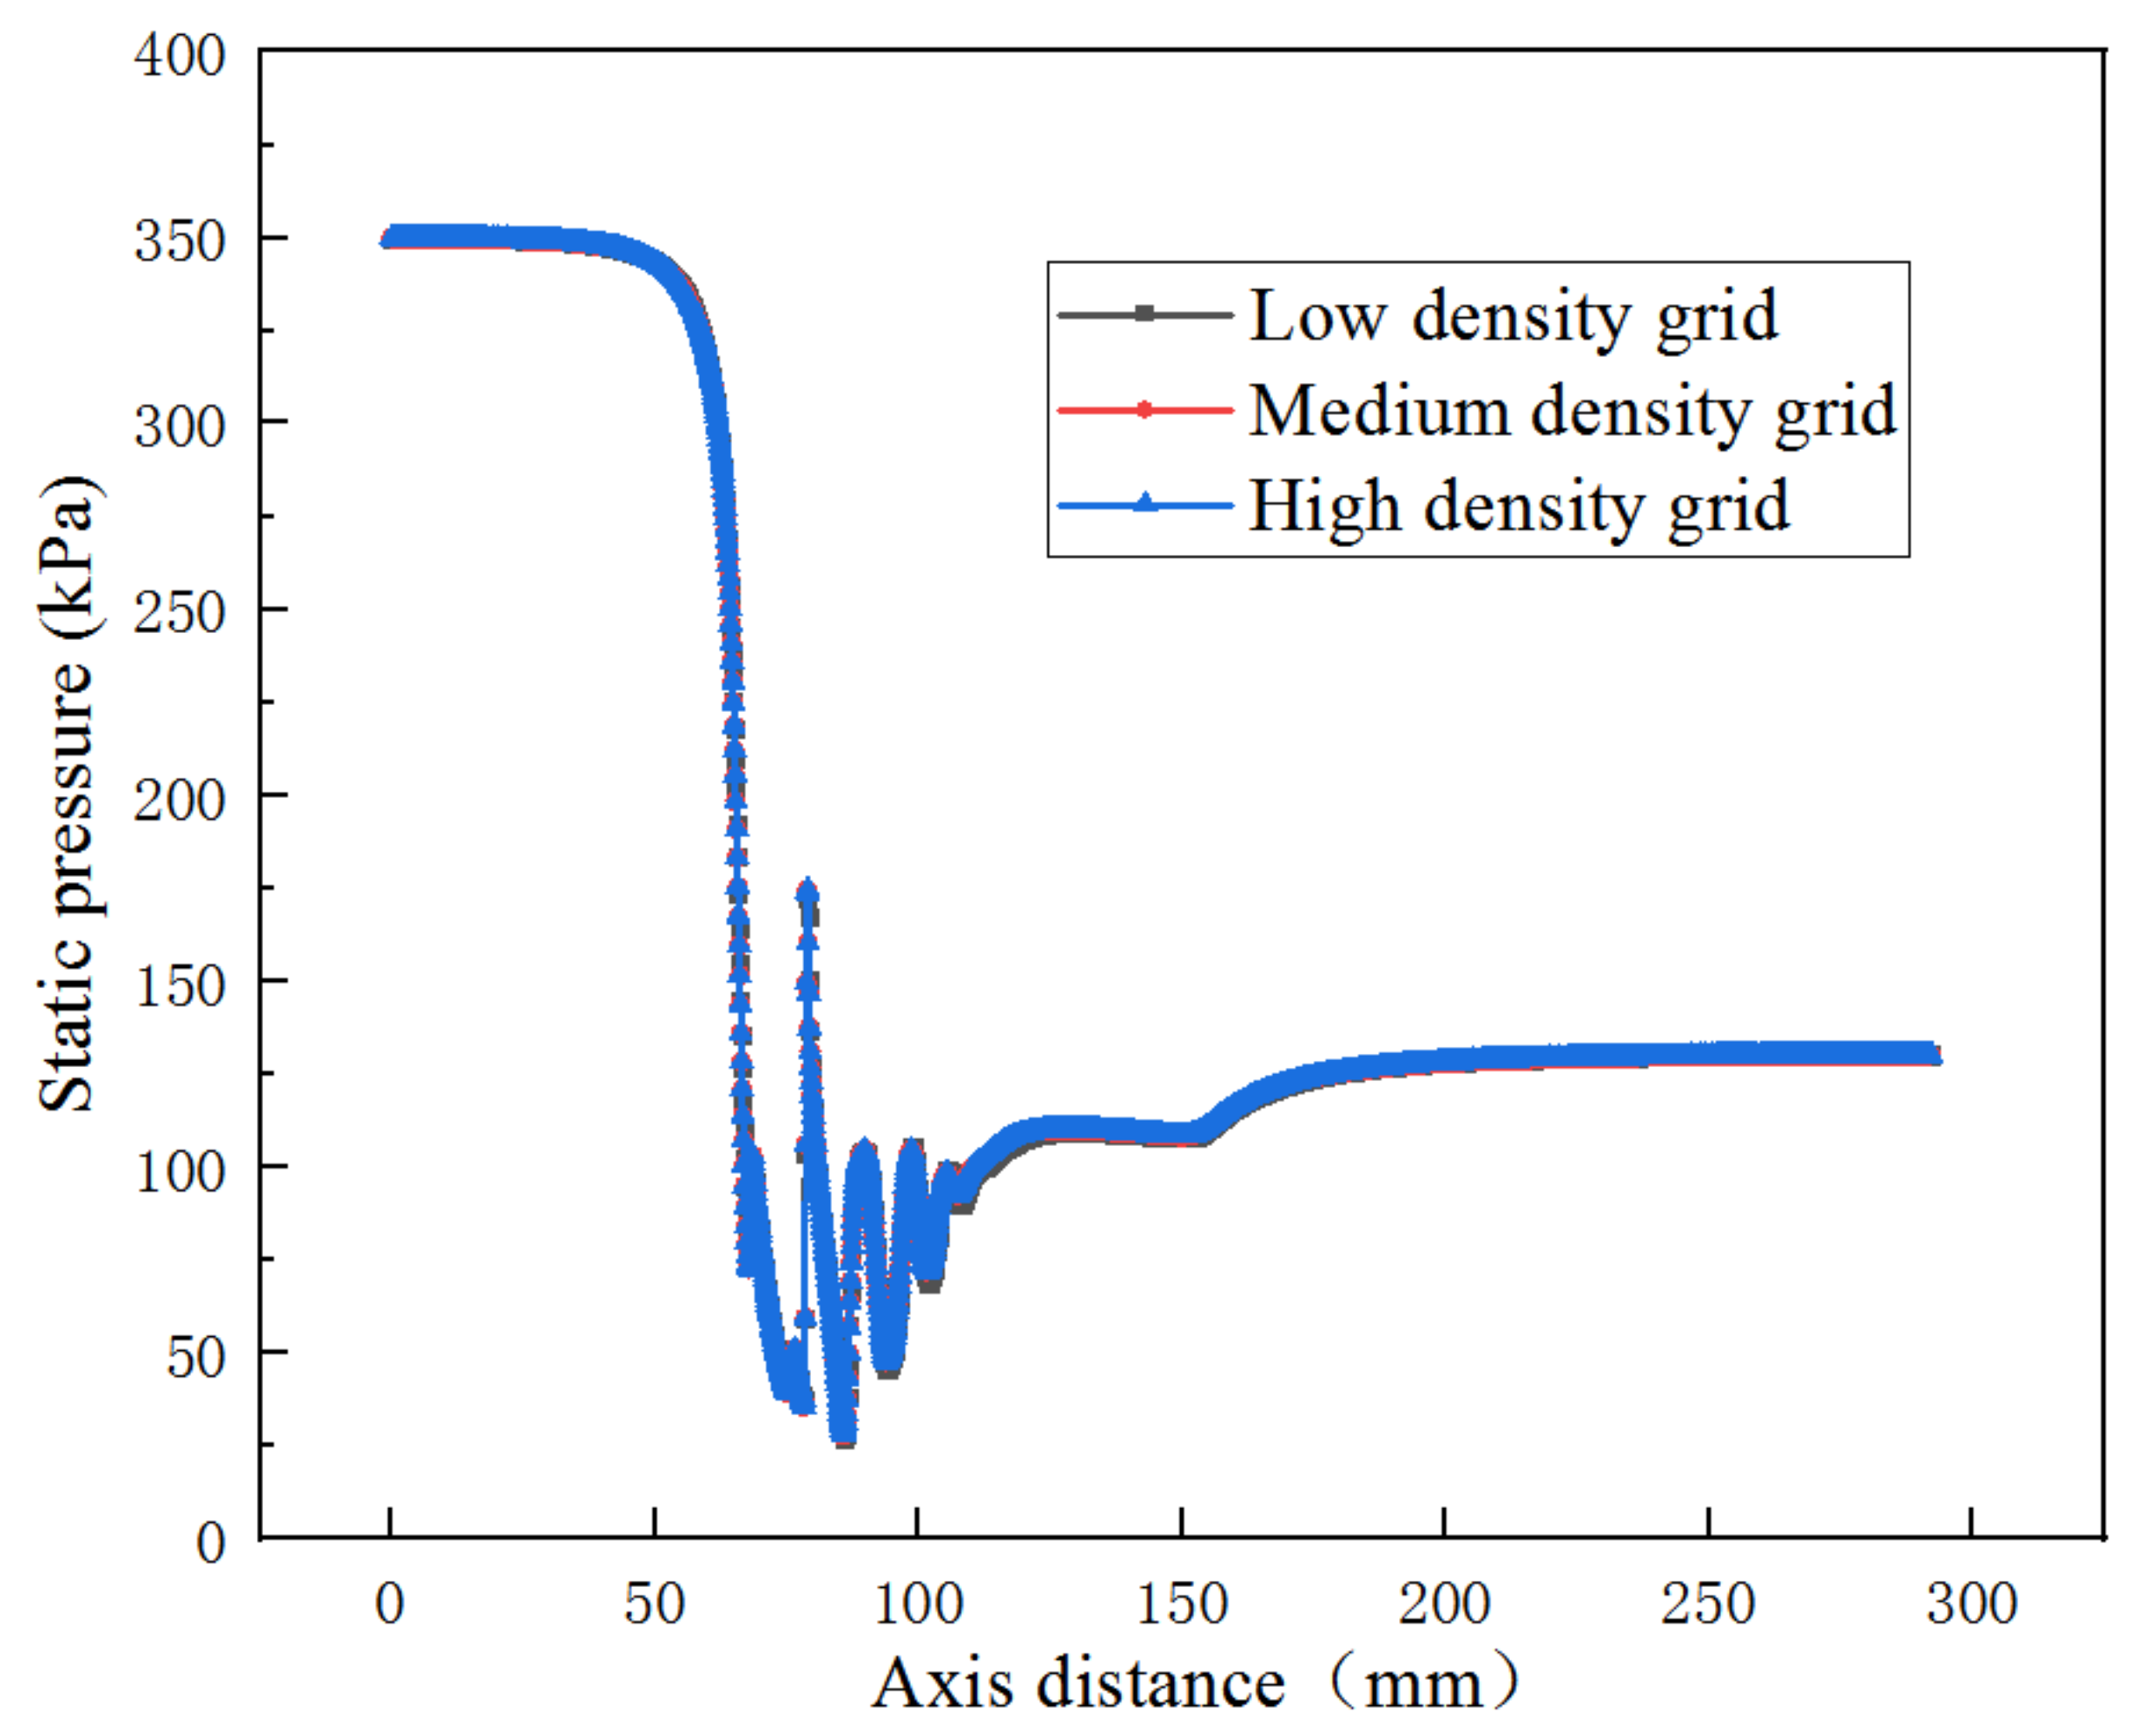
Under the grid numbers 119,720, 161,600, and 23,730, the differences in axial static pressure are all within 1% as shown in Figure 4. Considering both the calculation accuracy and time, thus, the medium one with 161,600 is adopted for the simulation.
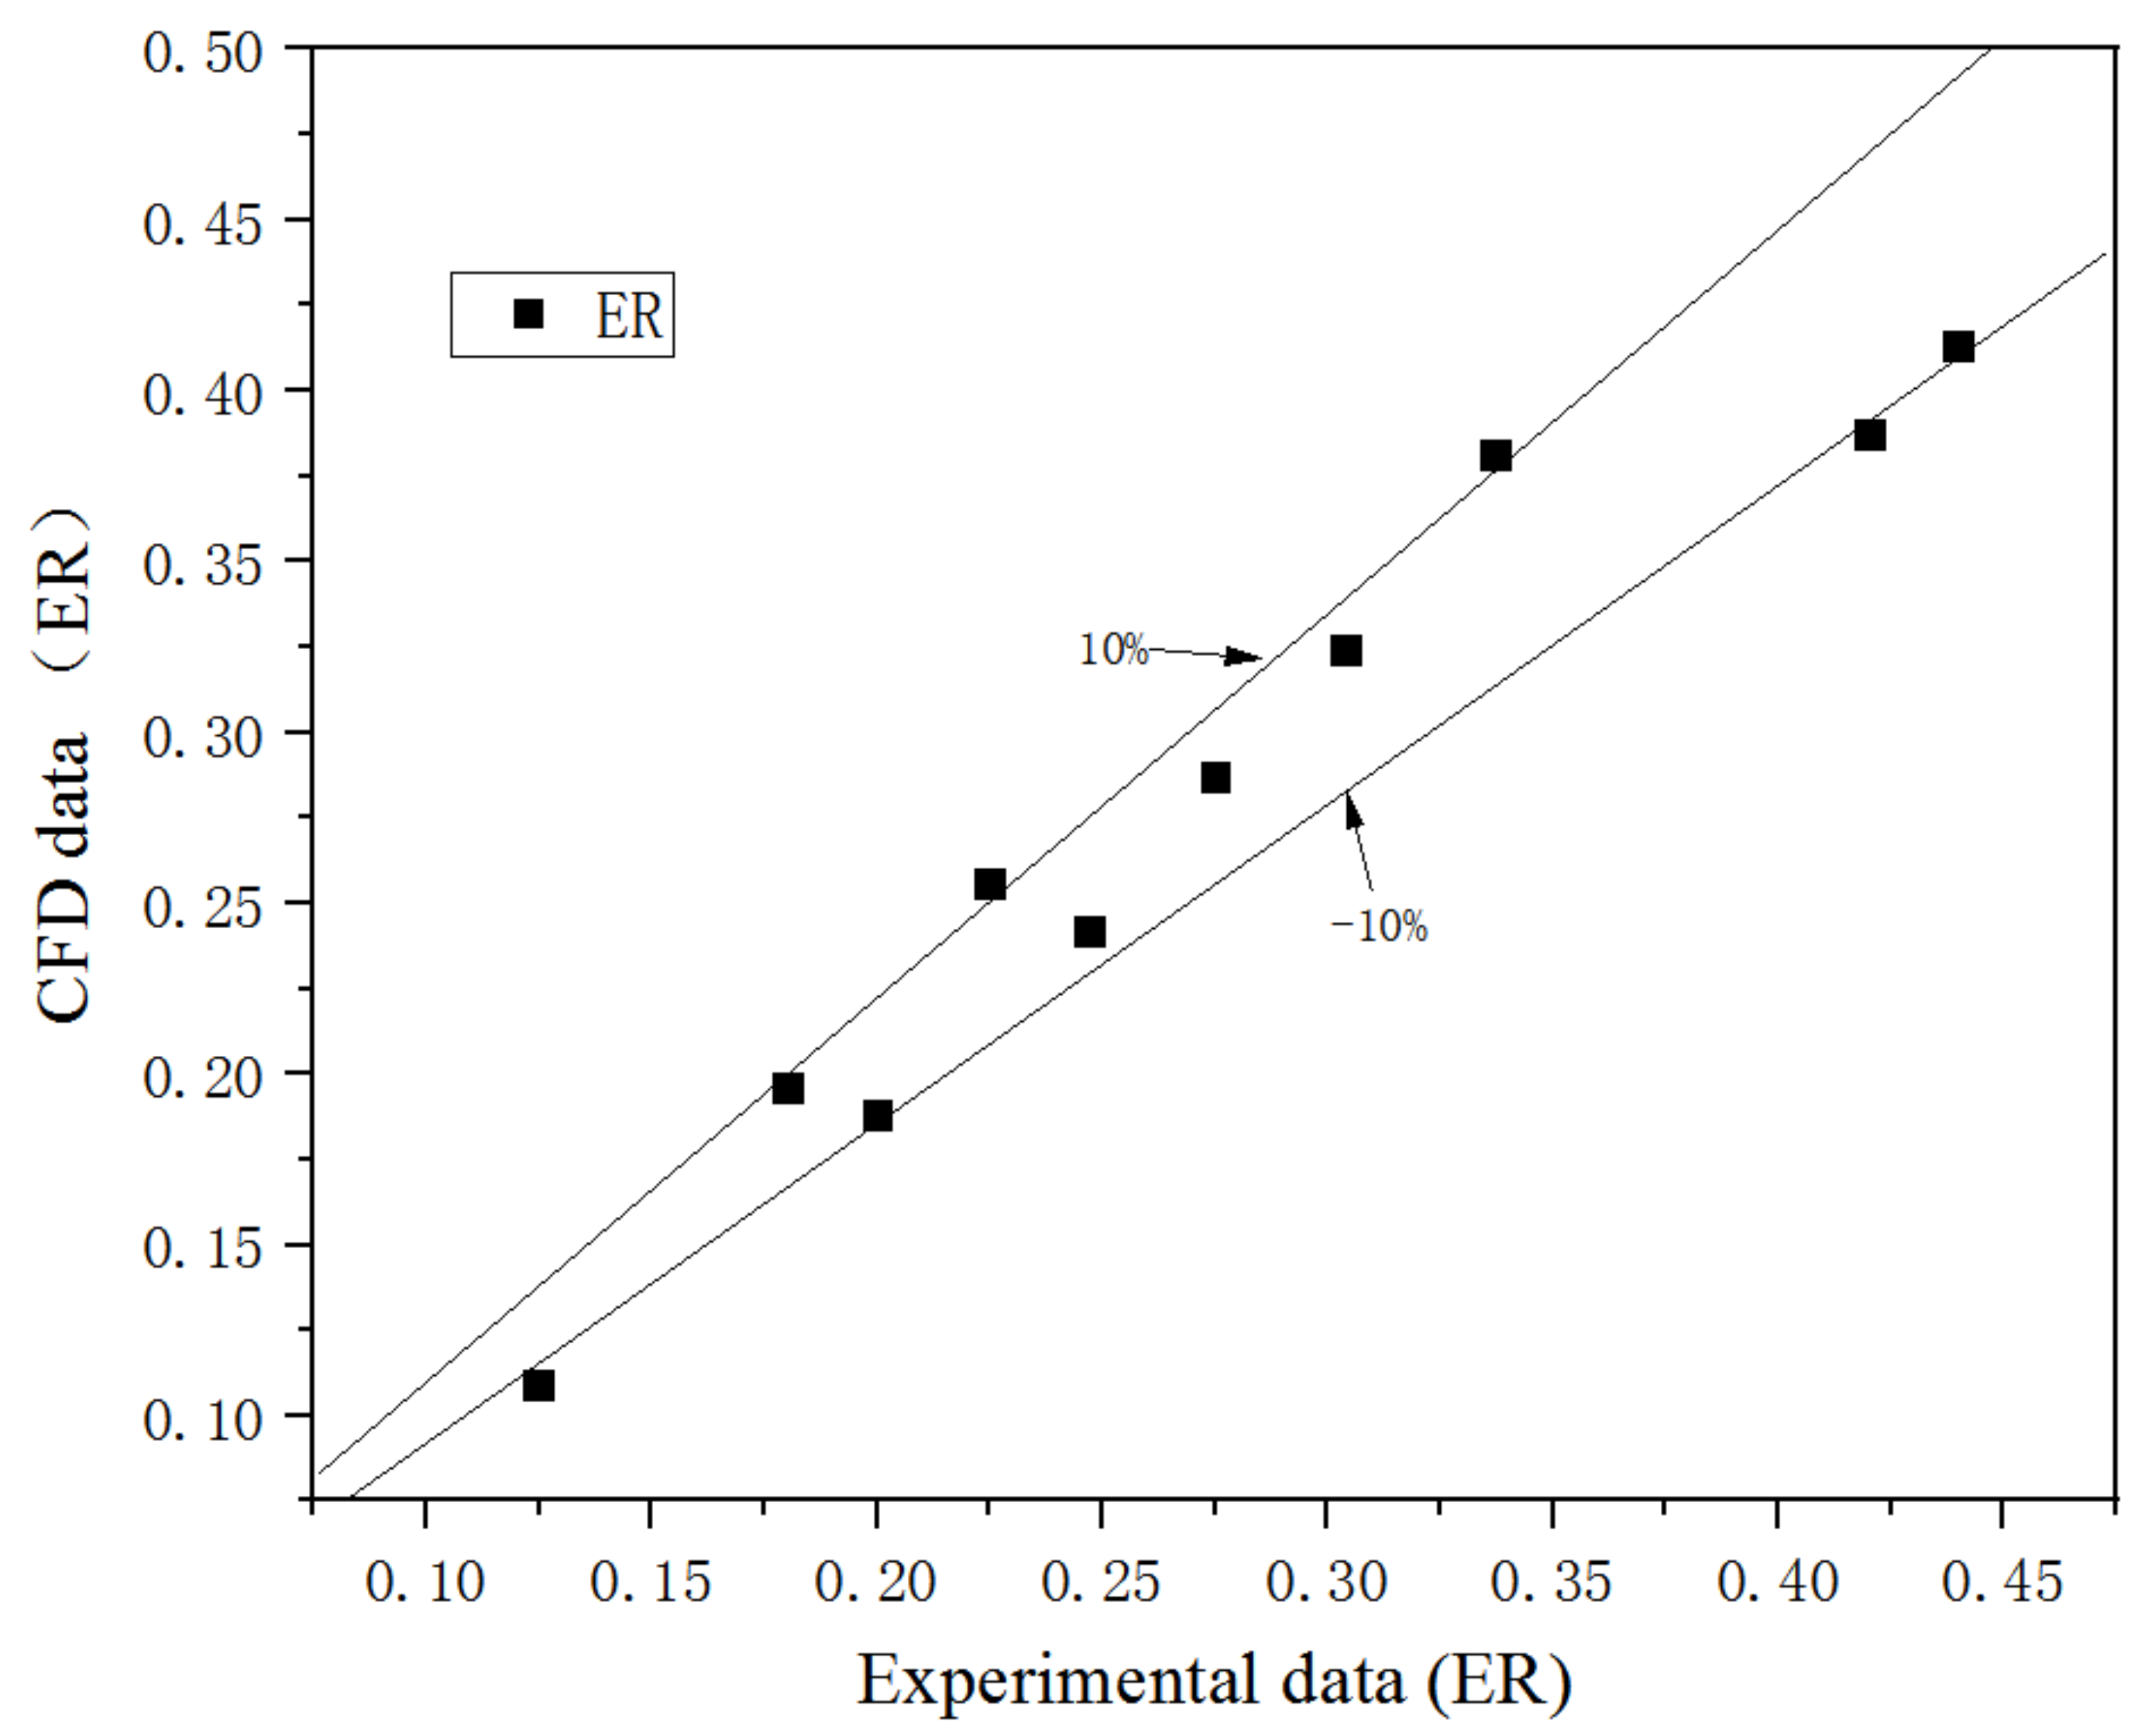
Figure 5 is the CFD and experimental ER, in which, ER is defined as:
where and are the primary and secondary flow mass flow rates, respectively. The average and maximum discrepancies of ER are 10.3% and 13.8%, respectively. The CFD results are quite close to experimental results, so the CFD model can be used for this study.
4. Results and Discussion
4.1. Effect of the Converging Section of the Primary Nozzle
- (1)
- Ejector performance under varied lengths and angles of converging section
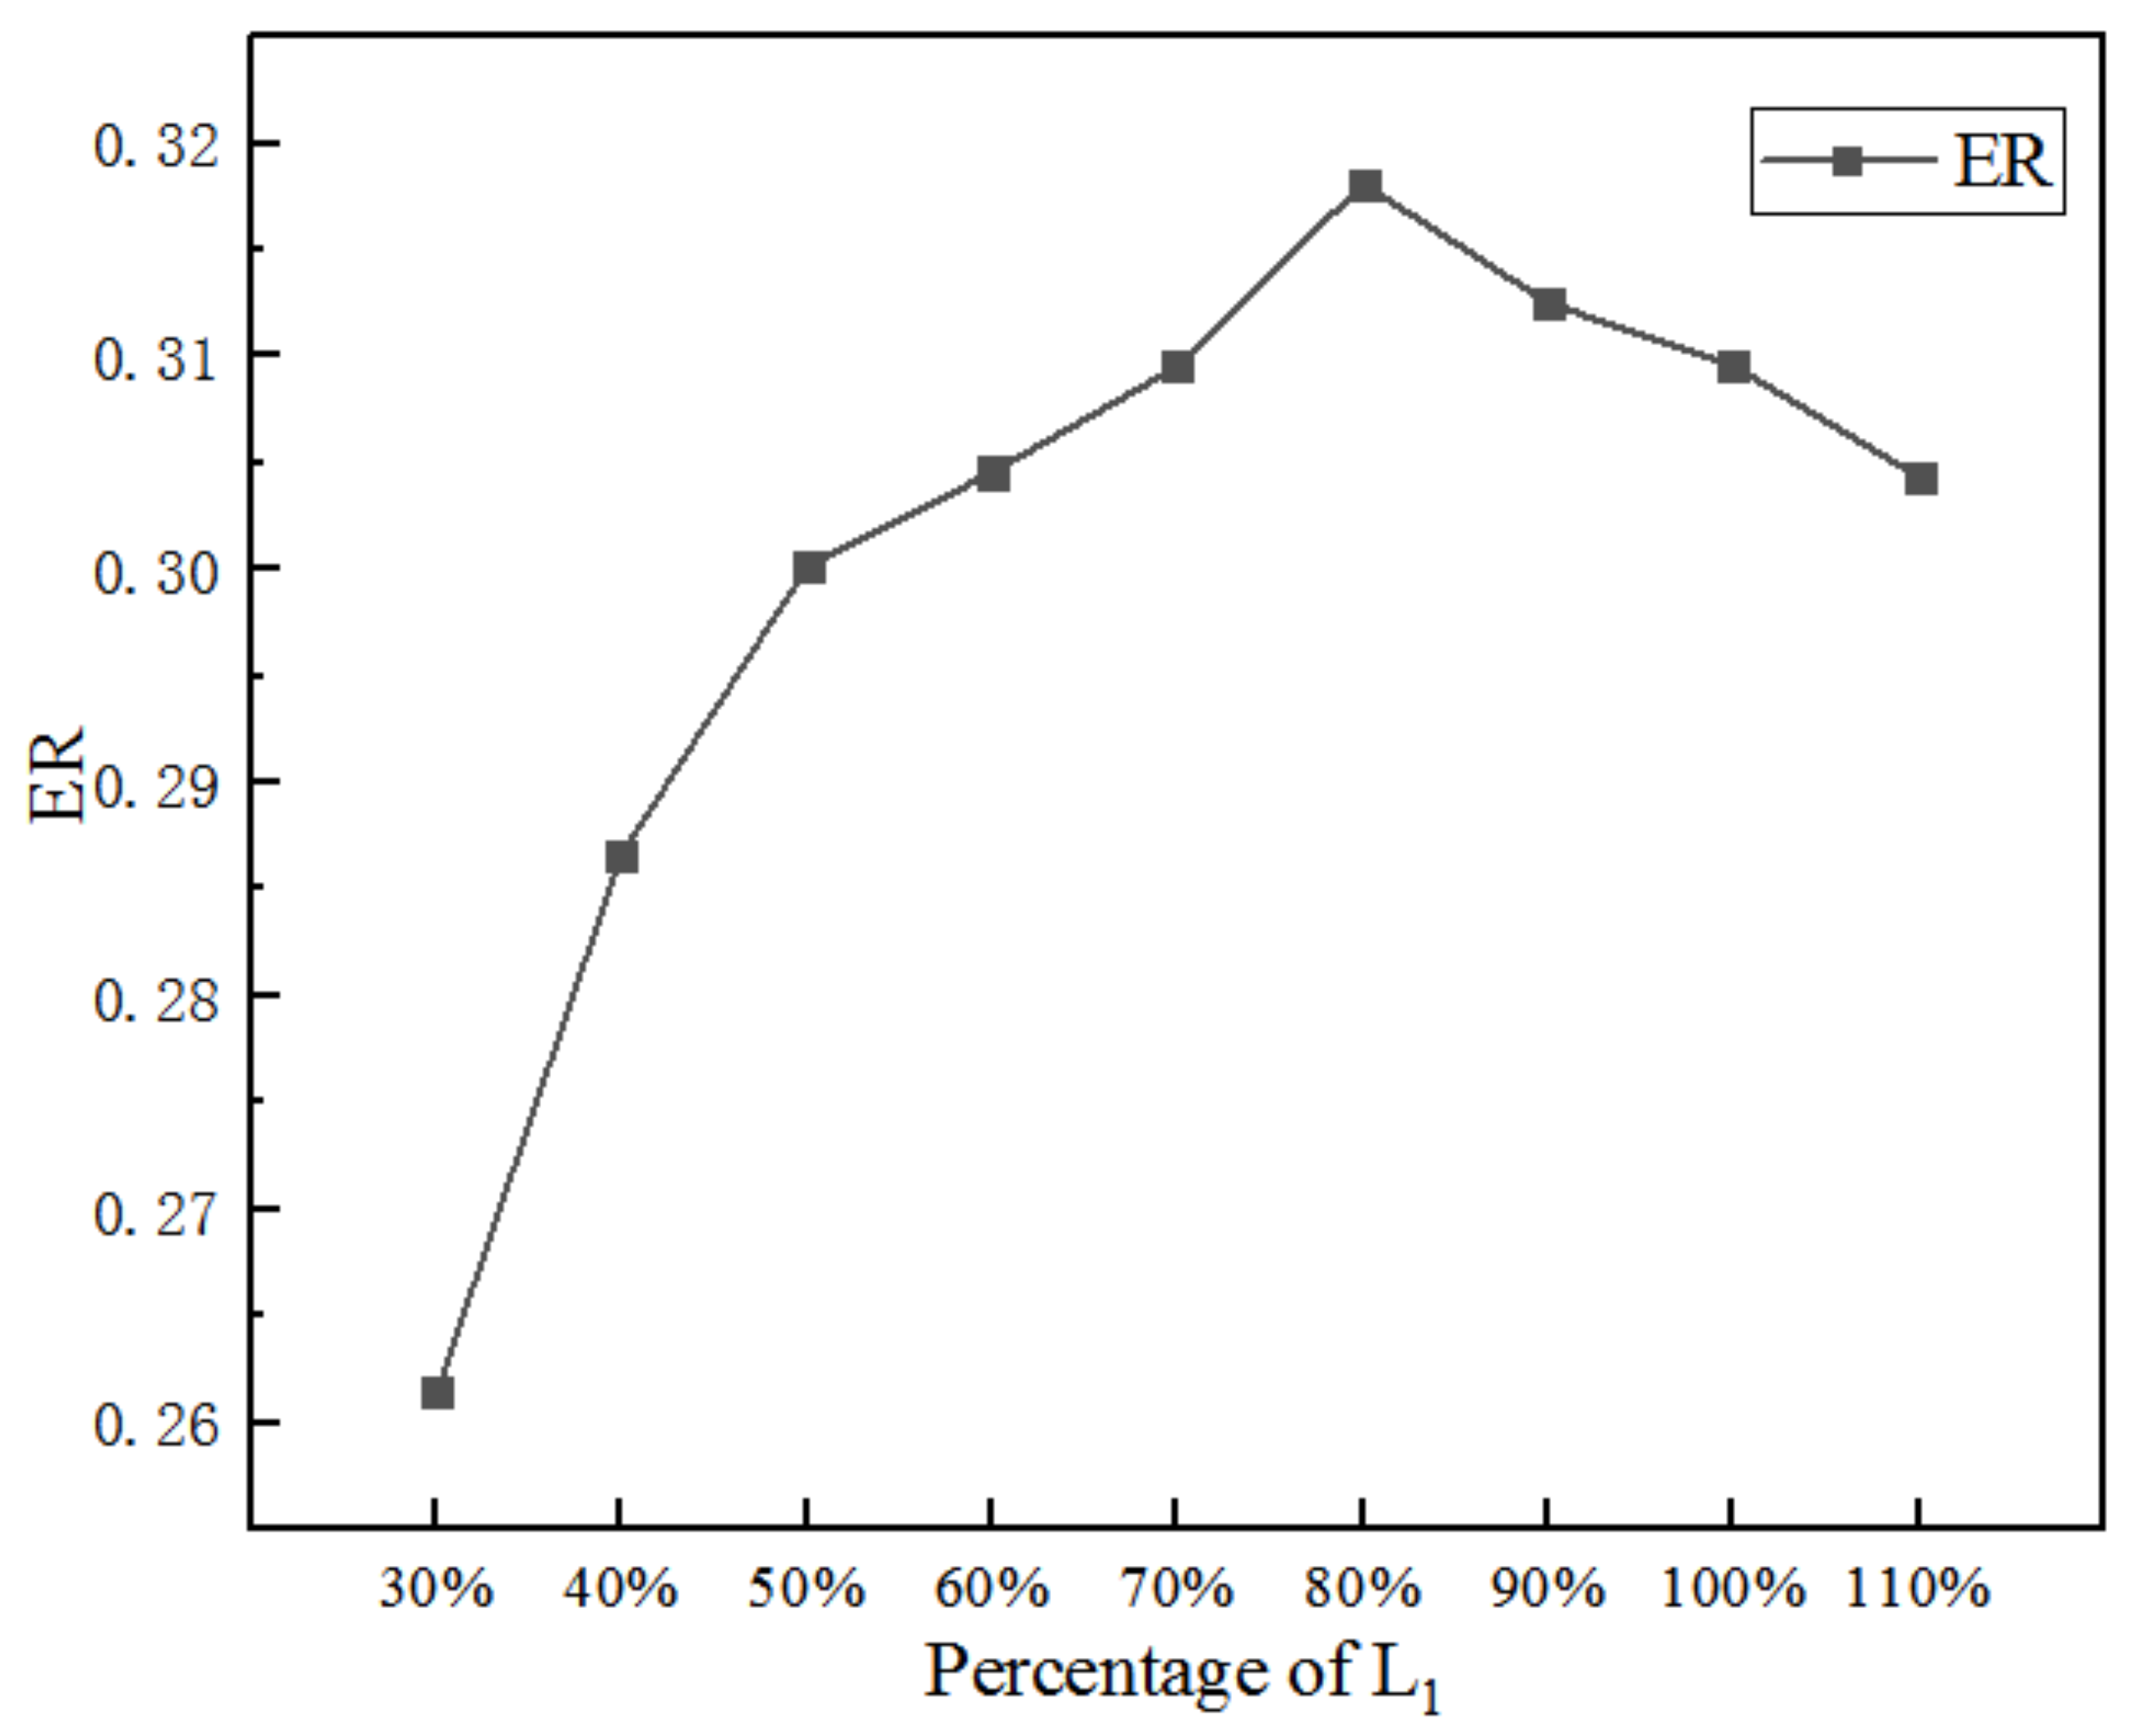
Figure 6 is the impact of L1 on ER when other dimensions remain constant. When the L1 increases from 30% (19.5 mm) to 110% (71.5 mm), the highest ER is 0.318 (the length of the converging section is 80%), thus the optimal ER increases by 2.9% over the initial ER.
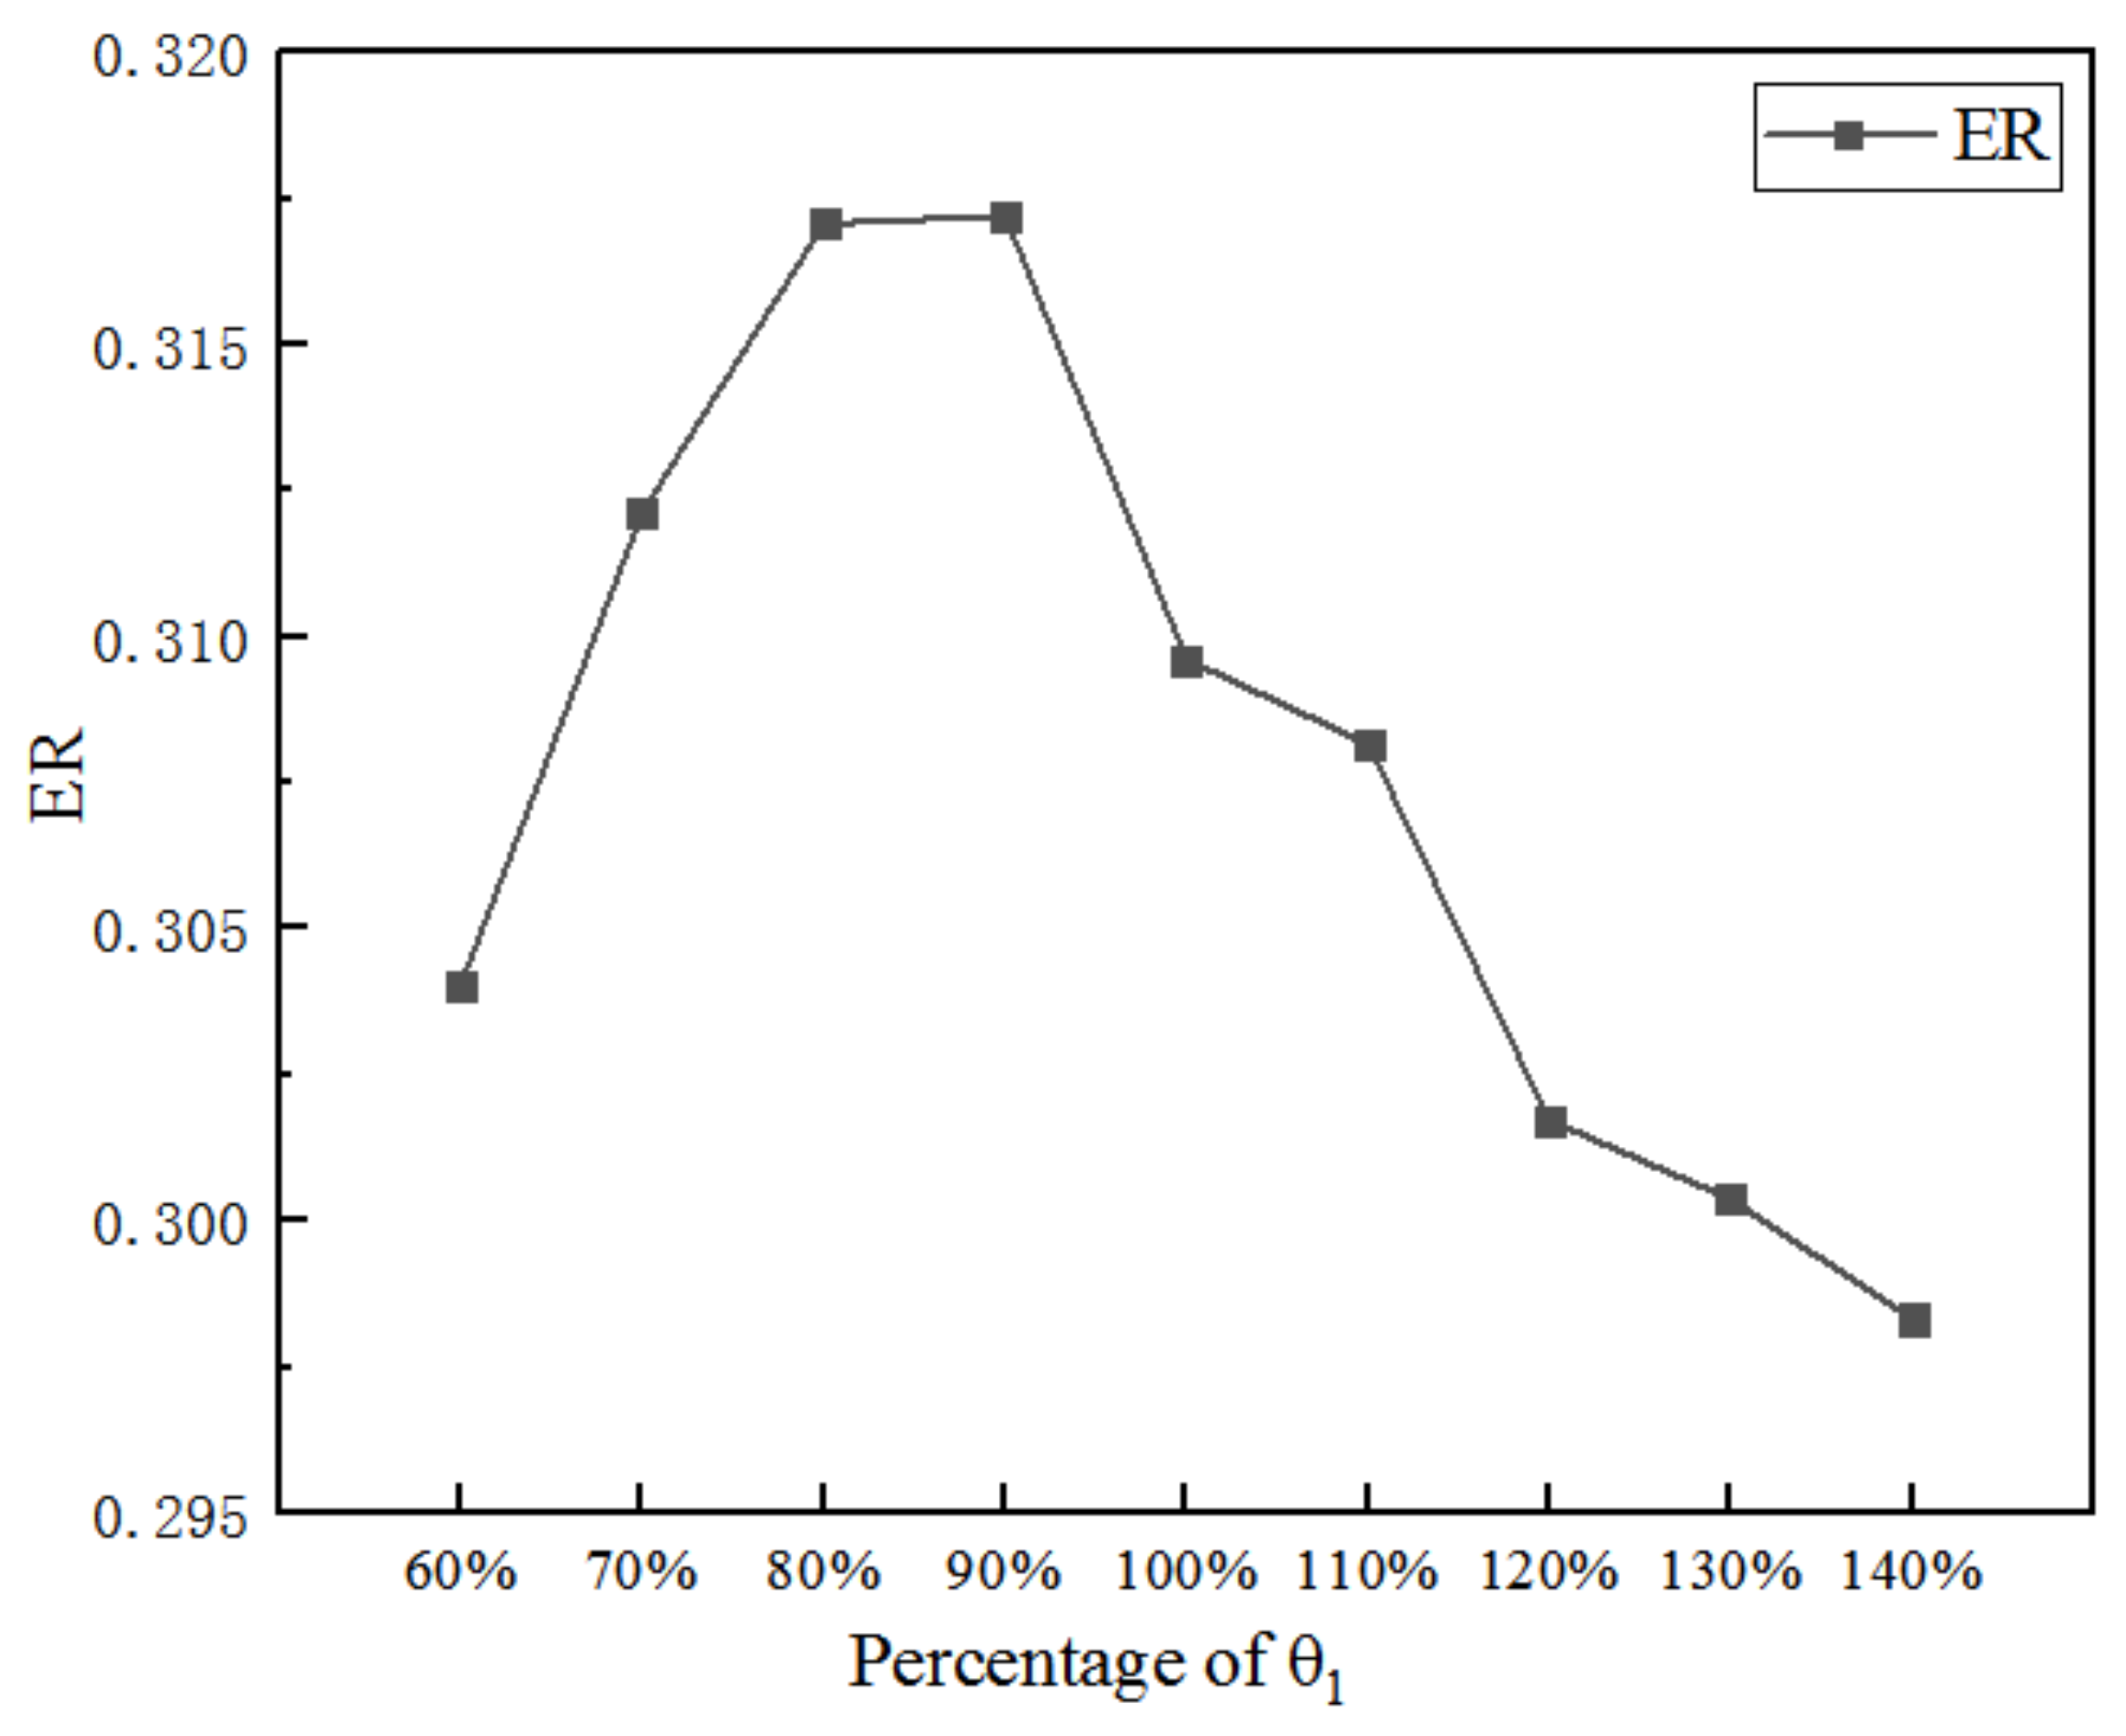
Figure 7 displays the impact of θ1 on ER. When θ1 increases from 60% (4.63°) to 140% (10.81°), ER reaches the maximum of 0.317 (the corresponding θ1 is 90%), thus, the ER increases by 2.4% over the initial ER.
In order to compare the relative sensitivity of ER to L1 and θ1, the following equation is introduced to calculate the relative sensitivity:
where, S is the relative sensitivity of ER; ERm and ERr are the maximum ER and the ER under the referred percentage of the geometry; Gm is the percentage of the geometry under maximum ER; and Gr is the referred percentage of the geometry.
For varied L1, the maximum ER is 0.318 obtained at 80% of the initial L1, and ERr and Gr are 0.31 and 100% of the initial L1, respectively, thus, the S to L1 is 0.1032. The S to θ1 is 0.2455. In comparison, the S to θ1 is relatively higher than that to L1. However, optimizing both L1 and θ1 has quite little performance improvement for the ejector, hence, it is necessary to further optimize other key geometries with varied L1 and θ1. As a result, the aim of the next section is to optimize the three key geometries under varied L1 and θ1, to evaluate the impact of varied L1 and θ1 on the optimized three key dimensions as well as the corresponding maximum ER. Especially, the three key dimensions are individually optimized with the varied L1 and θ1.
- (2)
- Individually optimizing each of the other three key geometries under varied lengths and angles of the nozzle converging section
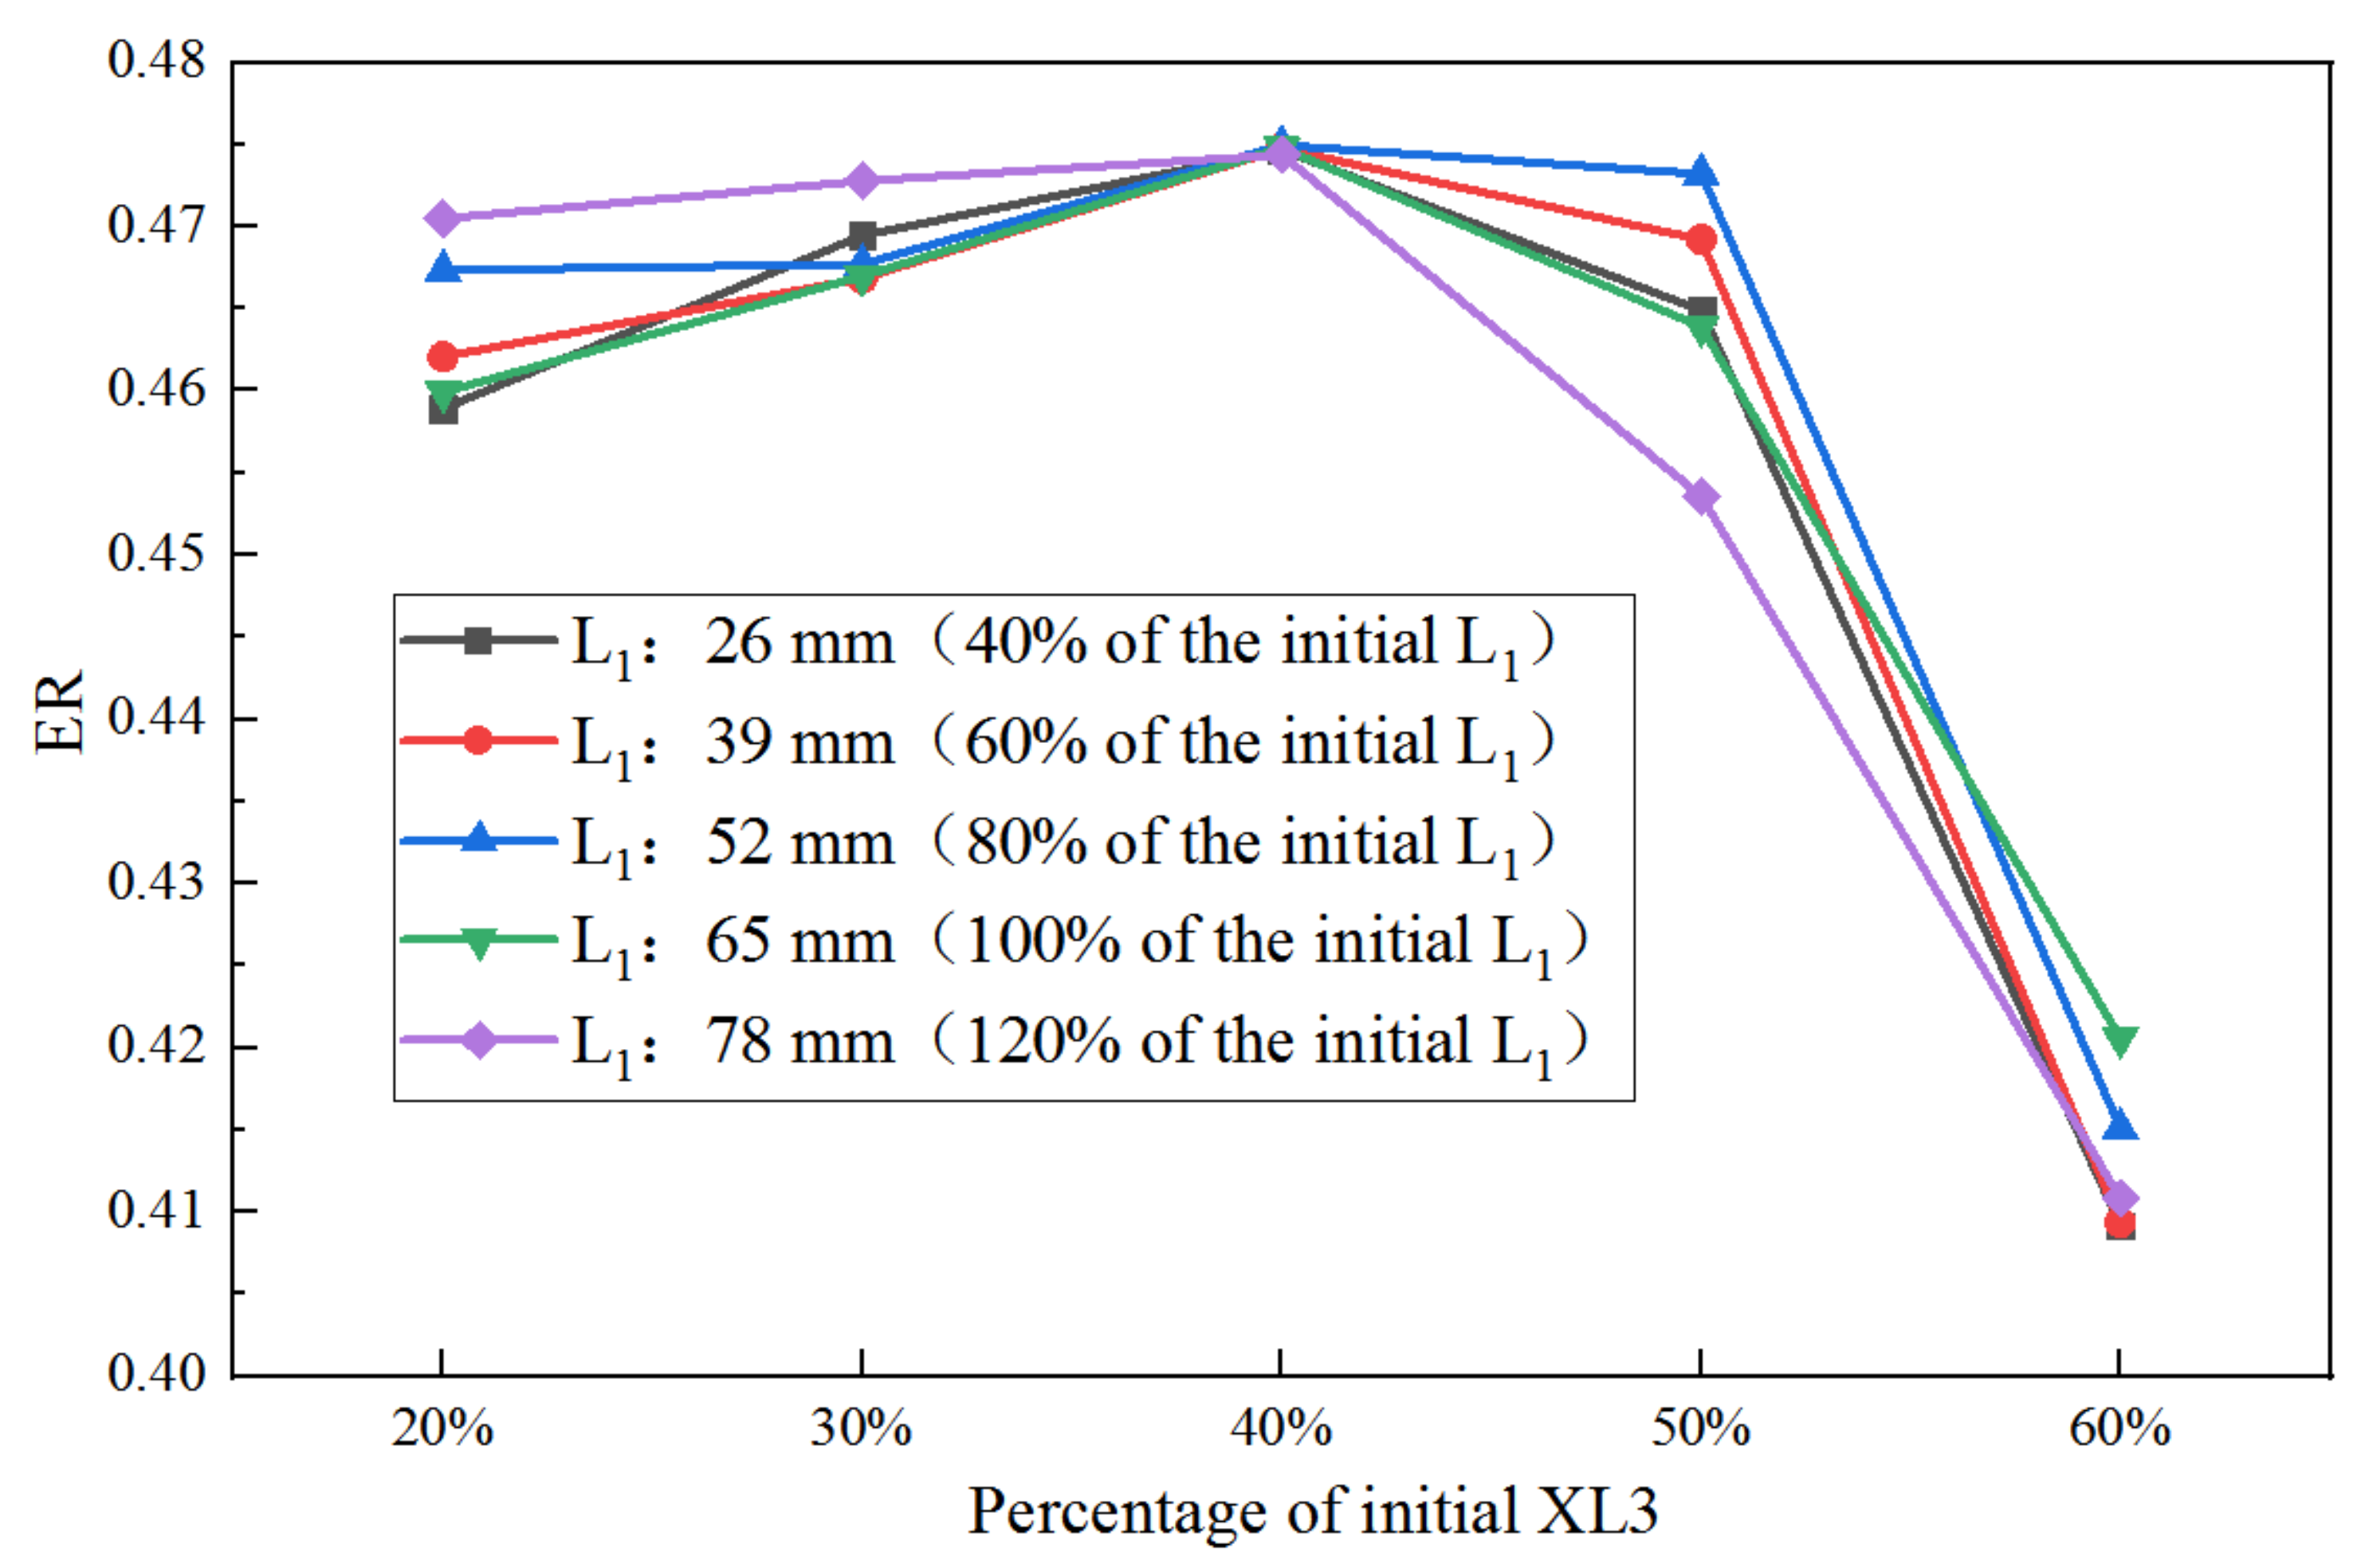
Figure 8 shows the obtained ER when XL3 is optimized under a varied percentage of L1. The change of ER with the percentage of initial XL3 under the varied percentage of L1 is presented in Figure 8. When XL3 is 20% of the initial value, the ER under L1 of 78 mm (120% of the initial value) is the maximum. When XL3 is increased to 30% of the initial value, the maximum ER can be obtained when L1 is 78 mm (120%). However, when XL3 is increased to 40% of the original size, there is almost no difference in ER at different L1 and the maximum ER is achieved at L1 of 52 mm (80%). When XL3 is increased to 50%, the highest ER can be reached when L1 is 52 mm (80%). Moreover, when XL3 is increased to 60%, the highest ER is obtained at 65 mm of L1 (100%). Obviously, a shorter converging section of the primary nozzle is needed to achieve higher ER as the increase of XL3. In addition, for given conditions, the highest S to L1 and XL3 are 0.146 and 0.243, respectively; thus, the S to XL3 is much larger than that to L1.
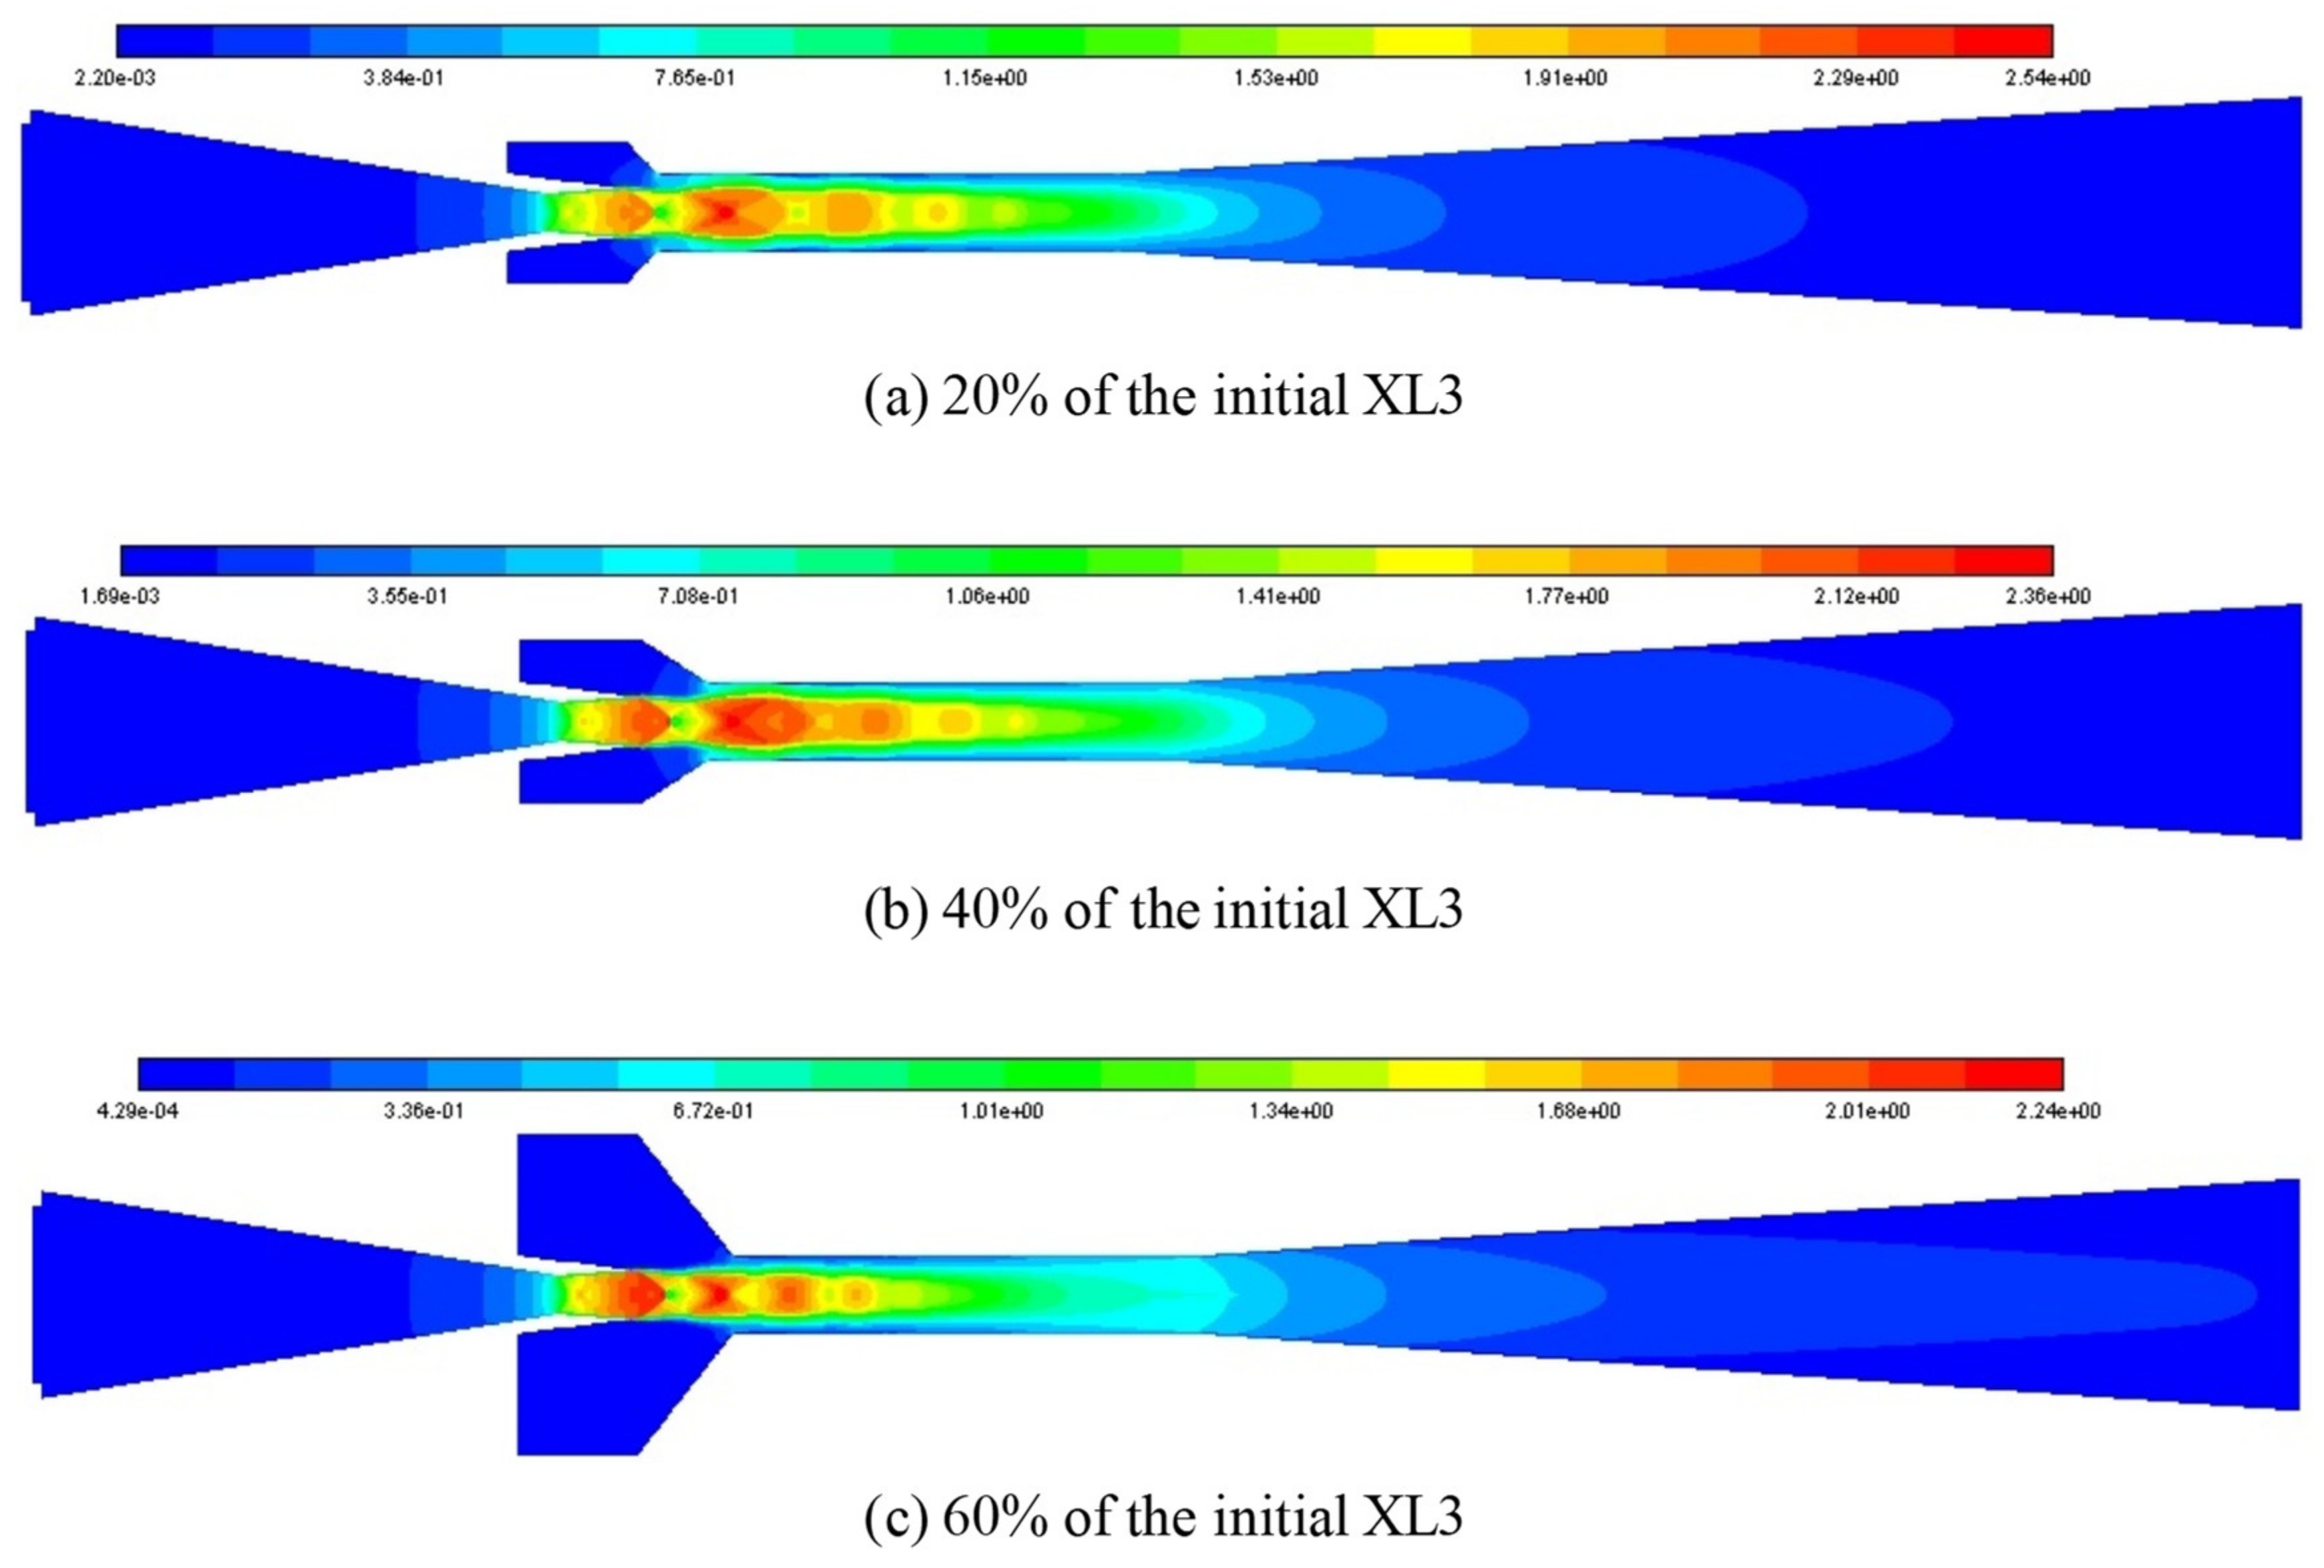
It is attempted to use the Mach number contour as illustrated in Figure 9 to analyze the impact of XL3 when XL3 increases from 20% (4 mm) to 60% (12 mm) with the interval of 20% when the L1 is 100% of its initial value. For the given three cases of XL3, the number of shock clusters in the ejector is four, and the shock intensity and the shock chain length are quite close to each other. Therefore, it is almost impossible to distinguish the difference between XL3 on ER from shock cluster number, intensity, and shock chain length. Hence, the static pressure (30–130 kPa) distribution contour is considered to analyze the effect as displayed in Figure 10. When XL3 is 20% of the initial value, the static pressure of the second and third shock clusters is the lowest, the distribution area of the low static pressure is relatively large, and the low static pressure area is quite close to the suction chamber, which has relatively strong entrainment ability. When XL3 is increased to 40% of the initial value, the low static pressure zone is bigger than in the former case, and the distance between the low static pressure zone and the suction chamber is shorter. Therefore, the ejector performance is further improved and ER reaches the maximum value. Then, when XL3 increases to 60% of the initial value, the area of the low static pressure zone become smaller, and the area of the high static pressure zone between the adjacent low static pressure zones increases, which has a negative entrainment impact.
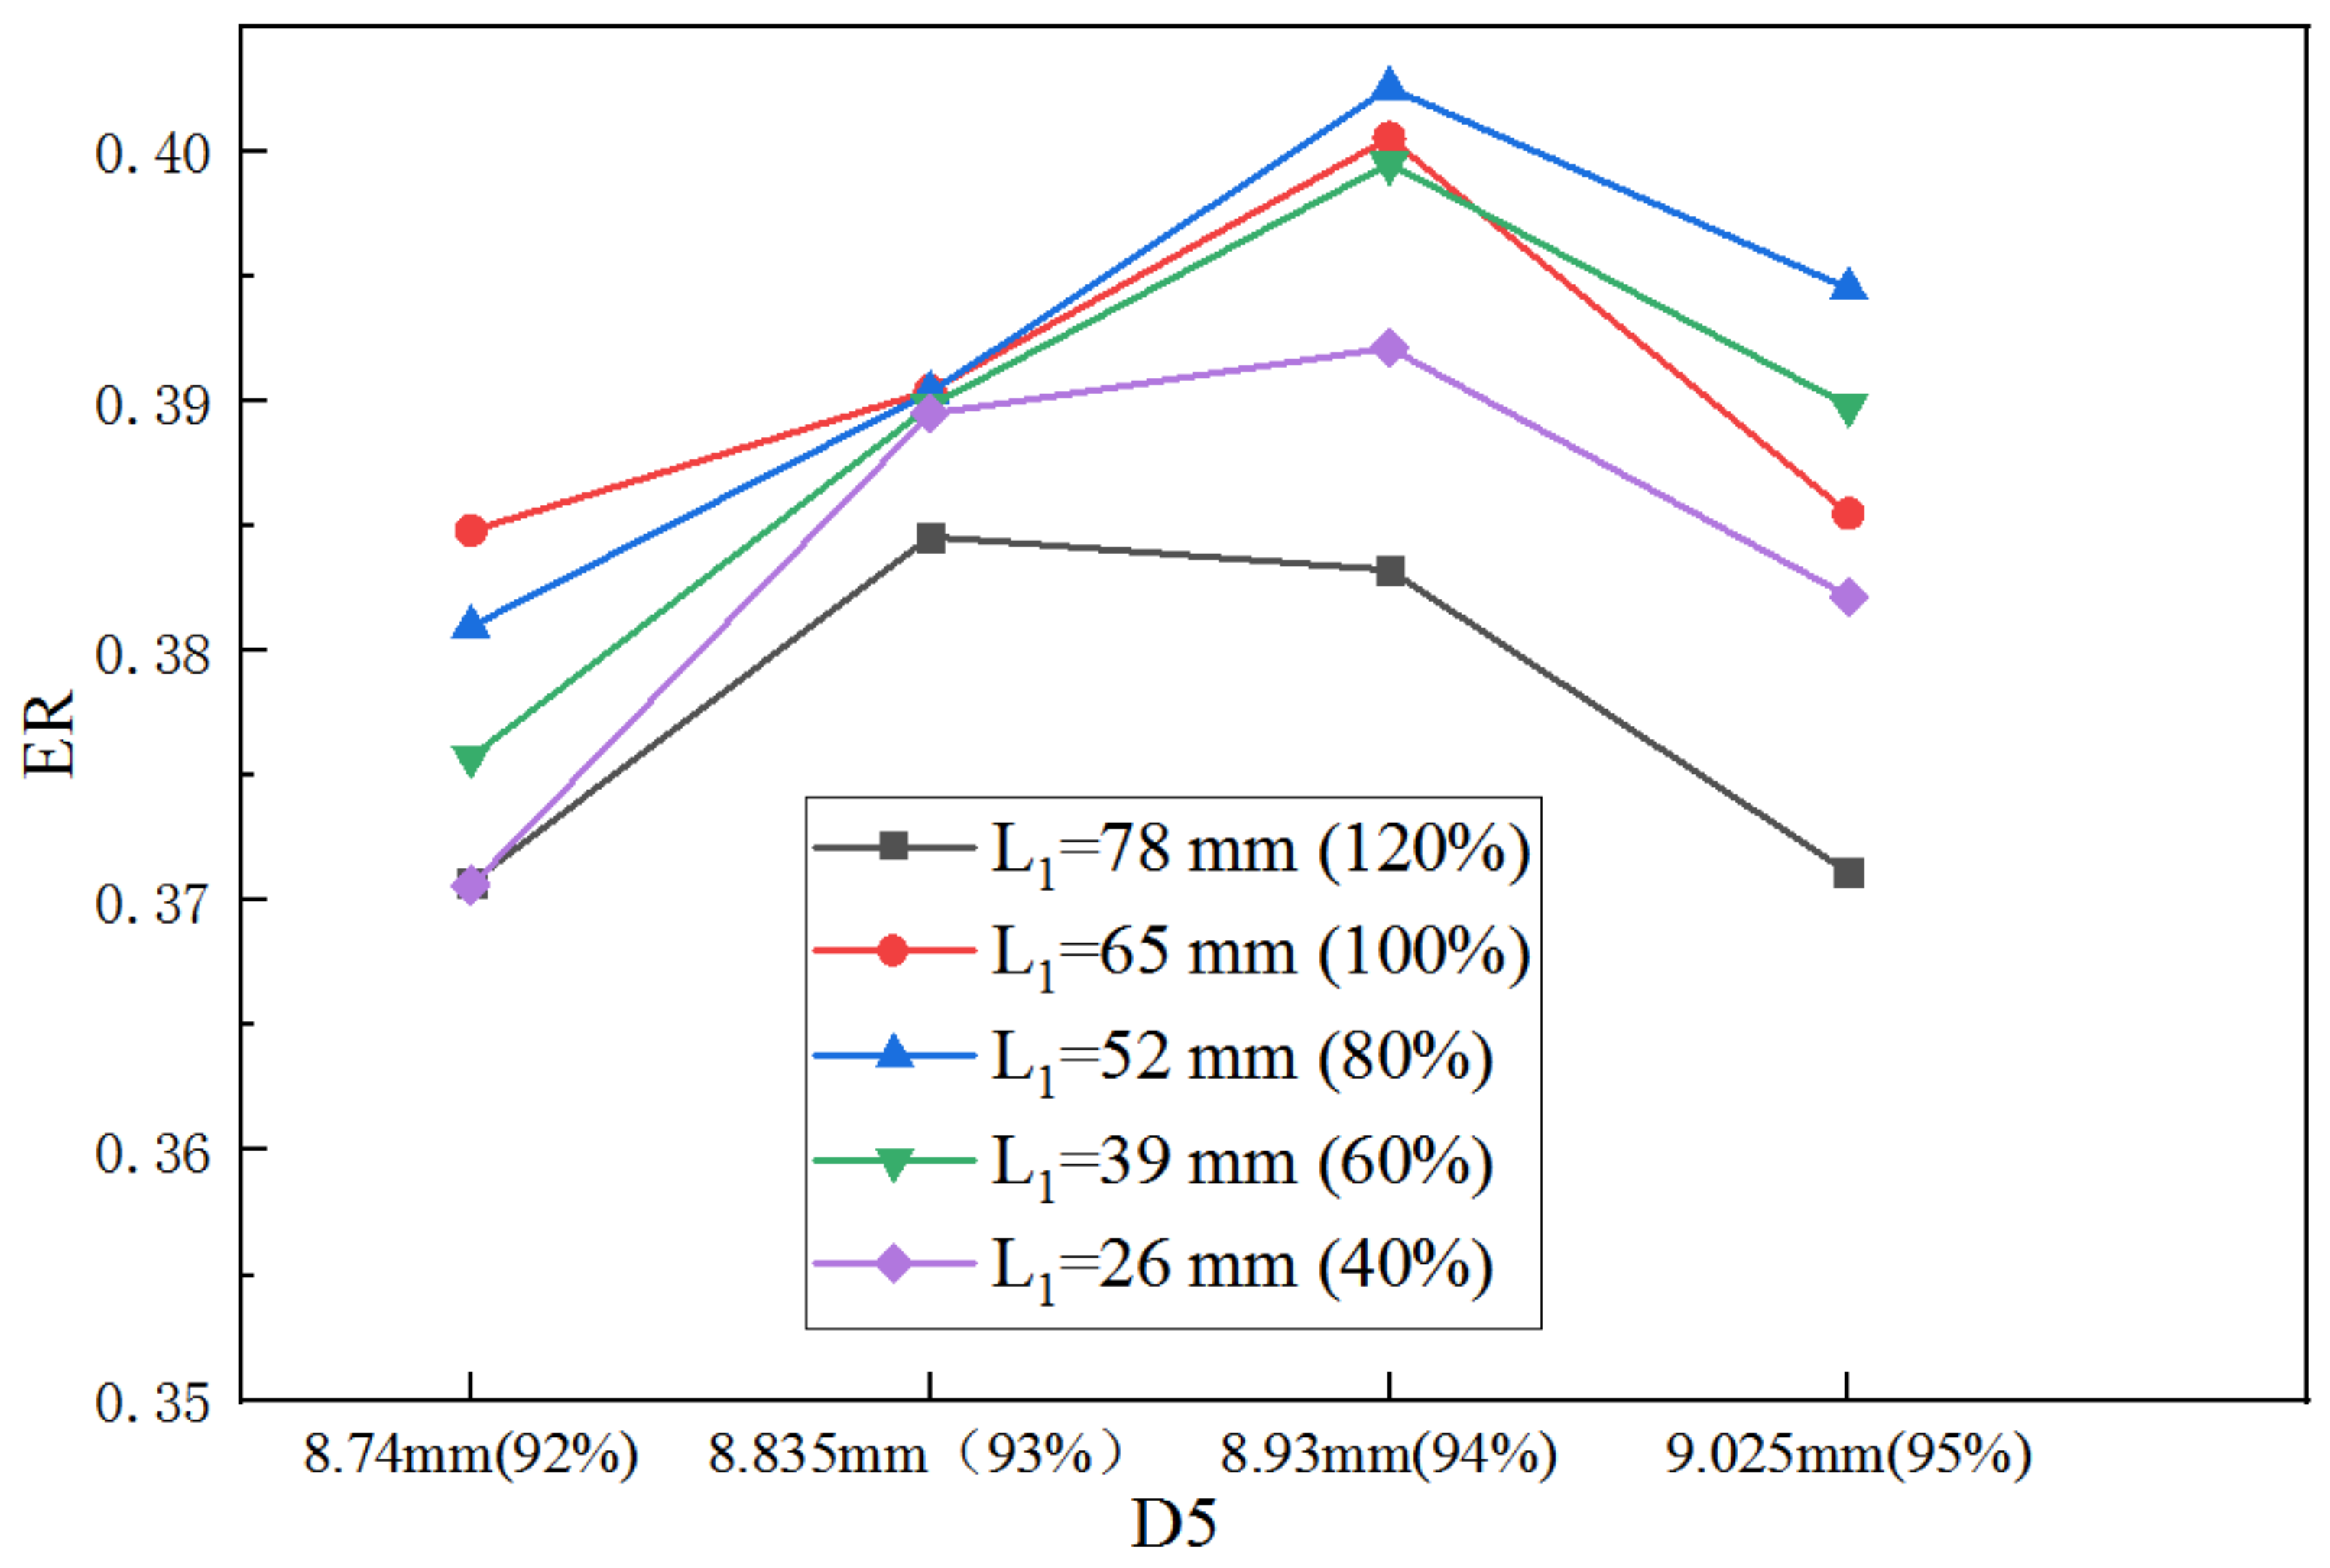
When both XL3 and XL5 are the initial values, the ER with D5 in varied L1 is shown in Figure 11. When L1 increases from 40% (26 mm) to 100% (65 mm), the largest ER is achieved at 94% of the initial D5. However, when L1 continues to increase to 120%, the D5 corresponding to the largest ER decreases to 93%. Furthermore, for all the given D5, the maximum ER can be obtained at 80% (52 mm) of the initial L1. With the same relative sensitivity analysis method, the maximum S to L1 is 0.203 and that to D5 is 3.63. It can be seen that S to D5 is much greater than that to L1.
When both the XL3 and D5 are the initial values, the ER with XL5 at varied L1 is presented in Figure 12. When L1 varies from 40% to 100%, the highest ER is obtained at 50% of the initial XL5. When L1 rises to 120%, the best XL5 is achieved at 70% of the initial value. Moreover, for given XL5, the calculated largest S to L1 under different XL5 is 0.409, while the maximum S to XL5 under different L1 is 0.424, thus, the difference between the two can be ignored.
Therefore, according to the above-mentioned results, it can be seen that the varied L1 has a different impact on the optimal three key dimensions and associated maximum ER. The impact of varied θ1 on the optimal three key dimensions and associated maximum ER is investigated as follows.
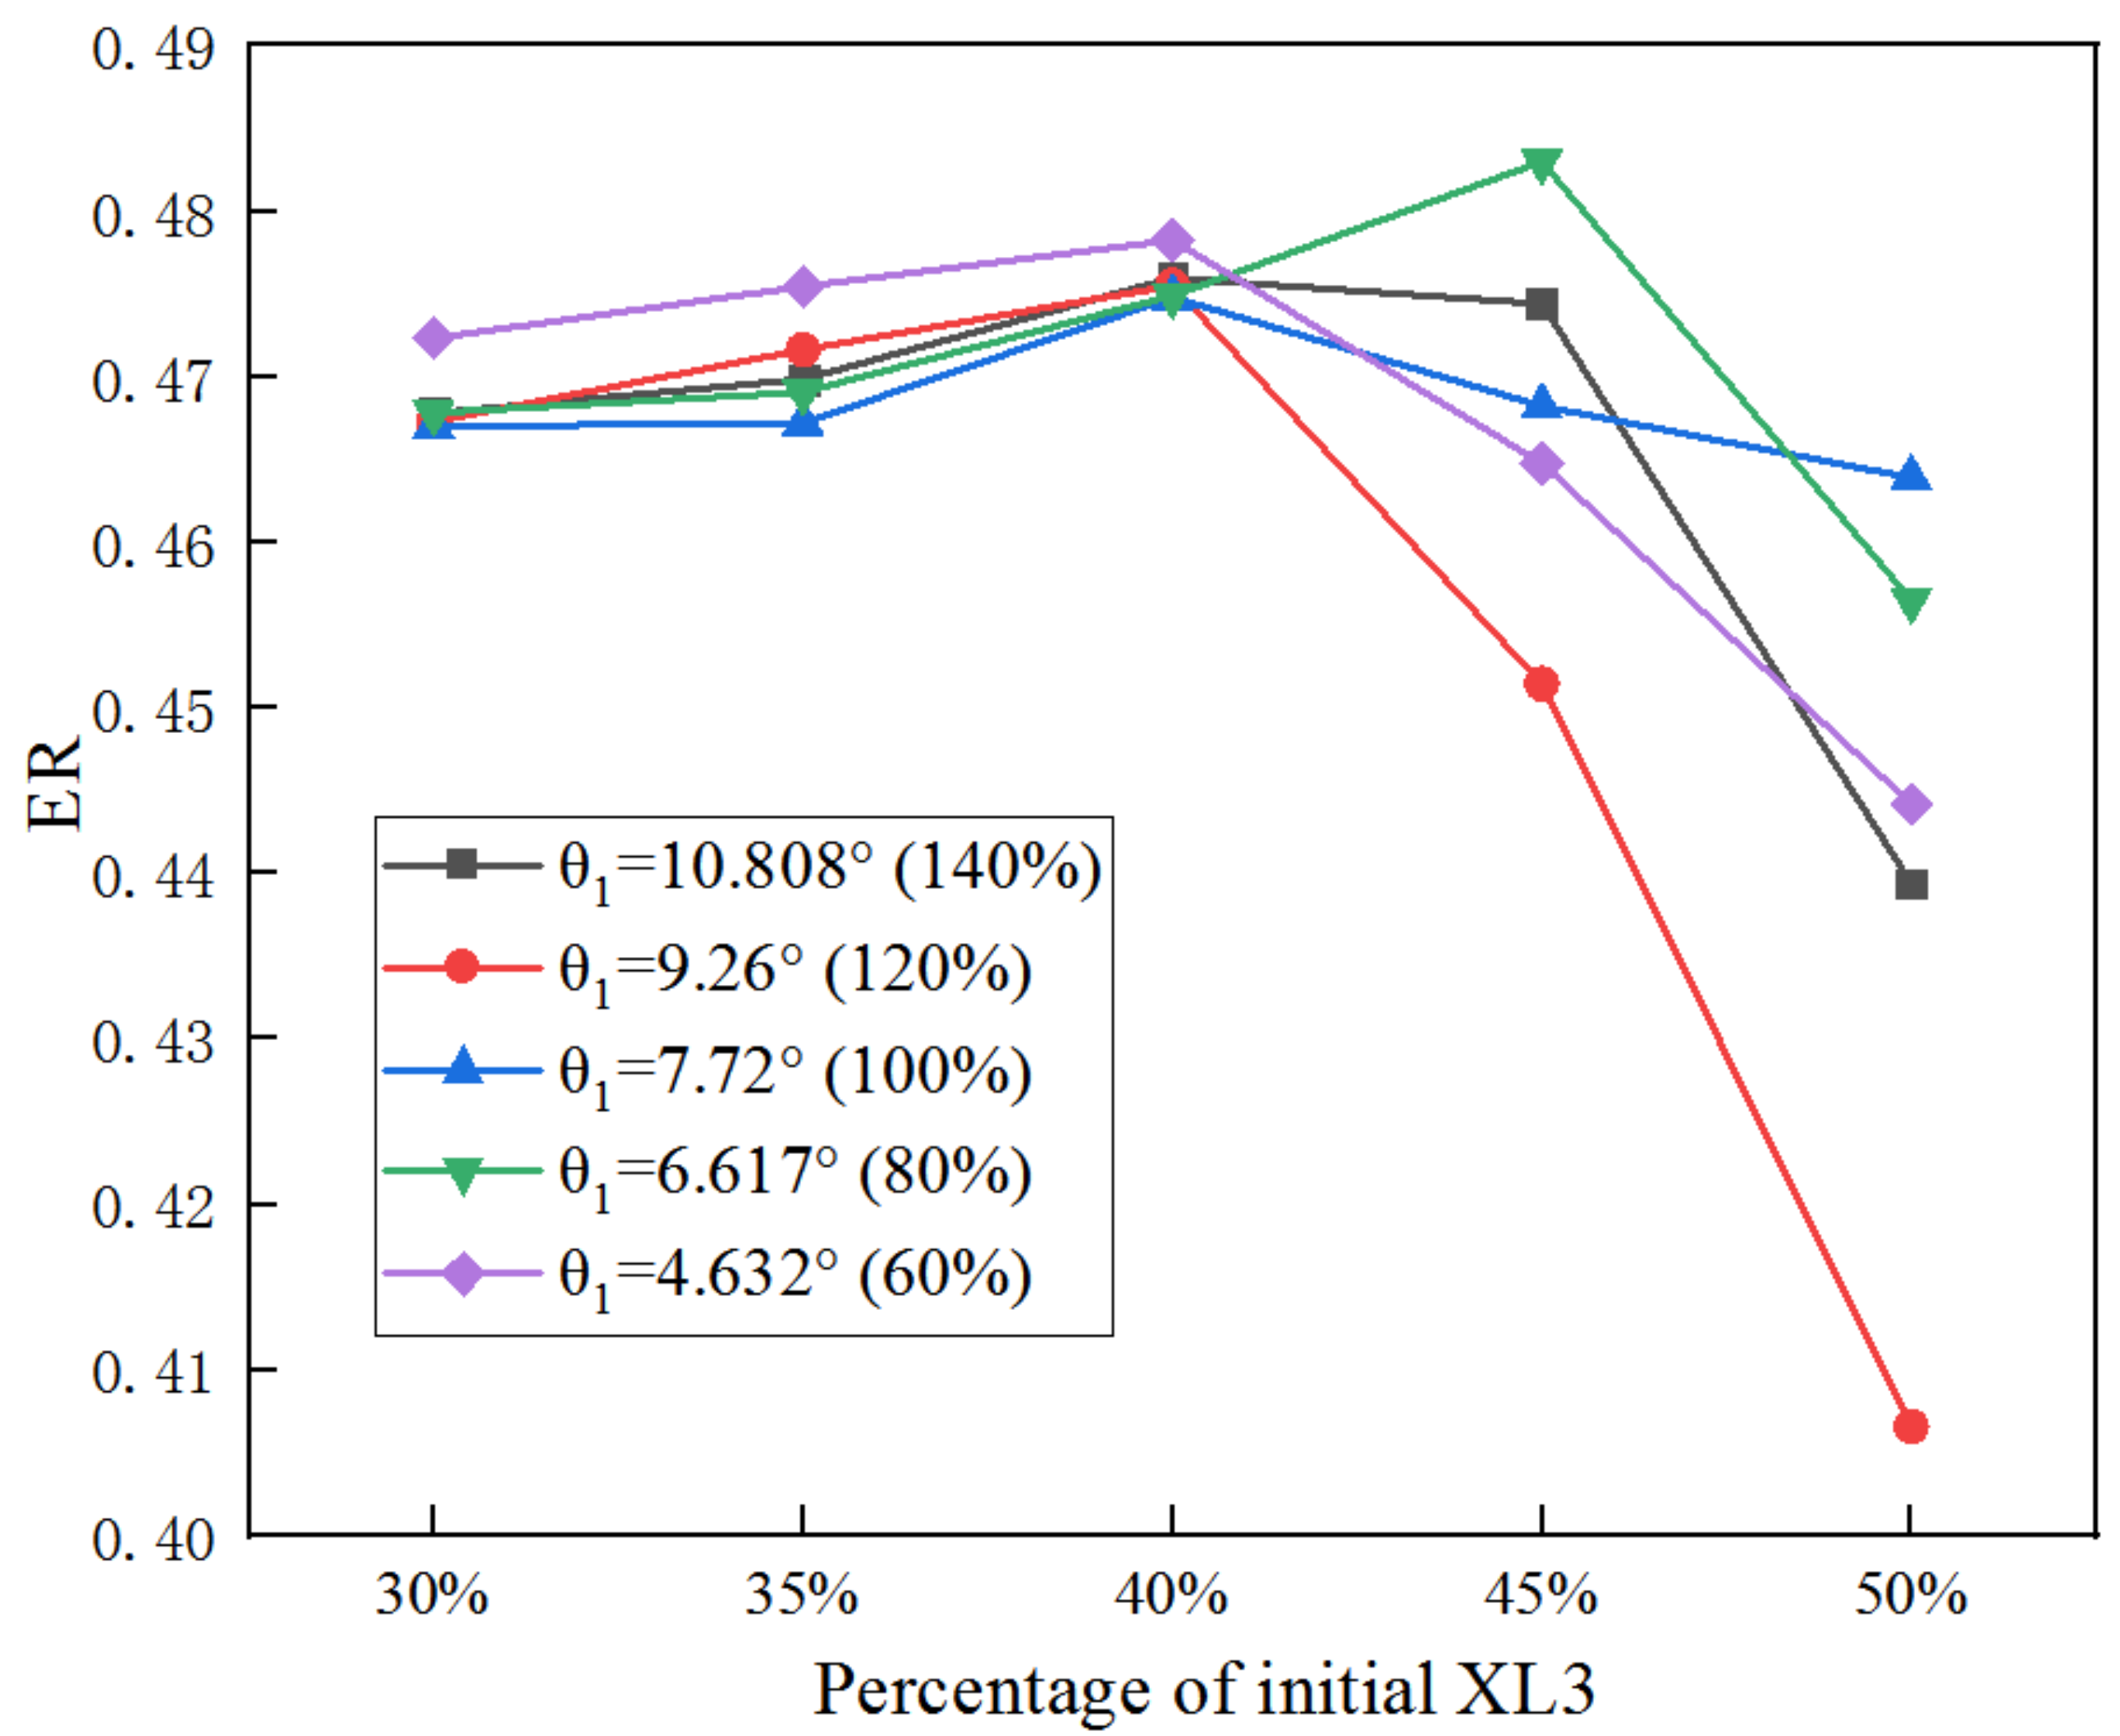
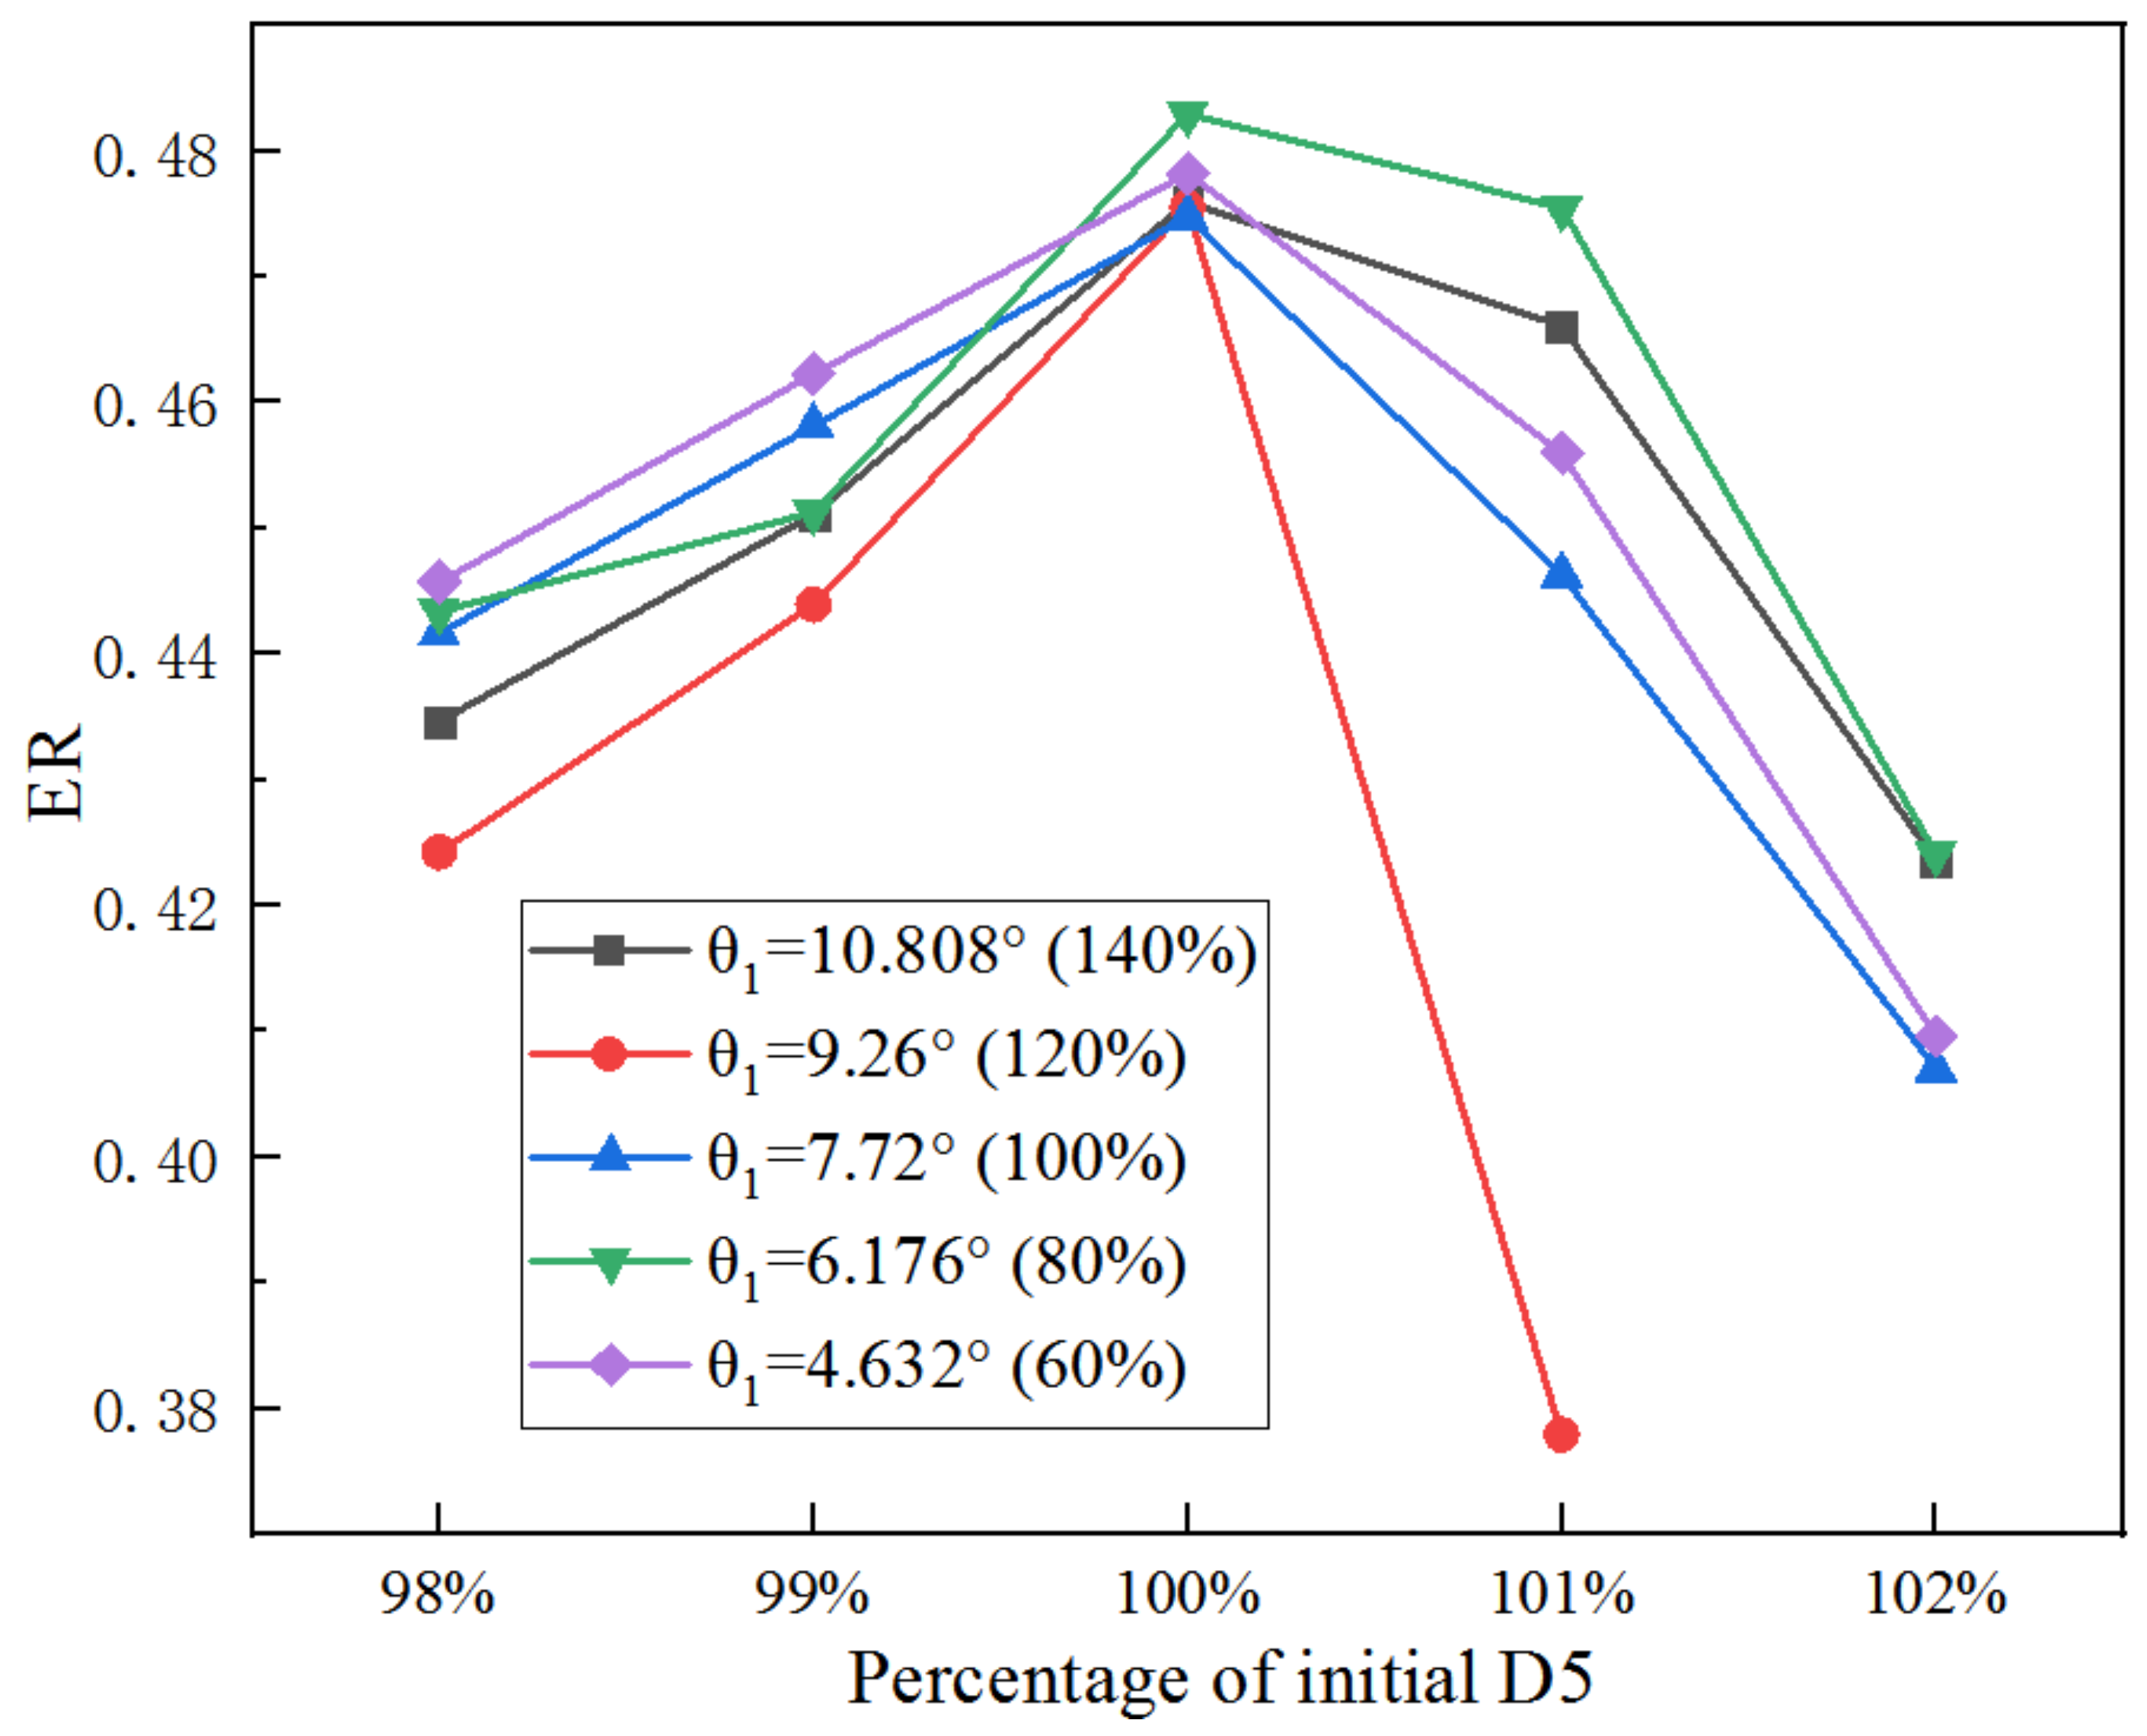
Figure 13 shows the obtained ER when XL3 is individually optimized under different θ1. When XL3 increases from 30% to 50% of the initial size at an interval of 5%, ER gradually increases first and then decreases. When XL3 varies from 30% to 40% of the initial size, ER reaches the maximum value at θ1 of 60% of the initial value; when XL3 achieves 45% of its initial value, the θ1 is 80% of the initial value (6.617°) which offers the maximum ER; and when XL3 achieves 50% of its initial value, the maximum ER can be gained when the θ1 is 100% of the initial value. Thus, with the increase of XL3, larger θ1 is needed to achieve higher ER.
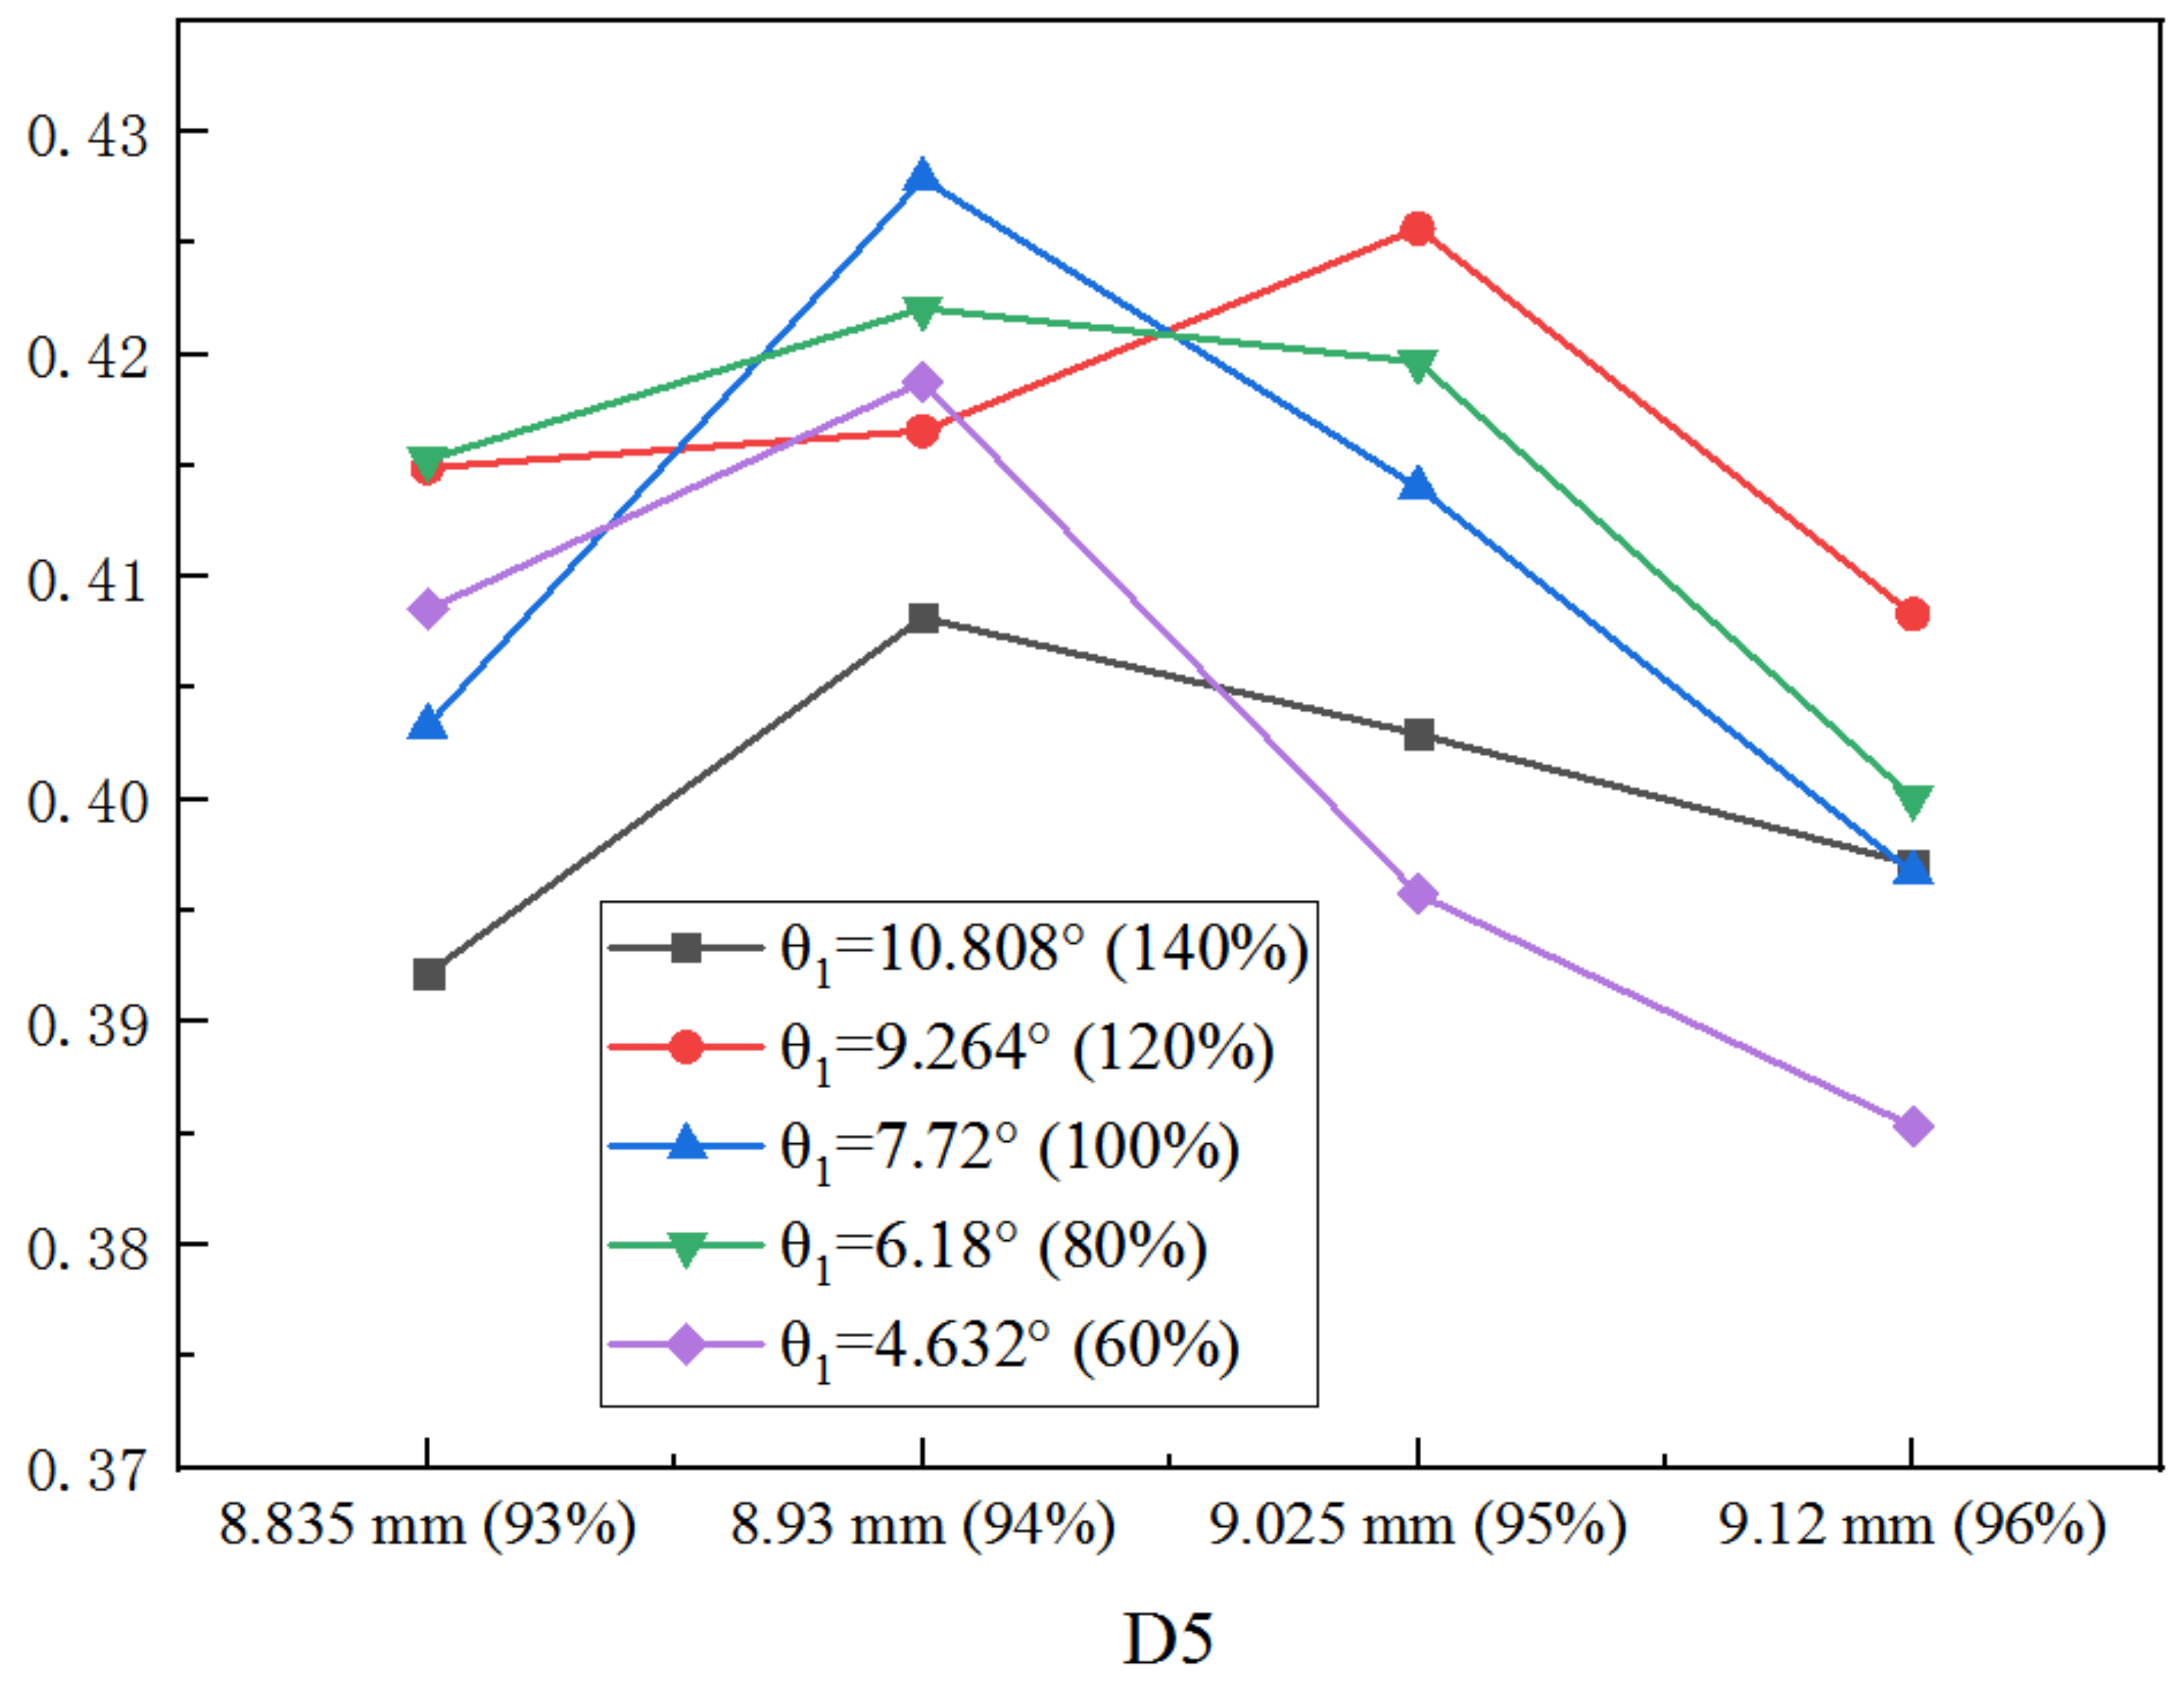
In the same way, when D5 is optimized alone under varied θ1, the optimization results are presented in Figure 14. The optimal D5 is at 94% of the initial value except for that of 80% of the initial θ1. In addition, the maximum ER is obtained when θ1 is the original value. In addition, with the increase of D5, larger θ1 is required to achieve better ER.
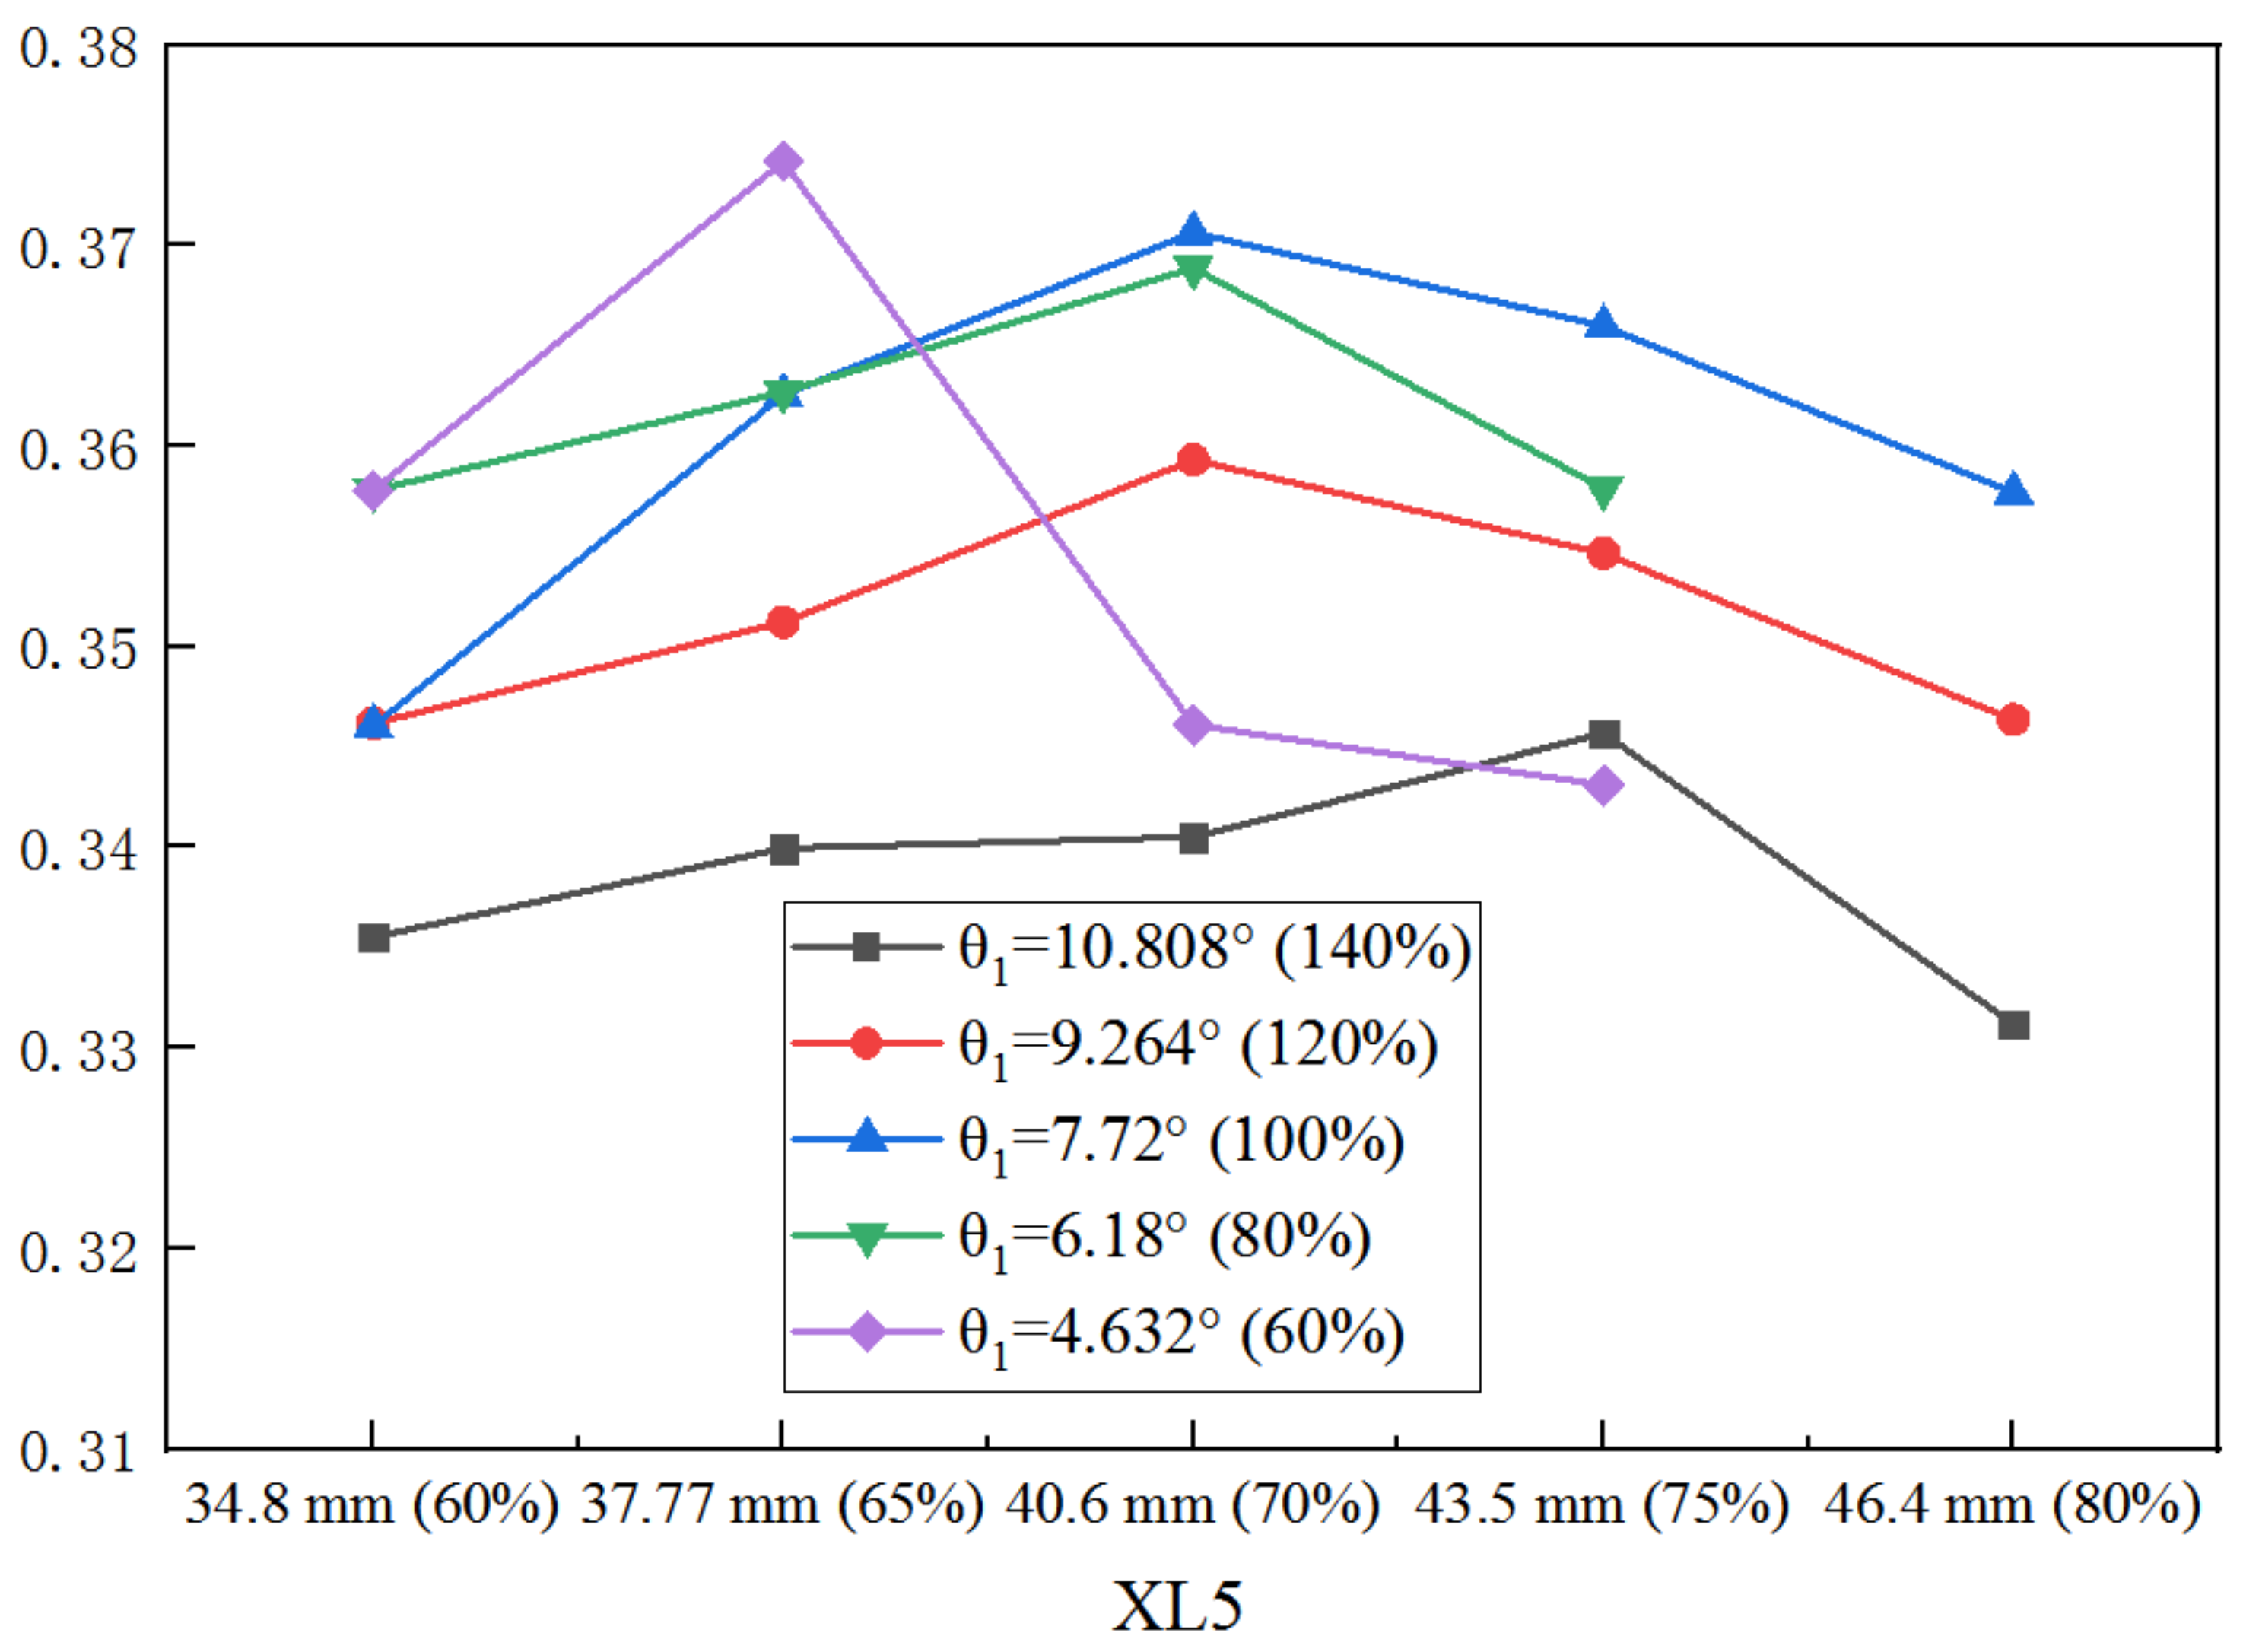
Likewise, the variation of ER with XL5 under varied θ1 is illustrated in Figure 15, when both the XL3 and D5 are the initial values. When θ1 is 60% of the initial value, the optimal XL5 is obtained at 65% of the initial value; when θ1 increases to 80%, 100%, and 120% of the initial value, the optimal XL5 increases to 70%; when θ1 continues to increase to 140%, the optimum XL5 increases to 75%. That is to say, with the increase of XL5, larger θ1 is required to reach a larger ER.
From the above optimization results, for most of the cases, with the increase of the three geometries, larger L1 and θ1 are required to achieve higher ER; however, the ejector performance improves limited with the three geometries optimized individually. As mentioned in our previous study [23], the ER can be obviously enhanced if the three geometries are optimized in the order of XL3→D5→XL5, therefore, the key geometries under different L1 and θ1 are optimized in this order as presented in the following section.
- (3)
- Sequentially optimizing the three key geometries under varied lengths and angles of the nozzle converging section
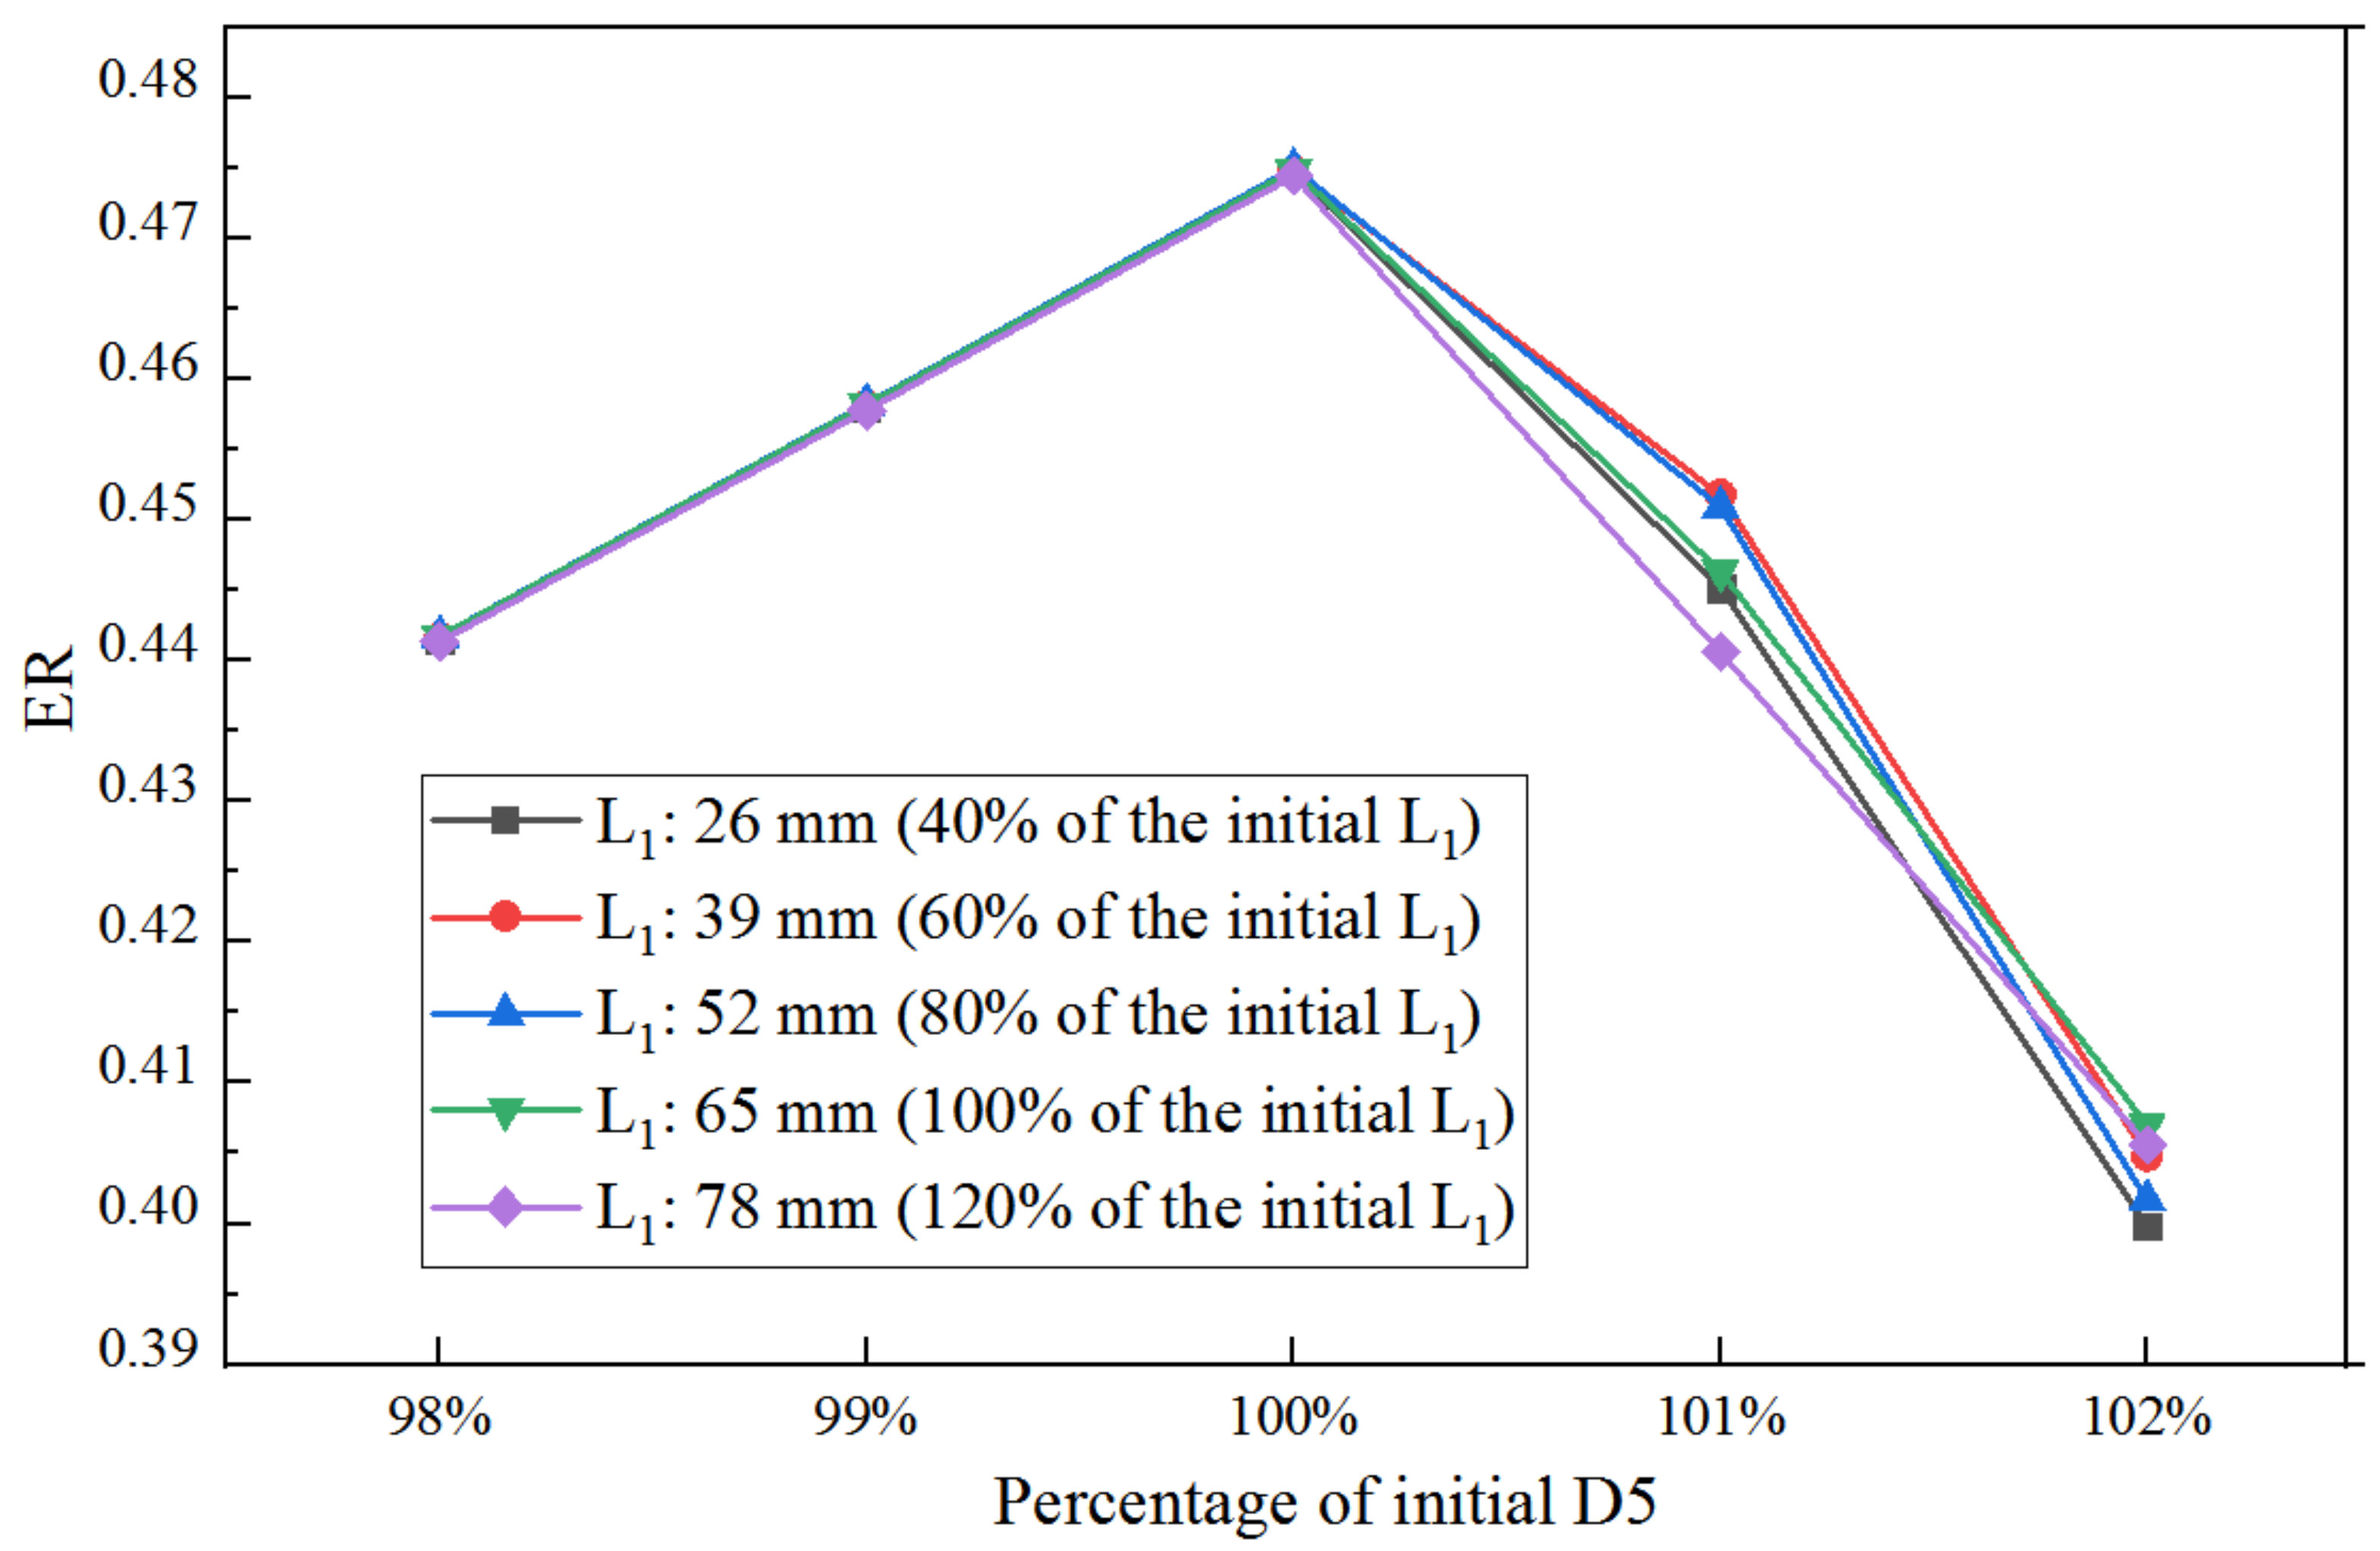
With the optimized XL3, the optimization of D5 under varied length of the nozzle converging section is shown in Figure 16.
As presented in Figure 16 and Table 3, the ER with D5 at varied L1 is basically similar. As D5 increases from 98% of the initial value to 100%, there is a negligible difference between ER with L1 for each D5. When D5 increases to 101% of the initial size, the gap of ER at different L1 is relatively evident, and the maximum ER achieves at L1 of 39 mm (60%). However, when D5 increases to 102% of the initial size, ER reaches its maximum value at L1 of 65 mm (100%). Thus, with the increase of D5, a larger L1 is needed to achieve higher ER. The above-mentioned results are similar to that of Figure 11; however, the difference between them is that the optimal D5 and corresponding maximum ER under the sequential optimization are larger than those under individual optimization.
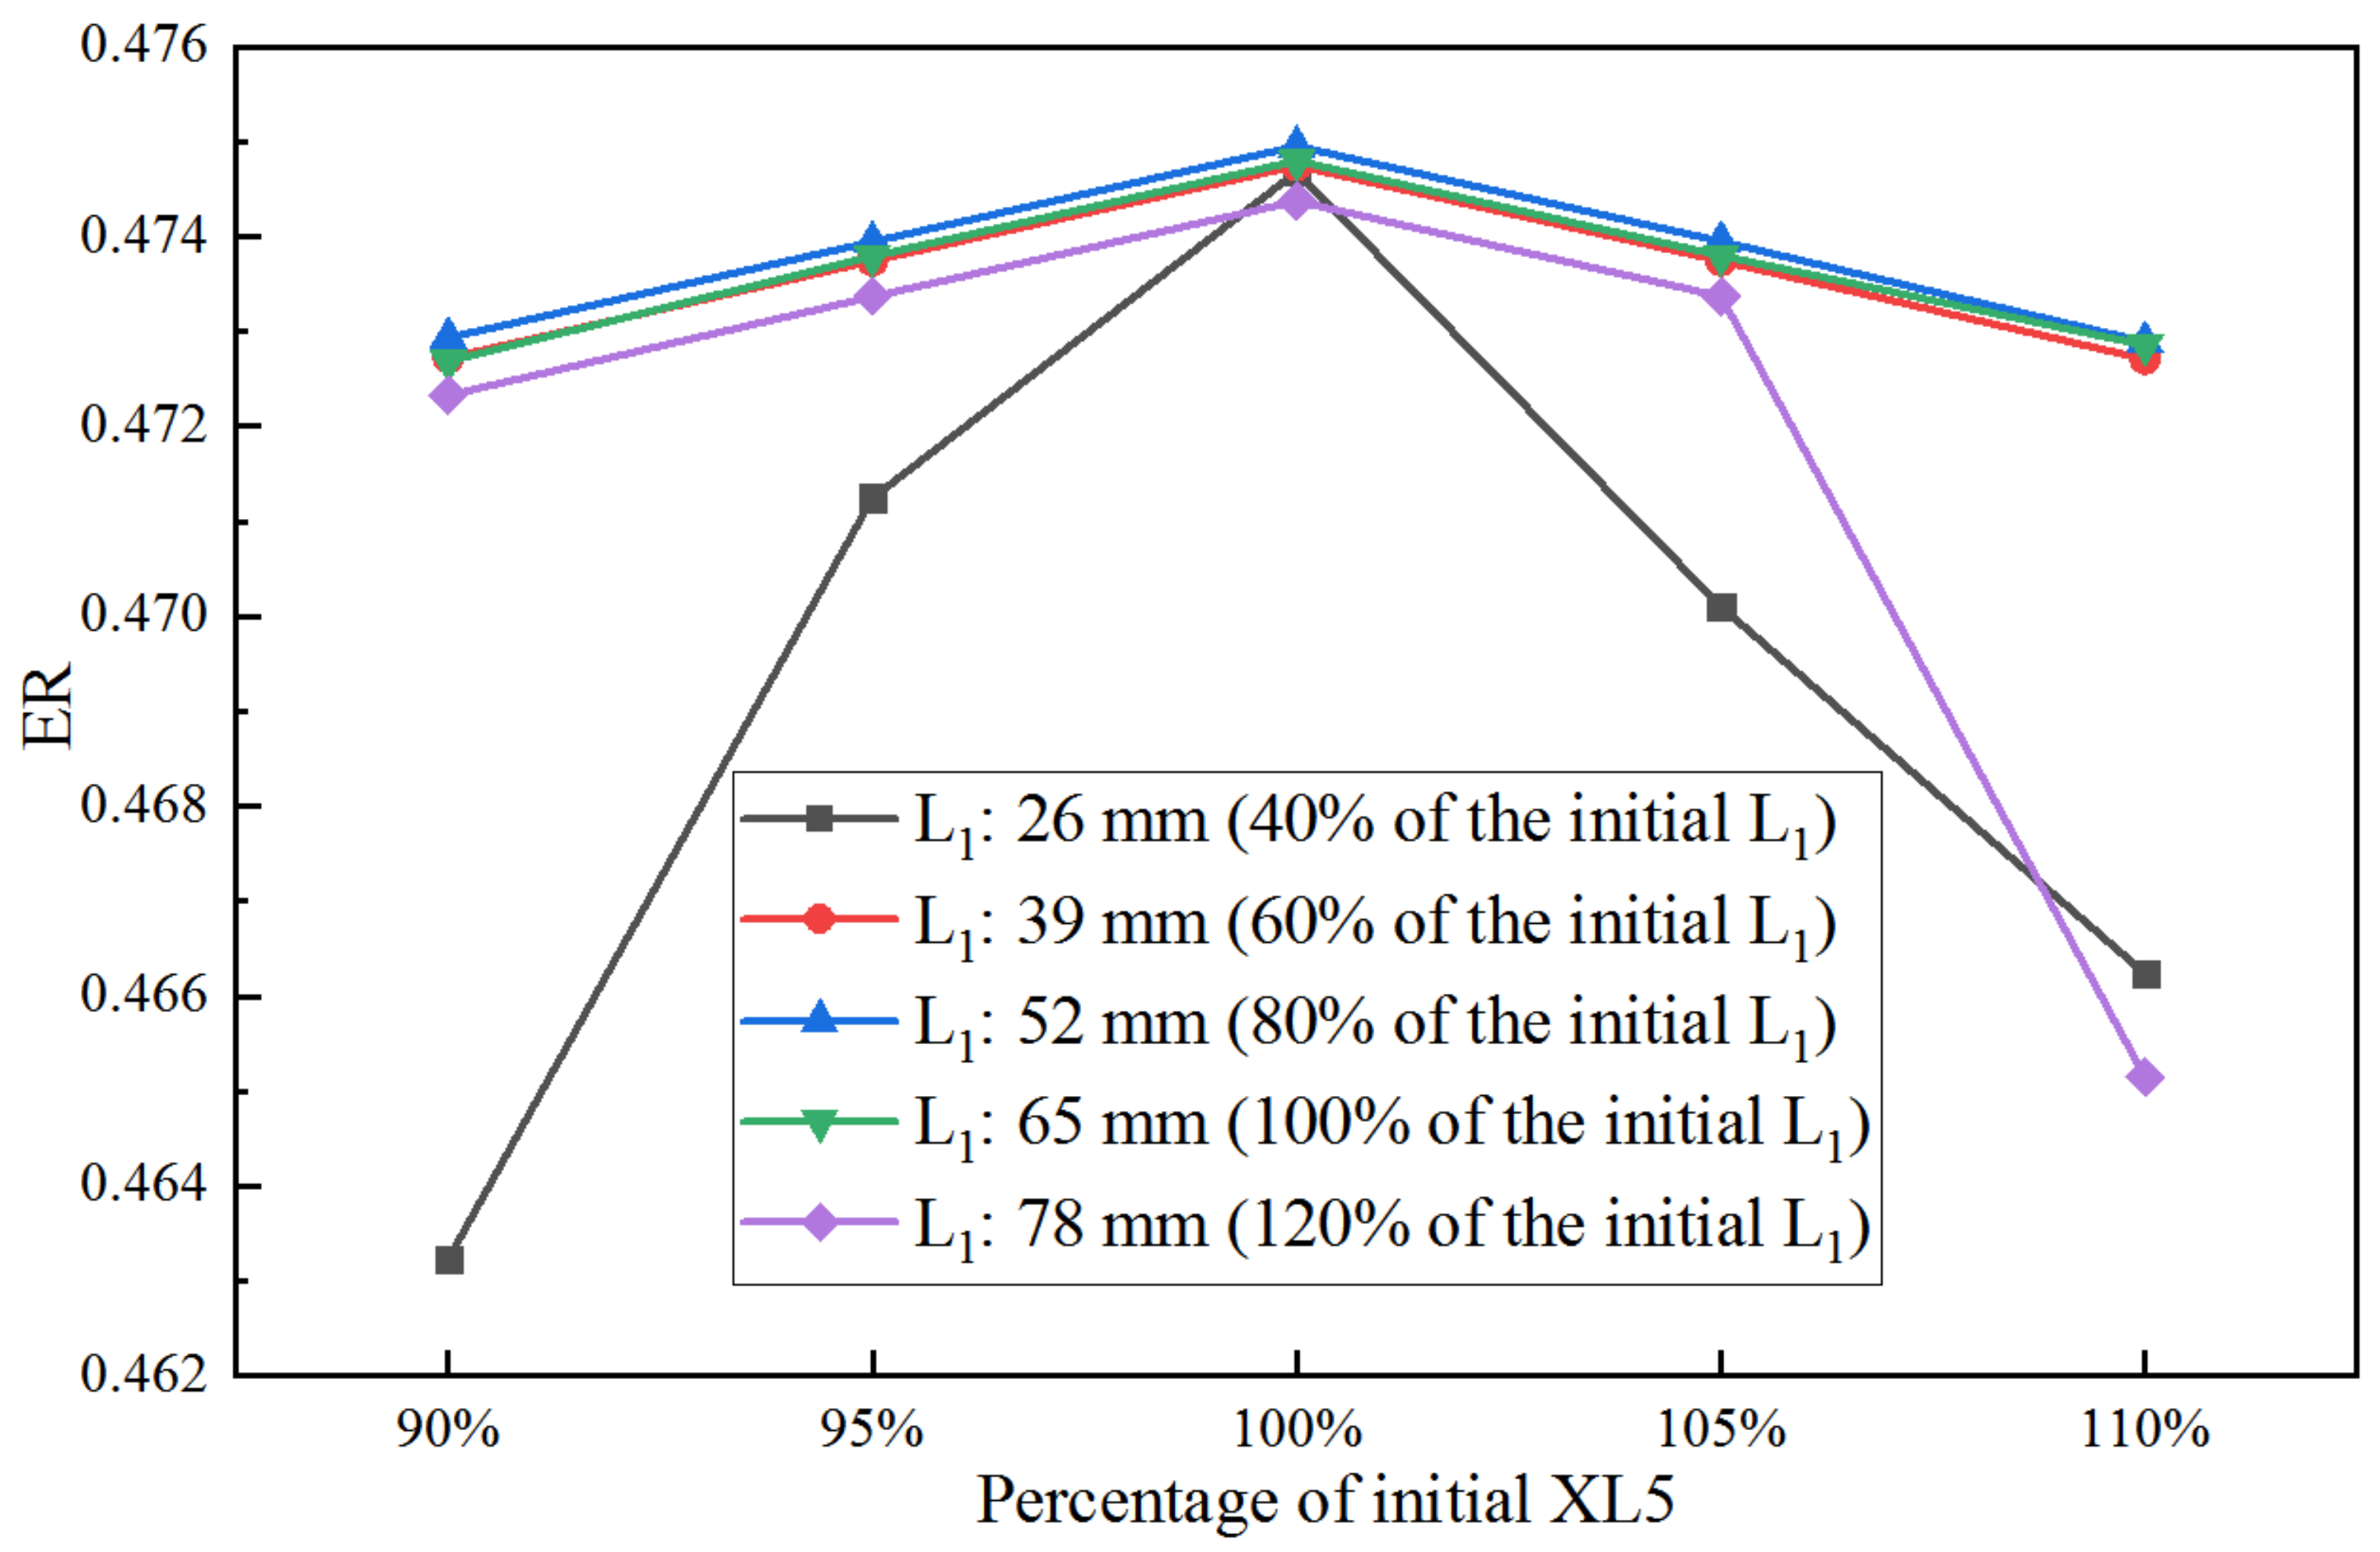
Under the same sequential optimization of XL3→D5→XL5, the f ER with XL5 at varied L1 is displayed in Figure 17. For each XL5, ER achieves the maximum value when L1 is 52 mm (80%).
The change of ER with D5 based on optimal XL3 under different θ1 is presented in Figure 18. As shown in Figure 18, for D5, the maximum ER is obtained at 100% of the initial D5 under given θ1. However, when D5 rises from 98% to 99% of the original size, the ER under the θ1 of 4.26° is greater than that of other cases of θ1; when D5 is increased to more than 100% of the initial value, the ER under θ1 of 7.04° is greater than other cases. Thus, a larger θ1 leads to a greater maximum ER when D5 increases.
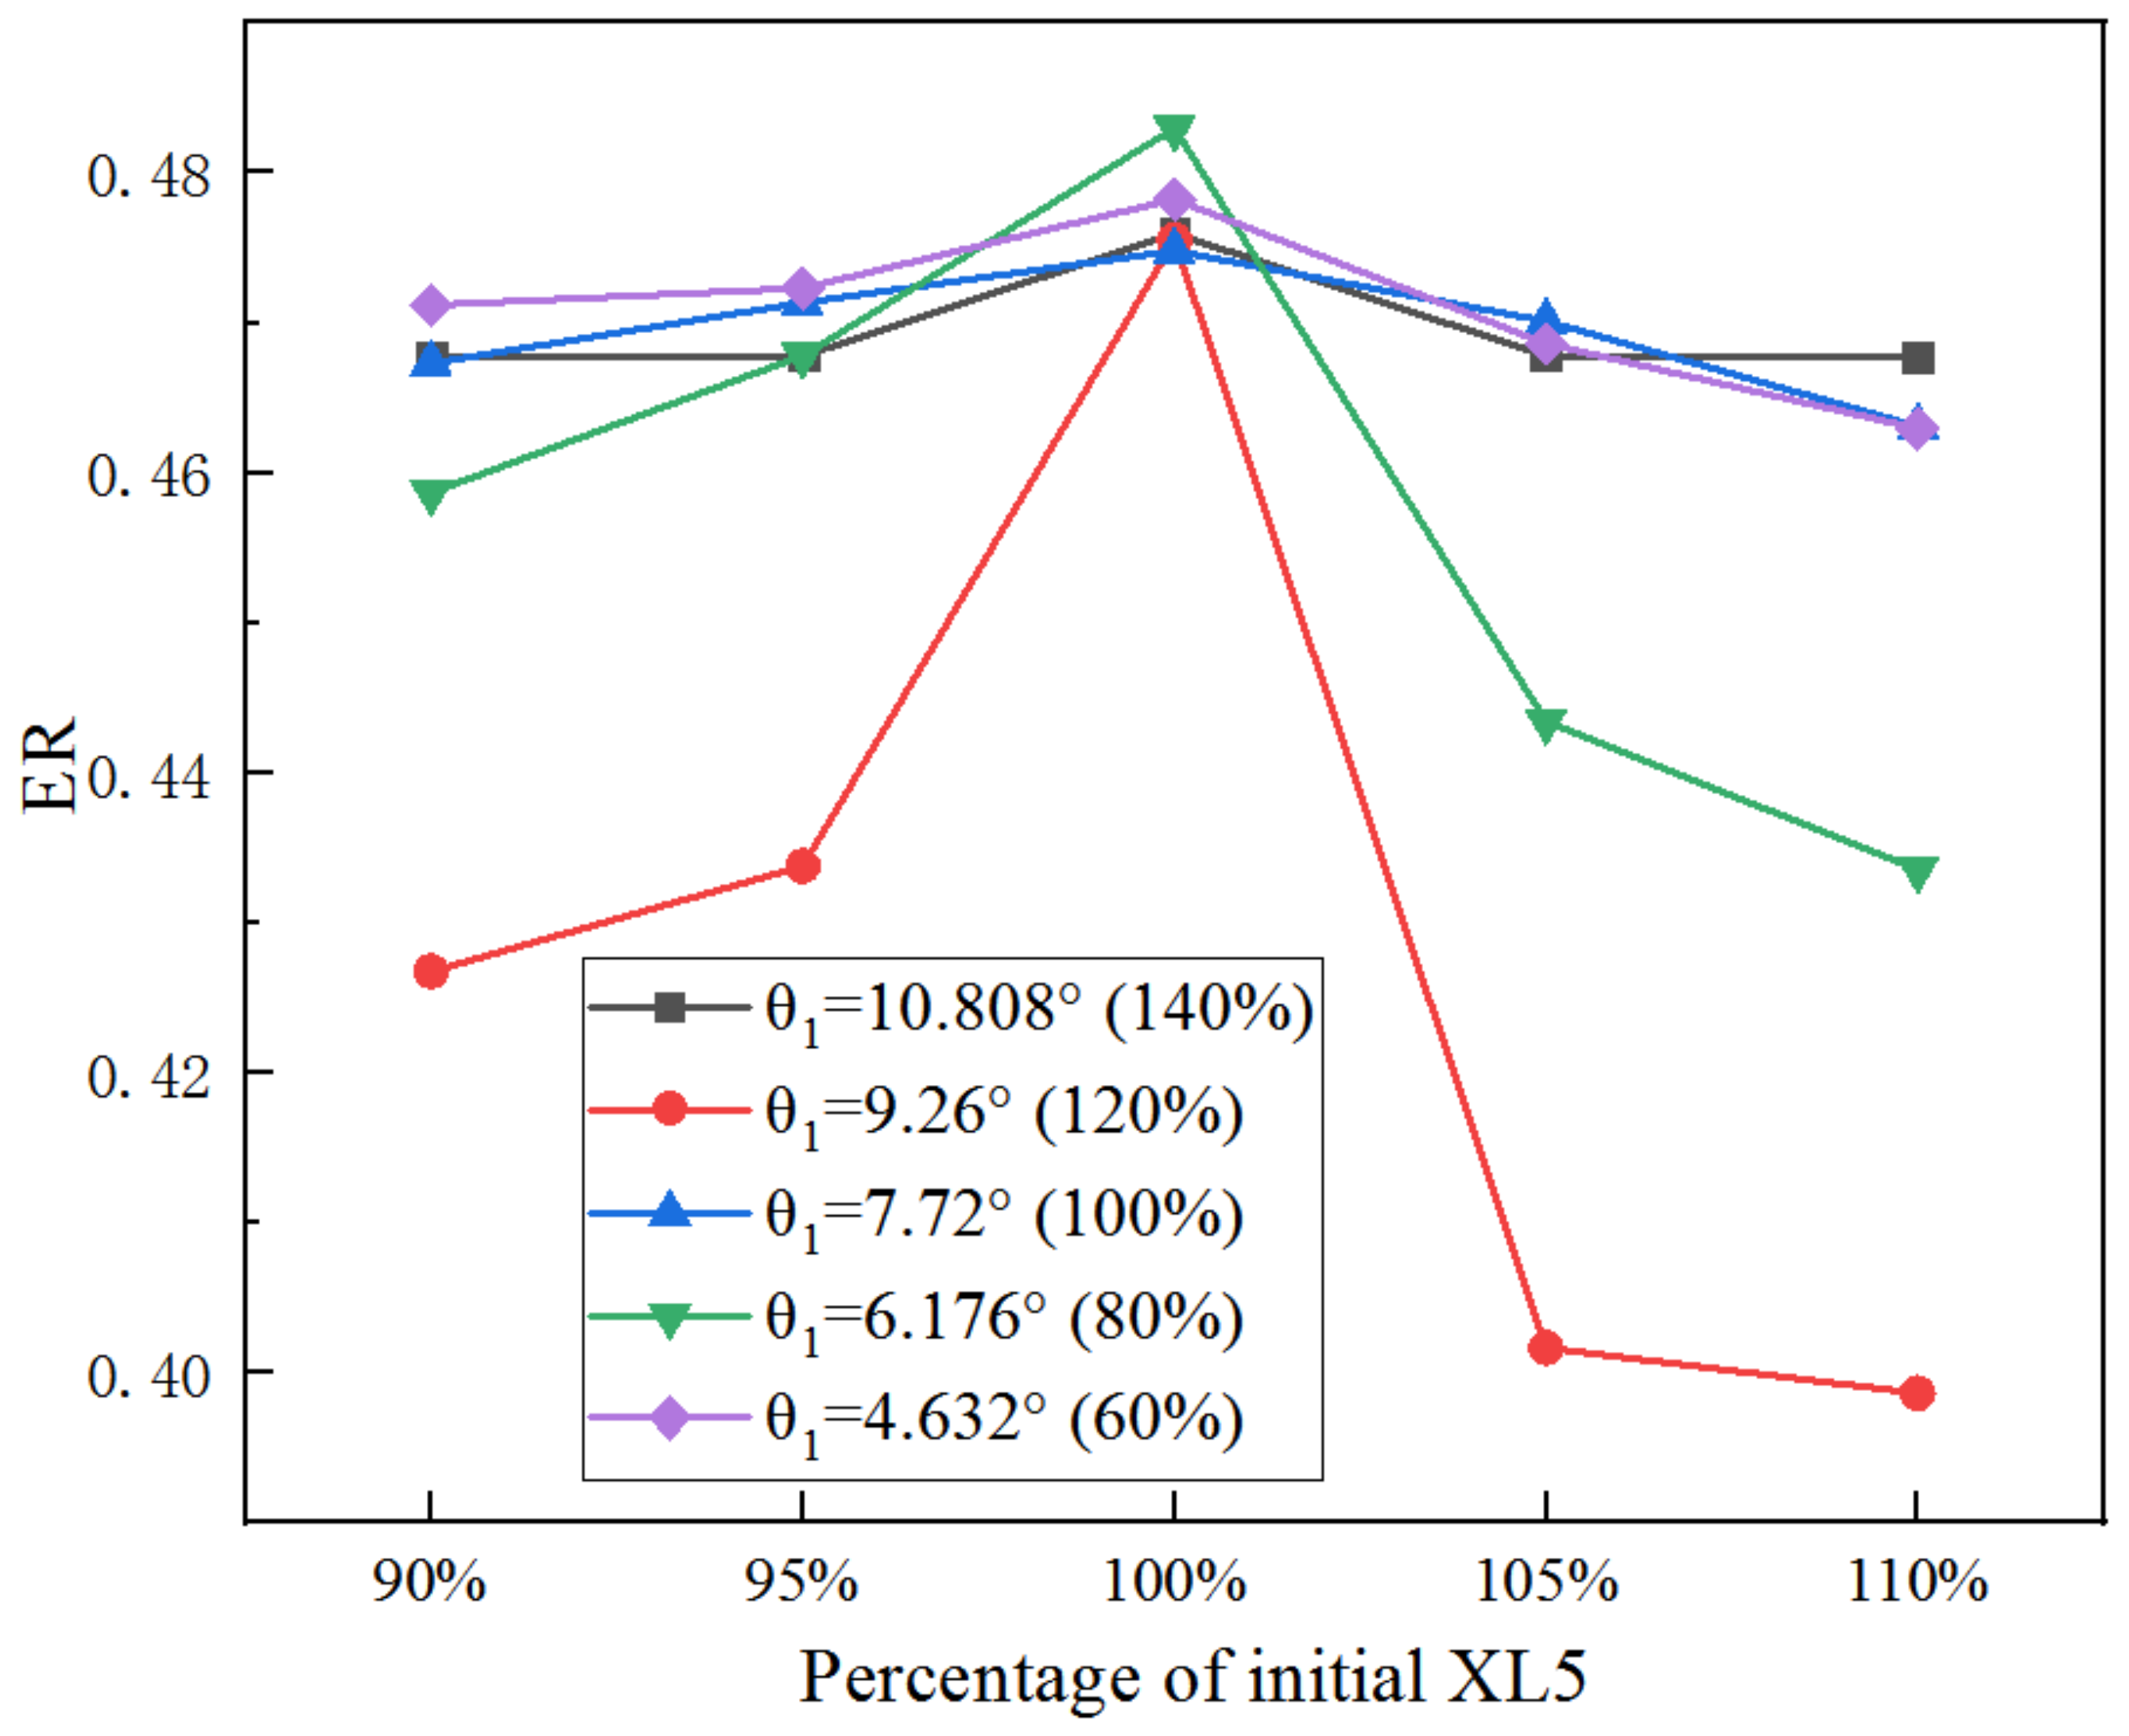
Figure 19 presents the change of ER with XL5 based on optimized D5 under given θ1. When XL5 rises from 90% to 95% of its initial size, ER with θ1 of 4.62° (60%) is the maximum; however, when the size of XL5 is 100%, the ER with θ1 of 7.04° (80%) is the highest; when the size of XL5 increases to 105%, ER with θ1 of 4.62° (60%) is still the largest; the ER with θ1 of 10.81° (60%) is the maximum when the size of XL5 is increased to 110%. It can be seen that with the varied XL5, there is an optimal θ1 to obtain the maximum ER.
Thus, it can be seen that a larger θ1 is needed to achieve a better performance of the ejector when XL3 and D5 increase, however, the relation between ER and θ1 is not obvious with the increase of XL5.
To summarize, with the increase of XL3, a larger θ1 and a smaller L1 are needed to provide the highest ER; with the increase of D5, it requires larger of them to achieve the maximum ER; however, ER has not an evident relation with varied θ1 or L1 with given XL5.
4.2. Effect of the Diverging Section of the Primary Nozzle
- (1)
- Ejector performance under varied lengths and angles of the diverging section
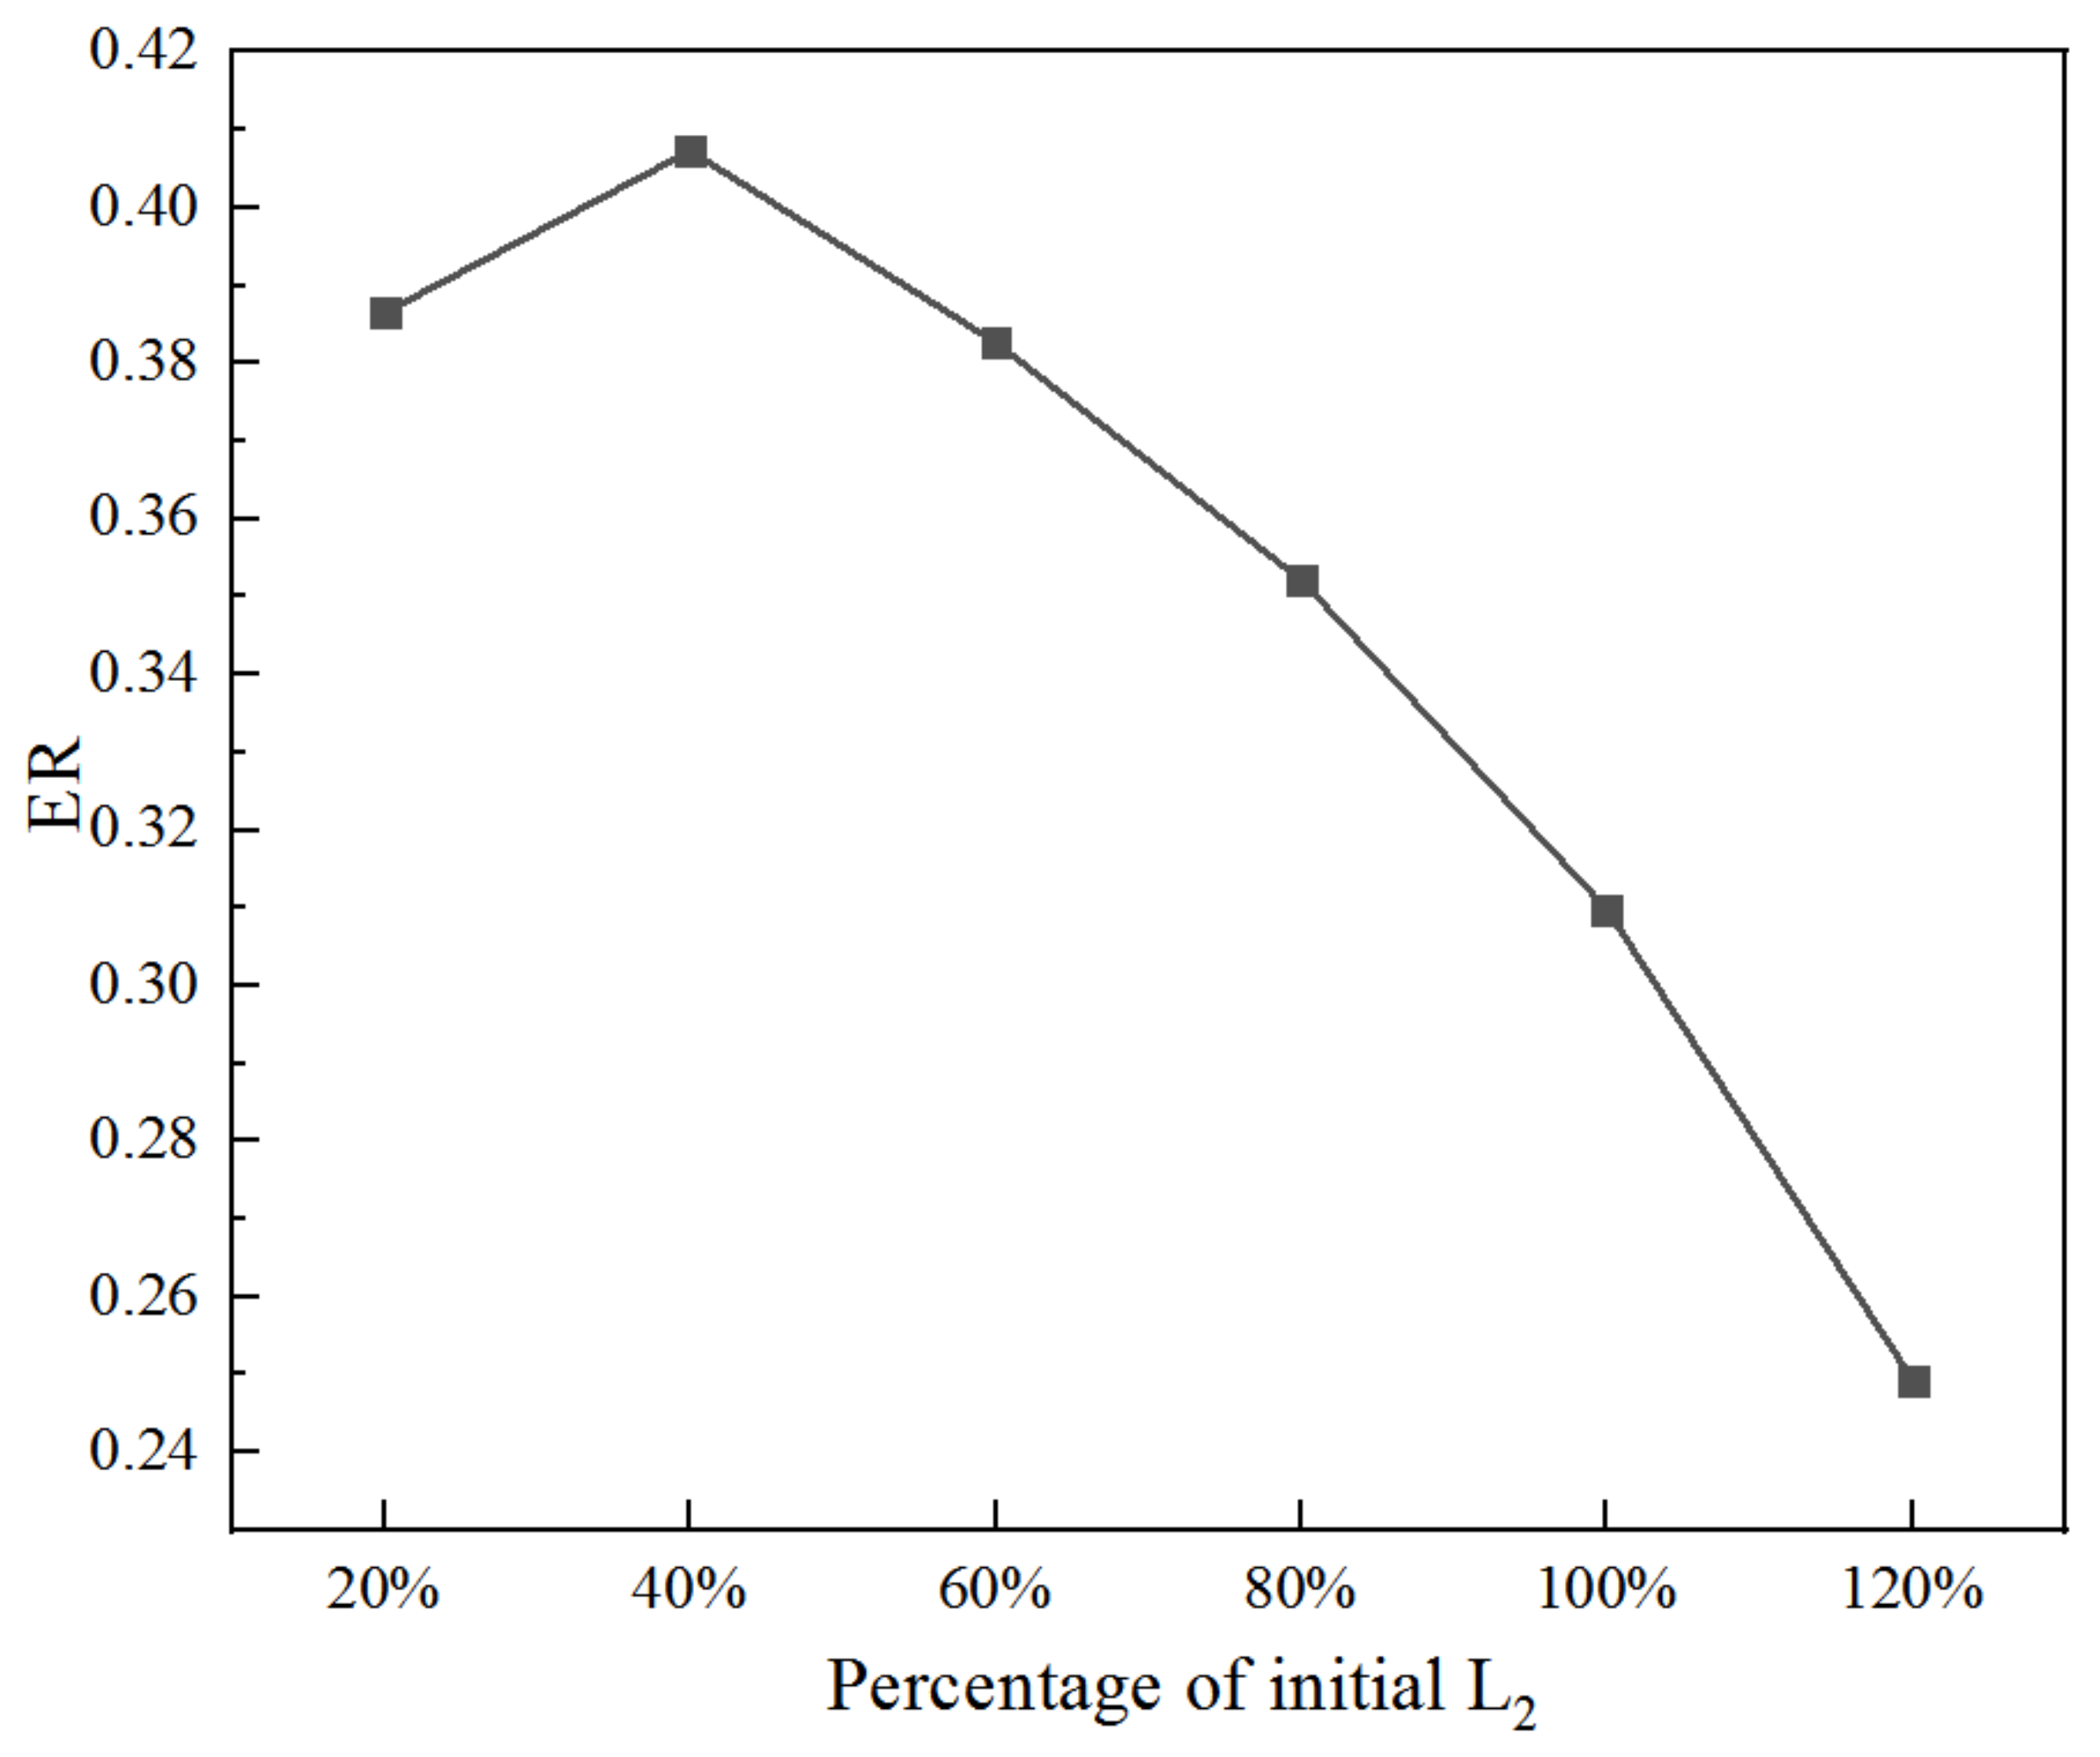
Similarly, when all else conditions keep unchanged, the impact of the length of the diverging section of the primary nozzle (L2) on ER is demonstrated in Figure 20. When L2 increases from 20% (2 mm) to 100% (10 mm), ER rises to the maximum of 0.407. Therefore, the optimal length of the diverging section of the primary nozzle is 4 mm, which provides an increase of 31.5% for the ER.
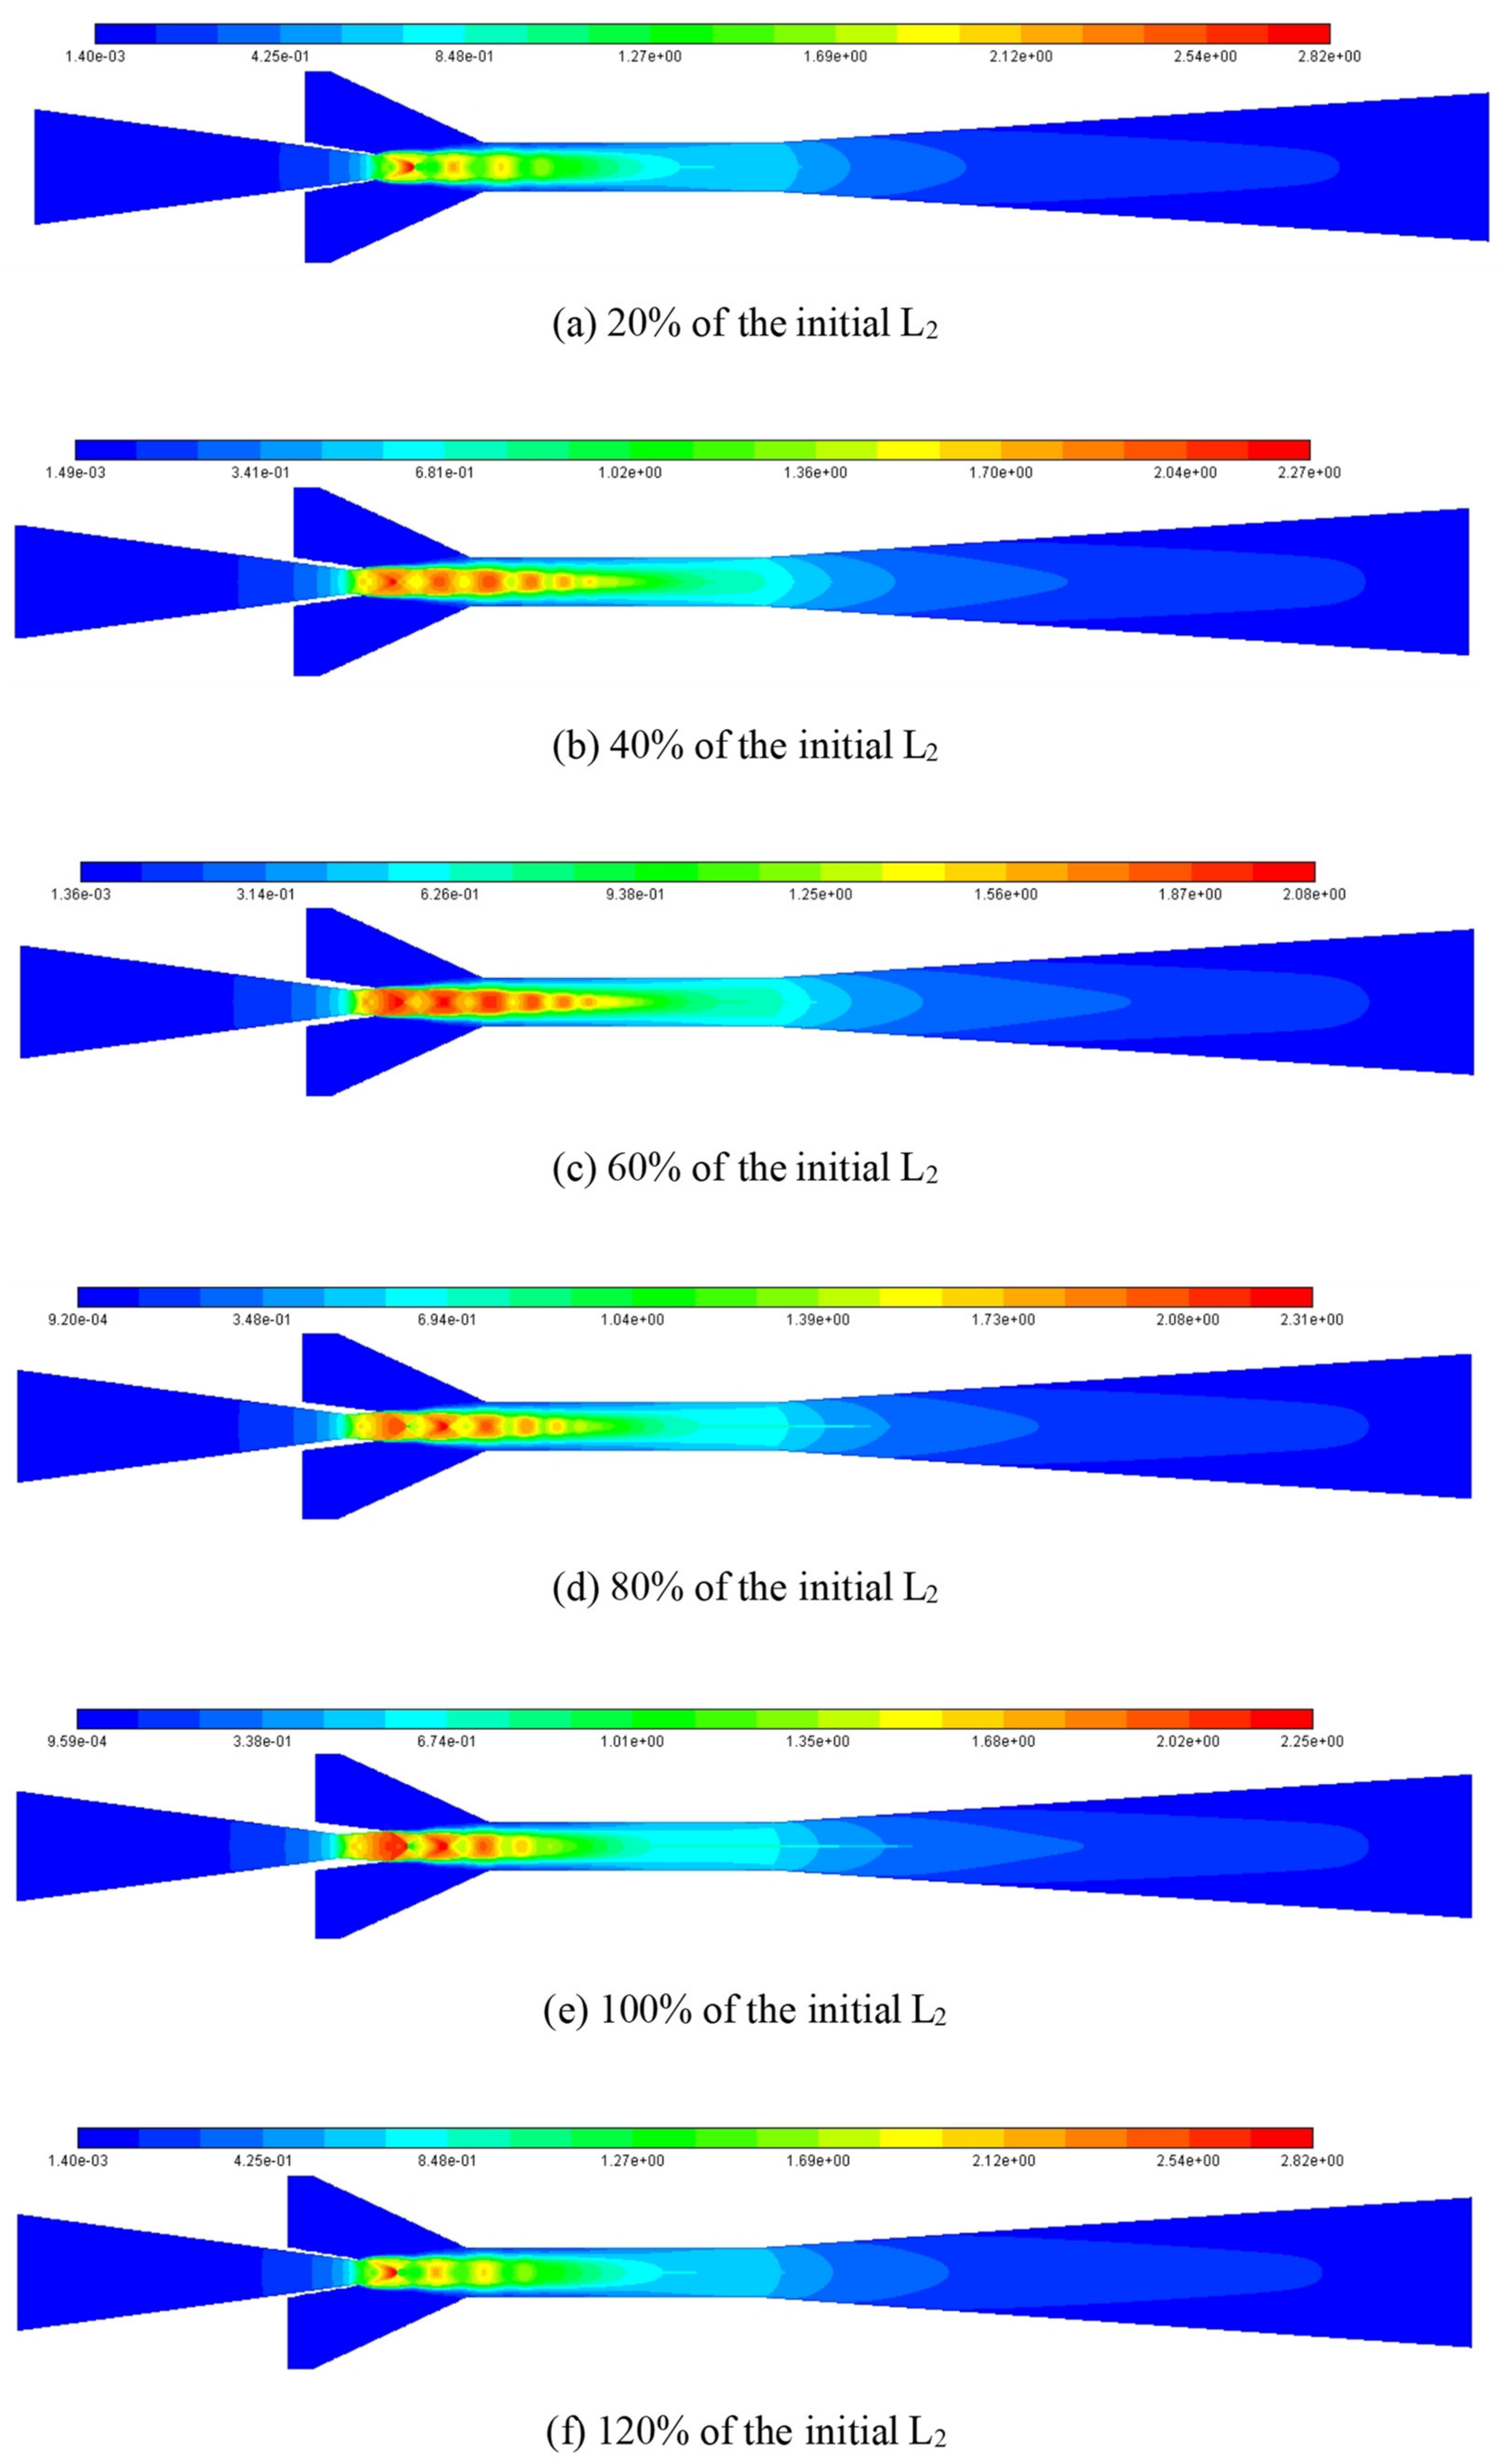
The impact of L2 on the ER can be explained by using Mach number contour at varied L2 as illustrated in Figure 21, in which, L2 is increased from 20% of the initial value to 120% with an interval of 20%. When L2 is 20% of the initial value, it can be seen from the figure that there are only four shock clusters, and the highest Mach number of the first shock cluster is 2.82. However, the intensity of the first shock cluster is relatively small and it decays quickly with the increase of shock cluster number, which results in a relatively small entrainment effect of the ejector. When L2 increases to 40% of the initial value, although the maximum Mach number in the first shock cluster is only 2.27, the number of shock clusters increases to six, and the intensity of each shock cluster is relatively large. In other words, the attenuation between adjacent shock clusters slows down, and the shock chain length increases significantly. Therefore, the ejector performance reaches the best. However, when L2 is increased to 60% of the initial value, although the shock chain length increases slightly, the maximum Mach number decreases to 2.08, and the interaction between two adjacent shock clusters causes a large loss of energy, so the entrainment capacity decreases and the ejector performance decreases accordingly. When L2 is increased to 80%, 100%, and 120% of the initial value, the number of shock clusters inside the ejector decreases and the length of the shock chain becomes shorter gradually, and the attenuation between adjacent shock clusters becomes evident, thus, the ejector performance decreases gradually.
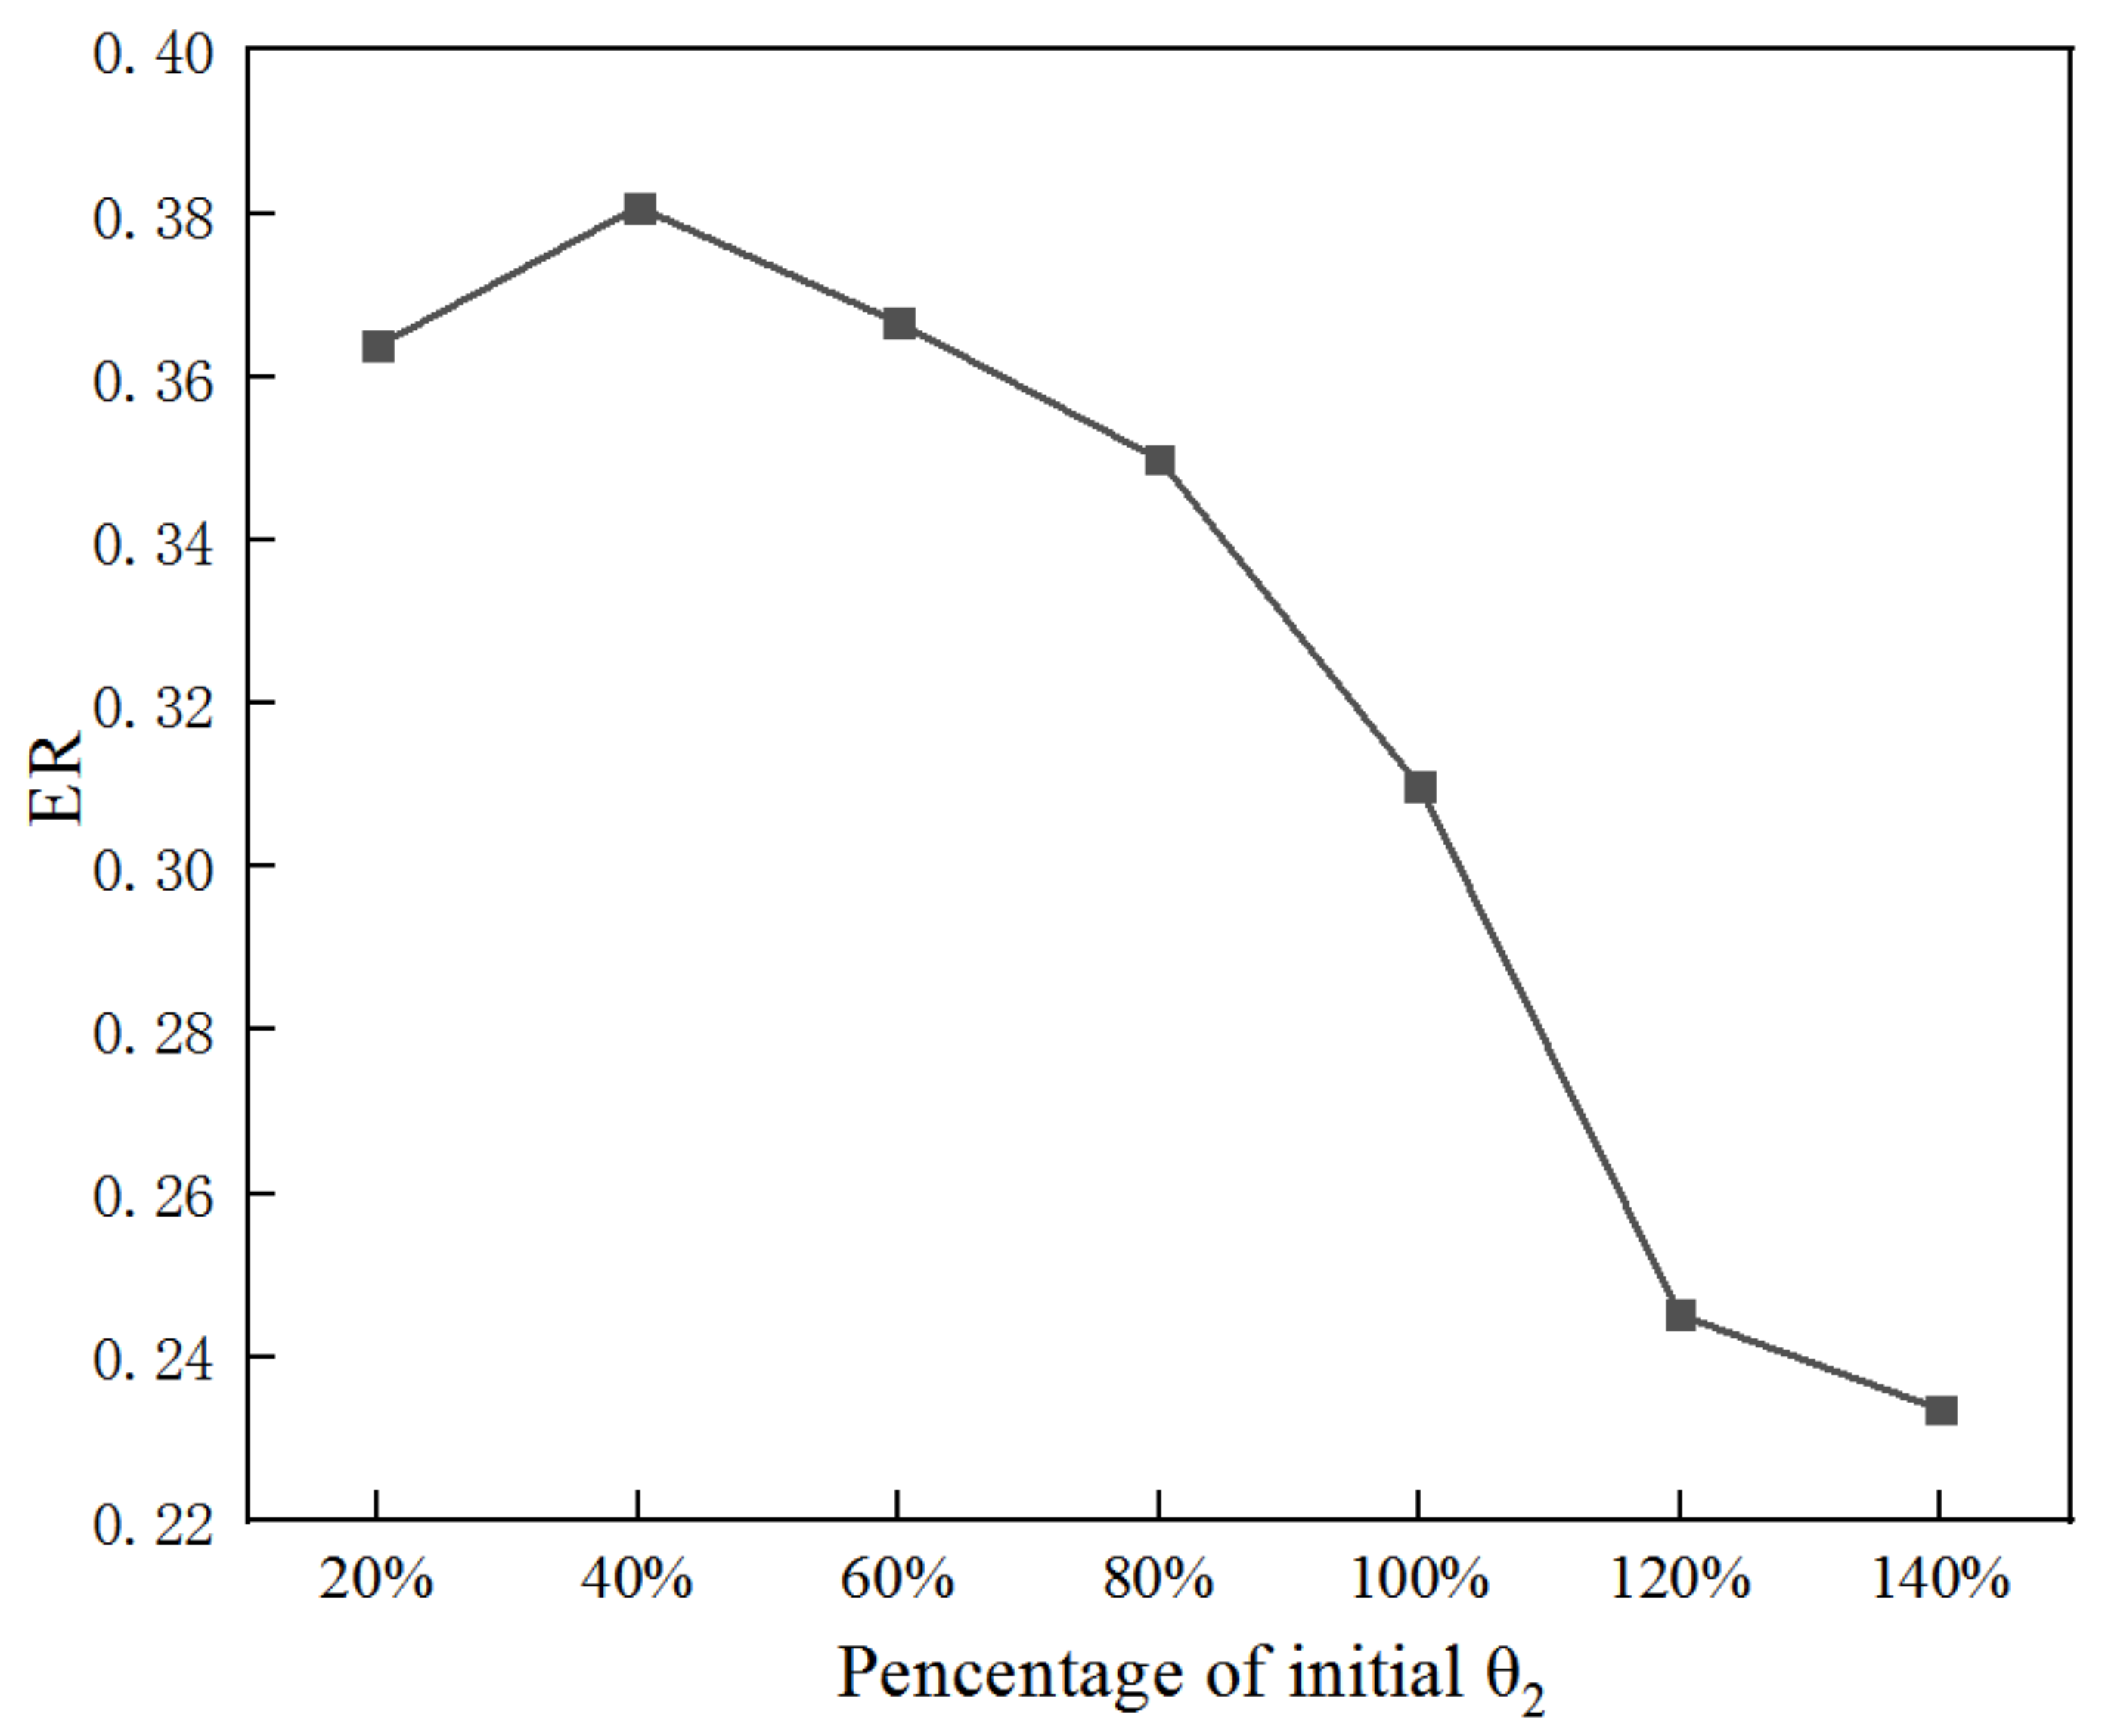
Figure 22 illustrates the impact of the angle of a diverging section of the primary nozzle (θ2) on ER. As the θ2 increases from 20% (0.915°) to 140% (6.404°), ER rises to the maximum of 0.381. Therefore, the optimal θ2 is considered to be 1.83° (40% of initial θ2), which offers an increase of 22.9% for the ER.
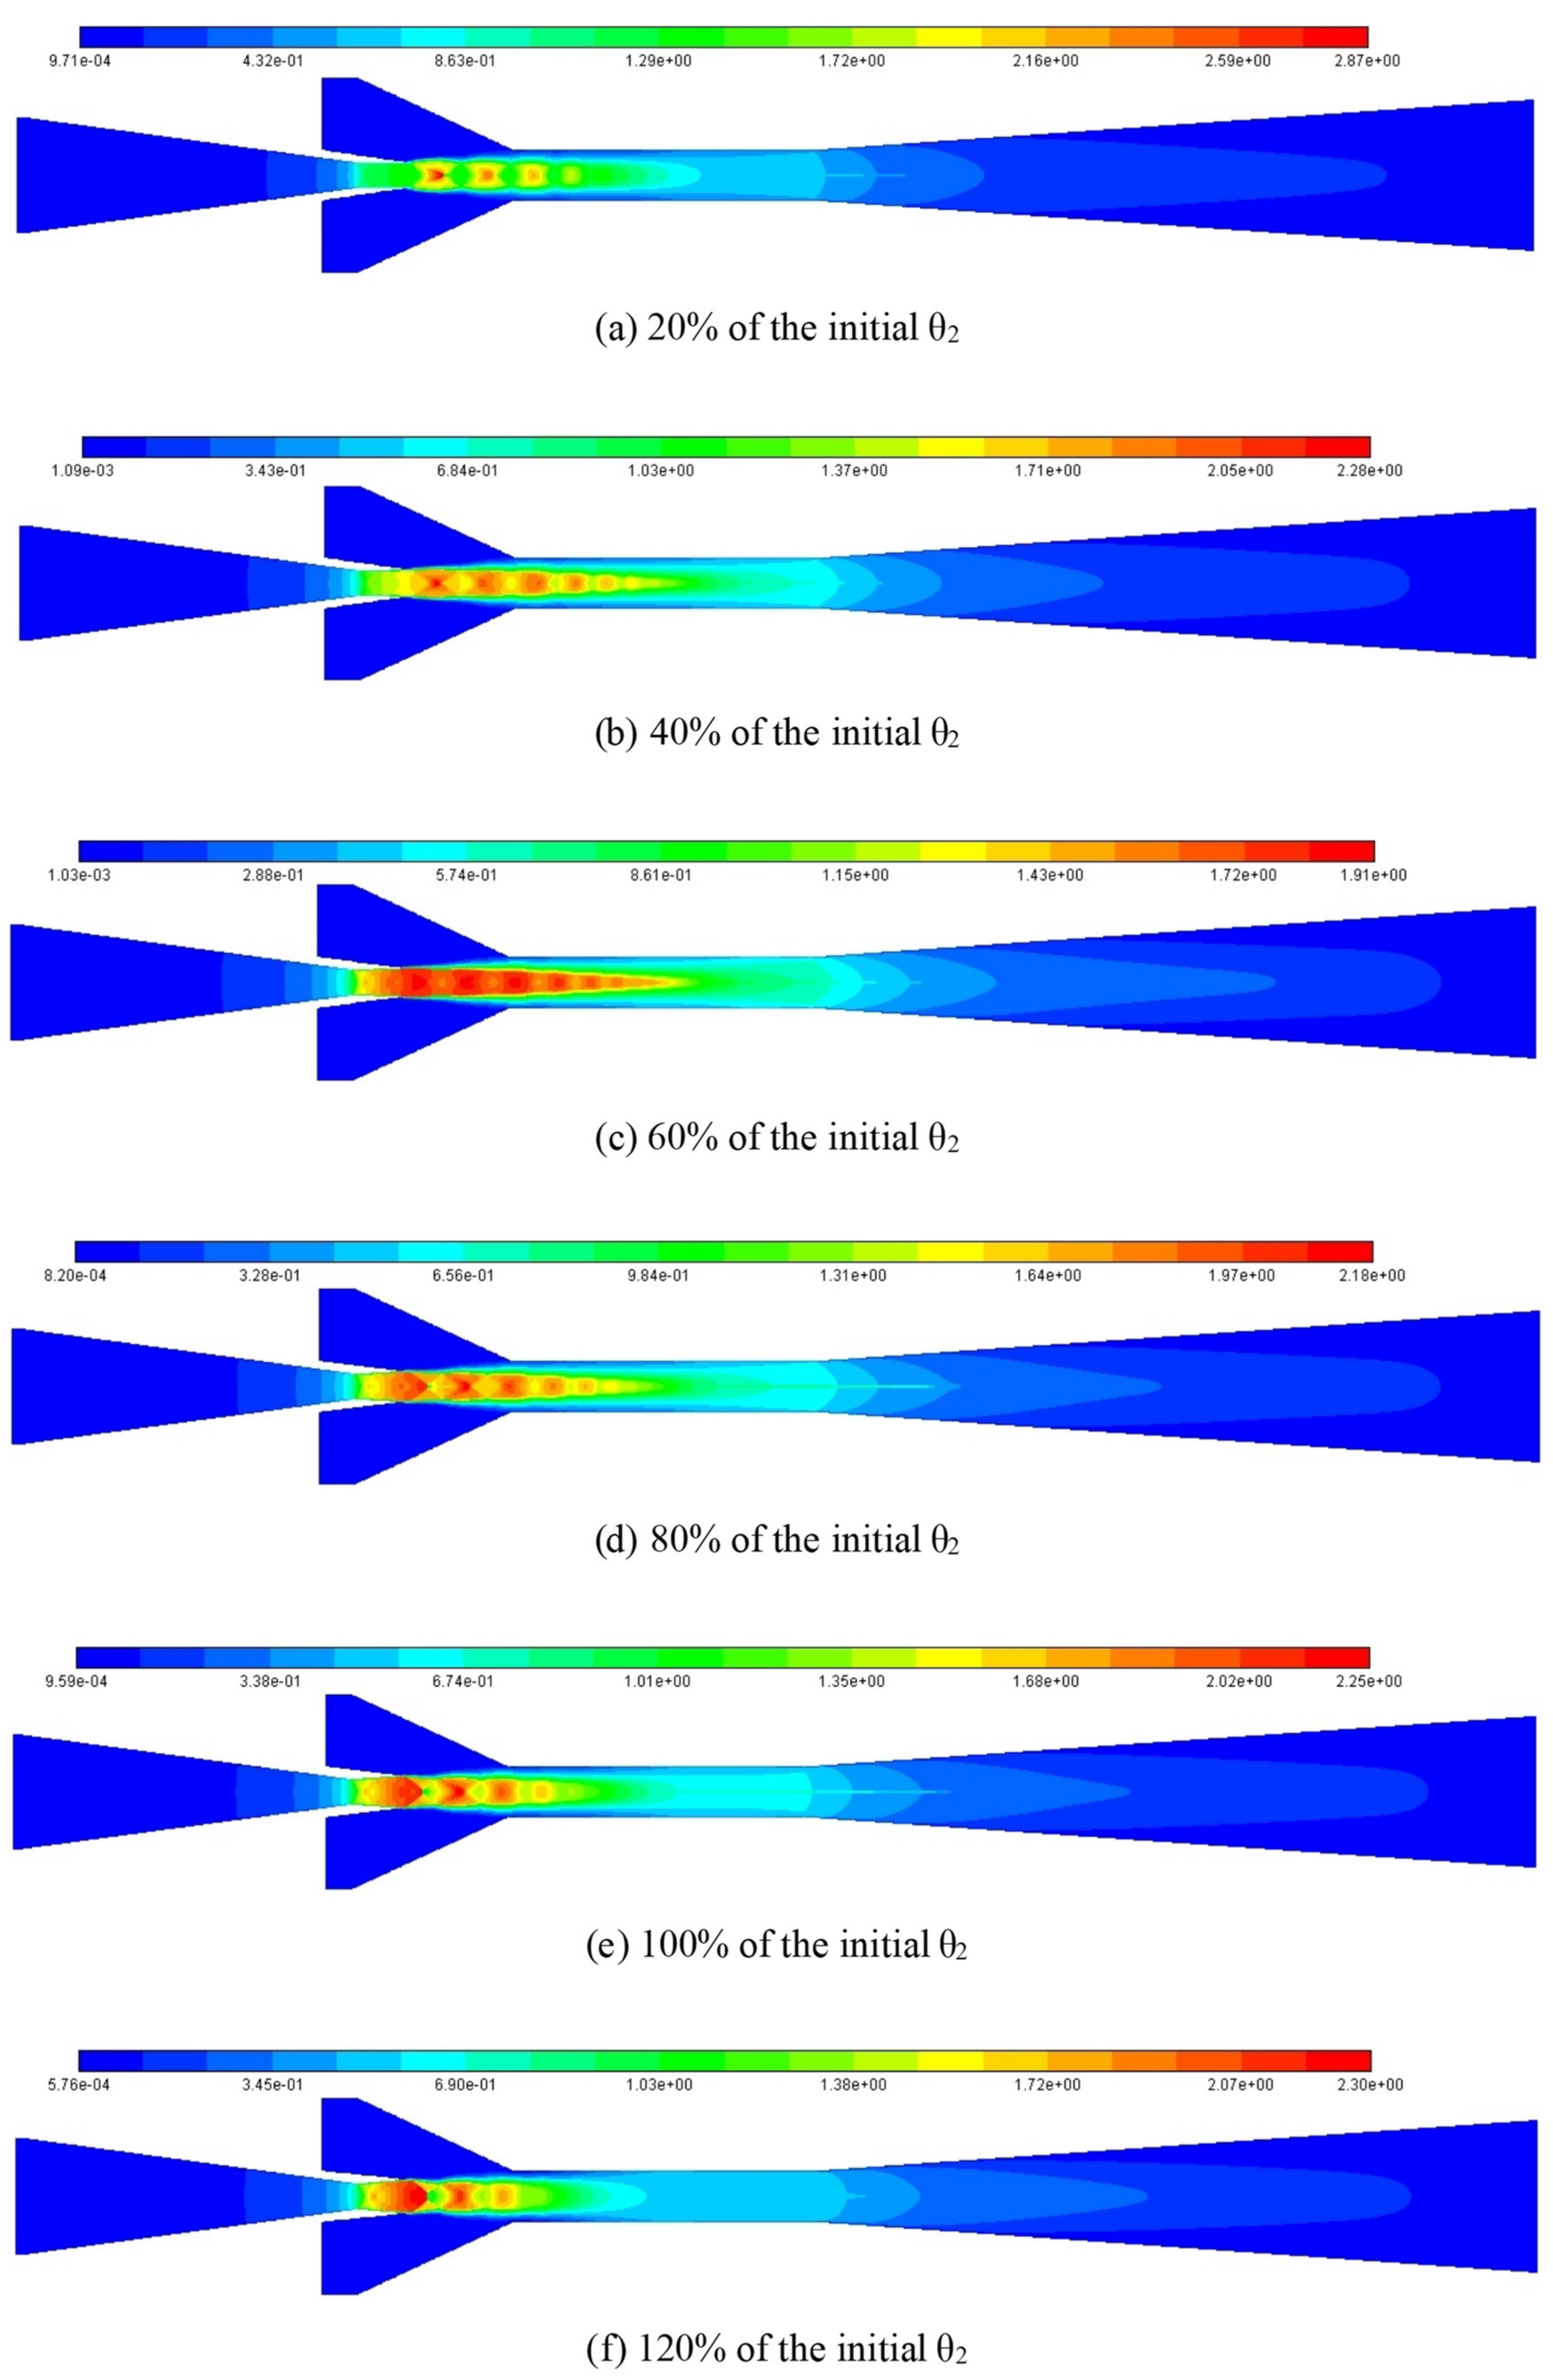
The impact of θ2 on the ER can be explained by using the number and intensity of shock clusters and shock chain length at different θ2 as displayed in Figure 23, in which, θ2 increases from 20% of the initial value to 120% with an interval of 20%. When θ2 is 20% of the initial value, it can be clearly seen that there are four shock clusters. Although the highest Mach number in the first shock cluster reaches 2.87, its overall intensity is small, the attenuation between adjacent shock clusters is very obvious, and the shock chain length is relatively short, so the ejector performance is relatively low. When θ2 is increased to 40% of the initial value, the number of shock clusters increases to six. Although the maximum Mach number in the first shock cluster decreases to 2.28, the intensity of the first four shock clusters increases significantly, and the shock chain length increases considerably. Therefore, the ejector performance reaches the best. When θ2 increases to 60% of the initial value, the number of shock clusters remains unchanged and the shock chain length increases slightly. However, the maximum Mach number in the first shock cluster decreases to 1.91, and the interference between the two adjacent shock clusters is significantly enhanced, which causes a certain amount of energy loss. Therefore, the suction capacity of the ejector decreases, thus, the ER reduces. Additionally, when θ2 continues to increase to 80%, 100%, and 120% of the initial value, although the maximum Mach number gradually increases, the attenuation between adjacent shock clusters increases, the number of shock clusters and the shock chain length gradually decreases, hence, the performance of the ejector gradually decreases.
- (2)
- Individually optimizing each key geometry under varied θ2 or L2
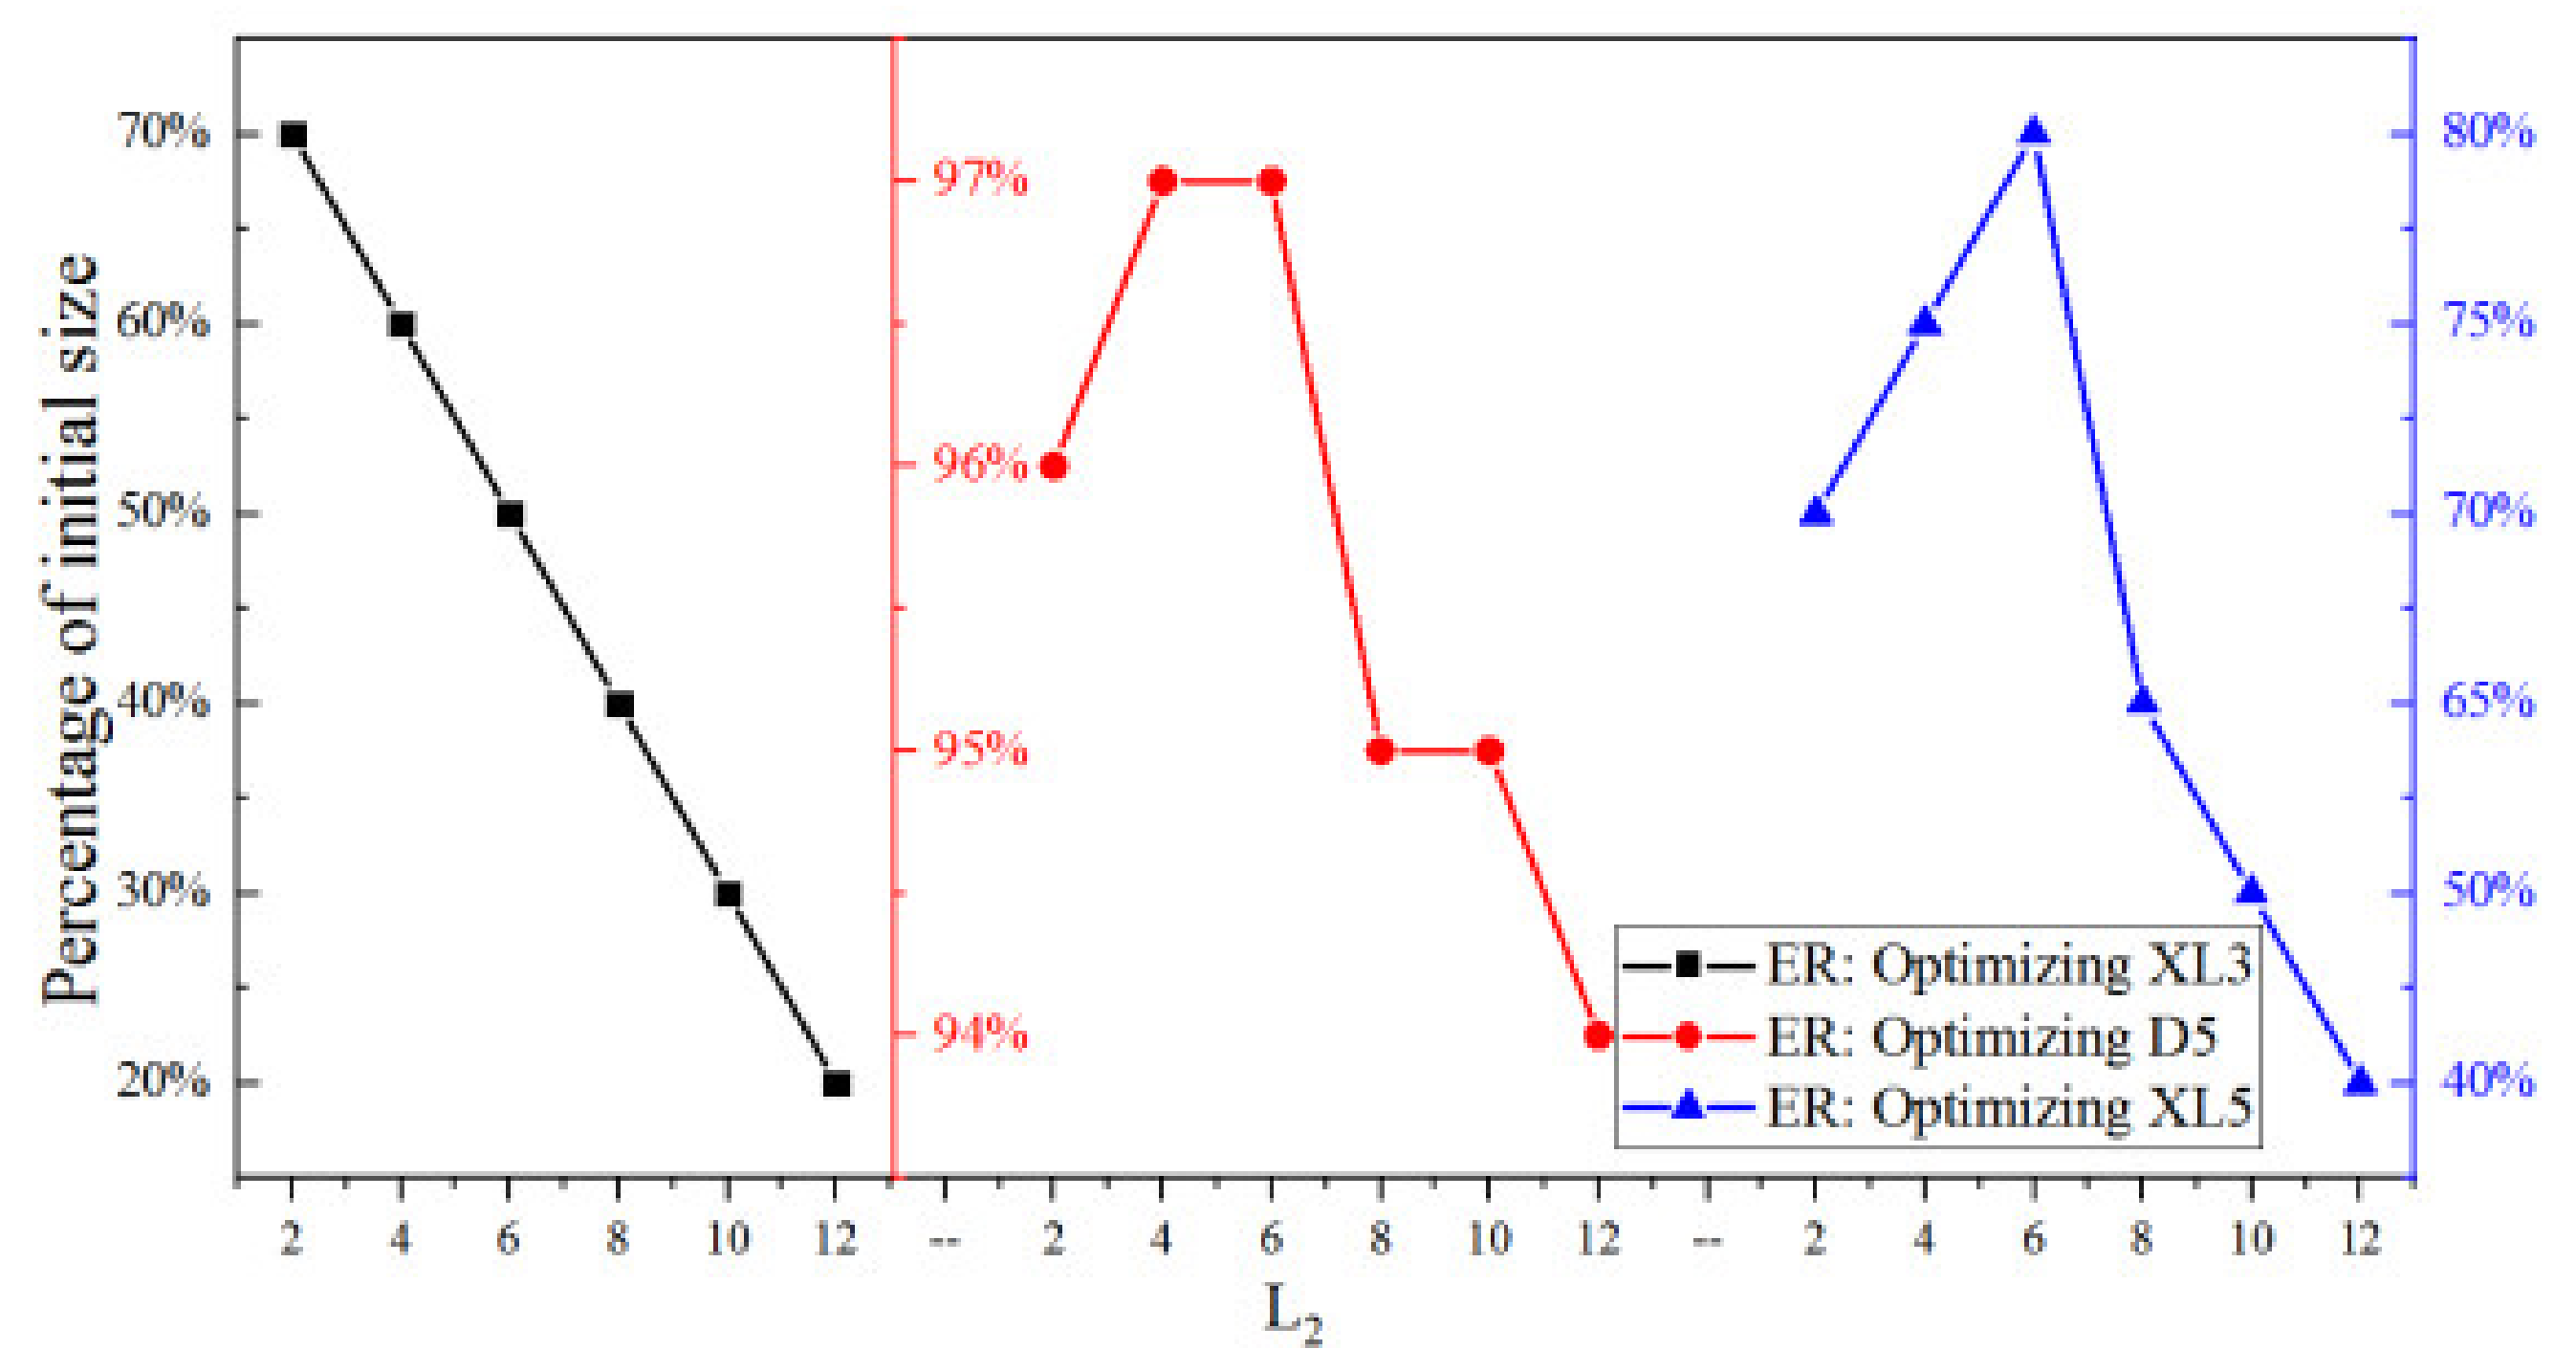
In this section, XL3, D5, or XL5 is individually optimized under different θ2 or L2. Figure 24 shows the optimized XL3, D5, and XL5 under different L2 when they are individually optimized. According to the results, optimized XL3 decreases, D5 and XL5 increases first and then decreases with L2 when L2 increases from 20% to 120% of its initial value.
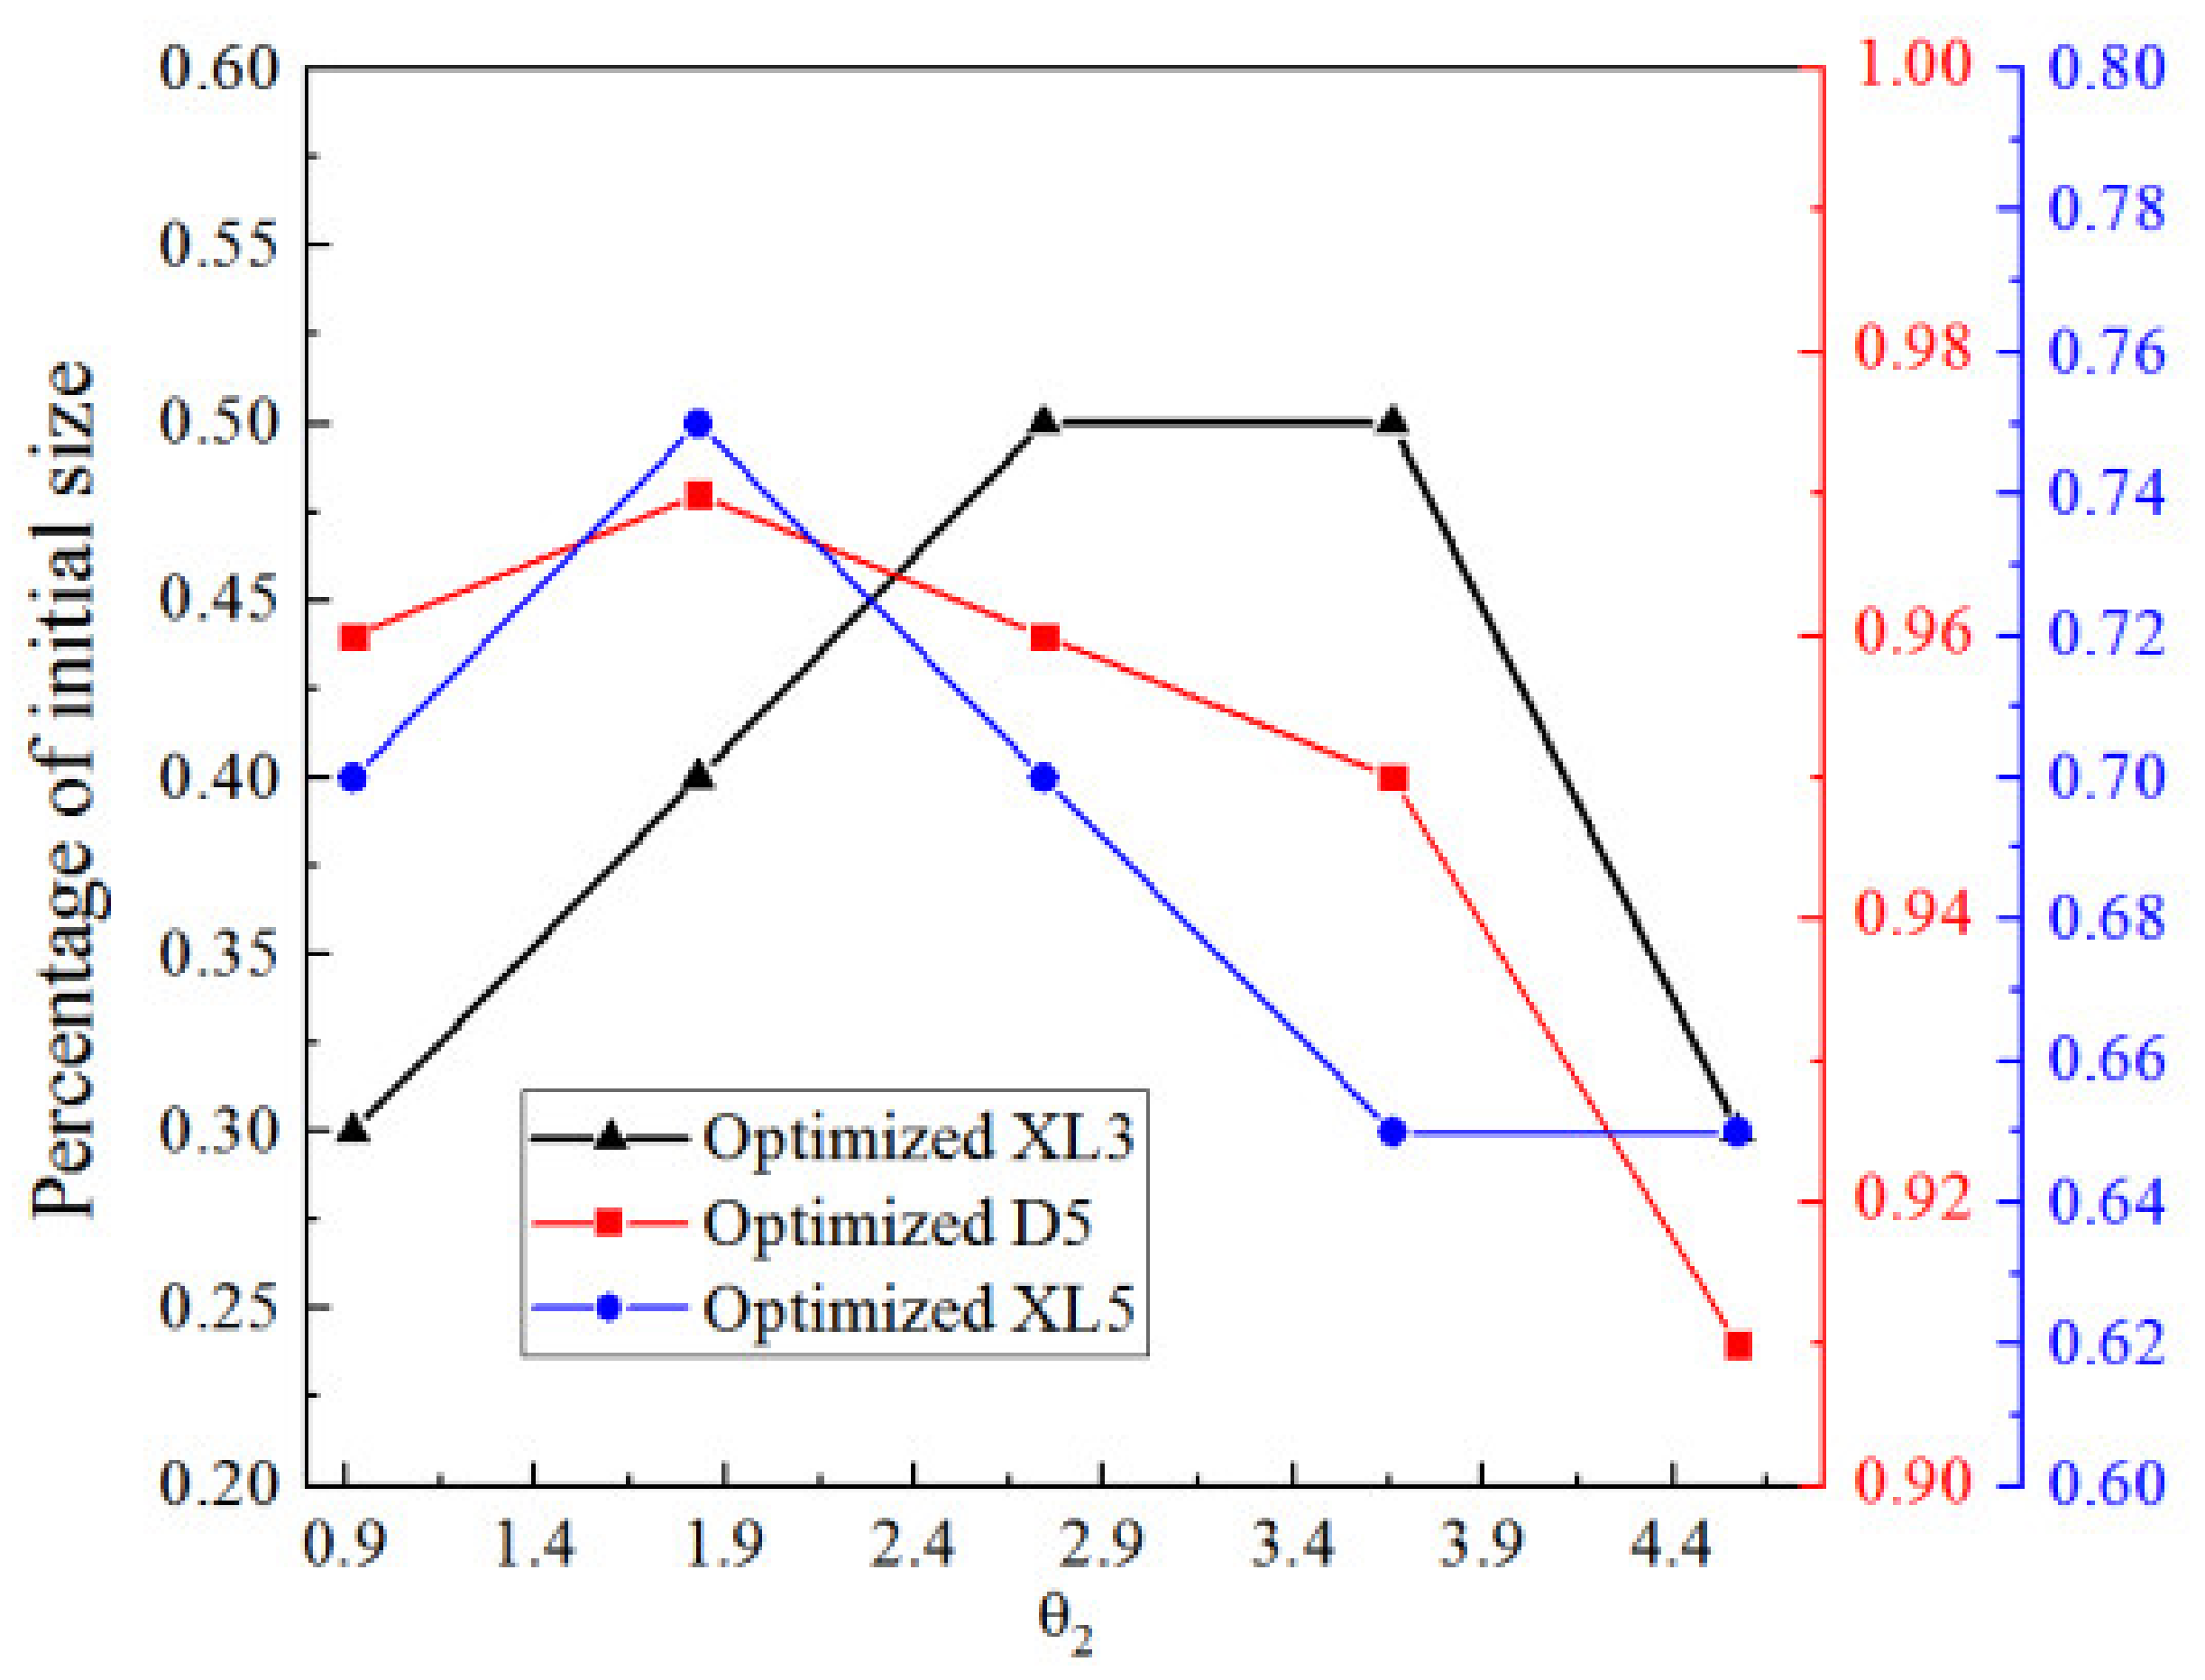
Figure 25 shows the optimized XL3, D5, and XL5 at different θ2, when XL3, D5, and XL5 are separately optimized. It can be observed that optimized XL3, D5, and XL5 increase first and then decrease when θ2 increases from 20% (0.92°) to 100% (4.57°) of its initial value.
- (3)
- Sequentially optimizing three key geometries under varied lengths and angles of nozzle diverging section
In this section, the impact of the angle (θ2) and length (L2) of the nozzle diverging section on the optimized key dimensions and corresponding optimal ER with the optimization sequence of XL3→D5→XL5 is studied.
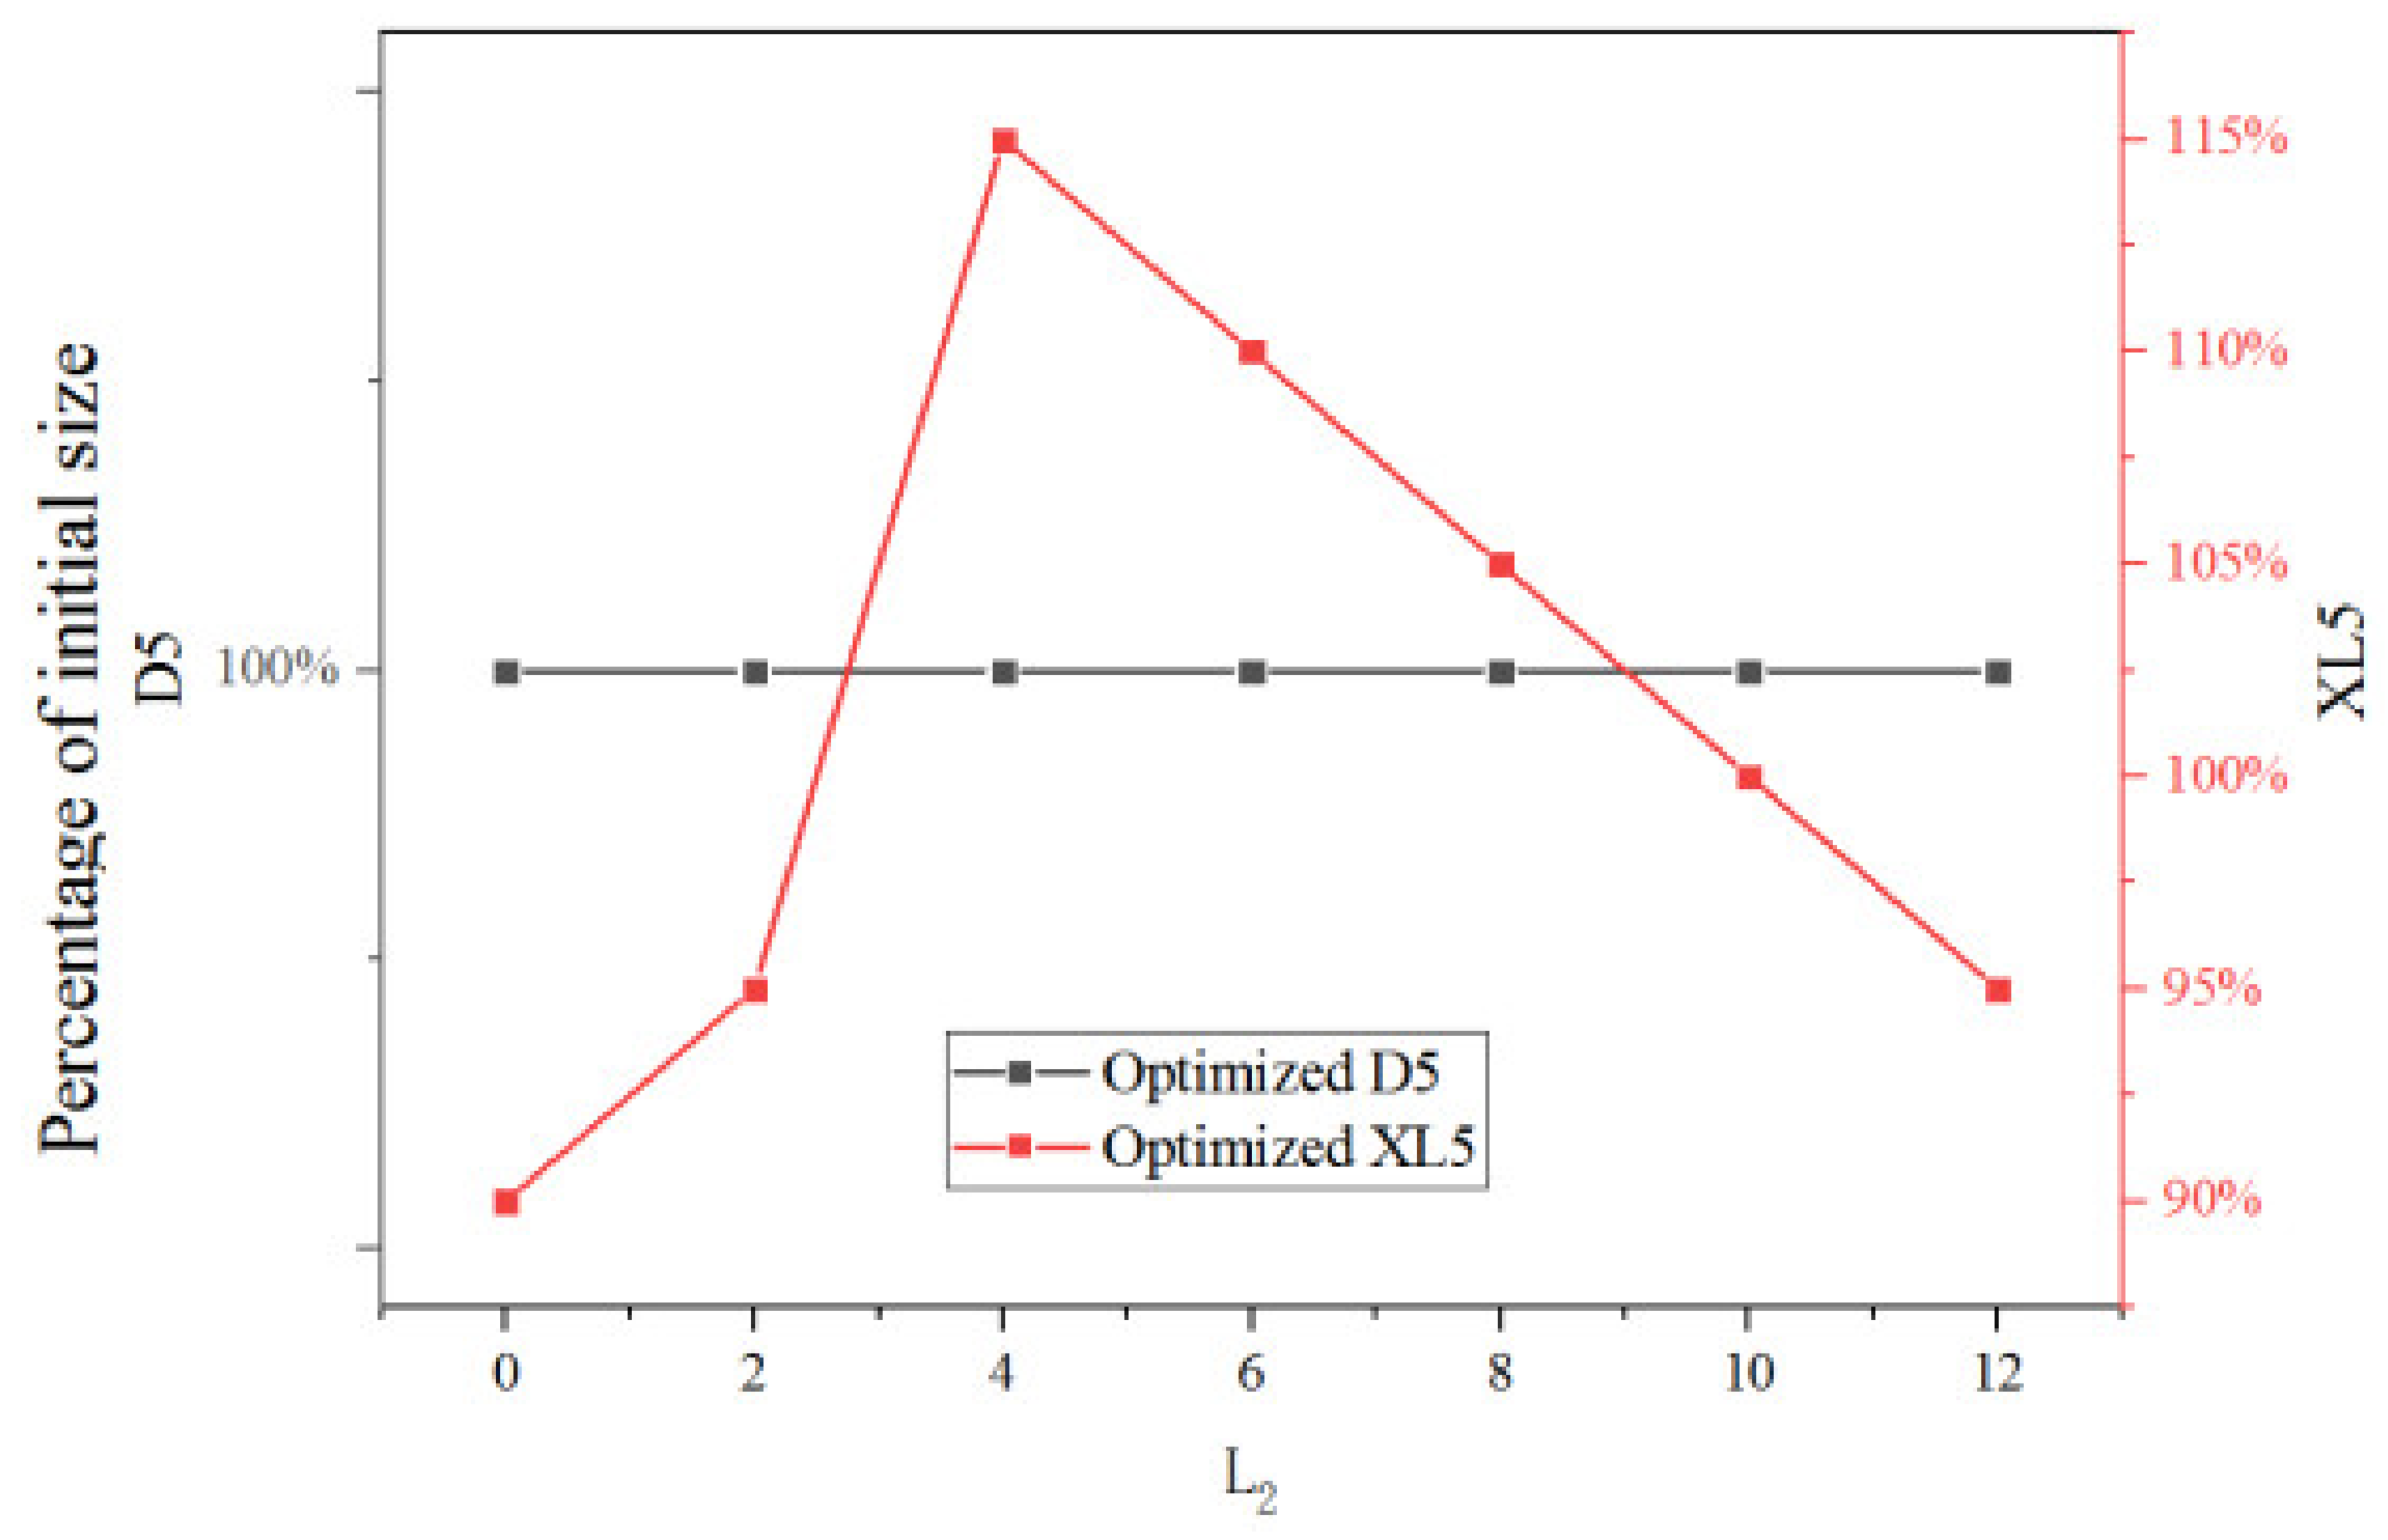
Figure 26 shows two key dimensions optimized with the given optimization sequence under different L2. It can be seen that the optimized D5 remains unchanged as L2 changes. As L2 increases from 0% (0 mm) to 40% (4 mm), the optimal XL5 increases from 90% of the initial size to 115%. However, as L2 continues to increase from 40% to 120%, the optimal XL5 decreases linearly from 115% to 95% of its initial value.
Table 4 shows the optimal ER corresponding to the optimized two key dimensions at different L2 with the given sequential optimization. It can be seen that with the increase of L2, the optimal ER corresponding to optimized D5 is at 4 mm of L2. The highest ER is 0.5017 with optimized D5 (100%) when L2 is 4 mm (40% of the initial size). In addition, optimal ER corresponding to optimized XL5 has no evident change trend with L2, however, the maximum ER is 0.5027 with optimized XL5 (115%) when L2 is still 4 mm (40% of the initial size).
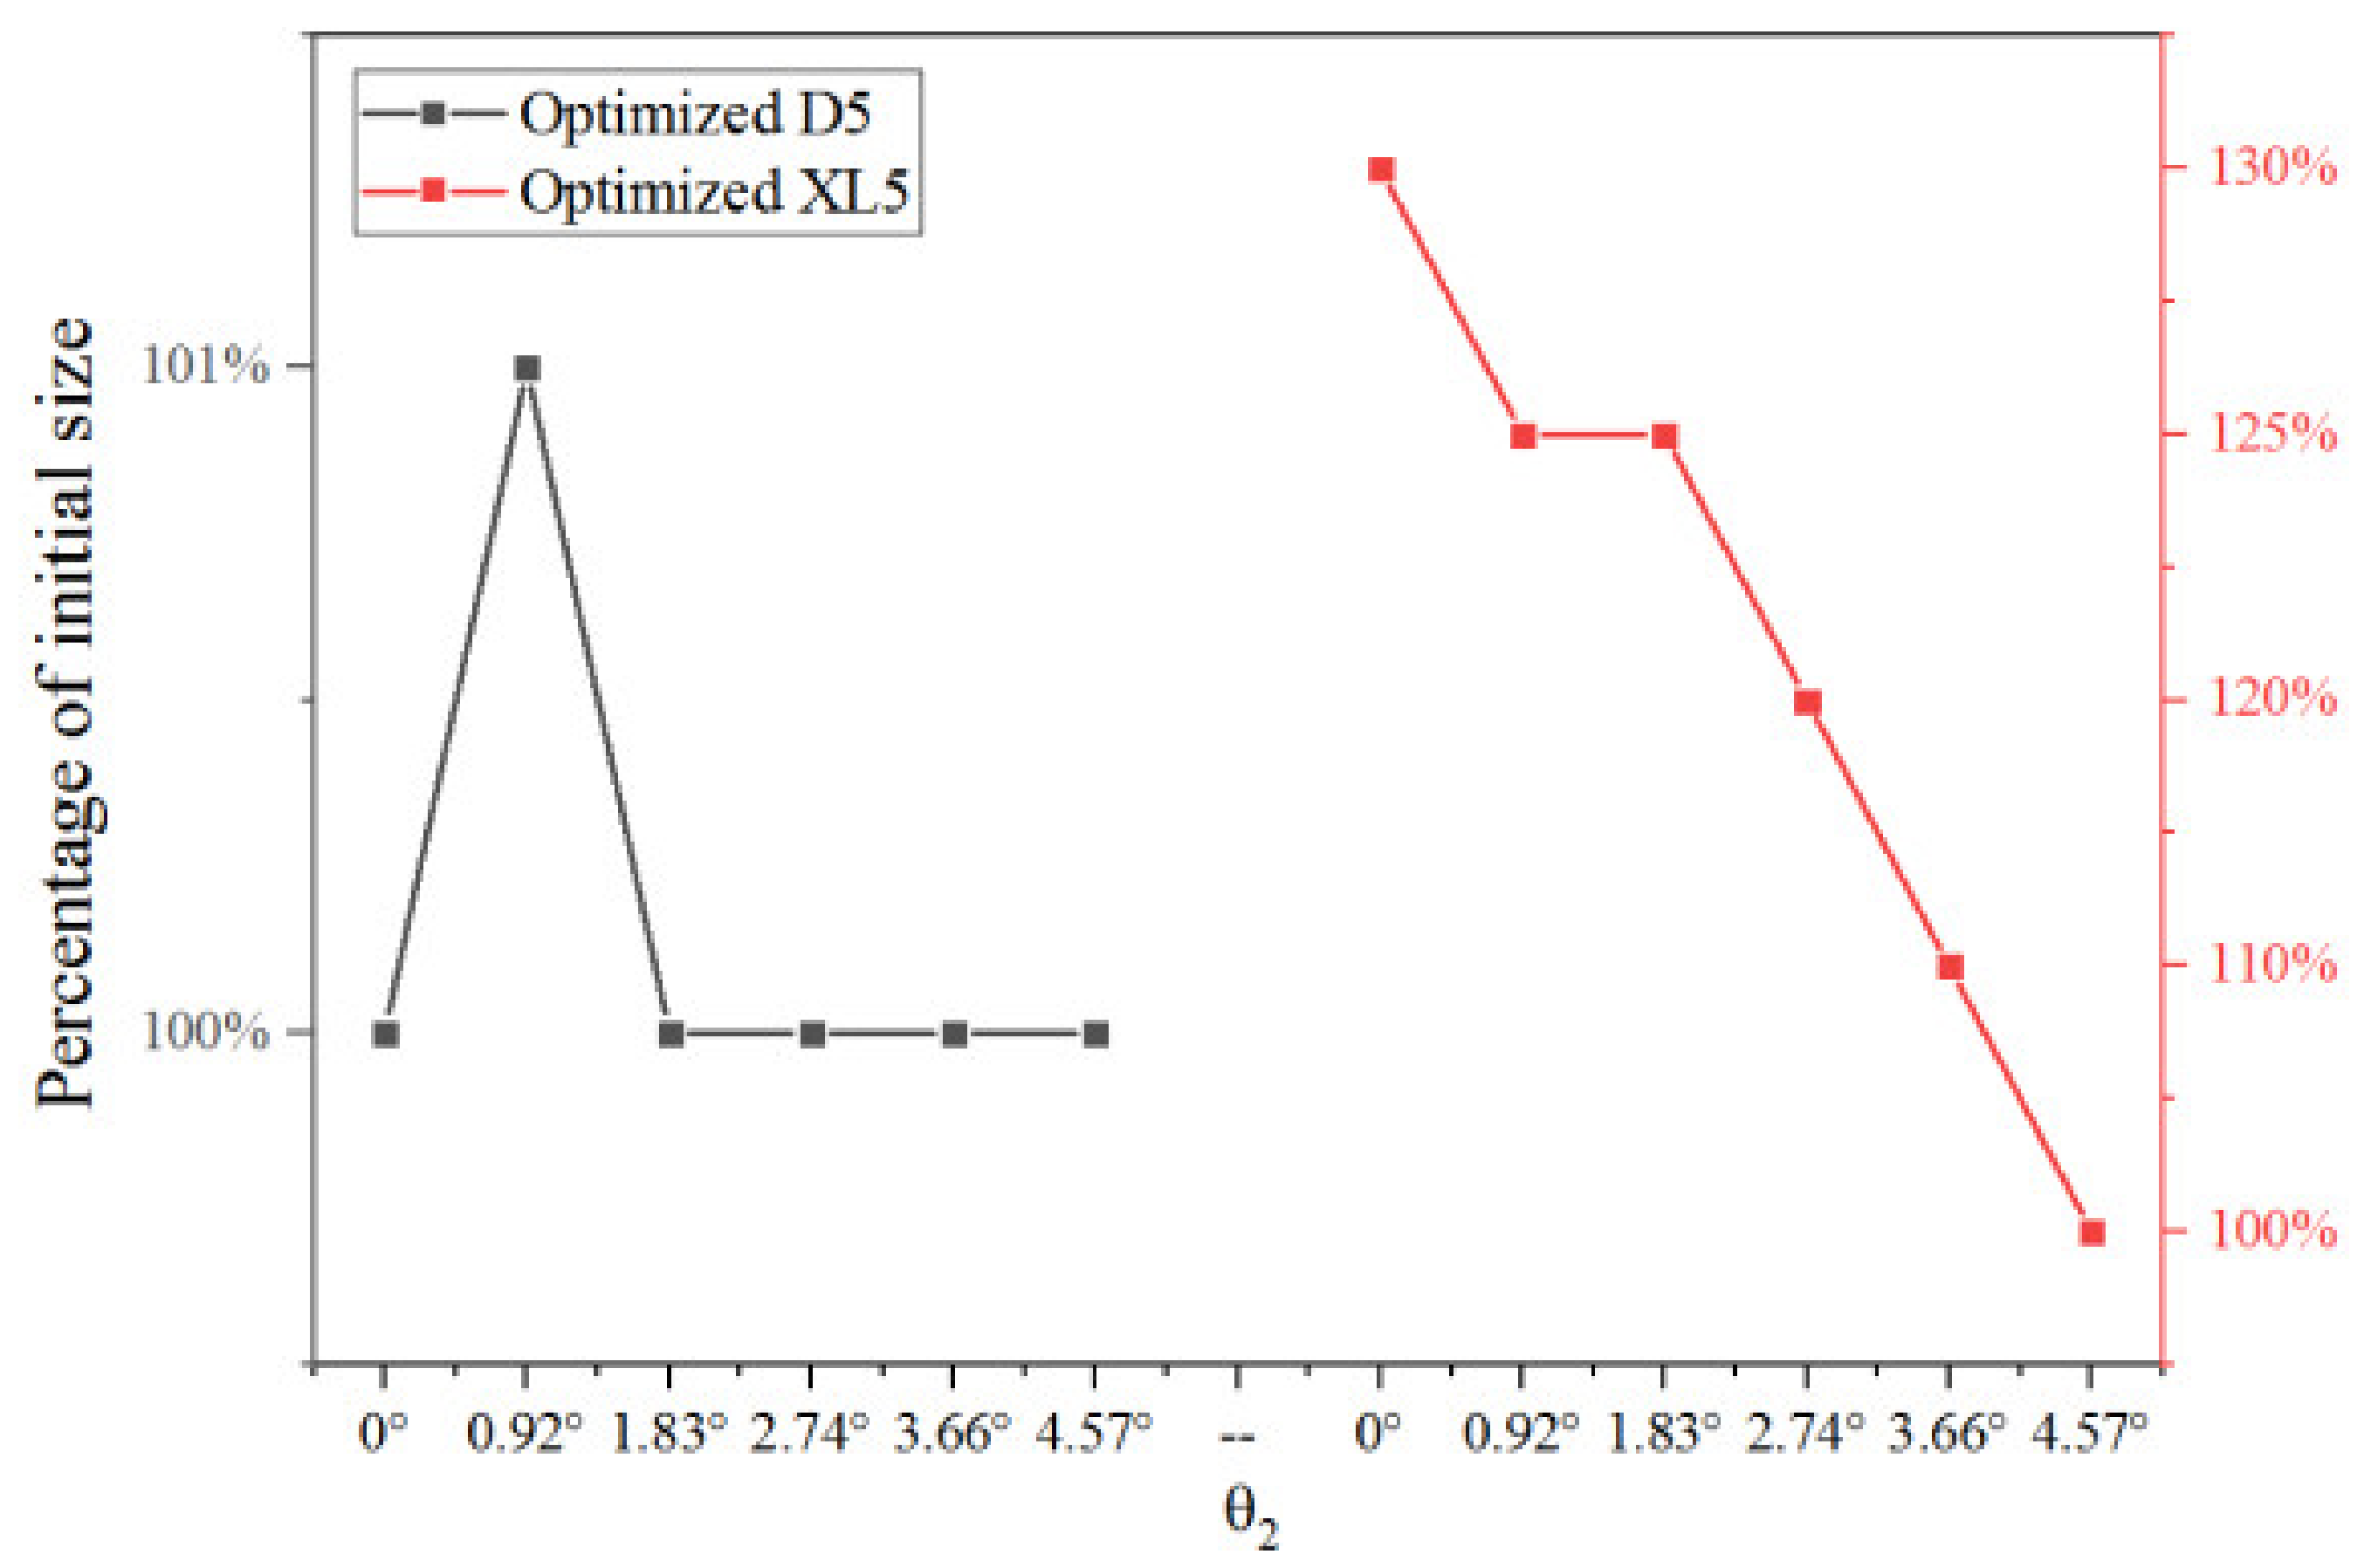
Figure 27 shows the percentage of the optimized two key dimensions corresponding to the maximum ER when the two key dimensions are optimized sequentially based on optimized XL3 at different θ2. When θ2 increases from 0% to 20% of the initial value, the optimized D5 increases from 100% to 101% of the initial value, and when θ2 continues to increase 40% (2.74°) of its initial value, the optimized D5 decreases from 101% to 100% of the initial value. When θ2 continues to increase to 100% (4.57°), the optimized D5 remains unchanged. Thus, the change of θ2 has little impact on the optimized D5. When θ2 increases from 0% (0°) to 20% (0.92°), the optimized XL5 decreases from 130% to 125%. When θ2 further increases from 20% (0.92°) to 40% (1.83°) of the initial value, the optimized XL5 keeps at 125% of the initial value. With the θ2 continuing to increase, the optimized XL5 decreases almost linearly, and finally reaches 100% of the initial XL5 when θ2 is 100% of its initial value. In other words, the optimized XL5 nearly decreases with the increase of θ2, which is probably caused by the reason that XL5 is optimized based on optimized D5.
Table 5 shows the optimal ER values corresponding to the optimized two key dimensions at different θ2. It can be seen from the table that, the optimal ER with each optimized key dimension is obtained with the increase of θ2. When θ2 is 20% of the initial value (0.92°), ERs reach the maximum values of 0.5098 and 0.5169 when the optimized D5 and XL5 are 101% and 125% of their initial values, respectively. Therefore, the optimal θ2 is 20% of the initial value, which can offer the highest ER of 0.5169 when three key dimensions are optimized.
5. Conclusions
In this paper, the three key dimensions of XL3, D5, and XL5 are separately and sequentially optimized under different L1, θ1, L2, and θ2. Key conclusions are given below:
- (1)
- The optimization of L1 and θ1 can improve the ER by 2.9% and 2.4%, while the optimization of those of the diverging section of the nozzle can lift it by 31.5% and 22.9%, respectively. Thus, the ER improvement is quite limited if only one of the four parameters of the nozzle is optimized.
- (2)
- With the increase of XL3, a larger θ1 and a smaller L1 are needed to offer the maximum ER; with the increase of D5, it requires the larger of them to obtain the highest ER; however, ER has not an evident relation with θ1 or L1 with given XL5.
- (3)
- If XL3, D5, or XL5 is separately optimized based on given θ2 or L2. Each of the optimized dimensions is identified with a given angle or length of the nozzle diverging section; furthermore, smaller optimized D5 or XL5 can achieve better optimal ER.
- (4)
- With the given sequence of XL3→D5→XL5, optimized XL3 and D5 are obtained with given θ2; and optimized XL3 and XL5 are achieved with given L2. However, two exceptions are different from others, one is that the optimized XL5 decreases almost linearly with the increase of θ2; and the other is that the optimized D5 keeps unchanged with L2.
- (5)
- The ejector ER can be explained well with the number of shock clusters and shock chain length or area of low static pressure zone when the geometries vary.
Author Contributions
Conceptualization, J.Y. and C.W.; methodology, J.Y.; investigation, R.L.; writing—original draft preparation, R.L.; writing—review and editing, J.Y. and C.W. All authors have read and agreed to the published version of the manuscript.
Funding
The research was funded by the Educational Department of Sichuan Province, China (Funding No.: 17ZB0449).
Institutional Review Board Statement
Not applicable.
Informed Consent Statement
Not applicable.
Data Availability Statement
Not applicable.
Conflicts of Interest
The authors declare no conflict of interest.
Nomenclature
| Symbols | |
| L1 | length of nozzle converging section, mm |
| L2 | length of nozzle diverging section, mm |
| θ1 | angle of nozzle converging section, ° |
| θ2 | angle of nozzle diverging section, ° |
| XL3 | length of constant-pressure mixing chamber, mm |
| XL5 | length of constant-area mixing chamber, mm |
| D5 | diameter of constant-area mixing chamber, mm |
| S | relative sensitivity |
| ERm | maximum entrainment ratio |
| ERr | entrainment ratio of referred point |
| Gm | optimum geometry, mm |
| Gr | referred geometry, mm |
| P | pressure, kPa |
| T | temperature, K or °C |
| M | mass flow rate, g·s−1 |
| Subscripts | |
| 1 | nozzle converging section |
| 2 | nozzle diverging section |
| p | primary flow |
| s | secondary flow |
| Abbreviations | |
| AR | Area ratio |
| ER | Entrainment ratio |
| NXP | Nozzle exit position |
References
- Dong, H.; Xue, M.; Xiao, Y.; Liu, Y. Do carbon emissions impact the health of residents? Considering China’s industrialization and urbanization. Sci. Total Environ. 2021, 758, 143688. [Google Scholar] [CrossRef] [PubMed]
- Song, Y.; Wang, X.; Wang, L.; Pan, F.; Chen, W.; Xi, F. A twin-nozzle ejector for hydrogen recirculation in wide power operation of polymer electrolyte membrane fuel cell system. Appl. Energy 2021, 300, 117442. [Google Scholar] [CrossRef]
- Kanti, P.; Sharma, K.V.; Said, Z.; Bellos, E. Numerical study on the thermo-hydraulic performance analysis of fly ash nanofluid. J. Therm. Anal. Calorim. 2021, 147, 2101–2113. [Google Scholar] [CrossRef]
- Kanti, P.; Sharma, K.; Said, Z.; Kesti, V. Entropy generation and friction factor analysis of fly ash nanofluids flowing in a horizontal tube: Experimental and numerical study. Int. J. Therm. Sci. 2021, 166, 106972. [Google Scholar] [CrossRef]
- Zhang, K.; Liu, Z.; Wang, Y.; Li, Y.; Li, Q.; Zhang, J.; Liu, H. Flash evaporation and thermal vapor compression aided energy saving CO2 capture systems in coal-fired power plant. Energy 2014, 66, 556–568. [Google Scholar] [CrossRef]
- Reddick, C.; Sorin, M.; Sapoundjiev, H.; Aidoun, Z. Carbon capture simulation using ejectors for waste heat upgrading. Energy 2016, 100, 251–261. [Google Scholar] [CrossRef]
- Sriveerakul, T.; Aphornratana, S.; Chunnanond, K. Performance prediction of steam ejector using computational fluid dynamics: Part 1. Validation of the CFD results. Int. J. Therm. Sci. 2007, 46, 812–822. [Google Scholar] [CrossRef]
- Sriveerakul, T.; Aphornratana, S.; Chunnanond, K. Performance prediction of steam ejector using computational fluid dynamics: Part 2. Flow structure of a steam ejector influenced by operating pressures and geometries. Int. J. Therm. Sci. 2007, 46, 823–833. [Google Scholar] [CrossRef]
- Sun, W.; Ma, X.; Zhang, Y.; Jia, L.; Xue, H. Performance analysis and optimization of a steam ejector through streamlining of the primary nozzle. Case Stud. Therm. Eng. 2021, 27, 101356. [Google Scholar] [CrossRef]
- Sheng, Z.; Zhang, L.; Dan, Y.; Wang, Y. Configuration of the lobed nozzle in an ejector mixer for extreme mixing efficiency. Int. J. Heat Mass Tran. 2022, 183, 122102. [Google Scholar] [CrossRef]
- Li, H.; Wang, X.; Ning, J.; Zhang, P.; Huang, H.; Tu, J. Numerical investigation of the nozzle expansion state and its effect on the performance of the steam ejector based on ideal gas model. Appl. Therm. Eng. 2021, 199, 117509. [Google Scholar] [CrossRef]
- Yan, J.; Li, S.; Liu, Z. Numerical investigation on optimization of ejector primary nozzle geometries with fixed/varied nozzle exit position. Appl. Therm. Eng. 2020, 175, 115426. [Google Scholar] [CrossRef]
- Fu, W.; Liu, Z.; Li, Y.; Wu, H.; Tang, Y. Numerical study for the influences of primary steam nozzle distance and mixing chamber throat diameter on steam ejector performance. Int. J. Therm. Sci. 2018, 132, 509–516. [Google Scholar] [CrossRef]
- Thongtip, T.; Aphornratana, S. Impact of primary nozzle area ratio on the performance of ejector refrigeration system. Appl. Therm. Eng. 2021, 188, 116523. [Google Scholar] [CrossRef]
- Fu, W.; Li, Y.; Liu, Z.; Wu, H.; Wu, T. Numerical study for the influences of primary nozzle on steam ejector performance. Appl. Therm. Eng. 2016, 106, 1148–1156. [Google Scholar] [CrossRef]
- Chen, S.; Chen, G.; Fang, L. An experimental study and 1-D analysis of an ejector with a movable primary nozzle that operates with R236fa. Int. J. Refrig. 2015, 60, 19–25. [Google Scholar] [CrossRef]
- El Zohbi, B.; Bukharin, N.; Assoum, H.H.; Abed-Meraim, K.; Sakout, A.; El Hassan, M. Investigation of the effects of the jet nozzle geometry and location on the performance of supersonic fluid ejectors. Energy Rep. 2022, 8, 228–233. [Google Scholar] [CrossRef]
- Zhu, Y.; Cai, W.; Wen, C.; Li, Y. Numerical investigation of geometry parameters for design of high performance ejectors. Appl. Therm. Eng. 2009, 29, 898–905. [Google Scholar] [CrossRef]
- Dong, J.; Hu, Q.; Yu, M.; Han, Z.; Cui, W.; Liang, D.; Ma, H.; Pan, X. Numerical investigation on the influence of mixing chamber length on steam ejector performance. Appl. Therm. Eng. 2020, 174, 115204. [Google Scholar] [CrossRef]
- Varga, S.; Oliveira, A.C.; Diaconu, B. Influence of geometrical factors on steam ejector performance—A numerical assessment. Int. J. Refrig. 2009, 32, 1694–1701. [Google Scholar] [CrossRef]
- Reis, L.B.; Gioria, R.D.S. Optimization of liquid jet ejector geometry and its impact on flow fields. Appl. Therm. Eng. 2021, 194, 117132. [Google Scholar] [CrossRef]
- Li, R.; Yan, J.; Reddick, C. Optimization of three key ejector geometries under fixed and varied operating conditions: A numerical study. Appl. Therm. Eng. 2022, 211, 118537. [Google Scholar] [CrossRef]
- Reddick, C.; Sorin, M.; Sapoundjiev, H.; Aidoun, Z. Effect of a mixture of carbon dioxide and steam on ejector performance: An experimental parametric investigation. Exp. Therm. Fluid Sci. 2018, 92, 353–365. [Google Scholar] [CrossRef]
- Hemidi, A.; Henry, F.; Leclaire, S.; Seynhaeve, J.; Bartosiewicz, Y. CFD analysis of a supersonic air ejector. Part II: Relation between global operation and local flow features. Appl. Therm. Eng. 2009, 29, 2990–2998. [Google Scholar] [CrossRef] [Green Version]
- Besagni, G.; Cristiani, N.; Croci, L.; Guédon, G.R.; Inzoli, F. Computational fluid-dynamics modelling of supersonic ejectors: Screening of modelling approaches, comprehensive validation and assessment of ejector component efficiencies. Appl. Therm. Eng. 2021, 186, 116431. [Google Scholar] [CrossRef]
- Ji, M.; Utomo, T.; Woo, J.; Lee, Y.; Jeong, H.; Chung, H. CFD investigation on the flow structure inside thermo vapor compressor. Energy 2010, 35, 2694–2702. [Google Scholar] [CrossRef]
- Mohammadi, A. An investigation of geometrical factors of multi-stage steam ejectors for air suction. Energy 2019, 186, 115808. [Google Scholar] [CrossRef]
Figure 1.
Schematic of the utilized ejector.

Figure 2.
Schematic of the ejector-based carbon capture system.

Figure 3.
2D axisymmetric quadrilateral grid structure.

Figure 4.
Axial static pressure distribution under low, medium and high grid densities.

Figure 5.
Comparison of CFD and experimental ER.

Figure 6.
Impact of the L1 on ER.

Figure 7.
Impact of the θ1 on ER.

Figure 8.
Impact of XL3 on ER as XL3 varies from 20% to 60% of its initial value under varied L1.

Figure 9.
Mach number distribution contour at different XL3 when the L1 is 100%.

Figure 10.
Static pressure (unit: kPa) distribution contour at different XL3 when the L1 is 100% of its initial value.
Figure 10.
Static pressure (unit: kPa) distribution contour at different XL3 when the L1 is 100% of its initial value.

Figure 11.
Impact of D5 on ER as D5 varies from 92% to 95% of its initial value under varied L1.

Figure 12.
Impact of XL5 on ER as XL5 varies from 45% to 75% of its initial value under varied L1.

Figure 13.
Impact of XL3 on ER as XL3 varies from 30% to 50% of its initial value under varied θ1.

Figure 14.
Impact of D5 on ER as D5 varies from 93% to 96% of its initial value under varied θ1.

Figure 15.
Impact of XL5 on ER as XL5 varies from 60% to 80% of its initial value under varied θ1.

Figure 16.
Impact of D5 on ER (with optimized XL3) as L1 varies from 40% to 120% of its initial value.
Figure 16.
Impact of D5 on ER (with optimized XL3) as L1 varies from 40% to 120% of its initial value.

Figure 17.
Impact of XL5 on ER (with optimized D5) as L1 varies from 40% to 120%.

Figure 18.
Impact of percentage of D5 on ER (with optimized XL3) when θ1 varies from 60% to 140%.

Figure 19.
Impact of percentage of XL5 on ER (with optimized D5) as θ1 varies from 60% to 140%.

Figure 20.
Impact of the length of diverging section of the primary nozzle on ER.

Figure 21.
Mach number distribution contour at different L2.

Figure 22.
Impact of the angle of diverging section of the primary nozzle on ER.

Figure 23.
Mach number distribution contour at different θ2.

Figure 24.
Optimized XL3, D5 and XL5 at different L2.

Figure 25.
Optimized XL3, D5 and XL5 at different θ2.

Figure 26.
Optimized two key dimensions at different L2 (based on optimized XL3).

Figure 27.
Optimized two key dimensions at different θ2 (based on optimized XL3).


Table 1.
Initial ejector geometries.
| Parameters | Value |
|---|---|
| L1 | 65 mm |
| θ1 | 7.72° |
| L2 | 10 mm |
| θ2 | 4.58° |
| XL3 | 20 mm |
| XL5 | 58 mm |
| XL6 | 139 mm |
| D1 | 22.2 mm |
| D2 | 6.4 mm |
| D3 | 6.2 mm |
| D5 | 9.5 mm |
| D6 | 29 mm |
Table 2.
Inlet and outlet conditions of the studied ejector (refer to Figure 1).
Table 2.
Inlet and outlet conditions of the studied ejector (refer to Figure 1).
| Primary flow inlet | 350 (kPa) | 427 (K) |
| Secondary flow inlet | 70 (kPa) | 373 (K) |
| Outlet | 130 (kPa) | 388 (K) |
Table 3.
ER under different L1 when D5 is 98%, 99%, and 100% of the initial value (based on optimized XL3).
Table 3.
ER under different L1 when D5 is 98%, 99%, and 100% of the initial value (based on optimized XL3).
| Percentage of D5 | L1 | ||||
|---|---|---|---|---|---|
| 26 mm | 39 mm | 52 mm | 65 mm | 78 mm | |
| 98% | 0.44141 | 0.44160 | 0.44172 | 0.44170 | 0.44135 |
| 99% | 0.45793 | 0.45806 | 0.45821 | 0.45813 | 0.45775 |
| 100% | 0.47468 | 0.47474 | 0.47495 | 0.47480 | 0.47437 |
Table 4.
Optimal ER corresponding to the optimized dimensions under different L2 (based on optimized XL3).
Table 4.
Optimal ER corresponding to the optimized dimensions under different L2 (based on optimized XL3).
| Varied L2 (mm) | Optimal ER with Optimized D5 | Optimal ER with Optimized XL5 |
|---|---|---|
| 0 | 0.4665 | 0.4673 |
| 2 | 0.4828 | 0.4958 |
| 4 | 0.5017 | 0.5027 |
| 6 | 0.4984 | 0.4985 |
| 8 | 0.4971 | 0.5025 |
| 10 | 0.4763 | 0.4889 |
| 12 | 0.4568 | 0.4571 |
Table 5.
Optimal ER corresponding to the optimized dimensions under different θ2 (based on optimized XL3).
Table 5.
Optimal ER corresponding to the optimized dimensions under different θ2 (based on optimized XL3).
| Varied θ2 | Optimal ER with Optimized D5 | Optimal ER with Optimized XL5 |
|---|---|---|
| 0° | 0.4689 | 0.4691 |
| 0.92° | 0.5098 | 0.5169 |
| 1.83° | 0.5094 | 0.5108 |
| 2.74° | 0.5005 | 0.5036 |
| 3.66° | 0.4978 | 0.4978 |
| 4.57° | 0.4764 | 0.4889 |
Disclaimer/Publisher’s Note: The statements, opinions and data contained in all publications are solely those of the individual author(s) and contributor(s) and not of MDPI and/or the editor(s). MDPI and/or the editor(s) disclaim responsibility for any injury to people or property resulting from any ideas, methods, instructions or products referred to in the content. |
© 2022 by the authors. Licensee MDPI, Basel, Switzerland. This article is an open access article distributed under the terms and conditions of the Creative Commons Attribution (CC BY) license (https://creativecommons.org/licenses/by/4.0/).
Share and Cite
MDPI and ACS Style
Yan, J.; Li, R.; Wang, C. Optimization of Three Key Geometries of a Steam Ejector under Varied Primary Nozzle Geometries. Entropy 2023, 25, 15. https://doi.org/10.3390/e25010015
AMA Style
Yan J, Li R, Wang C. Optimization of Three Key Geometries of a Steam Ejector under Varied Primary Nozzle Geometries. Entropy. 2023; 25(1):15. https://doi.org/10.3390/e25010015
Chicago/Turabian StyleYan, Jia, Ruixin Li, and Chen Wang. 2023. "Optimization of Three Key Geometries of a Steam Ejector under Varied Primary Nozzle Geometries" Entropy 25, no. 1: 15. https://doi.org/10.3390/e25010015
Note that from the first issue of 2016, this journal uses article numbers instead of page numbers. See further details here.