
The Interpretation of Graphical Information in Word Processing

Abstract
:1. Introduction
1.1. Aims and Methods
1.2. Hypothesis
1.3. The Algorithm of the Process
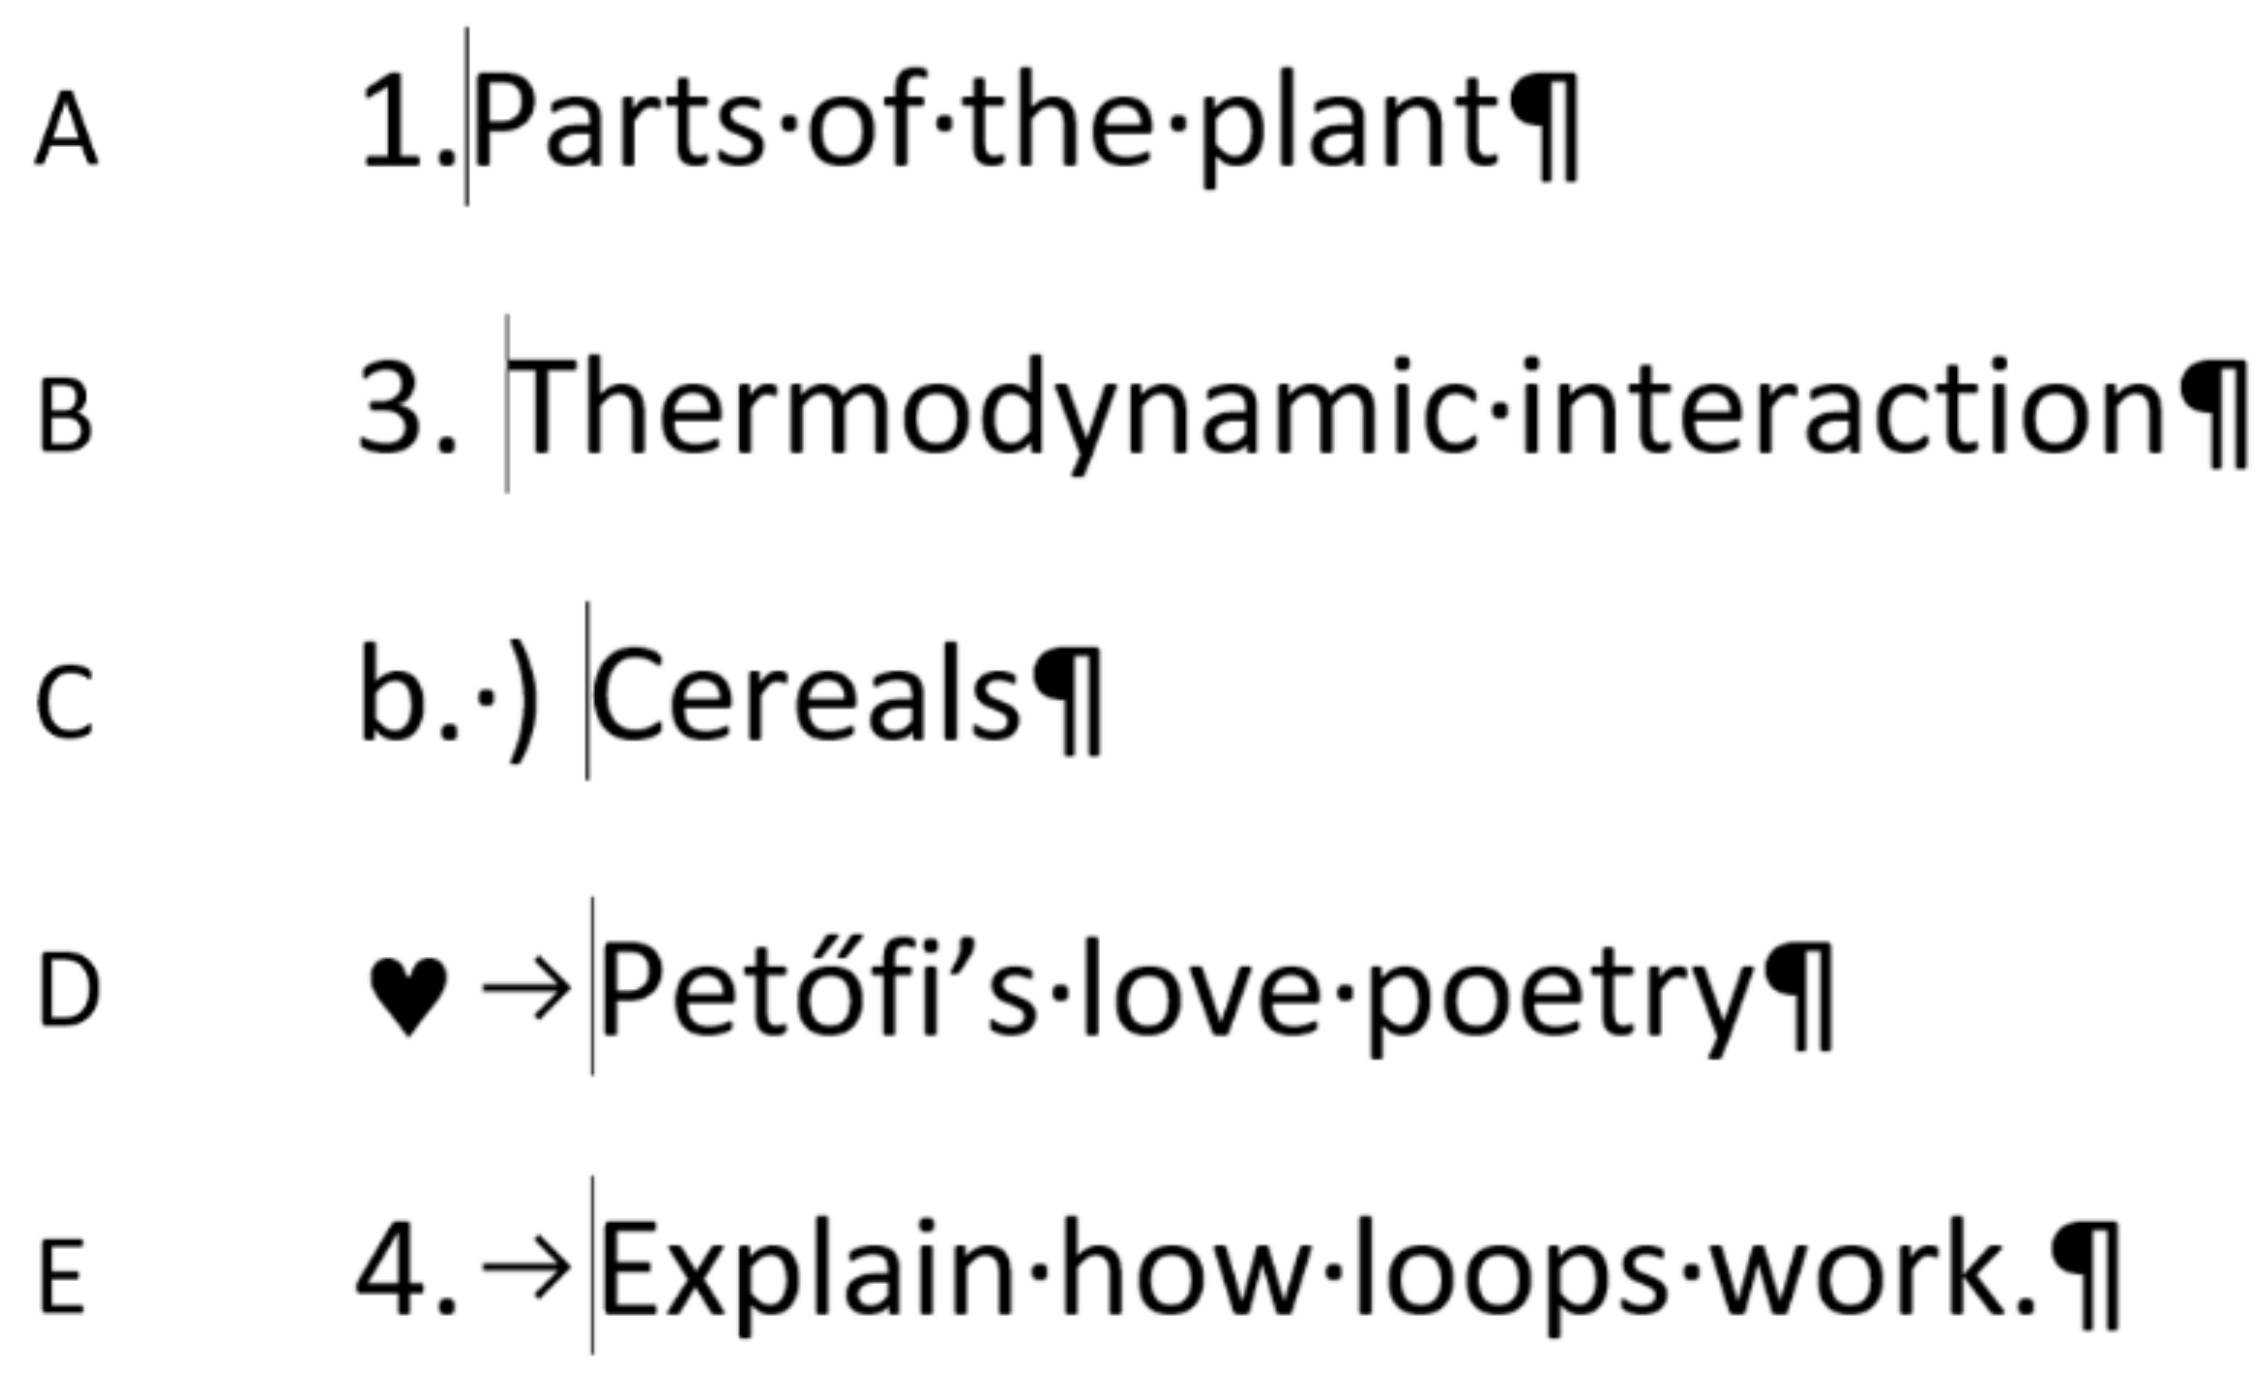
- A mini paper-based competence test was carried out to measure students’ knowledge of automated numbering. One-bit data were presented as the position of the cursor in the example of five samples. Based on this data, students must decide whether the samples are correct or not (automated or manual numbering);
- The analysis of the most popular word processors was carried out with a focus on tools for supporting automated numbering and for displaying non-printing characters;
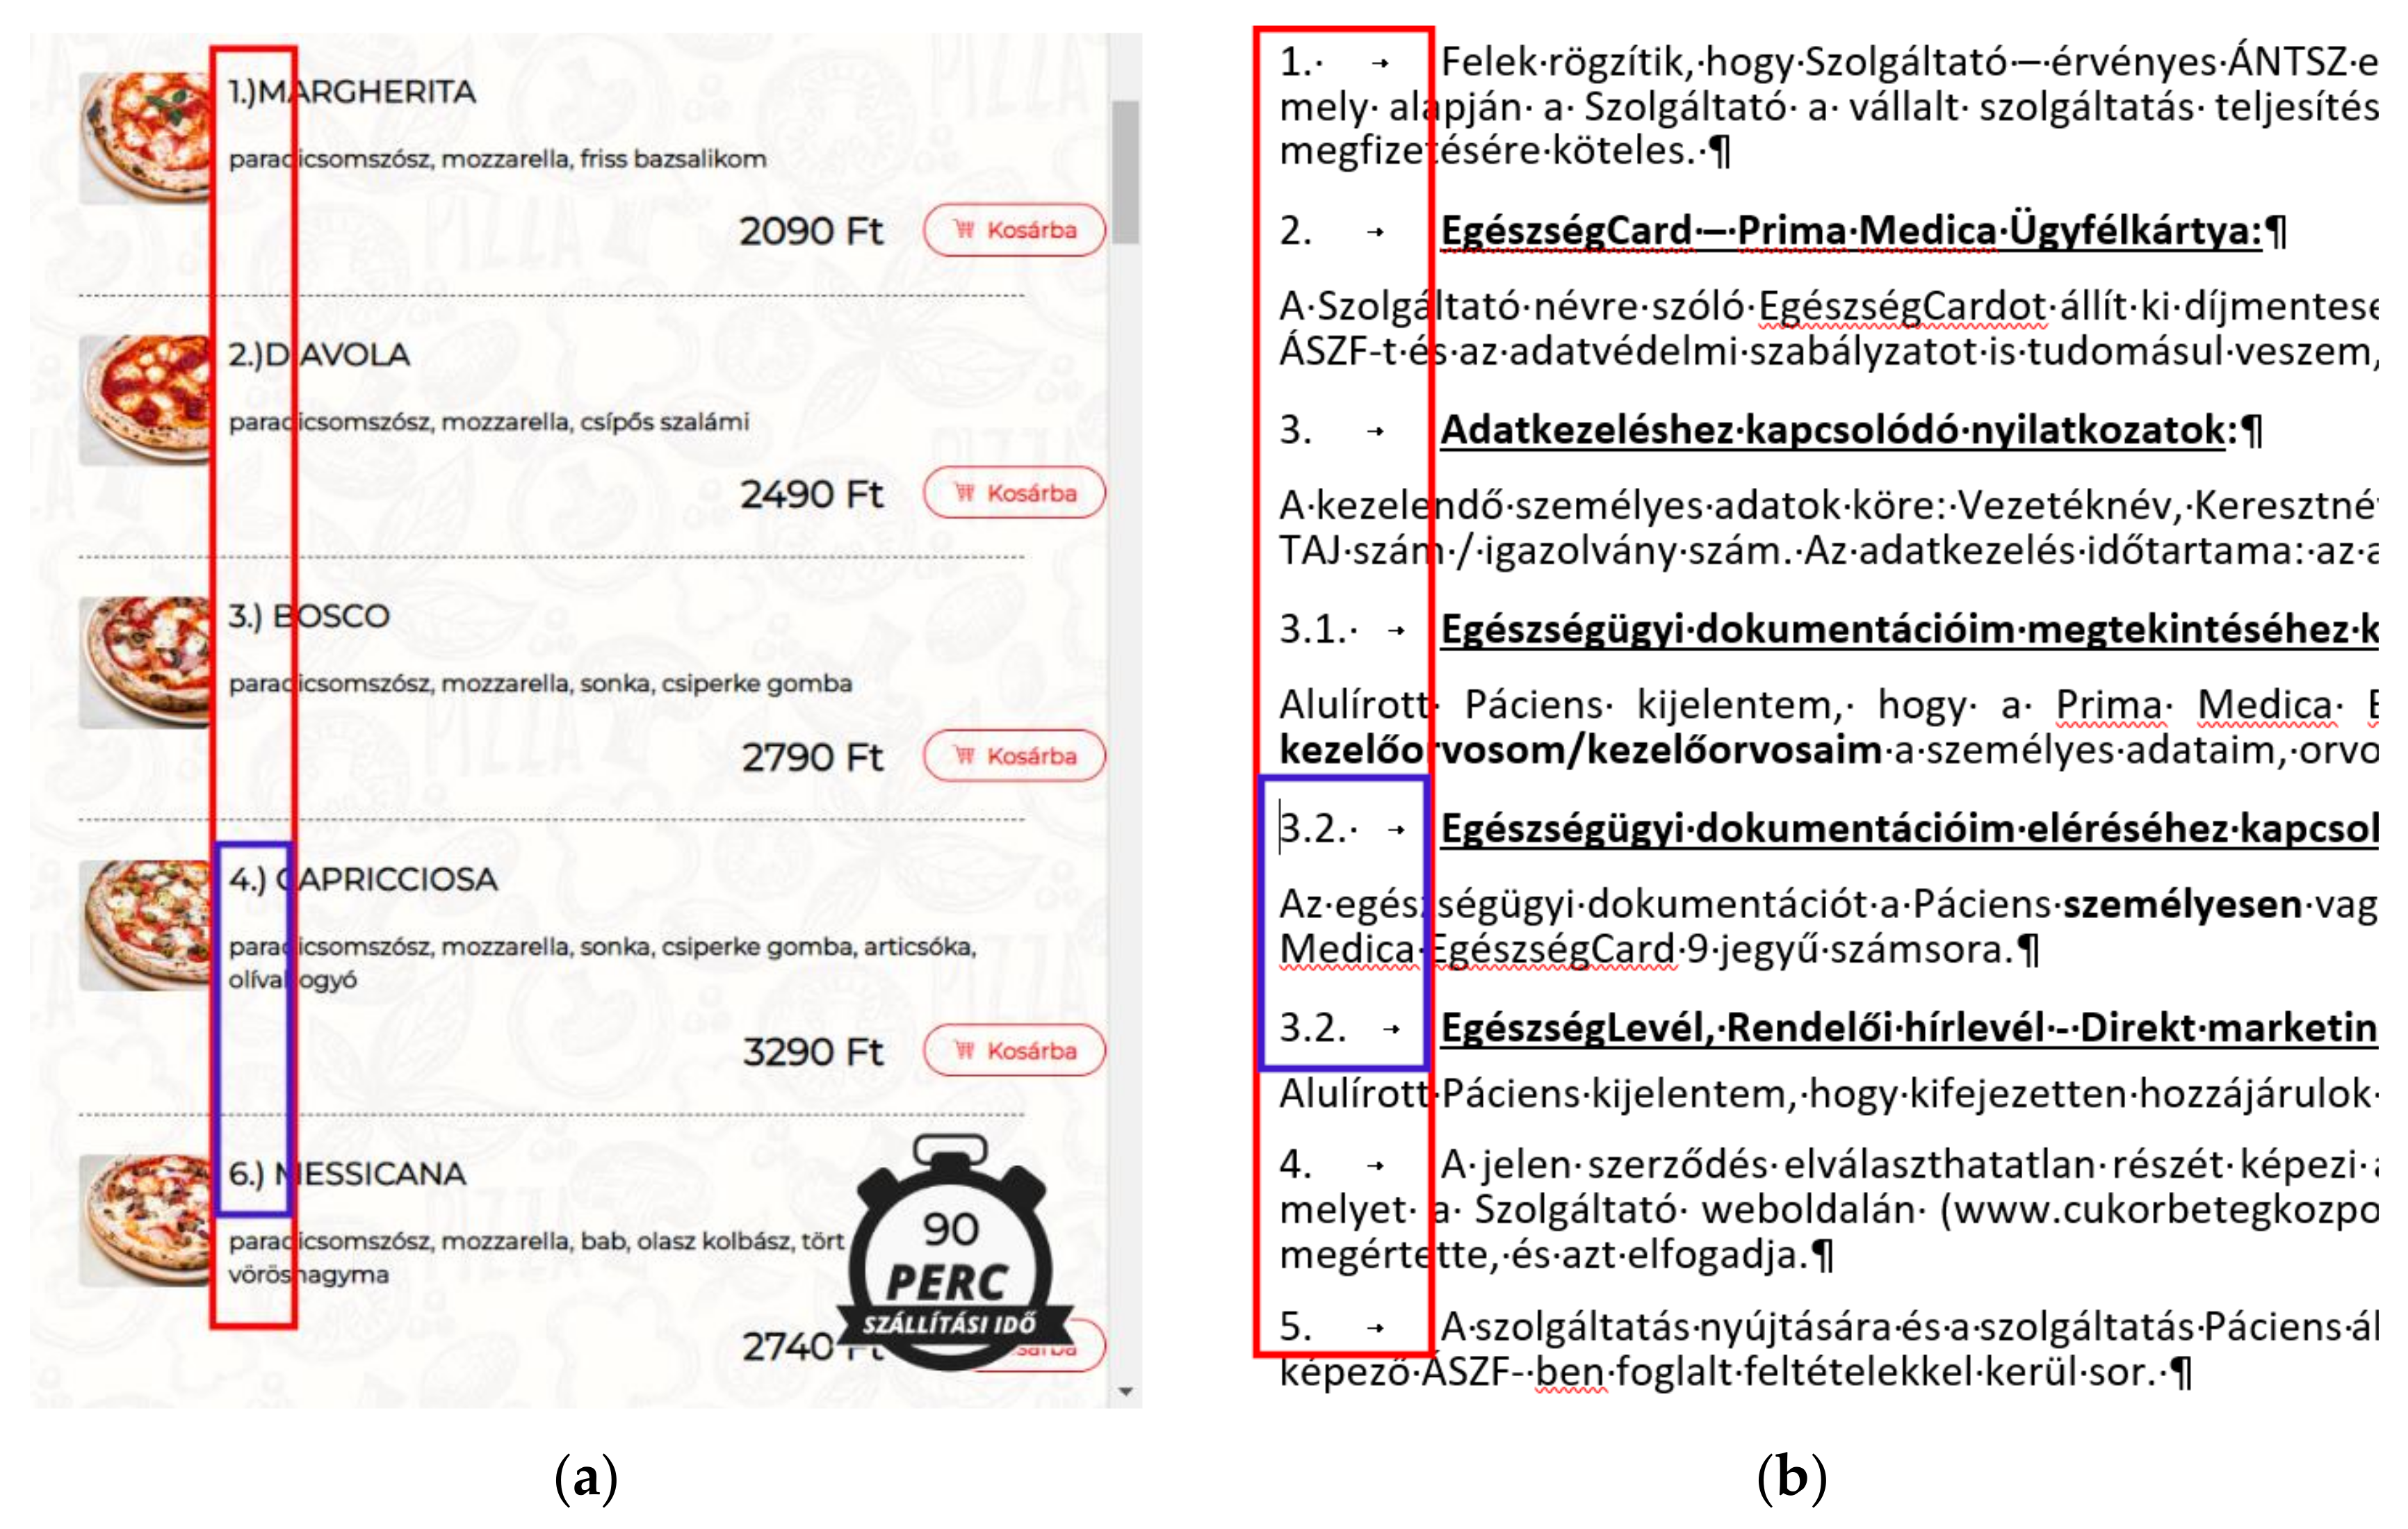
- The analysis of the semantics of automated numbering was carried out in MS Word. What tools the software offers to complete and modify automated numbering and what graphical data are put on the interface to indicate the presence of numbering were tested;
- We then built a corpus of word-processed texts with DOC or DOCX extensions;
- Considering Shannon’s original definition of entropy and formulating our concept of the entropy of the selected phenomenon (automated numbering), we aimed to measure how much data should be put on the different channels to solve the one-bit problem presented in the mini competence test (detailed in Section 3.3).
2. Materials and Methods
2.1. Selection of Application
2.2. Automated Numbering
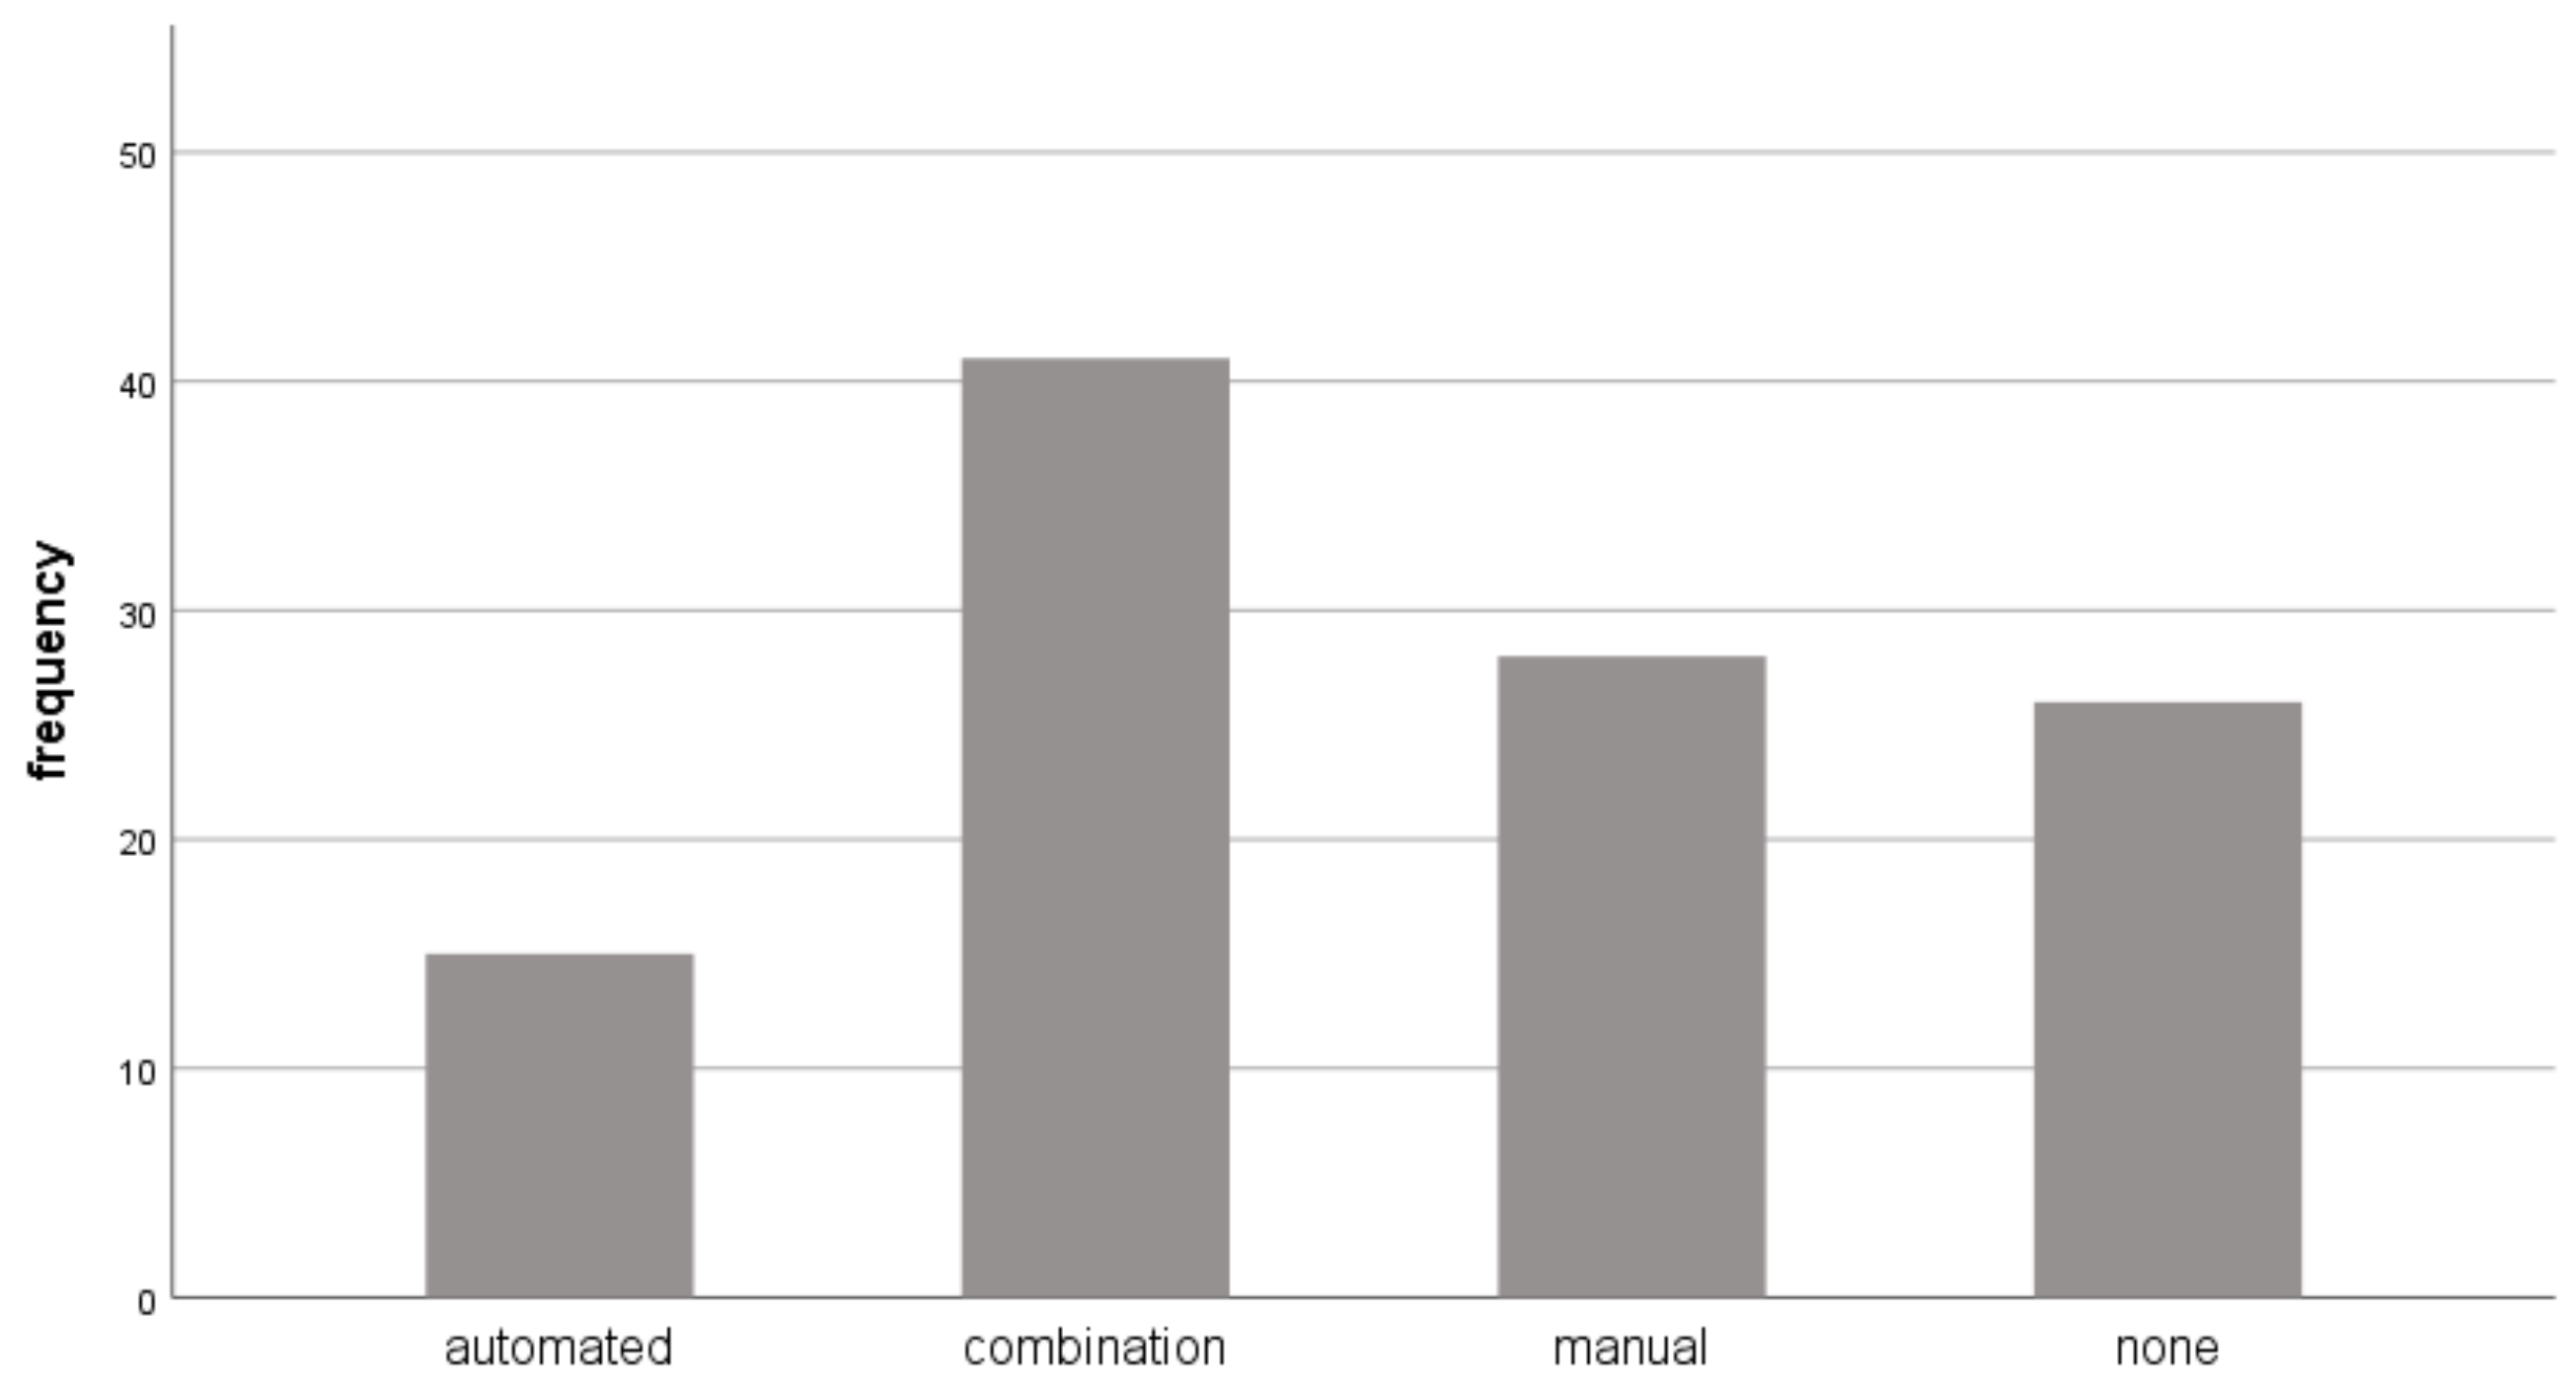
- Documents without numbering (26 documents);
- Automated numbering (15 documents);
- Manual numbering (carried out by typing both the leading and separator character(s)) (28 documents);
- A combination of automated and manual numbering (41 documents);
- Imitation of indentation with Space characters (Line 2);
- Double Space characters in the middle of the sentences (Lines 1, 3, 4, 7);
- Varying number of Space characters following the numbering;
- Arbitrary punctuation;
- Arbitrarily used font styles.
- An empty paragraph before and after the numbered paragraphs;
- Inconsistent use of vertical spaces before and after the numbered paragraphs;
- Underlining;
- Unnecessary bold;
- Justified alignment without hyphenation;
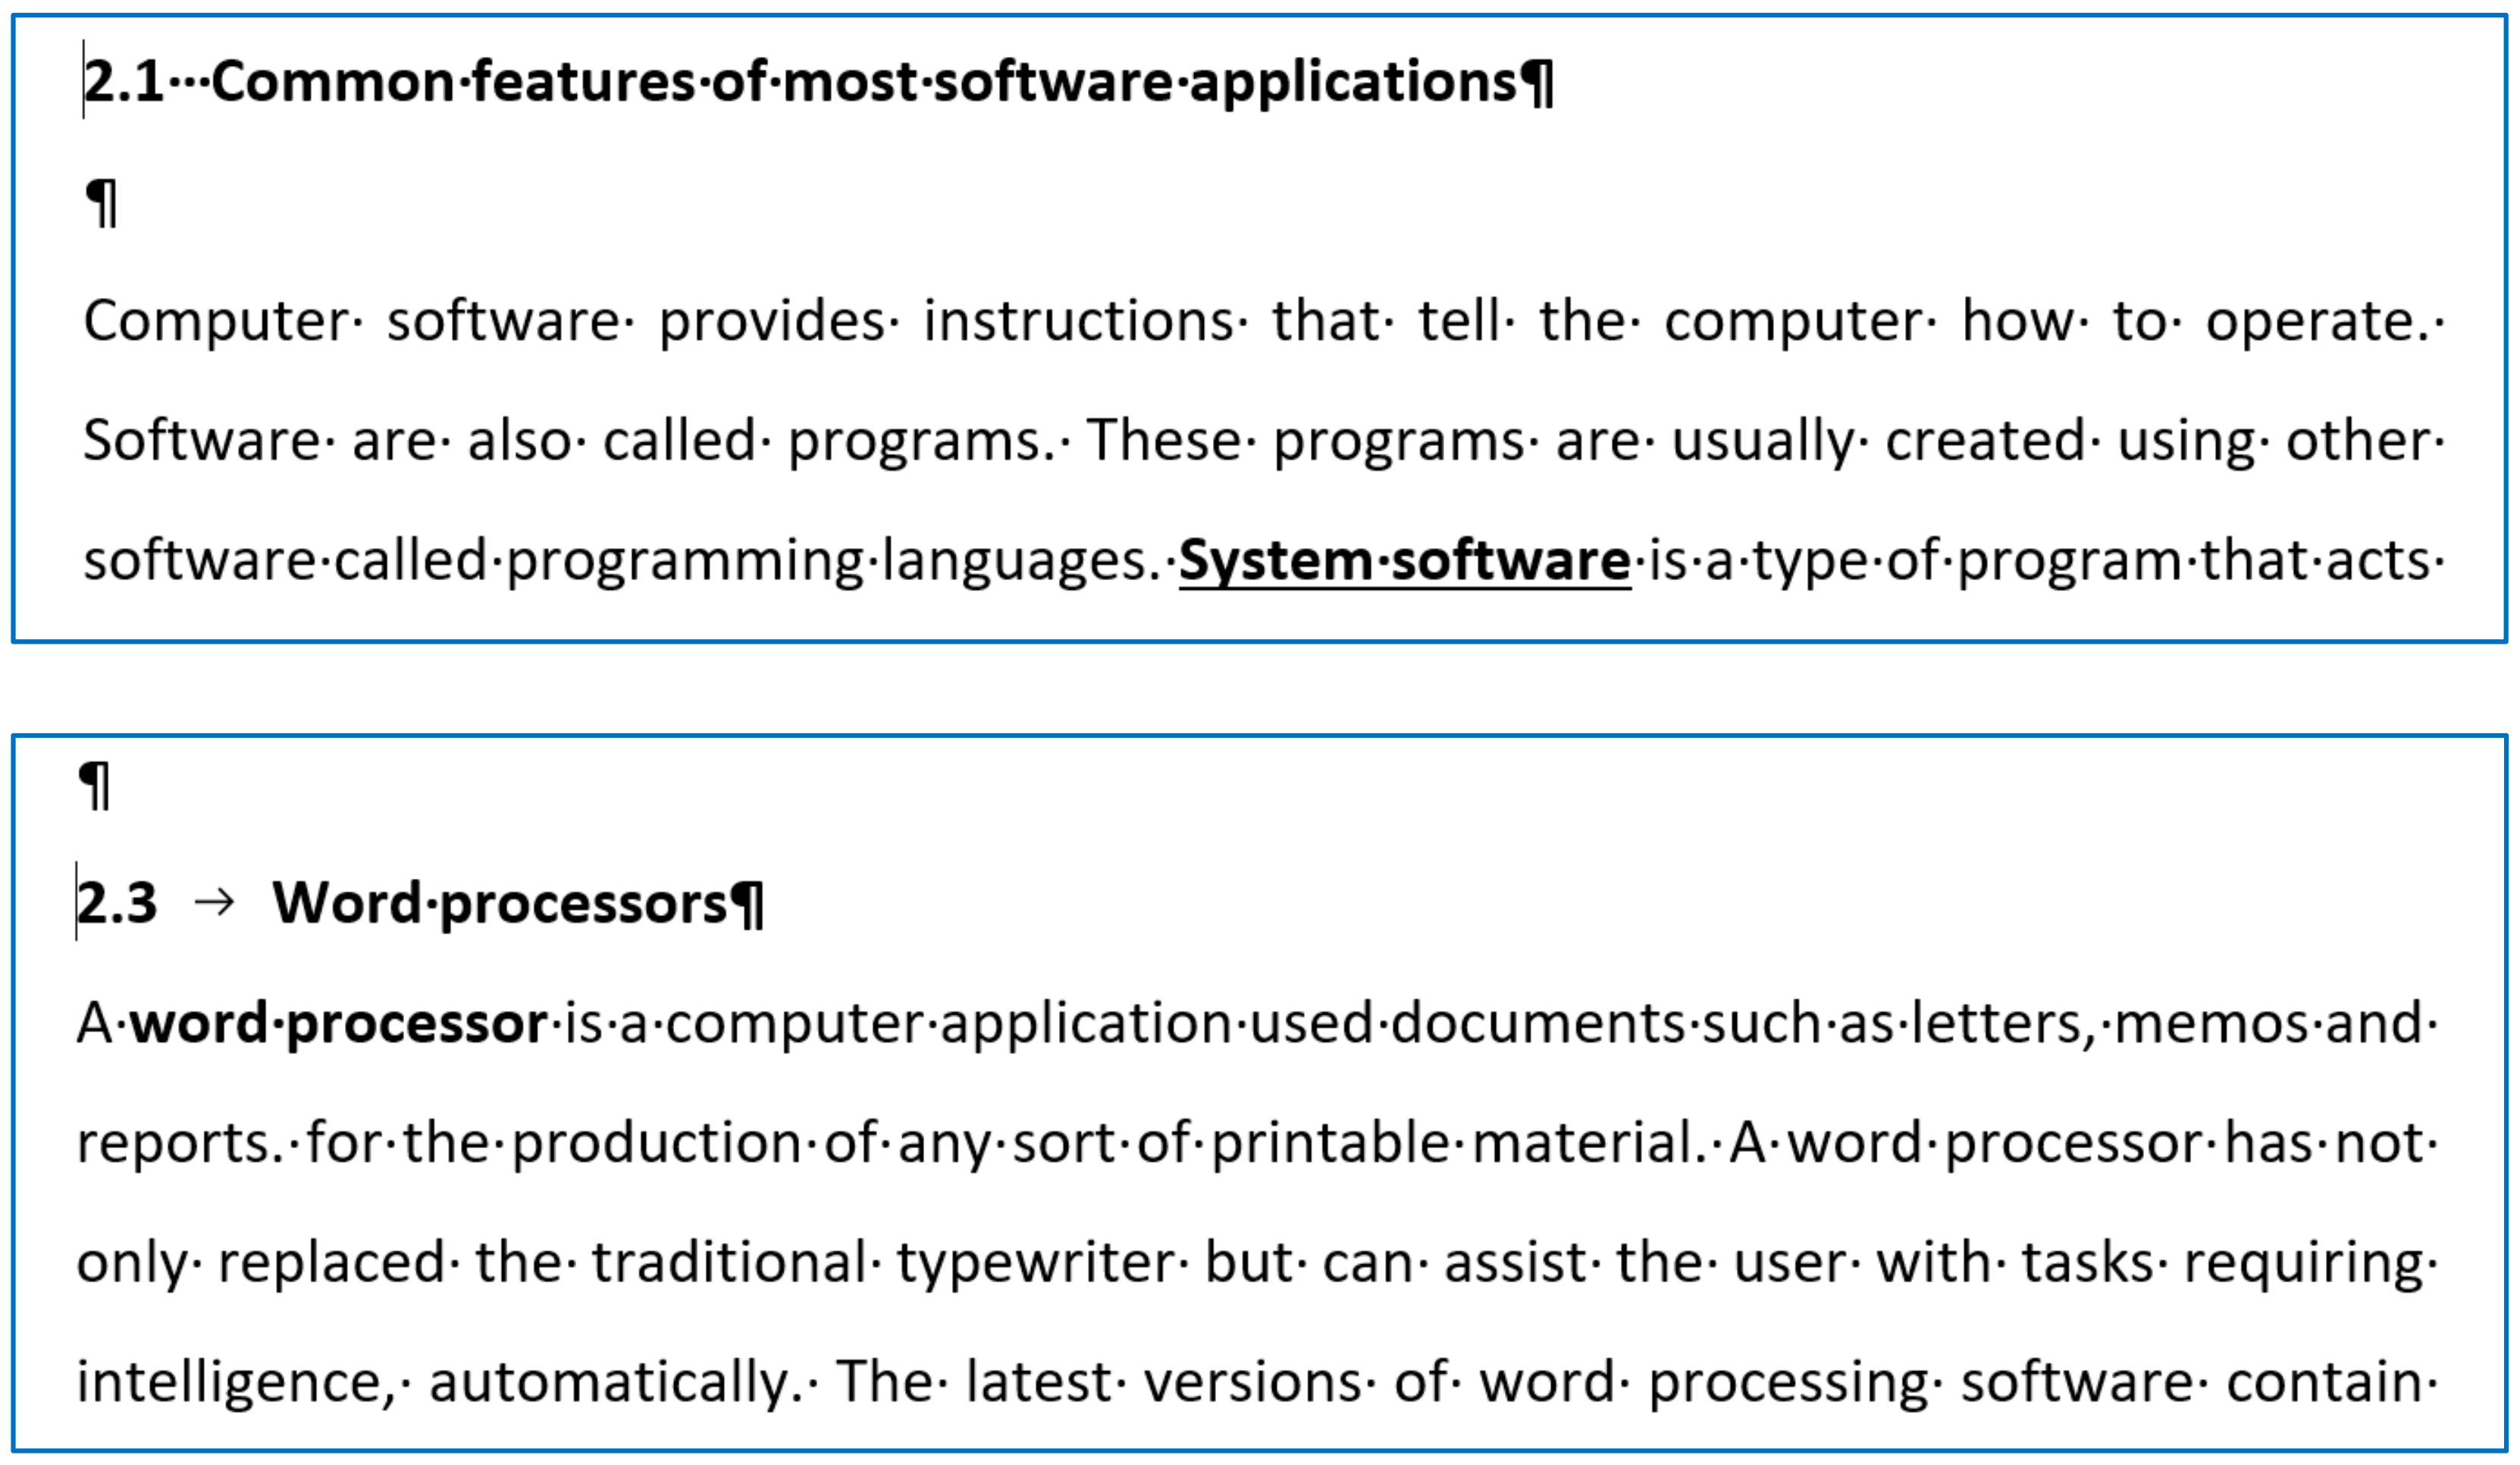
- A semantic error. Because software and programs are not synonyms ({programs} ⊂ {software}), the set of software includes the set of programs e.g., data files ∈ {software} but data files ∉ ({programs});
- A semantic error in the paragraph following paragraph 2.3.
2.3. Testing
2.4. Formatted Automated Numbering
- The numbering character (number, letter, special character) (NC);
- The separator character (none, Space, Tabulator) (SC);
- The indentation of the paragraph;
- The position of the cursor.
3. Results
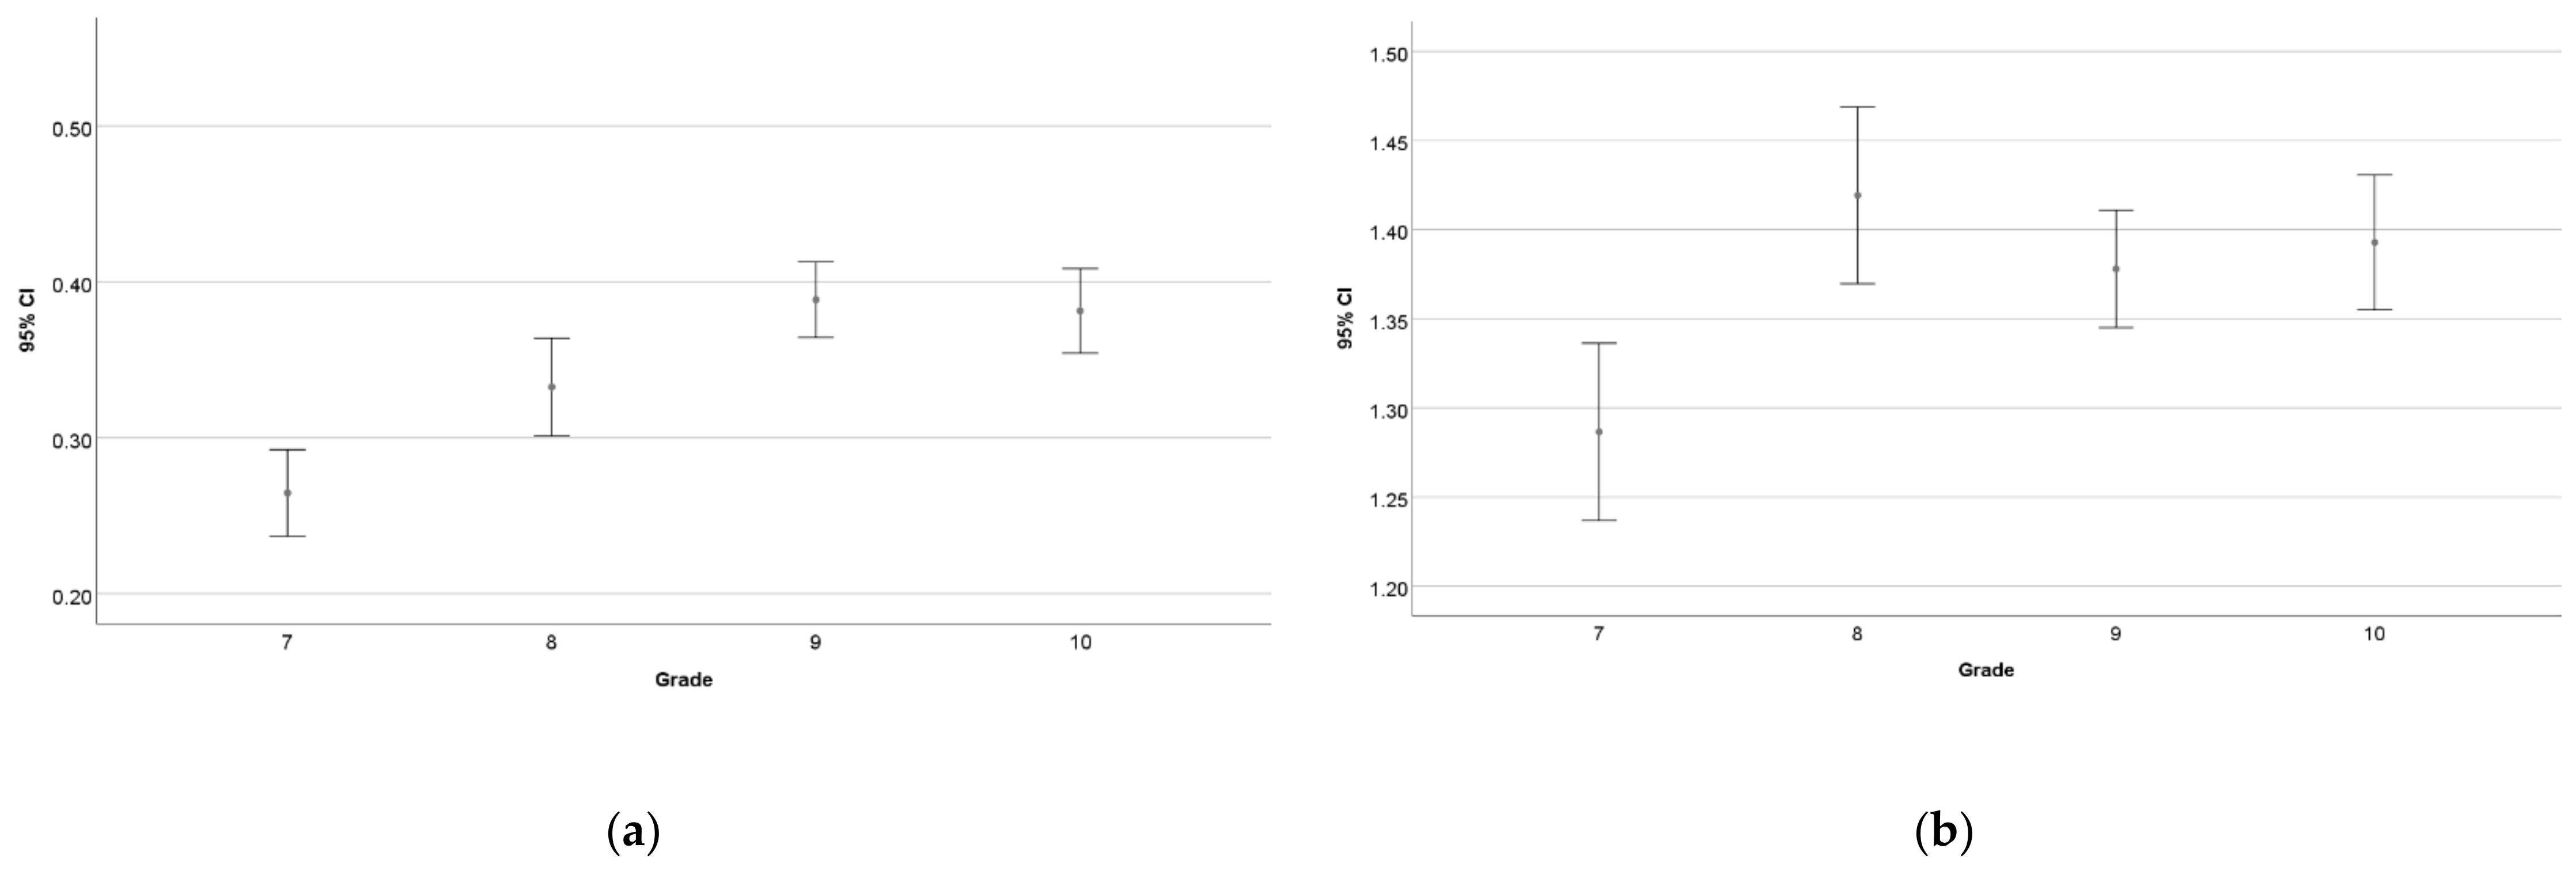
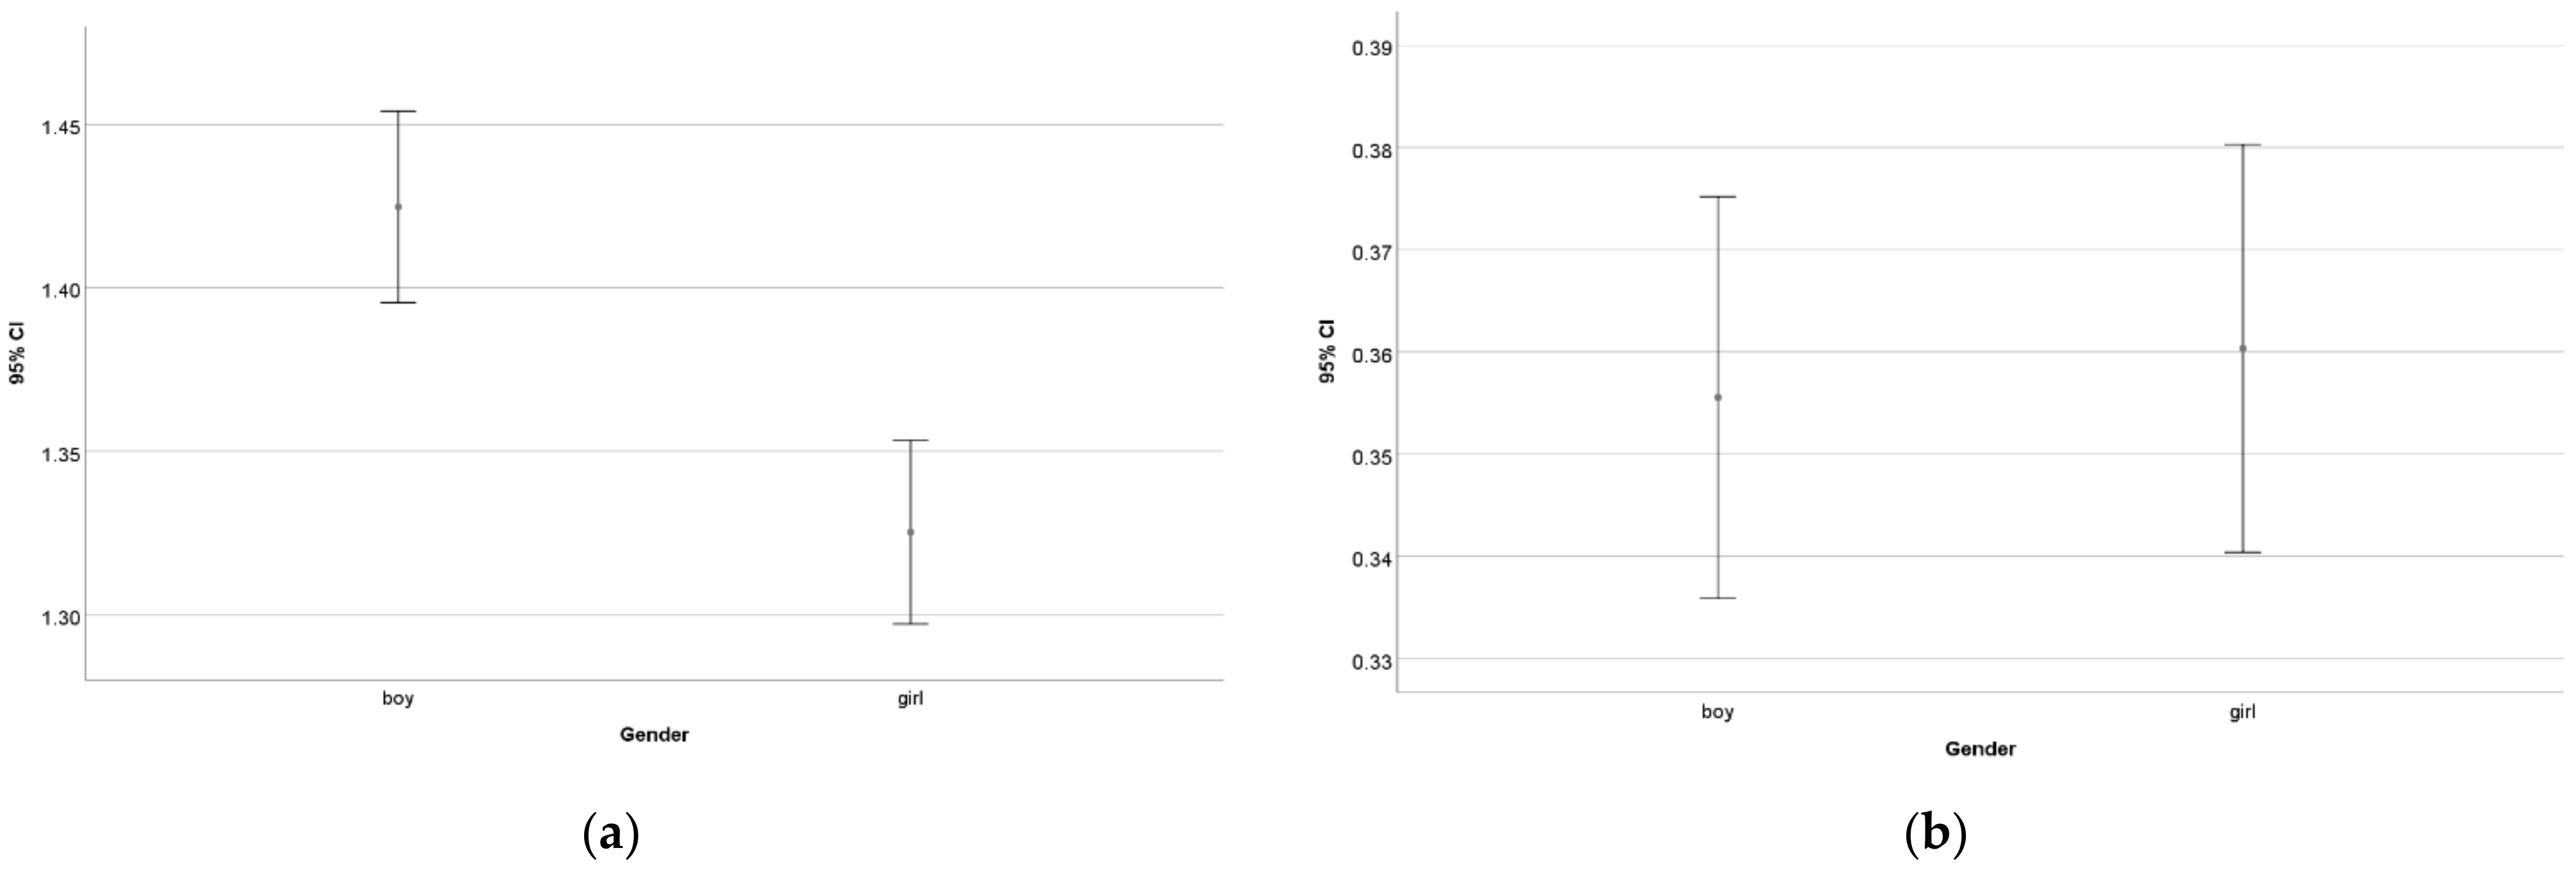
3.1. Results of the Test
3.2. Clusters of the Students’ Results
3.3. The Entropy of Automated Numbering
4. Discussion
5. Conclusions
Author Contributions
Funding
Institutional Review Board Statement
Conflicts of Interest
References
- A Little Learning about Word Processing, Eric Johnson, Dakota State University. Available online: https://www.uv.es/~fores/programa/johnson_wordprocessing2.html (accessed on 14 June 2022).
- Kirschenbaum, M.G. Track Changes: A Literary History of Word Processing; Harvard University Press: Cambridge, MA, USA, 2016. [Google Scholar]
- Ben-Ari, M.; Yeshno, T. Conceptual models of software artifacts. Interact. Comput. 2006, 18, 1336–1350. [Google Scholar] [CrossRef] [Green Version]
- Ben-Ari, M. Bricolage Forever! In Proceedings of the PPIG 1999—11th Annual Workshop, Leeds, UK, 5–7 January 1999; Available online: http://www.ppig.org/papers/11th-benari.pdf (accessed on 21 July 2015).
- Csernoch, M. Methodological Questions of Teaching Word Processing. In Proceedings of the 3rd International Conference on Applied Informatics, Eger-Noszvaj, Hungary, 5–7 January 1997; pp. 375–382. [Google Scholar]
- Csernoch, M. Teaching word processing—The theory behind. Teach. Math. Comput. Sci. 2009, 119–137. [Google Scholar] [CrossRef]
- Csernoch, M. Teaching word processing—The practice. Teach. Math. Comput. Sci. 2010, 8, 247–262. [Google Scholar] [CrossRef]
- Csernoch, M. Clearing Up Misconceptions About Teaching Text Editing. In Proceedings of the ICERI2011: 4th International Conference of Education, Research and Innovation, Madrid, Spain, 14–16 November 2011; pp. 407–415. [Google Scholar]
- Csernoch, M. Do You Speak and Write in Informatics? In Proceedings of the 10th International Multi-Conference on Complexity, Informatics and Cybernetics, Orlando, FL, USA, 12–15 March 2019; pp. 147–152. [Google Scholar]
- Csernoch, M. Thinking Fast and Slow in Computer Problem Solving. J. Softw. Eng. Appl. 2017, 10, 1–31. [Google Scholar] [CrossRef] [Green Version]
- Csernoch, M.; Biró, P. Wasting Human and Computer Resources. Int. J. Soc. Educ. Econ. Manag. Eng. 2015, 9, 573–581. [Google Scholar]
- Gibbs, S.; Steel, G.; Kuiper, A. Expectations of Competency: The Mismatch between Employers’ and Graduates’ Views of End-User Computing Skills Requirements in the Workplace. J. Inf. Technol. Educ. 2011, 10, 371–382. [Google Scholar] [CrossRef]
- McLennan, T.; Gibbs, S. Has the Computing Competence of First Year University Students Increased During the Last Decade? Ascilite Melbourne. 2008. Available online: https://researcharchive.lincoln.ac.nz/bitstream/handle/10182/3786/computing_competence.pdf?sequence=1 (accessed on 15 September 2022).
- Gibbs, S.; Steel, G.; McKinnon, A. Are Workplace End-User Computing Skills at a Desirable Level? A New Zealand Perspective. 2014. Available online: https://www.researchgate.net/publication/287552807_Are_workplace_end-user_computing_skills_at_a_desirable_level_a_New_Zealand_perspective (accessed on 16 September 2022).
- Gibbs, S.; Moore, K.; Steel, G.; McKinnon, A. The Dunning-Kruger Effect in a workplace computing setting. Comput. Hum. Behav. 2017, 72, 589–595. [Google Scholar] [CrossRef]
- Gibbs, S. Computer self-efficacy—Is there a gender gap in tertiary level introductory computing classes? J. Appl. Comput. Inf. Technol. 2013, 17, 43–48. [Google Scholar]
- Gibbs, S. The Above Average Effect in an End-User Computing Context; Lincoln University: Philadelphia, PA, USA, 2016; Available online: https://researcharchive.lincoln.ac.nz/bitstream/handle/10182/7735/Gibbs_PhD.pdf (accessed on 7 September 2022).
- Gibbs, S.; Steel, G.; McKinnon, A. A content validity approach to creating an end-user computer skill assessment tool. J. Appl. Comput. Inf. Technol. 2015, 19, 1–19. Available online: https://researcharchive.lincoln.ac.nz/rest/bitstreams/29312/retrieve (accessed on 16 July 2022).
- Repenning, A.; Ioannidou, A. What Makes End-User Development Tick? 13 Design Guidelines. In Human-Computer Interaction Series; Springer: Berlin/Heidelberg, Germany, 2006; Volume 9, pp. 51–86. [Google Scholar]
- Nagy, T.; Csernoch, M. Measuring the Level of Computer Problem Solving Abilities in Teaching Informatics. In Proceedings of the InfoÉra Conference, Zamárdi, Hungary, 22–24 November 2018; In Hungarian: Számítógépes Problémamegoldás Mérése az Informatika Órán. Available online: https://people.inf.elte.hu/szlavi/InfoDidact18/Infodidact2018.pdf (accessed on 28 September 2020).
- Curts, E. How to Show Non-Printing Characters in Google Docs. 2017. Available online: .https://www.controlaltachieve.com/2017/03/docs-nonprinting-characters.html (accessed on 15 September 2022).
- Kenyon, C. Show/Hide Non-Printing Formatting Characters. 2022. Available online: http://www.addbalance.com/word/nonprinting.htm (accessed on 6 July 2022.).
- Suzanne, S.B. Word’s Nonprinting Formatting Marks. 2017. Available online: http://wordfaqs.ssbarnhill.com/NonprintChars.htm (accessed on 6 July 2022.).
- Dodlapati, S.R.; Lakkaraju, P.; Tulluru, N.; Zeng, Z. Non Printable & Special Characters: Problems and How to Overcome Them, PharmaSUG2010—Paper CC13. 2010. Available online: https://www.lexjansen.com/pharmasug/2010/CC/CC13.pdf (accessed on 16 July 2022).
- Shannon, C.E. A Mathematical Theory of Communication. Bell Syst. Tech. J. 1948, 27, 379–423. [Google Scholar] [CrossRef] [Green Version]
- Shannon, C.E. A Mathematical Theory of Communication. Bell Syst. Tech. J. 1948, 27, 623–656. [Google Scholar] [CrossRef]
- Shannon, C.E. Prediction and entropy of printed English. Bell Syst. Tech. J. 1951, 30, 50–64. [Google Scholar] [CrossRef]
- Information Entropy (Foundations of Information Theory: Part 2), Matthew Bernstein. Available online: https://mbernste.github.io/posts/entropy/ (accessed on 6 September 2022).
- Gray, R.M. Entropy and Information Theory; Springer Science & Business Media: Berlin/Heidelberg, Germany, 2011. [Google Scholar]
- O’Neil, C.; Schutt, R. Doing Data Science; O’Reilly Media, Inc.: Sebastopol, CA, USA, 2013; pp. 186–187. [Google Scholar]
- Kinsner, W. Is entropy suitable to characterize data and signals for cognitive informatics? Int. J. Cogn. Inf. Nat. Intell. 2007, 1, 34–57. Available online: https://www.igi-global.com/article/entropy-suitable-characterize-data-signals/1533 (accessed on 14 July 2022). [CrossRef]
- Rényi, A. On measures of information and entropy. In Proceedings of the 4th Berkeley Symposium on Mathematics, Statistics and Probability, Berkely, CA, USA, 20 June–30 July 1960; pp. 547–561. [Google Scholar]
- Laufer, E.T. Az Információ- és Kódelmélet Alapjai. Available online: http://siva.bgk.uni-obuda.hu/~laufer/bevinfo_tankonyv/Informatika%20alapjai%20jegyzet.pdf (accessed on 15 July 2022).
- Lawyer, G. Entropy, Redundancy, and Communication, SpråkTeknologi Höst. 2001. Available online: http://www.nada.kth.se/kurser/kth/2D1418/uppsatser01/Entropy.htm (accessed on 4 July 2022).
- Prensky, M. Digital Natives, Digital Immigrants. In On the Horizon; MCB University Press: Bingley, UK, 2001; Volume 9, Available online: http://www.marcprensky.com/writing/Prensky%20-%20Digital%20Natives,%20Digital%20Immigrants%20-%20Part1.pdf (accessed on 14 July 2020).
- Wolfram, C. The Math(s) Fix: An Education Blueprint for the AI Age; Wolfram Media, Inc.: Champaign, IL, USA, 2020. [Google Scholar]
- Wolfram, C. Evidence: Let’s Promote Not Stifle Innovation in Education 2015. Available online: http://www.conradwolfram.com/home/2015/5/21/role-of-evidence-in-education-innovation (accessed on 10 October 2015).
- Sebestyén, K.; Csapó, G.; Csernoch, M.; Aradi, B. Error Recognition Model: High-mathability End-user Text Management. Acta Polytech. Hung. 2022, 19, 151–170. [Google Scholar]
- Mishra, P.; Koehler, M. Technological pedagogical content knowledge: A framework for teacher knowledge. Teach. Coll. Rec. 2006, 108, 1017–1054. [Google Scholar] [CrossRef]
- Angeli, C. Teaching Spreadsheets: A TPCK Perspective. In Improving Computer Science Education; Kadijevich, D.M., Angeli, C., Schulte, C., Eds.; Routledge: Oxfordshire, UK, 2013. [Google Scholar]
- Angeli, C.; Valanides, N. Technological Pedagogical Content Knowledge. In Exploring, Developing, and Assessing TPCK; Springer: New York, NY, USA, 2015. [Google Scholar]
- Wing, J.M. Computational thinking. Commun. ACM 2006, 49, 33–35. [Google Scholar] [CrossRef]
- Pólya, G. How To Solve It. A New Aspect of Mathematical Method 1957, 2nd ed.; Princeton University Press: Princeton, NJ, USA, 1954. [Google Scholar]
- Kahneman, D. Thinking, Fast and Slow; Farrar, Straus; Giroux: New York, NY, USA, 2011. [Google Scholar]
- Sweller, J.; Ayres, P.; Kalyuga, S. Cognitive Load Theory. Explorations in the Learning Sciences. In Instructional Systems and Performance Technologies; Springer: Berlin/Heidelberg, Germany, 2011. [Google Scholar]
- Freiermuth, K.; Hromkovic, J.; Steffen, B. Creating and Testing Textbooks for Secondary Schools. In Informatics Education—Supporting Computational Thinking, Proceedings of the 3rd International Conference on Informatics in Secondary Schools—Evolution and Perspectives, Torun, Poland, 1–4 July 2008; Springer: Berlin/Heidelberg, Germany, 2008; pp. 216–228. [Google Scholar] [CrossRef]
- Malmi, L.; Sheard, J.; Kinnunen, P.; Simon, J.; Sinclair, J. Computing Education Theories. What Are They and How Are They Used? In Proceedings of the ICER ‘19: Proceedings of the 2019 ACM Conference on International Computing Education Research, Toronto, ON, Canada, 12–14 August 2019; pp. 187–197. [Google Scholar] [CrossRef] [Green Version]
- Malmi, L.; Sheard, J.; Kinnunen, P.; Simon, J.; Sinclair, J. Development and Use of Domain-Specific Learning Theories. Models and Instruments in Computing Education. ACM Trans. Comput. Educ. 2022, 1–47. Available online: https://dl.acm.org/doi/10.1145/3530221 (accessed on 10 October 2022). [CrossRef]
- Hattie, J. Visible Learning for Teachers: Maximizing Impact on Learning; Routledge: Oxfordshire, UK, 2012. [Google Scholar]
- Chen, J.A.; Morris, D.B.; Mansour, N. Science Teachers’ Beliefs. Perceptions of Efficacy and the Nature of Scientific Knowledge and Knowing. In International Handbook of Rese-arch on Teachers’ Beliefs; Fives, H., Gill, M.G., Eds.; Routledge: Oxfordshire, UK, 2015. [Google Scholar]
- Kirschner, P.A.; Sweller, J.; Clark, R.E. Why Minimal Guidance During Instruction Does Not Work: An Analysis of the Failure of Constructivist Discovery, Problem-Based, Experiential, and Inquiry-Based Teaching. Educ. Psychol. 2006, 41, 75–86. [Google Scholar] [CrossRef]
- Kruger, J.; Dunning, D. Unskilled and Unaware of It: How Difficulties in Recognizing One’s Own Incompetence Lead to Inflated Self-Assessments. J. Personal. Soc. Psychol. 1999, 77, 1121–1134. [Google Scholar] [CrossRef]
- Kirschner, P.A.; de Bruyckere, P. The myths of the digital native and the multitasker. Teach. Teach. Educ. 2017, 67, 135–142. [Google Scholar] [CrossRef]
- Ng, W. Can we teach digital natives digital literacy? Comput. Educ. 2012, 59, 1065–1078. Available online: https://www.sciencedirect.com/science/article/abs/pii/S0360131512001005?via%3Dihub (accessed on 21 January 2022). [CrossRef]
- Lister, R. After the gold rush: Toward sustainable scholarship in computing. Proc. Tenth Conf. Australas. Comput. Educ. 2008, 78, 3–17. [Google Scholar]


| Title 1 | Total | Grade 7 | Grade 8 | Grade 9 | Grade 10 |
|---|---|---|---|---|---|
| 2 points | 9.7 | 5.9 | 9.8 | 10.7 | 10.8 |
| 1 point | 16.0 | 14.7 | 13.6 | 17.5 | 16.6 |
| 0 points | 74.3 | 79.4 | 76.6 | 71.8 | 72.6 |
| Solutions | Frequency | Percent |
|---|---|---|
| 00010 | 309 | 15.1 |
| 00011 | 301 | 14.7 |
| 00110 | 29 | 1.4 |
| 00111 | 8 | 0.4 |
| 01010 | 451 | 22.1 |
| 01011 | 373 | 18.3 |
| 01110 | 20 | 1.0 |
| 01111 | 18 | 0.9 |
| 10010 | 265 | 13.0 |
| 10011 | 102 | 5.0 |
| 10110 | 30 | 1.5 |
| 10111 | 3 | 0.1 |
| 11010 | 51 | 2.5 |
| 11011 | 27 | 1.3 |
| 11110 | 6 | 0.3 |
| 11111 | 48 | 2.4 |
| Total | 2041 | 100.0 |
| Solutions | Frequency | Percent |
|---|---|---|
| 00001 | 822 | 68.3 |
| 10001 | 382 | 31.7 |
| Total | 1204 | 100.0 |
| Solutions | Frequency | Percent |
|---|---|---|
| 00100 | 268 | 31.7 |
| 00101 | 48 | 5.7 |
| 01100 | 150 | 17.8 |
| 01101 | 62 | 7.3 |
| 10100 | 157 | 18.6 |
| 10101 | 53 | 6.3 |
| 11100 | 55 | 6.5 |
| 11101 | 52 | 6.2 |
| Total | 845 | 100.0 |
| Solutions | Frequency | Percent |
|---|---|---|
| 01000 | 989 | 43.4 |
| 01001 | 632 | 27.7 |
| 11000 | 350 | 15.4 |
| 11001 | 309 | 13.6 |
| Total | 2280 | 100.0 |
| Solutions | Frequency | Percent |
|---|---|---|
| 10000 | 939 | 100.0 |
| Total | 939 | 100.0 |
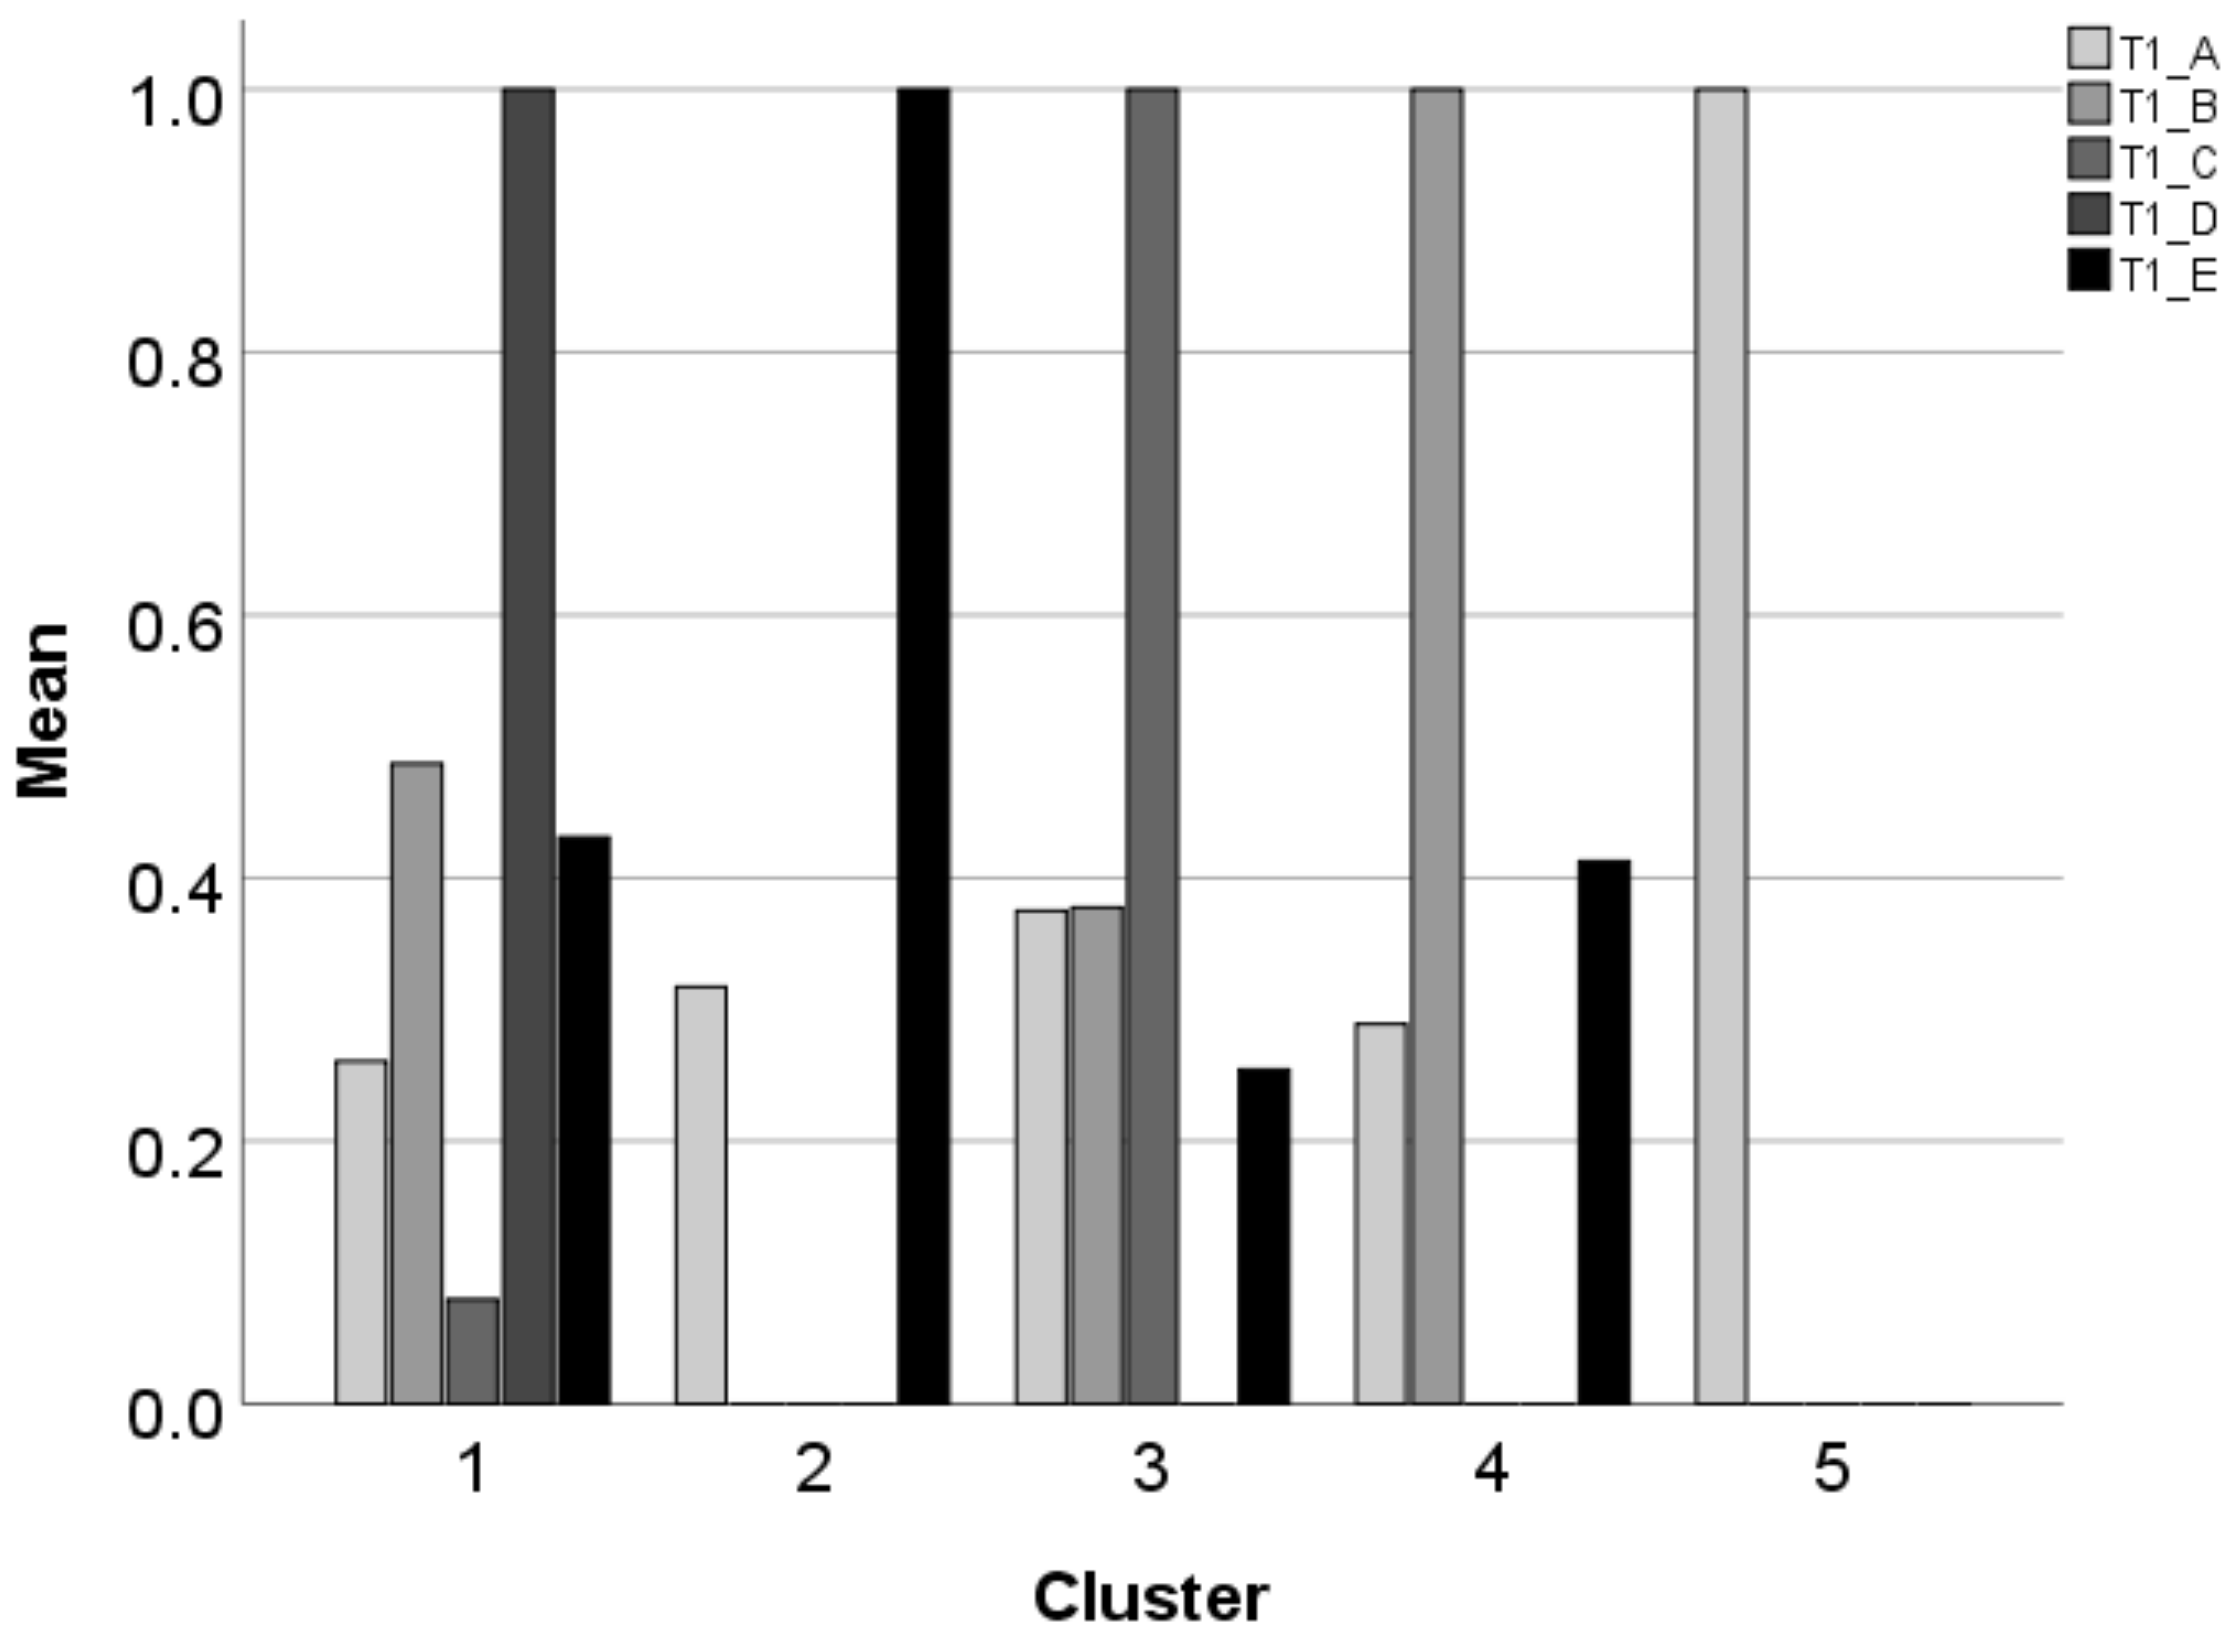
| Cluster | Dominant Answer | Pattern |
|---|---|---|
| 1 | D | ???1? |
| 2 | E | ?0001 |
| 3 | C | ??10? |
| 4 | B | ?100? |
| 5 | A | 10000 |
| Group | Pattern | Frequency | Probability | Identifiers |
|---|---|---|---|---|
| A | 10000 | 939 | 0.13 | dominant = Cluster 5 |
| B | 01000 | 989 | 0.14 | dominant ∈ Cluster 4 |
| C | 00100 | 268 | 0.04 | dominant ∈ Cluster 3 |
| D | 00010 | 309 | 0.04 | dominant ∈ Cluster 1 |
| E | 00001 | 822 | 0.11 | dominant ∈ Cluster 2 |
| ABE | 11001 | 309 | 0.04 | number as NC ∈ Cluster 4 |
| BE | 01001 | 632 | 0.09 | number as NC followed by a SC ∈ Cluster 4 |
| DE | 00011 | 301 | 0.04 | Tabulator as SC ∈ Cluster 1 |
| BC | 01100 | 150 | 0.02 | Space as SC ∈ Cluster 3 |
| BCE | 01101 | 62 | 0.01 | number or letter as NC followed by a SC∈ Cluster 3 |
| AE | 10001 | 382 | 0.05 | number as NC without SC = Cluster 2 |
| Other | 2146 | 0.29 |
Publisher’s Note: MDPI stays neutral with regard to jurisdictional claims in published maps and institutional affiliations. |
© 2022 by the authors. Licensee MDPI, Basel, Switzerland. This article is an open access article distributed under the terms and conditions of the Creative Commons Attribution (CC BY) license (https://creativecommons.org/licenses/by/4.0/).
Share and Cite
Csernoch, M.; Máth, J.; Nagy, T. The Interpretation of Graphical Information in Word Processing. Entropy 2022, 24, 1492. https://doi.org/10.3390/e24101492
Csernoch M, Máth J, Nagy T. The Interpretation of Graphical Information in Word Processing. Entropy. 2022; 24(10):1492. https://doi.org/10.3390/e24101492
Chicago/Turabian StyleCsernoch, Mária, János Máth, and Tímea Nagy. 2022. "The Interpretation of Graphical Information in Word Processing" Entropy 24, no. 10: 1492. https://doi.org/10.3390/e24101492