Article

Underdetermined DOA Estimation for Wideband Signals via Focused Atomic Norm Minimization

1
School of Marine Science and Technology, Northwestern Polytechnical University, Xi’an 710072, China
2
State Key Laboratory of Public Big Data, Guizhou University, Guiyang 550025, China
3
Institute of Acoustics, Chinese Academy of Sciences, Beijing 100190, China
*
Author to whom correspondence should be addressed.
Entropy 2020, 22(3), 359; https://doi.org/10.3390/e22030359
Submission received: 21 February 2020 / Revised: 17 March 2020 / Accepted: 17 March 2020 / Published: 20 March 2020
(This article belongs to the Special Issue Entropy and Information Theory in Acoustics)

Abstract

:
In underwater acoustic signal processing, direction of arrival (DOA) estimation can provide important information for target tracking and localization. To address underdetermined wideband signal processing in underwater passive detection system, this paper proposes a novel underdetermined wideband DOA estimation method equipped with the nested array (NA) using focused atomic norm minimization (ANM), where the signal source number detection is accomplished by information theory criteria. In the proposed DOA estimation method, especially, after vectoring the covariance matrix of each frequency bin, each corresponding obtained vector is focused into the predefined frequency bin by focused matrix. Then, the collected averaged vector is considered as virtual array model, whose steering vector exhibits the Vandermonde structure in terms of the obtained virtual array geometries. Further, the new covariance matrix is recovered based on ANM by semi-definite programming (SDP), which utilizes the information of the Toeplitz structure. Finally, the Root-MUSIC algorithm is applied to estimate the DOAs. Simulation results show that the proposed method outperforms other underdetermined DOA estimation methods based on information theory in term of higher estimation accuracy.

1. Introduction

Direction of arrival (DOA) estimation is an important issue in numerous fields of array signal processing, which has widespread applications in radar, sonar, acoustics, navigation, communications, speech enhancement [1,2,3] and multiple-input multiple-output (MIMO) systems [4]. Along with the recent development of underwater sonar systems, DOA estimation could supply the direction information, which plays various important roles in underwater target tracking [5,6,7] or target localization. Currently, plenty of mature and robust DOA estimation methods, such as estimating signal parameter via rotational invariance techniques (ESPRIT), multiple signal classification (MUSIC), etc. have achieved super-resolution estimation performance for narrowband signals [8]. Further, compared with narrowband signal sources, the wideband counterparts are able to provide more useful and interfering information where the array phase differences lie on two factors, i.e., the DOAs of sources and frequencies. Meanwhile, in passive sonar system, the radiation noise signal [9] from underwater vehicles is also a wideband signal. In light of such characteristics, wideband DOA (WDOA) estimation has attracted more research interests [10,11,12]. Among the classical wideband processing algorithms, the incoherent signal subspace method (ISM) can only deal with uncorrelated signal, which averages over the results of all frequency bins as the final fuse result. Alternatively, the coherent signal subspace method (CSM), whose main idea is to collect the averaged array covariance matrix by the focusing technique, not only can handle both uncorrelated and correlated signals, but also improves DOA estimation performance [13].
Traditionally, using a uniform linear array (ULA) formed with M sensors can detect at most M 1 signal sources successfully. However, handling underdetermined DOA estimation with fewer physical sensors than signal sources is a fundamental challenge and has great attention and concern in recent years [14,15,16,17,18]. To tackle such wideband DOA estimation issue, the sparse array structure has been proposed as one possible solution. Currently, two classes of recognized sparse linear arrays (SLA), i.e., nest arrays (NA) [19] and coprime arrays (CPA) [20,21], have been utilized to construct a virtual array based on the difference co-array concept theory, which enable to increased number of degrees of freedom (DOF), since the coordinate positions of virtual sensors are established by the consecutive and non-consecutive lag differences among the physical sensors. The CPA can deal with M N signal sources equipped with ( M + N + 1 ) sensors. Unfortunately, it fails to apply the augmentation techniques directly because it is unable to construct a filled co-array. By contrast, NA can easily generate a filled difference co-array, which makes itself one of the most attractive array configuration.
Alternatively, compressed sensing (CS), based on sparse signal processing techniques, has worked well in the DOA estimation application [22,23,24], whose irreplaceable advantage is to allow the DOA estimation with deficient snapshots, especially single snapshots, without enlarging the array aperture size [25]. Compared with traditional signal subspace methods, i.e., the spatial smoothing MUSIC, underdetermined CS-based DOA estimation attains not only a higher number of DOF but also better DOA estimation performance owing to the exploitation of all the unique co-array lags in lieu of only the consecutive part. Shen et al. [26] proposed a focused compressive sensing DOA estimation method for the underdetermined wideband signals, which enables reducing the complexity. However, the conventional CS approach has several huge disadvantages: (1) The true signal DOAs are always supposed to fall onto the predefined grid, otherwise the signals cannot be represented by the discrete dictionary [27]. (2) It lies on a finite-size DOAs grid, and finer grids give rise to the numerical instability issue. In particular, the true DOAs are not necessarily assumed to lie on a grid.
Developed as a gridless CS approach, Tang et al. [28] proposed a gridless atomic norm technique, which can be formulated as semidefinite programming (SDP) to recover off-grid sources with high probability from compressive measurements. The ANM approach attains off-grid estimation at super-resolution estimation performance of parameter due to the Vandermonde structure of the signal.
In this paper, aiming at addressing the problem of fewer physical sensors than signals in DOA estimation application, we propose a novel underdetermined DOA estimation method for wideband signals equipped with NA, which is based on ANM to seek and obtain the optimal Toeplitz covariance matrix. Firstly, inspired by SLAs’s benefits, the virtual array formed by the difference co-array is used as a substitute for the physical array geometry. We then build the virtual signal mode through vectorizing the covariance matrix of each frequency bin, and collecting the average vector by focusing technique. Finally, the Toeplitz covariance matrix is recovered via the ANM, which is beneficial for improving the estimation accuracy. The reason is that the retrieved Toeplitz covariance matrix is not only a low-rank Toeplitz matrix, but also a denoising covariance matrix. In addition, we use the information theory methods, named Akaike’s information criterion (AIC), minimum description length (MDL), and corrected AIC (AIC-C3) [29,30], to detect the number of signal sources.
The rest of this paper is organized as follows. In Section 2, the wideband signal model and problem formulation are introduced. The novel underdetermined wideband DOA estimation method via focused ANM is proposed in Section 3. Comprehensive simulations are presented to verify the performance of the proposed novel method in Section 4, followed by the conclusions in Section 5.
Notations: Vector a and matrices A are represented by lowercase and uppercase bold characters, respectively. A refers to an atom set. C and R denote the complex number and the real number, respectively. ( · ) H and ( · ) * represent the conjugate transpose and conjugate, respectively. a 2 is the 2 norm of a . Symbols · F , R a n k ( · ) , and t r ( · ) stand for the Frobenius norm, rank, and trace of a matrix, respectively. Expectation operator is denoted by E [ · ] . diag ( · ) implies that a diagonal matrix is formed from the given vector as the diagonal elements. vec { · } denotes the vectorization operator. ⊗ denotes the Kronecker product and ⊙ refers Khatri–Rao product. · represents rounding down.

2. Signal Model and Problem Formulation

Consider a two-level nested arrays of M sensors with the M 1 = M 2 sensors in the inner sub-array, while M 2 = M M 1 sensors in the outer sub-array, and both sub-arrays are the uniform linear array (ULA). d 1 denotes the separation between the sensors of the inner sub-array, while d 2 represents the counterpart of the outer sub-array, which is equivalent to ( M 1 + 1 ) d 1 . The NA structure is shown in Figure 1, in which the position of the sensors are given by the sets
H = { h m : m = 1 , 2 , , M } = { m 1 d 1 , m 1 = 0 , 1 , , M 1 1 } { m 2 d 2 d 1 , m 2 = 1 , 2 , , M 2 } .
Assume that K wideband stationary signals at the directions of θ 1 , θ 2 , , θ K from the far-field impinge on the nested array, where θ k represents the kth signal source. Then, the received signal x m ( t ) of the mth sensor can be expressed as
x m ( t ) = k = 1 K s k t τ m ( θ k ) + w m ( t ) , m = 1 , 2 , , M ,
where the w m ( t ) is noise part, whose entries are zero-mean Gaussian random variables with σ 2 variance. τ m ( θ k ) represents the propagation delay associated with the kth signal impinging and the mth sensor.
Wideband signal after time-sampling is split into L non-overlapping segments, and an N-point discrete Fourier transform (DFT) is carried out over each segment data. The output at frequency bin f n is modeled as
x n , l = A n ( θ ) s n , l + w n , l n = 1 , 2 , , N ; l = 1 , 2 , , L ,
where s n , l is the signal vector and w n , l represents the additive noise vector in the frequency domain. The array manifold matrix A n ( θ ) C M × K of the nth frequency is
A n ( θ ) = a n ( θ 1 ) , a n ( θ 2 ) , , a n ( θ K ) ,
whose columns denote array steering vectors for K signal sources of the nth frequency bin, that is
a n ( θ k ) = e 2 j π f n τ m ( θ k ) , e 2 j π f n τ 2 ( θ k ) , , e 2 j π f n τ M ( θ k ) T ,
where a n ( θ k ) C M , τ m ( θ k ) = h m s i n ( θ k ) / c , and c is the signal source propagation velocity.
Then, the covariance matrix R x n of the nth bin data can be expressed as
R x n = E x n , l x n , l H = A n ( θ ) R s n A n ( θ ) H + R w n = A n ( θ ) diag ( ρ n ) A n ( θ ) H + σ w 2 I ,
where R s n = E s n , l s n , l H = diag ( ρ n ) denotes the only signal covariance matrix at the frequency bin f n , and ρ n = ρ n , 1 2 , ρ n , 2 2 , , ρ n , K 2 T is the source power vector, while R w n = E w n , l w n , l H = σ w 2 I is the noise covariance matrix, and σ w 2 = σ n , 1 2 , σ n , 2 2 , , σ n , M 2 T represents the noise power vector.
In practice, the covariance matrix R x n is estimated from the sample covariance matrix R ^ x n with the L non-overlapping segments, and R ^ x n is given by
R ^ x n = 1 L l = 1 L x n , l x n , l H ,
Vectorizing R ^ x n in Equation (7), we have
r n = vec { R ^ x n } = B n ( θ ) q n + σ w 2 I ˇ ,
where
B n ( θ ) = A n ( θ ) * A n ( θ ) = b n ( θ 1 ) , b n ( θ 2 ) , , b n ( θ K ) C M 2 × K ,
with
b n ( θ k ) = a n * ( θ k ) a n ( θ k ) ,
where q n = ρ n , 1 2 , ρ n , 2 2 , , ρ n , K 2 T represents the signal vector, and I ˇ = vec { I } C M 2 × 1 . Note that B n ( θ ) is a tall matrix and can provide useful information for increasing the DOF; in other words, M < R a n k B n ( θ ) < M 2 . According to the concept of difference co-array [19], we can get a new virtual array position of the ULA
H ¯ = { h q h p : q , p = 1 , 2 , , M } = M 2 ( M 1 + 1 ) + 1 d 1 , , 0 , d 1 , , M 2 ( M 1 + 1 ) 1 d 1 R 1 × M ˜ ,
where M ˜ = 2 M 2 ( M 1 + 1 ) 1 .
The goal of the paper is to determine the θ from r n in Equation (8).

3. Wideband Signal Processing Using Virtual Array

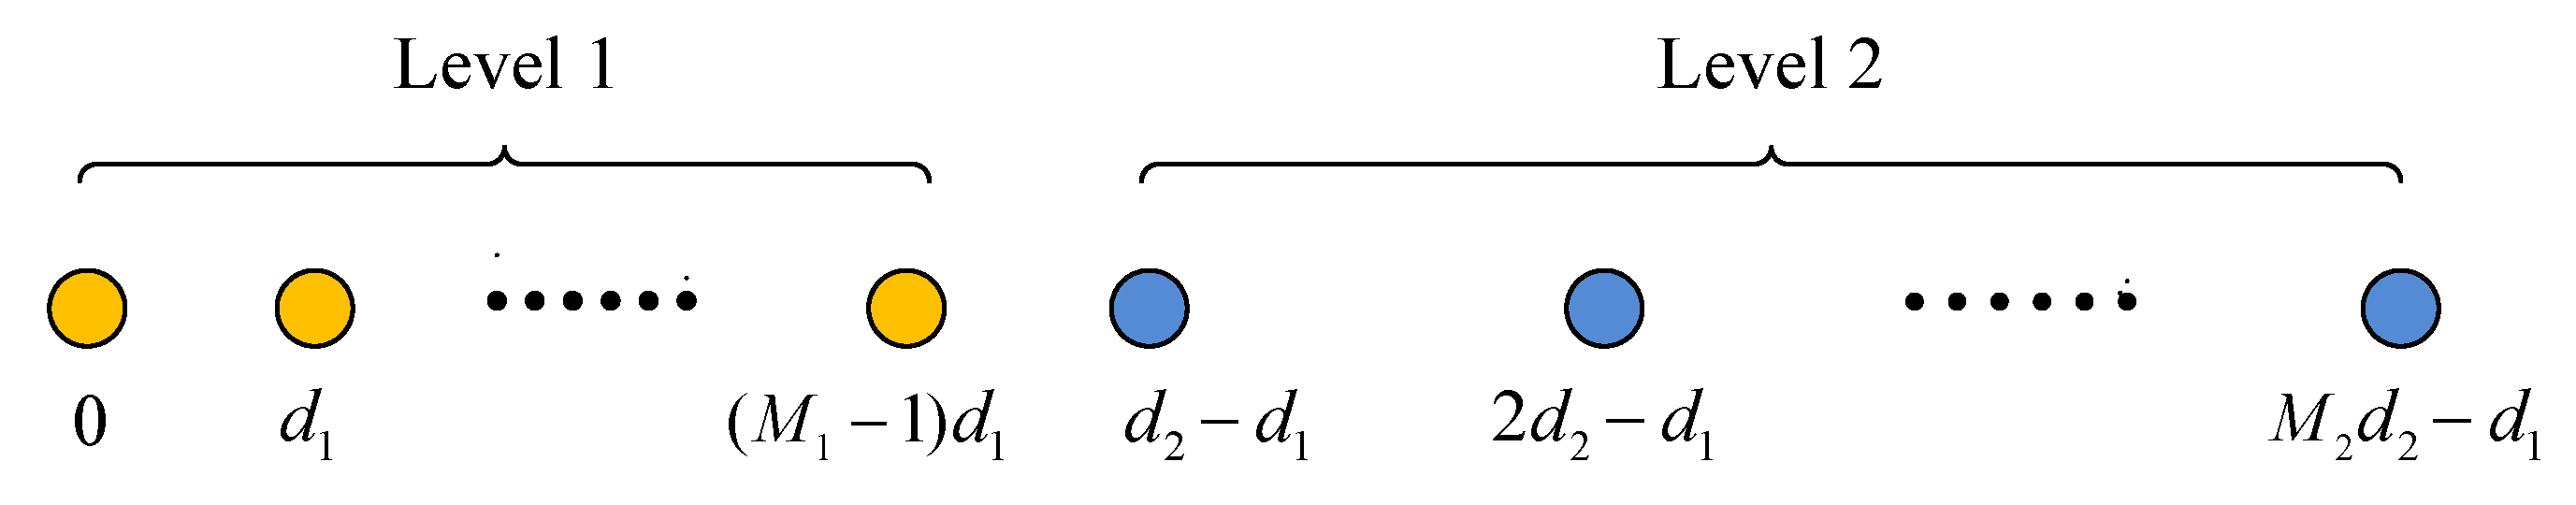
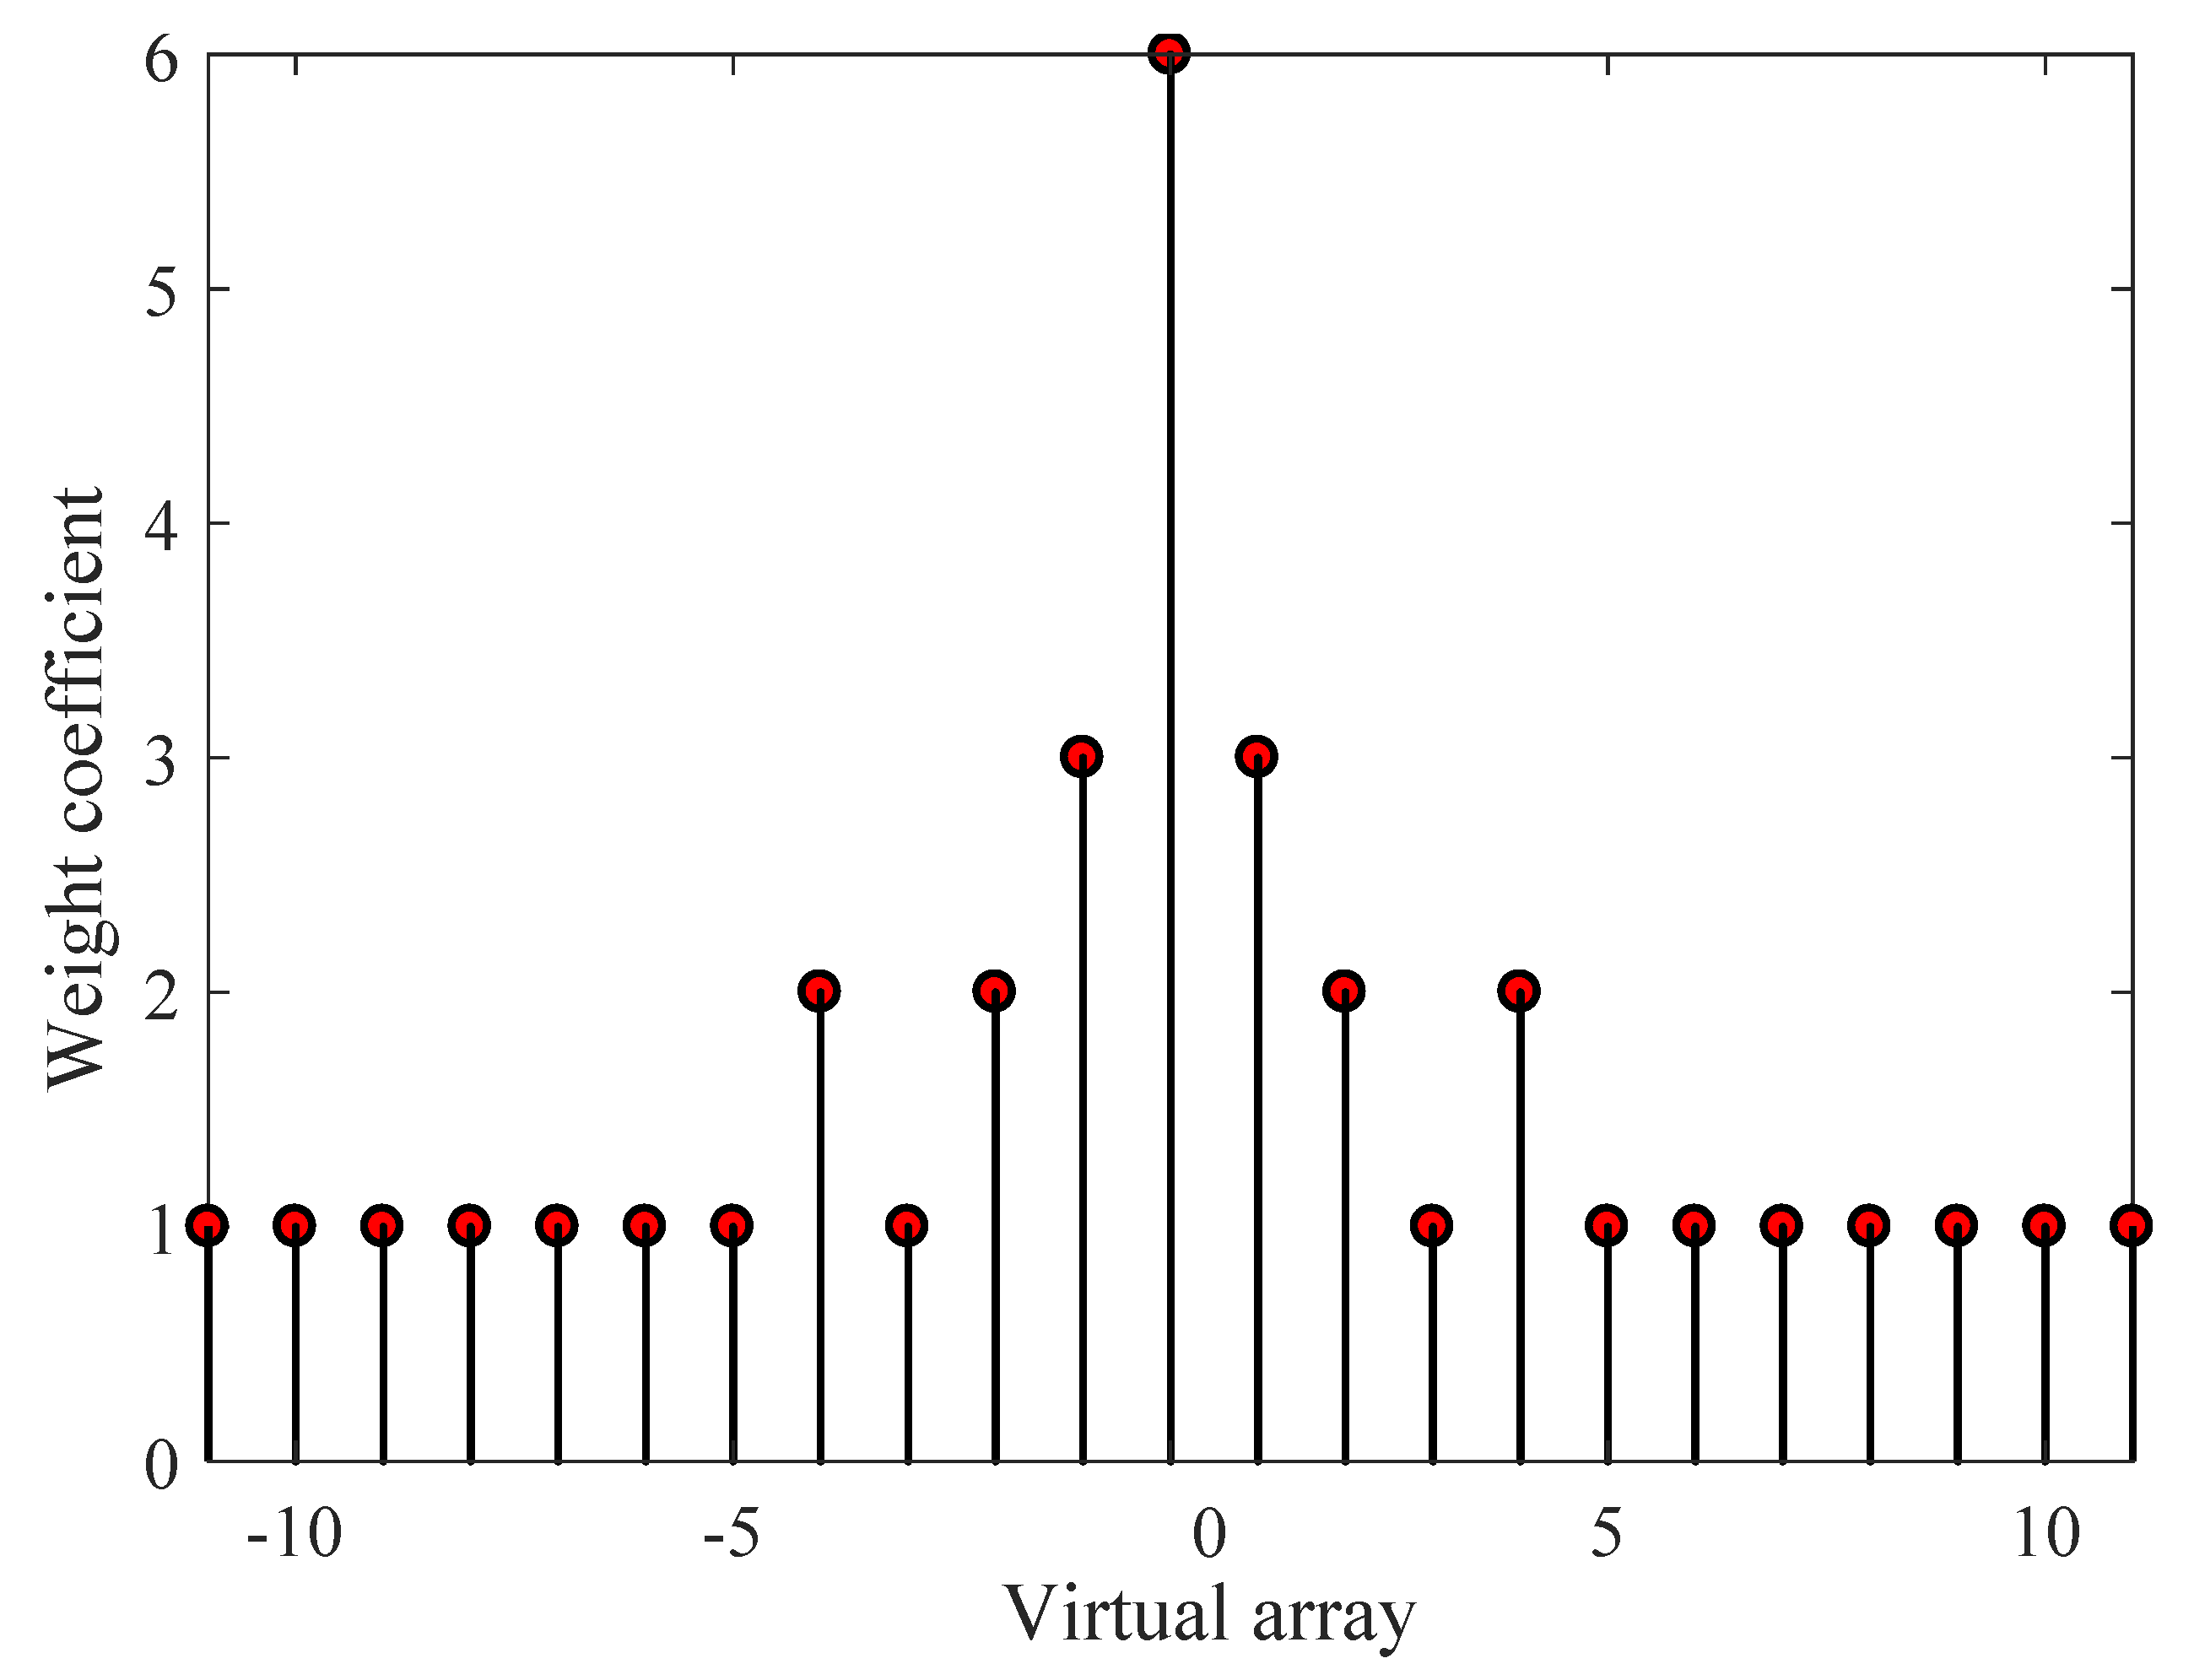
3.1. Virtual Array Signal

Recall that the vector r n in Equation (8) contains the repeat rows, which do not help for improving the DOF. After removing the repeat rows and sorting its remaining rows of the r n , we obtain a new vector by the following operation
z n = G n ( θ ) q n + w ˜ n ,
where z n C M ˜ and w ˜ n = σ w 2 I ˜ M ˜ C M ˜ represent the new observation vector and the new noise vector, respectively. G n ( θ ) = g n ( θ 1 ) , g n ( θ 2 ) , , g n C M ˜ × K is redefined as the filled virtual manifold matrix, which is equivalent to the counterpart of a ULA with M ˜ sensors. The virtual array steering vector g n ( θ k ) exhibits a Vandermonde structure of size M ˜ as follows
g n ( θ k ) = e 2 j π f n τ ( M 2 ( M 1 + 1 ) + 1 ) ( θ k ) e 2 j π f n τ ( M 2 ( M 1 + 1 ) + 2 ) ( θ k ) e 2 j π f n τ 0 ( θ k ) e 2 j π f n τ ( M 2 ( M 1 + 1 ) 1 ) ( θ k ) ,

3.2. Focusing on the Virtual Array

It is known that the CSM, which is a classic way of wideband signal processing [31], can lead to less complexity and better DOA estimation performance. The key point of CSM is to design focusing matrices P n n = 1 N , whose purpose are to transform the manifold matrices at frequencies f n n = 1 N to that at the pre-selected reference frequency f 0 as follows [32]
P n G n ( θ ) = G 0 ( θ ) ,
where G 0 ( θ ) denotes the virtual array manifold matrix at the referenced frequency f 0 . Note that rotational signal subspace (RSS) method is a well known way of CSM [13], whose focusing matrices P n n = 1 N are gained through minimizing a Frobenius norm of the obtained virtual array manifold errors
min P n G 0 ( θ ) ) P n G n ( θ ) F s . t . P n P n H = I ,
where P n should be a unitary matrix, yielding [33]
P n = U n r ( U n l ) H .
We now define an excessive matrix E = G n ( θ ) G 0 ( θ ) H , whose left and right singular vectors are defined as U n l and U n r , respectively. Accordingly, the product of the virtual array y n is defined through multiplying the focusing matrix by z ¯ n
y n = P n z ¯ n = P n G n ( θ ) q n + P n w ˜ n .
After focusing processing, we can reconstruct a new single wideband signal model by averaging the obtained signal of each frequency as follows
y ¯ = 1 N n = 1 N y n = 1 N n = 1 N P n z ¯ n = 1 N n = 1 N P n G n ( θ ) q n + 1 N n = 1 N P n w ˜ n = G 0 ( θ ) q ¯ + P ¯ w ˜ n ,
where q ¯ = 1 N n = 1 N q n C K × 1 is a column vector and P ¯ = 1 N n = 1 N P n . For the Gaussian white noise, there is w ˜ n = σ w 2 I ˜ M ˜ .

3.3. Source Number Detection Using Information Theory Criteria

As is known, the key factor for source number detection is the obtained sample covariance matrix. Unfortunately, we cannot get an optimal covariance matrix directly by the new reconstructed single wideband signal in Equation (18). The spatial smoothing method is one of effective solutions for such problem. We can divide the virtual array into M ˜ + 1 2 + 1 subarrays, each with M ˜ 1 2 1 sensors. The output of the n th subarray is defined as y ¯ n , whose corresponding covariance matrix R n is written as
R n = y ¯ n y ¯ n H .
Meanwhile, we can obtain the averaged covariance matrix R, that is
R = 1 ( M ˜ + 1 2 + 1 ) n = 1 M ˜ + 1 2 + 1 R n .
Afterwards, applying EVD on the matrix R, we have
R = U diag ( λ ) U H ,
where U and λ are the eigen vector matrix and eigenvalues, respectively. Here, we have the non-increasing order of such eigenvalues
λ 1 λ 2 λ M ˜ 1 2 1 .
We next introduce the information theory methods: AIC, AIC-C3, and MDL  [29,30] for source number detection. These three methods can be organized as follows:
A I C ( k ) = 2 L ˜ ( M ˜ k ) l o g Λ ( k ) + 2 k ( 2 M ˜ k )
M D L ( k ) = L ˜ ( M ˜ k ) l o g Λ ( k ) + 1 2 k ( 2 M ˜ k ) ) l o g L ˜
A I C C 3 ( k ) = 2 L ˜ ( M ˜ k ) l o g Λ ( k ) + C ,
where Λ ( k ) is the maximum likelihood
Λ ( k ) = 1 M ˜ k i = k + 1 M ˜ λ i ( i = k + 1 M ˜ λ i ) 1 M ˜ k ,
and
C = ( 4 M ˜ k 2 k 2 + 2 ) ( 2 M ˜ L ˜ + 2 M ˜ k + k 2 + 2 ) 2 M ˜ L ˜ 2 M ˜ k + k 2 2 4 M ˜ k 2 k 2 2 M ˜ L ˜ 2 M ˜ k + k 2 .
where L ˜ and k represent the number of snapshots and the number of DOF, respectively.
Then, we estimate the signal source number K by
K ^ A I C = arg min A I C ( k ) K ^ M D L = arg min M D L ( k ) K ^ A I C C 3 = arg min A I C C 3 ( k ) .

3.4. DOA Estimation via ANM

3.4.1. ANM Principle

In the literature  [28,34], the ANM principle is that the signal is expressed as a linear combination of a few atoms over a known atom set, and then, the structural information of these atoms, i.e., Vandermonde structure, is utilized for signal reconstruction from measurements.
We assume the signal Φ contains several components, which exhibit the same Vandermonde structure and especially belong to a basic atom set A . Therefore, we can define the atomic norm of Φ over the atom set A , which has the form
  Φ   A = inf n | s n | | Φ = n s n A n , A n A ,
whose main task is to seek the sparsest decomposition of Φ over A . In other words, if the signal Φ has a special form, i.e., a linear combination form, the signal Φ is considered to be sparse over the atom set of A in Equation (29). Knowing the A , the components of Φ can be retrieved using 1 norm minimization as follows:
arg min A n , s n n | s n | s . t . Φ = n s n A n , A n A .
Equation (30) can be tackled by seeking out the atomic norm   Φ   A , while the optimal atom set is also obtained for estimating DOAs.
In the presence of noise, the observed measurement Ψ = Φ + w contains the signal and the noise, thus the corresponding atomic norm is written as
min Φ   Φ   A s . t .   Ψ Φ   ε ,
where ε denotes the noise threshold. The problem in Equation (31) is called the atomic norm minimization, which can be solved via SDP.

3.4.2. DOA Estimation

Here, recall Equation (18); in the case of being noiseless, Equation (18) only contains the signals information, which can be rewritten as
y ¯ = s = Δ G 0 ( θ ) q ¯ = k = 1 K q ¯ k g 0 ( θ k ) ,
where q ¯ k = 1 N n = 1 N q n k = 1 N n = 1 N ( ρ n k ) 2 , and all K steering vectors g 0 ( θ k ) k = 1 K have the same structure, i.e., Vandermonde structure. Furthermore, they belong to a known atom set A v . According to the ANM definition, the signal s can be considered as the sparse signal over the atom set A v .
Afterwards, the set of atoms by all possible G 0 ( θ ) can be readily formed as follows:
A v : = G 0 ( θ ) : θ ( π / 2 , π / 2 ] .
Apparently, the noiseless version of Equation (32) of y ¯ is viewed as a positive combination of complex sinusoids over the atom set A v . It has been indicated that the atomic norm of s is said to be minimized, when only those atoms corresponding to the true signals θ k k = 1 K are selected to linearly describe s , which has the form
s A v = Δ inf n = 1 K | q ¯ k | | q ¯ k g 0 ( θ k ) , g 0 ( θ k ) A v .
To practically solve Equation (34), an SDP formulation of s A is given as
min u , v 1 2 t r ( T ( u ) ) + 1 2 v s . t . v ( s ) H s T ( u ) 0 ,
where T ( u ) is a Toeplitz matrix. According to the authors of [28,35], any PSD Toeplitz matrix allows for Vandermonde decomposition. For any { q ¯ k , θ k } k = 1 K , K < M ˜ , define u = n = 1 K | q ¯ k | g 0 ( θ k ) and the Toeplitz matrix T ( u ) is formed from the first row of the vector u = [ u 1 , u 2 , , u M ˜ ] , that is
T ( u ) = u 1 u 2 u M ˜ ( u 2 ) H u 1 u M ˜ 1 ( u M ˜ ) H ( u M ˜ 1 ) H u 1 .
The SDP yields the optimal vector u and the Toeplitz matrix T ( u ) , in which the true signals θ are estimated.
In practice, we usually do not have the s directly, and the measurement y ¯ contains the noise in Equation (18). According to Equation (31), the ANM formulation can be written as
min s ^ ξ     s ^   A v +     y ¯ s ^   2 2 .
Equation (37) makes a regularized denoising formulation to recover s . s ^ A v represents the sparsity enforcing term, and the quadratic term of Equation (37) is used to control the noise. ξ is a regularization parameter.
According to Equation (35), Equation (37) now can be converted to an equivalent SDP formulation as follows:
min u ^ , v , s ^ 1 2 ( t r ( T ( u ^ ) ) + v ) + ξ y ¯ s ^ 2 2 s . t . v ( s ^ ) H s ^ T ( u ^ ) 0 ,
where ξ is a regularization parameter balancing Toeplitz structure and the noise tolerance to the observation y ¯ , i.e.,  y ¯ s ^ 2 2 (least-squares term), whose poor choice may increases the probability of a bad solution. Therefore, an optimal section of ξ plays a very important role in guaranteeing signal recover. The SDP formulation in Equations (35) and (38) can be implemented efficiently by the CVX toolboxes.
After attaining the optimal Toeplitz matrix T ( u ^ ) in Equation (38), the subspace Root-MUSIC method is utilized to estimate the direction of K signal sources, θ ^ = [ θ ^ 1 , θ ^ 2 , , θ ^ K ] .
Remark on targets angle separation condition: Here, targets angle separation means the required angle separation between neighbouring signal source. According to the IV.2 theorem [34], the sufficient separation condition is
s i n ( θ m i n ) 1 ( M ˜ 1 ) 4 θ m i n a r c s i n 1 ( M ˜ 1 ) 4 ,
Note that Equation (39) is only a sufficient condition in ANM, and always much more conservative in most realistic applications. That is to say, if Equation (39) is indeed not satisfied, one may have a chance to get the DOAs.
The overall implementation of our proposed solution is summarized as Algorithm 1.
Algorithm 1 The proposed undetermined wideband DOA estimation method.
Input:
   The data: X ;
Output:
   Estimation of θ : θ ^ ;

1: Wideband signal processing and obtain the output of the frequency domain after DFT: x n , l ;
2: Obtain the covariance matrix of each frequency: R x n ;
3: Vectorizing: r n = vec { R x n } ;
4: Reduce redundancy and sort by (12);
5: Fix the focusing frequency: f 0 ;
6: Calculate the focusing matrices: P 1 , P 2 , , P N by (15) and (16);
7: Recover the optimal Toeplitz matrix: T ( u ^ ) through SDP via (38);
8: Estimate the DOAs via Root-MUSIC.

4. Simulation Results

To show the benefits of our proposed method, we used several simulations to testify its better DOA estimation performance, compared to the existing wideband DOA estimation methods: W-SpSF method [18], spatial smoothing MUSIC (SS-MUSIC) [36], and OGSBL [37]. Moreover, to better demonstrate the estimation performance of these four methods, the Cramer–Rao lower bound (CRLB) for wideband signal provided in [18,38] was used as the benchmark, which represents a lower bound for unbiased estimator. In addition, we used the information theory methods, i.e., AIC, MDL, and AIC-C3, to detect the signal source number.

4.1. Simulation Setting

We considered a two-level nest array with six physical sensors, whose inner sub-array and outer sub-array have the same amount of sensors, that is to say, M 1 is equal to M 2 = 3 . The physical sensors locate at [ 0 , d 1 , 2 d 1 , 3 d 1 , 7 d 1 , 11 d 1 ] , and d 1 is equal to 1 / 2 λ , where λ represents the wavelength corresponding to the center frequency f 0 = ( f l + f h ) / 2 . In addition, c = 1500 m/s denotes the signal propagation velocity of underwater acoustic scenarios. Therefore, we have d 1 = l / 2 λ = c / ( 2 f 0 ) . The unchangeable default simulation parameters setting is shown in Table 1, and a co-array of NA with six sensors is displayed in Figure 2.

4.2. Performance Comparison

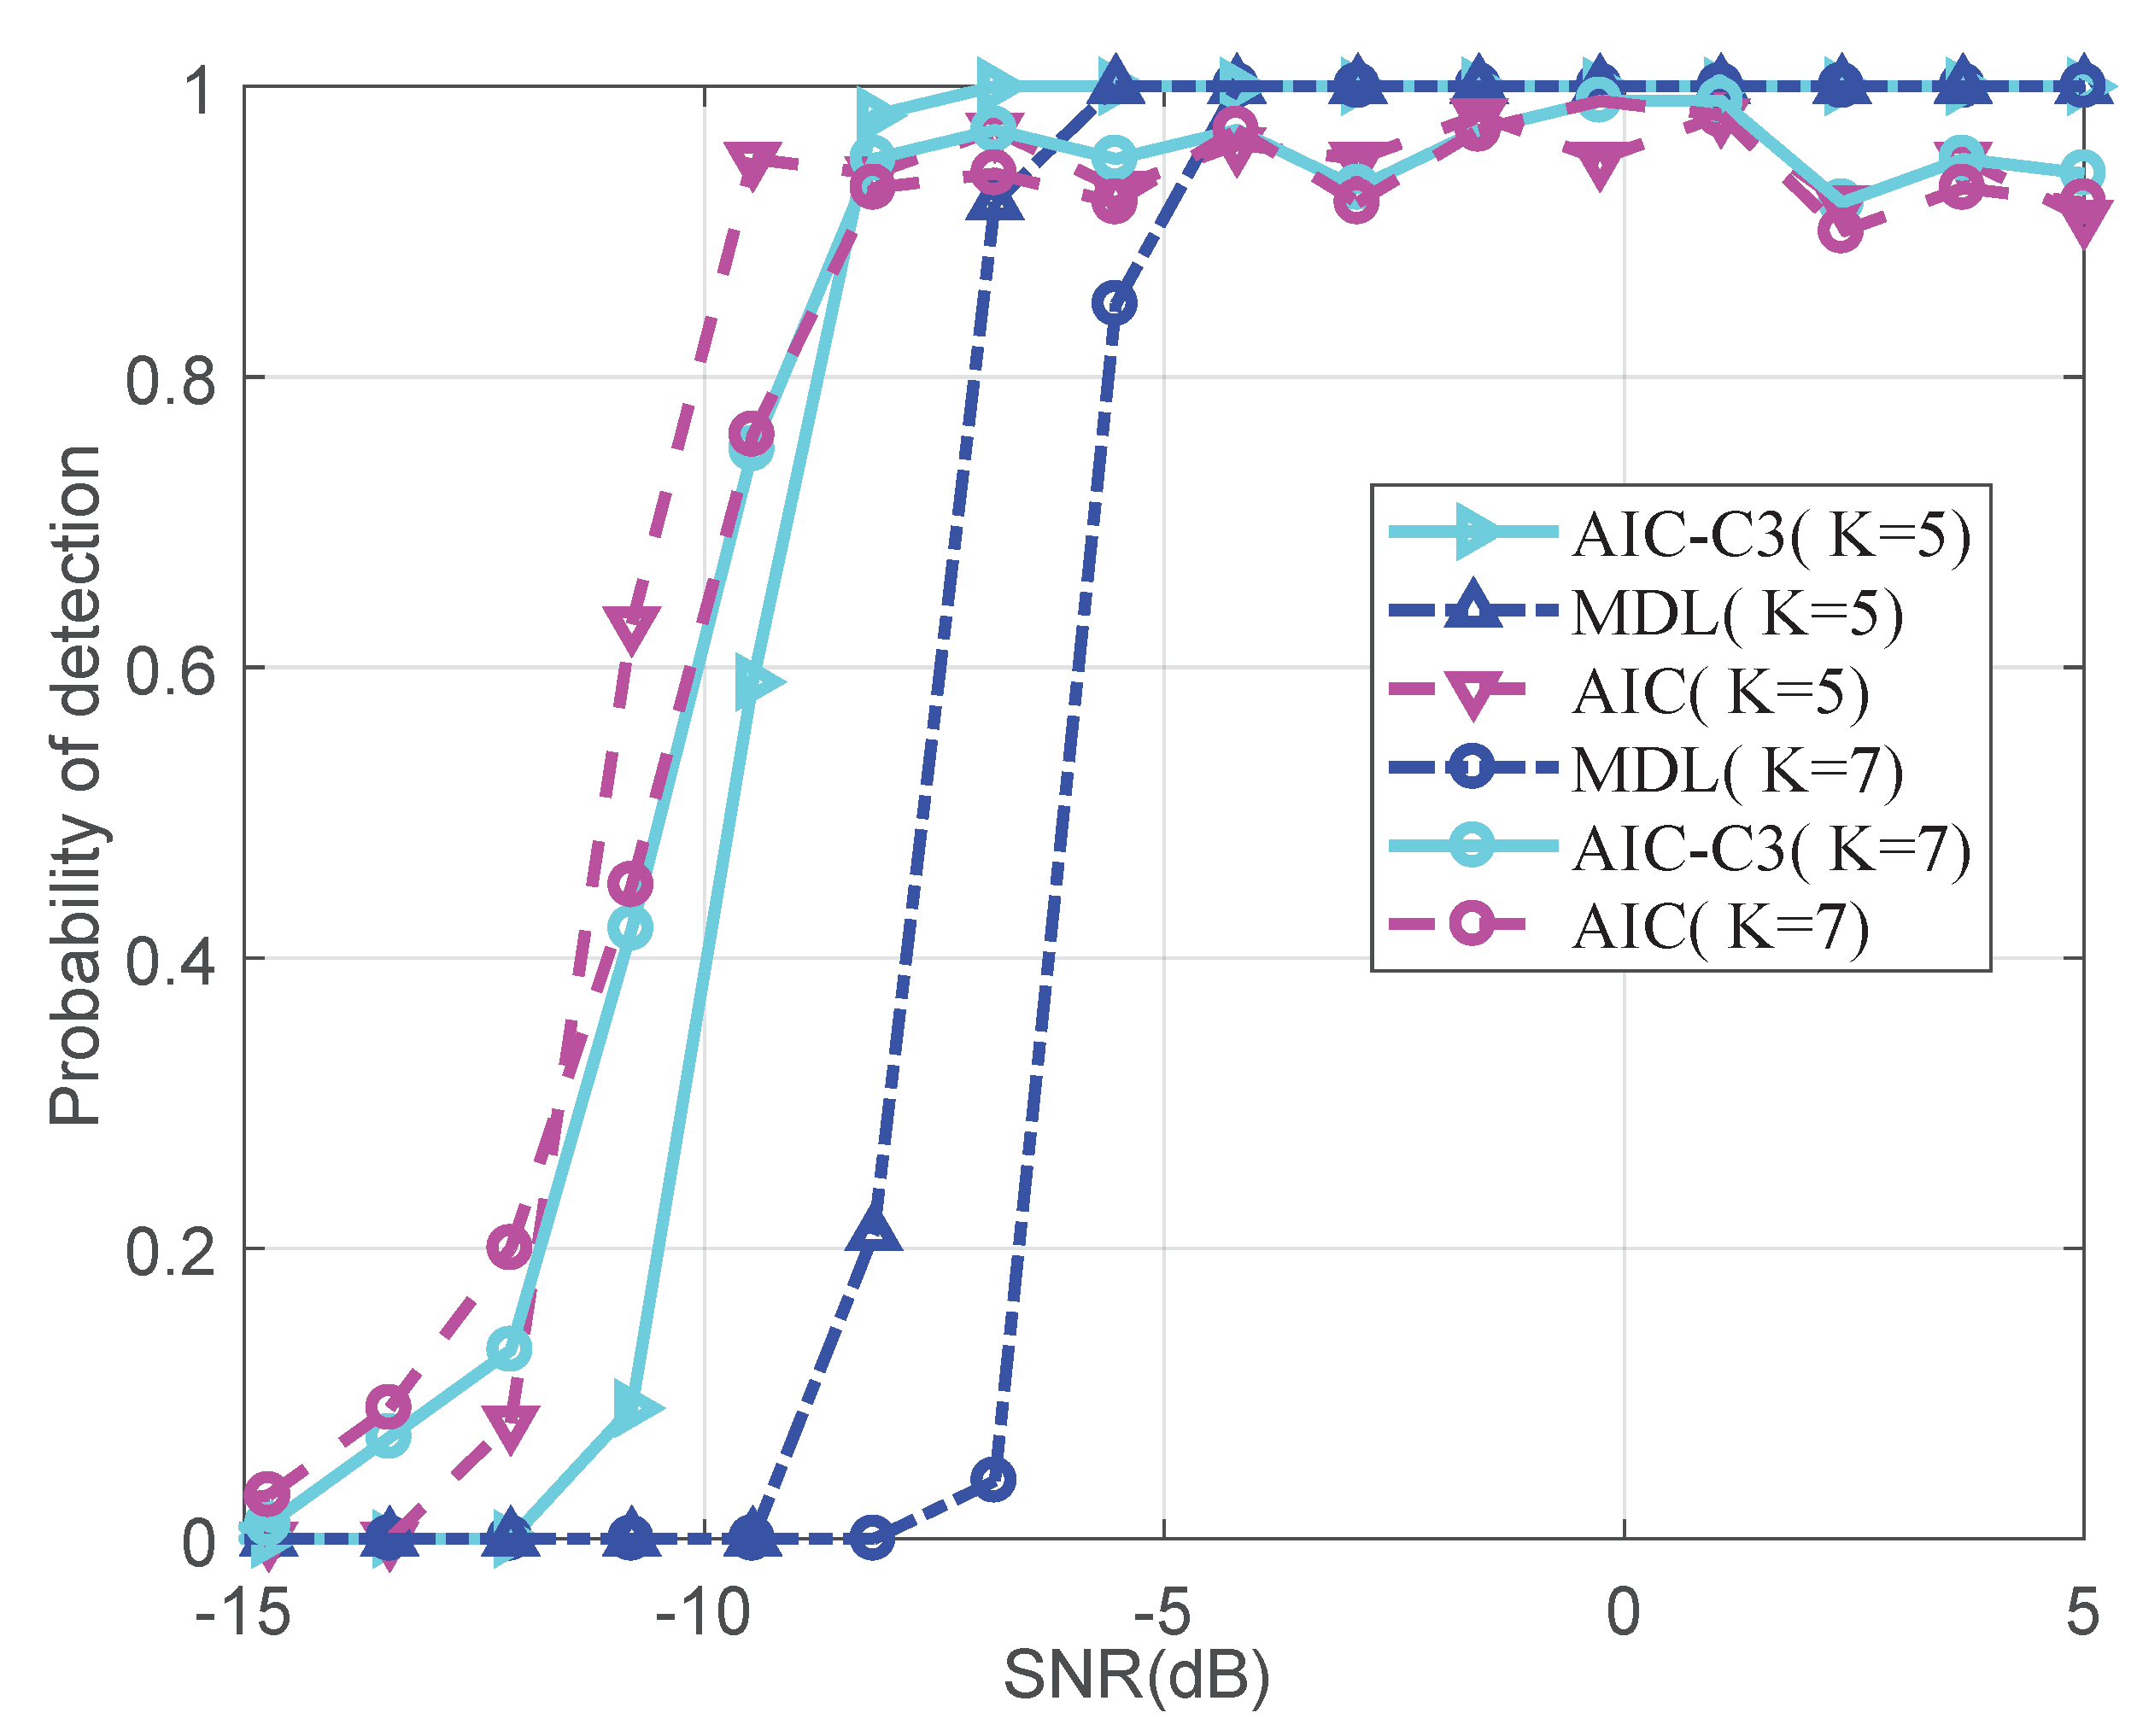
4.2.1. Source Number Detection

To verify the detection accuracy of wideband signal with NA, we compared the probability of detection using the mentioned information theory method in the overdetermined and underdetermined cases, respectively. Under the overdetermined scenario, we assumed that five wideband signals impinge on the NA from 30 , 15 , 0 , 15 , 29 , and seven wideband signal sources are from 45 , 30 , 15 , 0 , 15 , 29 , 44 for the underdetermined scenario. We varied the SNR from −15 to 5 dB, and fixed snapshots to 30. Figure 3 shows the result of the probability of detection versus SNR. The detection accuracies of AIC are the highest in low SNR, followed by AIC-C3 and MDL, as the case may be. The detection accuracies of all information theory methods for five signals are higher than those of seven signals. Table 2 displays the needed SNRs of the three methods, when the probability of detection are equal to 0.9 and 1, respectively.

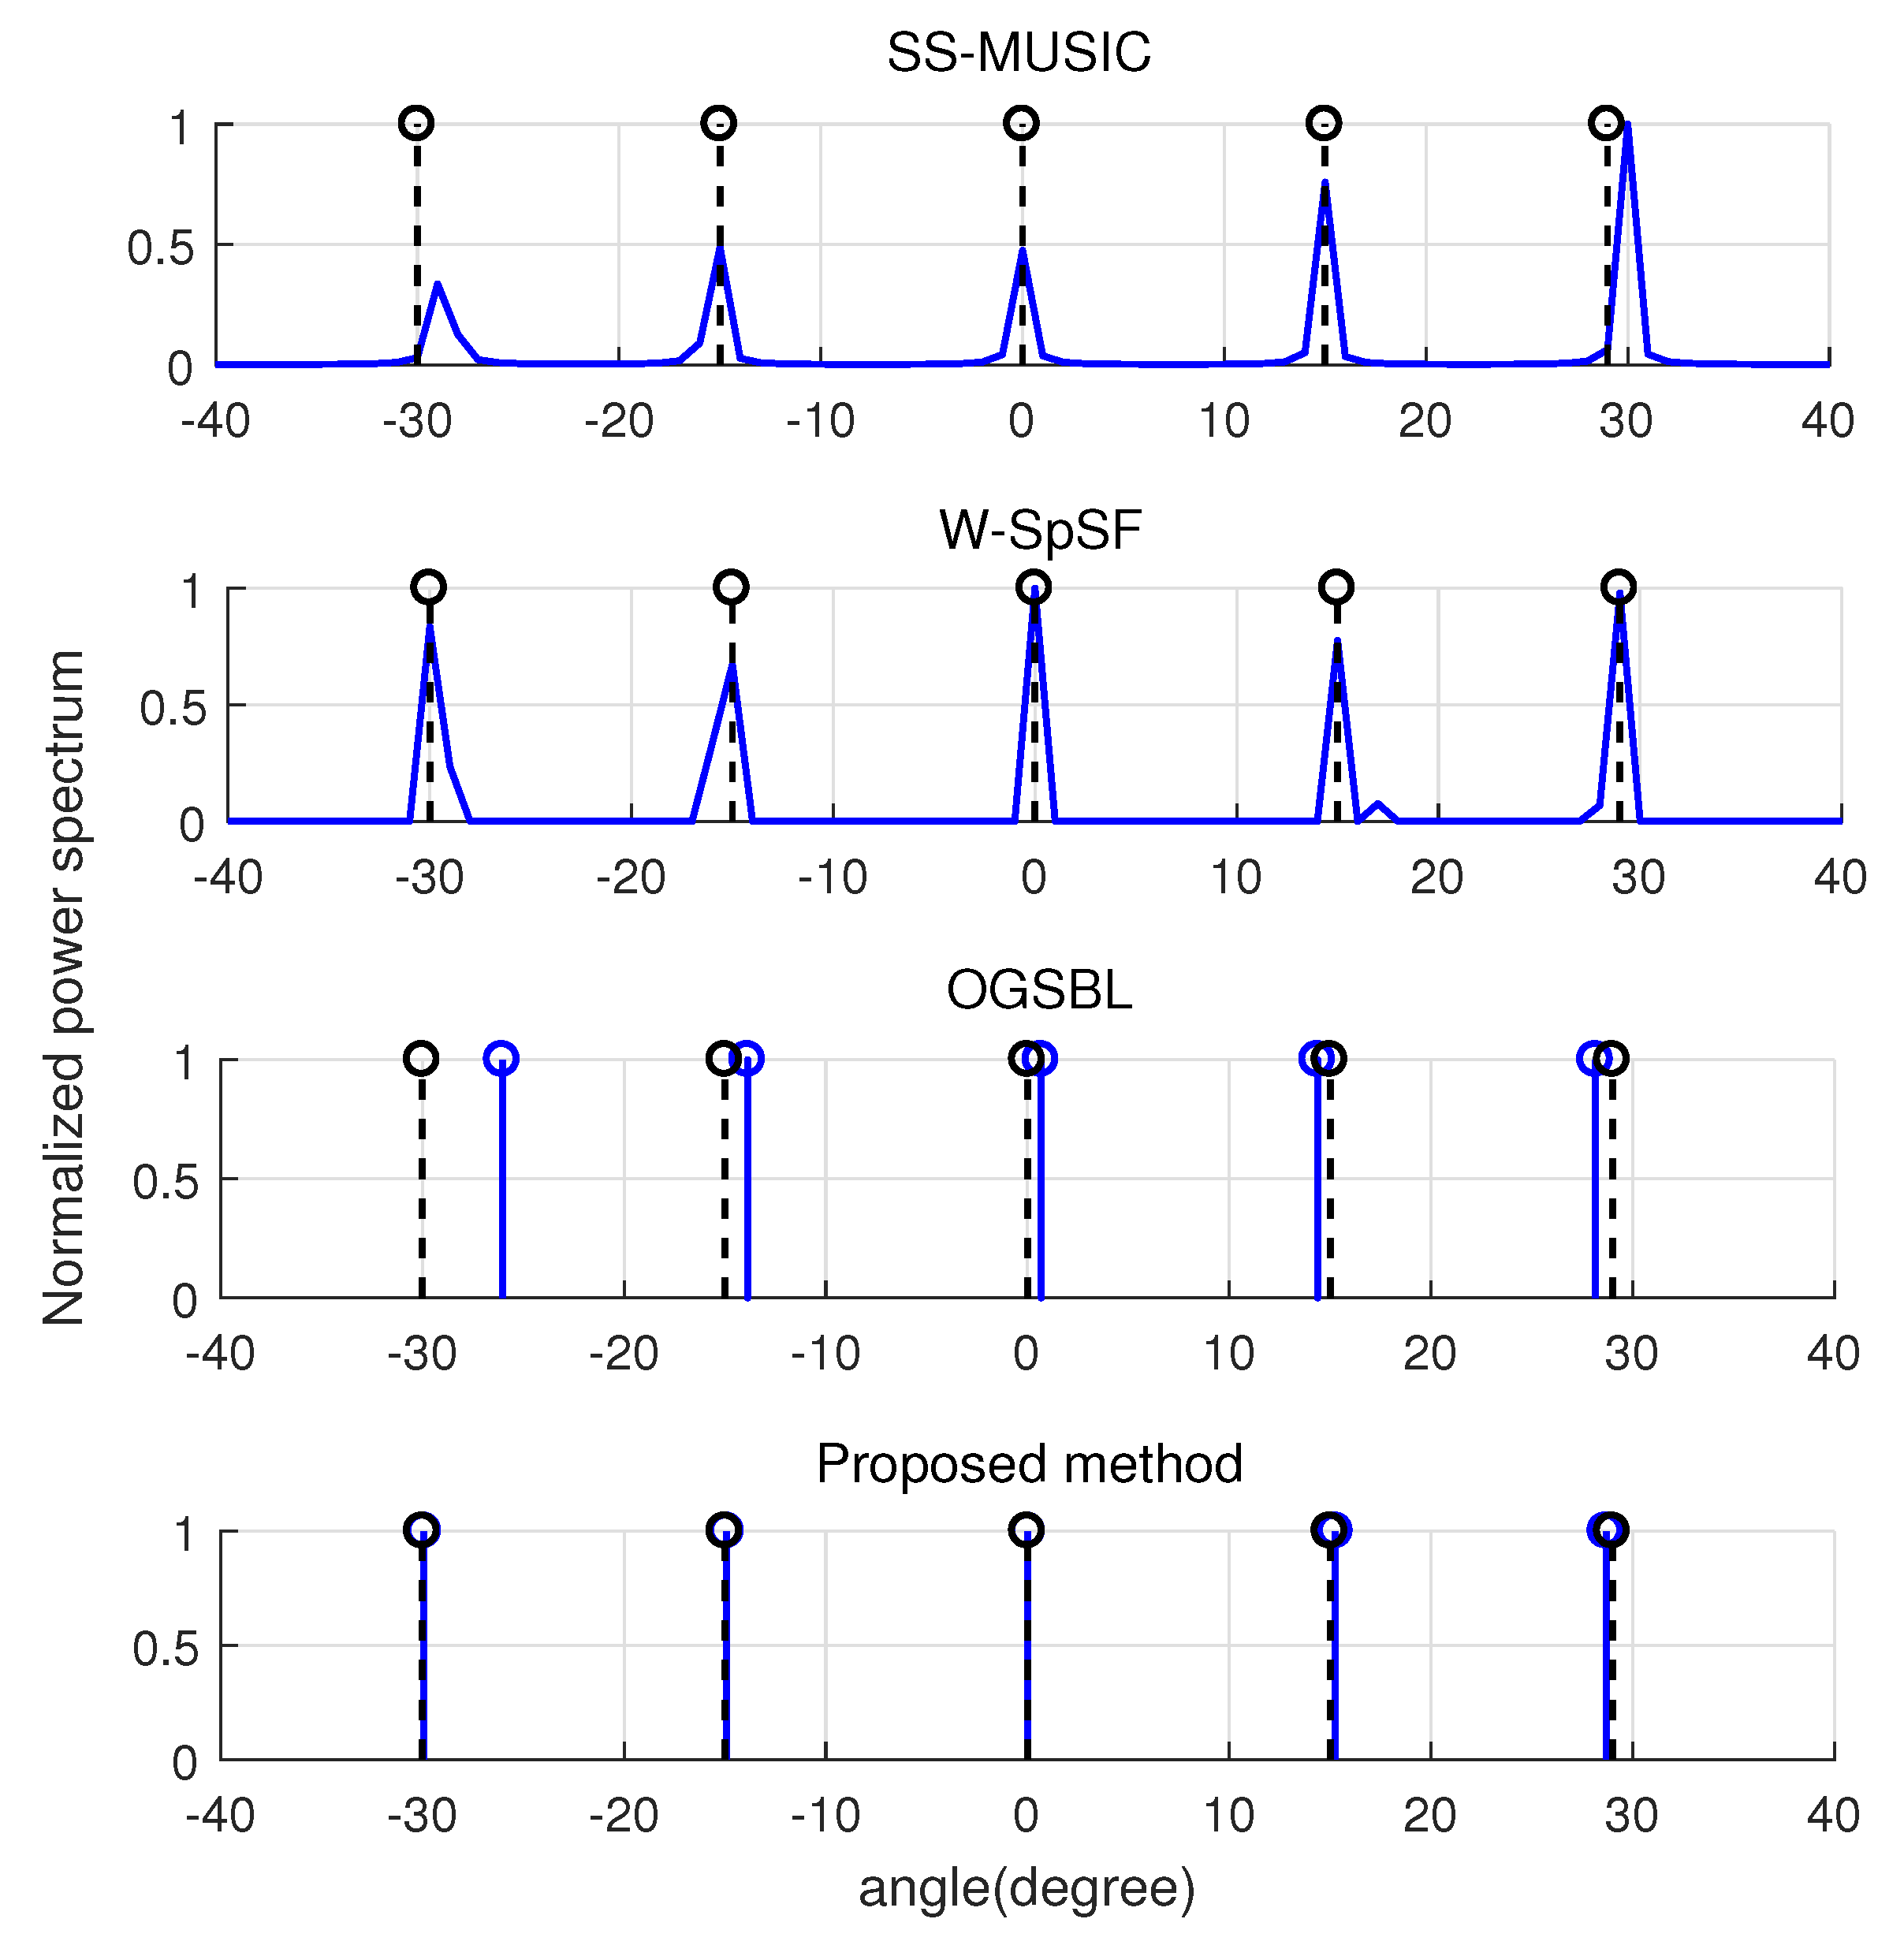
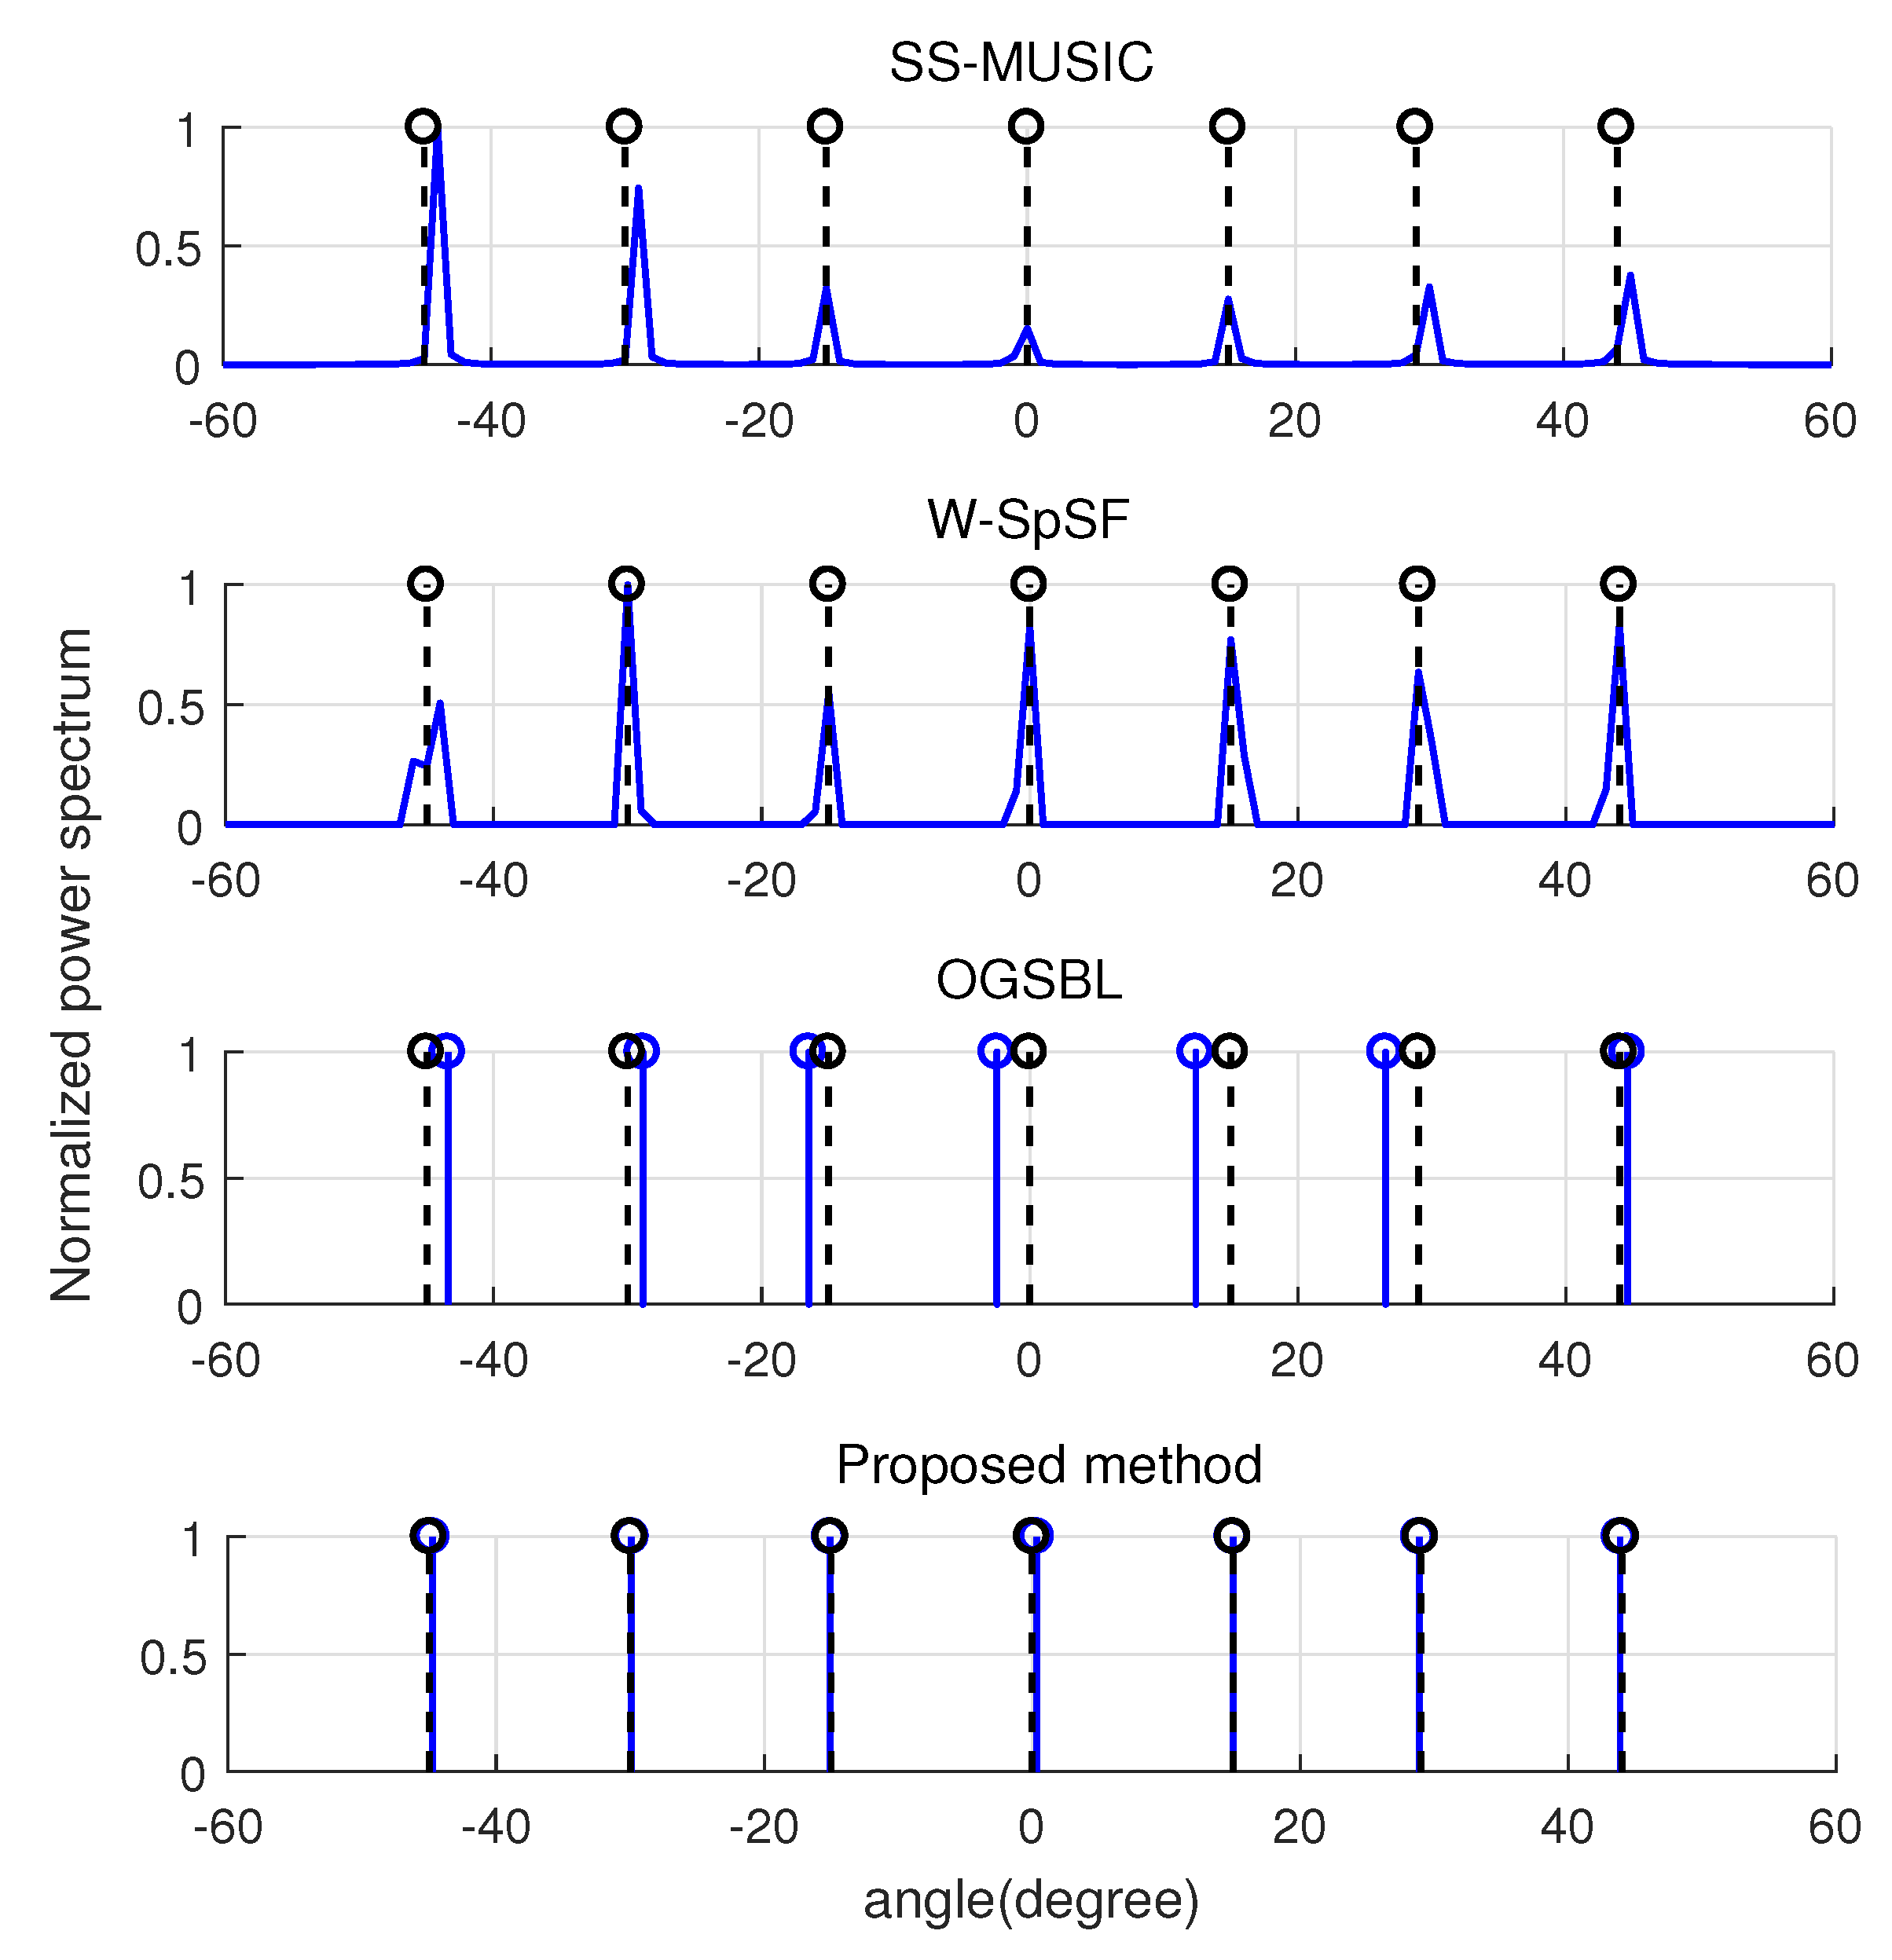
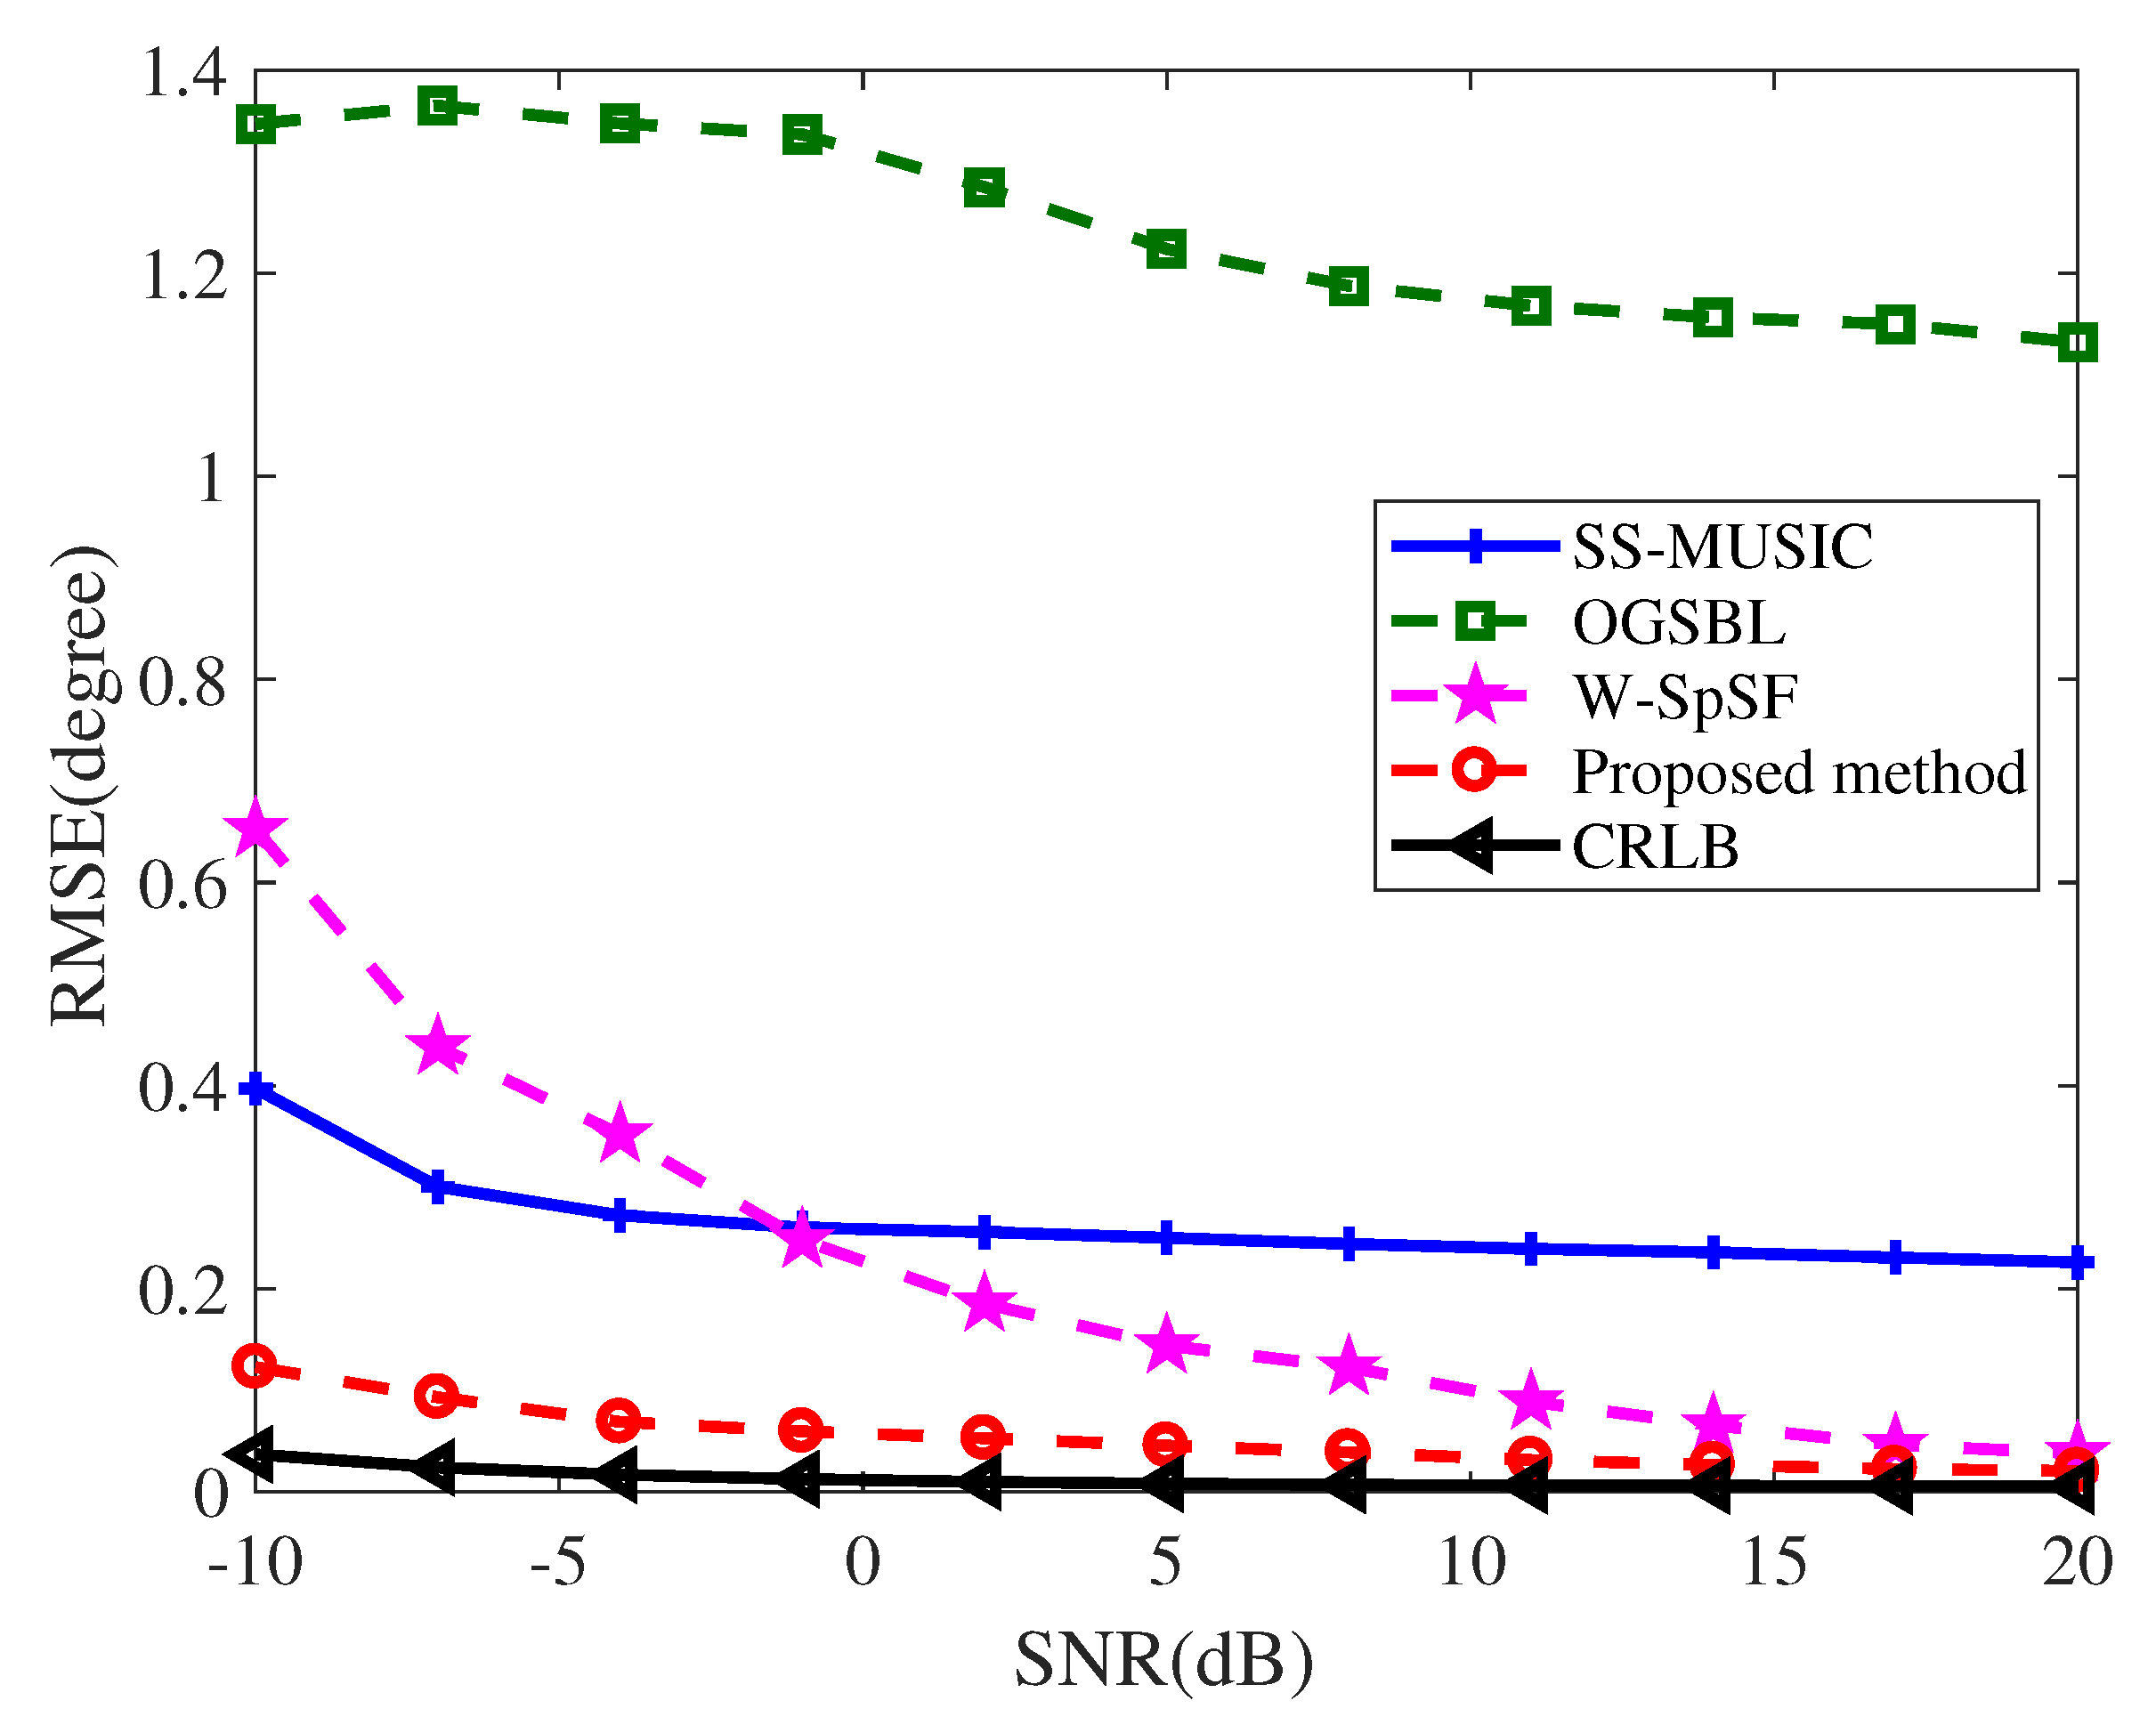
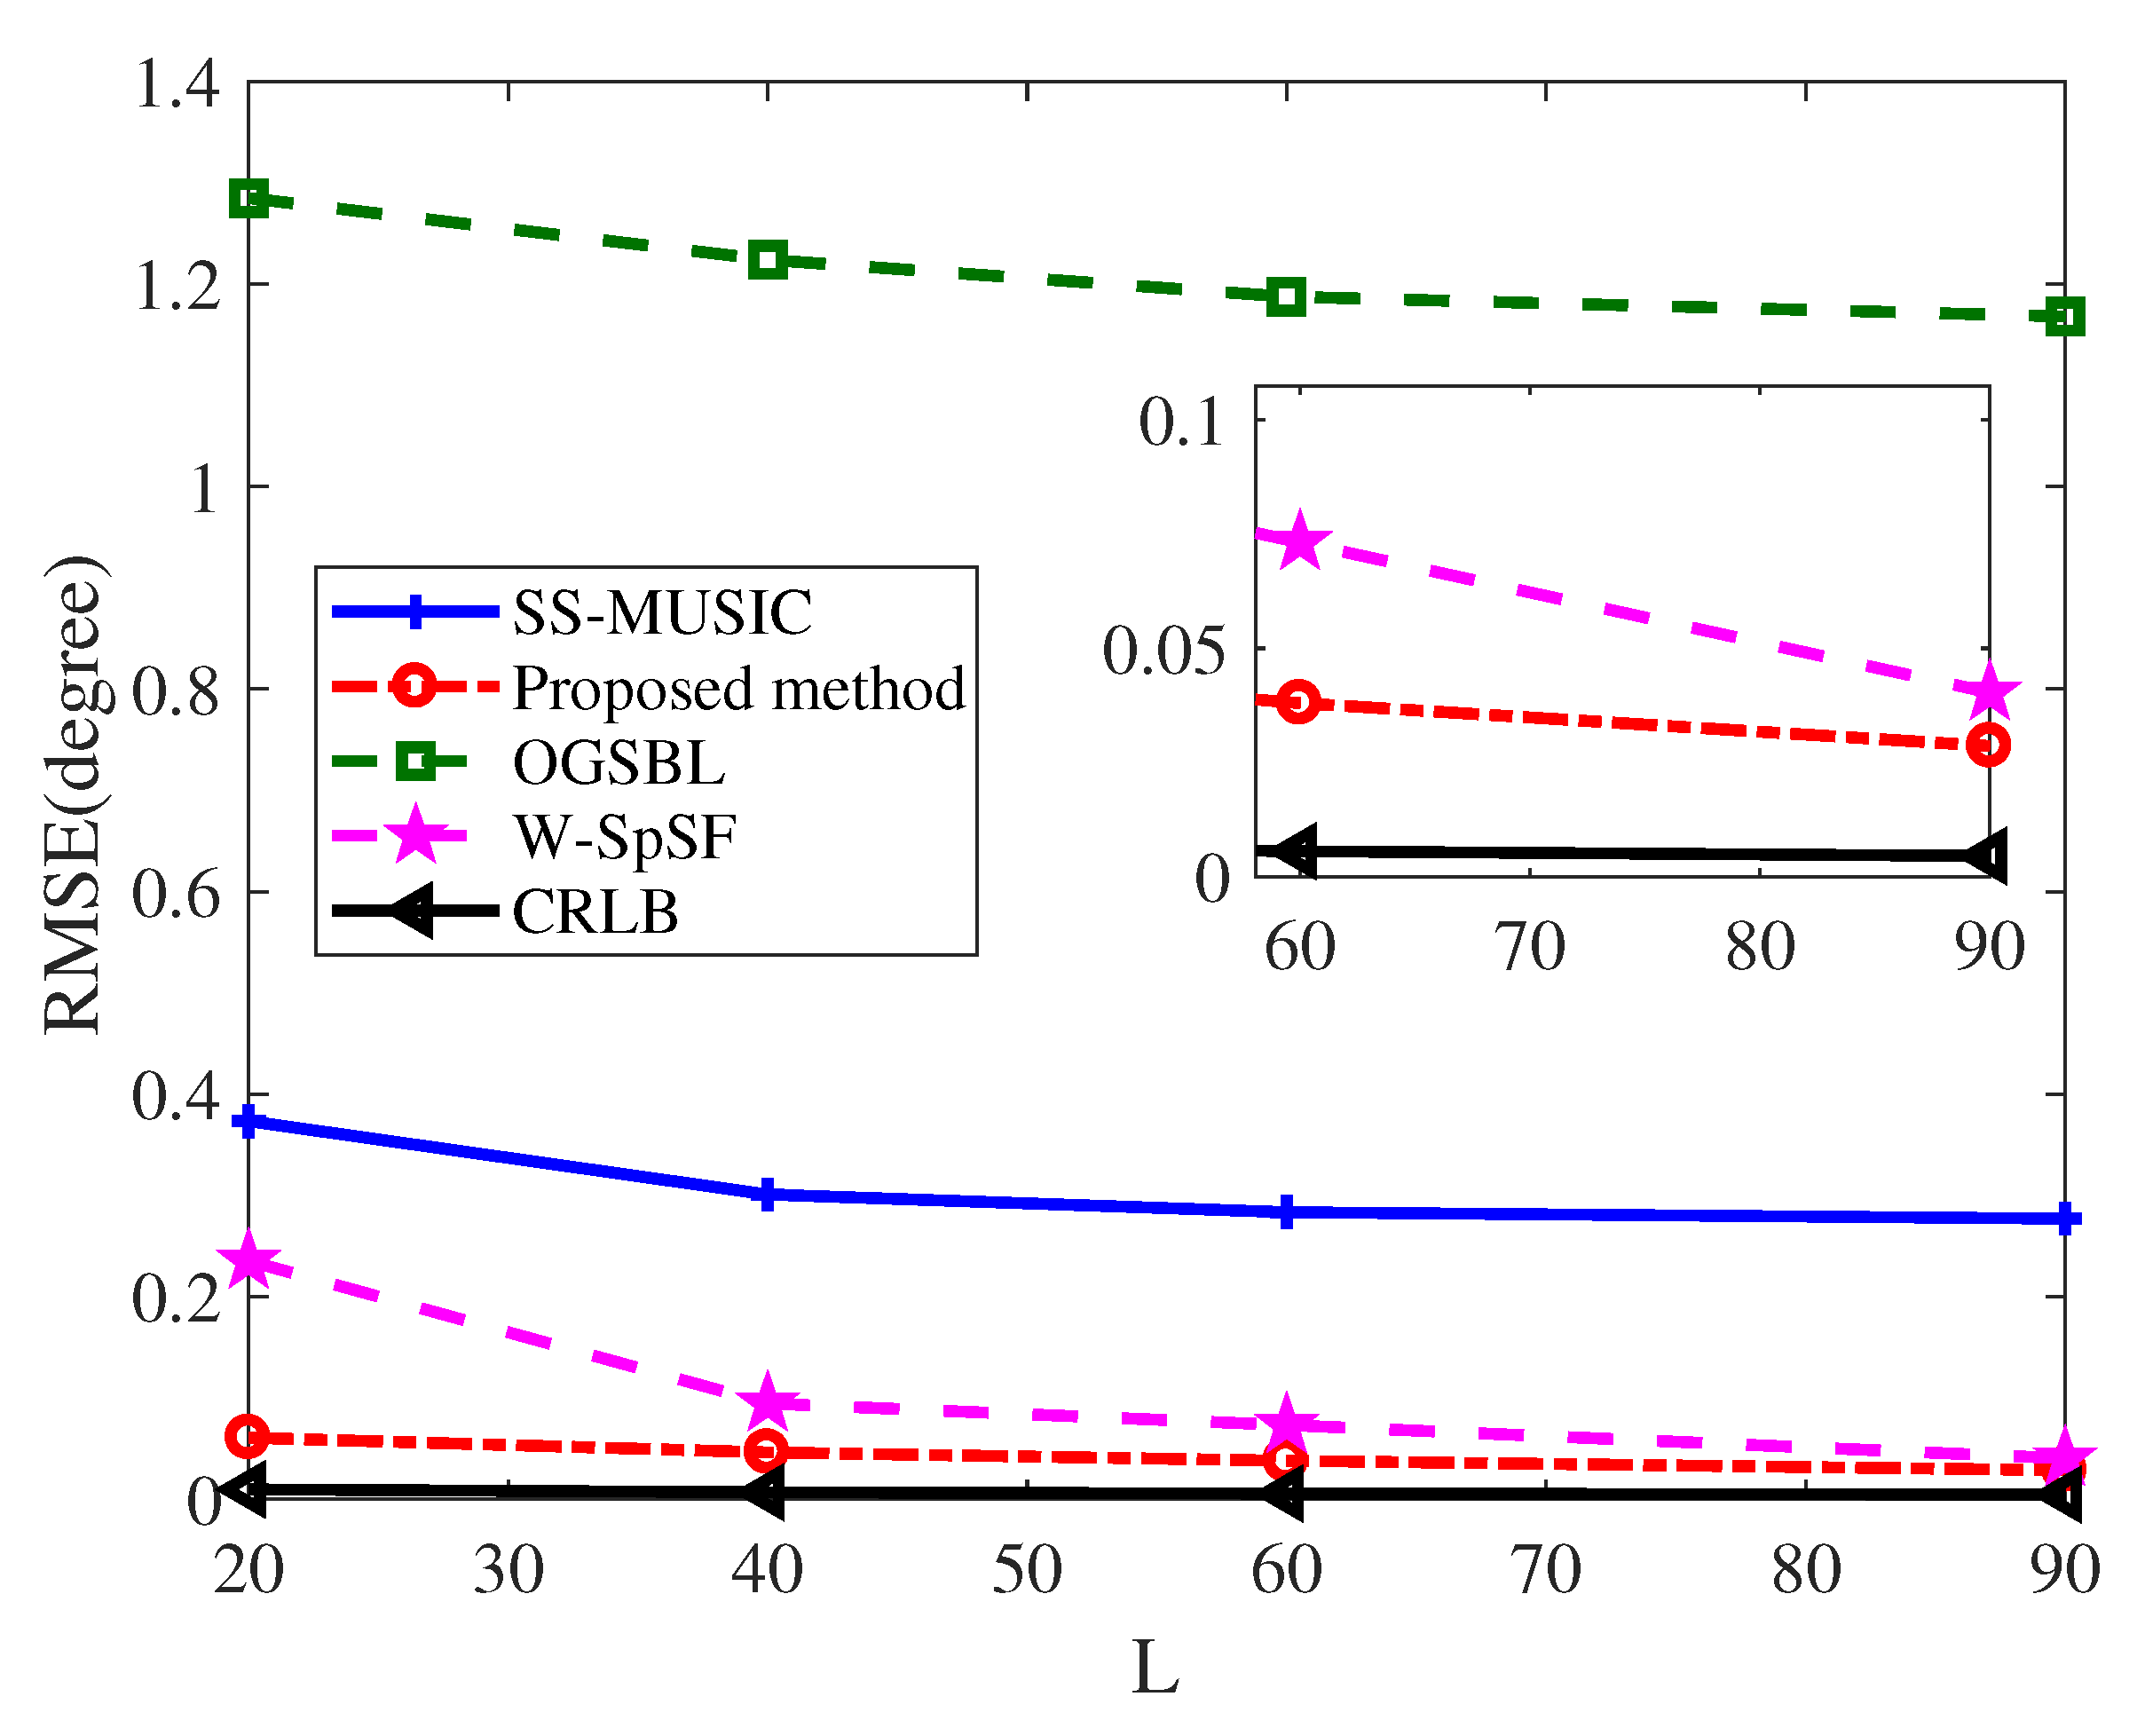
4.2.2. DOA Estimation

We compared the normalized spatial spectrum of all methods under the overdetermined and underdetermined scenarios, respectively. Firstly, five uncorrelated signal sources were at [ 30 , 15 , 0 , 15 , 29 ] and the S N R and snapshots were set as −5 dB and 30, respectively. In addition, the grid size was 0.5 degree in W-SpSF method. Figure 4 displays the normalized spatial spectrum for the five signal sources with the NA of six sensors. In Figure 4, the dashed lines are used to represent the true signal sources, while the solid lines stand for the estimated DOAs. It can be seen that five wideband signals can be detected successfully by SS-MUSIC, W-SpSF method, OGSBL, and the proposed method in the low SNR. However, there is a sidelobe peak with the performance of W-SpSF, and worse accuracy for some angles are displayed with the performance SS-MUSIC and OGSBL. Therefore, our proposed method has the best detection and estimation performance as the DOA estimations are closest to the true signals.
Then, we compared the detection performance of all methods for the underdetermined case. The seven signals were the same as in Figure 3. The SNR and snapshots were again fixed as −5 dB and 30, respectively. Figure 5 shows the normalized spatial spectrum for the five signal sources of all methods, respectively. It is shown that all methodd can detect seven peaks successfully in the normalized spatial spectrum nearby the true DOAs. The normalized power of SS-MUSIC is worse for some signals, and there is a certain deviation in this method. W-SpSF method has a sidelobe and a certain deviation, as well. Although OGSBL has stronger normalized power, its DOA estimations are farthest from the true signals. Figure 5 shows that the propose method gives the best detectable capability, since it has strong normalized power and its estimated DOAs are closest to the true signals.
Afterwards, to evaluate the estimation accuracy of our proposed method, we give the estimation results of all methods in the light of the root mean square error (RMSE), that is
RMSE = 1 K Q k = 1 K q = 1 Q ( θ ^ k q θ k ) 2 .
where θ k and θ ^ k q denote the kth true angle and the kth estimated angle in the qth Monte Carlo trial, respectively. Unless otherwise specified, seven wideband signals impinged on the NA from 45 , 30 , 15 , 0 , 15 , 29 , 44 . We varied SNR from −10 to 20 dB at the step of 3 dB and fixed snapshots to L = 30 . Figure 6 shows the results averaged over Q = 100 Monte Carlo trials as a function of SNR. It can be observed that OGSBL and SS-MUSCI have the same performance, whose estimation accuracies do not improve markedly with the SNR increasing. Although the W-SpSF method outperforms the SS-MUSIC method when S N R > 1 dB, and its RMSE curve is gradually close to the CRLB curve, our proposed method’s estimation accuracy is the closest to the counterpart of CRLB. The reason is that the method we propose can recover the optimal covariance matrix with Toeplitz structure, which is beneficial to obtain accurate DOAs.
Finally, to further illustrate the estimation performance of our proposed method, the RMSE versus the number of snapshots was examined for all methods. In this simulation, the value of snapshots was varied from 20 to 90, while the SNR was fixed to 5 dB. In Figure 7, we note that all methods can obtain more accurate estimation performance by increasing the number of snapshots. Obviously, the RMSE of OGSBL is still the largest among all methods followed the RMSE of SS-MUSIC (Figure 7). Although the W-SpSF RMSE curve tends to decrease most quickly versus the number of snapshots, its performance is worse than the counterpart of the proposed method in all regions. Therefore, under the case of same snapshots, the proposed method exhibits better performance in comparison with SS-MUSIC, OGSBL, and W-SpSF method.

5. Conclusions

In this paper, a novel wideband DOA estimation technique equipped with NA is proposed, which seeks and utilizes the Toeplitz structure of the reconstructed virtual array by ANM and thus can work well under the underdetermined wideband case. Our method provides an effective solution through collecting the vectorized covariance matrix via sub-band focusing operation to reformulate the single wideband model of virtual array, recovering the optimal Toeplitz covariance matrix and improving the Root-MUSIC by Toeplitz structure enhancement. Numerical simulations showed that the proposed method outperforms the state-of-the-art methods. In the next work, we will continue to study the wideband coherent signals DOA estimation via ANM with sensors position error.

Author Contributions

Conceptualization, J.S.; methodology, J.S.; software, J.S. and W.T.; formal analysis, J.S., W.T., and L.H.; writing—original draft, J.S.; writing—review and editing, Q.Z., W.T., L.M., and W.S.; and supervision, Q.Z. All authors have read and agreed to the published version of the manuscript.

Funding

This work was funded by National Key R & D Program of China under Grant number 2016YFC1400203 and National Natural Science Foundation of China under Grant numbers 61531015 and 61901467.

Conflicts of Interest

The authors declare no conflict of interest.

References

  1. Tuncer, T.; Friedlander, B. Classical and Modern Direction of Arrival Estimation; Academic: New York, NY, USA, 2009. [Google Scholar]
  2. Wang, B.; Zhang, S.; Wang, W. Bayesian inverse synthetic aperture radar imaging by exploiting sparse probing frequencies. IEEE Antennas Wirel. Propag. Lett. 2015, 14, 169–1701. [Google Scholar] [CrossRef]
  3. Wu, Y.; Zhang, S.; Kang, H. Fast marginalized sparse Bayesian learning for 3-D interferometric ISAR Image information via super resolution ISAR imaging. IEEE J. Sel. Top. Appl. Earth Obs. Remote Sens. 2015, 10, 4942–4951. [Google Scholar] [CrossRef]
  4. Mao, L.; Li, H.; Zhang, Q. Transmit design and DOA estimation for wideband MIMO system with colocated nested arrays. Signal Process. 2018, 134, 244–248. [Google Scholar] [CrossRef] [Green Version]
  5. Li, X.; Zhao, C.; Yu, J.; Wei, W. Underwater Bearing-Only and Bearing-DopplerTarget Tracking Based on Square Root Unscented Kalman Filter. Entropy 2019, 21, 740. [Google Scholar] [CrossRef] [Green Version]
  6. Chen, X.; Li, Y.; Li, Y.; Yu, J.; Li, X. A Novel Probabilistic Data Association for Target Tracking in a Cluttered Environment. Sensors 2016, 16, 2180. [Google Scholar] [CrossRef] [PubMed] [Green Version]
  7. Li, Y.; Chen, X.; Yu, J.; Yang, X.; Yang, H. The Data-Driven Optimization Method and Its Application in Feature Extraction of Ship-Radiated Noise with Sample Entropy. Energies 2019, 12, 359. [Google Scholar] [CrossRef] [Green Version]
  8. Roy, R.; Paulraj, A.; Kailath, T. Comparative performance of ESPRIT and MUSIC for direction-of-arrival estimation. In Proceedings of the IEEE International Conference on Acoustics, Speech, and Signal Processing, ICASSP ’87, Dallas, TX, USA, 6–9 April 1987; Volume 12, pp. 2344–2347. [Google Scholar]
  9. Li, Y.; Chen, X.; Yu, J.; Yang, X. A Fusion Frequency Feature Extraction Method for Underwater Acoustic Signal Based on Variational ModeDecomposition, Duffing Chaotic Oscillator and a Kind of Permutation Entropy. Electronics 2019, 8, 61. [Google Scholar] [CrossRef] [Green Version]
  10. Yu, H.; Liu, J.; Huang, Z. A New Method for Wideband DOA Estimation. In Proceedings of the 2007 International Conference on Wireless Communications, Networking and Mobile Computing, Shanghai, China, 21–25 September 2007; pp. 1–5. [Google Scholar]
  11. Shi, J.; Zhang, Q.; Shi, W. Wideband DOA estimation with deficient snapshots using low rank Toeplitz structure. IET Electron. Lett. 2019, 17, 961–963. [Google Scholar] [CrossRef]
  12. Pal, P.; Vaidyanathan, P. A Novel Autofocusing Approach for Estimating Directions-of-Arrival of Wideband Signals. In Proceedings of the 2009 Conference Record of the Forty-Third Asilomar Conference on Signals, Systems and Computers, Pacific Grove, CA, USA, 1–4 November 2009; pp. 1663–1667. [Google Scholar]
  13. Shi, J.; Zhang, Q.; Wang, Y. Wideband DOA Estimation based on A-shaped Array. In Proceedings of the 2017 IEEE International Conference on Signal Processing, Communications and Computing (ICSPCC), Xiamen, China, 22–25 October 2017; pp. 1–5. [Google Scholar]
  14. Qin, Y.; Liu, Y.; Liu, J.; Yu, Z. Underdetermined Wideband DOA Estimation for Off-Grid Sources with Coprime Array Using Sparse Bayesian Learning. Sensors 2018, 18, 253. [Google Scholar] [CrossRef] [Green Version]
  15. Ma, W.; Hsieh, T.; Chi, C. DOA estimation of quasistationary signals with less sensors than sources and unknown spatial noise covariance: A Khatri-Rao subspace approach. IEEE Trans. Signal Process. 2010, 58, 2168–2180. [Google Scholar] [CrossRef]
  16. Shen, Q.; Liu, W.; Cui, W.; Wu, S. Underdetermined DOA Estimation Under the Compressive Sensing Framework: A Review. IEEE Access 2016, 4, 8865–8878. [Google Scholar] [CrossRef]
  17. Shi, Y.; Mao, X.; Zhao, C.; Liu, W. Underdetermined DOA estimation for Wideband Signals via Joint Sparse Signal Reconstruction. IEEE Signal Process. Lett. 2019, 26, 1541–1545. [Google Scholar] [CrossRef]
  18. He, Z.; Shi, Z.; Huang, L. Underdetermined DOA estimation for wideband signals using robust sparse covariance fitting. IEEE Signal Process. Lett. 2015, 4, 435–439. [Google Scholar] [CrossRef]
  19. Pal, P.; Vaidyanathan, P. Nested arrays: A novel approach to array processing with enhanced degrees of freedom. IEEE Trans. Signal Process. 2010, 58, 4167–4180. [Google Scholar] [CrossRef] [Green Version]
  20. Tan, Z.; Eldar, Y.; Nehorai, A. Direction-of-arrival estimation using coprime arrays: A super resolution viewpoint. IEEE Trans. Signal Process. 2014, 62, 5565–5576. [Google Scholar] [CrossRef] [Green Version]
  21. Pal, P.; Vaidyanathan, P. Sparse sensing with co-prime samplers and arrays. IEEE Trans. Signal Process. 2011, 59, 573–586. [Google Scholar]
  22. Raj, A.; McClellan, J. Single Snapshot Super-Resolution DOA Estimation for Arbitrary Array Geometries. IEEE Signal Process. Lett. 2019, 26, 119–123. [Google Scholar]
  23. Li, Y.; Chi, Y. Off-the-Grid Line Spectrum Denoising and Estimation With Multiple Measurement Vectorss. IEEE Trans. Signal Process. 2016, 64, 1257–1269. [Google Scholar] [CrossRef] [Green Version]
  24. Wang, Y.; Xu, P.; Tian, Z. Efficient Channel Estimation for Massive MIMO Systems via Truncated two-dimensional Atomic Norm Minimization. In Proceedings of the 2017 IEEE International Conference on Communications (ICC), Paris, France, 21–25 May 2017; pp. 1–6. [Google Scholar]
  25. Carlin, M.; Rocca, P.; Oliveri, G.; Viani, F.; Massa, A. Directions of arrival estimation through Bayesian compressive sensing strategies. IEEE Trans. Antennas Propag. 2013, 61, 3828–3838. [Google Scholar] [CrossRef]
  26. Shen, Q.; Liu, W.; Cui, W.; Wu, S.; Zhang, Y.; Amin, M. Focused compressive sensing for underdetermined wideband DOA estimation exploiting high-order difference coarrays. IEEE Signal Process. Lett. 2017, 24, 86–90. [Google Scholar] [CrossRef]
  27. Tan, W.; Feng, X. Covariance matrix reconstruction for direction finding with nested arrays using iterative reweighted nuclear norm minimization. Int. J. Antennas Propag. 2019, 2019, 7657898. [Google Scholar] [CrossRef] [Green Version]
  28. Bhaskar, B.; Tang, G.; Recht, B. Atomic norm denoising with applications to line spectral estimation. IEEE Trans. Signal Process. 2013, 61, 5987–5999. [Google Scholar] [CrossRef] [Green Version]
  29. Huang, L.; So, H. Source Enumeration Via MDL Criterion Based on Linear Shrinkage Estimation of Noise Subspace Covariance Matrix. Trans. Signal Process. 2013, 61, 4806–4821. [Google Scholar] [CrossRef]
  30. Seghouane, A.-K. Asymptotic bootstrap corrections of AIC for linear regression models. Signal Process. 2010, 90, 217–224. [Google Scholar] [CrossRef]
  31. Feng, Z.; Liao, H. Wideband Direction of Arrival Estimation Based on the Principal Angle between Subspace. Electromagn. Res. Lett. 2018, 78, 23–29. [Google Scholar] [CrossRef] [Green Version]
  32. Bo, L.; Xiong, J.; Luo, L. Novel Wideband DOA Estimation Method Using Direction-Free Focusing Matrix. In Proceedings of the 2013 3rd International Conference on Computer Science and Network Technology, Dalian, China, 12–13 October 2013; pp. 1065–1069. [Google Scholar]
  33. Cui, W.; Shen, Q.; Liu, W.; Wu, S. Low complexity DOA estimation for wideband off-grid sources based on re-focused compressive sensing with dynamic dictionary. IEEE J. Sel. Signal Process. 2019, 5, 918–928. [Google Scholar] [CrossRef]
  34. Zhang, Z.; Wang, Y.; Tian, Z. Efficient two-dimensional line spectrum estimation based on decoupled atomicnorm minimization. Signal Process. 2019, 163, 95–106. [Google Scholar] [CrossRef] [Green Version]
  35. Wang, Y.; Tian, Z. IVDST: A Fast Algorithm for Atomic Norm Minimization in Line Spectral Estimation. IEEE Signal Process. Lett. 2018, 25, 1715–1719. [Google Scholar] [CrossRef]
  36. Iwai, T.; Hirose, N.; Kikuma, N. Doa Estimation by Music Algorithm using Forward-backward Spatial Smoothing with Overlapped and Augmented Arrays. In Proceedings of the 2014 International Symposium on Antennas and Propagation Conference Proceedings, Kaohsiung, Taiwan, 2–5 December 2014; pp. 375–376. [Google Scholar]
  37. Yang, J.; Liao, G.; Li, J. An efficient off-grid DOA estimation sparse Bayesian learning strategies. Signal Process. 2016, 128, 110–122. [Google Scholar] [CrossRef]
  38. Liu, C.; Vaidyanathan, P. Cramér bounds for coprime and other sparse arrays, which find more sources than sensors. Digit. Signal Process. 2017, 61, 43–61. [Google Scholar] [CrossRef] [Green Version]
Figure 1. A two-level NA with M 1 sensors in the inner sub-array and M 2 sensors in the outer sub-array.
Entropy 22 00359 g001
Figure 2. Weight coefficient of co-array of NA with six sensors.
Entropy 22 00359 g002
Figure 3. Probability of detection versus SNRs.
Entropy 22 00359 g003
Figure 4. Normalized spatial spectrum for K = 5 sources when M = 6 , L = 30 , and S N R = 5 dB.
Entropy 22 00359 g004
Figure 5. Normalized spatial spectrum for K = 7 sources when M = 6 , L = 30 , and S N R = 5 dB.
Entropy 22 00359 g005
Figure 6. RMSE of DOA estimation for K = 7 sources versus SNRs when M = 6 and L = 30 .
Entropy 22 00359 g006
Figure 7. RMSE of DOA estimation for K = 7 sources versus the number of snapshots when M = 6 and S N R = 5 dB.
Entropy 22 00359 g007
Table 1. The default simulation settings.
ParameterValue
Number of sensors ( M ) 6
Number of sensors of inner sub-array ( M 1 ) 3
Number of sensors of outer sub-array ( M 2 ) 3
Low frequency ( f l ) 1000 Hz
High frequency ( f h ) 5000 Hz
Center frequency ( f 0 ) 3000 Hz
Velocity of underwater acoustic ( c ) 1500 m/s
Azimuthal range0–180 degree
Table 2. The probability of detection of the mentioned methods versus SNR.
MethodsPd = 0.9Pd = 1
Overdetermined CaseUnderdetermined CaseOverdetermined CaseUnderdetermined Case
AIC−10 dB−8.2 dB\\
AIC-C3−8.2 dB−8.2 dB−6.8 dB1.0 dB
MDL−6.8 dB−5.0 dB−5.5 dB−4.2 dB

