Time-Frequency Analysis of Cardiovascular and Cardiorespiratory Interactions During Orthostatic Stress by Extended Partial Directed Coherence

 , , ,
, , ,
Abstract
:1. Introduction
2. Materials and Methods
2.1. Subjects and Experimental Protocol
2.2. Pre-Processing and Data Analysis
2.3. Cardiovascular and Cardiorespiratory Interactions by ePDC
2.3.1. Time-Frequency Analysis of Interactions
2.3.2. Surrogate Data Analysis
2.3.3. Parametrization of Time-Frequency Representation of Interactions
2.4. Statistics
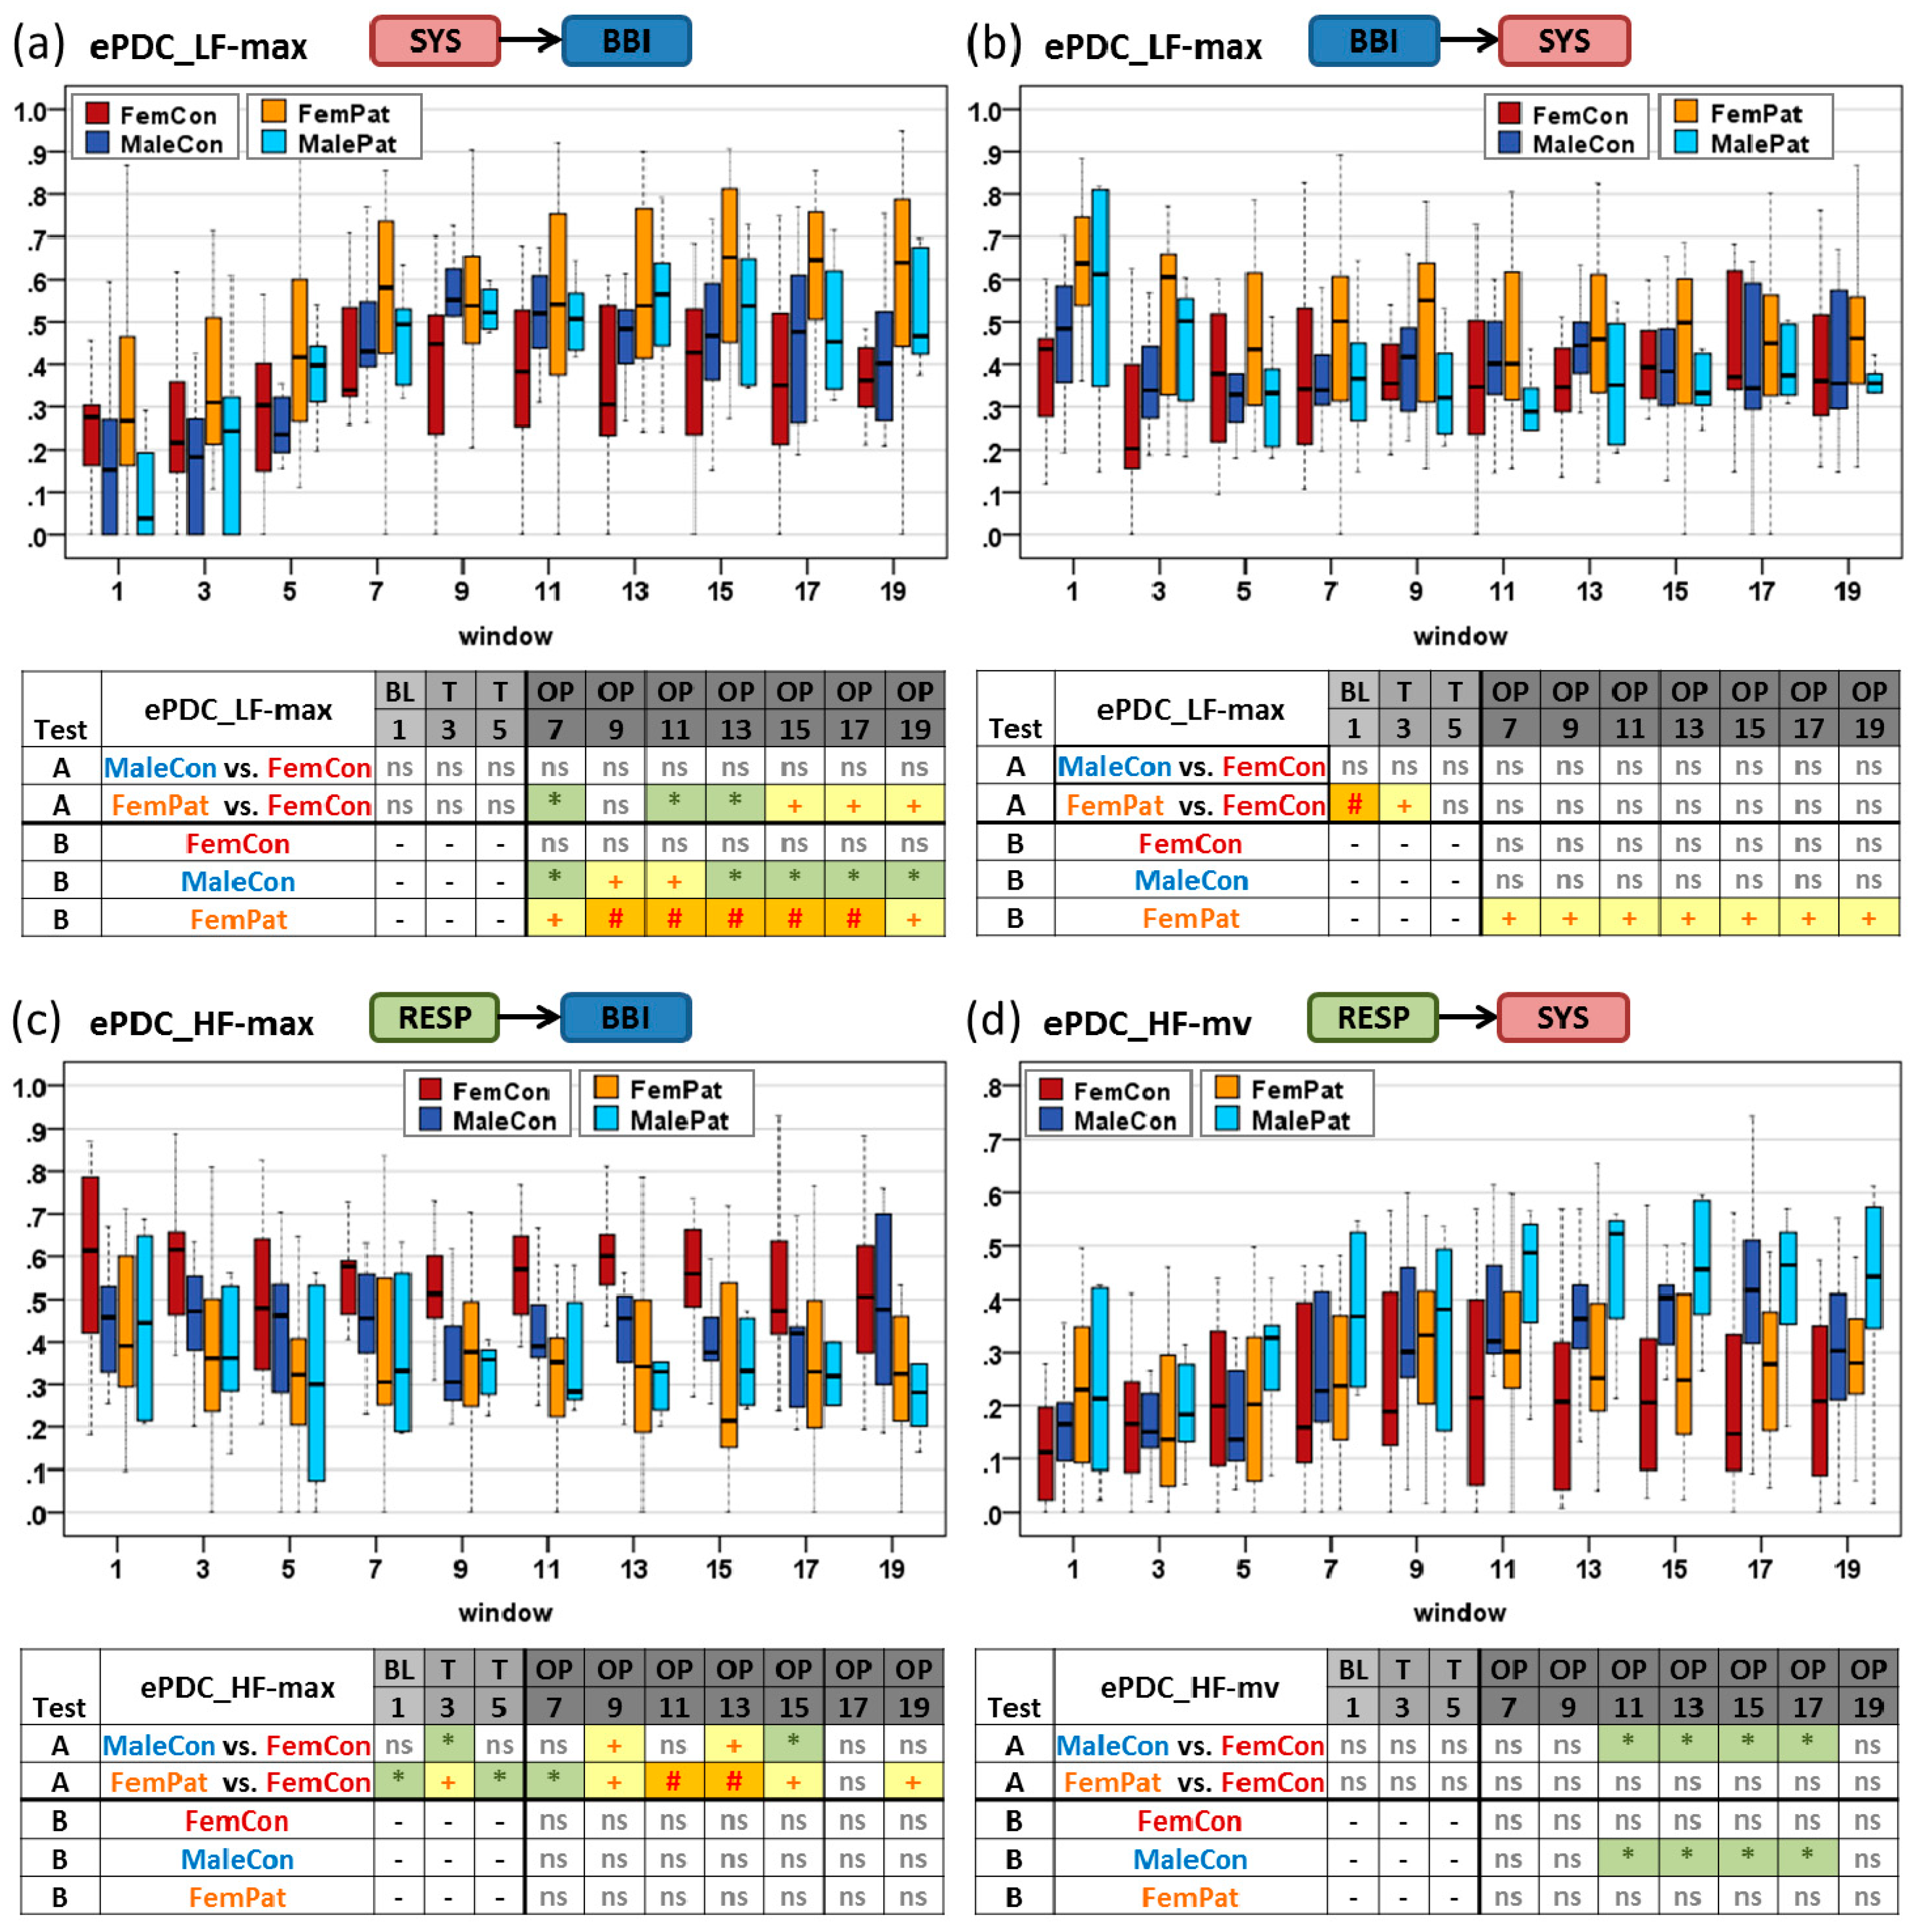
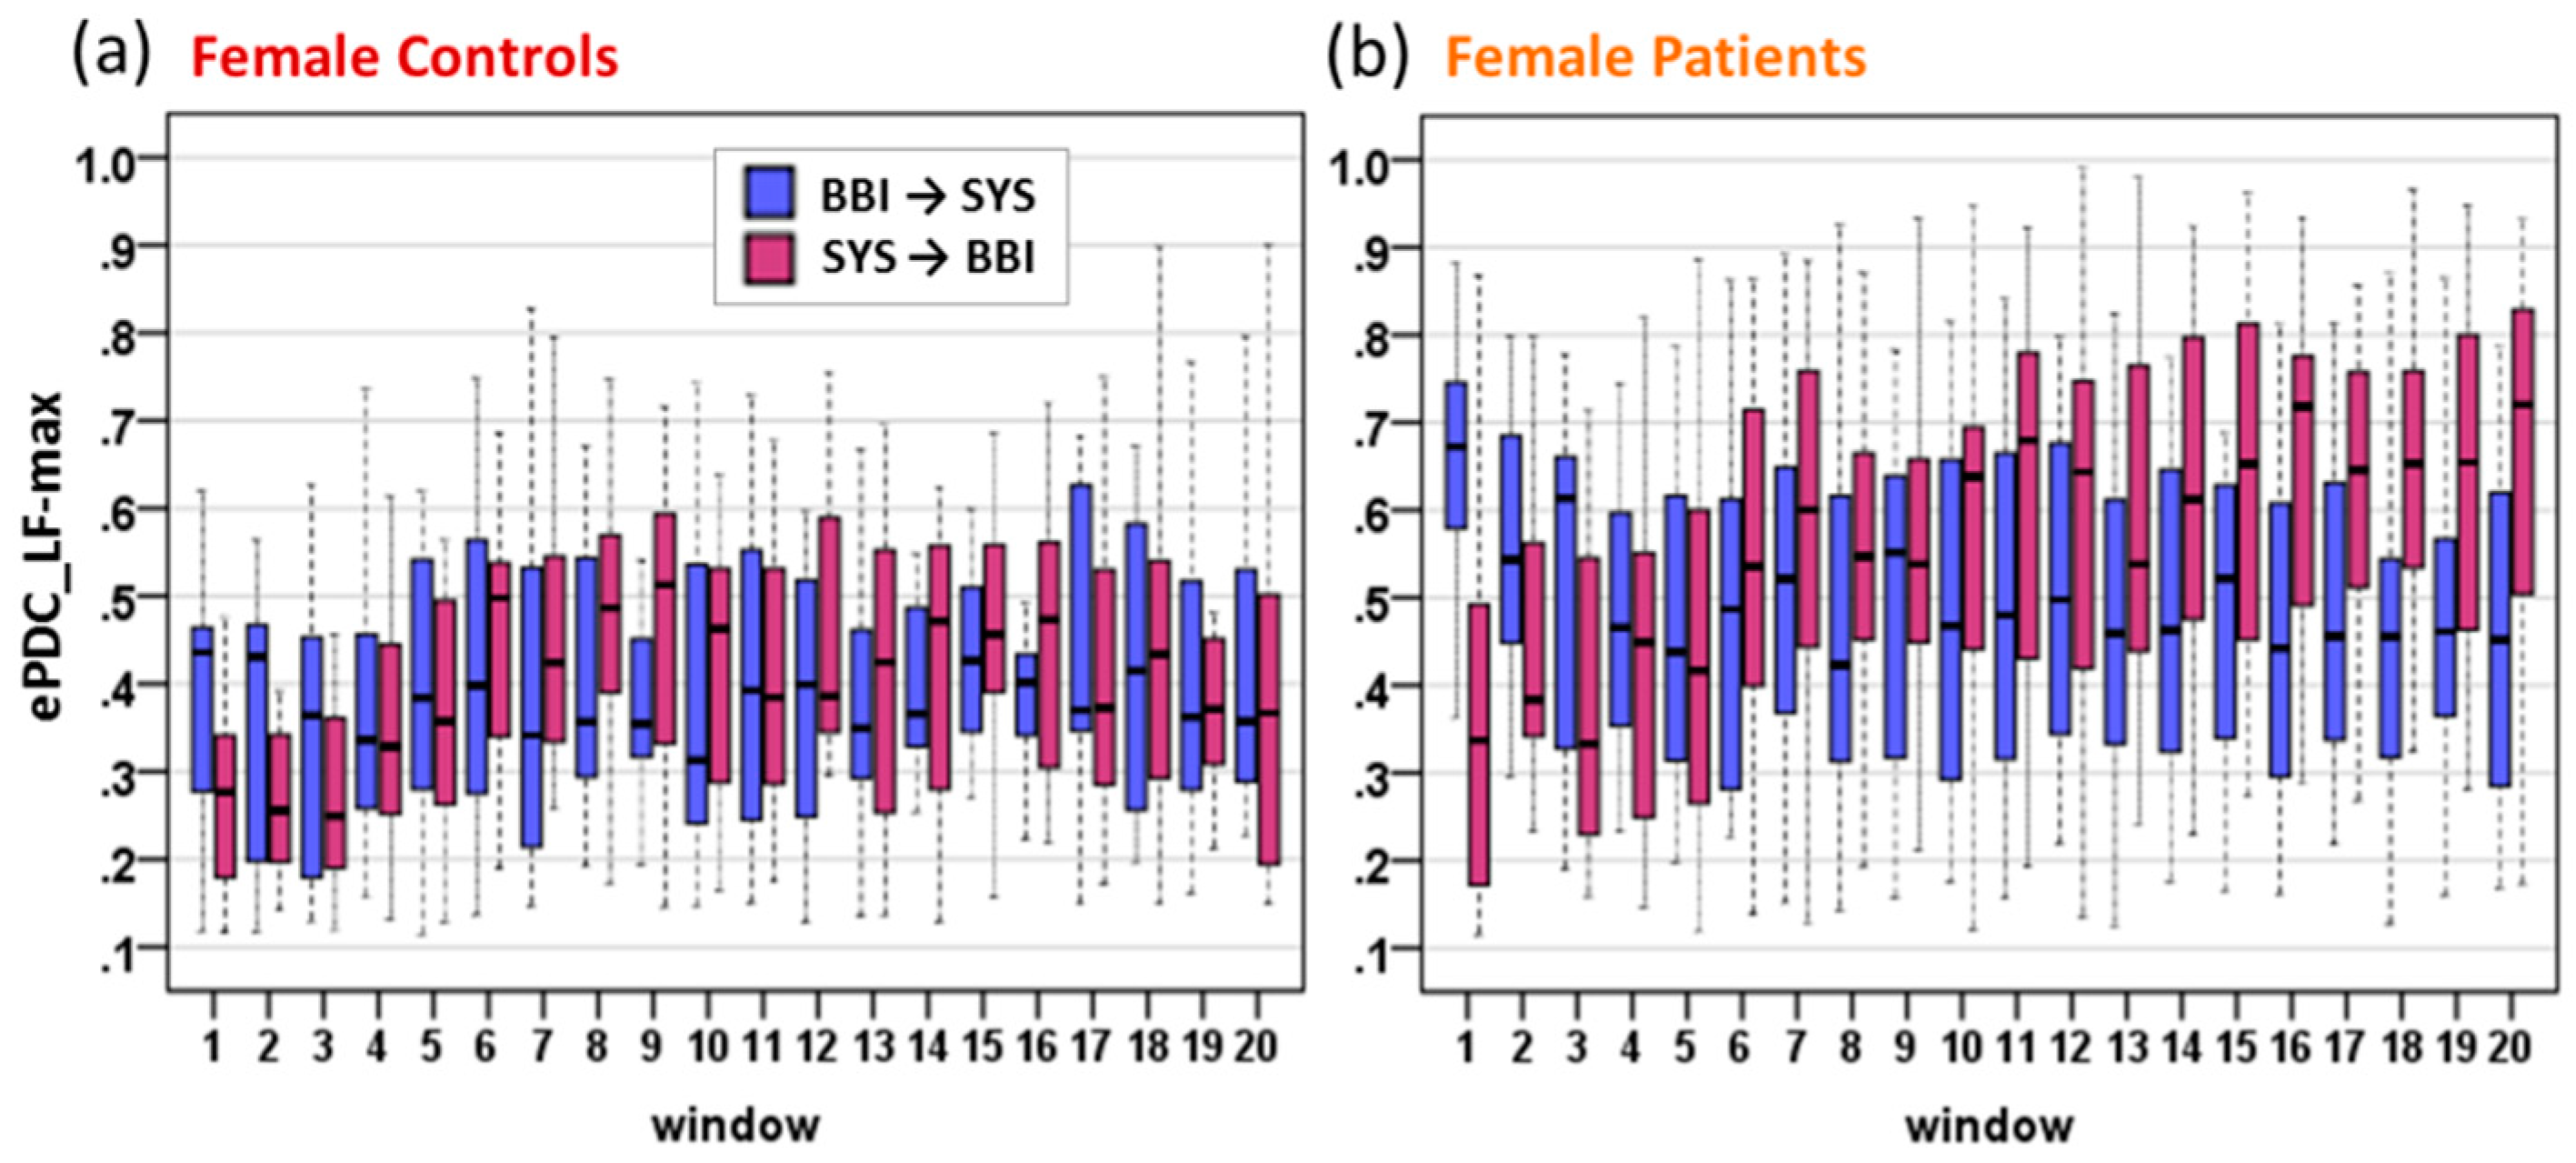
3. Results
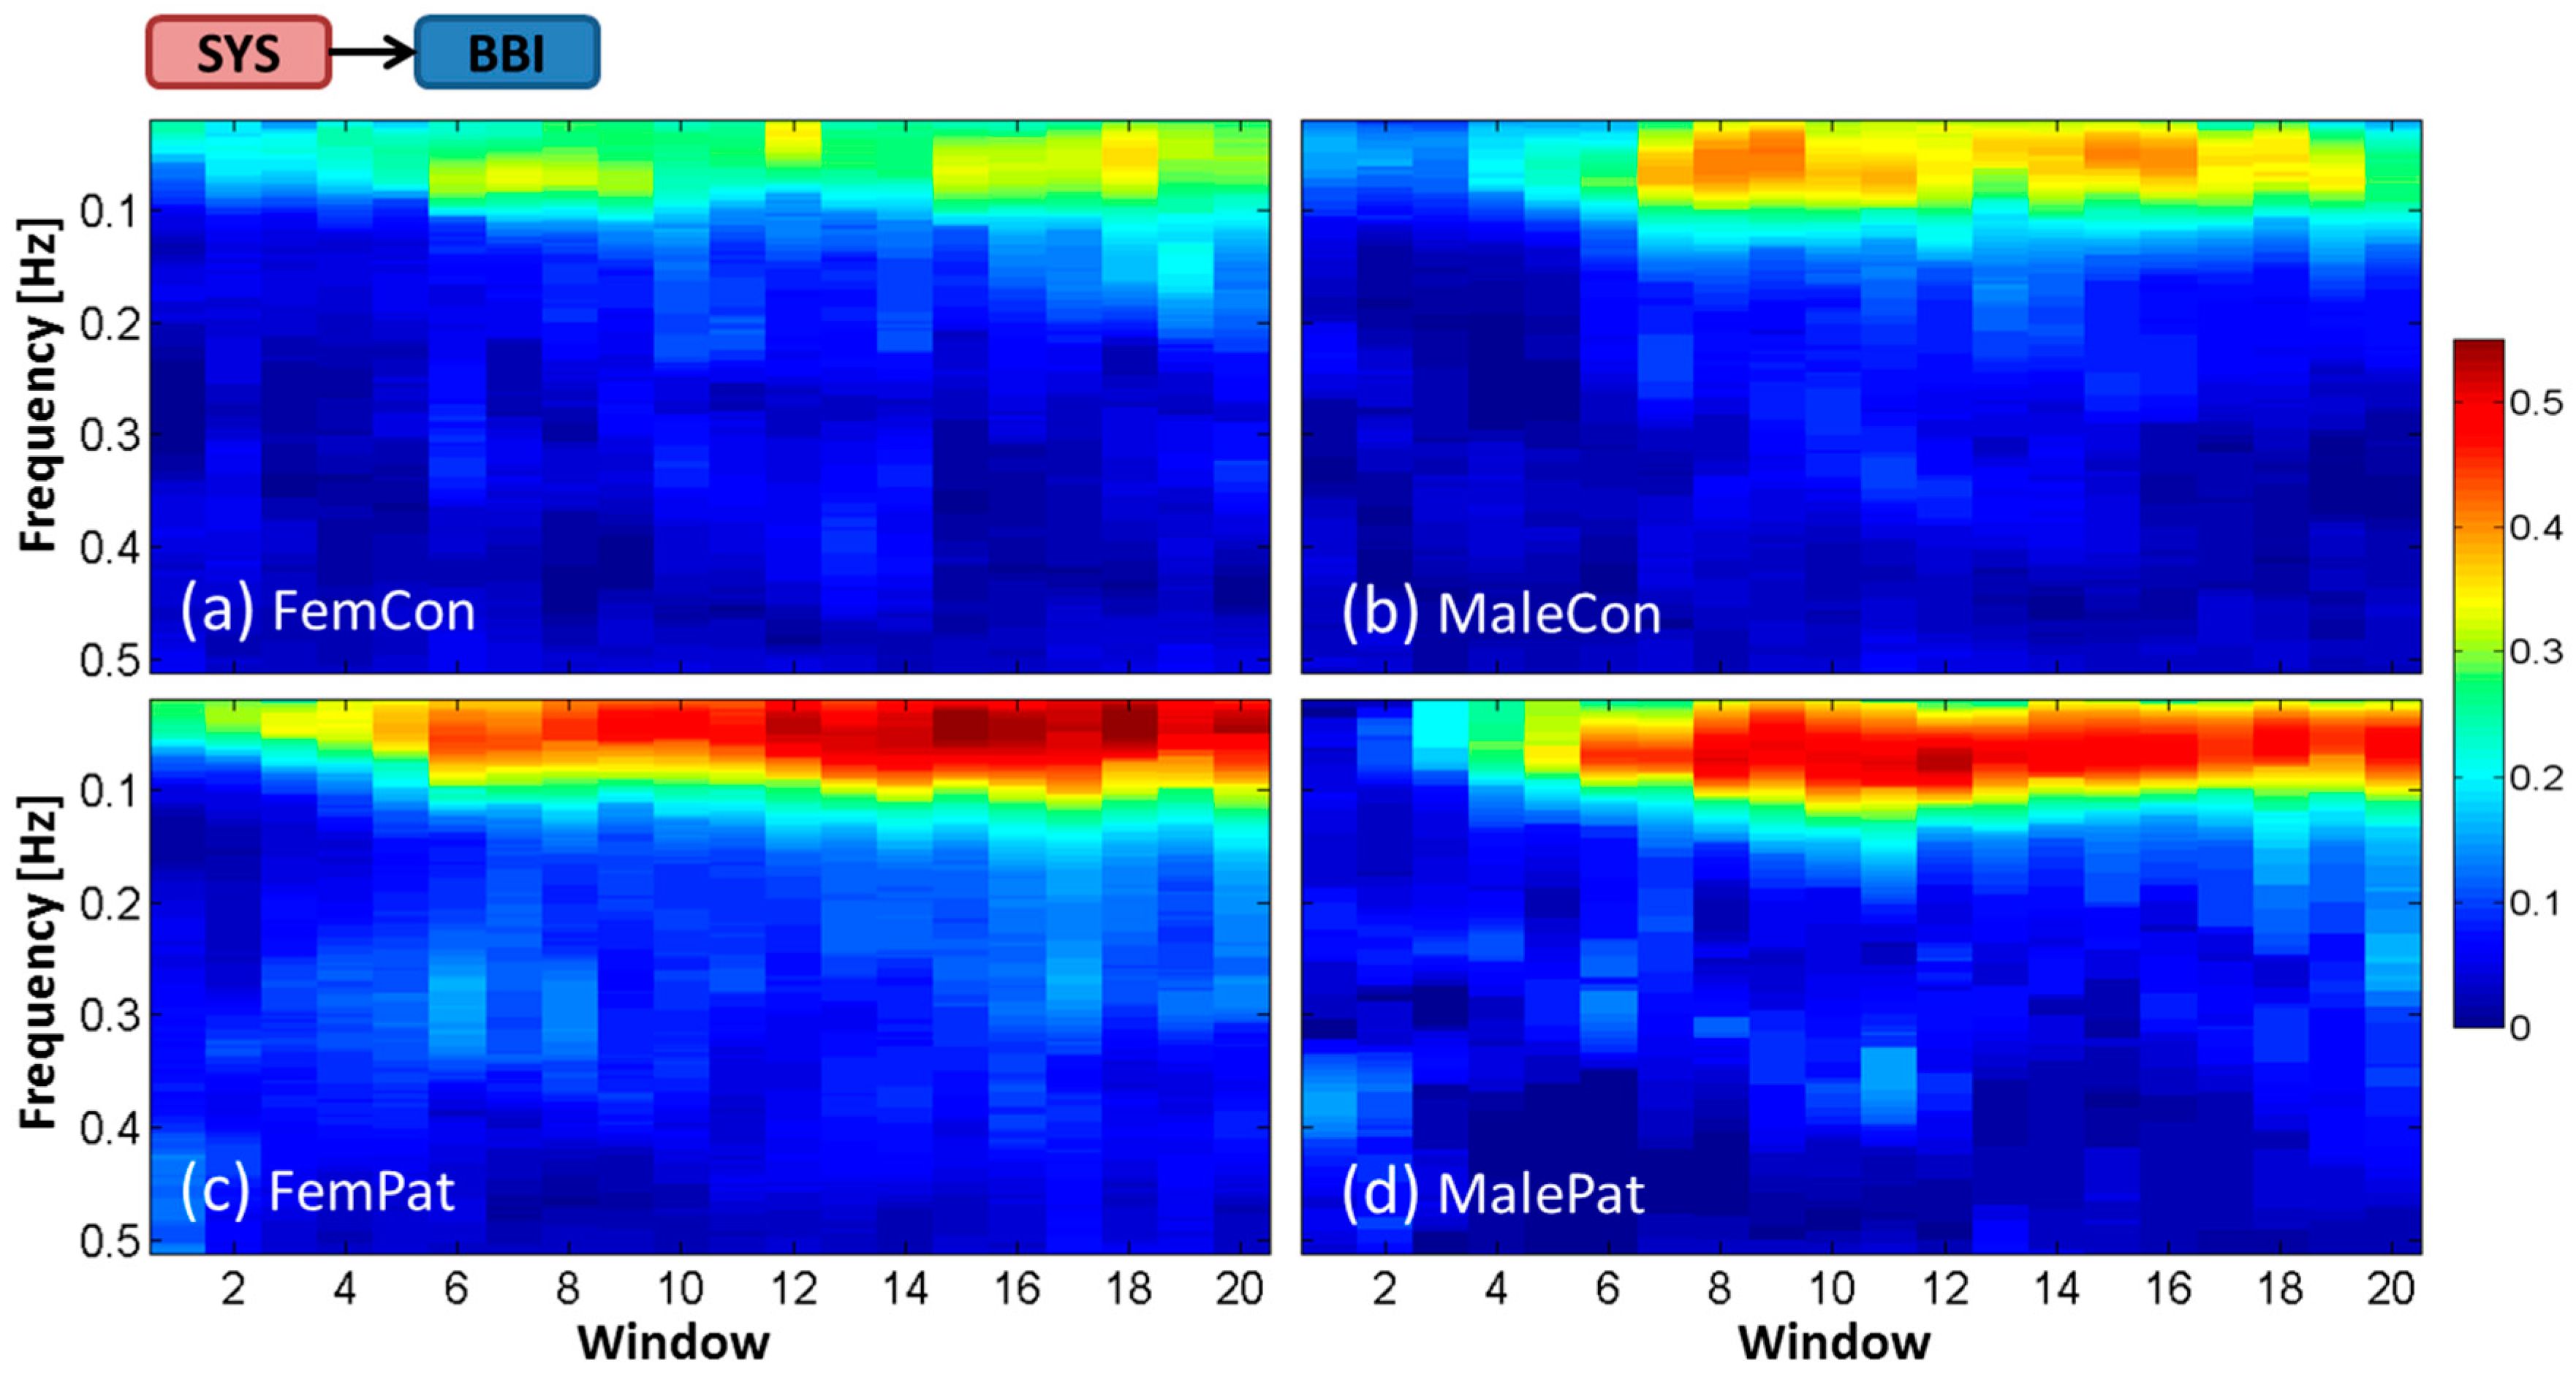
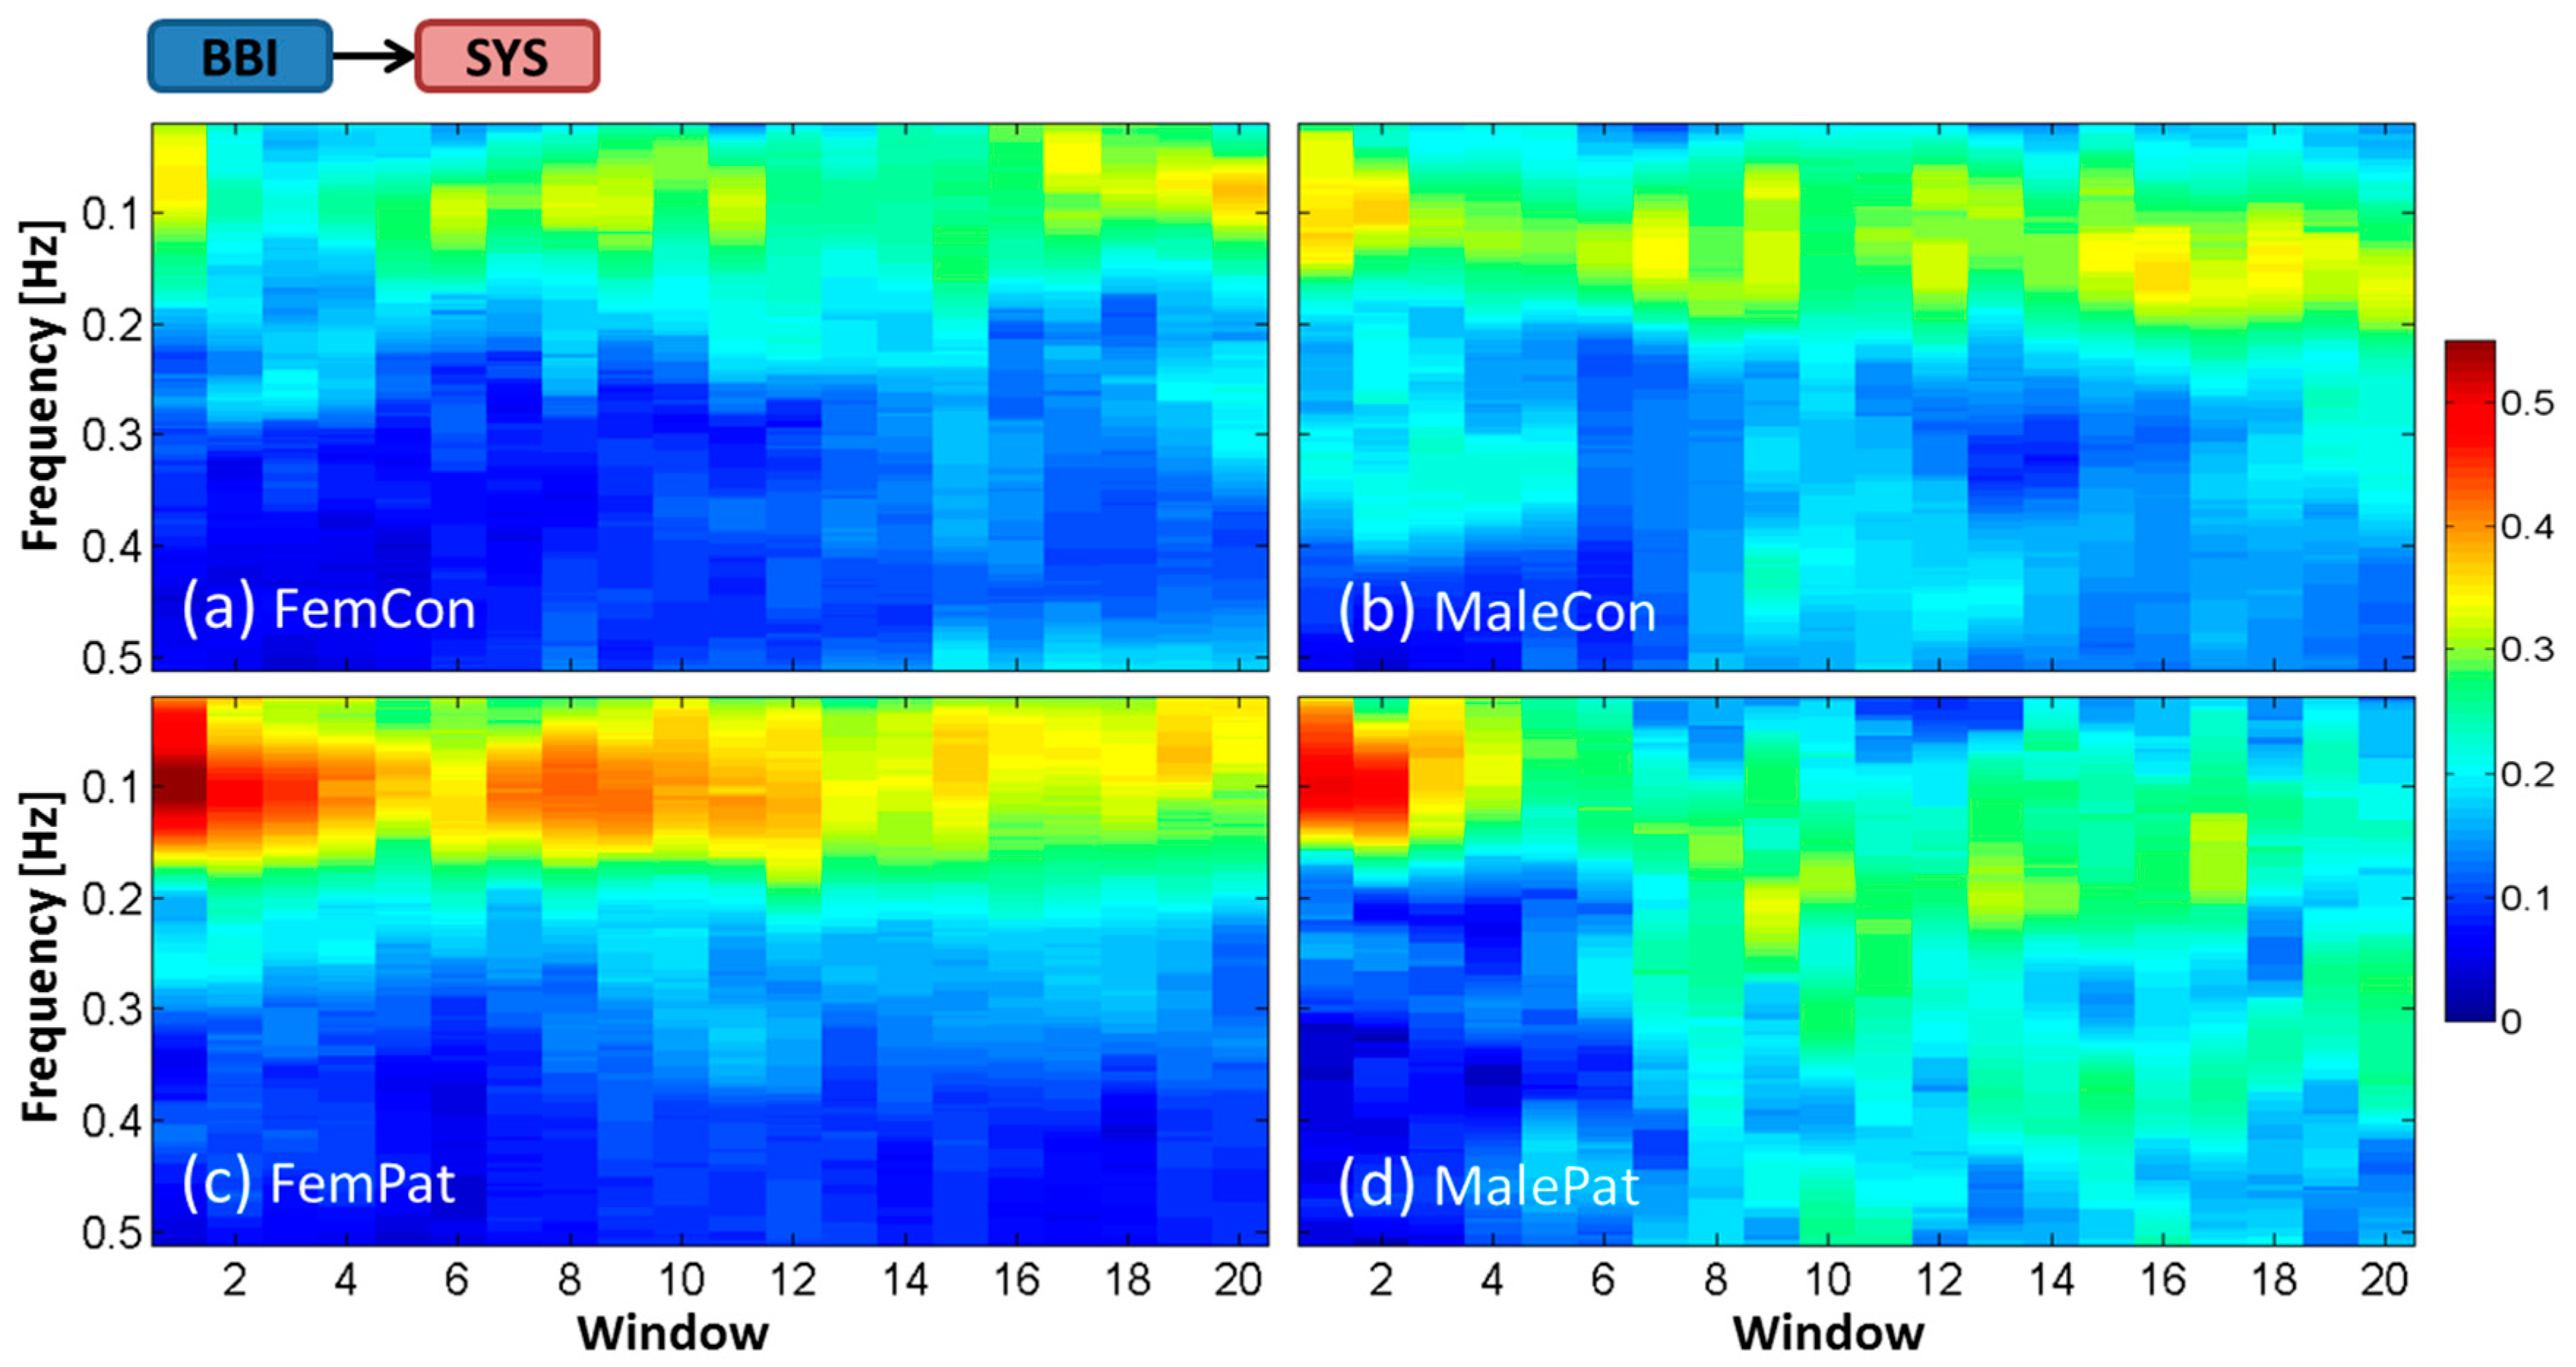
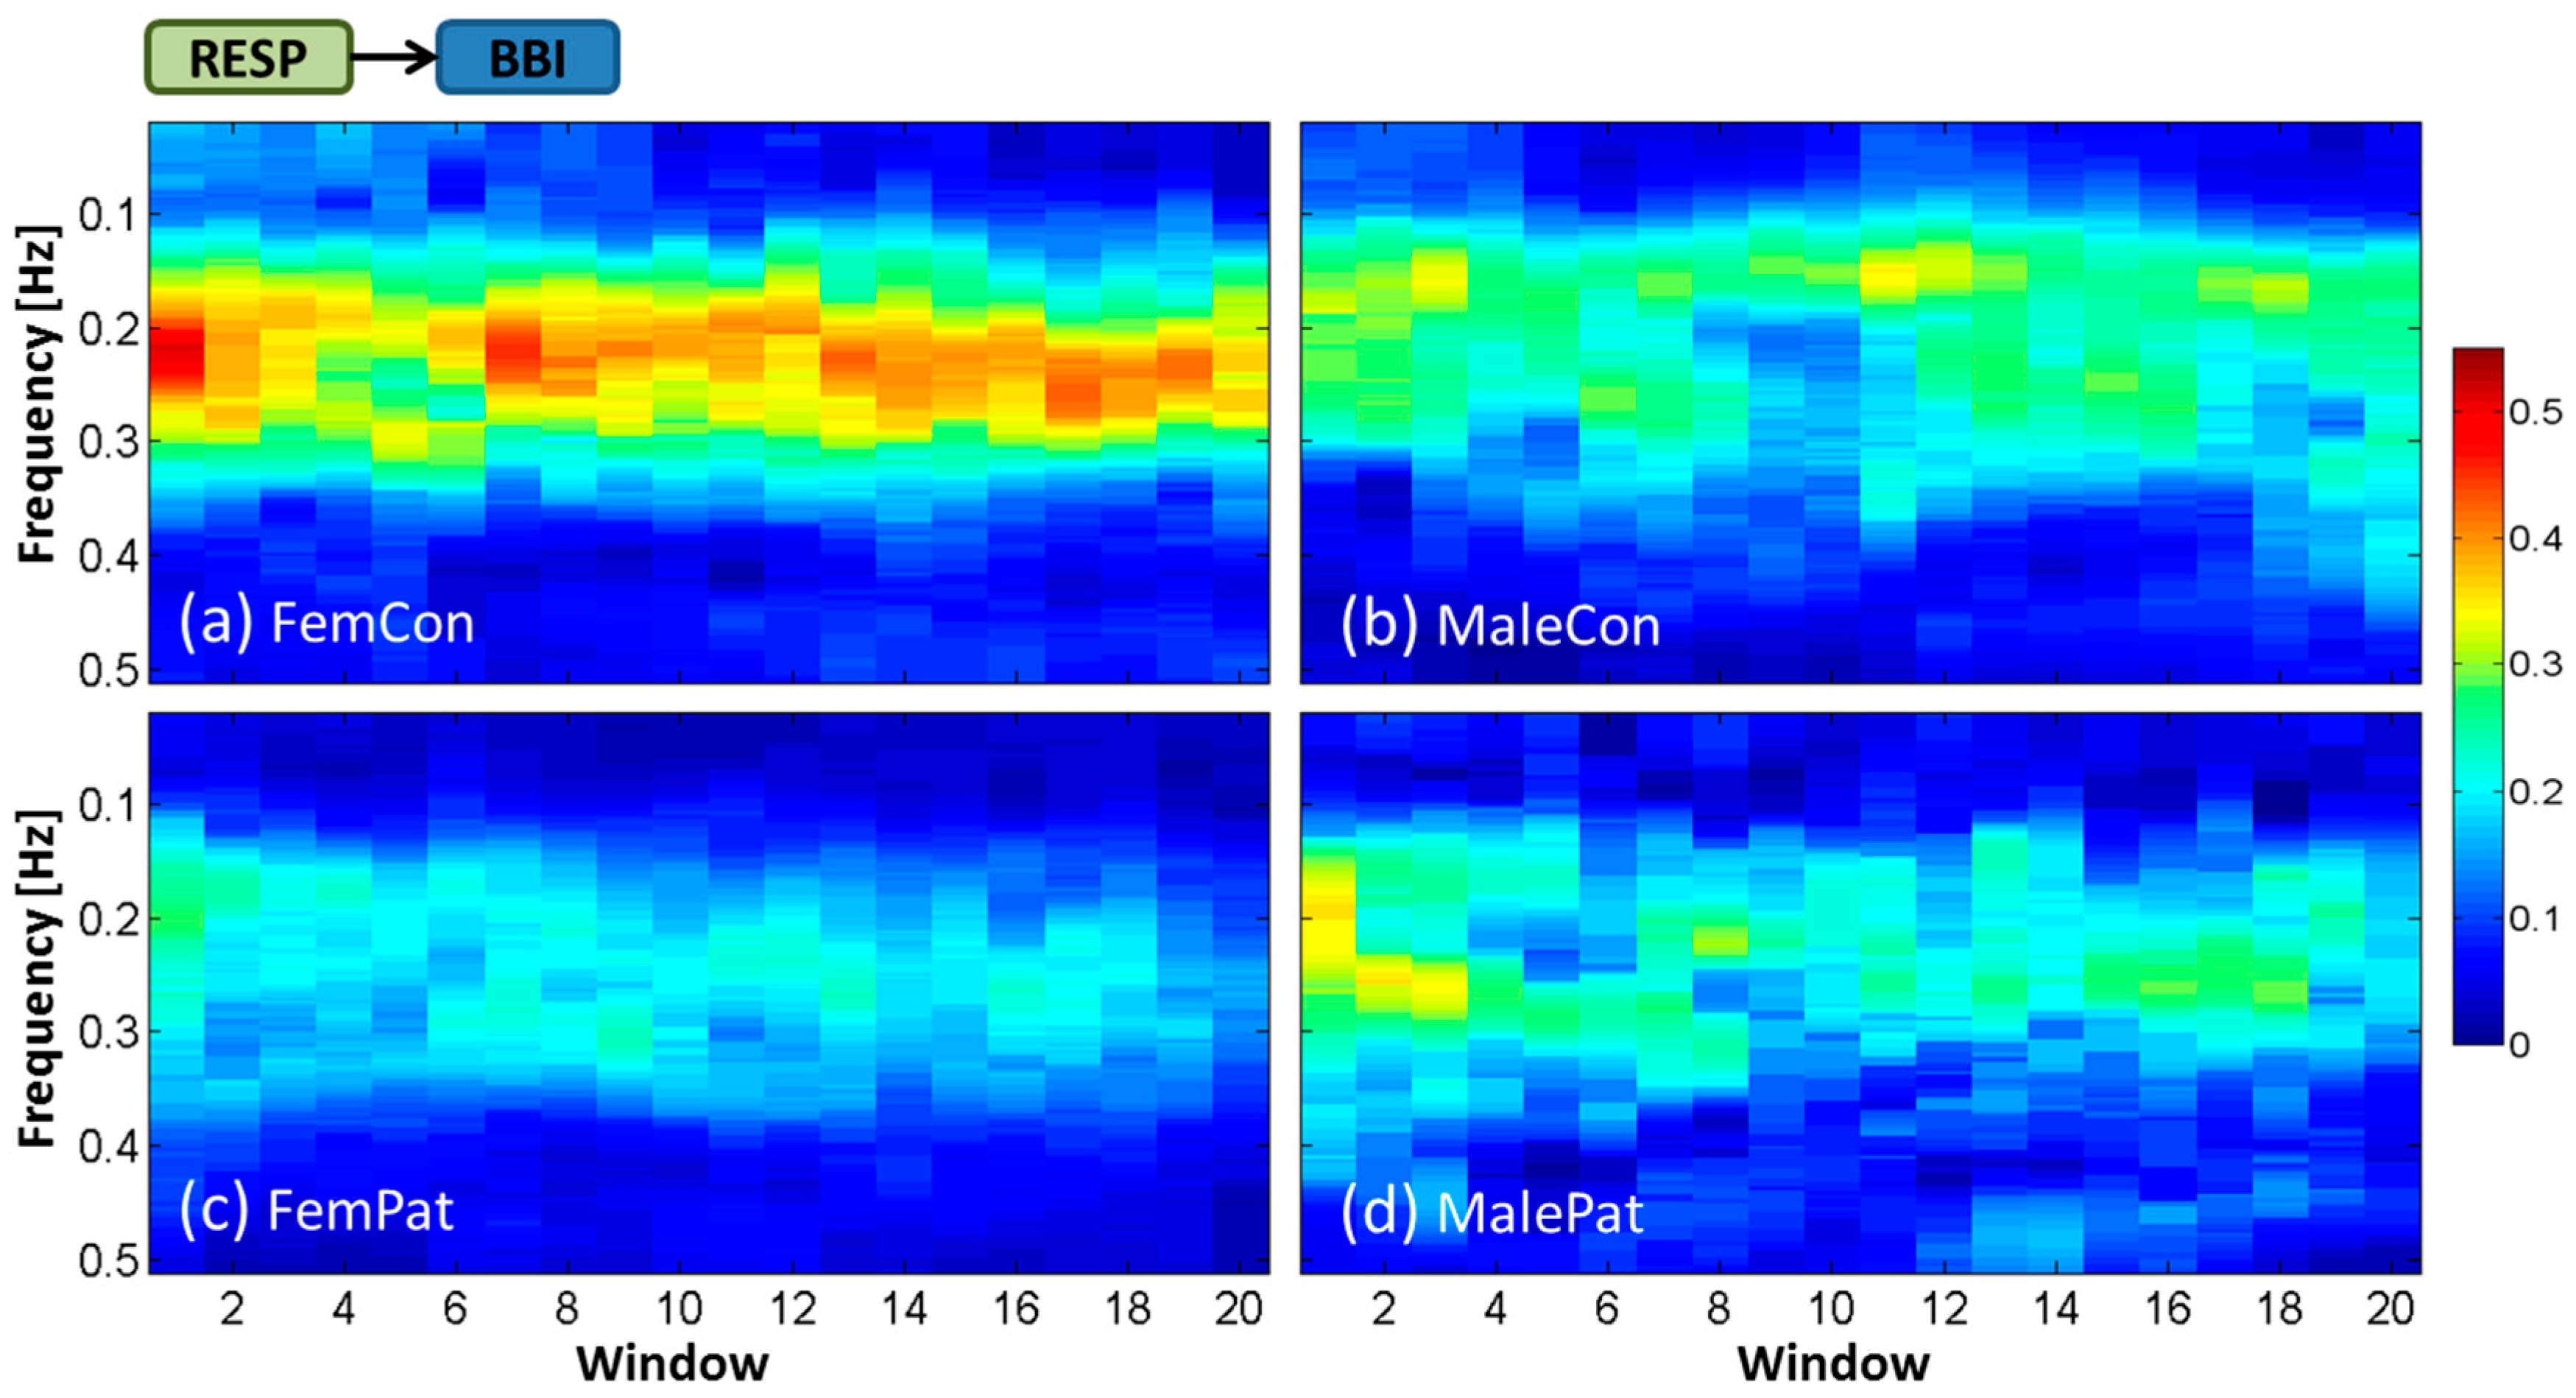
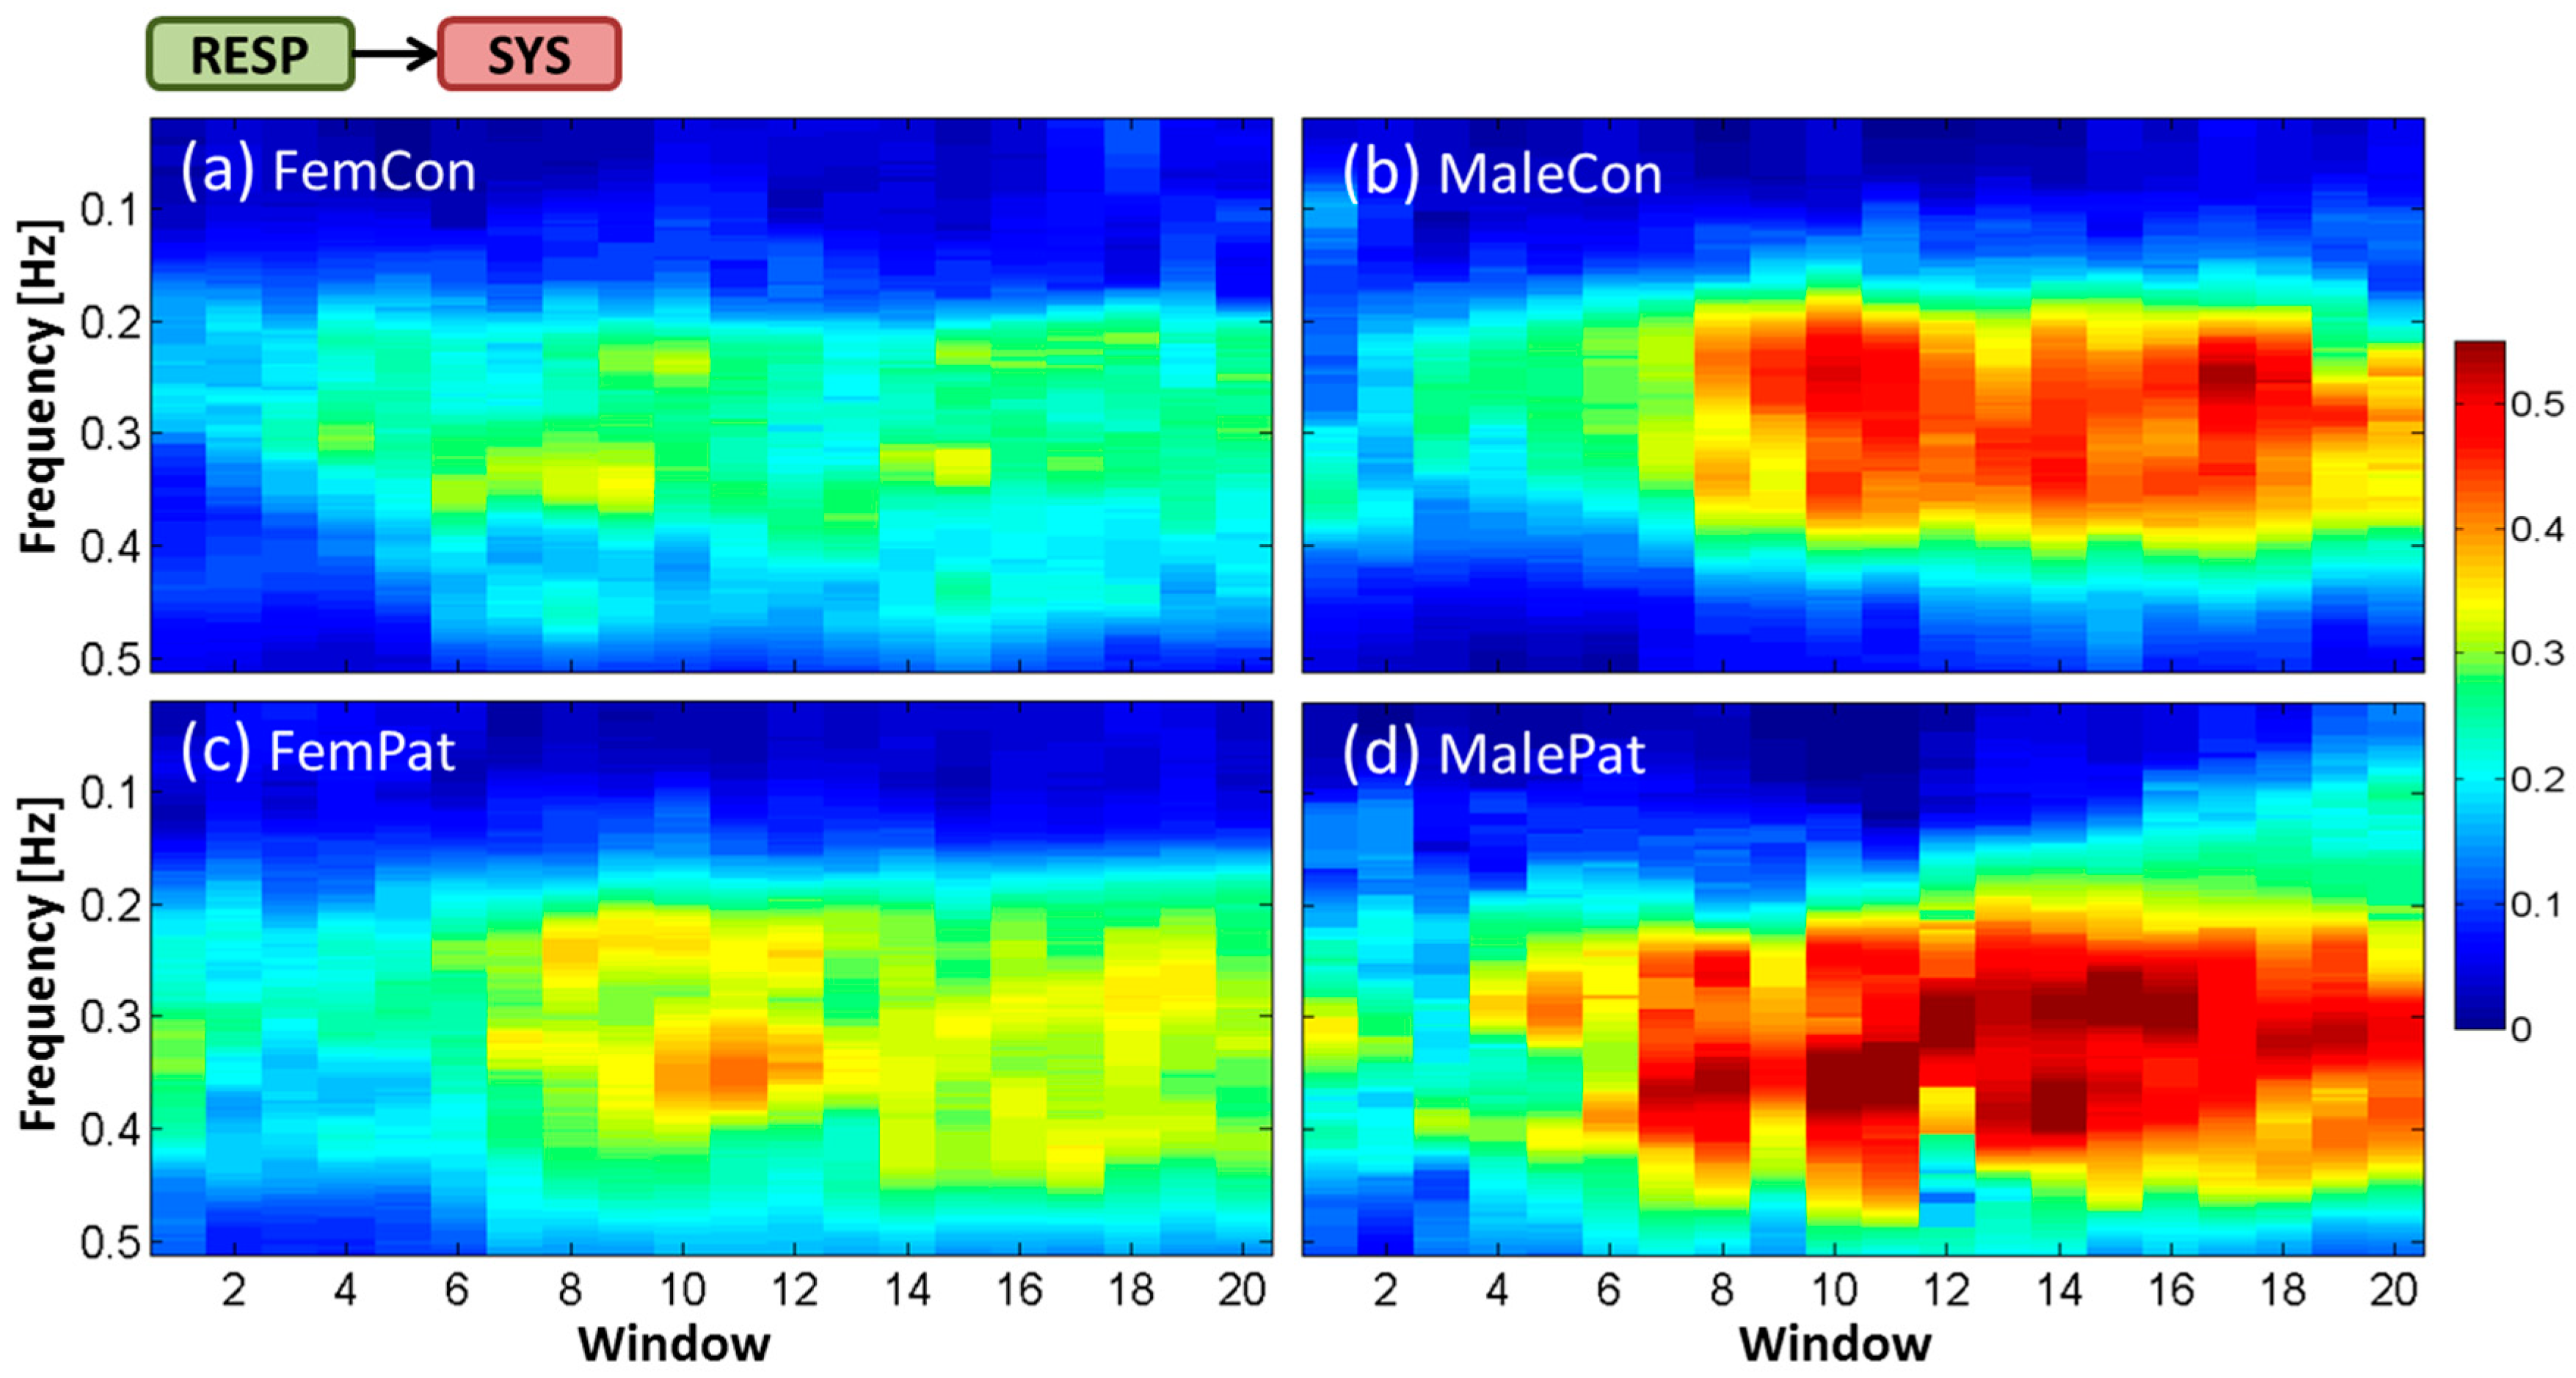
3.1. Averaged Time-Frequency Representation by ePDC (TF-ePDC) during the HUT Test
3.2. Dynamical Differences by TF-ePDC Parameters
4. Discussion
5. Conclusions
Author Contributions
Funding
Conflicts of Interest
References
- Faes, L.; Erla, S.; Nollo, G. Measuring Connectivity in Linear Multivariate Processes: Definitions, Interpretation, and Practical Analysis. Comput. Math. Method Med. 2012. [Google Scholar] [CrossRef]
- Baccala, L.A.; Sameshima, K. Partial directed coherence: A new concept in neural structure determination. Biol. Cybern. 2001, 84, 463–474. [Google Scholar] [CrossRef] [PubMed]
- Faes, L.; Nollo, G. Extended causal modeling to assess Partial Directed Coherence in multiple time series with significant instantaneous interactions. Biol. Cybern. 2010, 103, 387–400. [Google Scholar] [CrossRef] [PubMed]
- Porta, A.; Faes, L. Wiener–Granger Causality in Network Physiology With Applications to Cardiovascular Control and Neuroscience. Proc. IEEE 2016, 104, 282–309. [Google Scholar] [CrossRef]
- Hamzaoui, O.; Monnet, X.; Teboul, J.L. Pulsus paradoxus. Eur. Respir. J 2013, 42, 1696–1705. [Google Scholar] [CrossRef] [PubMed]
- Berntson, G.G.; Cacioppo, J.T.; Quigley, K.S. Respiratory sinus arrhythmia: Autonomic origins, physiological mechanisms, and psychophysiological implications. Psychophysiology 1993, 30, 183–196. [Google Scholar] [CrossRef]
- Albanese, A.; Cheng, L.; Ursino, M.; Chbat, N.W. An integrated mathematical model of the human cardiopulmonary system: model development. Am. J Physiol. Heart Circ. Physiol. 2016, 310, H899–H921. [Google Scholar] [CrossRef] [PubMed]
- Lenis, G.; Kircher, M.; Lázaro, J.; Bailón, R.; Gil, E.; Doessel, O. Separating the effect of respiration on the heart rate variability using Granger’s causality and linear filtering. Biomed. Signal Process. Control 2017, 31, 272–287. [Google Scholar] [CrossRef]
- Houtveen, J.H.; Rietveld, S.; De Geus, E.J.C. Contribution of tonic vagal modulation of heart rate, central respiratory drive, respiratory depth, and respiratory frequency to respiratory sinus arrhythmia during mental stress and physical exercise. Psychophysiology 2002, 39, 427–436. [Google Scholar] [CrossRef] [PubMed]
- Dick, T.E.; Hsieh, Y.H.; Dhingra, R.R.; Baekey, D.M.; Galan, R.F.; Wehrwein, E.; Morris, K.F. Cardiorespiratory Coupling: Common Rhythms in Cardiac, Sympathetic, and Respiratory Activities. Prog. Brain Res. 2014, 209, 191–205. [Google Scholar] [CrossRef] [Green Version]
- Javorka, M.; Krohova, J.; Czippelova, B.; Turianikova, Z.; Lazarova, Z.; Javorka, K.; Faes, L. Basic cardiovascular variability signals: Mutual directed interactions explored in the information domain. Physiol. Meas. 2017, 38, 877–894. [Google Scholar] [CrossRef]
- Nollo, G.; Faes, L.; Antolini, R.; Porta, A. Assessing causality in normal and impaired short-term cardiovascular regulation via nonlinear prediction methods. Philos. Trans. A Math. Phys. Eng. Sci. 2009, 367, 1423–1440. [Google Scholar] [CrossRef] [PubMed] [Green Version]
- Di Rienzo, M.; Parati, G.; Radaelli, A.; Castiglioni, P. Baroreflex contribution to blood pressure and heart rate oscillations: time scales, time-variant characteristics and nonlinearities. Philos. Trans. A Math. Phys. Eng. Sci. 2009, 367, 1301–1318. [Google Scholar] [CrossRef] [Green Version]
- Brown, C.M. Experimental Studies of the Baroreflex. In Mathematical Modeling and Validation in Physiology; Batzel, J.J., Bachar, M., Kappel, F., Eds.; Springer: Berlin/Heidelberg, Germany, 2013; pp. 163–176. [Google Scholar]
- Porta, A.; Bari, V.; Maria, B.; Takahashi, A.C.M.; Guzzetti, S.; Colombo, R.; Catai, F.; Raimondi, F. Effect of variations of the complexity of the target variable on the assessment of Wiener–Granger causality in cardiovascular control studies. Physiol. Meas. 2016, 37, 276. [Google Scholar] [CrossRef]
- Faes, L.; Javorka, M.; Nollo, G. Information-Theoretic Assessment of Cardiovascular Variability During Postural and Mental Stress. In Proceedings of the XIV Mediterranean Conference on Medical and Biological Engineering and Computing 2016: MEDICON 2016, Paphos, Cyprus, 31 March–2 April 2016; Kyriacou, E., Christofides, S., Pattichis, C.S., Eds.; Springer International Publishing: Cham, The Netherland, 2016; pp. 67–70. [Google Scholar]
- Muller, A.; Kraemer, J.F.; Penzel, T.; Bonnemeier, H.; Kurths, J.; Wessel, N. Causality in physiological signals. Physiol. Meas. 2016, 37, R46–R72. [Google Scholar] [CrossRef]
- Faes, L.; Nollo, G. Assessing frequency domain causality in cardiovascular time series with instantaneous interactions. Methods Inf. Med. 2010, 49, 453–457. [Google Scholar] [CrossRef] [PubMed]
- Faes, L.; Marinazzo, D.; Montalto, A.; Nollo, G. Lag-Specific Transfer Entropy as a Tool to Assess Cardiovascular and Cardiorespiratory Information Transfer. Trans. Biomed. Eng. 2014, 61, 2556–2568. [Google Scholar] [CrossRef]
- Faes, L.; Nollo, G.; Porta, A. Mechanisms of causal interaction between short-term RR interval and systolic arterial pressure oscillations during orthostatic challenge. J. Appl. Physiol. 2013, 114, 1657–1667. [Google Scholar] [CrossRef] [PubMed] [Green Version]
- Zhang, Q.G.; Patwardhan, A.R.; Knapp, C.F.; Evans, J.M. Cardiovascular and cardiorespiratory phase synchronization in normovolemic and hypovolemic humans. Eur. J. Appl. Physiol. 2015, 115, 417–427. [Google Scholar] [CrossRef] [PubMed]
- Faes, L.; Erla, S.; Porta, A.; Nollo, G. A framework for assessing frequency domain causality in physiological time series with instantaneous effects. Philos. Trans. Royal Soc. A 2013, 371. [Google Scholar] [CrossRef]
- Ocon, A.J.; Medow, M.S.; Taneja, I.; Stewart, J.M. Respiration drives phase synchronization between blood pressure and RR interval following loss of cardiovagal baroreflex during vasovagal syncope. Am. J. Physiol. Heart Circ. Physio. 2011, 300, H527–H540. [Google Scholar] [CrossRef] [PubMed]
- Takahashi, D.; Baccalá, L.; Sameshima, K. Information theoretic interpretation of frequency domain connectivity measures. Biol. Cybern. 2010, 103, 463–469. [Google Scholar] [CrossRef] [Green Version]
- Hlavackova-Schindler, K. Equivalence of Granger causality and transfer entropy: A generalization. Appl. Math. Sci. 2011, 73, 3637–3648. [Google Scholar]
- Faes, L.; Porta, A.; Nollo, G. Testing frequency-domain causality in multivariate time series. IEEE Trans. Biomed. Eng. 2010, 57, 1897–1906. [Google Scholar] [CrossRef] [PubMed]
- Reulecke, S.; Charleston-Villalobos, S.; Voss, A.; González-Camarena, R.; González-Hermosillo, J.; Gaitán-González, M.J.; Hernández-Pacheco, G.; Schroeder, R.; Aljama-Corrales, T. Men and women should be separately investigated in studies of orthostatic challenge due to different gender-related dynamics of autonomic response. Physiol. Meas. 2016, 37, 314. [Google Scholar] [CrossRef]
- Reulecke, S.; Charleston-Villalobos, S.; Voss, A.; González-Camarena, R.; González-Hermosillo, J.; Gaitán-González, M.J.; Hernández-Pacheco, G.; Schroeder, R.; Aljama-Corrales, T. Orthostatic stress causes immediately increased blood pressure variability in women with vasovagal syncope. Comput. Methods Programs Biomed. 2016, 127, 185–196. [Google Scholar] [CrossRef] [PubMed]
- Lee, H.; Low, P.A.; Kim, H.A. Patients with Orthostatic Intolerance: Relationship to Autonomic Function Tests results and Reproducibility of Symptoms on Tilt. Sci. Rep. 2017, 7, 5706. [Google Scholar] [CrossRef] [Green Version]
- Faes, L.; Porta, A.; Rossato, G.; Adami, A.; Tonon, D.; Corica, A.; Nollo, G. Investigating the mechanisms of cardiovascular and cerebrovascular regulation in orthostatic syncope through an information decomposition strategy. Auton. Neurosci. 2013, 178, 76–82. [Google Scholar] [CrossRef]
- Javorka, M.; Czippelova, B.; Turianikova, Z.; Lazarova, Z.; Tonhajzerova, I.; Faes, L. Causal analysis of short-term cardiovascular variability: State-dependent contribution of feedback and feedforward mechanisms. Med. Biol. Eng. Comput. 2017, 55, 179–190. [Google Scholar] [CrossRef]
- Elstad, M.; Walløe, L.; Holme, N.L.A.; Maes, E.; Thoresen, M. Respiratory sinus arrhythmia stabilizes mean arterial blood pressure at high-frequency interval in healthy humans. Eur. J. Appl. Physiol. 2015, 115, 521–530. [Google Scholar] [CrossRef]
- Faes, L.; Nollo, G.; Porta, A. Information domain approach to the investigation of cardio-vascular, cardio-pulmonary, and vasculo-pulmonary causal couplings. Front. Physiol. 2011, 2. [Google Scholar] [CrossRef] [PubMed]


| Group | Name | Number of Subjects | Age (years) | Assigned Color |
|---|---|---|---|---|
| Female Controls | FemCon | 13 | 26 ± 5 | Red |
| Male Controls | MaleCon | 13 | 28 ± 3 | Blue |
| Female Patients | FemPat | 21 | 28 ± 7 | Orange |
| Male Patients | MalePat | 6 | 26 ± 6 | Light blue |
| Parameter | Low Frequency Band SYS→BBI, BBI→SYS | High Frequency Band RESP→BBI, RESP→SYS |
|---|---|---|
| Percentile frequencies 25%, …, 95% | ePDC_LF-pf25, …, ePDC_LF-pf95 | ePDC_HF-pf25, …, ePDC_HF-pf95 |
| Absolute power | ePDC_LF | ePDC_HF |
| Maximum peak value | ePDC_LF-max | ePDC_HF-max |
| Frequency of MPV | ePDC_LF-fmax | ePDC_HF-fmax |
| Mean value | ePDC_LF-mv | ePDC_HF-mv |
© 2019 by the authors. Licensee MDPI, Basel, Switzerland. This article is an open access article distributed under the terms and conditions of the Creative Commons Attribution (CC BY) license (http://creativecommons.org/licenses/by/4.0/).
Share and Cite
Charleston-Villalobos, S.; Reulecke, S.; Voss, A.; Azimi-Sadjadi, M.R.; González-Camarena, R.; Gaitán-González, M.J.; González-Hermosillo, J.A.; Hernández-Pacheco, G.; Schulz, S.; Aljama-Corrales, T. Time-Frequency Analysis of Cardiovascular and Cardiorespiratory Interactions During Orthostatic Stress by Extended Partial Directed Coherence. Entropy 2019, 21, 468. https://doi.org/10.3390/e21050468
Charleston-Villalobos S, Reulecke S, Voss A, Azimi-Sadjadi MR, González-Camarena R, Gaitán-González MJ, González-Hermosillo JA, Hernández-Pacheco G, Schulz S, Aljama-Corrales T. Time-Frequency Analysis of Cardiovascular and Cardiorespiratory Interactions During Orthostatic Stress by Extended Partial Directed Coherence. Entropy. 2019; 21(5):468. https://doi.org/10.3390/e21050468
Chicago/Turabian StyleCharleston-Villalobos, Sonia, Sina Reulecke, Andreas Voss, Mahmood R. Azimi-Sadjadi, Ramón González-Camarena, Mercedes J. Gaitán-González, Jesús A. González-Hermosillo, Guadalupe Hernández-Pacheco, Steffen Schulz, and Tomás Aljama-Corrales. 2019. "Time-Frequency Analysis of Cardiovascular and Cardiorespiratory Interactions During Orthostatic Stress by Extended Partial Directed Coherence" Entropy 21, no. 5: 468. https://doi.org/10.3390/e21050468