Article

Integrated Production and Transportation Scheduling in E-Commerce Supply Chain with Carbon Emission Constraints

1
Research Centre for International Business and Economics, School of International Business and Management, Sichuan International Studies University, Chongqing 400031, China
2
International College, Krirk University, Bangkok 10220, Thailand
3
National Research Base of Intelligent Manufacturing Service, Chongqing Technology and Business University, Chongqing 400067, China
*
Authors to whom correspondence should be addressed.
J. Theor. Appl. Electron. Commer. Res. 2021, 16(7), 2554-2570; https://doi.org/10.3390/jtaer16070140
Submission received: 21 August 2021 / Revised: 20 September 2021 / Accepted: 22 September 2021 / Published: 26 September 2021

Abstract

:
Carbon emission constraints and trading policies in e-commerce environments have brought huge challenges to the operation of supply chain enterprises. In order to ensure the good operation of the e-commerce supply chain in a low-carbon environment, a supply chain scheduling optimization method based on integration of production and transportation with carbon emission constraints is proposed; we use it to analyze the impact of centralized decision-making mode and decentralized decision-making mode on supply chain scheduling and establish a scheduling optimization model that aims at optimal carbon emissions and costs. A multilevel genetic algorithm was designed according to the characteristics of the model, and numerical examples are used to verify the effectiveness of the model and algorithm. The results show that the centralized decision-making mode plays the role of the carbon emission constraints to the greatest extent; the carbon emissions and the cost are smallest in the centralized decision-making mode. The decentralized decision-making mode leads to the overall cost preference of the supply chain due to separate decisions made by enterprises, and the carbon emissions in the supply chain are greater. Transportation experts, business managers and government departments are interesting for integrated production and transportation scheduling in e-commerce supply chain with carbon emission constraints. Further research should address integrated production and transportation scheduling in dual-channel low supply chains.

1. Introduction

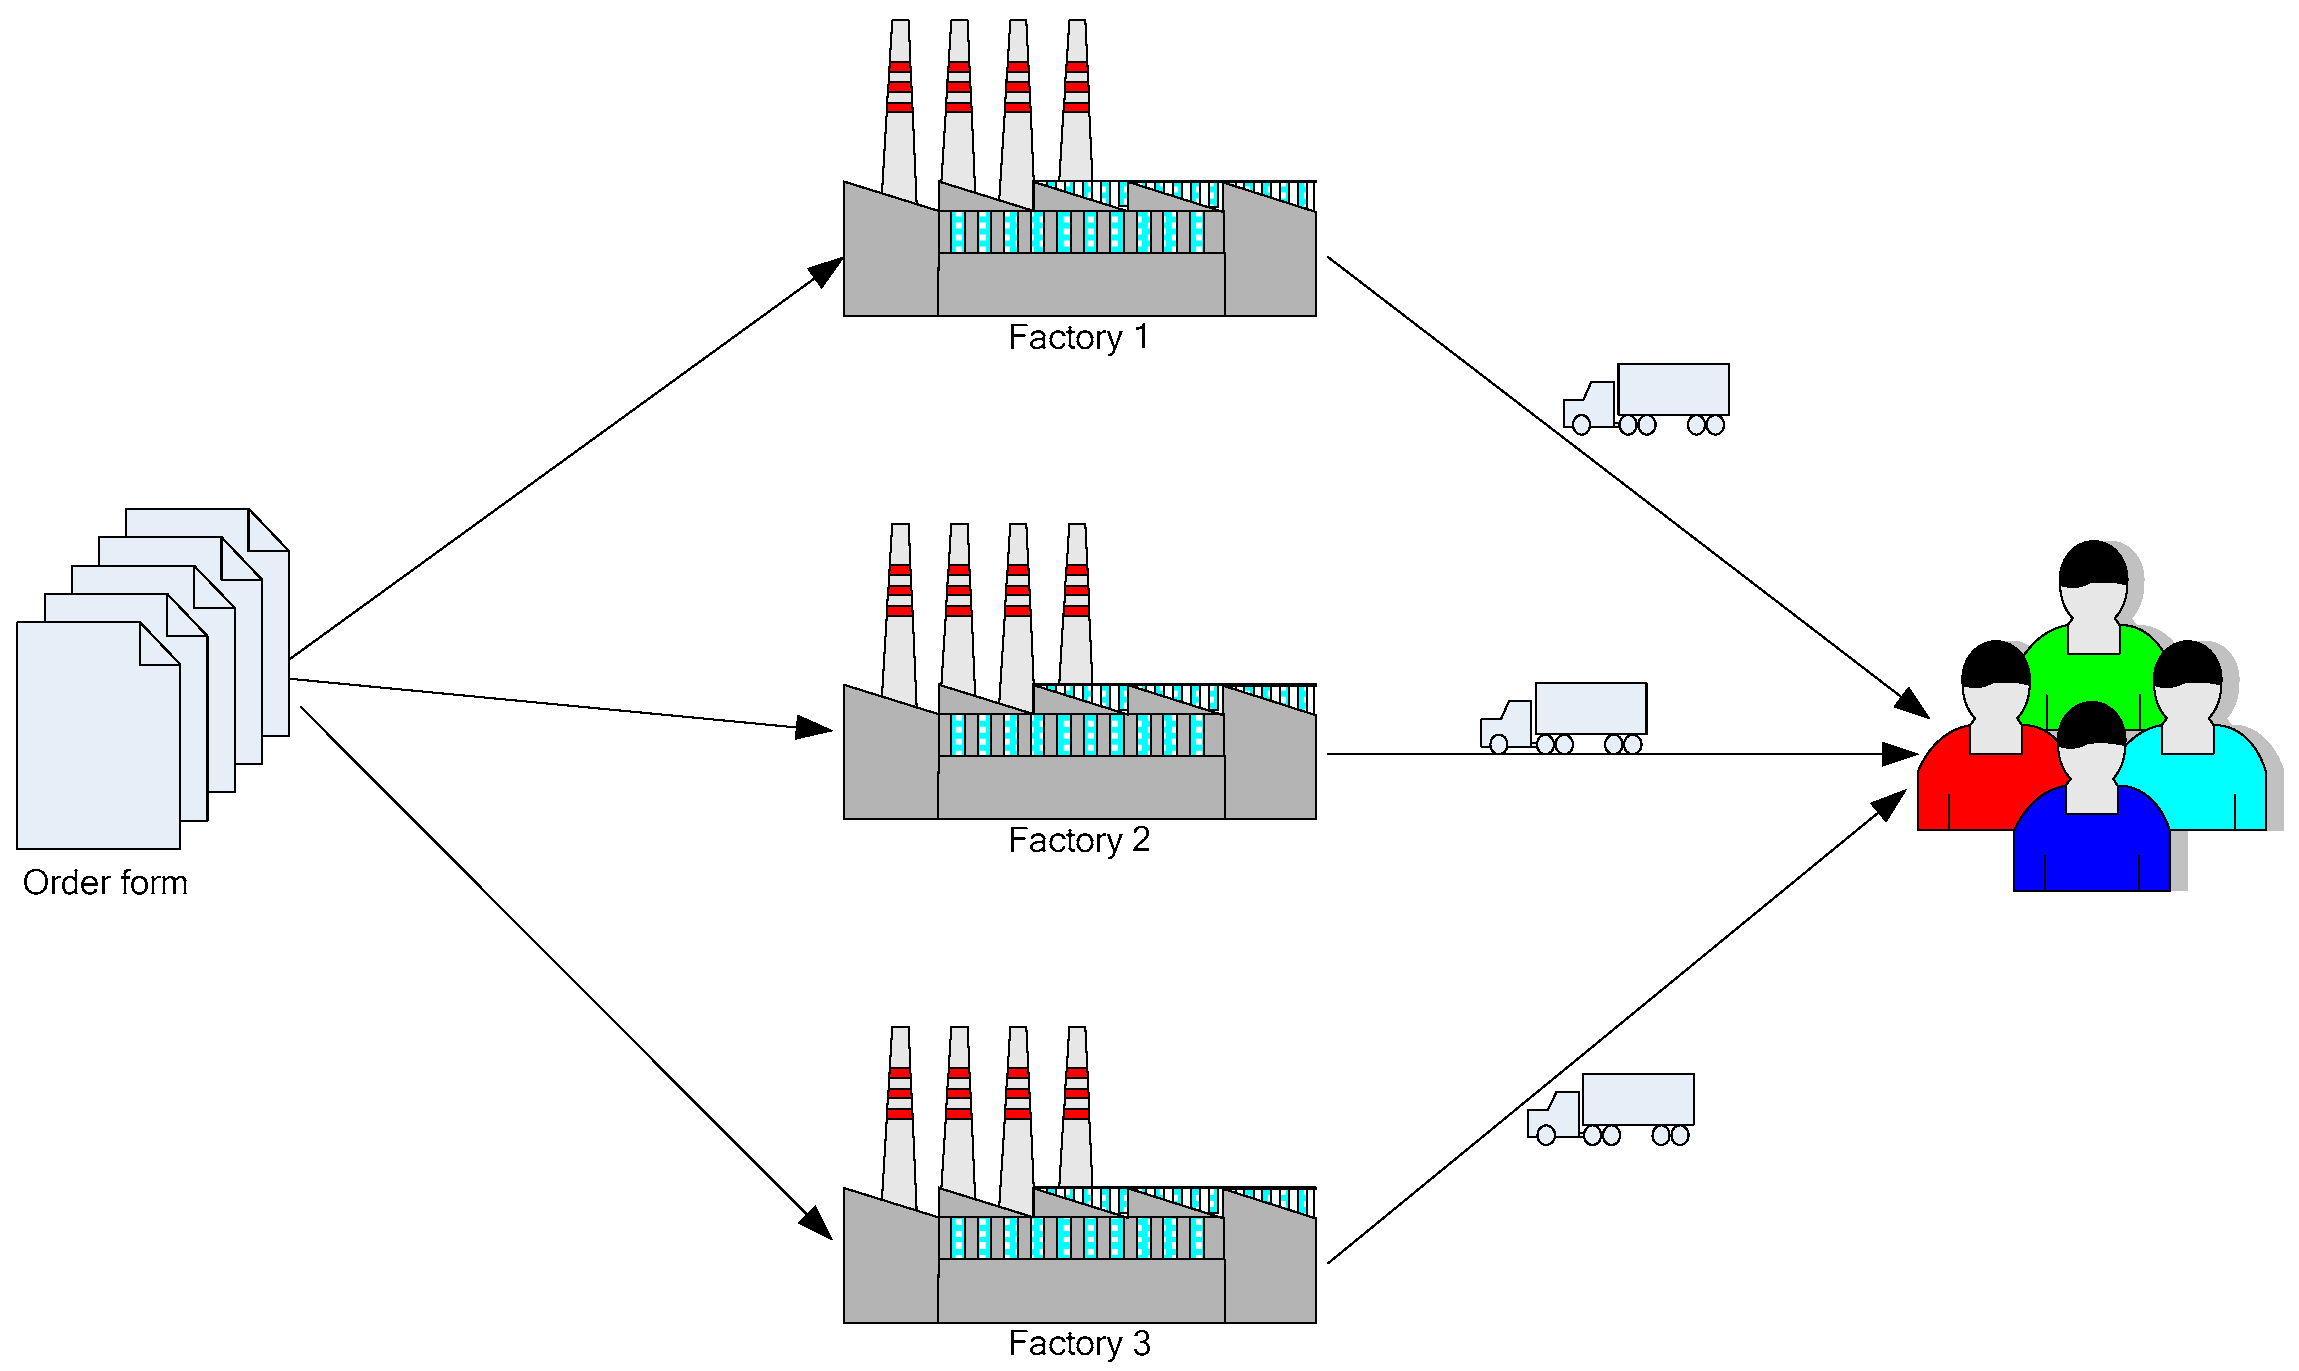
In the e-commerce environment, in order to maximize customer demand and effectively reduce costs, the integration of production and transportation is widely adopted in supply chain enterprises. Chinese companies are gradually optimizing the structure of the supply chain, and transition to supply chain model under the e-commerce environment. Enterprises need to execute terminal delivery or need a third-party logistics company to complete terminal delivery, and the supply chain structure has changed from a traditional mode to an integrated production–transportation mode. Therefore, more materials and energy may be consumed, which ultimately affects costs and carbon emissions. Hensse [1] found that compared with the traditional supply chain, the supply chain in the e-commerce environment has relatively fewer links, but the entire supply chain will produce longer transportation distances, more frequent transportation times, which has an impact on the cost, efficiency and carbon emissions of the supply chain. However, when moving towards the goal of carbon emission peak and carbon neutrality, more and more companies must face the practical constraints of energy saving and carbon reduction. Adapting to the development of e-commerce, production and transportation in supply chain scheduling should keep pace with the goal of carbon emission peak and carbon neutrality. Generally, corporate decision-making in traditional supply chains is performed to maximize the corporations’ own interests. Corporate decision-making affects not only their own interests, but also the interests of competitors and other companies in the supply chain. Traditional scheduling methods can no longer meet the actual needs of the supply chain, so integrated supply chain scheduling has become the focus of scholars. However, the low operating efficiency of the supply chain has caused it to generate a large number of additional carbon emissions. The carbon emissions that accompany the products exist in the supply chain’s procurement, production, transportation, storage and distribution.
Developed countries have put the low-carbon economy in an important position for national development, promulgated relevant legal provisions and formulated relating measures. In order to control carbon emissions and undertake the obligation to reduce greenhouse gas emissions, developing a low-carbon economy has become a major strategy for China’s economy. As an important carrier of the economy, the reduction of carbon emissions of enterprises is the key to achieving low-carbon goals. Therefore, to analyze the production–distribution integration scheduling problem of the supply chain under the constraints of carbon emission, to improve the carbon emissions of enterprises in the supply chain according to its dynamics and uncertainties, and to build an environmentally friendly supply chain production–distribution integration scheduling mode are the goals of this paper.
The existing research literature on the optimization of supply chain operation from a low-carbon perspective is mainly reflected in two aspects. First, control carbon emissions from production and transportation, such as updating equipment to improve energy efficiency, and adopting new energy or green product design concepts to reduce carbon emissions. Second, improve the decision-making of the company from an optimization perspective, such as the rational design of storage locations, transportation routes and integrated management of carbon emissions in the supply chain. In order to reduce carbon emissions, the proper design of carbon emission trading mechanisms has become the focus of scholars at home and abroad. The purpose is to create a benign carbon trading market mechanism and ultimately achieve the goal of reducing carbon emissions. As the carbon emission trading mechanism and carbon finance business have just started, the carbon emission trading venues that have been built have not carried out carbon transfer business. Therefore, before the state-led mandatory carbon emission policy was formed, the functions of carbon trading venues did not perform well, and the carbon allocation mechanism in the supply chain could not be effectively adjusted. To achieve the goal of reducing carbon emissions, it is necessary to establish a carbon emission allocation mechanism in the supply chain and study the production–distribution integrated scheduling problem of the supply chain from an overall perspective.
Section 1 describes the research problems, variables and assumptions involved in this paper. Section 2 establishes scheduling optimization models for different decision modes. Section 3 designs a multilevel genetic algorithm to solve the problem model. Section 4 verifies the effectiveness of the model and algorithm through examples. In Section 5, the relevant conclusions of this paper are proposed.

2. Literature Review

From the perspective of production–distribution integrated scheduling in the supply chain, some scholars have analyzed the problem of carbon emission optimization in the supply chain under the e-commerce environment. Shen et al. [2] compared and analyzed the difference between the traditional mode and the e-commerce mode in the logistics and transportation of the supply chain operation. Mallidis et al. [3] analyzed the impact of the low-carbon e-commerce model on the supply chain. Agnetis and Pacciarelli [4] built a mathematical model for how to coordinate decisions made by decision-makers at different stages. It is assumed that the supplier and each manufacturer have an ideal scheduling solution, which is determined by their own cost and constraints. By comparing the results of a single decision made by the supplier and the manufacturer with the results of a common decision, it is found that the results of the two centralized decisions can reduce the total cost and achieve a win-win situation. Hall [5] studied the supply chain scheduling problem in a parallel machine production environment and solved it by using dynamic programming methods. Experiments proved that combining production scheduling and batch distribution decision-making can improve customer service. Pundoor [6] studied the make-to-order production distribution system, which includes a supplier and one or more customers. Considering the case where the order has a delivery deadline and allows batch shipment in a single machine production environment, a polynomial algorithm is used to solve the supply chain with a single customer, but when the number of customers exceeds a certain number, the complexity of the problem will vary with the increase of the number of customers. At this time, if you want to solve the problem, you need the help of a heuristic algorithm. Armentano et al. [7] studied the integrated scheduling problem of multi-cycle production and distribution, with the goal of minimizing production and inventory costs in factories, and applying prohibited search algorithms to solve them.
The research on integrated scheduling of supply chain from the perspective of low carbon mainly focuses on the impact of carbon emission trading mechanism on the supply chain and the scheduling mechanism of supply chain from the perspective of low carbon. In the low-carbon context, companies in the supply chain have considered the optimization of operating strategies under carbon emission policies in order to compete for development opportunities in the competition. Carbon emissions in the supply chain run through the entire life cycle of the product. Therefore, scientific measurement of carbon emissions is the basis for improving the operation of the supply chain. Chen [8] studied the scientific measurement of “carbon emissions” and the optimization of low-carbon supply chains. Nathan et al. et al. [9] studied the carbon footprint of the production and sales supply chain in the Midwestern United States. Andrew [10] analyzed the carbon emission structure of the European Union’s international supply chain. Erik and Anna [11] analyzed the carbon footprint management of transnational supply chains and studied the value chain optimization of transnational supply chains to reduce carbon emissions. Scientific measurement of carbon emissions is the basis for building a low-carbon supply chain. However, Accenture research reports show that only 10% of companies try to manage the carbon footprint in the supply chain. Therefore, it is necessary to start from the characteristics of the supply chain and put the enterprises at the supply chain as a research object to design simple and easy-to-use carbon footprint measurement methods.
The carbon emissions trading mechanisms have been conducted by domestic and foreign scholars. Gao et al. [12] analyzed the current status of the carbon trading market under free allocation and auction mechanisms. Meng et al. [13] found that auction-style allocation of carbon emission rights is better than free allocation mechanisms. Sathaye et al. [14] compared and analyzed the threshold method, long-term performance of free trade and initial free mechanisms. Yao et al. [15] analyzed the dual-channel transaction methods under both physical and online transactions, and built a two-channel two-stage supply chain network optimization model under carbon emission constraints. China’s carbon trading mechanism is not complete and can be allocated free of charge in the short term. However, in order to create a good low-carbon economic order, a paid trading mechanism should be adopted as soon as possible from the perspective of long-term development. In the paid trading mechanism, carbon emission quotas, a special commodity, can bring benefits to enterprises just like other resources. Different carbon emission trading mechanisms will inevitably affect the decision-making behavior of enterprises in the supply chain, so it is difficult to establish traditional mathematical models for their decision-making problems. Therefore, taking the production and distribution links of the supply chain as the research object, we see that analyzing the impact of carbon emission quotas on the scheduling scheme is conducive to the formation of a low-carbon and efficient scheduling system. Shi and Zhao [16] studied the cooperation alliance of resource emission reduction for high energy consumption and high emission enterprise. Xu [17] designed the carbon emission reduction responsibility division and cost allocation mechanism to build a framework of low carbon supply chain. Tsan [18] analyzed the impact of carbon tax on the supply chain and considered that the proper setting of carbon tax is closely related to the manufacturing and transportation costs of products and affects the profit margin of manufacturers. Bo et al. [19] used input–output models to study the impact of supply chain carbon emissions on the region, and they believed that carbon emissions depended on factors such as regional production technology, energy efficiency and participation in global supply chains. Behnam et al. [20] studied the closed-loop supply chain problem under carbon trading, converted carbon emissions into costs and analyzed its impact on the closed-loop supply chain. Chia et al. [21] used decision-making and evaluation experiments to study carbon emissions and management issues in the green supply chain, striving to improve the management of carbon emissions by companies in the supply chain. The research on the supply chain in a low-carbon environment mostly focuses on reducing the carbon emissions of the distribution link under the consideration of cost constraints [22]. For example, the supply chain optimization scheduling problem, using multimodal transportation, can effectively lower the freight cost of and reduce the total carbon emissions [23]. Integrated production and transportation low-carbon supply chain scheduling problem under the constraint of total logistics cost was proposed [24]. The EU and other countries are, through legislation and design mechanisms, limiting carbon emissions. Many links in the supply chain, such as distribution and production, generate a large amount of carbon emissions. The improvement path is to actively develop new energy and use low-energy equipment on the one hand, and to optimize production and logistics decisions on the other hand. Integrated dispatching is an effective and low-cost way to reduce carbon emissions in the supply chain [25,26]. Under the constraints of carbon emission, changes in the supply chain’s distribution batch and mode, production start-up time and production efficiency will also cause changes in its construction period and costs. Analyzing the impact of carbon emissions, schedules and costs on integrated supply chain scheduling; integrating all activities in the production–distribution chain of the supply chain; studying the impact of cost, schedule and carbon emissions issues on supply chain operations and systematical optimization are the research content of this paper.
The integrated production and transportation scheduling problem in the supply chain with carbon emission constraints is based on the traditional production and transportation scheduling problem, which consider carbon emissions constraint, so it is a typical NP hard problem [27]. There are precise algorithms and heuristic algorithms for solving this problem. Kim et al. [28] analyzed the influence of carbon emission constraint on chain supply on the choice of transportation modes; the VRP model was established with the minimum carbon emission as the objective function, and a path construction algorithm was designed to solve the problem. Shu et al. [29] aimed at a special type of integrated production and distribution scheduling problem, requiring batch production and batch distribution of orders and vehicles with limited capacity. Aiming at this kind of restrictive problem, heuristic algorithm was used to reduce the difficulty of solving the problem. The results of numerical experiments prove the feasibility and accuracy of the algorithm. Peng and Wen [30] selected a supply chain with multiple manufacturers and multiple customers as the research object, integrated the production scheduling problem and the transportation scheduling problem, and established a model solution. The objective was to minimize the sum of production and distribution costs, and a dynamic programming algorithm was designed to solve and analyze the complexity of the algorithm. Battarra al et. [31] established a multi-objective VRP nonlinear programming model with the shortest vehicle mileage and the smallest carbon emissions as the goals, and an improved ant-colony system algorithm was proposed to solve the model. The algorithm introduced a chaotic disturbance mechanism when updating the ant pheromone on the path, so as to reduce the probability of falling into a local optimal solution and effectively improve the adaptability of the algorithm. In summary, current scholars mostly adopted heuristic algorithms, such as the genetic algorithm and ant colony algorithm, to solve the integrated scheduling problem of production and transportation in the supply chain [32,
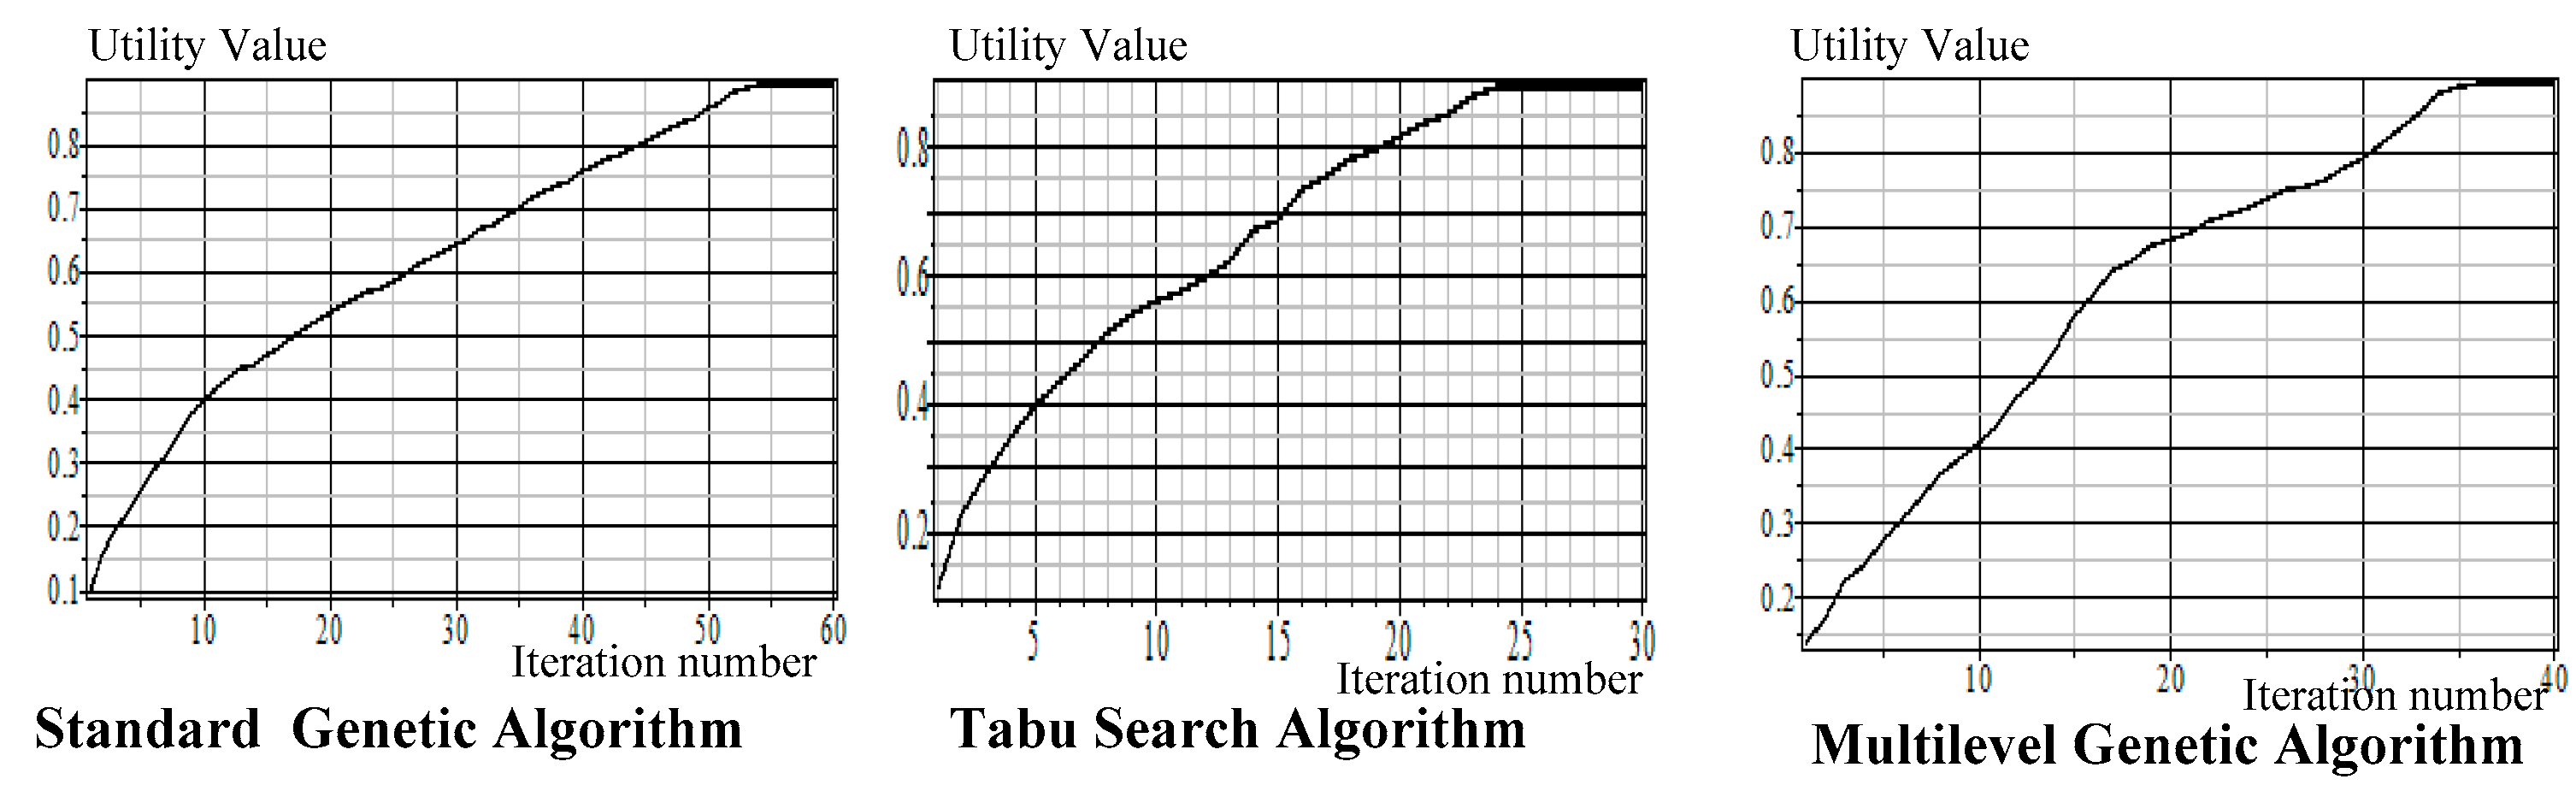
33]. However, there are many variables, such as the distribution batch and mode of the supply chain, the start-up time of production and the production efficiency, which increase the complexity of the model and require higher requirements for algorithm efficiency. Based on the superiority of multilevel genetic algorithm in solving multi-objective optimization problems, a multilevel genetic algorithm is designed; the rationality of the model and the performance of the algorithm are tested and analyzed through a calculation example.

3. Problem Description

3.1. Overview of Supply Chain Production–Distribution Integrated Scheduling

Manufacturing companies in the supply chain have multiple factories and several customer groups. After receiving the customer’s order, the manufacturing company issues a task to the factory according to the order delivery time and required quantity, and then delivers the product to the customer in a timely manner. On condition that it can meet the needs of customers and delivery time, in order to achieve the goals of optimal distribution costs and minimize carbon emissions in the supply chain, it is necessary to scientifically formulate the production batches, start time and customer-service sequence of each factory on the distribution line. The research questions in this paper are divided into two stages: the factory production stage and the distribution stage. There are a total of k production plants with a total capacity load of n products. After the processing is completed, the product is delivered to the customer, as shown in Figure 1. Products are processed in batches and distributed. Use G = ( N , A ) to denote the network structure of supply chain production–distribution scheduling, where N = U { 0 } , 0 represents the production plant and U = { 1 , 2 , , n } represents the customer point set. A = { i , j } , i N , j N represents the set of road segments; K represents the product type produced in the supply chain; and m ( m M ) represents the number of the production batch, which is consistent with the distribution batch.

3.2. Analysis of Supply Chain Decision Modes Constrained by Carbon Emission Limits

In the e-commerce environment, the decision-making modes of enterprises in the supply chain have an important impact on carbon emissions and affect the integrated scheduling strategy of the supply chain under the constraints of carbon emission. According to its decision mode, it can be divided into two types: centralized supply chain decision mode and decentralized supply chain decision mode. The centralized decision-making mode of the supply chain is to allow manufacturers and suppliers as a whole to share carbon emission constraints, and its scheduling goal is to maximize the overall benefits. In the decentralized decision-making mode of the supply chain, manufacturers and suppliers make plans based on their own scheduling strategies, so manufacturers and suppliers each have carbon emission constraints, namely E M and E S . Based on the above analysis, this paper makes the following assumptions:
Hypothesis 1 (H1).
If there is no-load condition in the distribution activities, it will have a fixed carbon emission.
Hypothesis 2 (H2).
There is a linear relationship between the carbon emissions of production and distribution activities and the number of products.
Hypothesis 3 (H3).
Carbon emissions from activities are not related to the number of repeated activities.
Hypothesis 4 (H4).
The customer orders products of the same distribution route are regarded as a production batch, and the same batch is preferentially produced with a longer life cycle, regardless of the production conversion time and cost between products.
Hypothesis 5 (H5).
The same vehicle can deliver multiple customer orders on the route, and each customer’s demand can only be delivered by one vehicle.

4. The Optimization Model

Aiming at the problem that the two attributes of carbon emissions and costs are not comparable, we propose a multi-attribute utility function method to establish the problem model for this study. The multi-attribute utility function uses the principles of experimental psychology to map the supply chain production–distribution integrated scheduling strategy to different utility values and then finds a scheduling scheme that maximizes utility. Because the production–distribution integrated scheduling decision-making modes of the supply chain are different, a supply-chain production–distribution scheduling optimization mode based on the decentralized decision mode, and the centralized decision mode under the constraints of carbon emission is established.

4.1. The Centralized Decision-Making Mode

In reality, the factors affecting the urban–rural income gap are complex and diverse. The models used in this paper are applied at the provincial level. The regional heterogeneity of the provinces is a problem that cannot be ignored. Therefore, this paper selects representative variables as far as possible to describe regional heterogeneity and avoids excluding key explanatory and control variables. In this way the paper minimizes errors in the estimation of the model. The specific variables are defined as follows.
Based on the above analysis, the supply chain scheduling optimization model of the centralized production–distribution decision-making mode under the constraints of carbon emission is as follows:
M a x G = ω C F C + ω E F E
Equation (1) is the objective function, which means that the total utility of the supply chain scheduling of the centralized production–distribution decision-making mode under the constraint of carbon emission is maximized; F C represents the univariate function of cost; F E represents the univariate function of carbon emissions; ω C represents the weight coefficient of the cost univariate function; and ω E represents the weight coefficient of the carbon emissions univariate function.
s . t . C = i N j N m M c i j x i j m + C g j N m M x 0 j m
Equation (2) represents the total cost of supply chain scheduling, C represents the total cost and c i j represents the cost of the link from customer point i to customer point j . The x i j m = 1 batch represents the m batch delivery from customer i to customer j , x i j m = 0 represents the other and C g represents the fixed cost of vehicle start-up.
E = E M f + i N k K q i k E M m + E S g s + i N k K q i k B E S t r
Equation (3) represents total carbon emissions, E M f represents the manufacturer’s fixed carbon emissions per unit time, E represents the total carbon emissions, q i k represents the quantity of product k ordered by customer i , B represents the vehicle capacity, E M m represents the carbon emissions of the unit produced by the manufacturer, E S g s represents the carbon emissions of the initiation of the distribution process and E S t r represents the carbon emissions of each delivery vehicle.
t m k e = t m k s + T k i N y i m q i k
Equation (4) represents the time required for the continuous production of any product in the same production batch, y i m = 1 represents the order product of customer i is produced in the m batch and y i m = 0 represents the other. T k represents the production time per unit product k ( k N ) , t m k s represents the production start time of product k in the m production batch and t m k e represents the production completion time of product k in the m production batch.
t m k s = t m ( k 1 ) e ; m M , k K \ { 1 }
Equation (5) represents no production waiting time for products in the same production batch.
t 11 s 0
Equation (6) indicates the production start time of the initial batch.
t m k e T 0
Equation (7) indicates that the production completion time of the last batch of products must not exceed the production time window constraint; [ 0 , T 0 ] represents the production time window of the factory.
t m k e t m d , m M
Equation (8) indicates that all orders of the batch cannot be distributed until production is completed; t m d represents the moment when the m delivery batch leaves the factory.
j N m M x i j m = 1 , i U
Equation (9) means that all customer needs are met.
i N x i j m j N x i j m = 0 , i U , m M
Equation (10) indicates that the vehicle must leave after completing the distribution task; j N represents road segment. Vehicles are reusable resources. After the vehicle is used up, it re-enters the resource pool and can be used again.
i N q i y i m B , m M
Equation (11) indicates that the number of vehicle distribution products cannot exceed its maximum capacity, q i represents the number of products ordered by customer i and B represents the vehicle capacity.
m M t m d y i m t i T i , i U
Equation (12) indicates that the customer’s service start time is no later than the latest product delivery deadline and no earlier than the production completion time of this batch of products; T i represents the latest delivery deadline of the order, and t i represents the delivery time of order i .
E E max
Equation (13) indicates that the carbon emissions in the production and distribution links cannot exceed the maximum carbon emissions in the supply chain. E max represents the total carbon emission limit of the supply chain.

4.2. The Decentralized Decision Mode

The supply chain scheduling optimization model of the production–distribution decentralized decision mode under the constraint of carbon emission is as follows:
M a x G = ω C F C + ω E F E
Equation (14) is the objective function that maximizes the total utility of the supply chain scheduling in the production–distribution decentralized decision mode under the constraint of carbon emission.
C = i N j N m M c i j x i j m + C g j N m M x 0 j m
Equation (15) represents the total cost of supply chain scheduling.
E M f + i N k N q i k E M m E M
Equation (16) represents how the manufacturers’ carbon emissions cannot exceed their carbon emission constraints, E M represents the manufacturer’s carbon emissions and E M f represents the manufacturer’s fixed carbon emissions per unit time.
E S g s + i N k N q i k B E S t r E S
Equation (17) indicates that the carbon emissions in the distribution link cannot exceed its carbon emission constraints, and E S represents the carbon emissions of the distribution link.
E M + E S E max
Equation (18) indicates that the sum of carbon emissions in production and distribution cannot exceed the maximum carbon emissions in the supply chain. Equations (14) and (17) and Equations (4)–(12) together form the supply chain scheduling optimization model of the production–distribution decentralized decision mode under the constraint of carbon emission.

5. Multilevel Genetic Algorithm Design

Multilevel genetic algorithm has probability and uncertainty, and the search direction is random, in order to obtain a better solution effect. The superiority of the multilevel genetic algorithm has been verified in fields such as production shop scheduling [34,35]. The most prominent feature of encoding activities into chromosomes through coding conversion is that they can simultaneously explore multi-objective optimization problems. Therefore, the multilevel genetic algorithm is suitable for solving the supply chain scheduling problem of production–distribution integration.
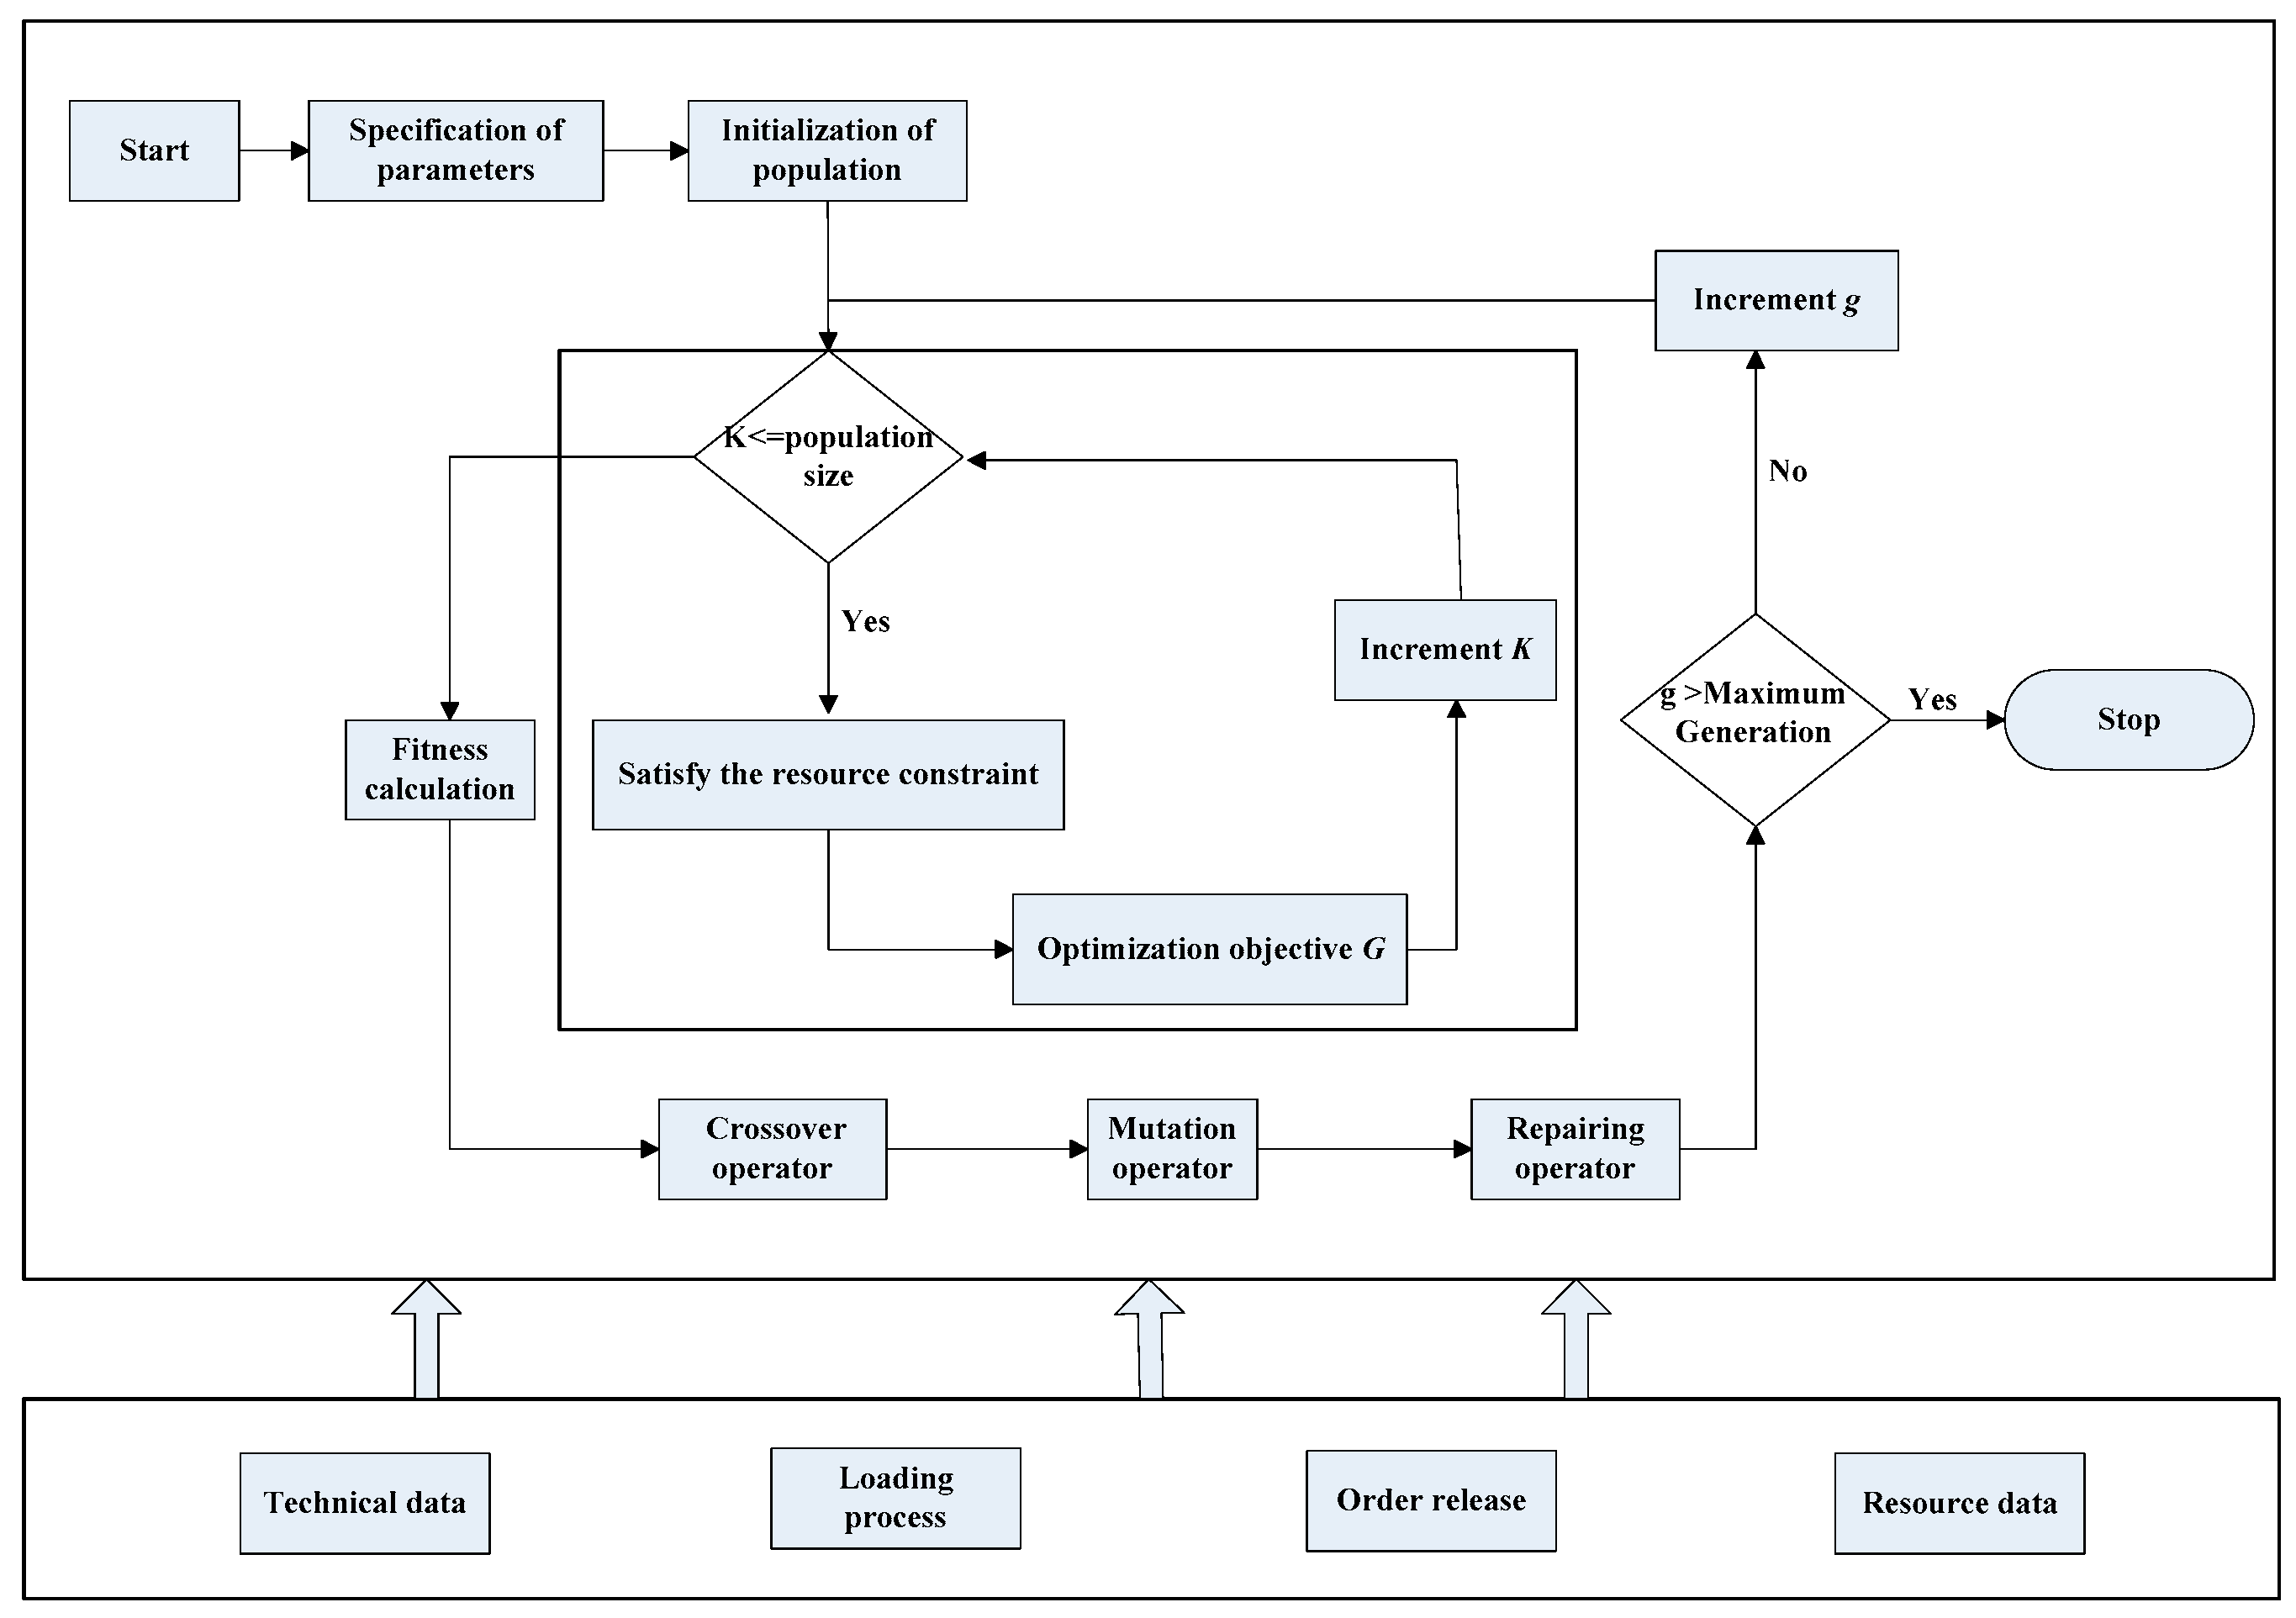
Figure 2 is Multilevel genetic algorithm framework and Figure 3 shows the coding procedure of a multilevel genetic algorithm. The repair operator repairs it before it enters the next generation. The repair operator redetects the logic between tasks and checks whether it has been completed before the original scheduling plan. If it has already been performed, swap the new task with the original task’s location.

5.1. Coding Structure of Multilevel Chromosomes

A good chromosome coding scheme must be designed with reasonable genetic operators in order to better present the problem information. For the problems in the real world, the application of genetic algorithms is mainly divided into the following two ways: direct use of chromosome representation and indirect use of chromosome representation. According to the Topcuoglu theory [27,32], multilevel chromosomes contain different information and have different data types. The individuals in each population are composed of three levels of serial coding: the first level, a random sequence representing the customer’s random sequence, and also a direct representation of progress information; the second level represents the path number sequence, which represents the path to which the customers of the same gene locus belong to the first level; and the third level uses actual numbers to indicate the corresponding service time of different orders. Multilevel genetic algorithm operators are independently applied in the above three levels. Figure 4 and Figure 5 show the schematic diagrams of one-level coding and multilevel coding of a multilevel genetic algorithm.

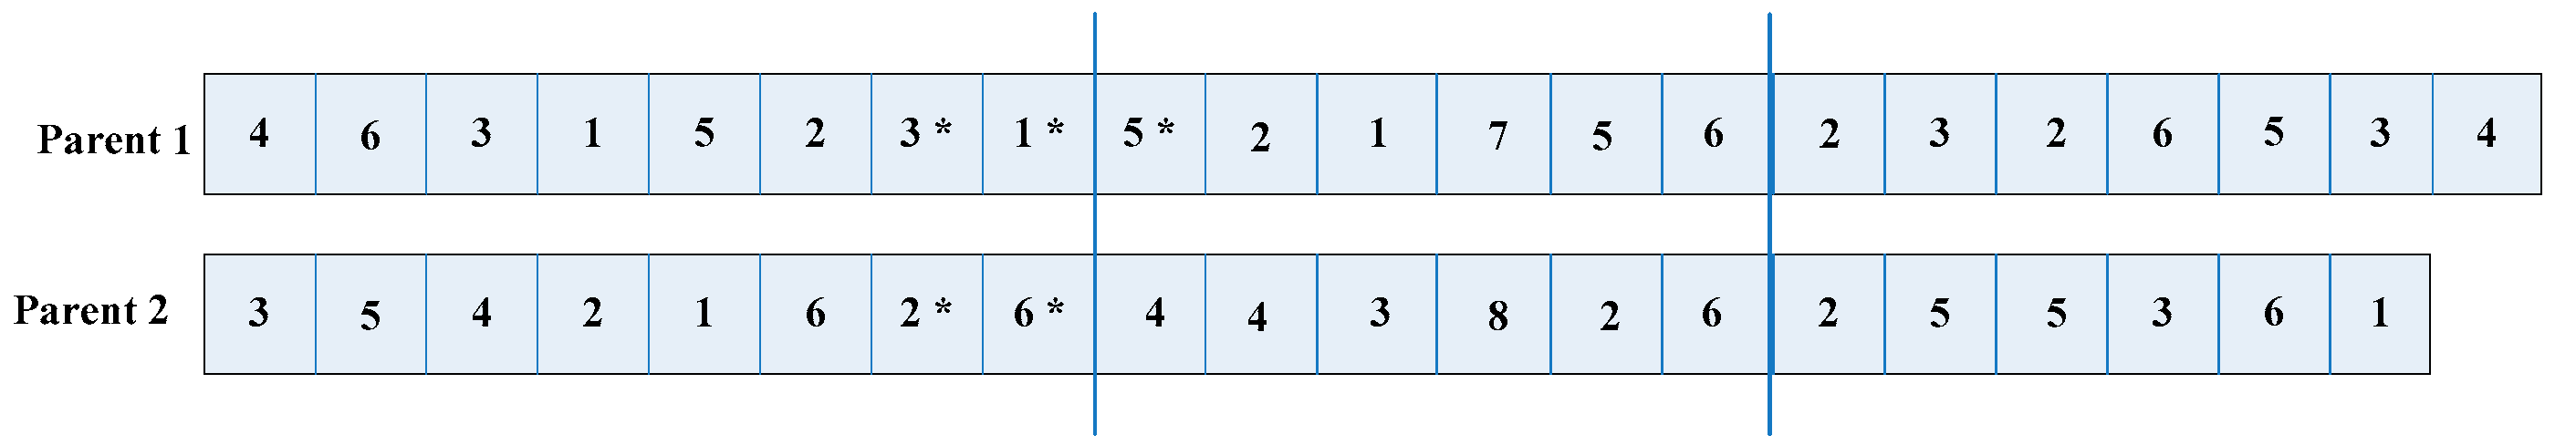
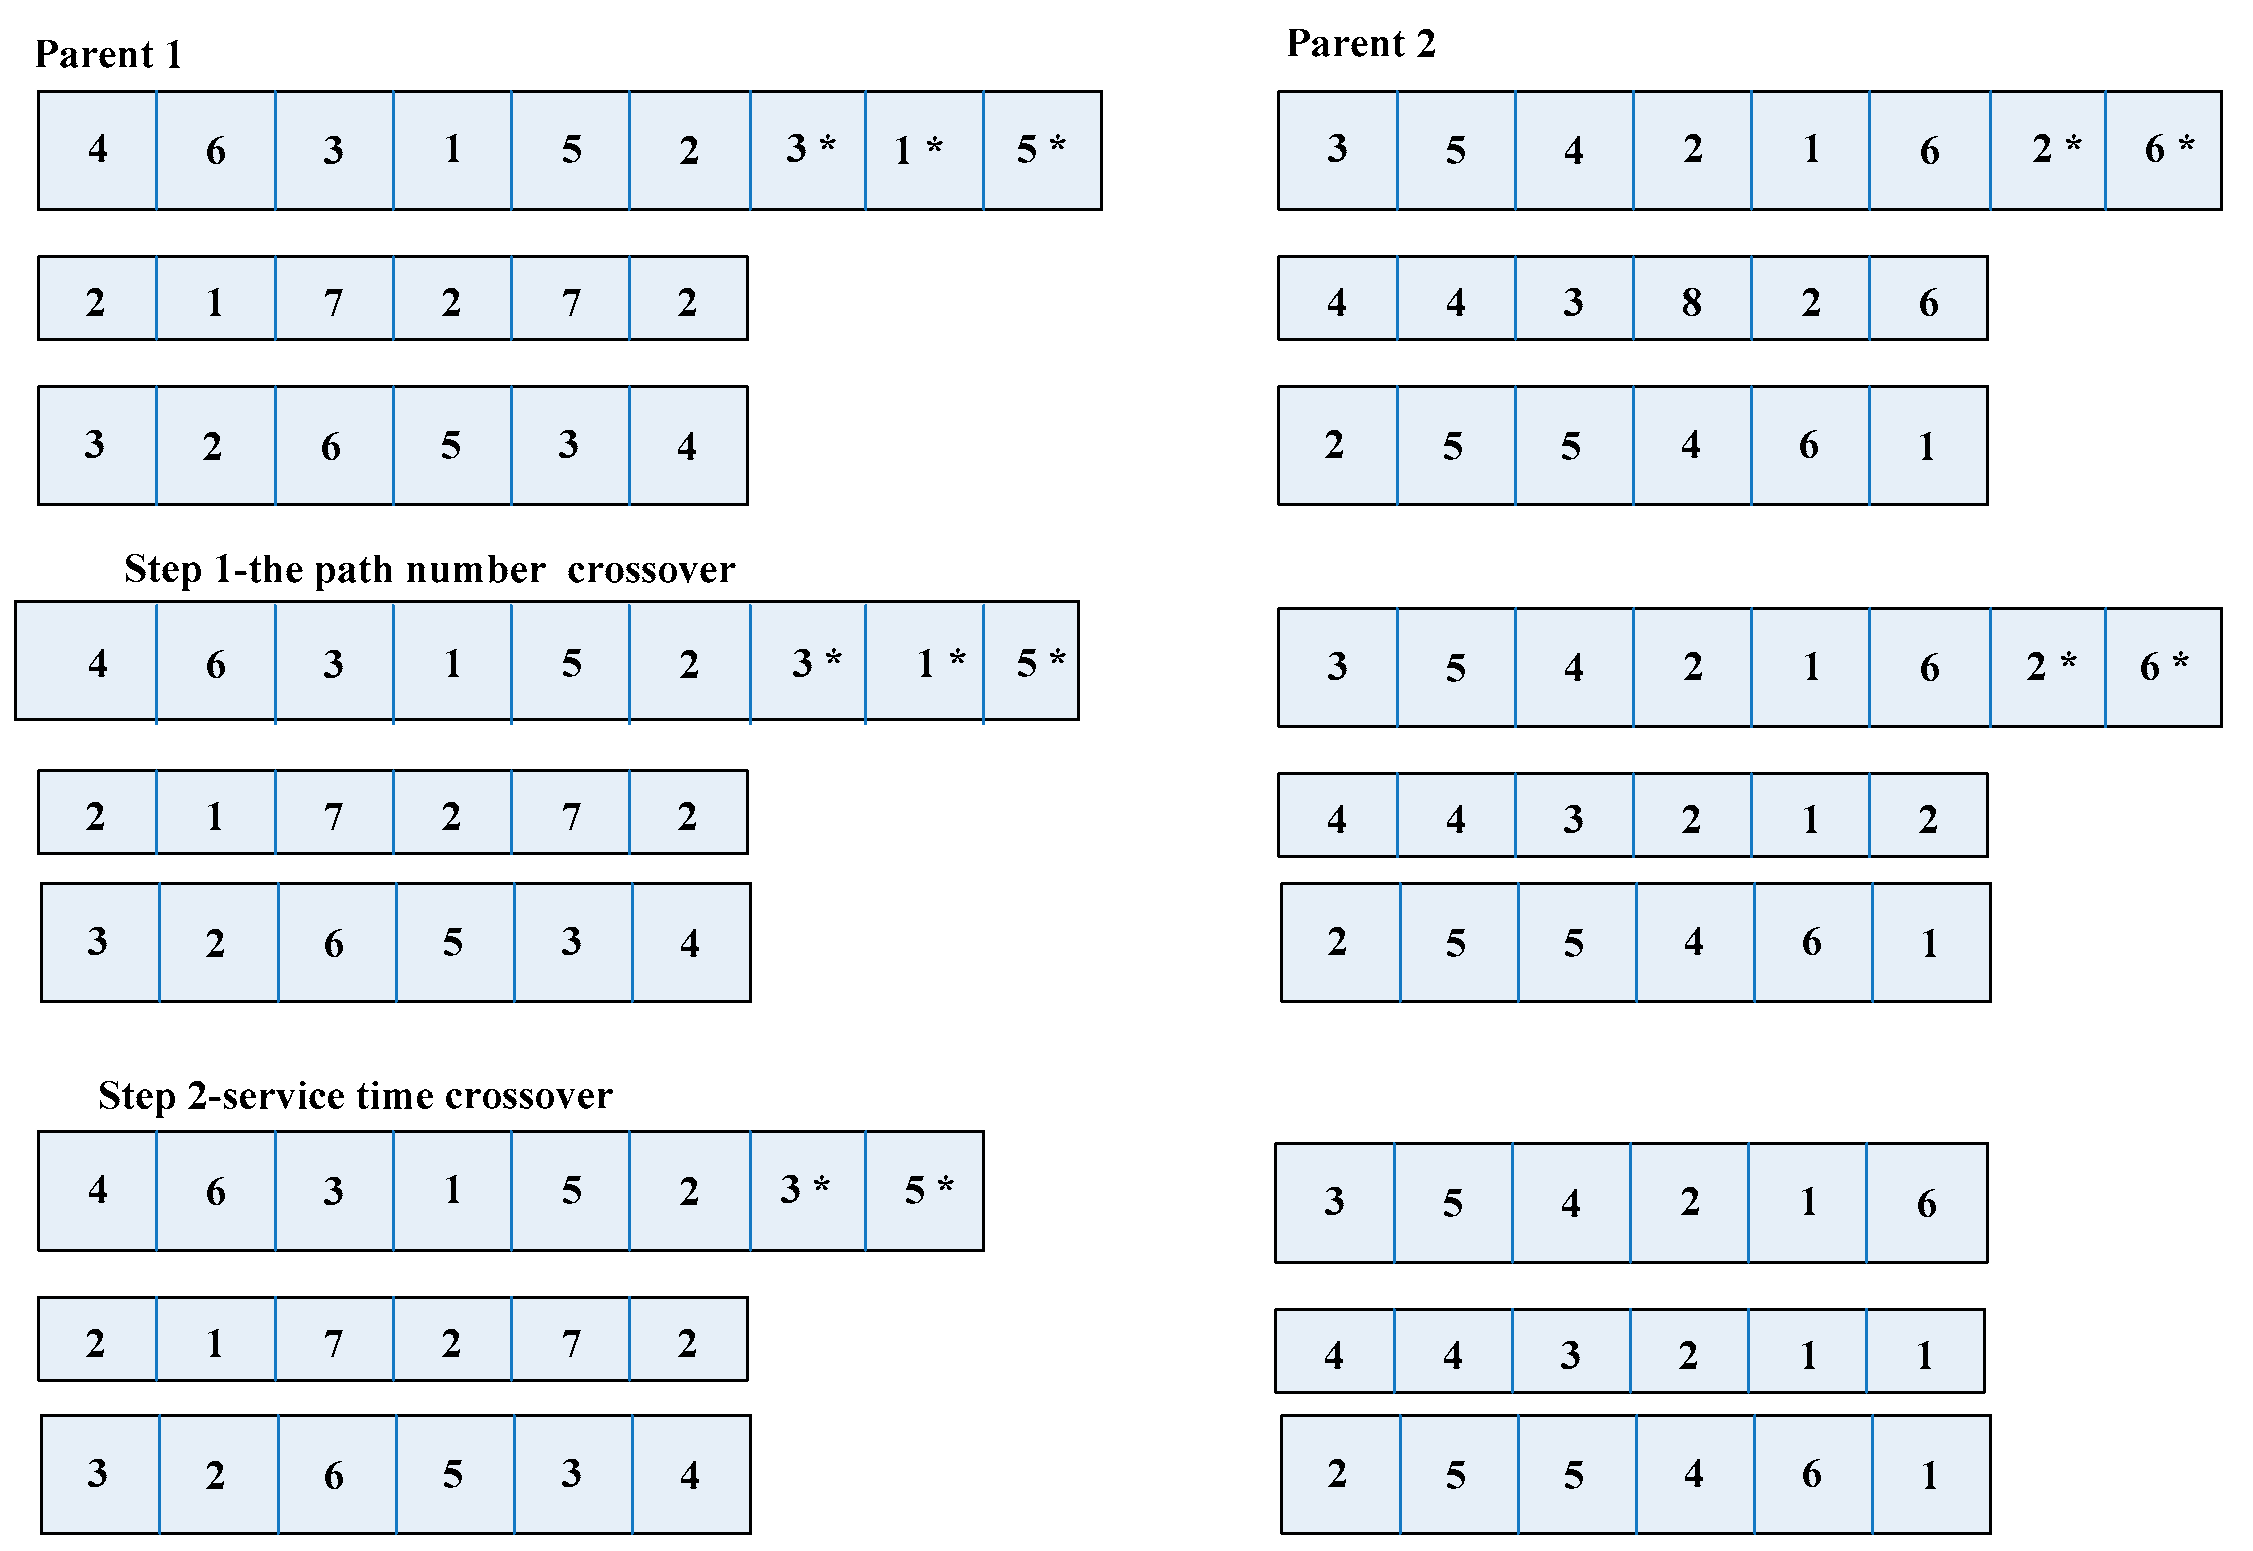
5.2. Crossover Operator

Because the chromosome has three levels and is encoded with different types of data, the crossover operations at different levels must be performed independently. First, the first and second tiers remain the same, with two crossings during the third tier service hours. Secondly, the path sequence of the second level changes correspondingly but its value remains unchanged, the customer’s service order is updated and two offspring are generated. Finally, two new crossover operators need to be extracted and generated again. In the process of generating the crossover operator, the customer service order, route sequence and service time will change accordingly. The cross process of the multilevel genetic algorithm is shown in Figure 6.

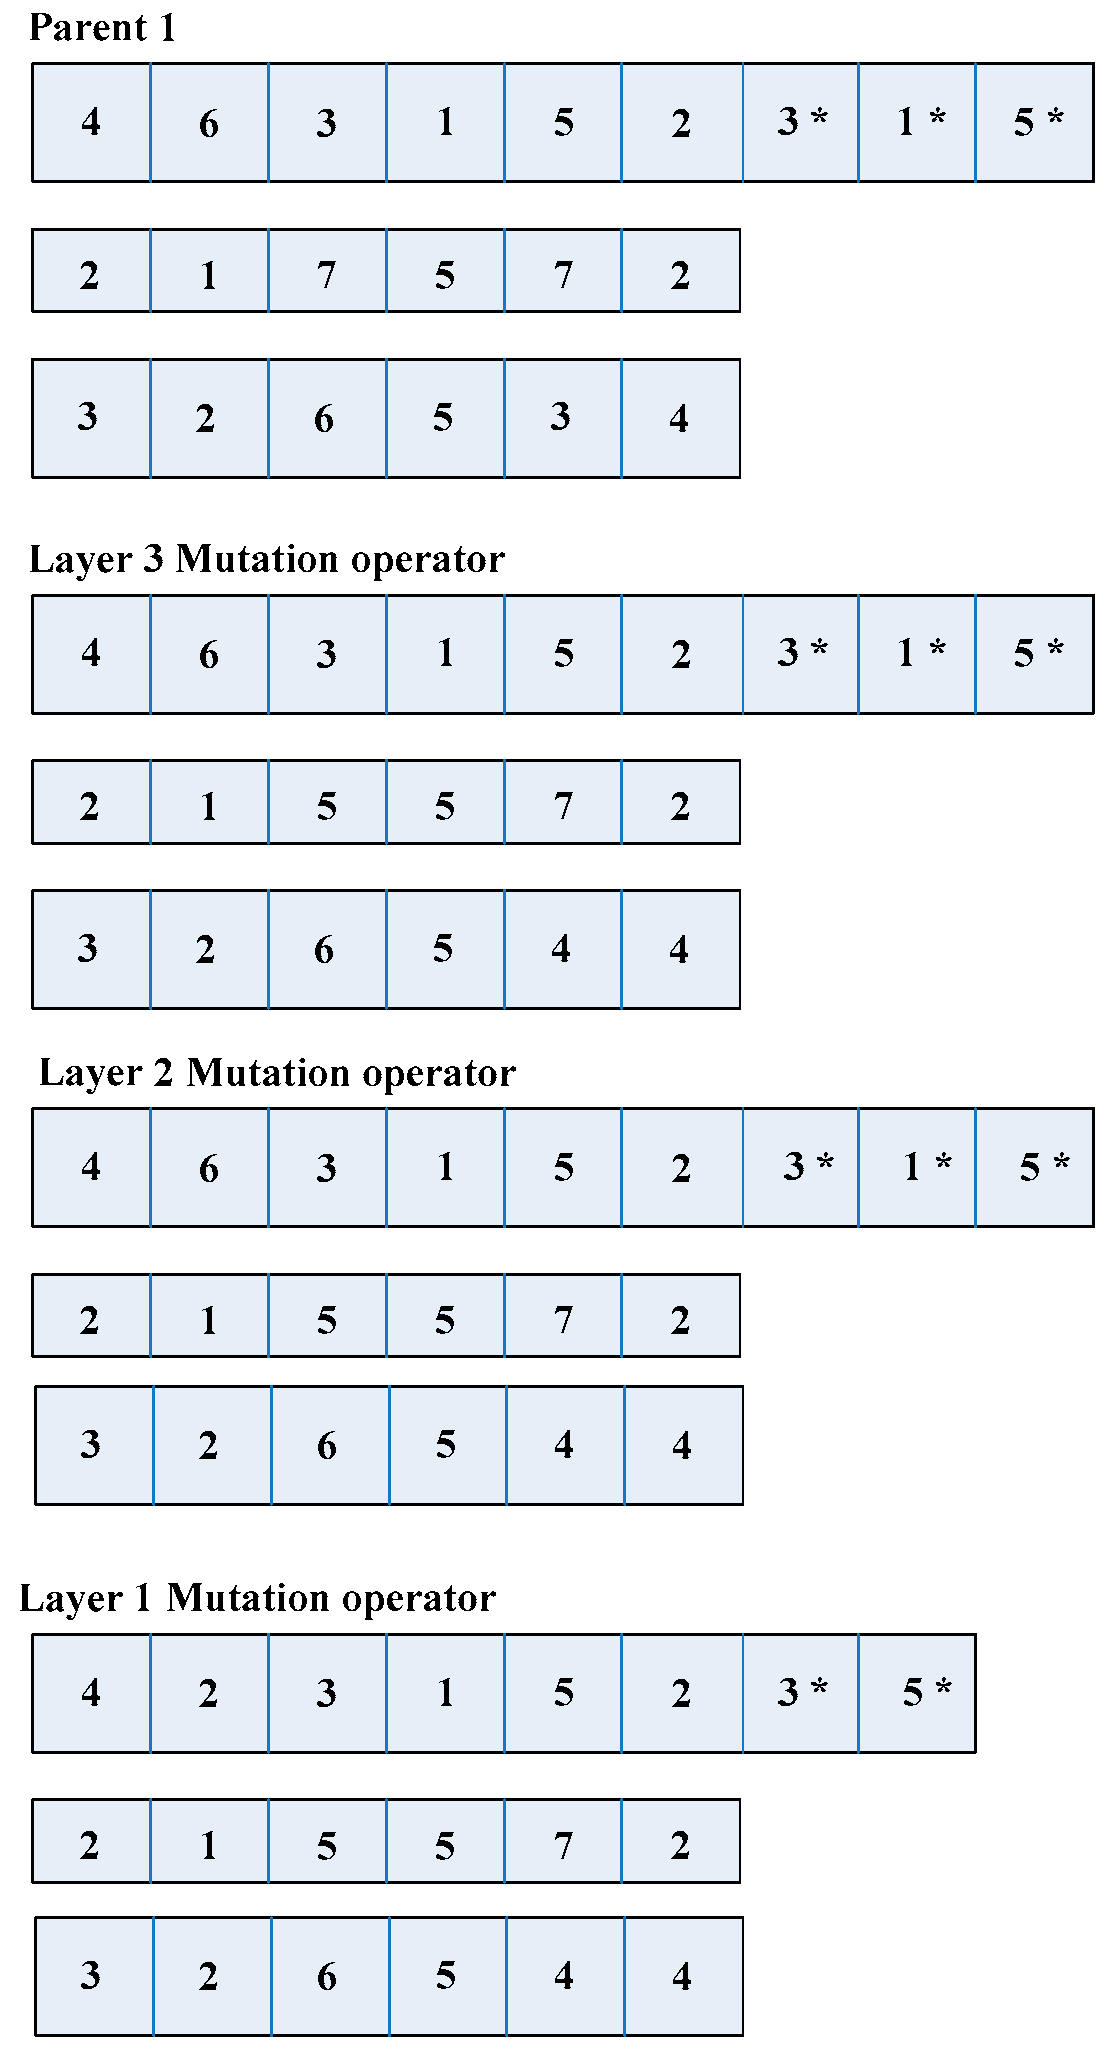
5.3. Mutation Operator

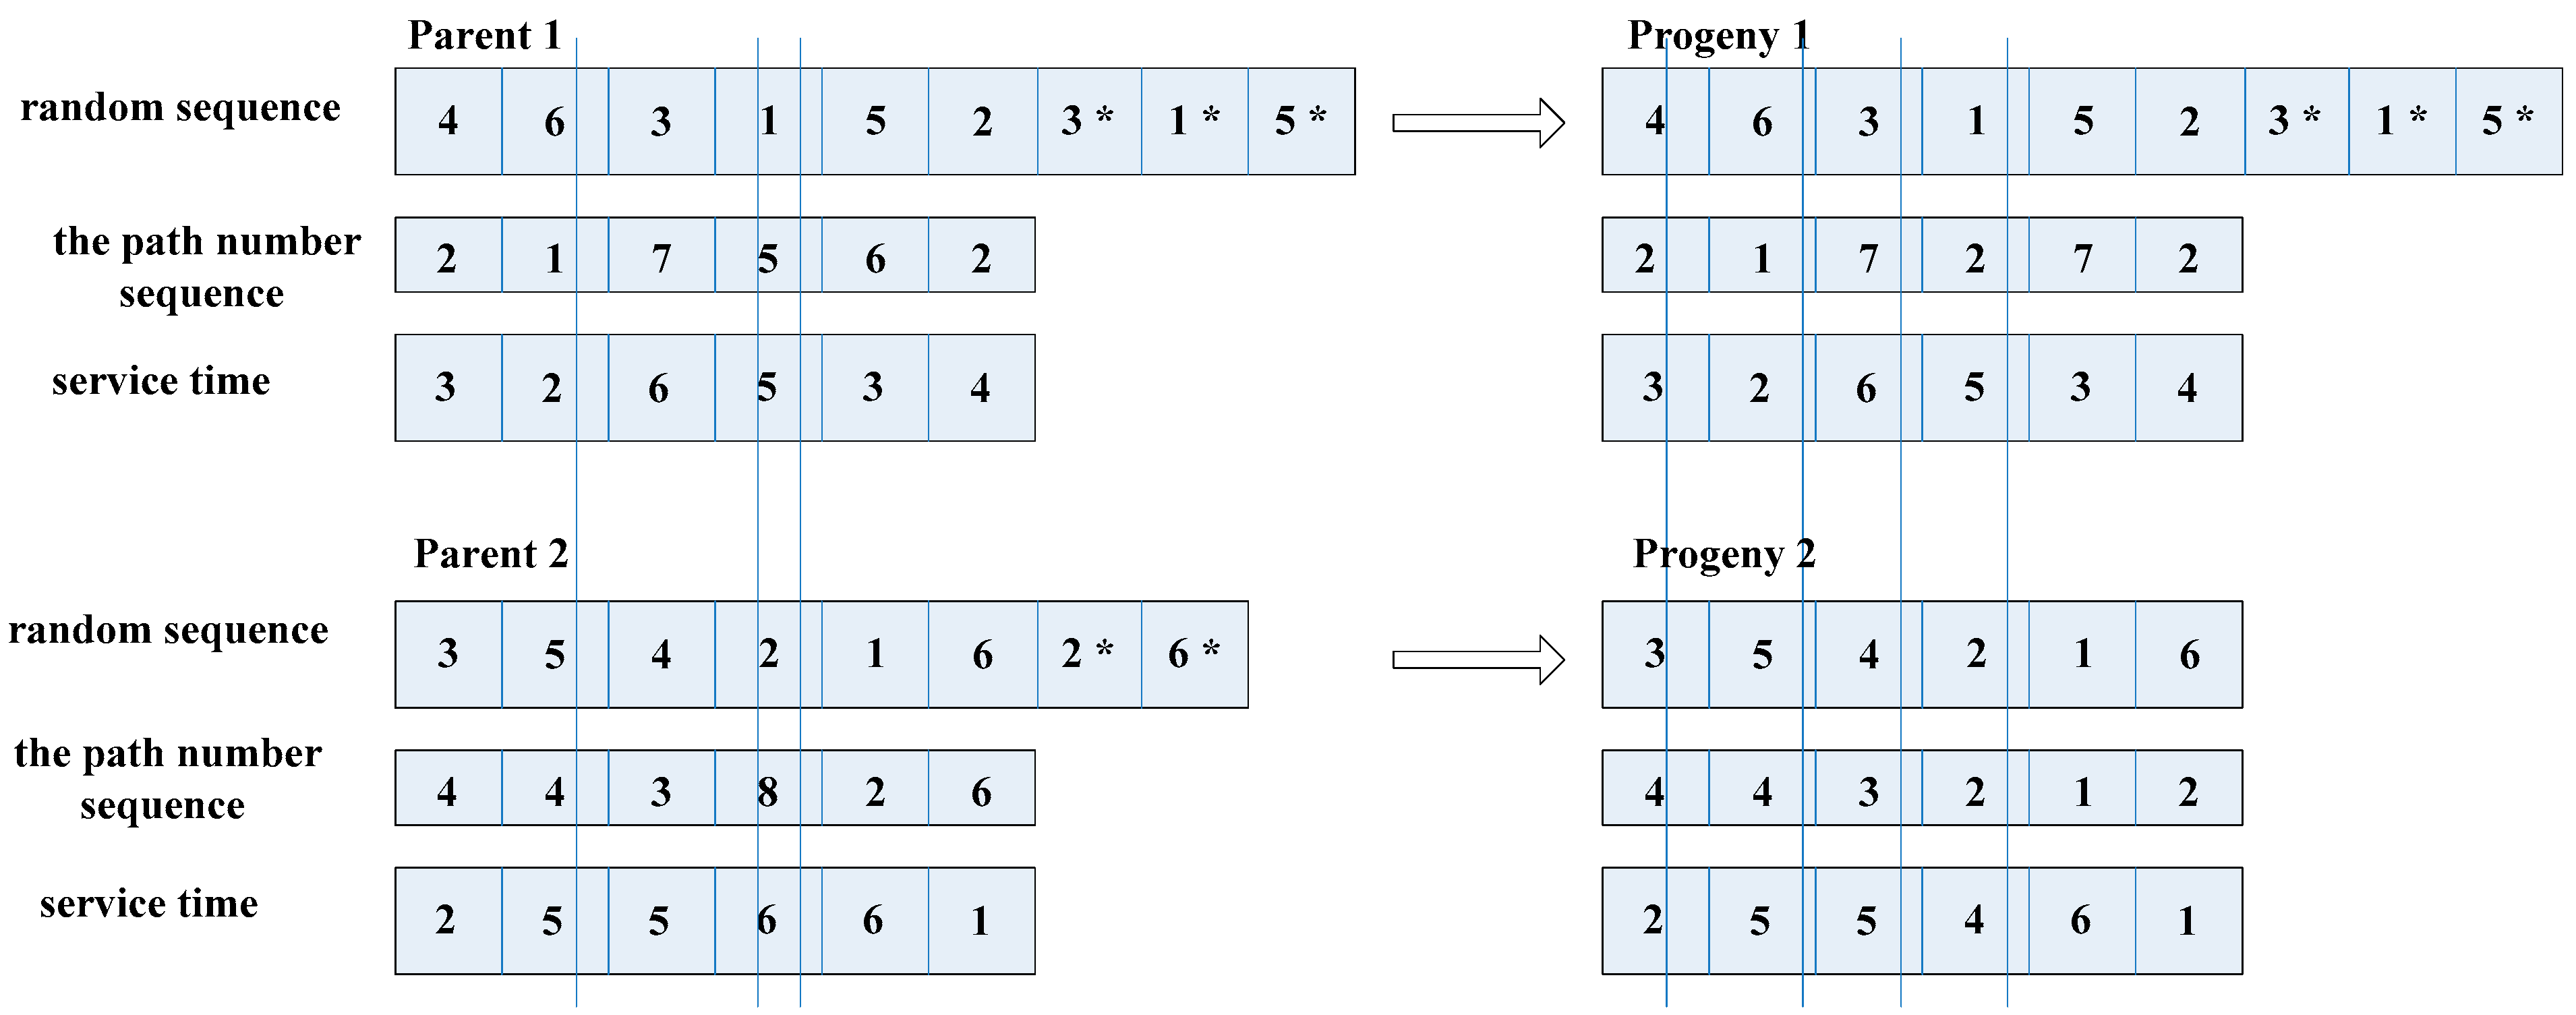
The mutation process is similar to the iterative crossover process. The first and second levels remain unchanged, starting from the third level and requiring only one parent. As for mutation, because the supply chain integration scheduling problem is subject to multiple constraints such as time and resource availability, in order to meet the constraints, the location of the mutation operation must be limited to a specific range. As shown in Figure 7, take Parent 1 as an example; the mutation operation needs to change a position randomly, and at the same time, it needs to detect whether the new chromosome is within the time window constraint. If it is within the bounds of the time window, it is retained; otherwise, the gene of the chromosome is mutated. Generate customer sequence and customer random coding layer mutations in turn, and copy the data generated by the repair process.

5.4. Repairing Operator

The production–distribution integrated supply chain scheduling solution must meet two prerequisites, they are, the constraints and service logic cannot be violated. In the process of crossover and mutation, the path number sequence generation process in the chromosome is located before the client sequence. The repairing operator will detect the logic of the scheduling and swap the positions of the corresponding customer sequences, while detecting whether the time constraints are met.

5.5. Calculation of Fitness

The goal of the multilevel genetic algorithm is to formulate a supply chain scheduling optimization plan for production–distribution integration under the constraints of carbon emission, and to reduce cost and carbon emissions while meeting the constraints of the time window. Therefore, the fitness f i t ( t ) is the same as the objective function; that is, f i t ( t ) = G ( t ) .

5.6. Algorithm Termination Principle

The superiority of the multilevel genetic algorithm is that even if the scale of the problem continues to increase, the solution obtained is a nearly optimal solution under the premise that the population size and the population algebra do not increase correspondingly. Based on the complexity of the scale of the production–distribution integrated supply chain scheduling problem under the constraint of carbon emission, the calculation is stopped here when the population algebra is 100, and the number of each algebra is determined by experimental statistics.

6. Experimental Analysis

6.1. Simulation Tests

In order to verify the effectiveness of the model and algorithm, this paper selects test data from the automotive battery production and sales supply chain. There are three production plants and 25 customer points in e-commerce supply chain, and there are 10 homogeneous vehicles with a capacity of 300 units. The driving cost is 1 RMB/km, the daily average driving speed of the vehicle is 27 km/h and the fixed cost of using a car is RMB 120. The service time of each customer is 0.15 h. The factory produces three types of automotive batteries, and the production time per unit product is 0.006, 0.008 and 0.009 h. The specific data of customer demand for each type of product and customer demand time window are shown in Table 1. Multilevel genetic algorithm programming is implemented by MATLAB. Let population size be set as P o p s i z e = 100 ; P o p s i z e represents population size. In order to meet the requirements of population diversity, the value of evolutionary algebra is M a x g e n = 100 ; M a x g e n represents the maximum number of iterations. The expert scoring method is adopted to set the weight coefficients of each parameter, or setting the weight coefficients of each parameter according to the actual implementation of the company. The weight coefficients of each parameter are ω E = 0 . 54 and ω C = 0 . 46 respectively. Because there are few related researches on the carbon emissions of the automotive battery production and marketing supply chain, the project-oriented supply chain problem under the constraint of the carbon emission studied in this paper is the average value of its industry carbon as a constraint value; that is, E max 700 ( kg ) . The relevant information is shown in Table 1.
After analyzing the data of the example, it is found that the setting of the carbon emission constraints has an important effect on the scheduling scheme in e-commerce supply chain. The liberalized carbon emission constraints reduce its sensitivity to carbon emissions, generate a large amount of carbon emissions, and reduce the operating cost of the supply chain’s integrated production and distribution scheduling. According to the results of the examples, we can set a scientific and reasonable carbon emission constraints and make a supply chain scheduling decision within the time and cost range acceptable to the supply chain dispatcher, so that the production–distribution scheduling of the supply chain meets most enterprises in the supply chain and promotes the establishment of stable cooperative relationships and operational order in the supply chain.
Based on the analysis of the above example, as well as the data results in Table 2 and Table 3 and Figure 8 and Figure 9, we can find the impact of two different supply chain decision modes on the integrated scheduling of production–distribution in the supply chain. The centralized decision-making mode can play the role of the carbon emission constraints to the greatest extent. Although the carbon emission is large, it can well control the cost and achieve the purpose of minimizing the cost. In the decentralized decision-making mode, companies determine their carbon emissions individually, and the adjustment effect of integrated scheduling is more limited. It can be seen from Table 2 that 10 homogeneous vehicles are the total number of vehicles. In this experiment, only four vehicles were used, and others are non-use vehicles; reducing the use of vehicles is also conducive to reducing carbon emissions.

6.2. Comparative Analysis of Algorithms

In this paper, the standard genetic algorithm, Tabu search algorithm and multilevel genetic algorithm are used to analyze the above examples in order to test the performance of the multilevel genetic algorithm. The convergence of the calculation results, using the above algorithms, is shown in Figure 10.
It can be seen from Figure 10 that the Tabu search algorithm has the fastest convergence rate, but it is easy to generate a local optimal solution. While the convergence rate of the genetic simulated annealing algorithm is slower than the Tabu search algorithm, its decreased speed of convergence is the fastest. Therefore, its global convergence ability is the strongest among the three. Moreover, in order to verify the validity of the algorithm, the above example is calculated 100 times to calculate the optimal value, the worst value and the average value, and the calculation results are shown in Table 4.
It can be seen from Table 4 that the average results obtained by the multilevel genetic algorithm proposed in this paper can basically reach the optimal solution. It can be clearly seen from other data that the results of the multilevel genetic algorithm are better than that of the Tabu search algorithm and standard genetic algorithm. The abovementioned studies prove that the multilevel genetic algorithm has the strongest global search ability.
The algorithms test shows that the multilevel genetic algorithm designed in this paper is superior to other intelligent algorithms in global search and fast convergence. It can meet the requirements for solving algorithms of integrated production and transportation scheduling problem in e-commerce supply chain with carbon emission constraints.

7. Conclusions

To research the e-commerce supply chain scheduling problem of production–distribution integration under the constraints of carbon emission, analyze the impact of centralized and decentralized decision modes on carbon emissions and costs, and build centralized decision-making and decentralized decision-making, we used a scheduling optimization model. The main research conclusions of this paper are as follows:
(1) The centralized decision-making mode makes the role of carbon emission constraints to the greatest extent. The carbon emissions and the cost are smallest in the centralized decision-making mode. The decentralized decision-making mode has a more limited regulatory effect due to the individual determination of carbon emissions. Neither carbon emissions nor cost control are ideal. The research objectives of this article focus on the two key variables of operating costs and carbon emissions. However, the variables, such as profit, carbon emissions trading and government preferential policies, also need to be considered on business operations and thus the complex network relationship will affect the ultimate interests of the enterprise, which will be analyzed in the follow-up research.
(2) We designed a multilevel genetic algorithm to solve the e-commerce supply chain scheduling problem of production–distribution integration under the constraints of carbon emission. The multilevel genetic algorithm has probability and uncertainty. It encodes activities into chromosomes through coding conversion. It is a multi-objective optimization problem that can be explored simultaneously, and the optimal solution can be found in a series of feasible scheme groups. Therefore, the multilevel genetic algorithm is suitable for the e-commerce supply chain scheduling problem of production–distribution integration. In the simulation tests, the multilevel genetic algorithm was adopted to solve the problem; the multilevel genetic algorithm can be improved to increase the calculation efficiency, so as to find the optimal solution more quickly in following research.
(3) The model can also be further expanded; we established the multi-attribute utility model in this article, and a chance constrained programming model may be established in the follow-up research. In the e-commerce environment, the supply chain is quite uncertain; it is difficult to achieve deterministic state in both production and transportation links. Therefore, the integrated scheduling of production and transportation in uncertain environments is a follow-up research topic.

Author Contributions

Conceptualization, W.W.; methodology, S.W.; software, J.S.; formal analysis, W.W.; resources, W.W.; writing—original draft preparation, W.W.; writing—review and editing, J.S. All authors have read and agreed to the published version of the manuscript.

Funding

Chongqing Education Committee Science and Technology Research Project, grant number KJZD-K202000901, and Sichuan International Studies University Scientific Research Project, grant number sisu2019044.

Institutional Review Board Statement

Not applicable.

Informed Consent Statement

Not applicable.

Data Availability Statement

The data presented in this study are available in the article.

Conflicts of Interest

The authors declare no conflict of interest.

References

  1. Hesse, M. Shipping news: The implications of electronic commerce for logistics and freight transport. Resour. Conserv. Recycl. 2002, 3, 211–240. [Google Scholar] [CrossRef]
  2. Shen, L.; Wang, X.; Liu, Q.; Wang, Y.; Lv, L.; Tang, R. Carbon Trading Mechanism, Low-Carbon E-Commerce Supply Chain and Sustainable Development. Mathematics 2021, 9, 1717. [Google Scholar] [CrossRef]
  3. Mallidis, I.; Dekker, R.; Vlachos, D. The impact og greening on supply chain design and cost: A case for a developing region. J. Transp. Geogr. 2012, 22, 118–128. [Google Scholar] [CrossRef]
  4. Agnetis, A.; Hall, N.G.; Pacciarelli, D. Supply chain scheduling: Sequence coordination. Discret. Appl. Math. 2006, 154, 2044–2063. [Google Scholar] [CrossRef]
  5. Hall, P. The coordination of scheduling and batch deliveries. Ann. Oper. Res. 2005, 135, 41–64. [Google Scholar] [CrossRef]
  6. Pundoor, G.; Chen, Z.-L. Scheduling a production–distribution system to optimize the tradeoff between delivery tardiness and distribution cost. Nav. Res. Logist. 2005, 52, 571–589. [Google Scholar] [CrossRef]
  7. Armentano, V.A.; Shiguemoto, A.L.; Lokketangen, A. Tabu search with path relinking for an integrated production-distribution problem. Comput. Oper. Res. 2011, 38, 1199–1209. [Google Scholar] [CrossRef] [Green Version]
  8. Chen, J. Study on Supply Chain Management in a Low-Carbon Era. J. Syst. Manag. 2012, 21, 721–728. [Google Scholar]
  9. Nathan, P.; Maro, I.; Hong, W.X. A carbon footprint analysis of egg production and processing supply chains in the Midwestern United States. J. Clean. Prod. 2013, 54, 108–114. [Google Scholar]
  10. Andrew, S. EU corporate action as a driver for global emissions abatement: A structural analysis of EU international supply chain carbon dioxide emissions. Glob. Environ. Chang. 2013, 23, 1795–1806. [Google Scholar]
  11. Erik, S.; Anna, K.S.A. Carbon footprint of a Cavendish banana supply chain. Int. J. Life Cycle Assess 2013, 18, 1450–1464. [Google Scholar]
  12. Gao, S.; Qi, L.; Lei, L. Integrated batch production and distribution scheduling with limited vehicle capacity. Int. J. Prod. Econ. 2014, 9, 1–13. [Google Scholar] [CrossRef]
  13. Bai, M.; Chen, F.; Tang, G. Integrated Production and Distribution Scheduling in Supply Chain Management. Ind. Eng. Manag. 2007, 5, 47–50. [Google Scholar] [CrossRef]
  14. Sathaye, N.; Horvath, A.; Madanat, S. Unintended impacts of increased truck loads on pavement supply chain emissions. Transp. Res. Part A Policy Pract. 2010, 44, 1–15. [Google Scholar] [CrossRef] [Green Version]
  15. Man, Y.; Wang, C.X.; Xu, C. A Network Optimization Model for Dual-Channel Two-Echelon Supply Chain with Carbon Emission Constraints. Ind. Eng. J. 2013, 16, 7–13. [Google Scholar]
  16. Shi, Z.; Zhao, D. Integrated Study on Supply Chain Carbon Reduction in the Voluntary Reduction Market. J. Northwest. Polytech. Univ. 2013, 33, 41–47. [Google Scholar]
  17. Xu, L. Duty Allocation and Cost Distribution of Carbon Emission Reduction during the Construction of Low Carbon Supply Chain. Soft Sci. 2013, 27, 104–108. [Google Scholar]
  18. Tsan, M.C. Carbon footprint tax on fashion supply chain systems. Int. J. Adv. Manuf. Technol. 2013, 68, 835–847. [Google Scholar]
  19. Bo, M.; Jin, J.X.; Kui, S.F.; Dabo, G.; Xue, F. China’s inter-regional spillover of carbon emissions and domestic supply chains. Energy Policy 2013, 61, 1305–1321. [Google Scholar]
  20. Behnam, F.; Joseph, S.; Farzad, D.; Nahid, B.; Shams, R. The impact of carbon pricing on a closed-loop supply chain: An Australian case study. J. Clean. Prod. 2013, 59, 210–225. [Google Scholar]
  21. Chia, W.H.; Tsai, C.K.; Sheng, H.C.; Allen, H.H. Using DEMATEL to develop a carbon management model of supplier selection in green supply chain management. J. Clean. Prod. 2013, 56, 164–172. [Google Scholar]
  22. Su, J.; Li, C.; Zeng, Q.; Yang, J.; Zhang, J. A green closed-loop supply chain coordination mechanism based on third-party recycling. Sustainability 2019, 11, 5335. [Google Scholar] [CrossRef] [Green Version]
  23. Rebitzer, G.; Ekvall, T.; Frishknecht, R.; Hunkeler, D.; Norris, G.; Rydberg, T.; Schmidt, W.-P.; Suh, S.; Weidema, B.P.; Pennington, D.W. Life cycle assessment, part 1: Framework, goal and scope definition, inventory analysis, and applications. Environ. Int. 2004, 30, 701–720. [Google Scholar] [CrossRef] [PubMed]
  24. Long, L.D.; Ohsato, A. A genetic algorithm-based for scheduling repetitive construction projects. Autom. Constr. 2009, 18, 499–511. [Google Scholar] [CrossRef]
  25. Harris, I.; Nan, T.; Palmerc, A.; Potter, A.; Mumford, C. Assessing the Impact of cost Optimization Based on Infrastructure Modeling on CO2 Emissions. Int. J. Prod. Econ. 2011, 131, 313–321. [Google Scholar] [CrossRef] [Green Version]
  26. Su, J.; Li, C.; Tsai, S.B.; Lu, H.; Liu, A.; Chen, Q. A sustainable closed-loop supply chain decision mechanism in the electronic sector. Sustainability 2018, 10, 1295. [Google Scholar] [CrossRef] [Green Version]
  27. Wang, W.X.; Ge, X.L.; Li, L.; Su, J. Proactive and Reactive Multi-project Scheduling in Uncertain Environment. IEEE Access 2019, 7, 88986–88997. [Google Scholar] [CrossRef]
  28. Kim, N.; Janic, M.; Wee, B. Trade-off between Carbon dioxide emissions and Logistics Costs Based on Multiobjective Optimization. Transp. Res. Rec. 2009, 2139, 107–116. [Google Scholar] [CrossRef] [Green Version]
  29. Yang, S.; Huang, G.; Liang, L. Auction Based Distribution Supply Chain Project Scheduling. J. Ind. Eng. Manag. 2008, 22, 41–45. [Google Scholar]
  30. Gao, P.; Wen, W. Carbon Tax and Carbon Distribution. J. Tsinghua Univ. Sci. Technol. 2002, 42, 1335–1338. [Google Scholar]
  31. Battarra, M.; Erdogan, G.; Vigo, D. Exact algorithms for the clustered vehicle routing problem. Oper. Res. 2014, 41, 58–71. [Google Scholar] [CrossRef] [Green Version]
  32. Najera, A.; Bullinaria, J. An Improved Multi-objective Evolutionary algorithm for the Vehicle Routing problem with Time Windows. Comput. Oper. Res. 2011, 38, 287–300. [Google Scholar] [CrossRef] [Green Version]
  33. Jian, J.; Li, B.; Zhang, N.; Su, J. Decision-making and coordination of green closed-loop supply chain with fairness concern. J. Clean. Prod. 2021, 298, 126779. [Google Scholar] [CrossRef]
  34. Jian, J.; Guo, Y.; Jiang, L.; An, Y.; Su, J. A multi-objective optimization model for green supply chain considering environmental benefits. Sustainability 2019, 11, 5911. [Google Scholar] [CrossRef] [Green Version]
  35. Su, J.; Wei, M.; Liu, A. A Robust Predictive–Reactive Allocating Approach, Considering Random Design Change in Complex Product Design Processes. Int. J. Comput. Intell. Syst. 2018, 11, 1210–1228. [Google Scholar] [CrossRef] [Green Version]
Figure 1. Unit structure diagram of project-oriented supply chain.
Jtaer 16 00140 g001
Figure 2. Multilevel genetic algorithm framework.
Jtaer 16 00140 g002
Figure 3. Coded program of multilevel genetic algorithm.
Jtaer 16 00140 g003
Figure 4. First-level coding. (* indicates the selected gene segment.)
Jtaer 16 00140 g004
Figure 5. Multilevel coding. (* indicates the selected gene segment.)
Jtaer 16 00140 g005
Figure 6. Crossover operator. (* indicates the selected gene segment.)
Jtaer 16 00140 g006
Figure 7. Mutation operator. (* indicates the selected gene segment.)
Jtaer 16 00140 g007
Figure 8. Path trajectory of centralized decision-making supply chain.
Jtaer 16 00140 g008
Figure 9. Path trajectory of decentralized decision-making supply chain.
Jtaer 16 00140 g009
Figure 10. Contrast diagram of algorithm convergences.
Jtaer 16 00140 g010
Table 1. Relevant information of customers.
No.CoordinateDemand (A,B,C)Time Window
1[66,78](14,15,12)[8:00,10:00]
2[56,27](10,13,9)[13:00,16:00]
3[88,72](13,9,11)[10:00,14:00]
4[88,32](15,10,15)[8:00,12:00]
5[24,48](13,11,14)[8:30,10:00]
6[40,48](14,15,16)[15:30,17:00]
7[32,80](23,8,10)[8:30,10:00]
8[16,69](18,9,20)[9:00,11:00]
9[88,96](22,15,18)[9:00,11:00]
10[48,96](19,17,20)[8:00,14:30]
11[32,104](17,23,18)[9:30,11:00]
12[80,56](14,15,22)[10:00,11:30]
13[48,40](20,16,19)[8:30,11:00]
14[24,16](8,9,13)[8:00,12:00]
15[48,8](9,13,10)[8:00,11:30]
16[16,32](5,7,9)[10:00,12:00]
17[8,48](12,16,8)[14:00,17:00]
18[32,64](11,13,13)[9:30,15:00]
19[24,96](14,13,13)[13:00,15:00]
20[72,104](11,7,15)[9:00,10:00]
21[72,32](19,20,16)[8:00,17:00]
22[72,16](16,9,16)[9:00,13:00]
23[88,8](12,11,15)[10:30,15:00]
24[104,56](11,12,12)[13:00,15:00]
25[104,32](16,16,11)[10:00,15:00]
Table 2. Path sequences.
VehicleThe Path Sequences of Centralized Decision-Making Supply ChainThe Path Sequences of Decentralized Decision-Making Supply Chain
1[0 1 20 10 11 19 7 0][0 18 7 19 11 10 20 0]
2[0 15 14 16 17 8 18 5 6 0][0 9 3 24 25 23 22 15 0]
3[0 9 3 24 25 4 23 22 0][0 6 5 8 17 16 14 13 0]
4[0 13 2 21 12 0][0 2 21 4 12 1 0]
Table 3. Test results.
Cost ($)Carbon Emissions (kg)
Centralized decision-making supply chain2559.91415
Decentralized decision-making supply chain2621.12512
Table 4. Comparative analysis of simulation results.
AlgorithmSimulation Experiment Results
The Optimal ValueWorst ValueAverage ValueCalculating TimeSearch Success RateAverage Search Iterations
Standard genetic algorithm0.8030.0920.6575.335%56.31
Tabu search algorithm0.7910.1130.7064.731%27.32
Multilevel genetic algorithm0.8130.1460.7566.949%35.37
Publisher’s Note: MDPI stays neutral with regard to jurisdictional claims in published maps and institutional affiliations.

