
Turning a 3D Printer into a HPLC Fraction Collector: A Tool for Compound-Specific Stable Isotope Measurements


Abstract
:
1. Introduction
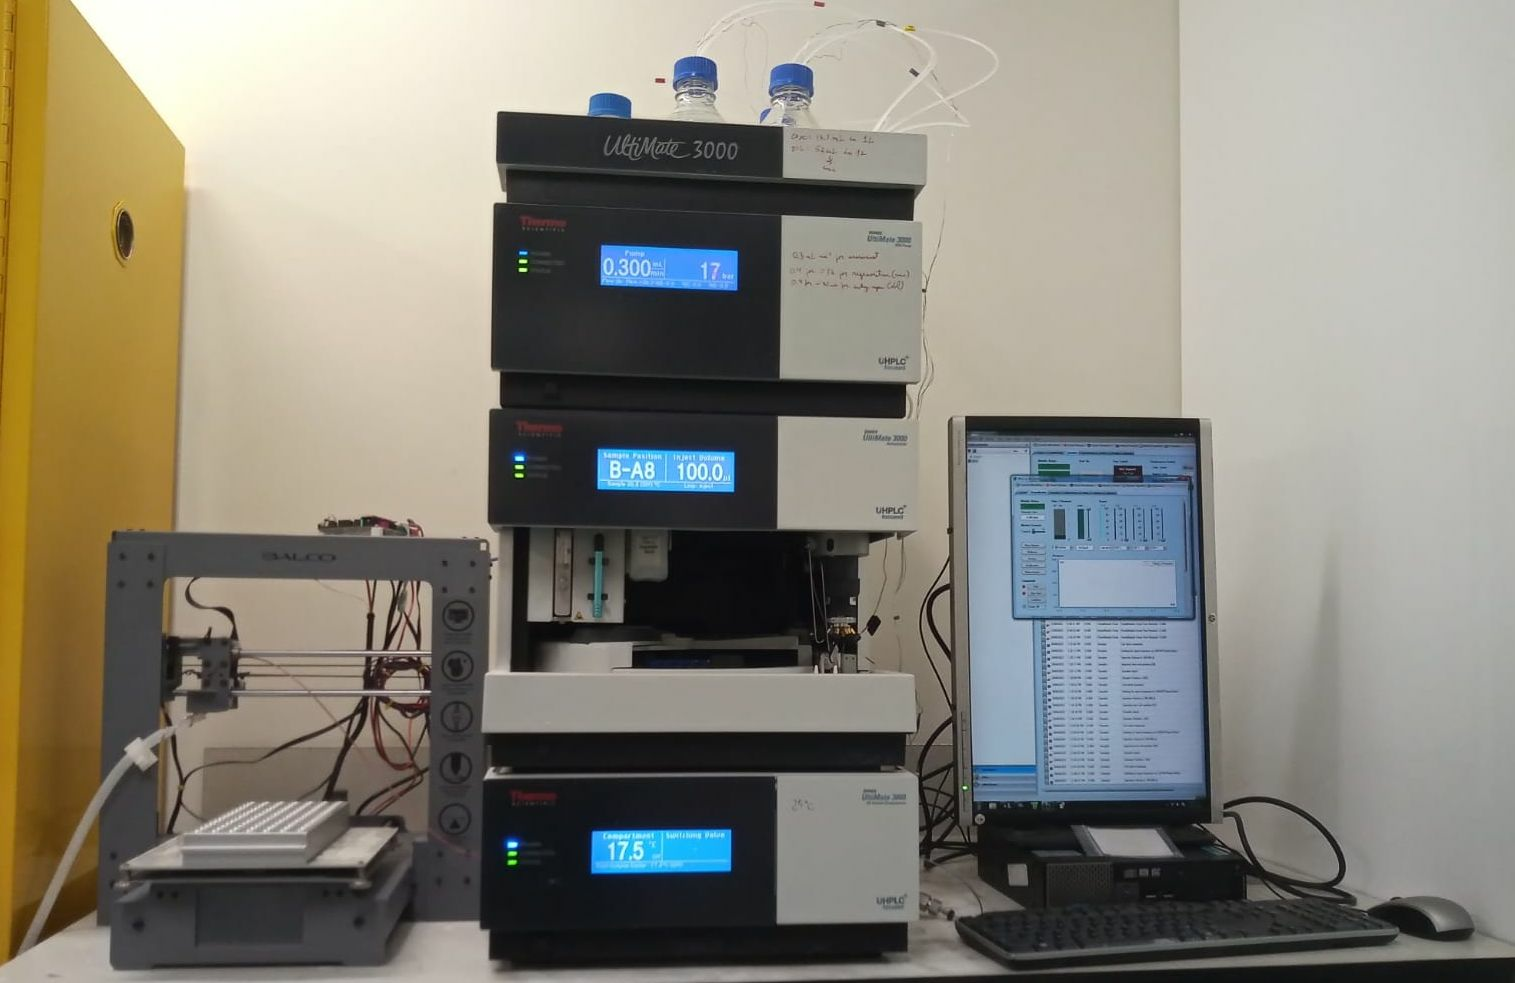
2. Design
2.1. Justification of the Design
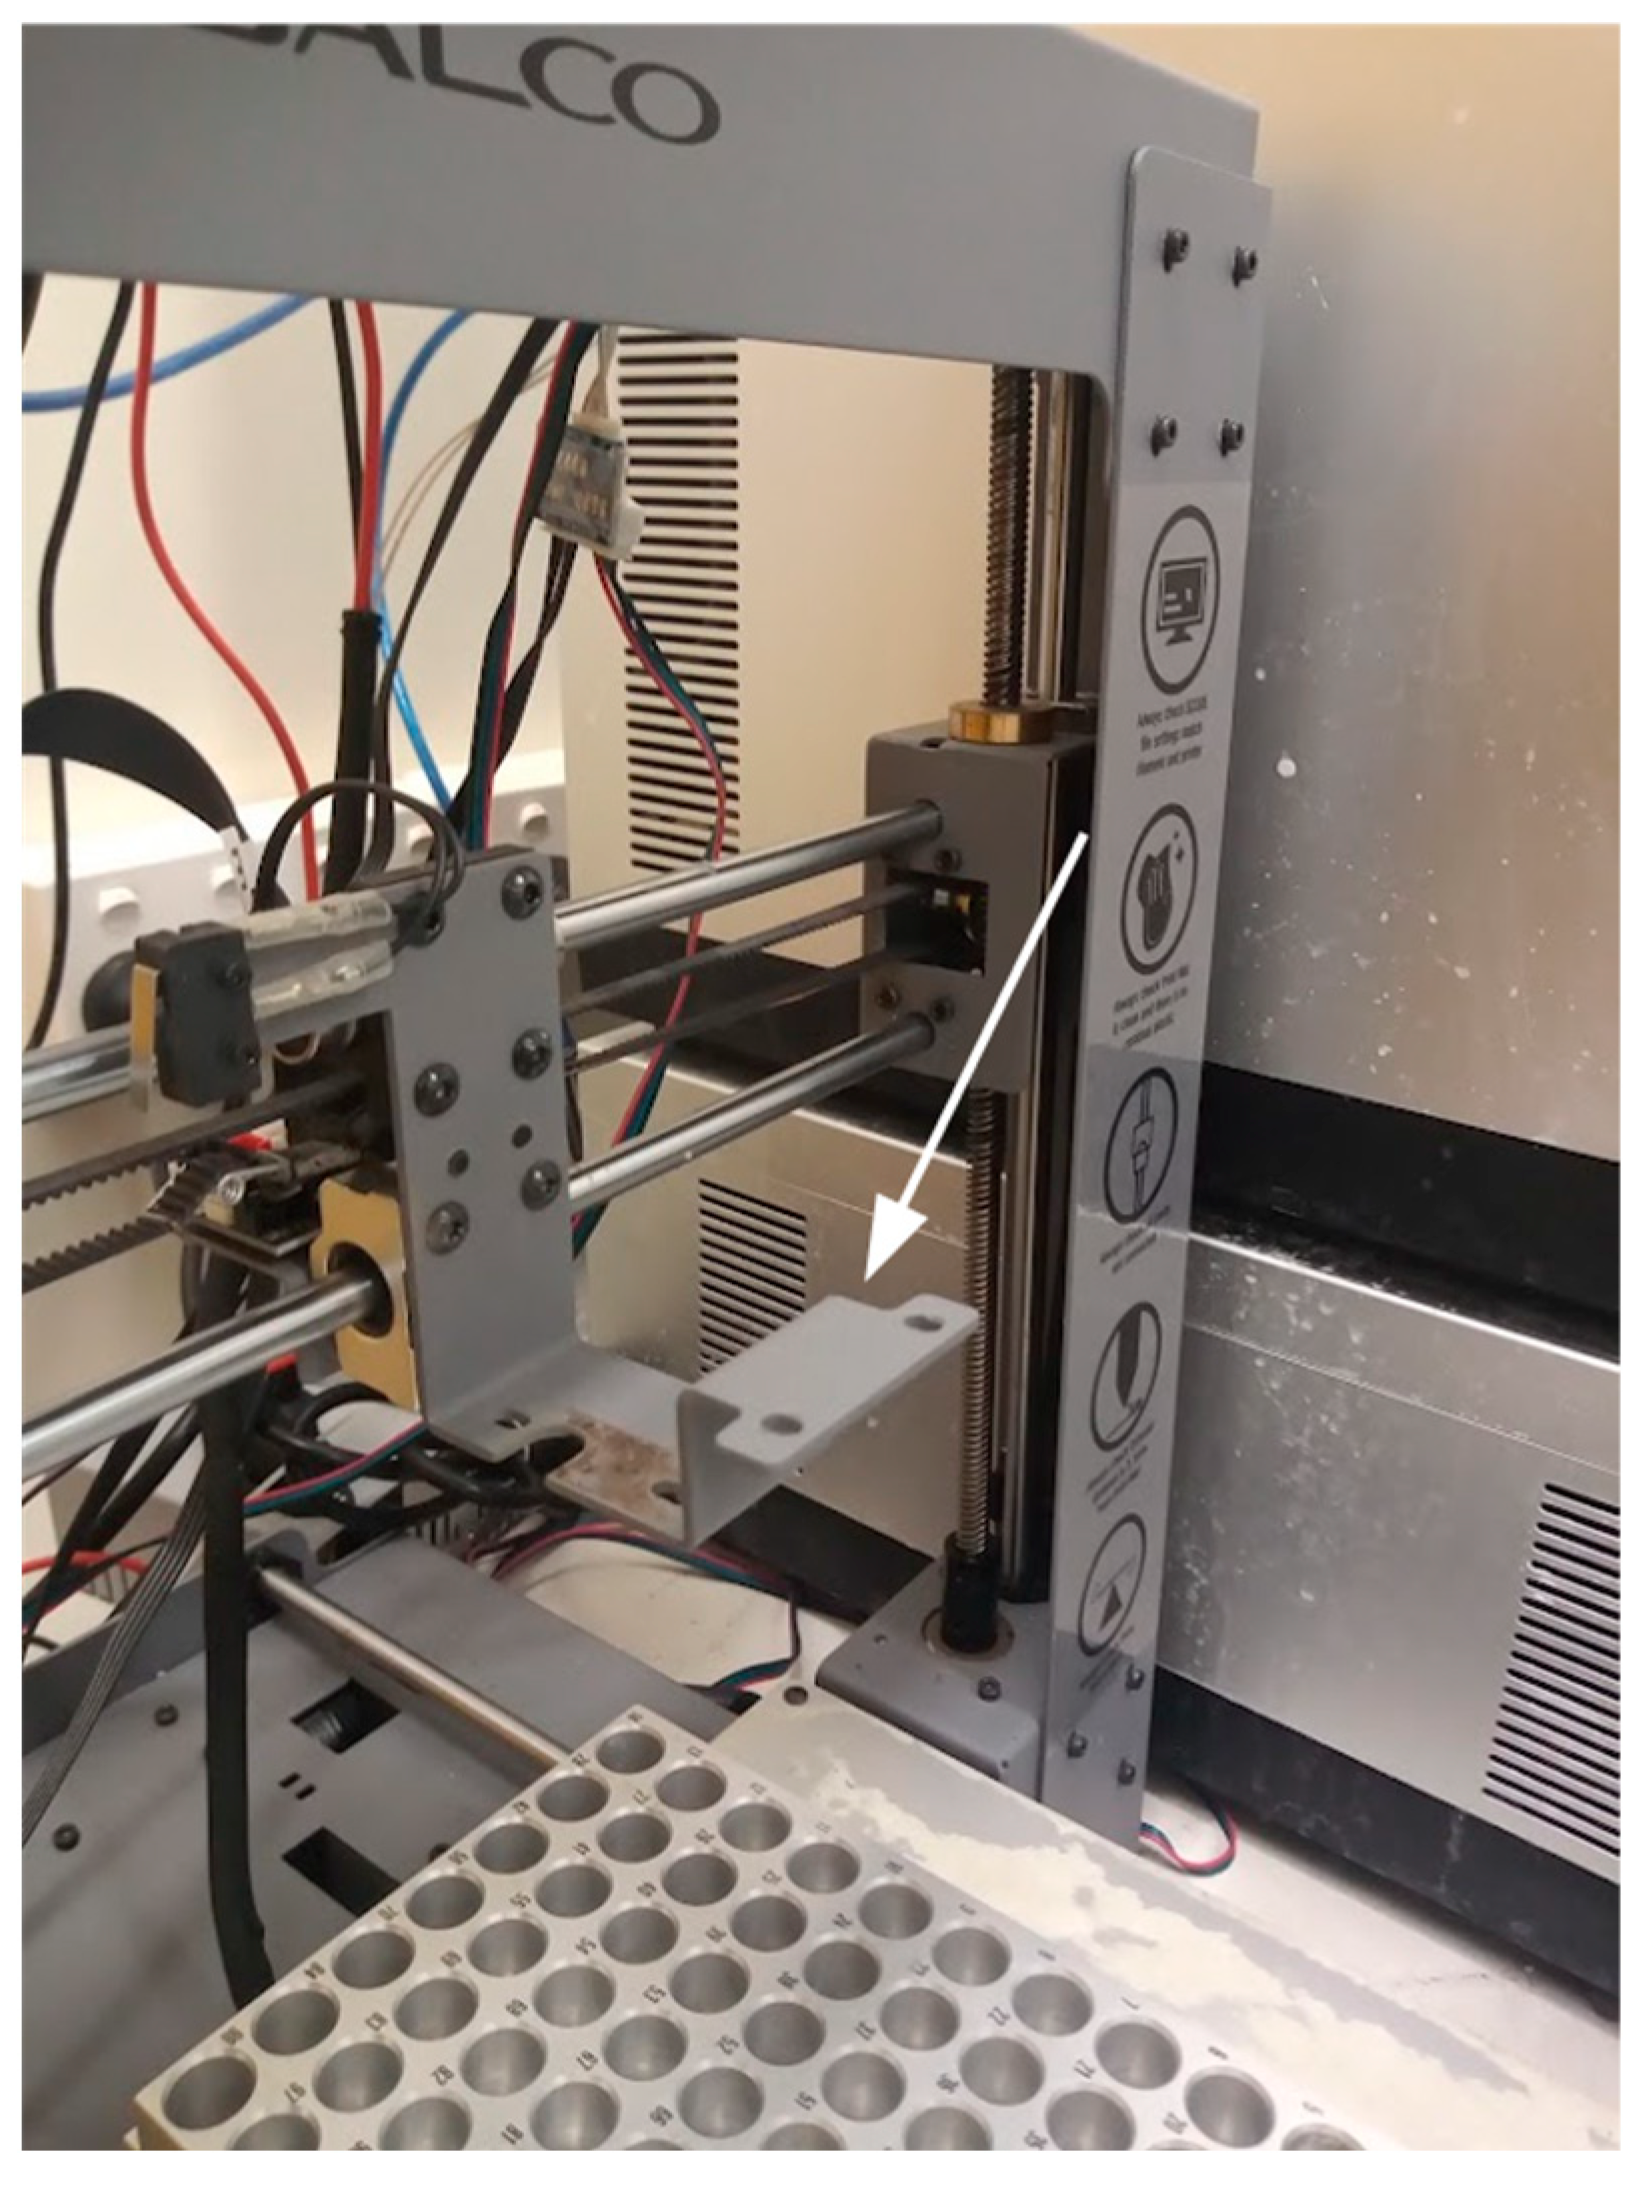
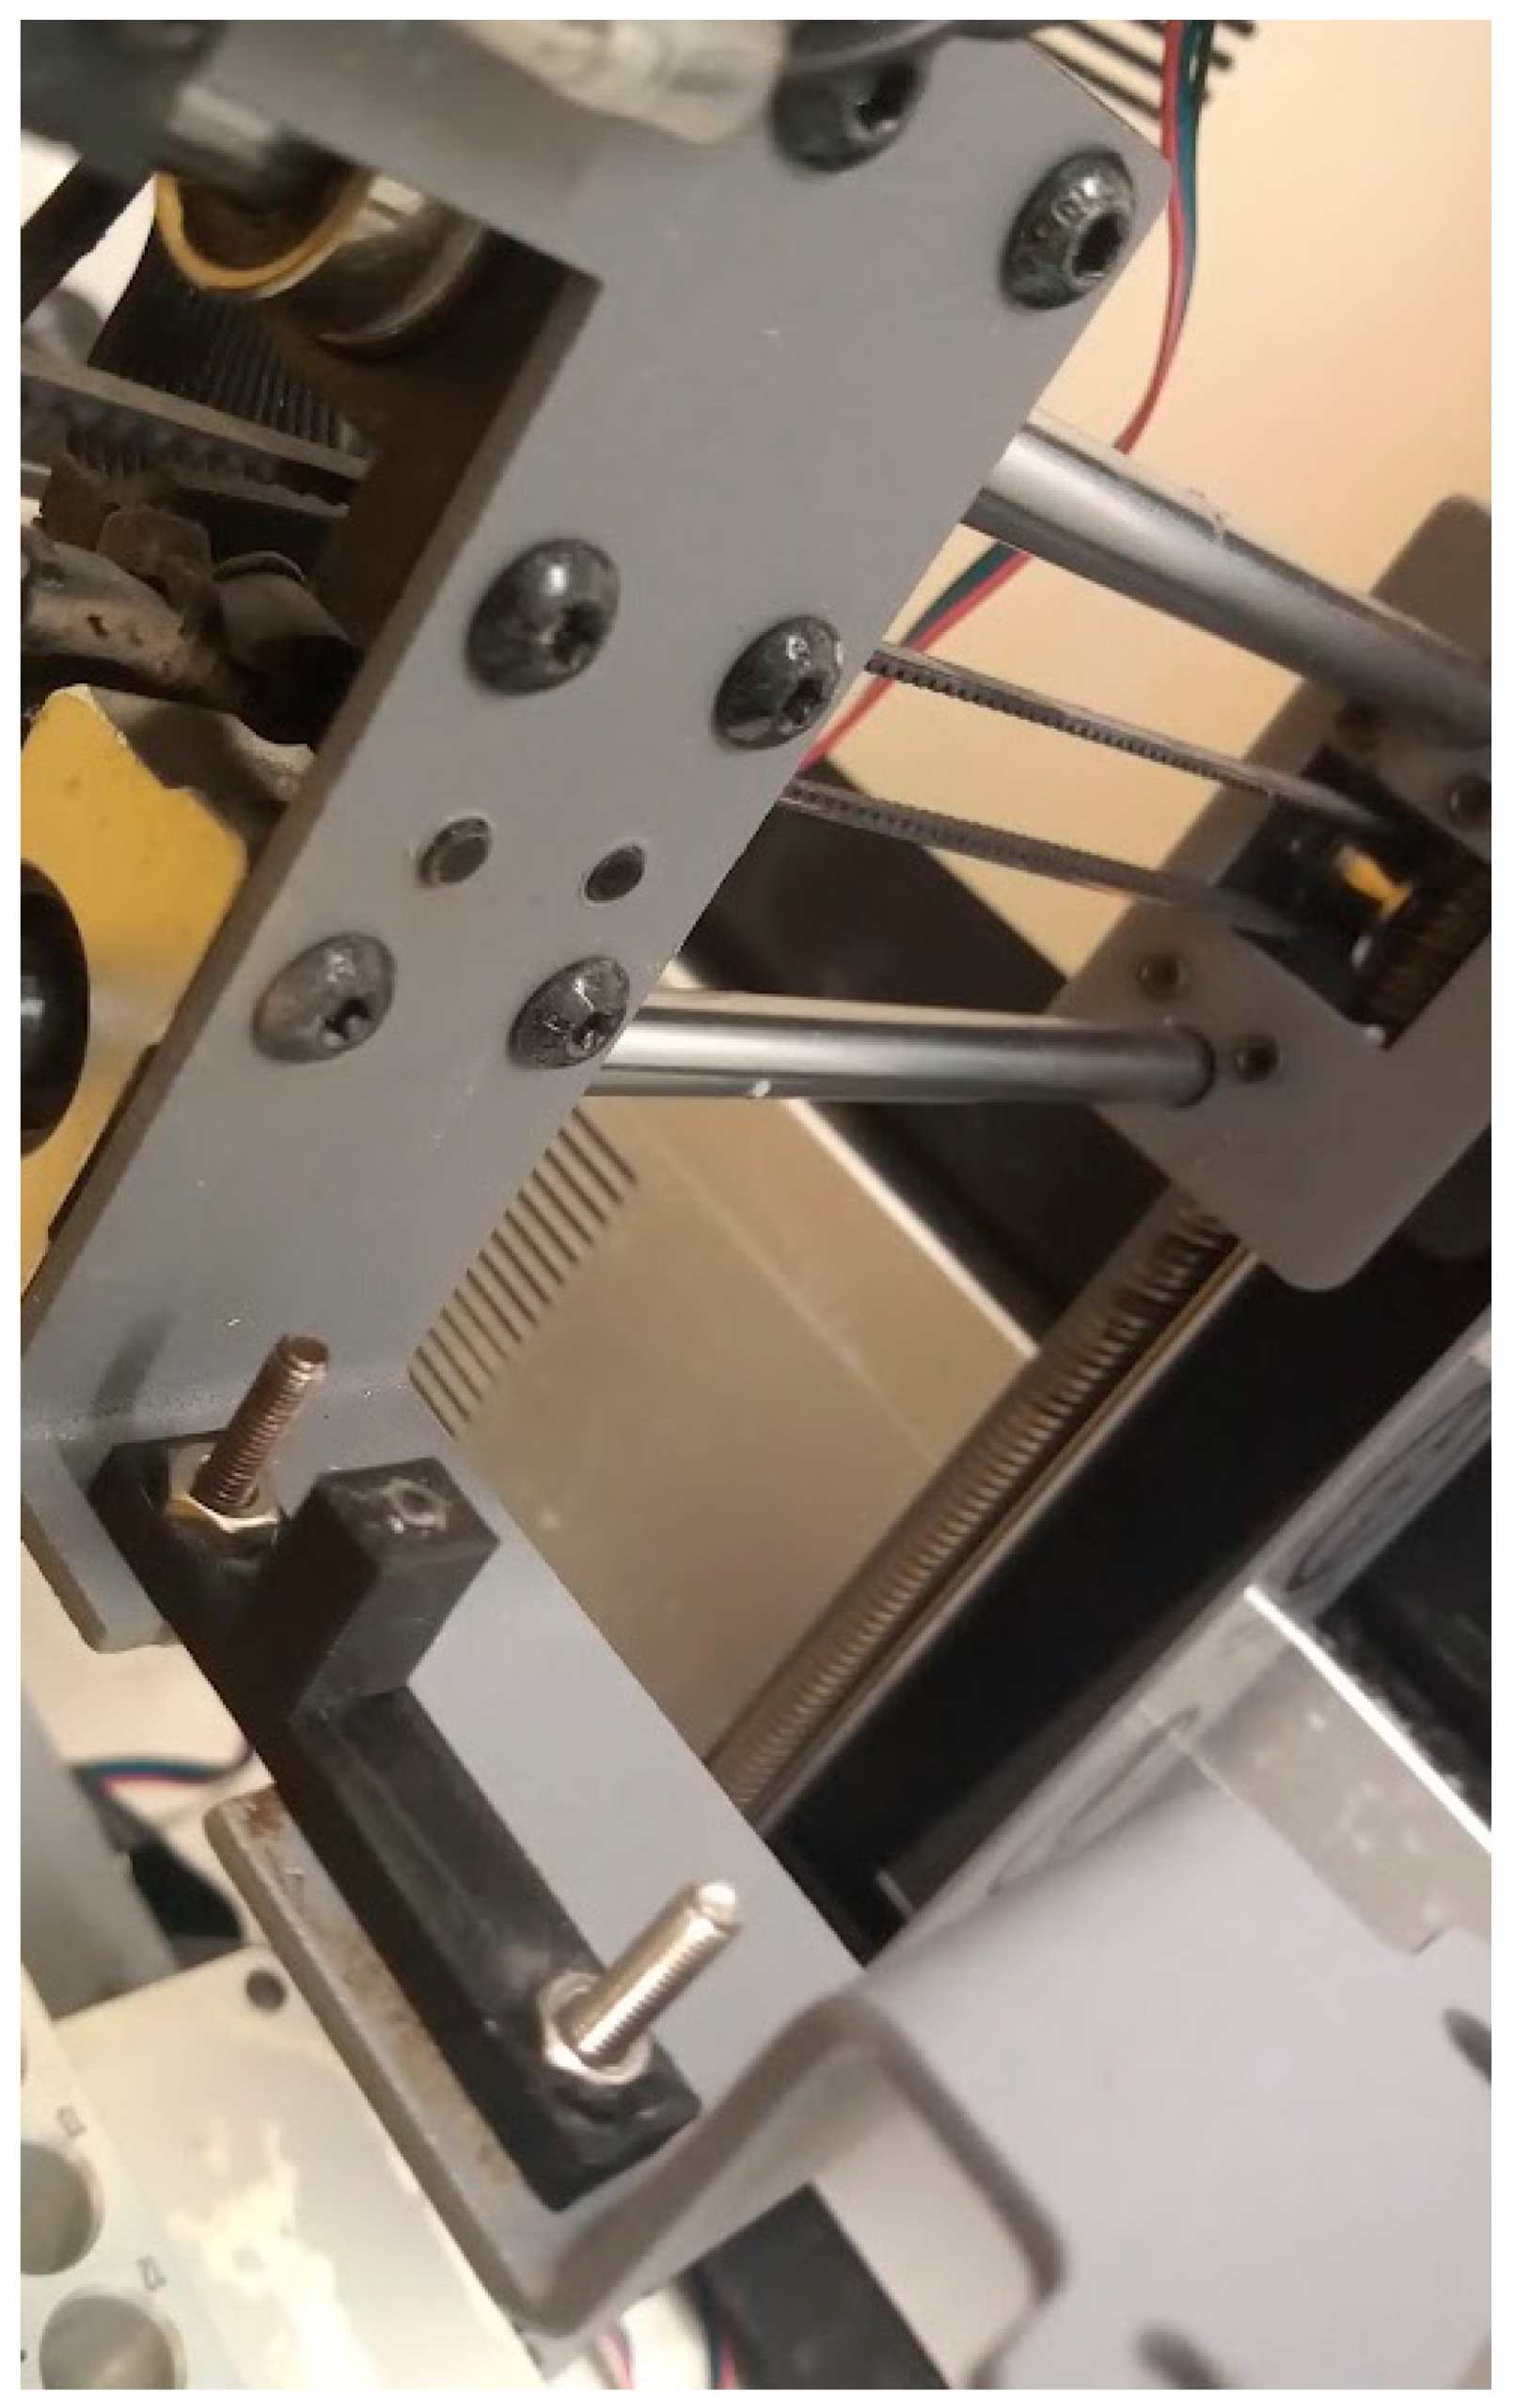
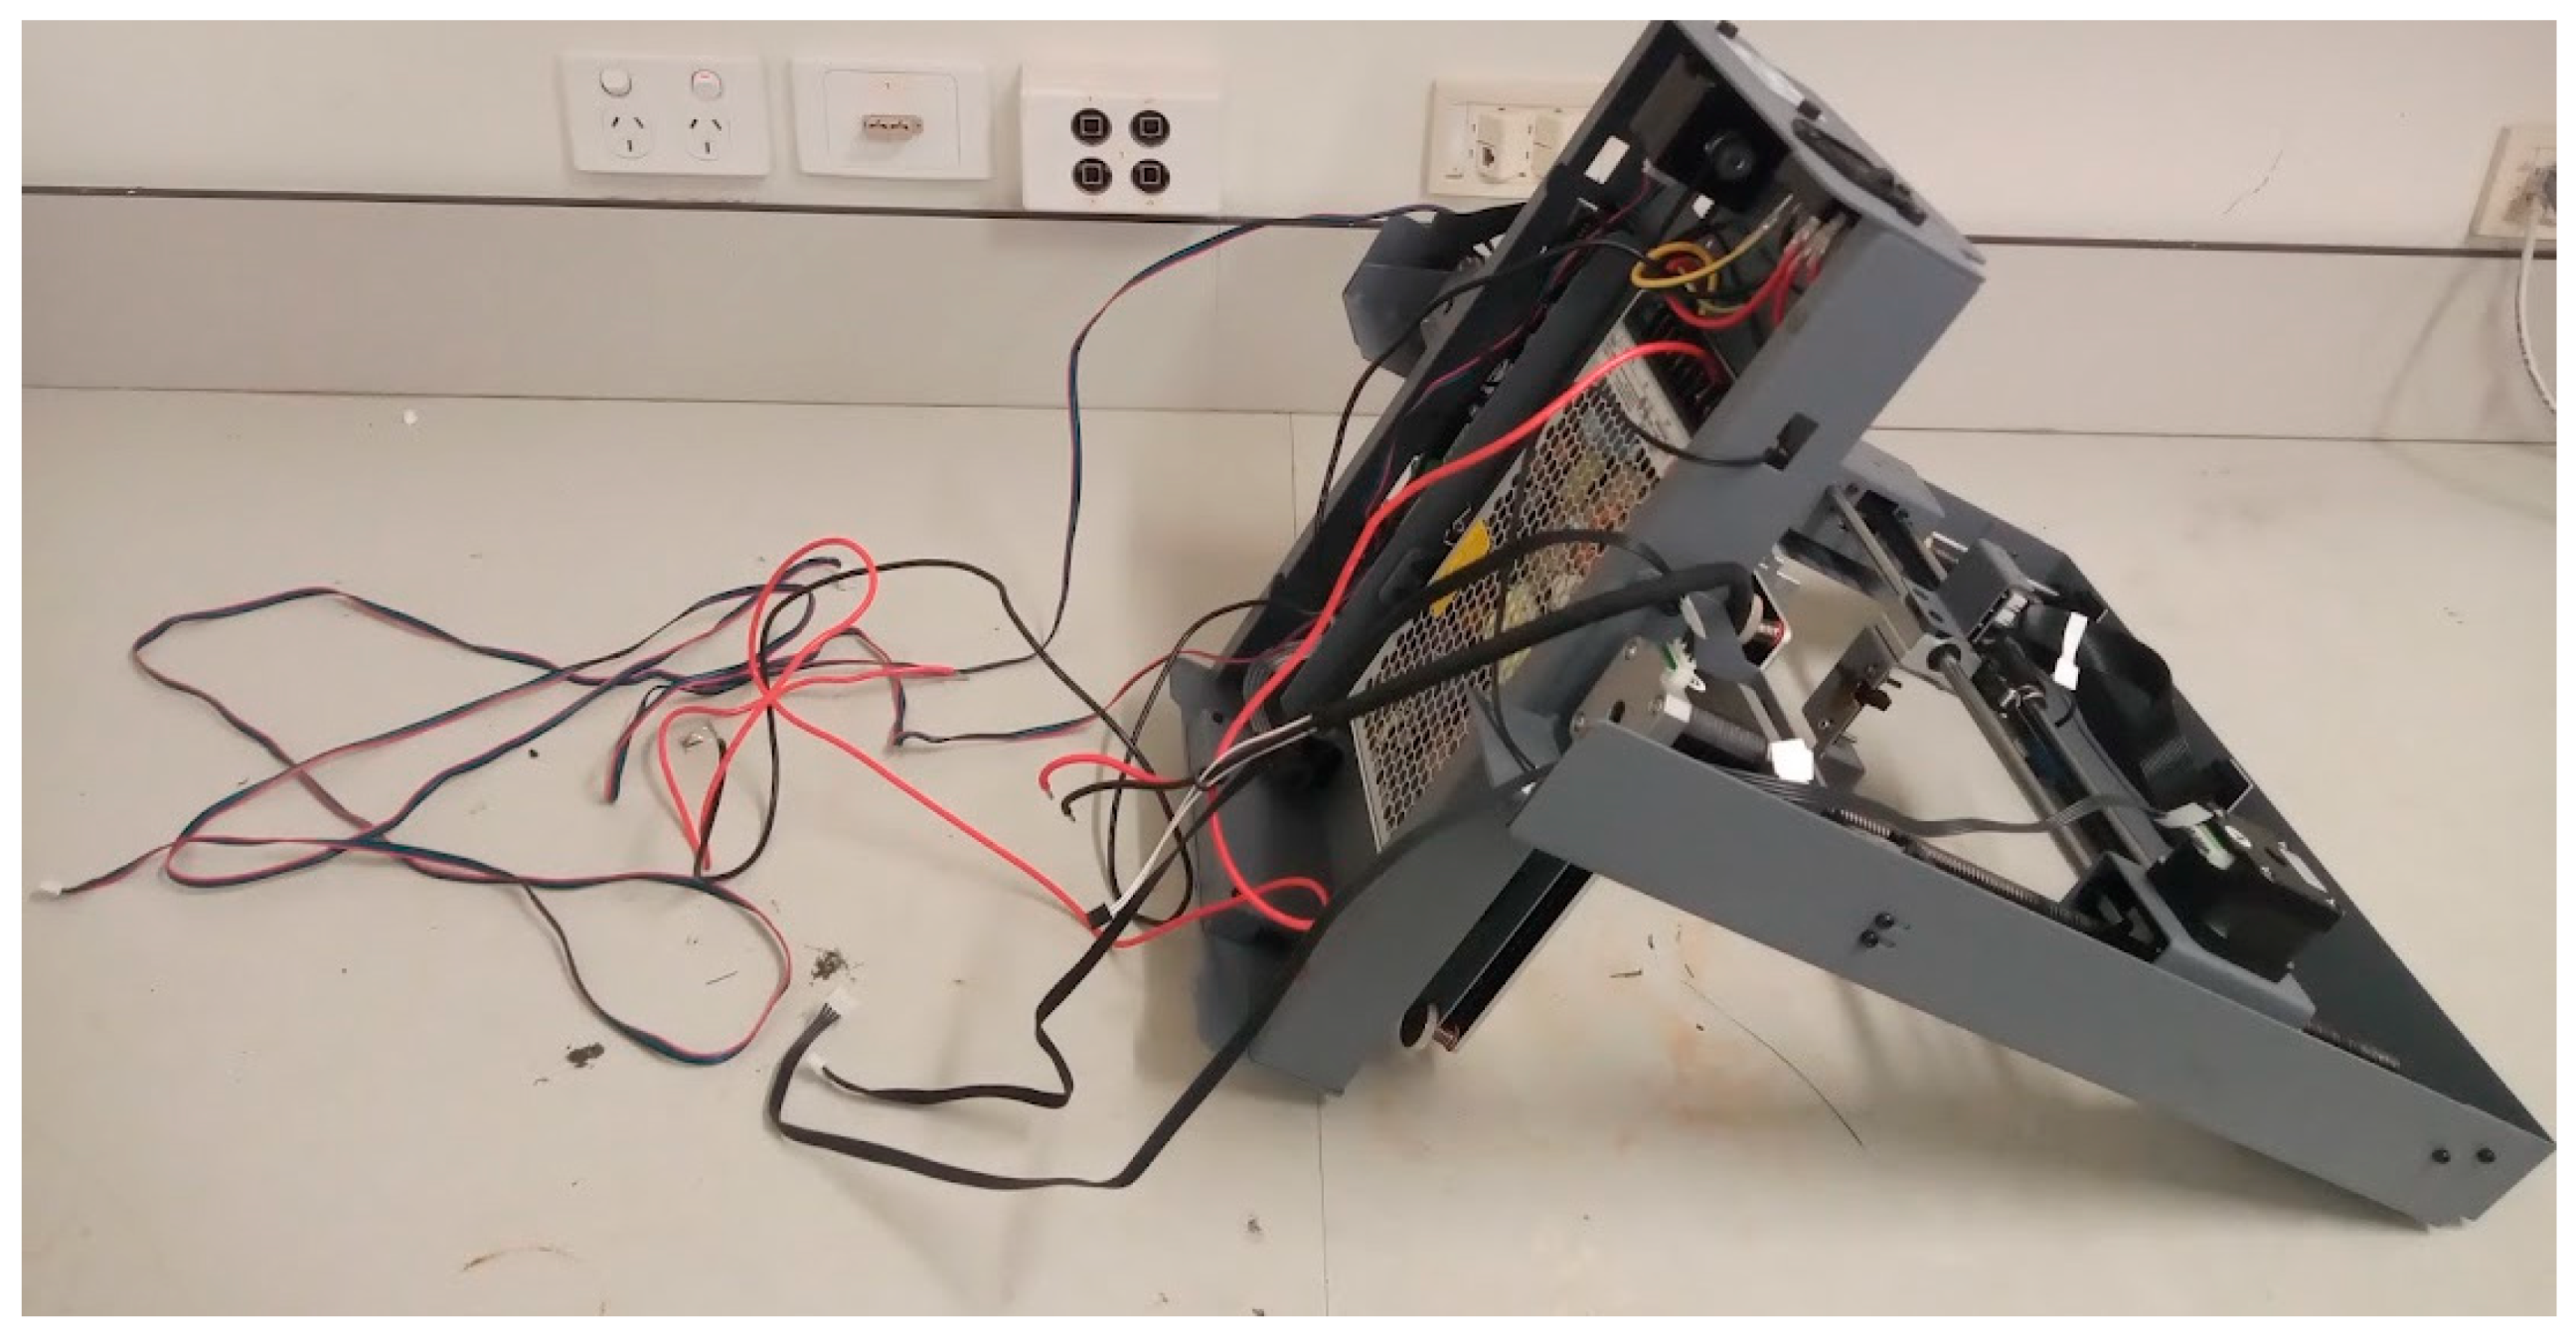
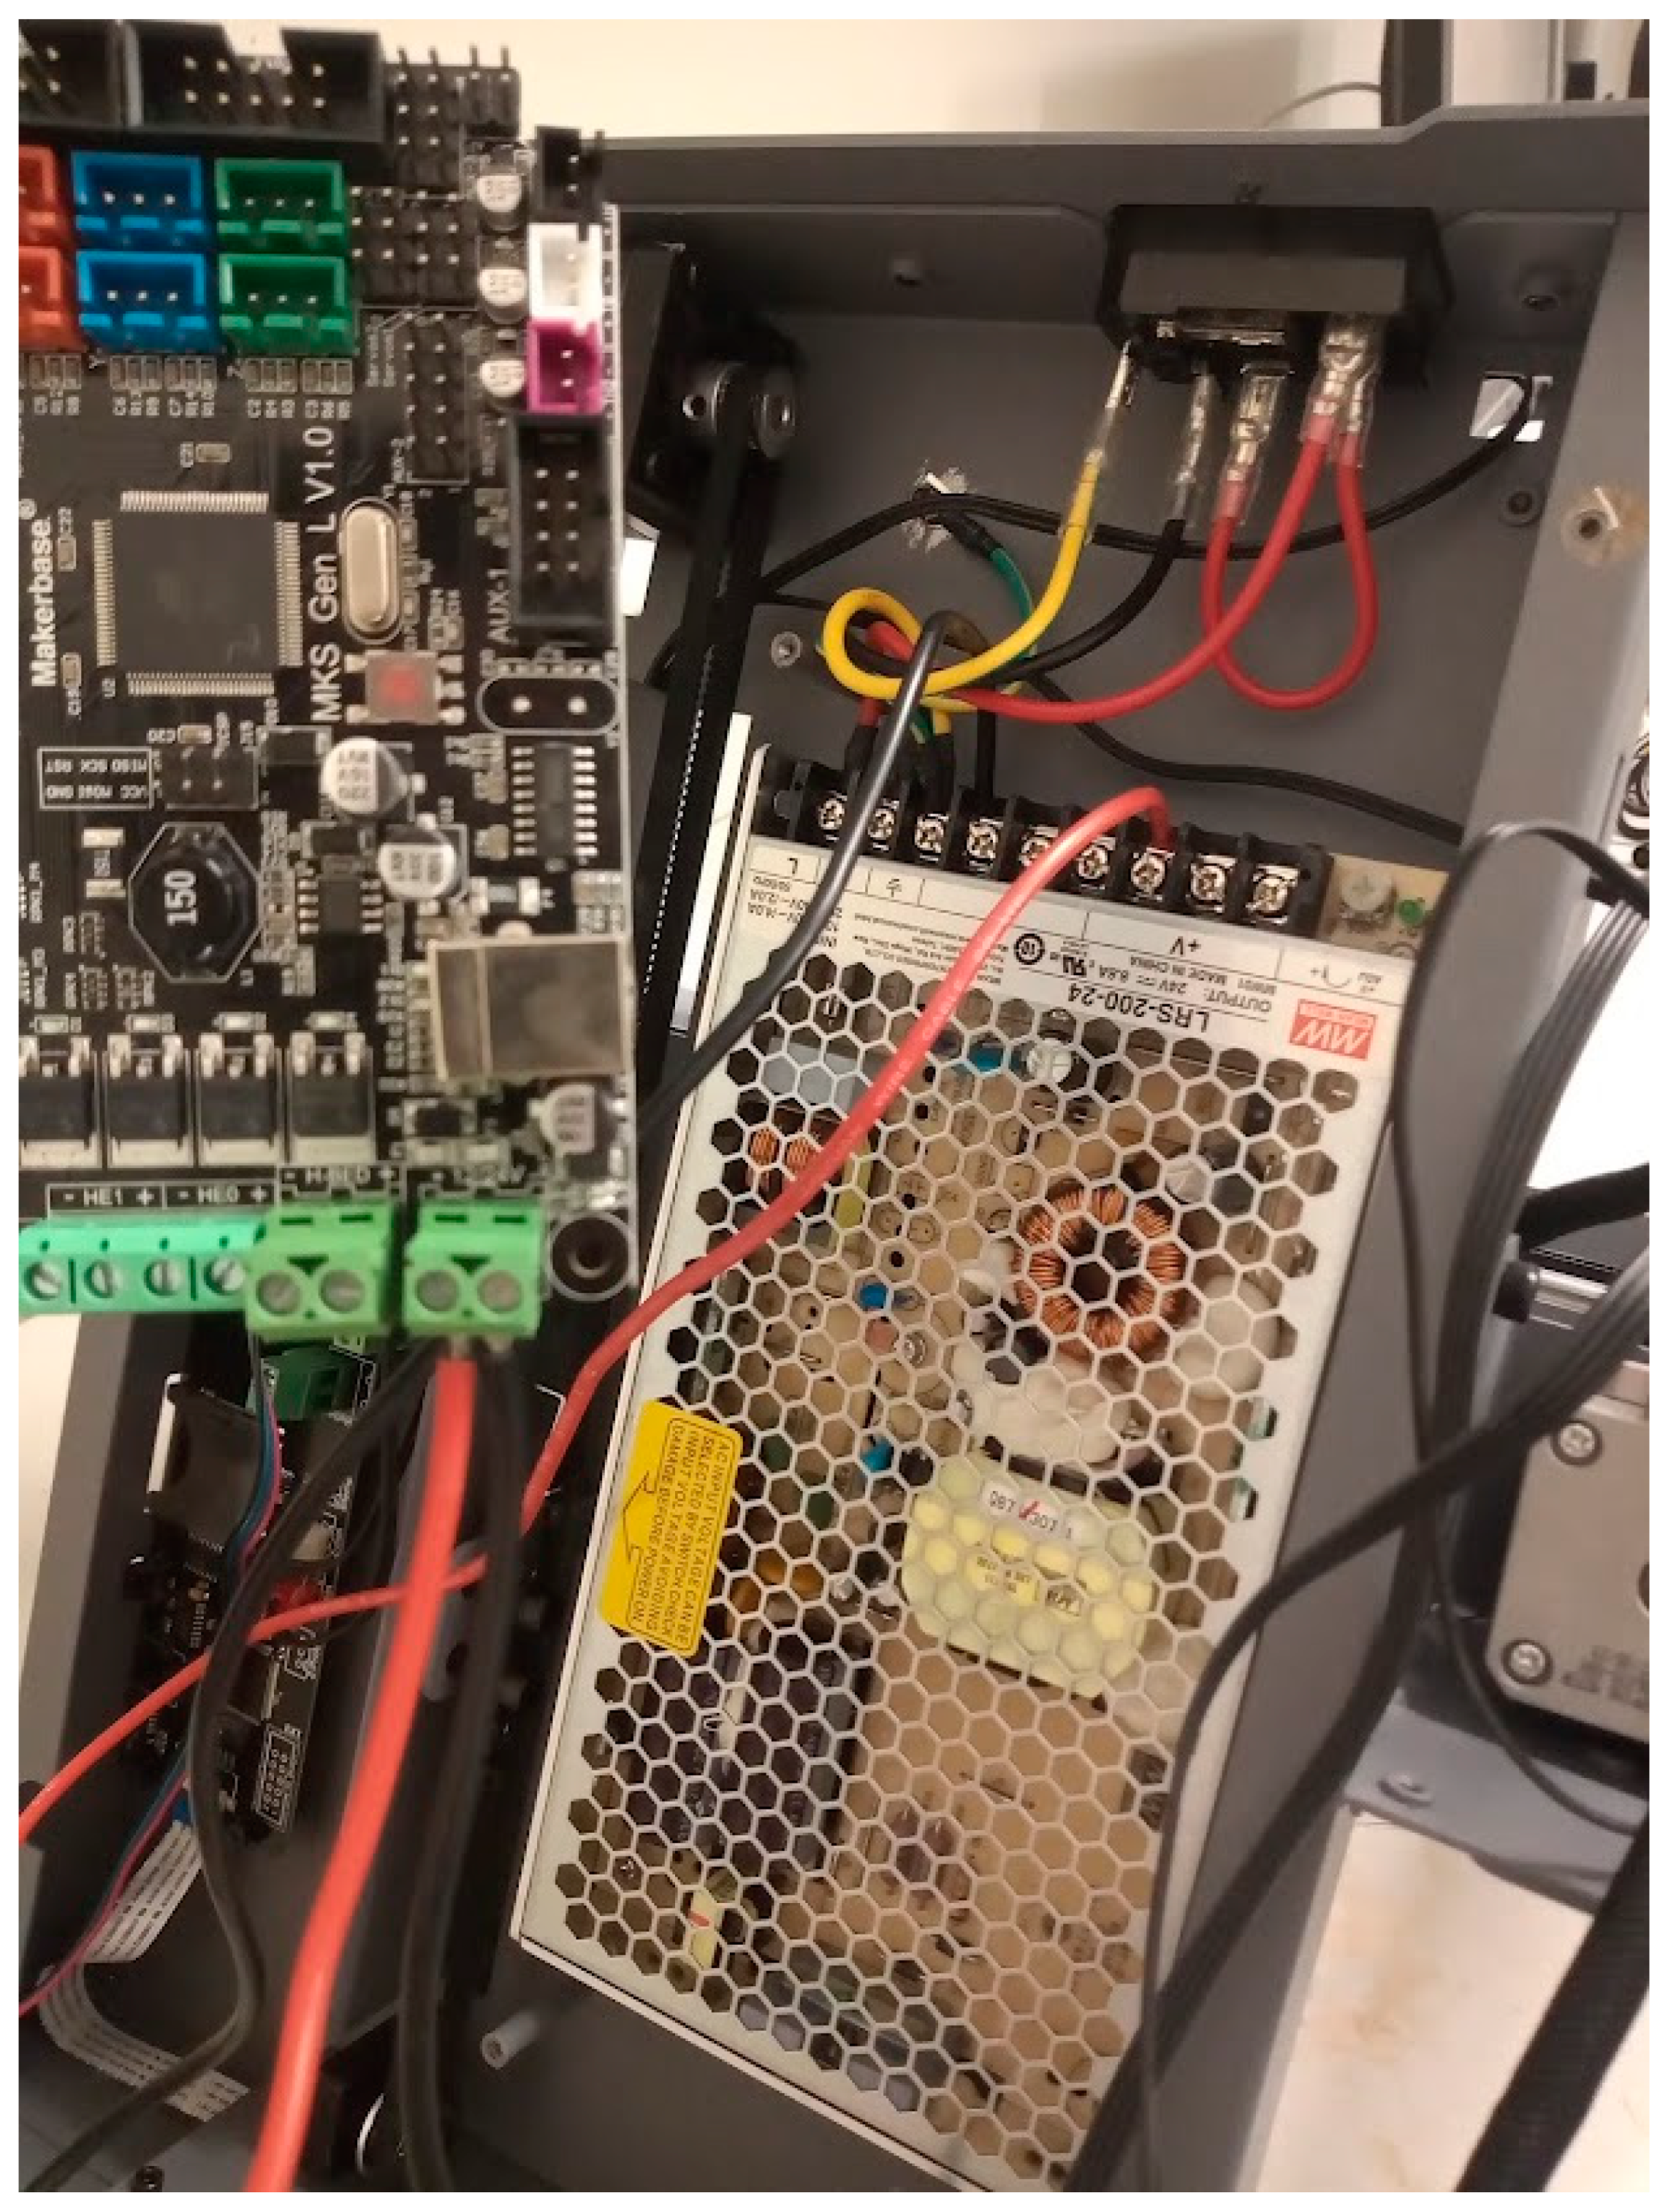
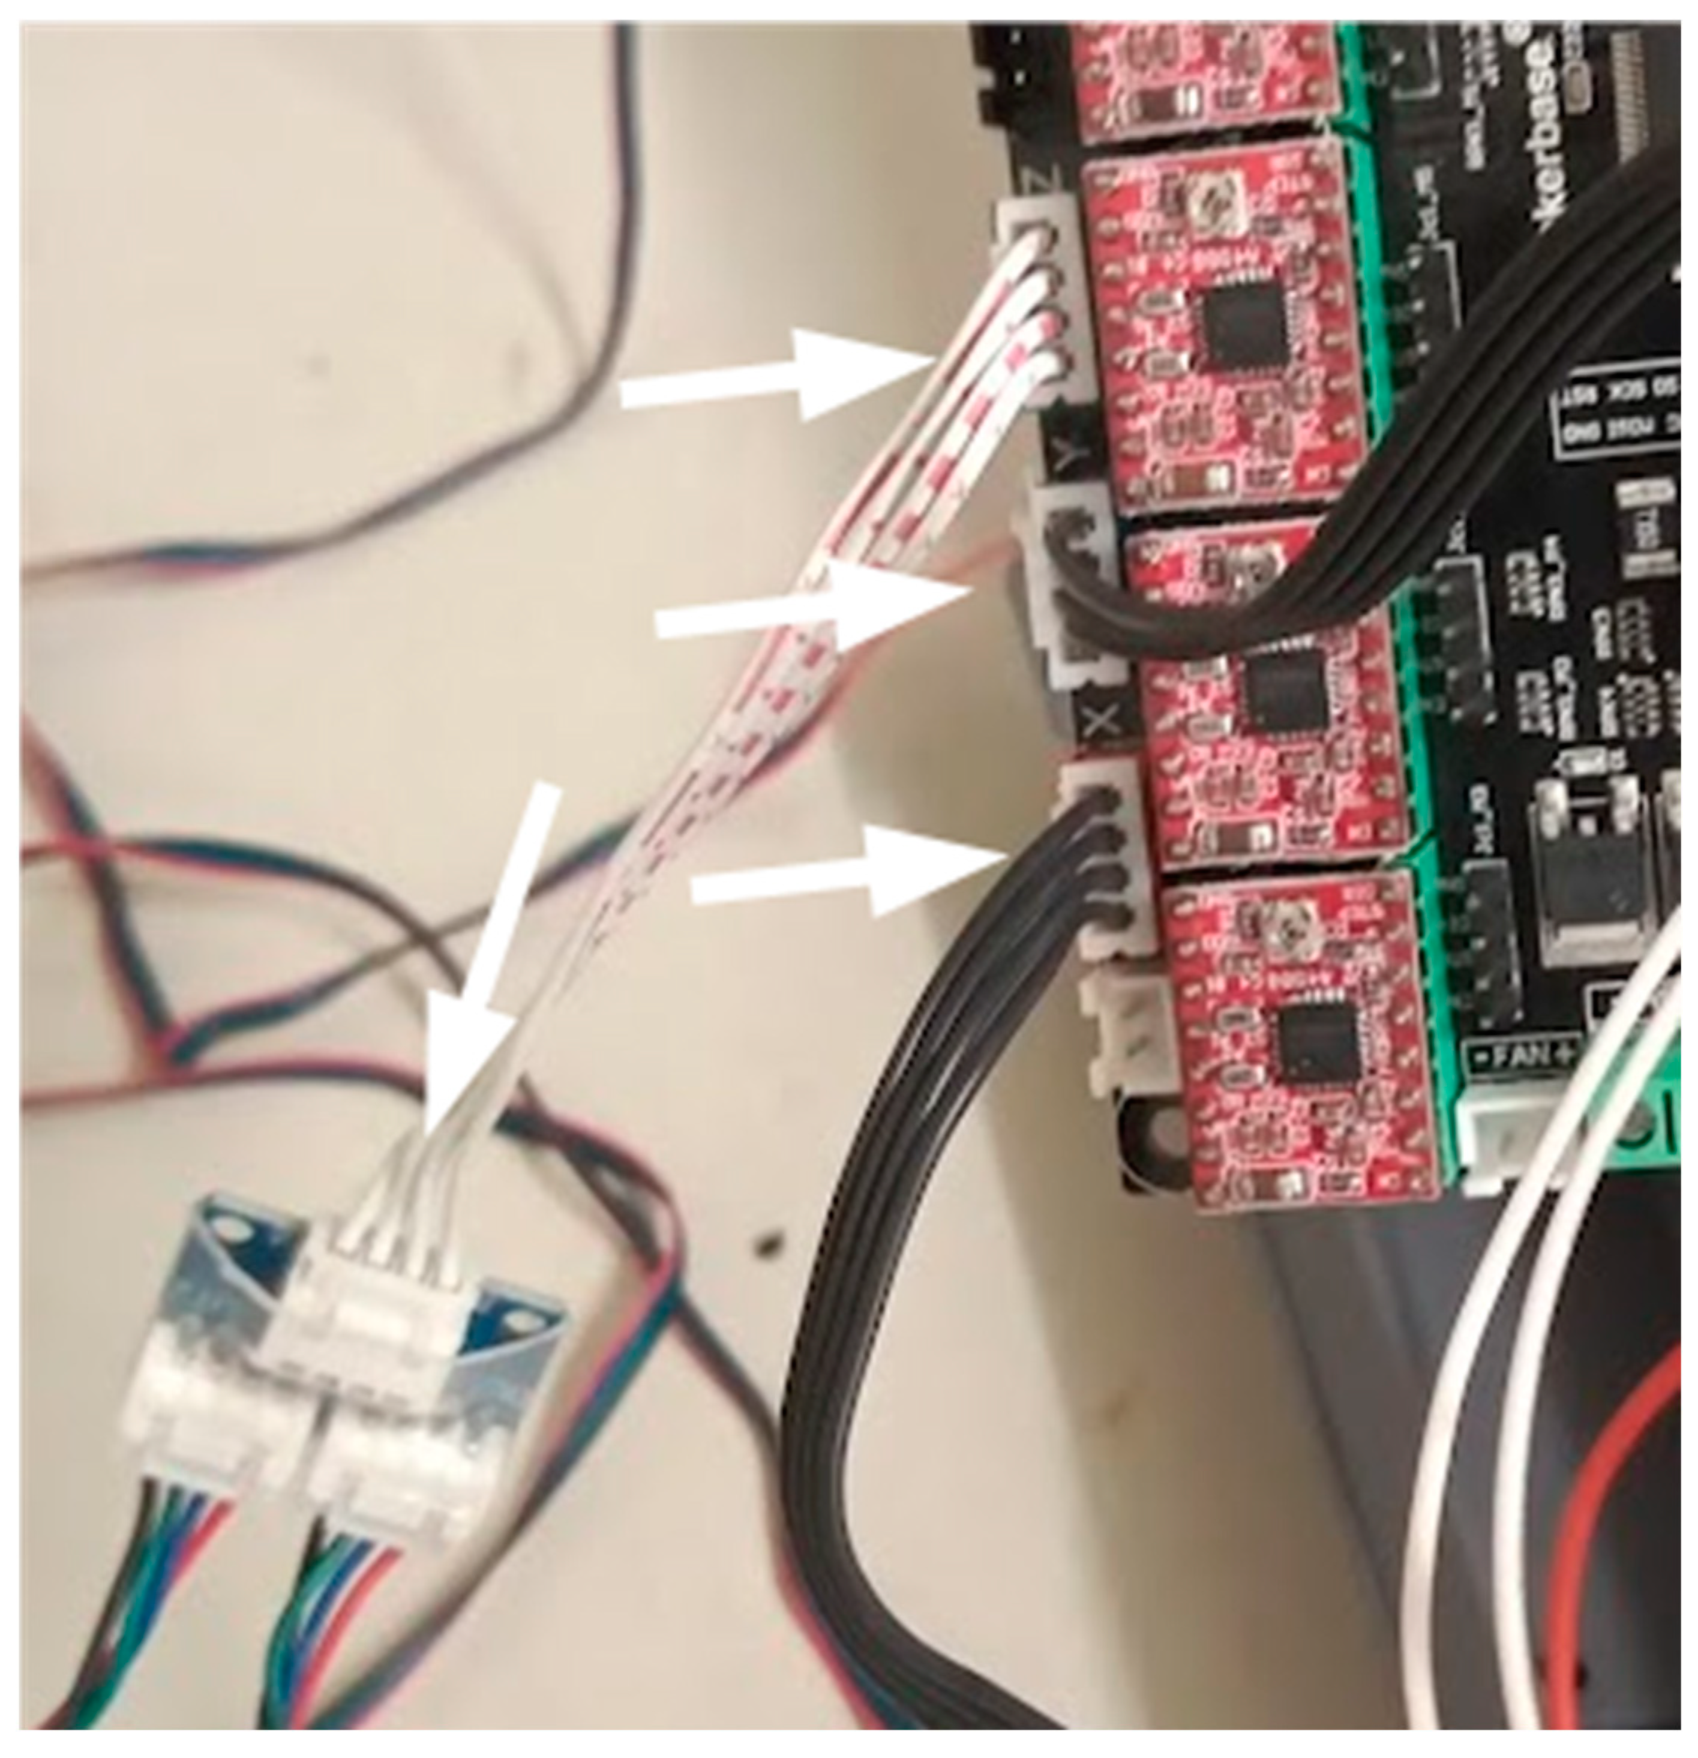
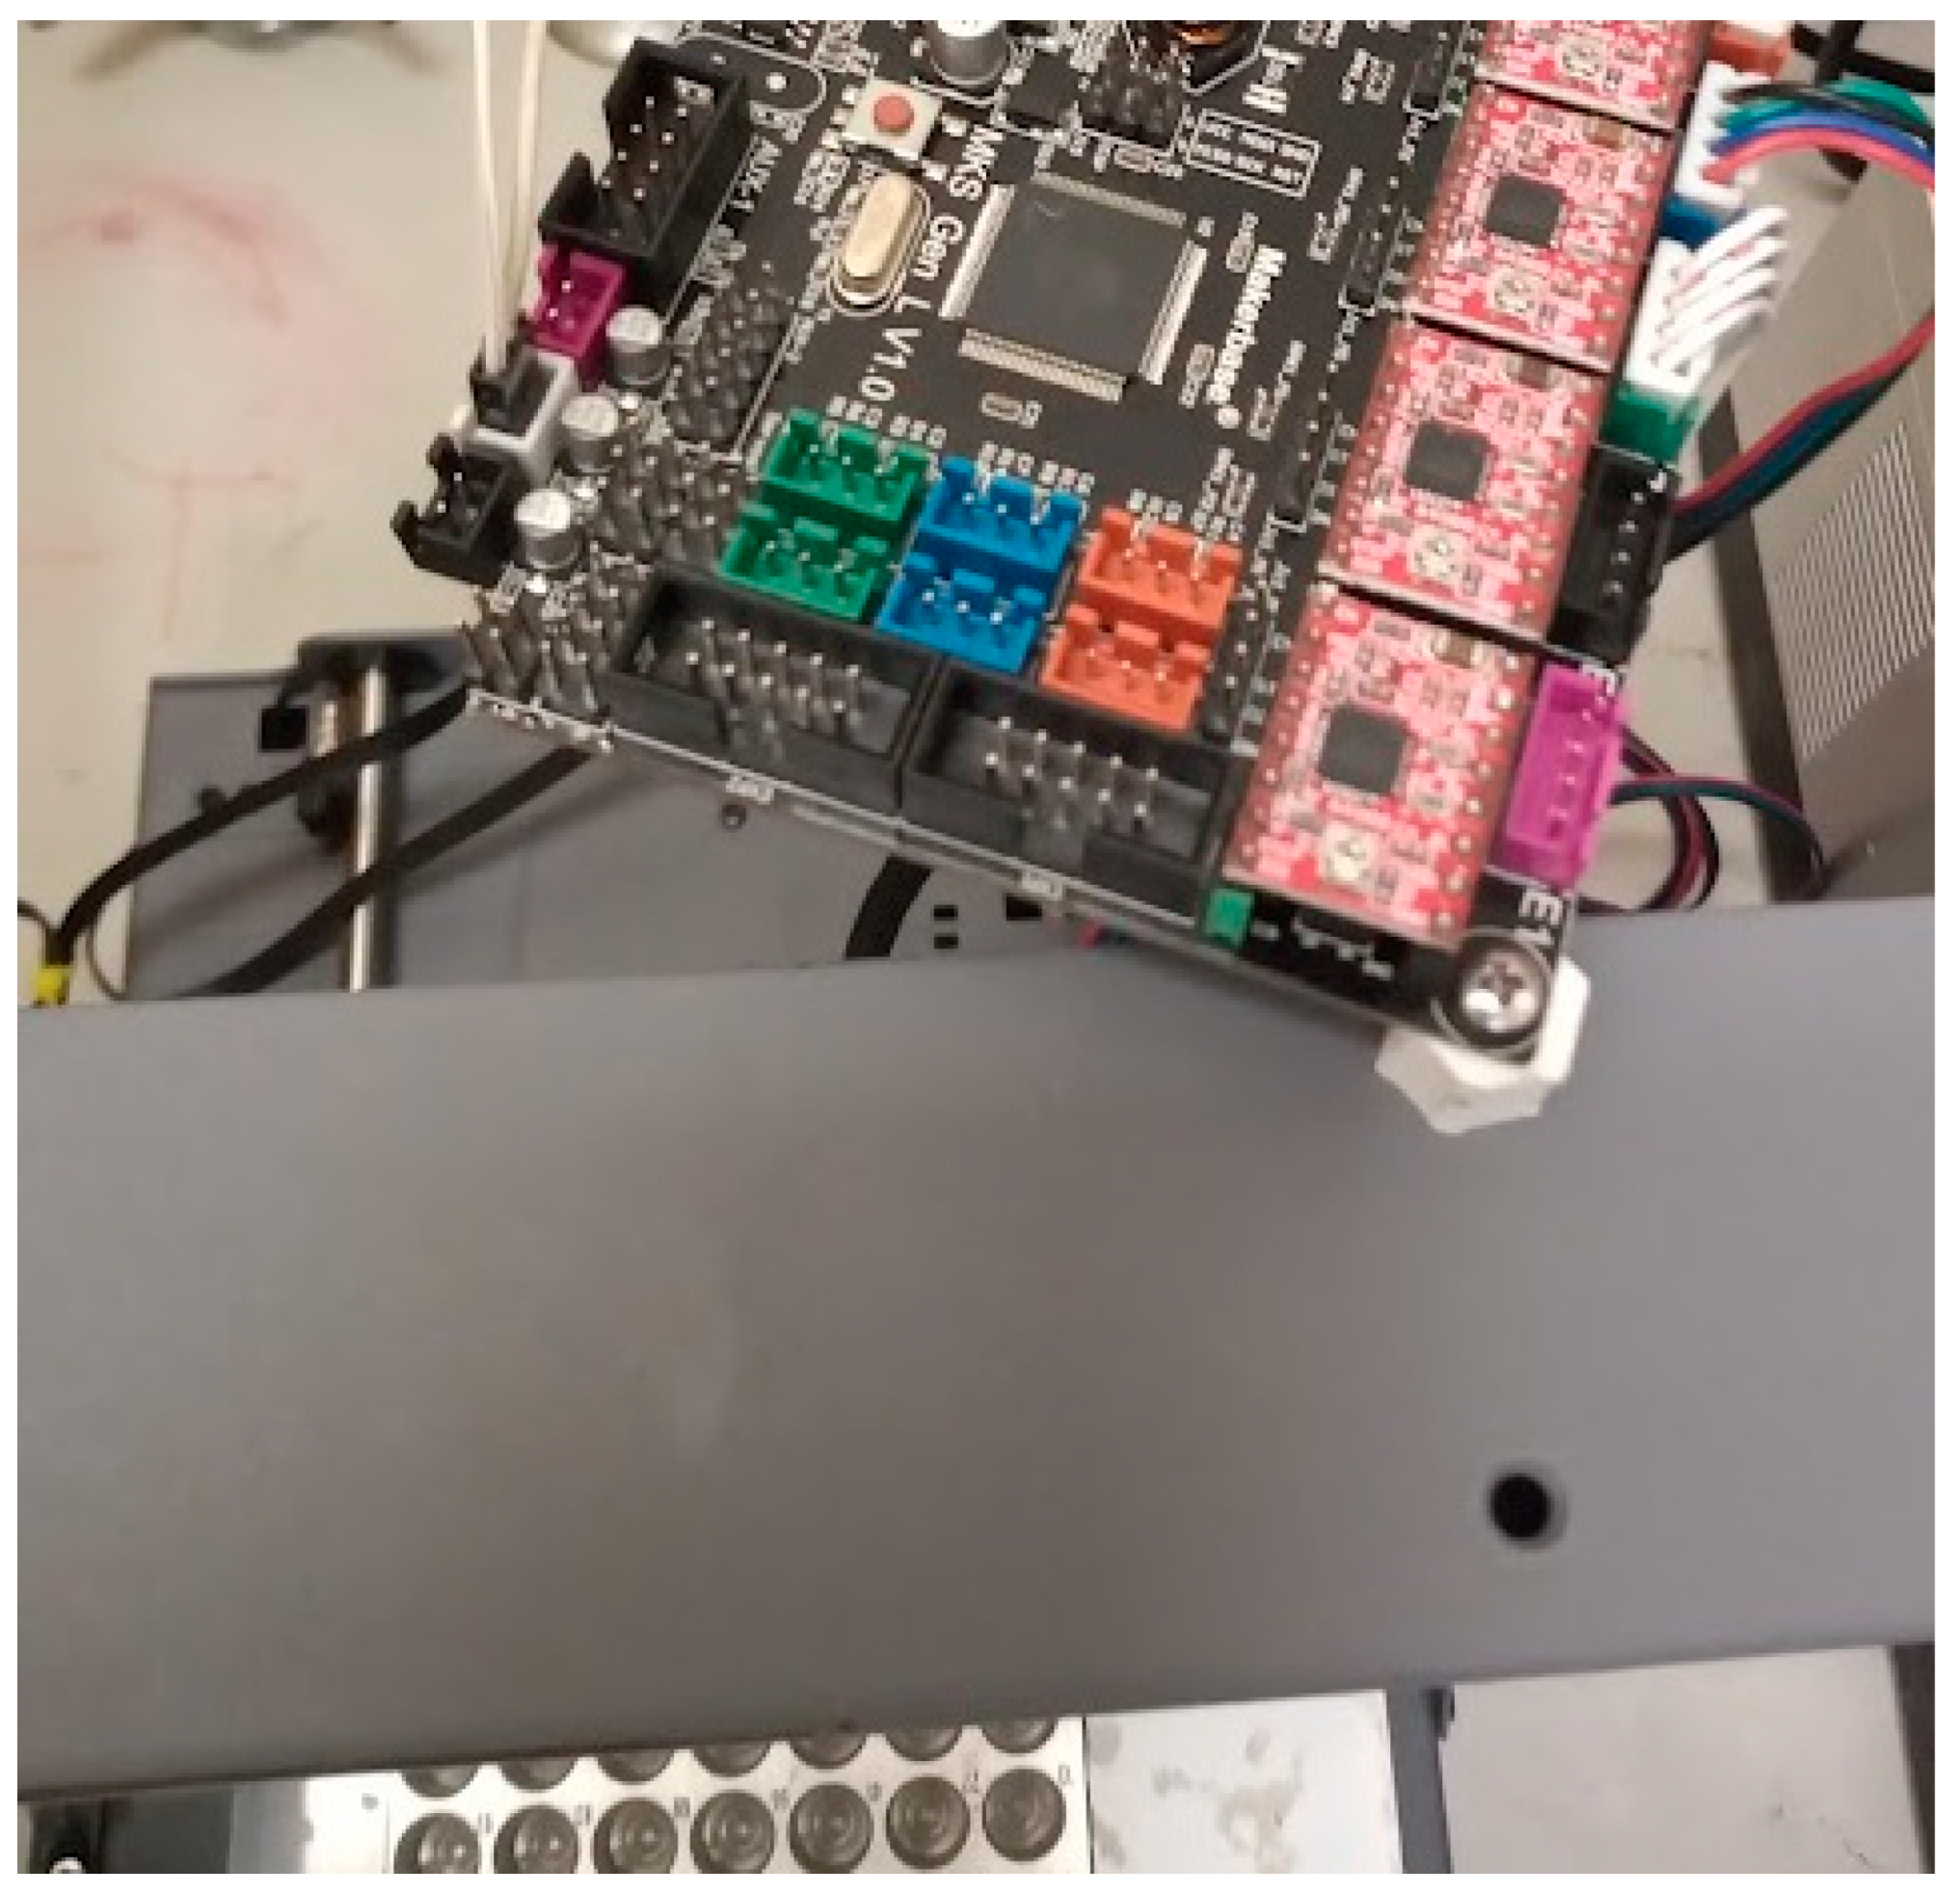
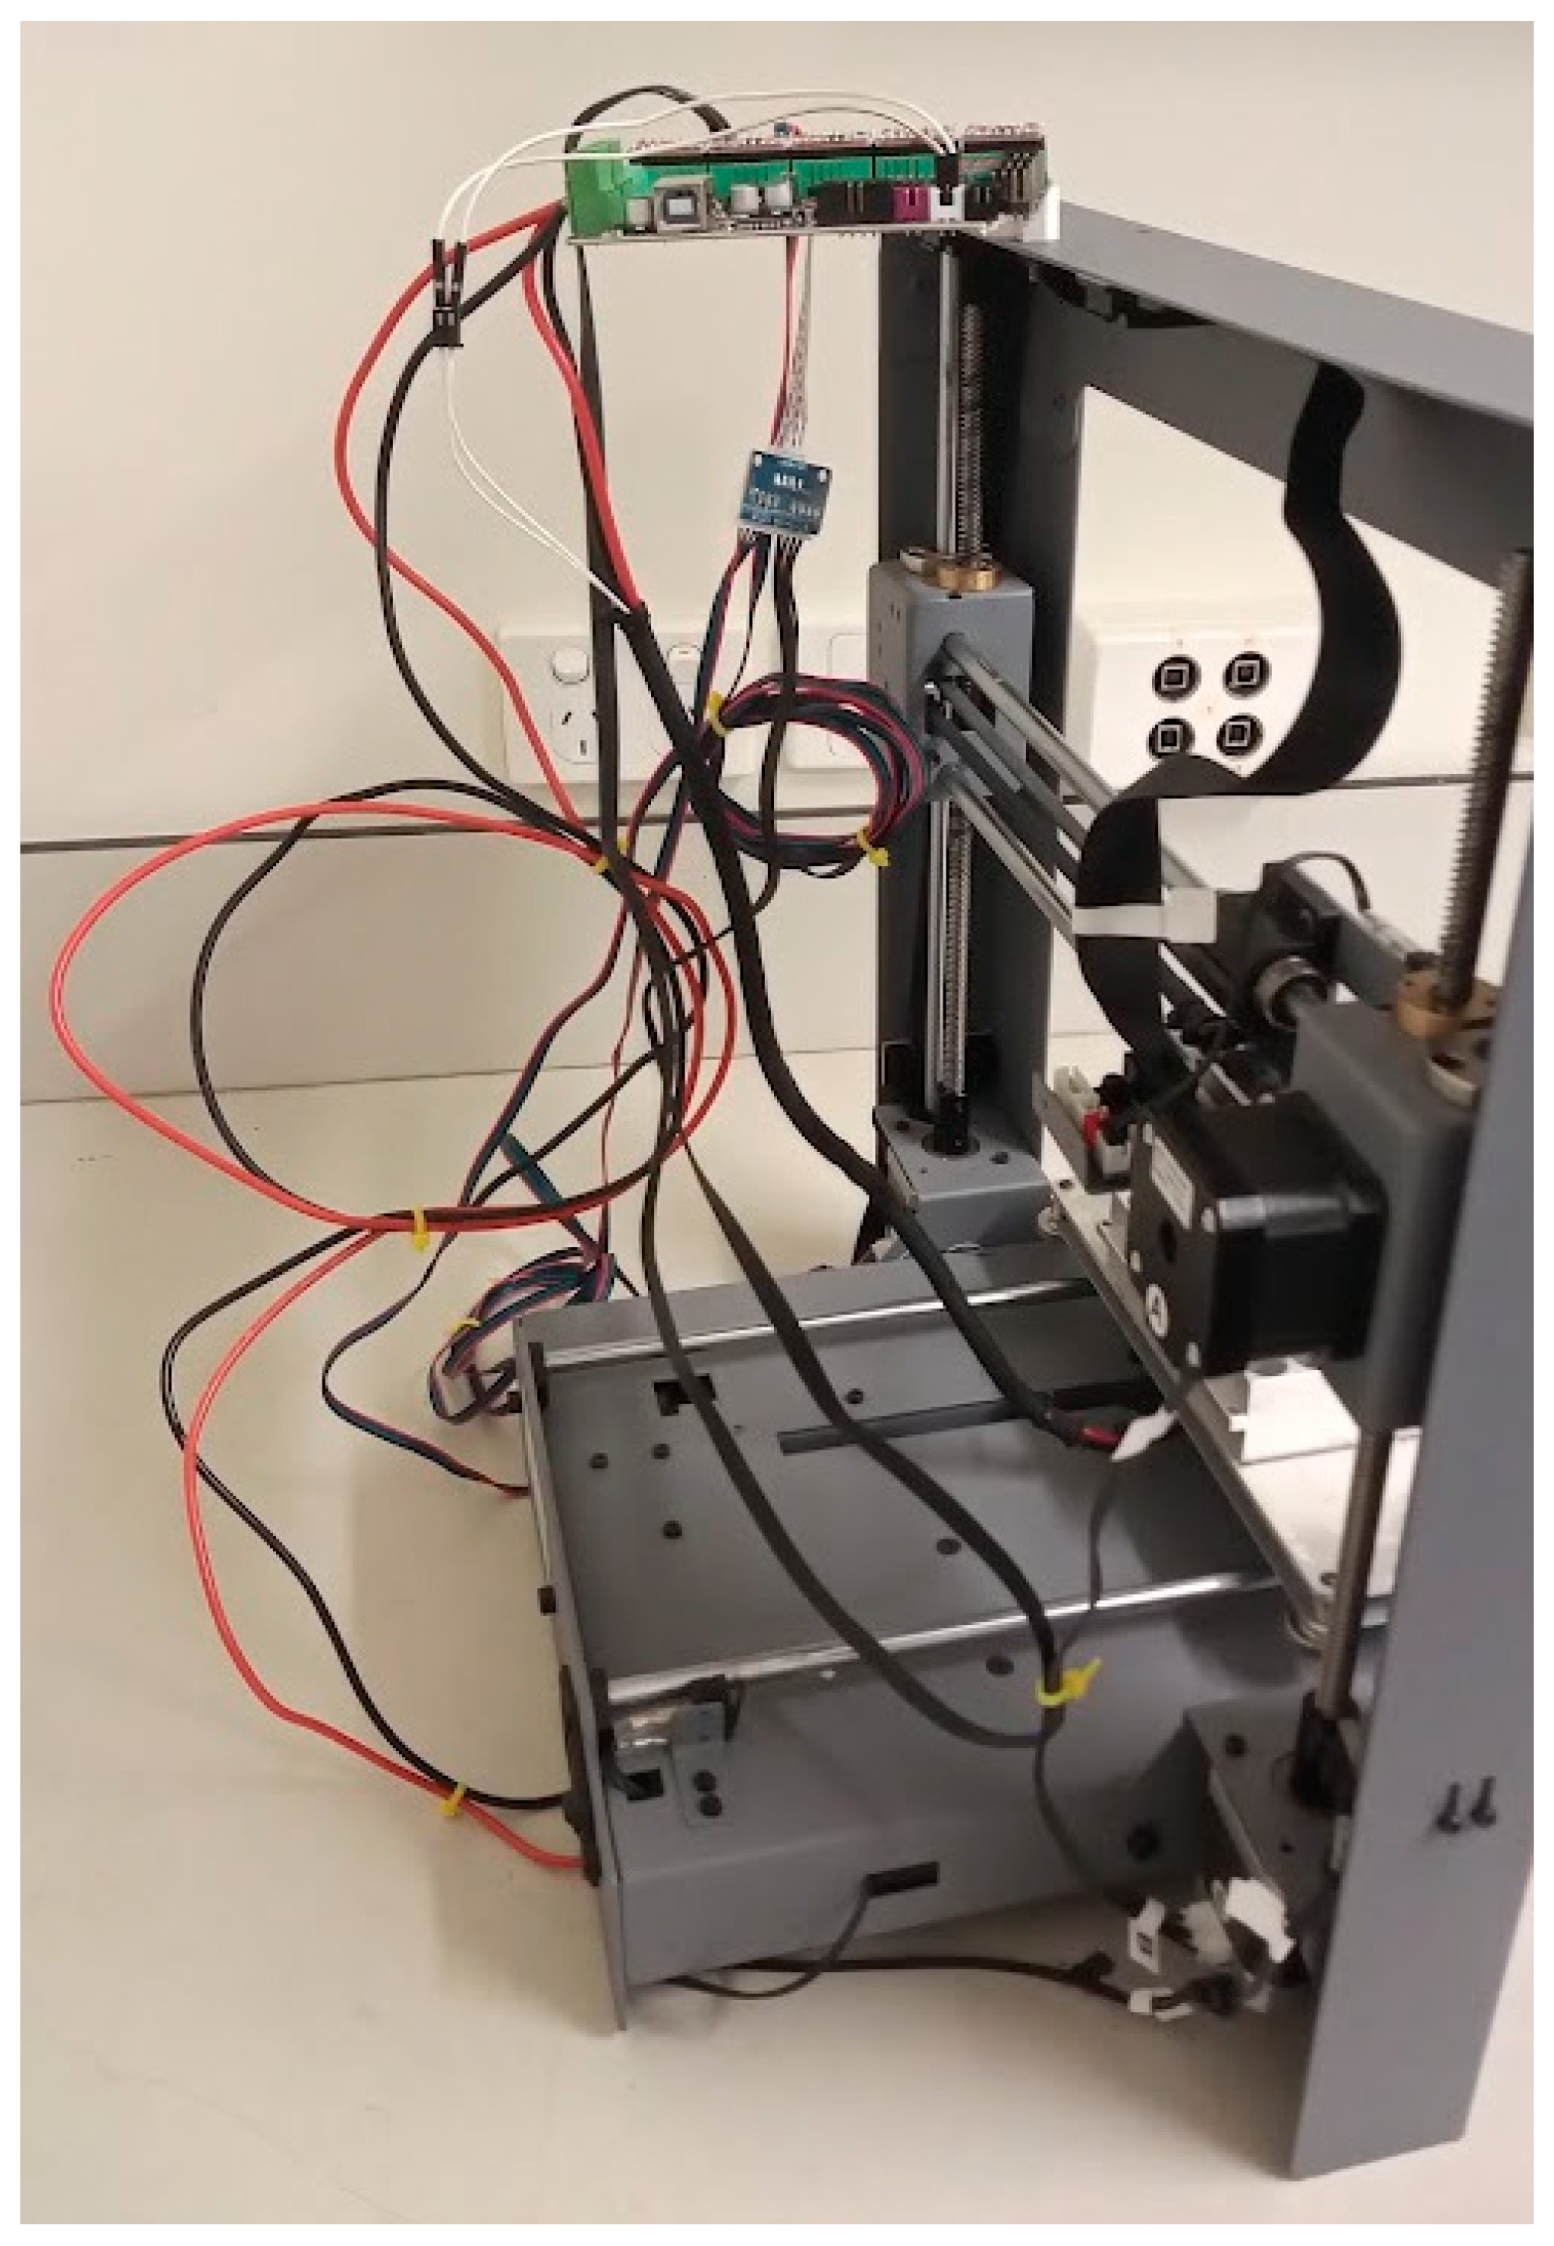
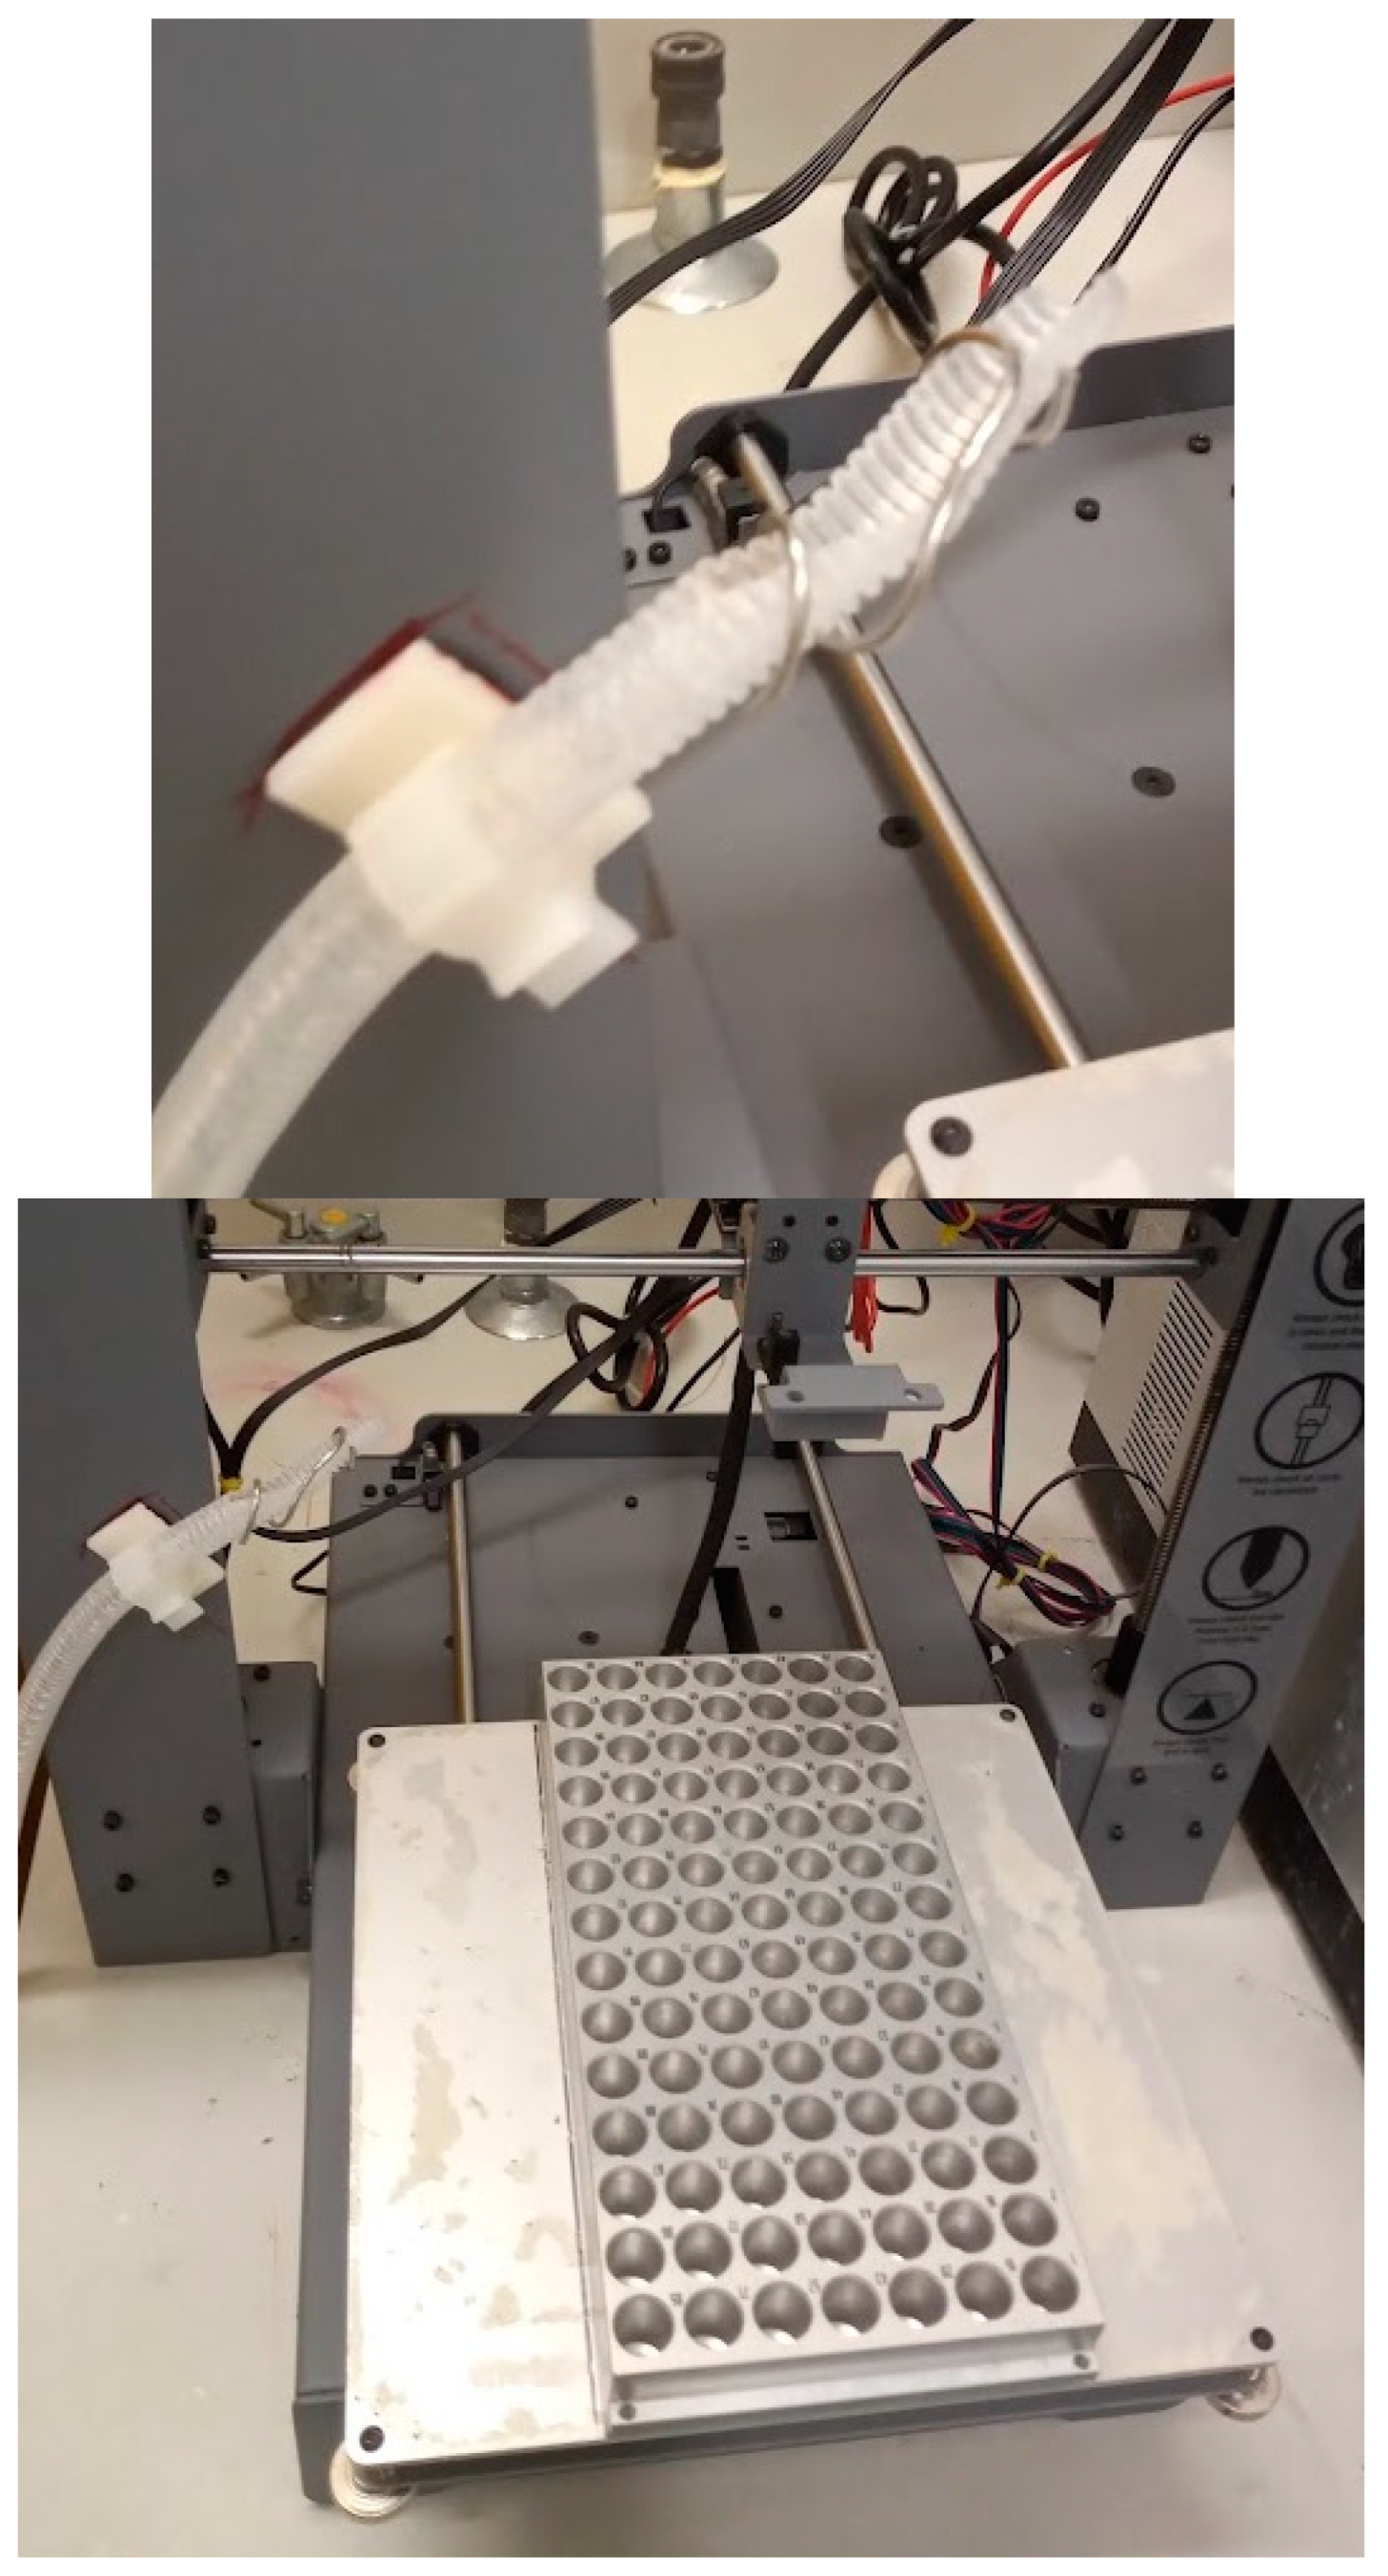
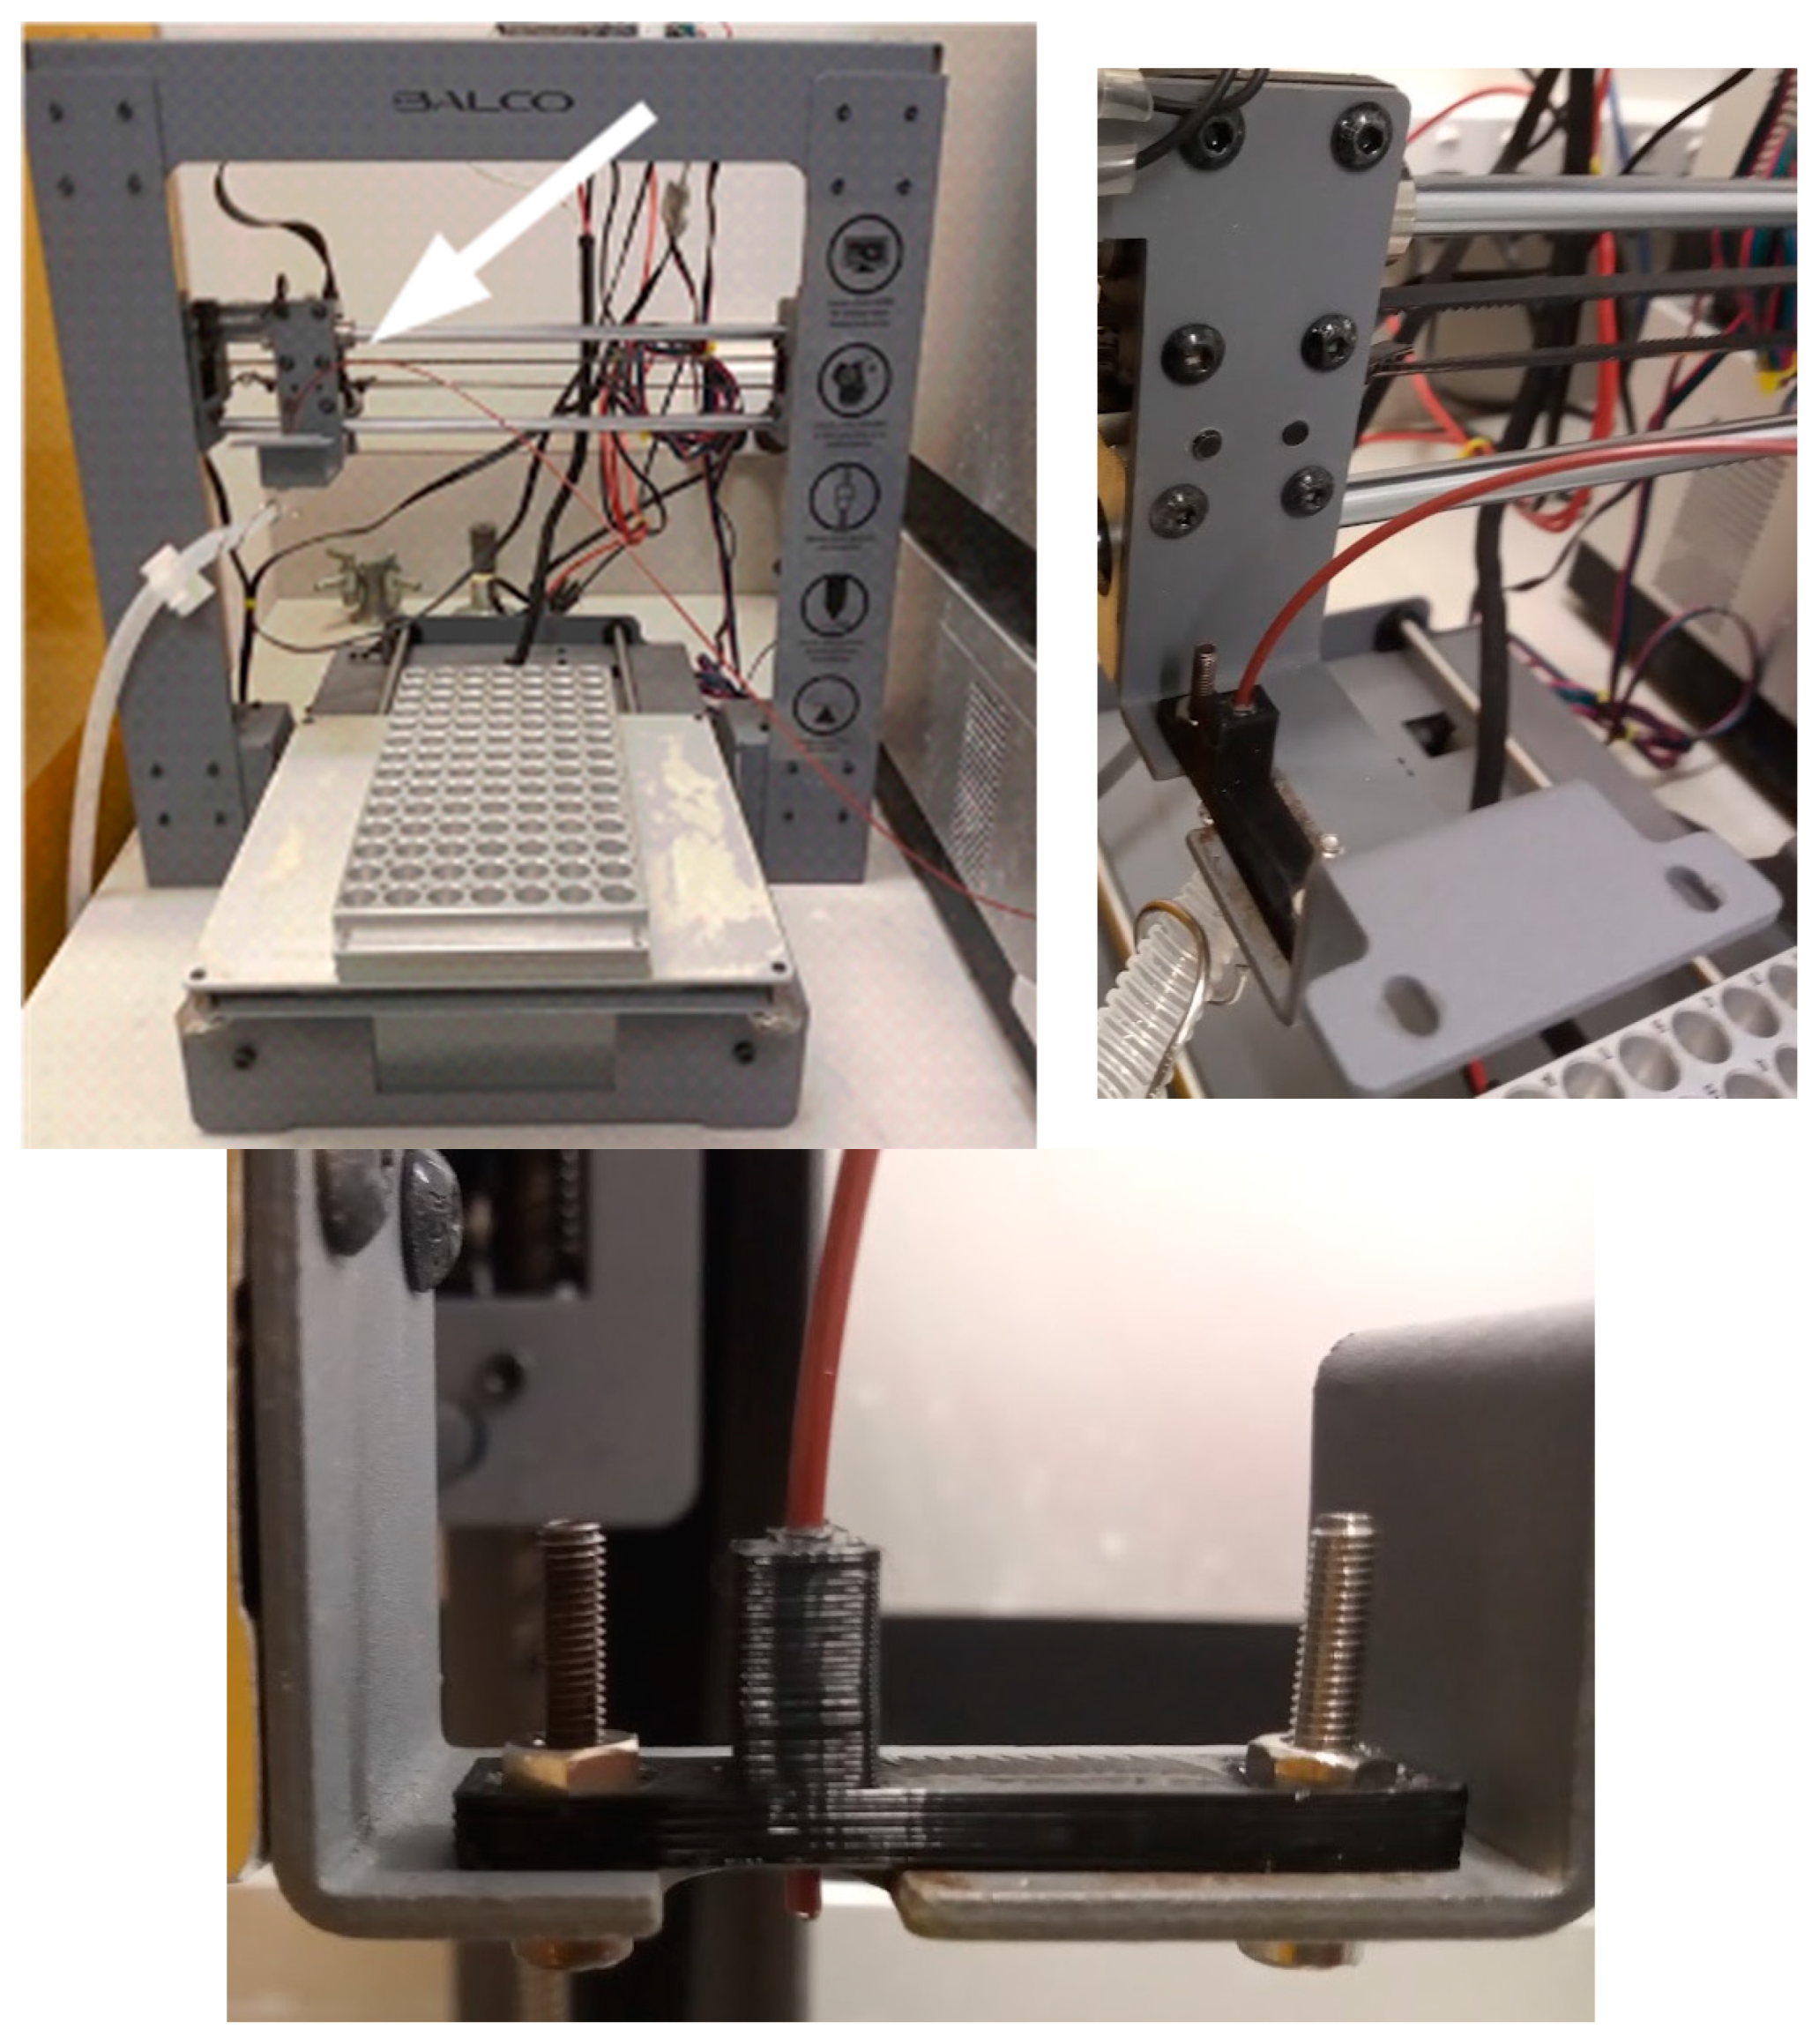
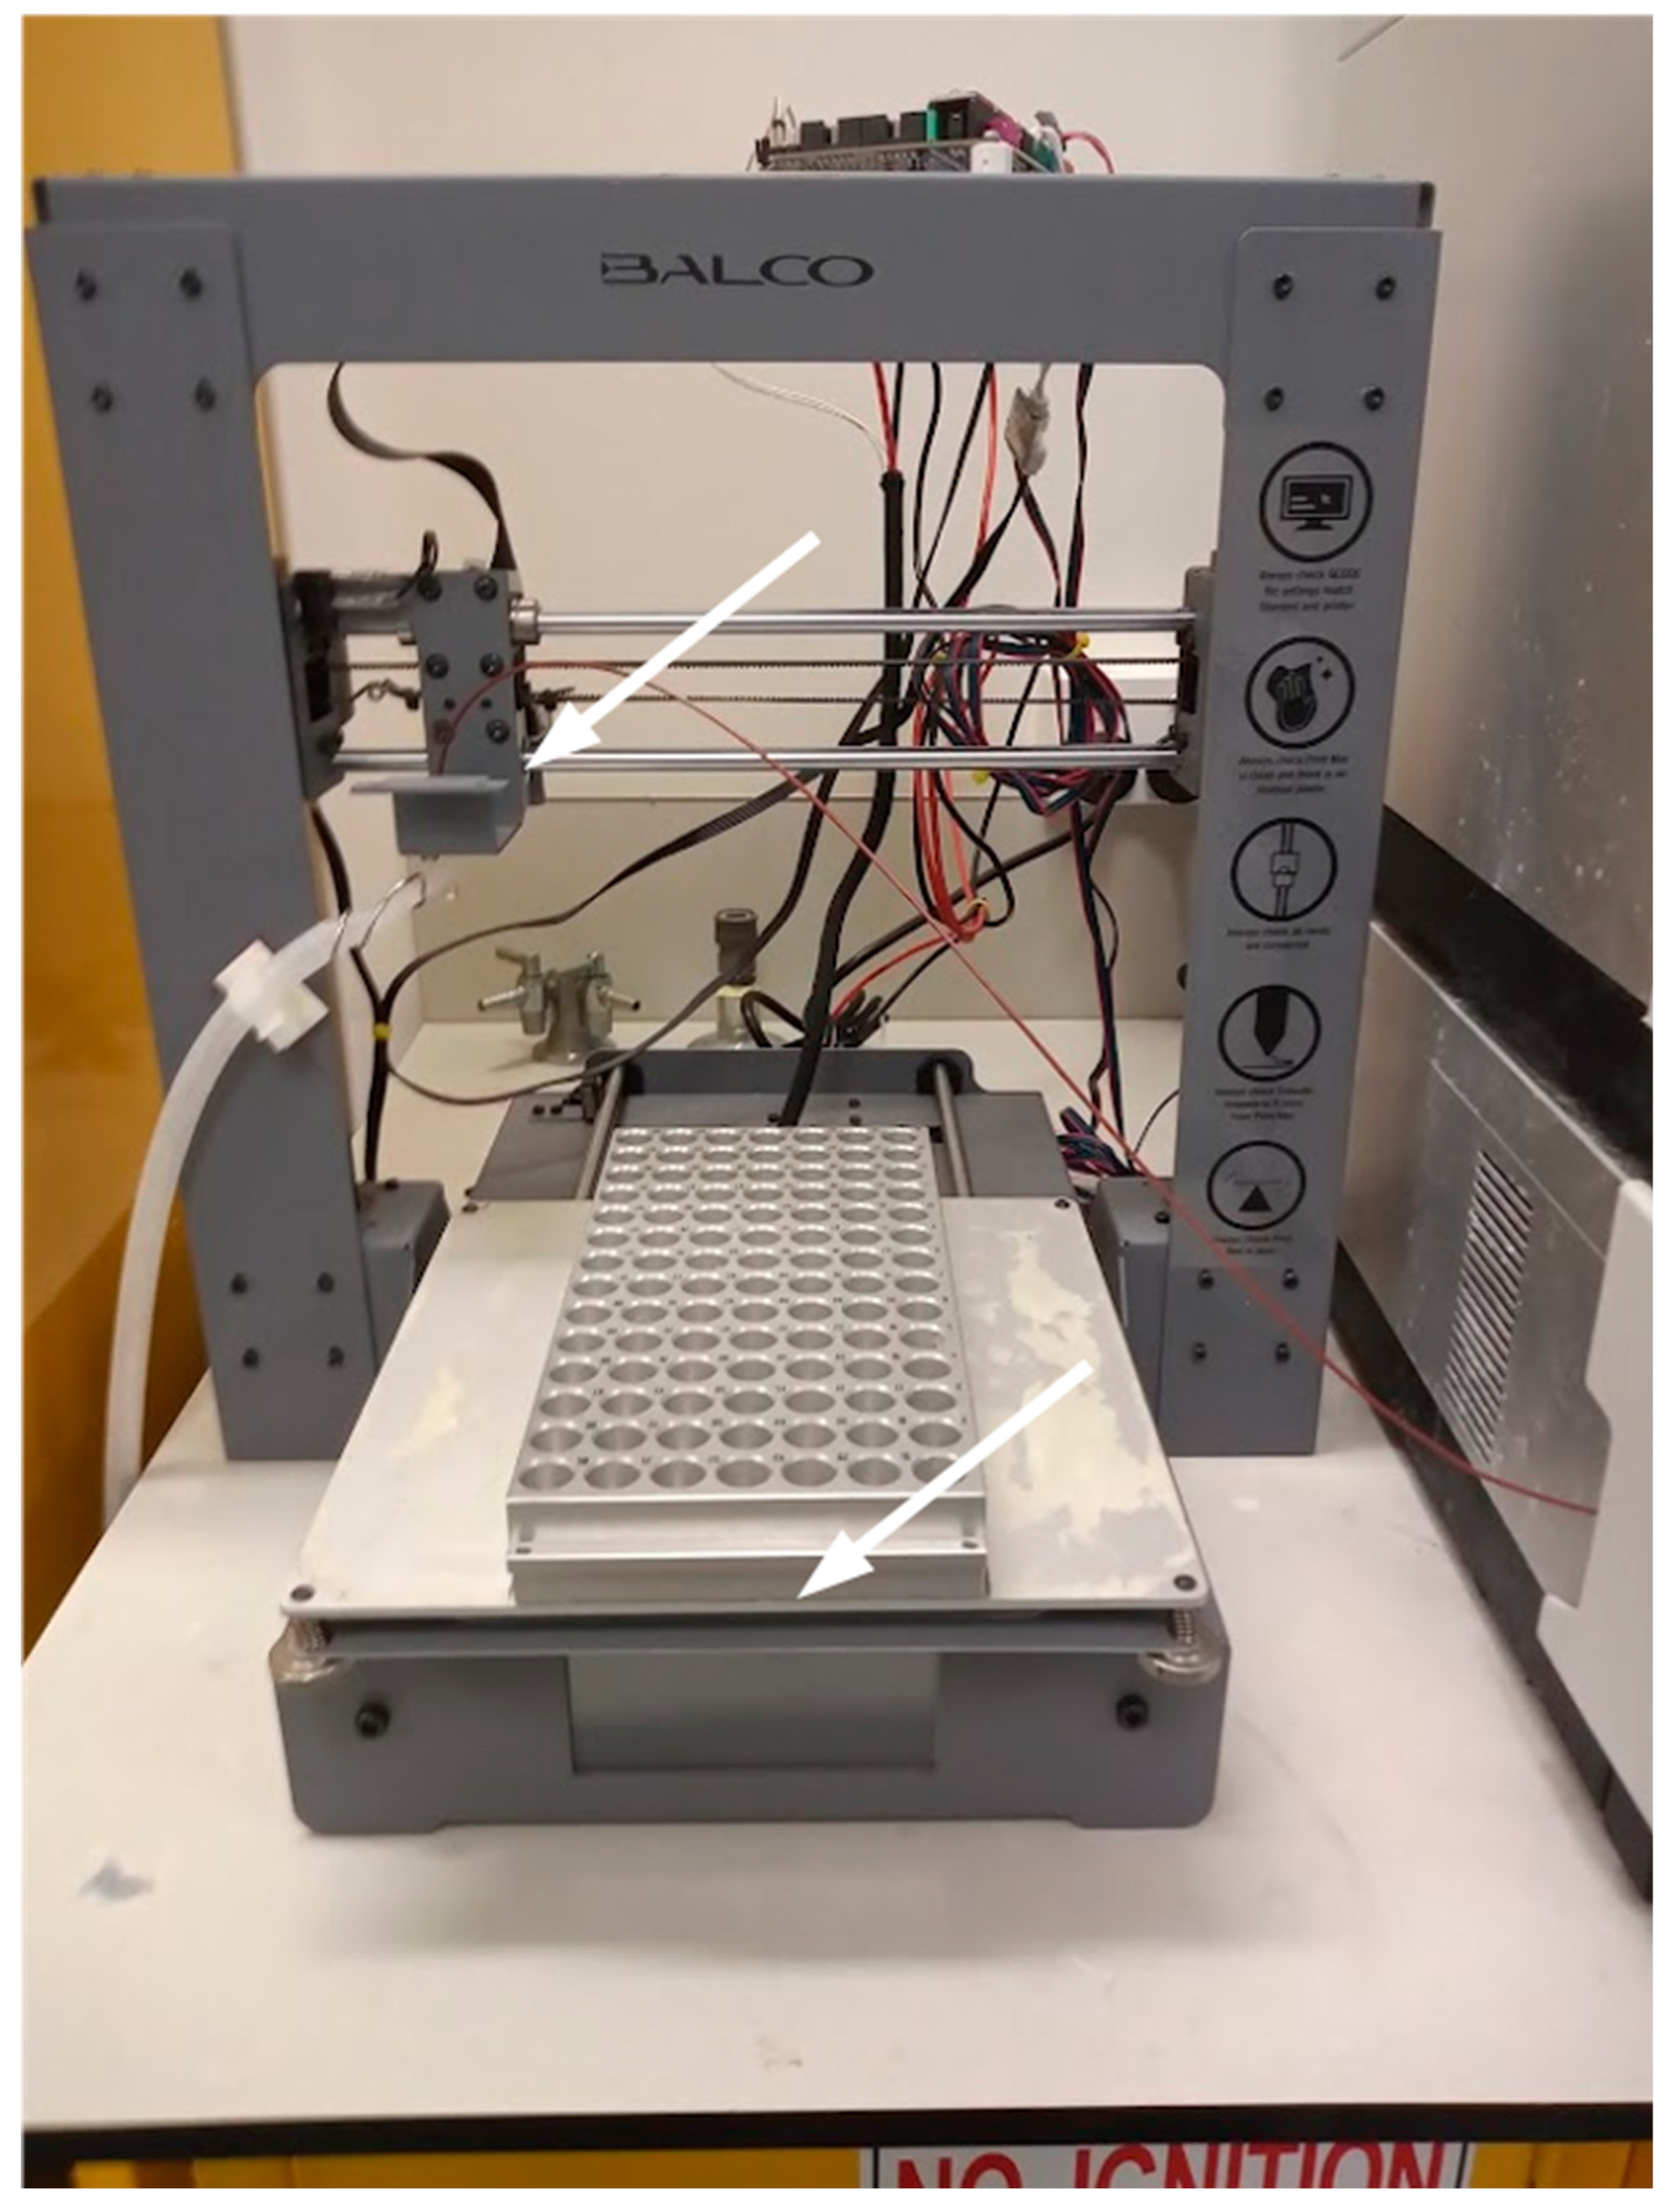
2.2. 3D-Printer Modifications
2.3. Bill of Materials

| Component | Source | Cost |
|---|---|---|
| 3D printer Prusa I3 style 1 | https://www.ebay.com.au/itm/155077037136 (accessed on 30 November 2023) | AUD 232.00 |
| MKS GEN L board | https://www.ebay.com.au/itm/354788810185 (accessed on 30 November 2023) | AUD 70.00 |
| A4988 drivers (5 units) | https://www.ebay.com.au/itm/134438897517 (accessed on 30 November 2023) | AUD 11.00 |
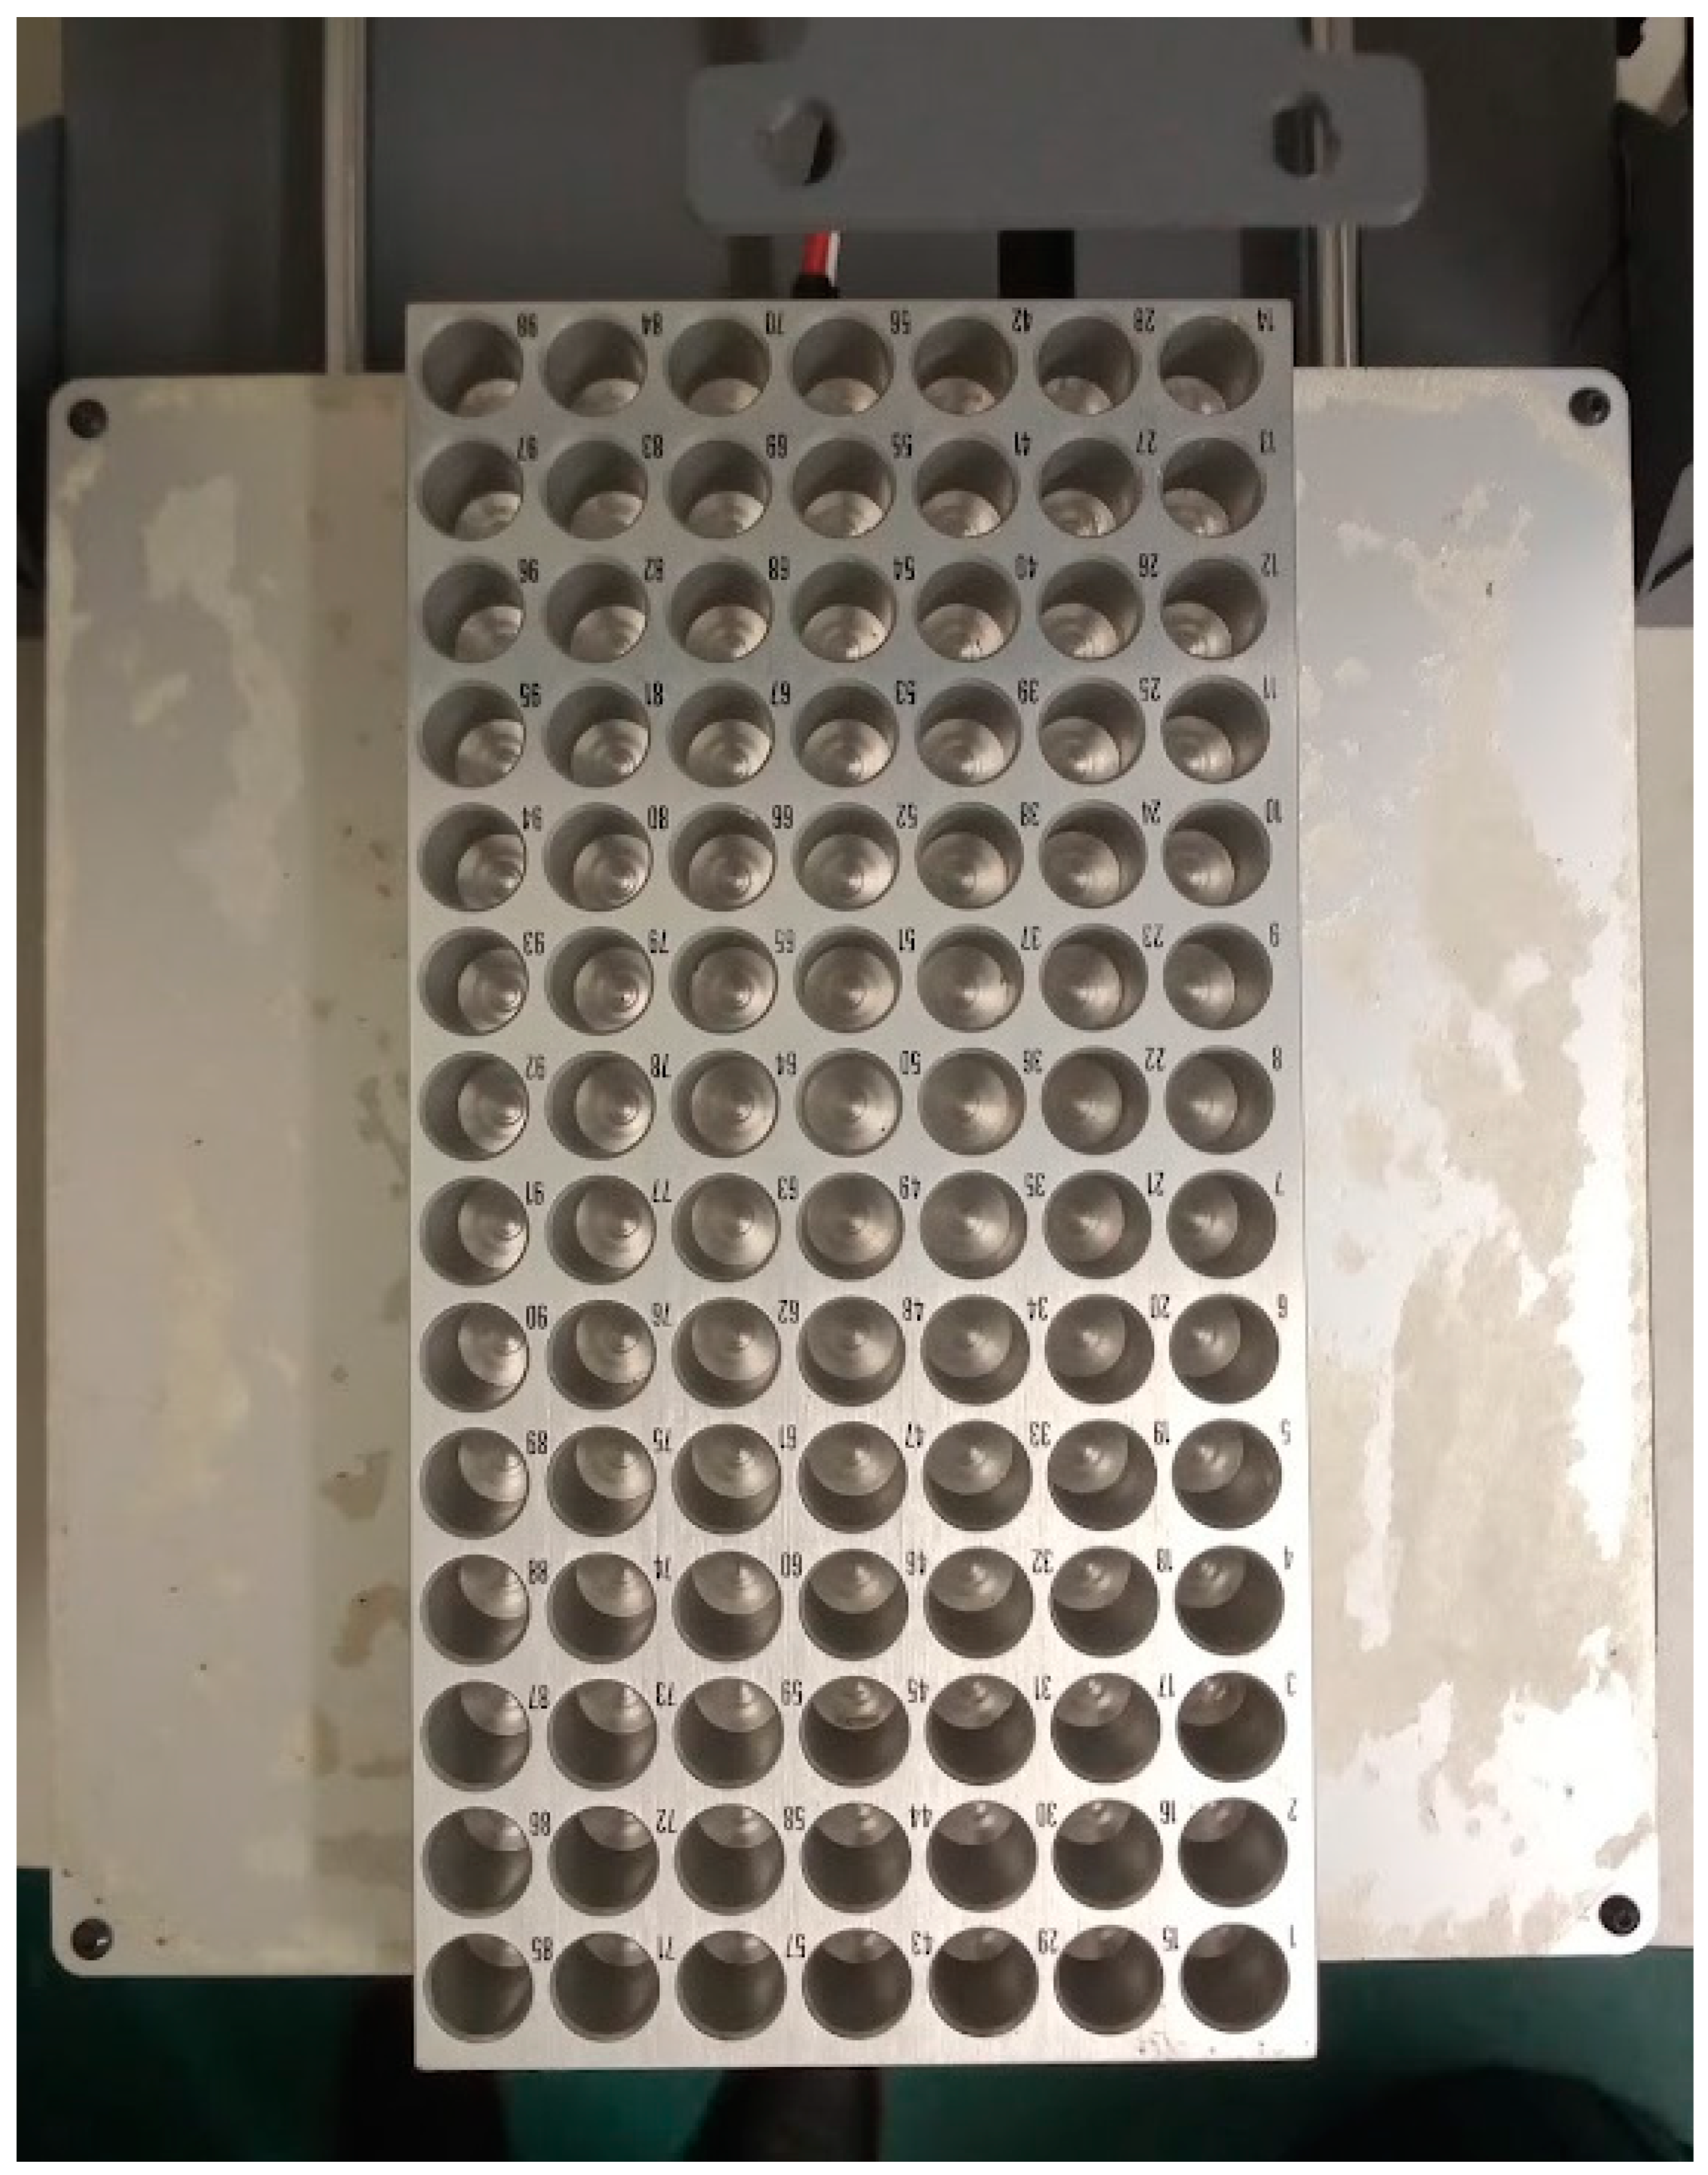
| PAL TR98 tray | https://www.palparts.com/product/pal-tr98/ (accessed on 30 November 2023) | AUD 1045.00 |
| Male-female DuPont cable for stepper motors (5 units) | https://3dprintingperth.com/products/stepper-motor-cable-male-to-female-extension-dupont-wire?variant=39471376826481 (accessed on 30 November 2023) | AUD 15.00 |
| Adapter model BT7242A for stepper motors | https://www.aliexpress.com/i/32881420875.html (accessed on 30 November 2023) | AUD 5.00 |
| Waste tube | https://www.labfriend.com.au/bsafe-corrugated-tubing-pp-ø-65-x-100-mm-t-175-mm (accessed on 30 November 2023) | AUD 50.00 |
| Cable holder for waste tube | https://www.ebay.com.au/itm/203860080384 (accessed on 30 November 2023) | AUD 4.00 |
| M3 screw, nut, and space | Hardware store | Less than AUD 5.00 |
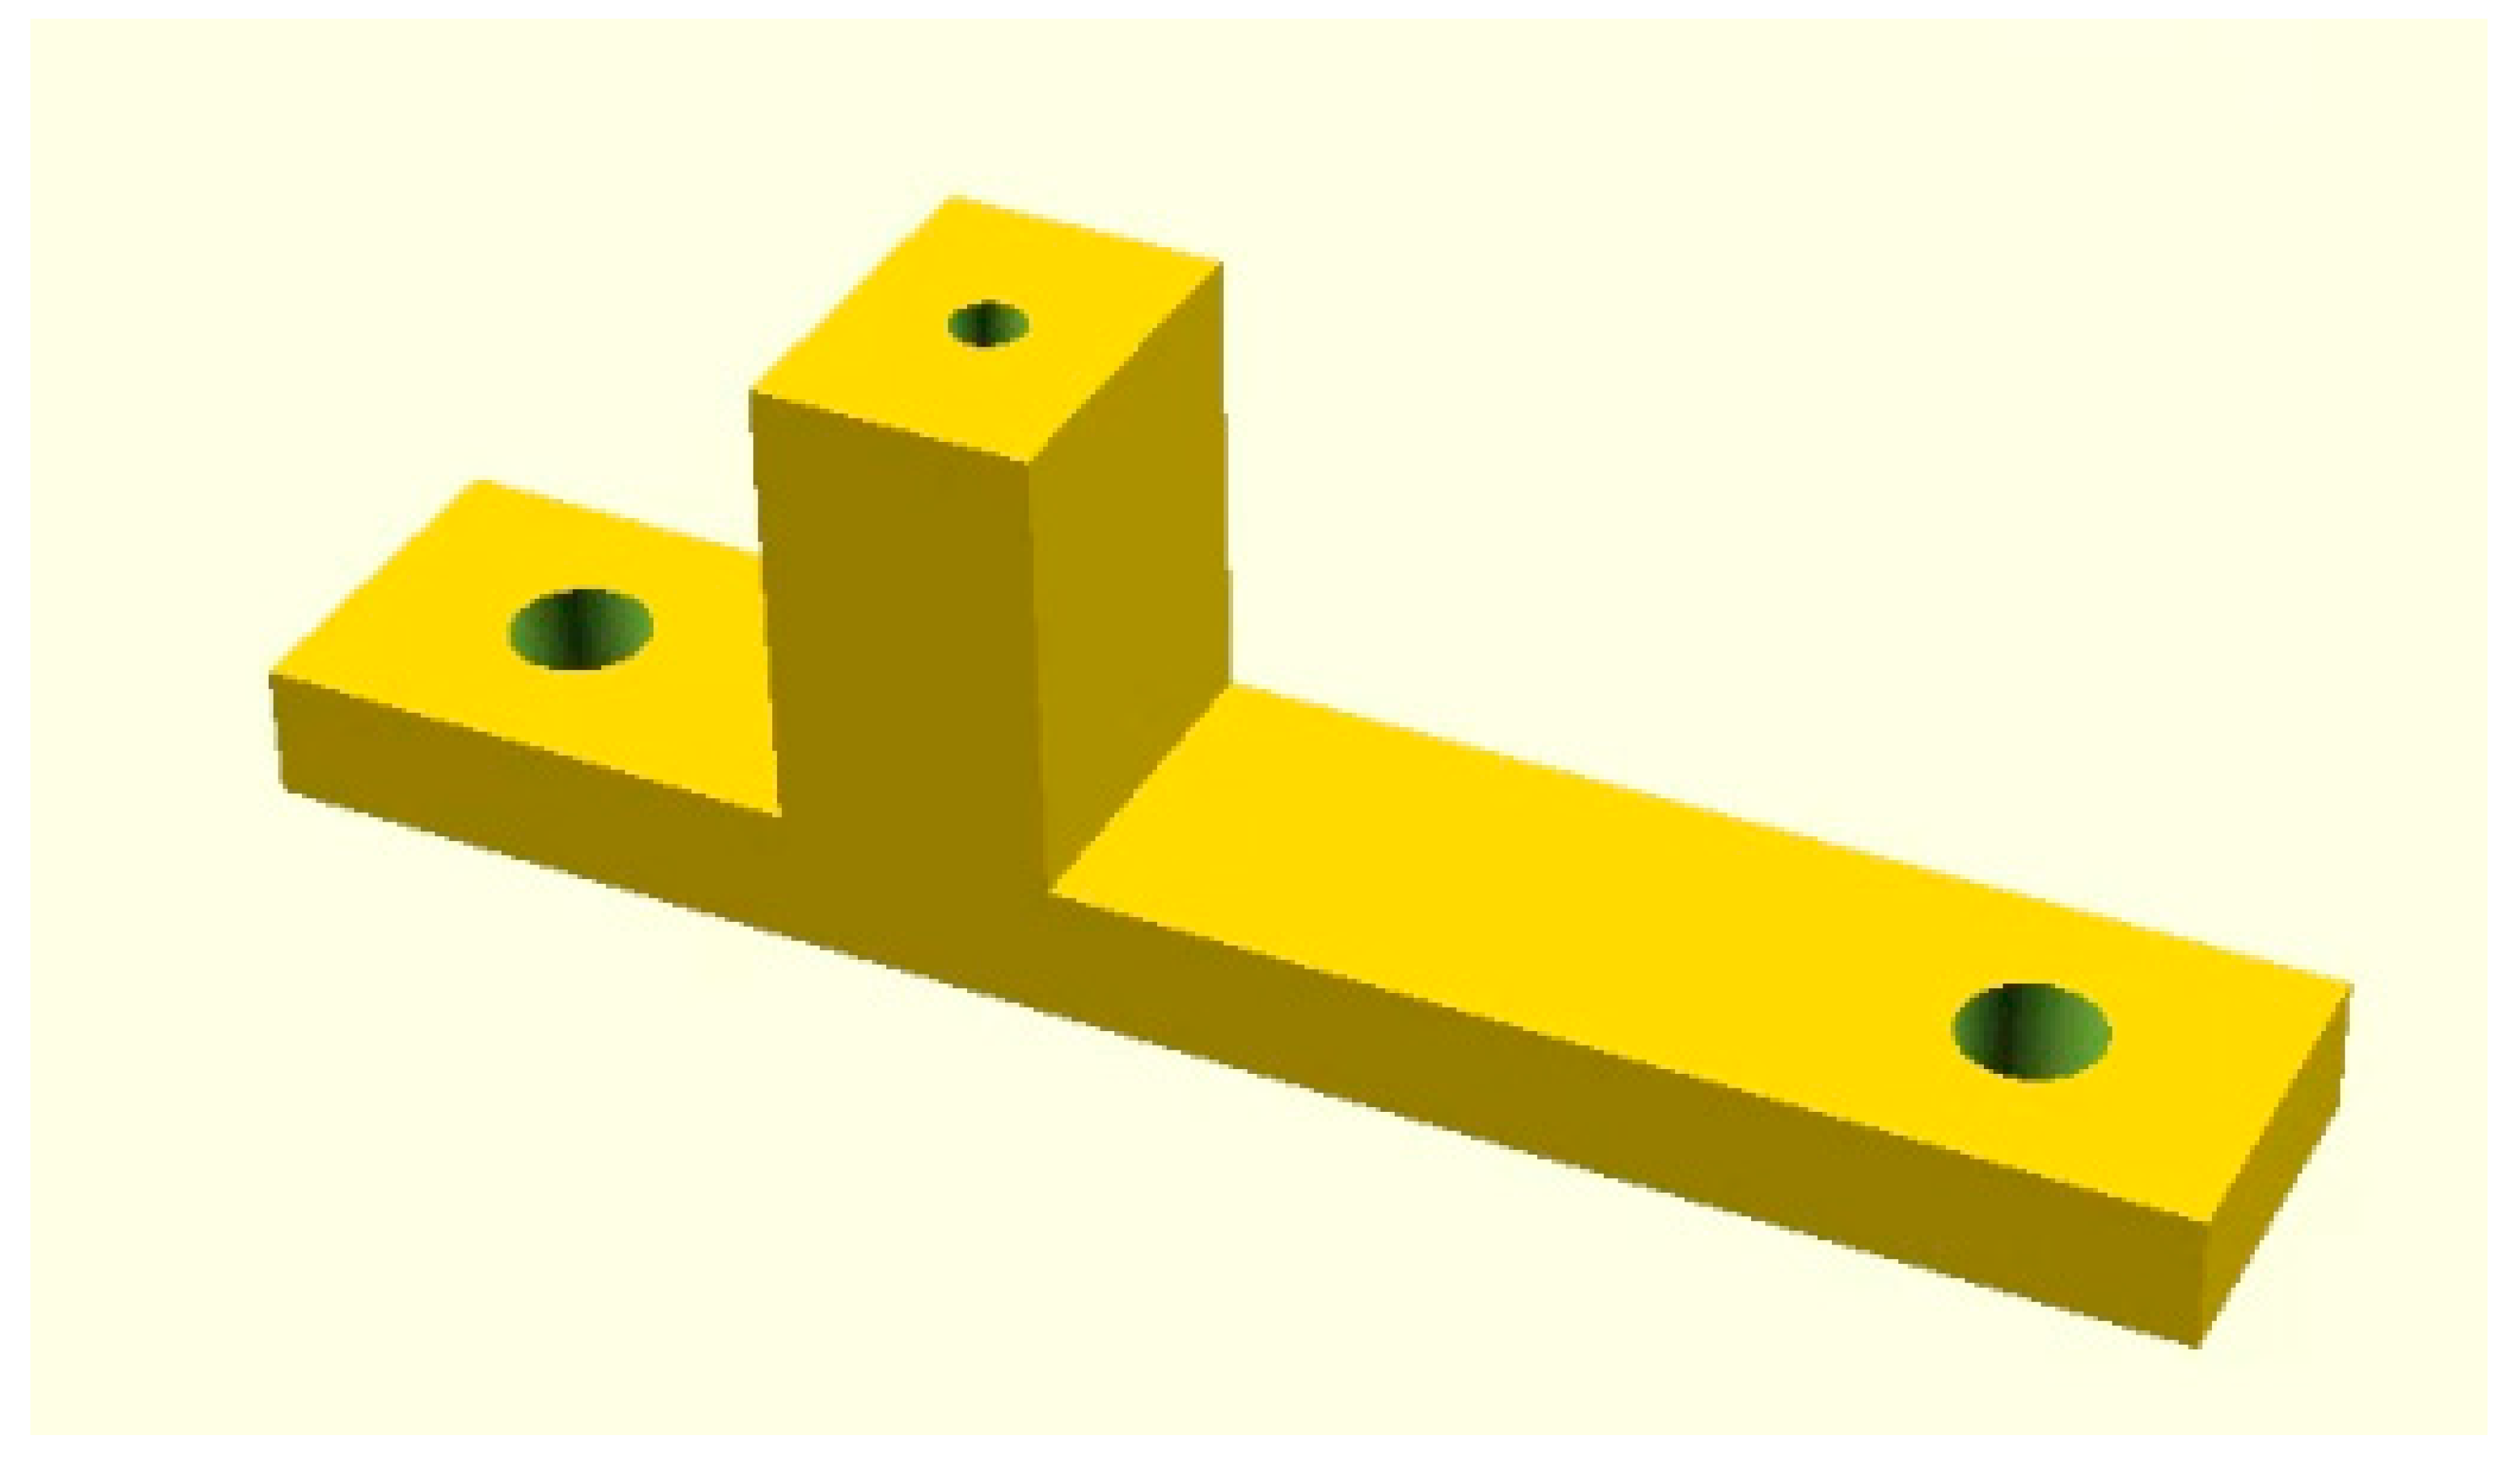
| 3D-printed tube holder | Appendix A | Less than AUD 1.00 |
| Total | AUD 1438.00 |
3. Build Instructions
4. Operating Instructions
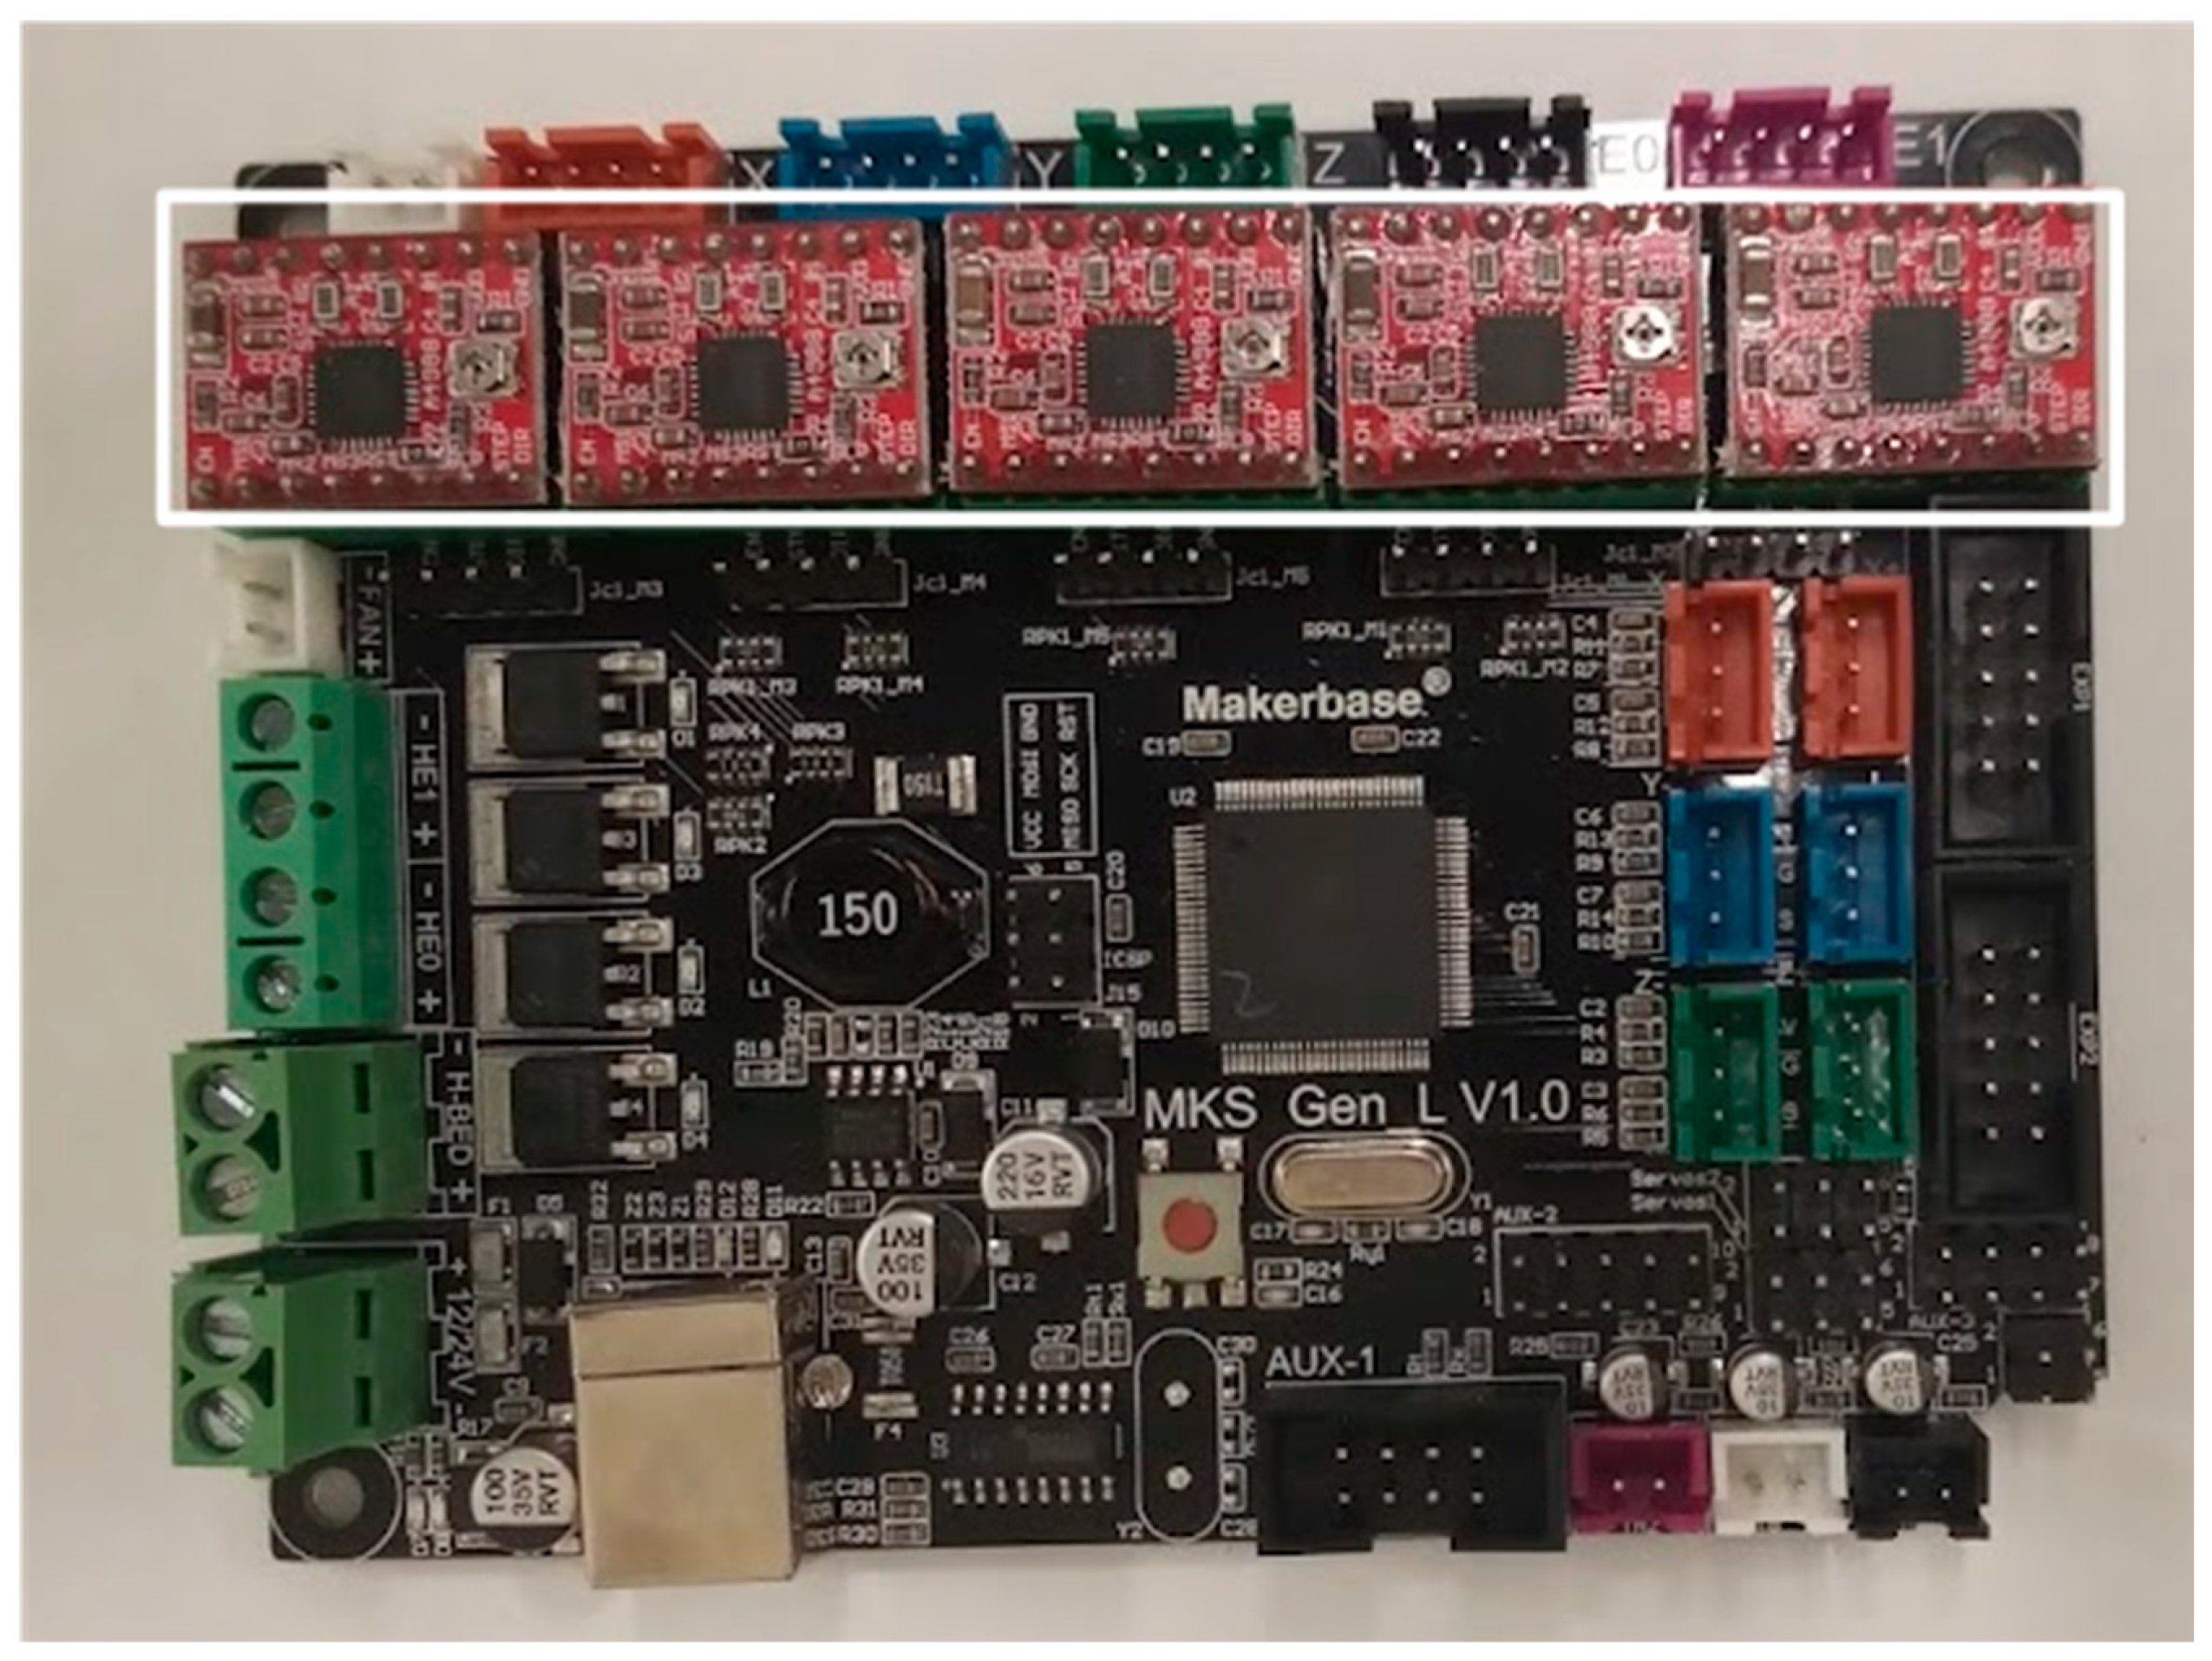
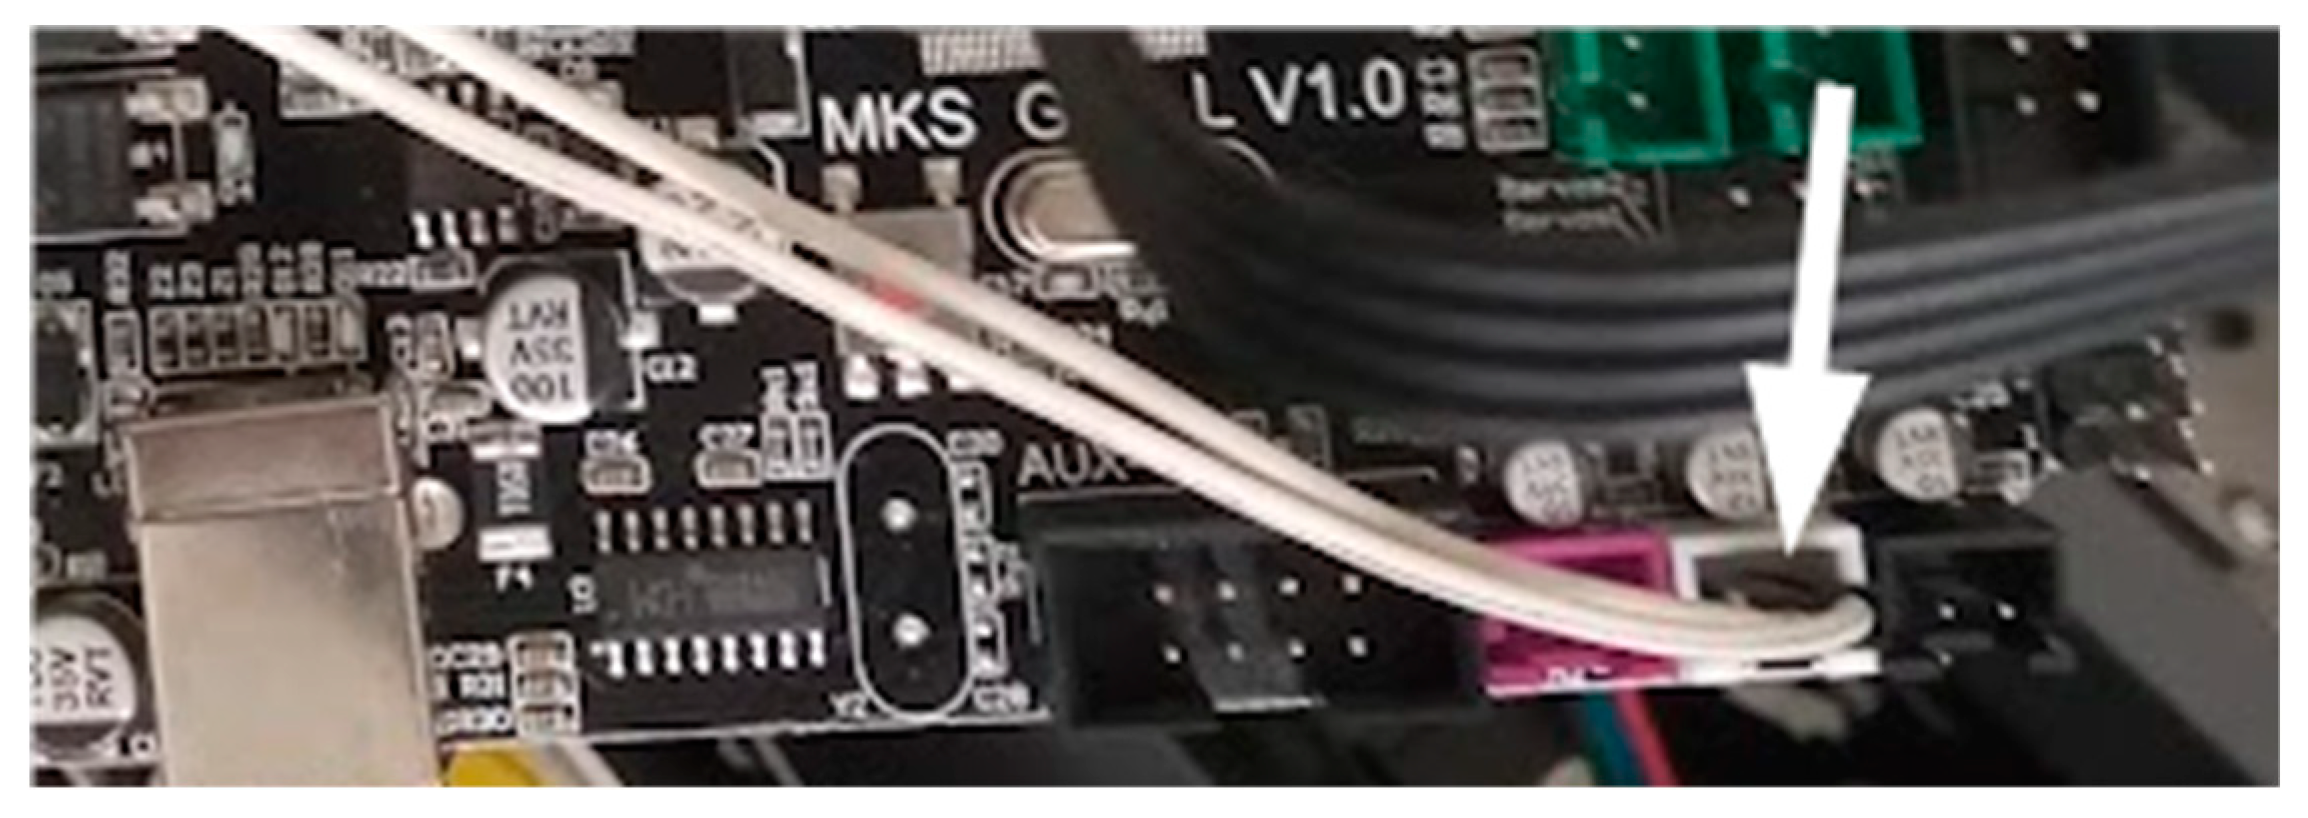
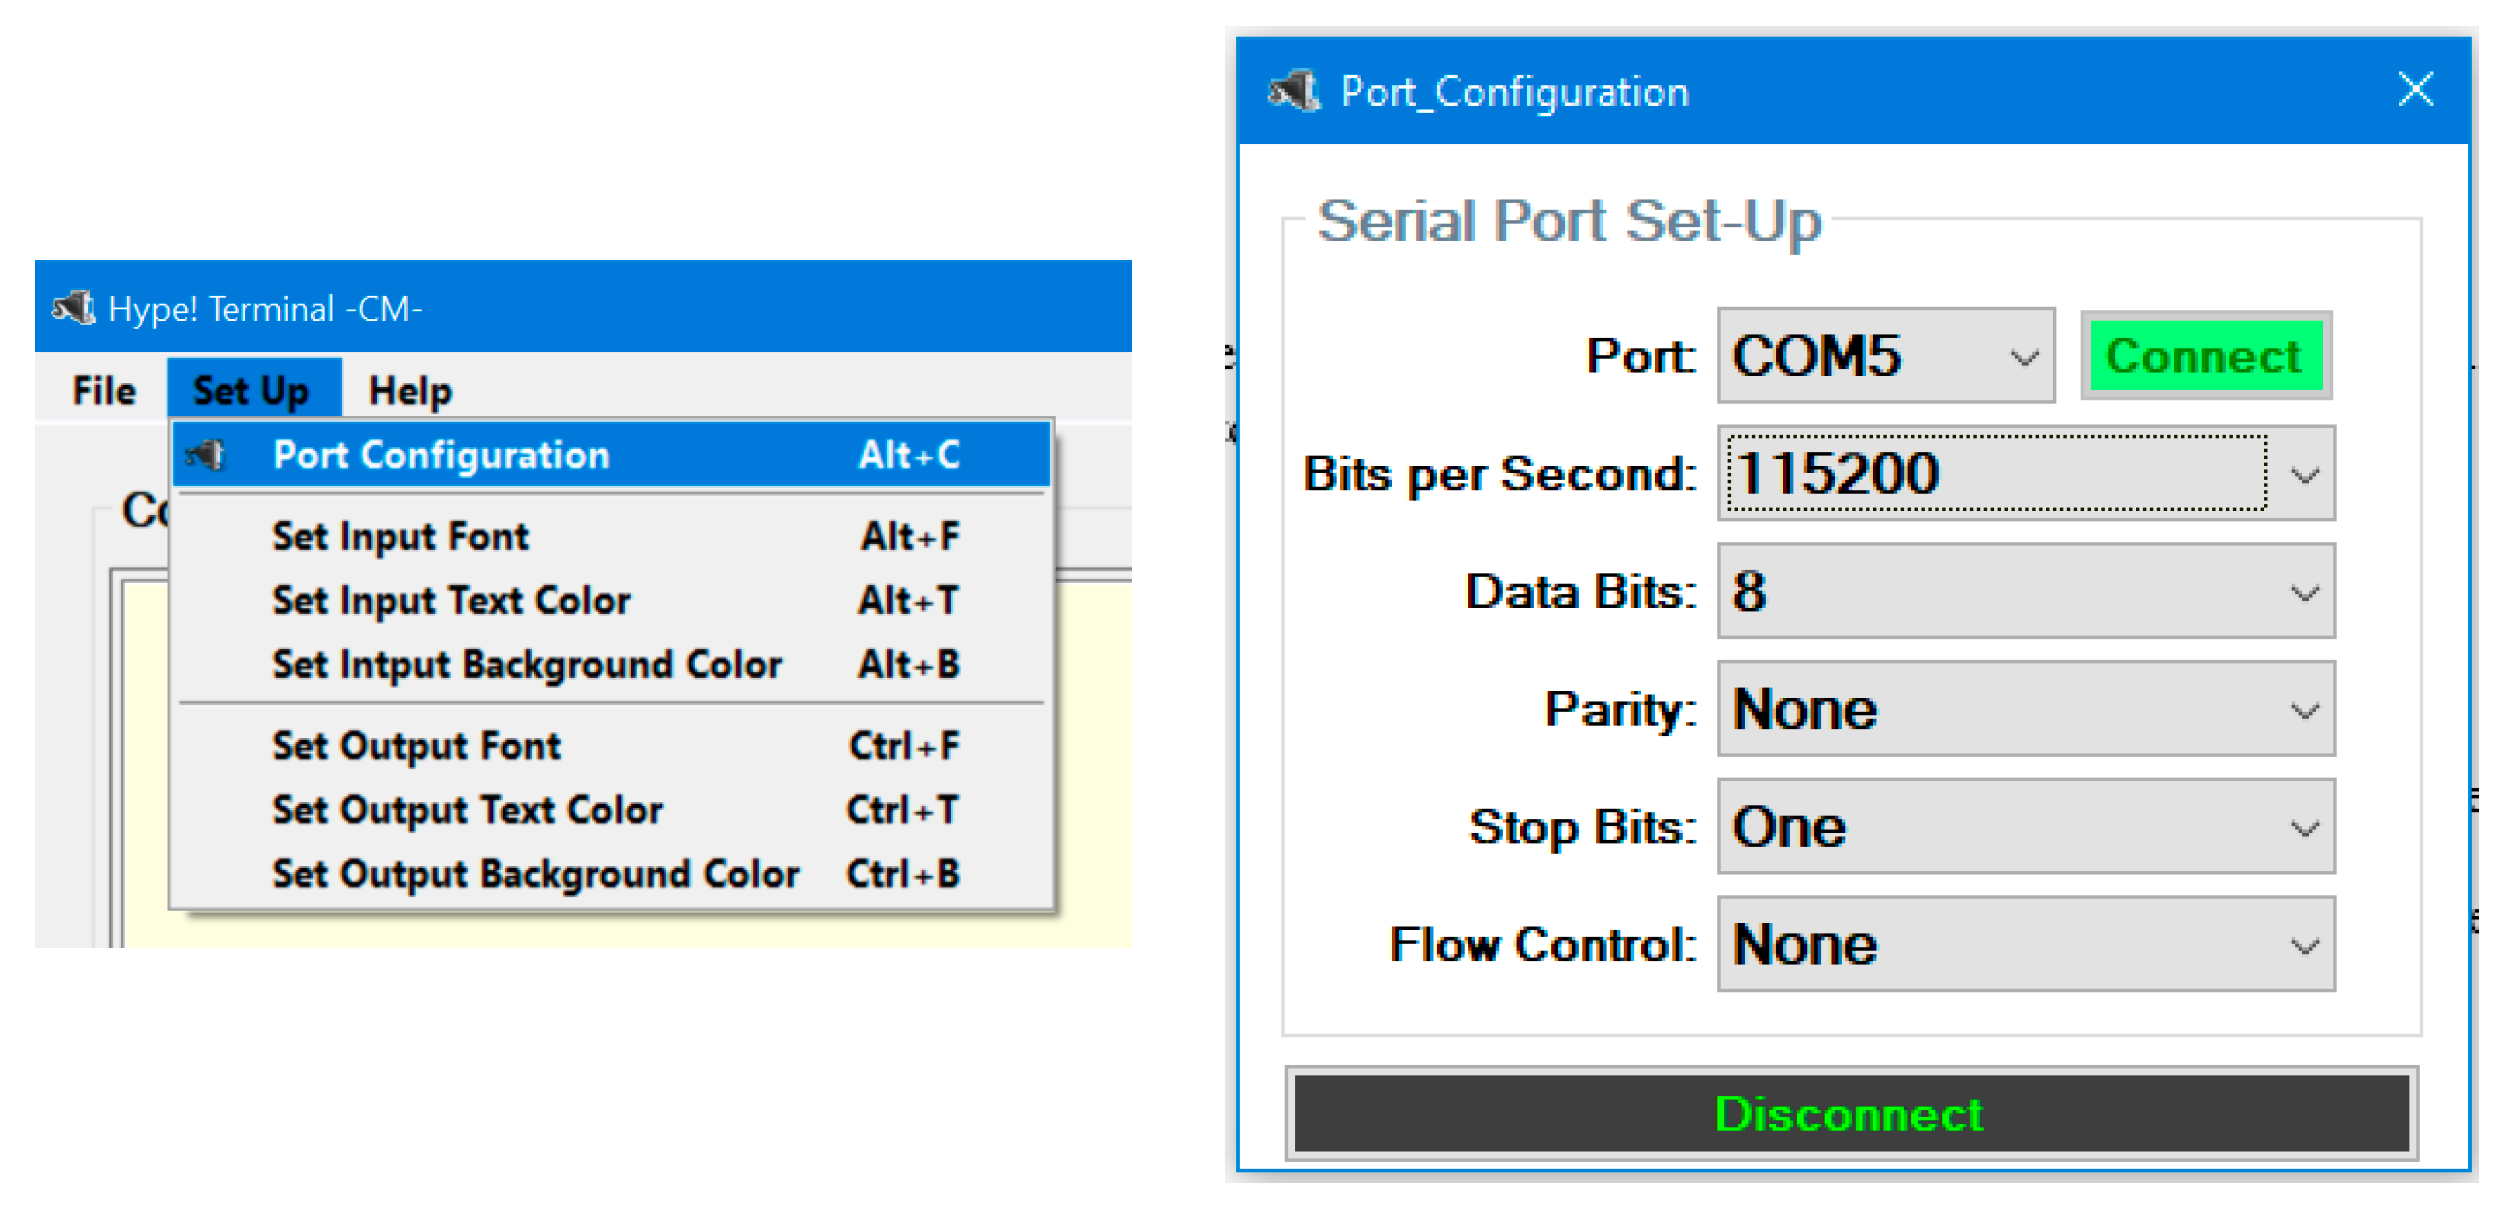
4.1. Control Board Preparation
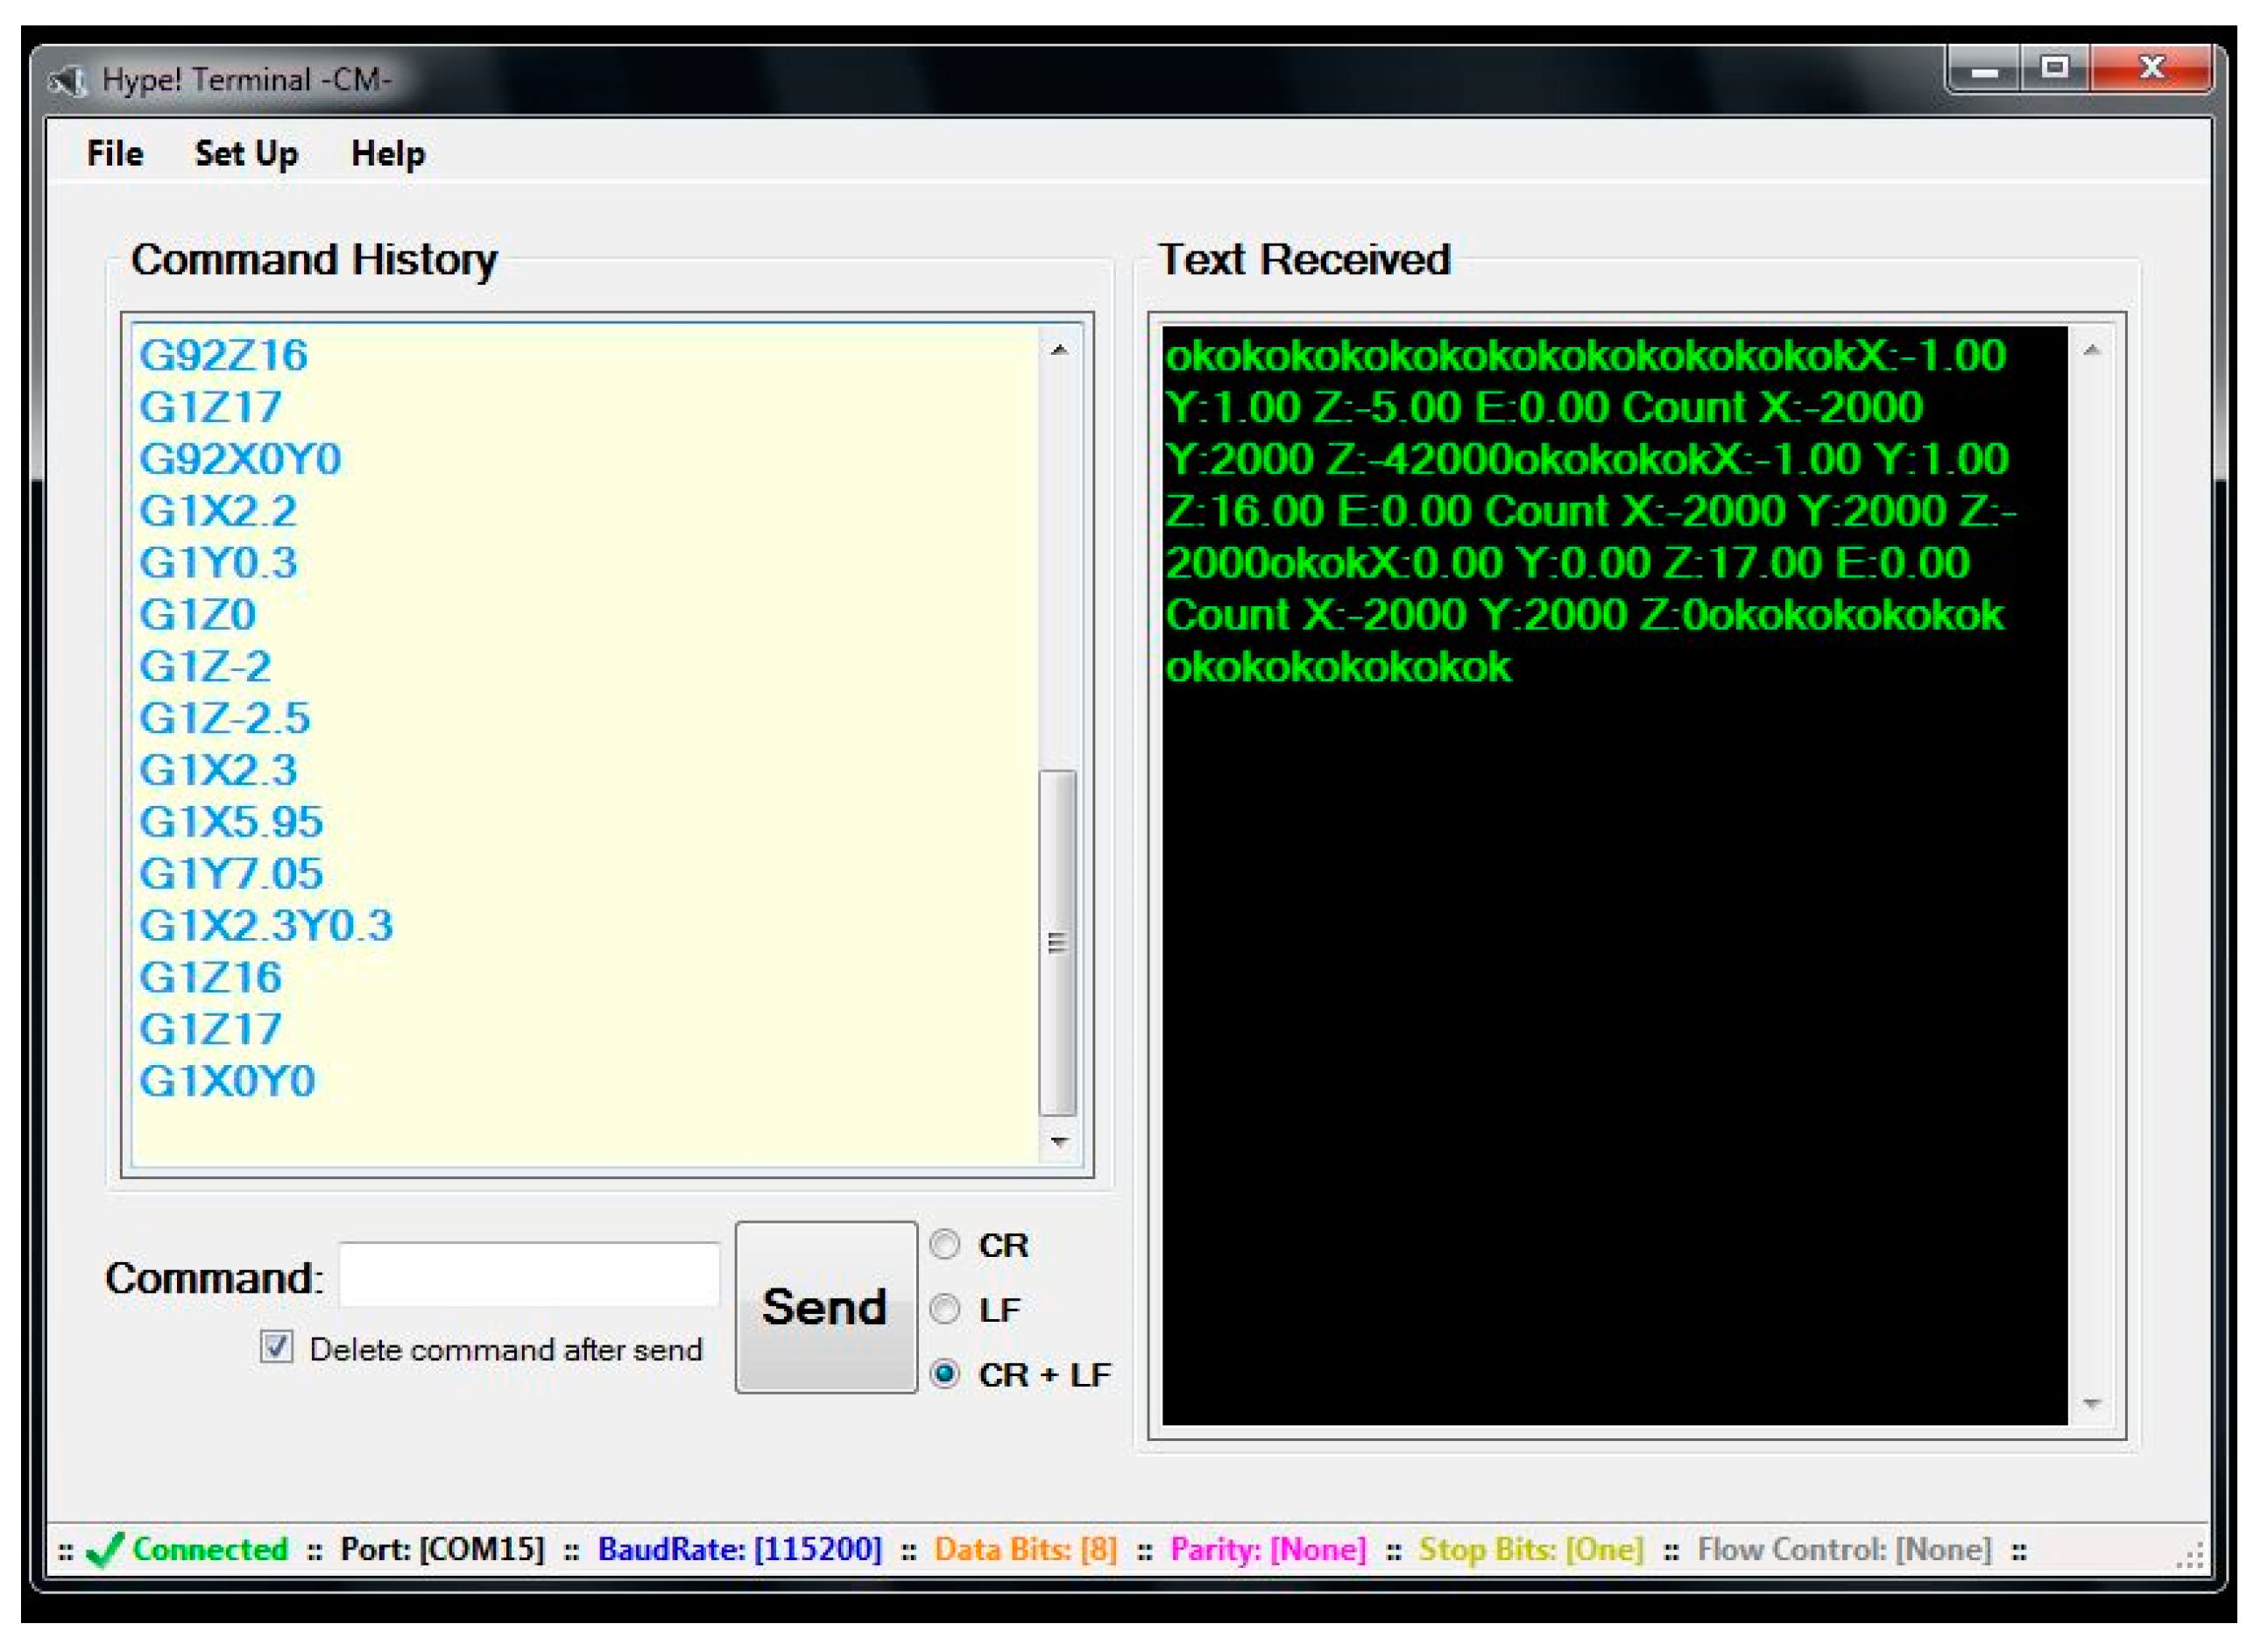
4.2. Basic Commands
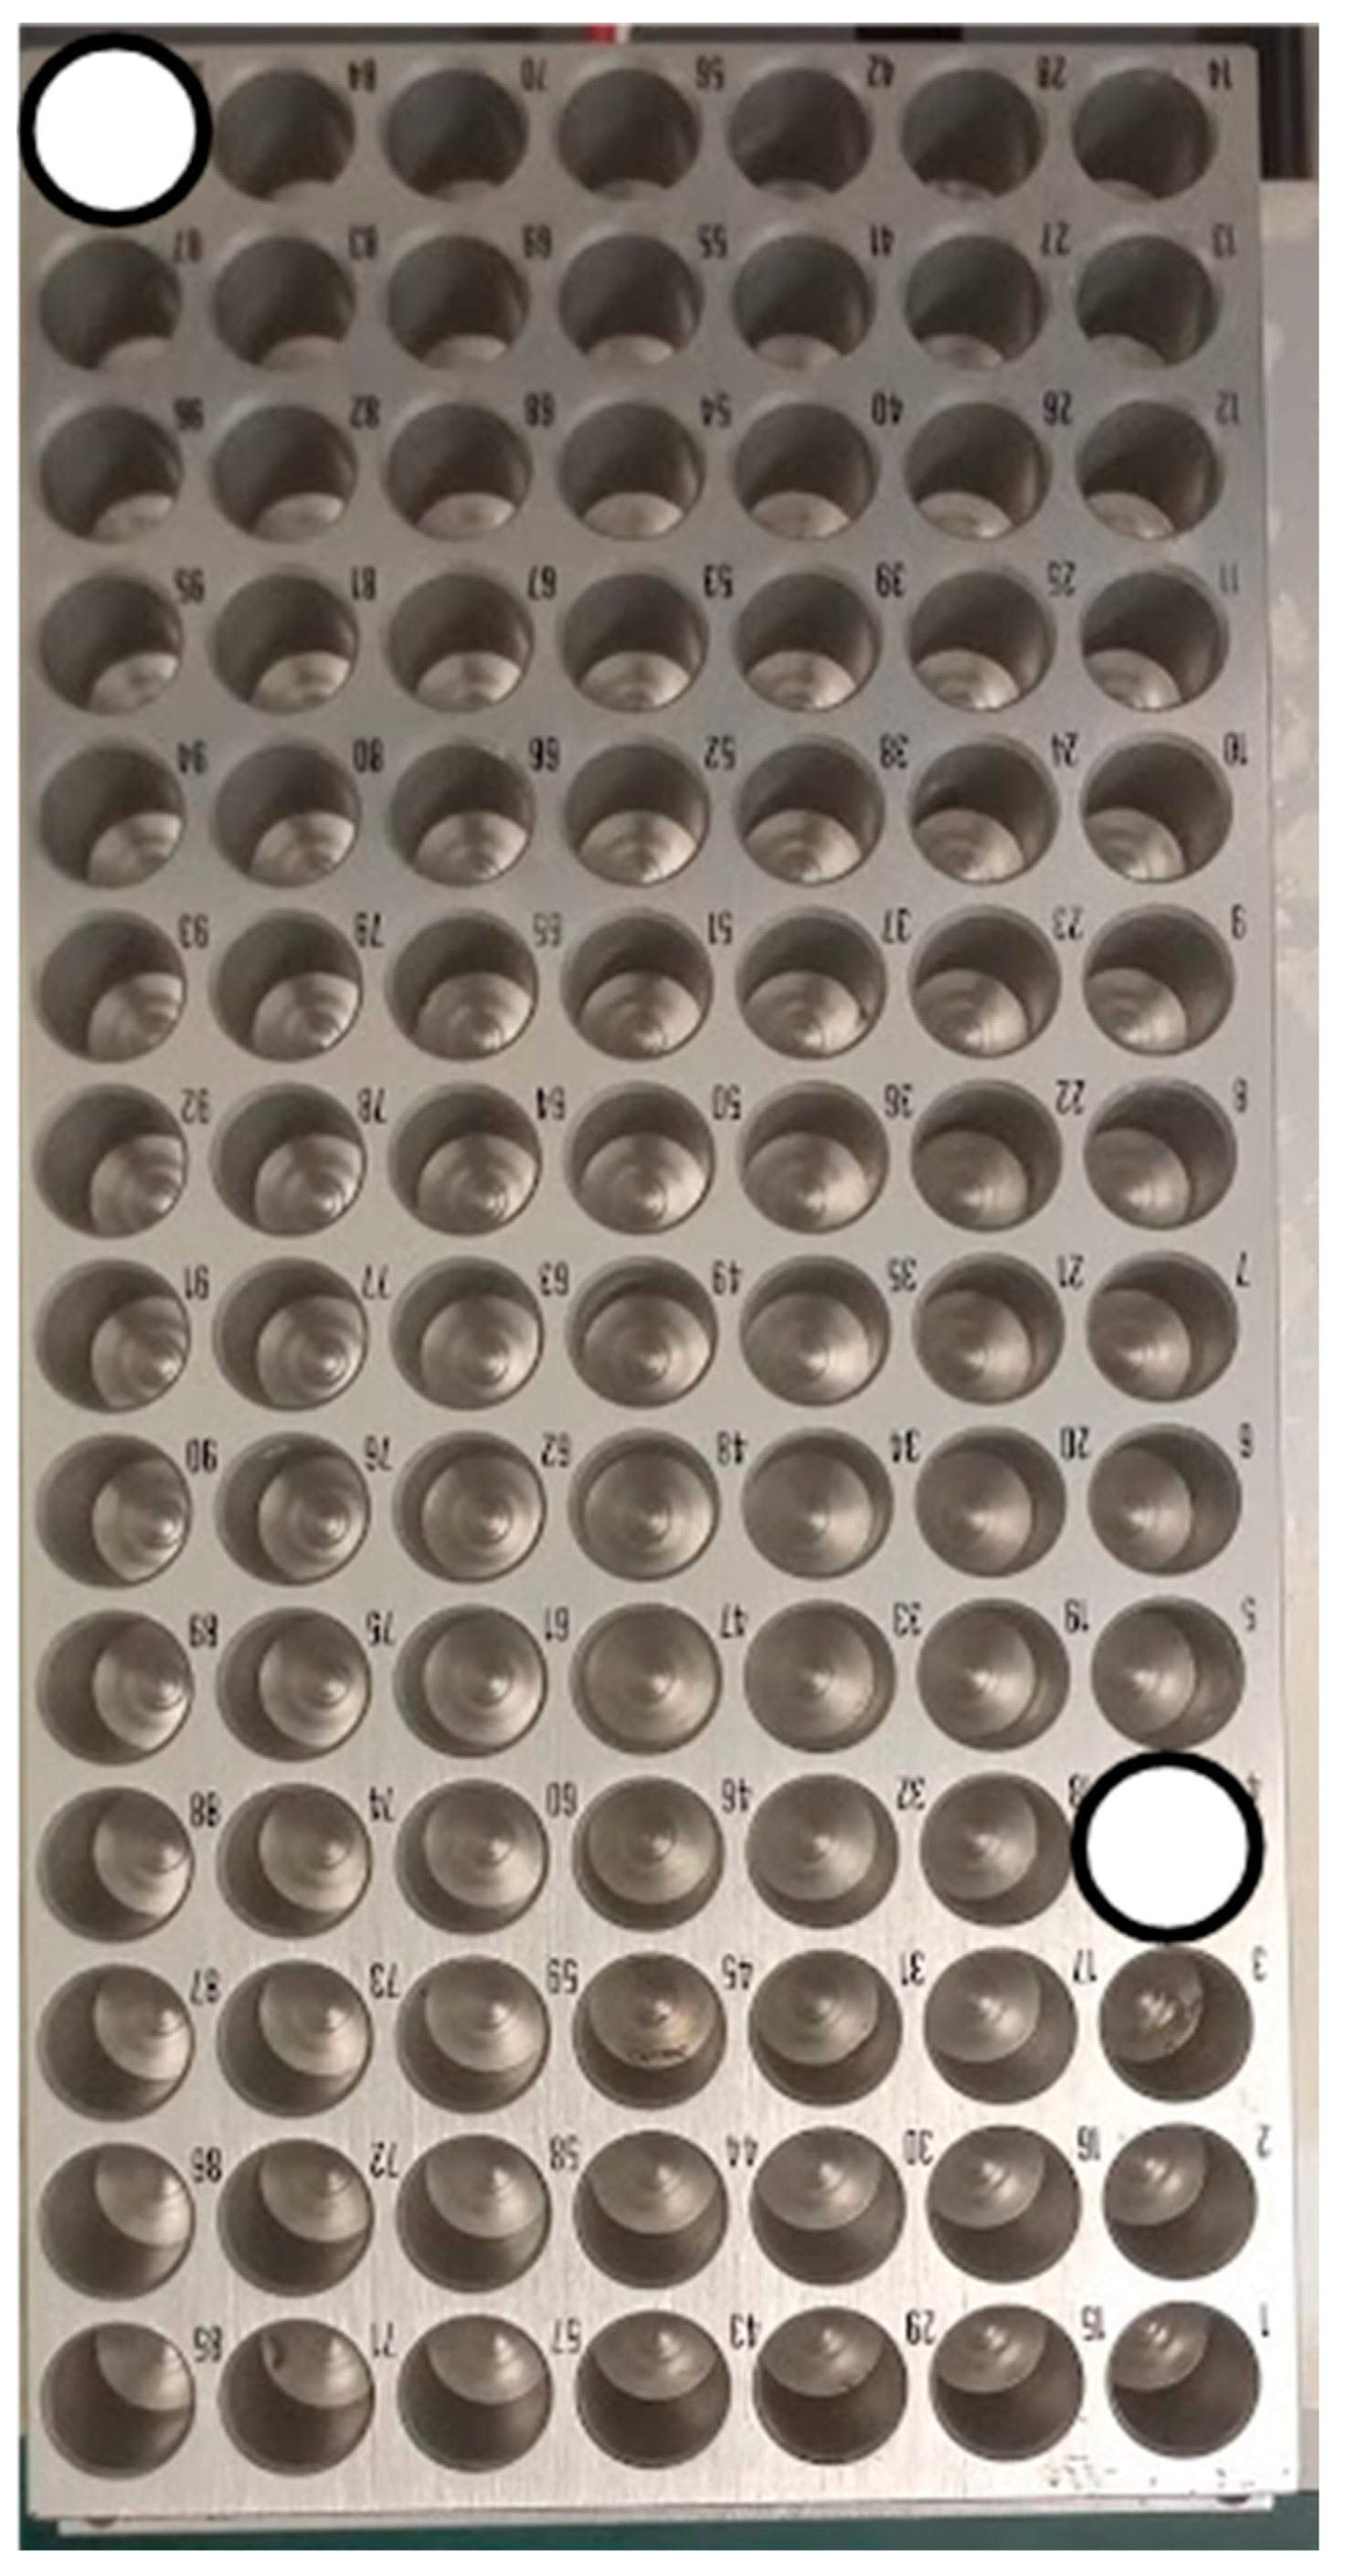
4.3. Determining Important Positions
4.4. Automated Control
- (1)
- Turn on the HPLC pump (by sending a command to the Chromeleon pump control interface);
- (2)
- Inject a sample volume from a sample in the HPLC autosampler (by sending a command to the Chromeleon sampler control interface);
- (3)
- Wait a predetermined time until the compound of interest is at the exit of the tube in the fraction collector (this needs to be determined beforehand);
- (4)
- Move the HPLC tube to the first tin capsule (by sending commands to Hype!Terminal);
- (5)
- Wait for a predetermined time above the tin capsule so that the compound is completely collected in it;
- (6)
- Move to the next tin capsule (by sending commands to Hype!Terminal);
- (7)
- Repeat step 6 for as many compounds as are needed to be collected (by sending commands to Hype!Terminal);
- (8)
- Move to the waste tube (by sending commands to Hype!Terminal);
- (9)
- Turn the HPLC pump off (by sending a command to the Chromeleon pump control interface);
- (10)
- Wait until the collected liquid has completely evaporated;
- (11)
- Repeat all steps for multiple replicates of the sample, as required to collect sufficient material for elemental analysis coupled to isotope ratio mass spectrometry (EA–IRMS).
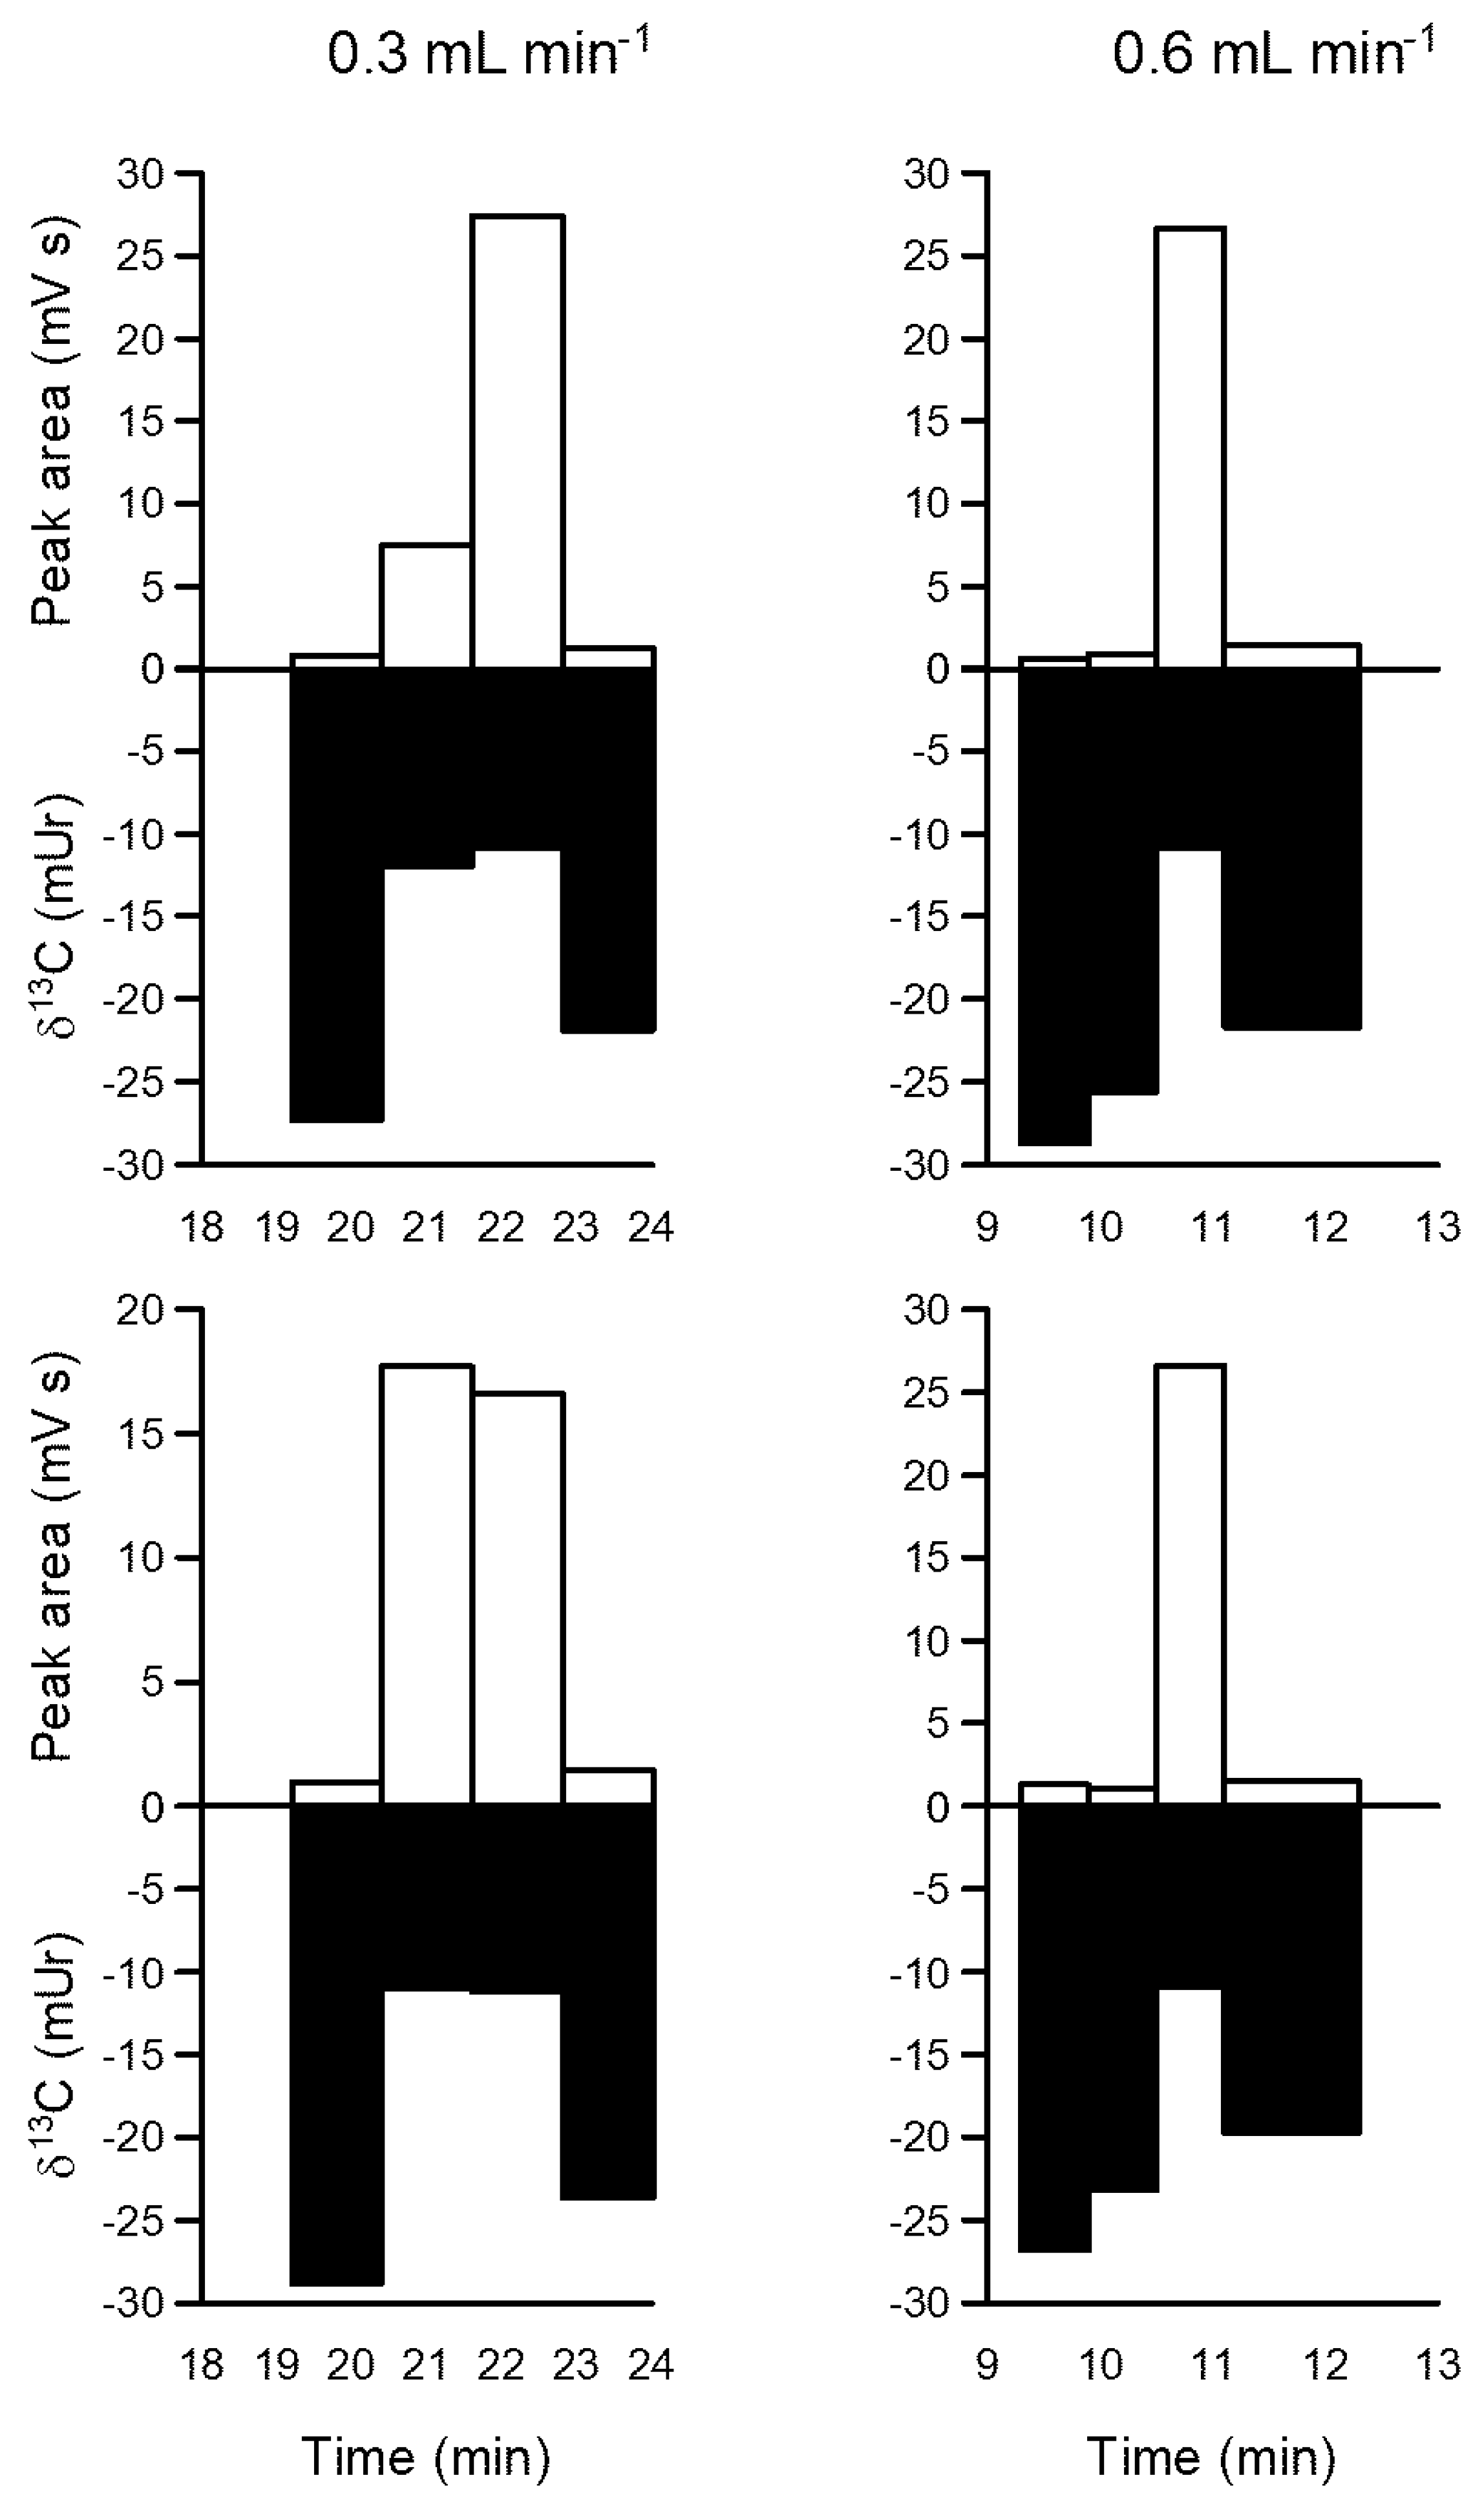
5. Validation
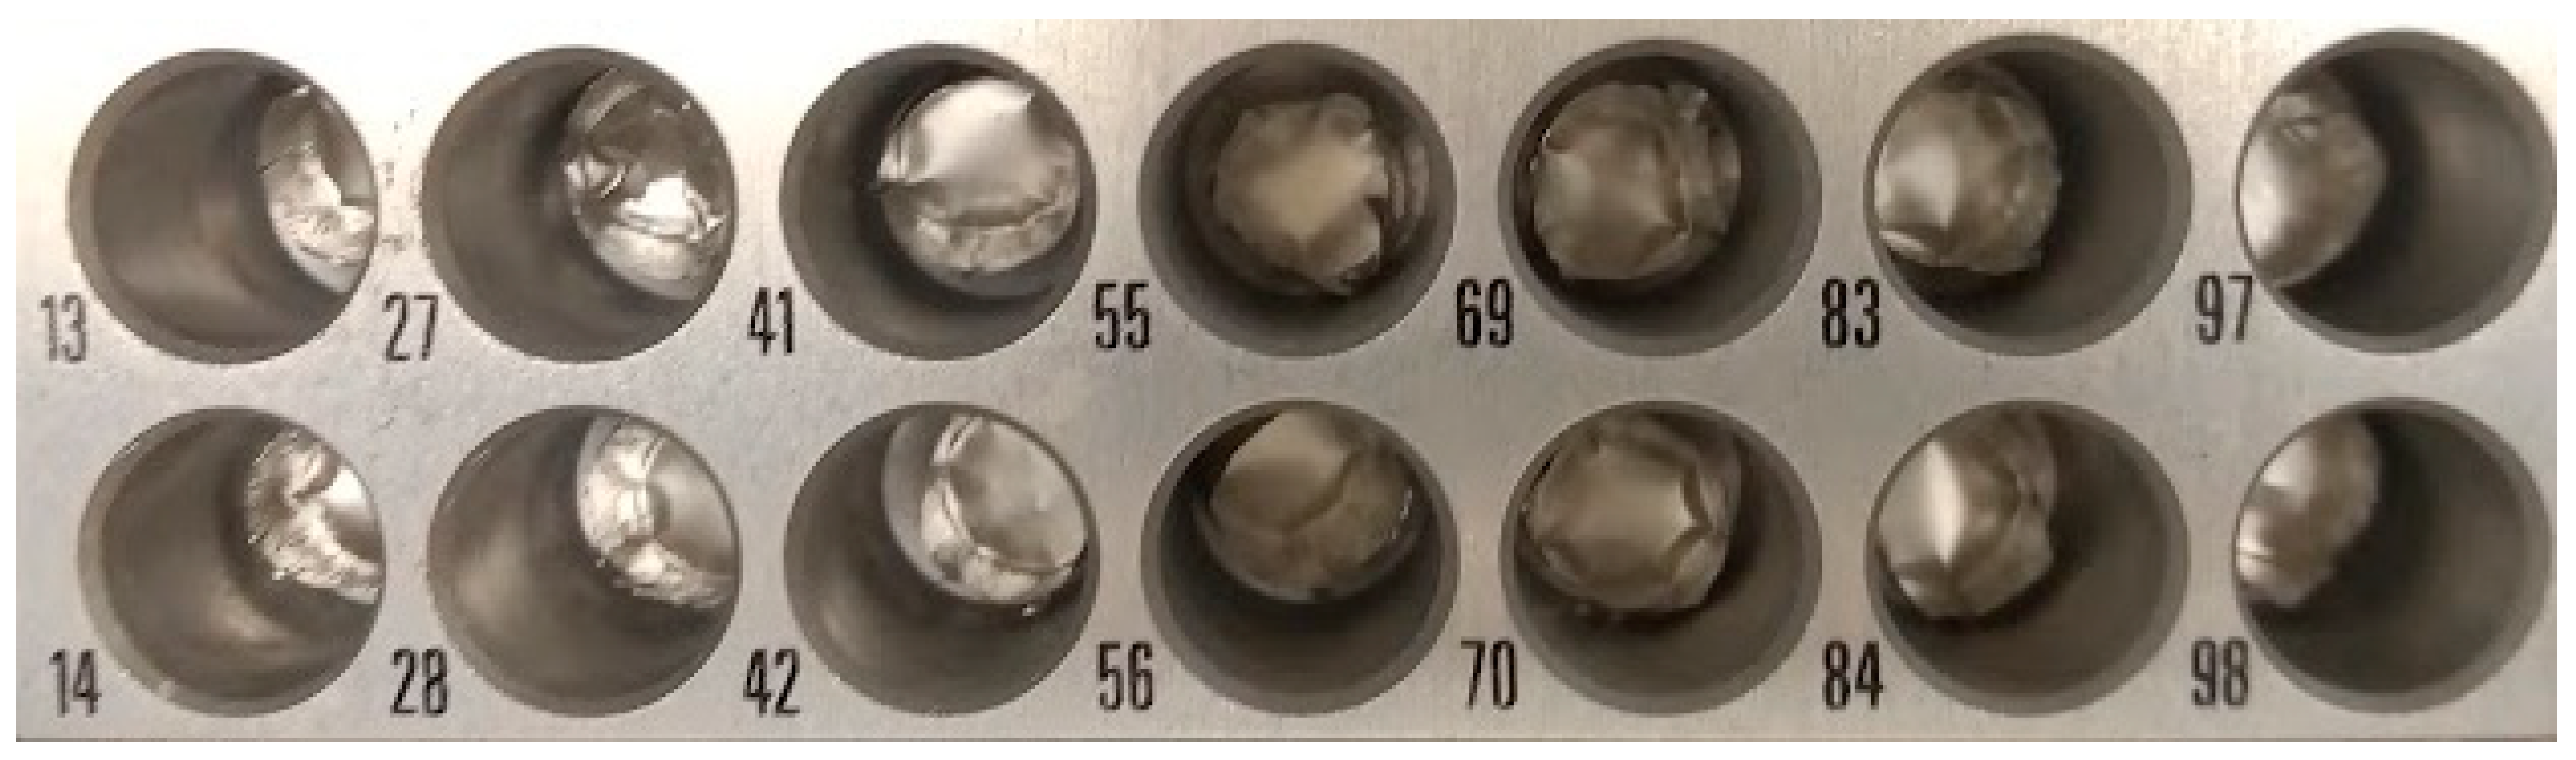
Stable Carbon Isotope Analysis of Glucose
6. Conclusions
Supplementary Materials
Author Contributions
Funding
Institutional Review Board Statement
Informed Consent Statement
Data Availability Statement
Acknowledgments
Conflicts of Interest
Appendix A

Appendix B


References
- Meier-Augenstein, W. GC and IRMS technology for 13C and 15N analysis on organic compounds and related gases. In Handbook of Stable Isotope Analytical Techniques; De Groot, H.J., Ed.; Elsevier: Amsterdam, The Netherlands, 2004; Volume 1, pp. 153–176. [Google Scholar]
- Whiteman, J.P.; Elliott Smith, E.A.; Besser, A.C.; Newsome, S.D. A Guide to Using Compound-Specific Stable Isotope Analysis to Study the Fates of Molecules in Organisms and Ecosystems. Diversity 2019, 11, 8. [Google Scholar] [CrossRef]
- Veuger, B.; van Oevelen, D.; Middelburg, J.J. Fate of microbial nitrogen, carbon, hydrolysable amino acids, monosaccharides, and fatty acids in sediment. Geochim. Cosmochim. Acta 2012, 83, 217–233. [Google Scholar] [CrossRef]
- Moerdjik-Poortvliet, T.C.W.; van Breugel, P.; Sabbe, K.; Beauchard, O.; Stal, L.J.; Boschker, H.T.S. Seasonal changes in the biochemical fate of carbon fixed by benthic diatoms in intertidal sediments. Limnol. Oceanogr. 2018, 63, 550–569. [Google Scholar] [CrossRef]
- Moerdijk-Poortvliet, T.C.W.; Stal, L.J.; Boshker, H.T.S. LC/IRMS analysis: A powerful technique to trace carbon flow in microphytobenthic communities in intertidal sediments. J. Sea Res. 2014, 92, 19–25. [Google Scholar] [CrossRef]
- Oakes, J.; Riekenberg, P.; Eyre, B. Assimilation and short-term processing of microphytobenthos nitrogen in intertidal sediments. Limnol. Oceanogr. 2020, 65, 2377–2389. [Google Scholar] [CrossRef]
- Riekenberg, P.; Oakes, J.M.; Eyre, B.D. Uptake of dissolved organic and inorganic nitrogen in microalgae-dominated sediment: Comparing dark and light in situ and ex situ additions of 15N. Mar. Ecol. Prog. Ser. 2017, 571, 29–42. [Google Scholar] [CrossRef]
- Riekenberg, P.; van der Heide, T.; Holthuijsen, S.J.; van der Veer, H.W.; van der Meer, M.T.J. Compound-specific stable isotope analysis of amino acid nitrogen reveals detrital support of microphytobenthos in the Dutch Wadden Sea benthic food web. Front. Ecol. Evol. 2022, 10, 951047. [Google Scholar] [CrossRef]
- Ohkouchi, N.; Chikaraishi, Y.; Close, H.G.; Fry, B.; Larsen, T.; Madigan, D.J.; McCarthy, M.D. Advances in the application of amino acid nitrogen isotopic analysis in ecological and biogeochemical studies. Org. Geochem. 2017, 113, 150–174. [Google Scholar] [CrossRef]
- Pollierer, M.M.; Larsen, T.; Popatov, A.; Bruckner, A.; Heethoff, M.; Dyckmans, J.; Scheu, S. Compound-specific isotope analysis of amino acids as a new tool to uncover trophic chains in soil food webs. Ecol. Monogr. 2019, 89, e01384. [Google Scholar] [CrossRef]
- Hanz, U.; Riekenberg, P.; de Kluijver, A.; van der meer, M.; Middelburg, J.J.; de Goeji, J.M.; Bart, M.C.; Wurz, E.; Colaço, A.; Duineveld, G.C.A.; et al. The important role of sponges in carbon and nitrogen cycling in a deep-sea biological hotspot. Funct. Ecol. 2022, 36, 2188–2199. [Google Scholar] [CrossRef]
- Oakes, J.; Rysgaard, S.; Glud, R.N.; Eyre, B.D. The transformation and fate of sub-Arctic microphytobenthos carbon revealed through 13C-labeling. Limnol. Oceanogr. 2016, 61, 2296–2308. [Google Scholar] [CrossRef]
- Burian, A.; Nielsen, J.M.; Hansen, T.; Bermudez, R.; Winder, M. The potential of fatty acid isotopes to trace trophic transfer in aquatic food-webs. Philos. Trans. R. Soc. B 2020, 375, 20190652. [Google Scholar] [CrossRef] [PubMed]
- Twining, C.W.; Taipale, S.J.; Ruess, L.; Bec, A.; Martin-Creuzburg, D.; Kainz, M.J. Stable isotopes of fatty acids: Current and future perspectives for advancing trophic ecology. Philos. Trans. R Soc. Lond B Biol. Sci. 2020, 375, 20190641. [Google Scholar] [CrossRef] [PubMed]
- Broek, T.A.B.; McCarthy, M.D. A new approach to δ15N compound-specific amino acid trophic position measurements: Preparative high pressure liquid chromatography technique for purifying underivatized amino acids for stable isotope analysis. Limnol. Oceanogr. Methods 2014, 12, 840–852. [Google Scholar] [CrossRef]
- Phillips, A.A.; Wu, F.; Sessions, A.L. Sulfur isotope analysis of cysteine and methionine via preparatory liquid chromatography and elemental analyzer isotope ratio mass spectrometry. Rapid Commun. Mass Spectrom. 2020, 35, e9007. [Google Scholar] [CrossRef] [PubMed]
- Sun, Y.; Ogawa, N.O.; Ishikawa, N.F.; Blattmann, T.M.; Takano, Y.; Ohkouchi, N. Application of a porous graphitic carbon column to carbon and nitrogen isotope analysis of underivatized individual amino acids using high-performance liquid chromatography coupled with elemental analyzer/isotope ratio mass spectrometry. Rapid Commun. Mass Spectrom. 2023, 37, e9602. [Google Scholar] [CrossRef] [PubMed]
- Zhang, L.; Lee, W.-m.C.; Kreider-Mueller, A.; Kuhnel, E.; Baca, J.; Ji, C.; Altabet, M.A. High-precision measurement of phenylalanine and glutamic acid δ15N by coupling ion-exchange chromatography and purge-and-trap continuous-flow isotope ratio mass spectrometry. Rapid Commun. Mass Spectrom. 2021, 35, e9085. [Google Scholar] [CrossRef]
- Yun, H.Y.; Won, E.-J.; Choi, J.; Cho, Y.; Lim, D.-J.; Kim, I.-S.; Shin, K.-H. Stable isotope analysis of residual pesticides via High Performance Liquid Chromatography and Elemental Analyzer–Isotope Ratio Mass Spectrometry. Molecules 2022, 27, 8587. [Google Scholar] [CrossRef]
- Broek, T.A.B.; Walker, B.D.; Andreasen, D.H.; McCarthy, M.D. High-precision measurement of phenylalanine δ15N values for environmental samples: A new approach coupling high-pressure liquid chromatography purification and elemental analyzer isotope ratio mass spectrometry. Rapid Commun. Mass Spectrom. 2013, 27, 2327–2337. [Google Scholar] [CrossRef]
- Mauve, C.; Bleton, J.; Bathellier, C.; Lelarge-Trouverie, C.; Guérard, F.; Ghashghaie, J.; Tchapla, A.; Tcherkez, G. Kinetic 12C/13C isotope fractionation by invertase: Evidence for a small in vitro isotope effect and comparison of two techniques for the isotopic analysis of carbohydrates. Rapid Commun. Mass Spectrom. 2009, 23, 2499–2506. [Google Scholar] [CrossRef]
- Thompson, R.A.; Morello, D.R.; Panicker, S.; Toske, S.G.; Li, L. Carbon and nitrogen isotopic analysis of morphine from opium and heroin samples originating in the four major heroin producing regions. Drug Test. Anal. 2022, 14, 505–513. [Google Scholar] [CrossRef] [PubMed]
- Godin, J.-P.; Fay, L.B.; Hopfgarther, G. Liquid chromatography combined with mass spectrometry for 13C isotopic analysis in life science research. Mass Spectrom. Rev. 2007, 26, 751–774. [Google Scholar] [CrossRef] [PubMed]
- Perini, M.; Bontempo, L. Liquid Chromatography coupled to Isotope Ratio Mass Spectrometry (LC-IRMS): A review. Trends Anal. Chem. 2022, 147, 116515. [Google Scholar] [CrossRef]
- Pearce, J.M. Open-Source Lab: How to Build Your Own Hardware and Reduce Research Costs; Elsevier: Waltham, MA, USA, 2014; p. 271. [Google Scholar]
- Pearce, J.M. Economic savings for scientific free and open source technology: A review. HardwareX 2020, 8, e00139. [Google Scholar] [CrossRef] [PubMed]
- Bravo-Martinez, J. Open source 3D-printed 1000 μL micropump. HardwareX 2018, 3, 110–116. [Google Scholar] [CrossRef]
- Caputo, M.; Lyles, J.T.; Salazar, M.S.; Quave, C.L. LEGO MINDSTORMS Fraction Collector: A Low-Cost Tool for a Preparative High-Performance Liquid Chromatography System. Anal. Chem. 2020, 92, 1687–1690. [Google Scholar] [CrossRef]
- Ficarro, S.B.; Alexander, W.M.; Tavarves, I.; Marto, J.A. Open source fraction collector/MALDI spotter for proteomics. HardwareX 2022, 11, e00305. [Google Scholar] [CrossRef]
- Booeshaghi, A.S.; Kil, Y.; Min, K.H.; Gehring, J.; Pachter, L. Low-cost, scalable, and automated fluid sampling for fluidics applications. HardwareX 2021, 10, e00201. [Google Scholar] [CrossRef]
- Medina, D.A.V.; Lozada-Blanco, A.; Rodrígues, J.P.G.; Lanças, F.M.; Santos-Neto, A.J. An open-source smart fraction collector for isocratic preparative liquid chromatography. HardwareX 2023, 15, e00462. [Google Scholar] [CrossRef]
- Carvalho, M.C. Automated weighing in the stable isotope lab: When less is more. MethodsX 2023, 10, 102207. [Google Scholar] [CrossRef]
- Baas, S.; Saggiomo, V. Ender3 3D printer kit transformed into open, programmable syringe pump set. HardwareX 2021, 10, e00219. [Google Scholar] [CrossRef] [PubMed]
- Zhang, C.; Wijnen, B.; Pearce, J.M. Open-Source 3-D Platform for Low-Cost Scientific Instrument Ecosystem. J. Lab. Autom. 2016, 21, 517–525. [Google Scholar] [CrossRef] [PubMed]
- Campbell, T.; Jones, J.F.X. Design and implementation of a low cost, modular, adaptable and open-source XYZ positioning system for neurophysiology. HardwareX 2020, 7, e00098. [Google Scholar] [CrossRef] [PubMed]
- Carvalho, M.C. Practical Laboratory Automation Made Easy with AutoIt; Wiley VCH: Hoboken, NJ, USA, 2016; p. 290. [Google Scholar]


Disclaimer/Publisher’s Note: The statements, opinions and data contained in all publications are solely those of the individual author(s) and contributor(s) and not of MDPI and/or the editor(s). MDPI and/or the editor(s) disclaim responsibility for any injury to people or property resulting from any ideas, methods, instructions or products referred to in the content. |
© 2023 by the authors. Licensee MDPI, Basel, Switzerland. This article is an open access article distributed under the terms and conditions of the Creative Commons Attribution (CC BY) license (https://creativecommons.org/licenses/by/4.0/).
Share and Cite
Carvalho, M.C.; Oakes, J.M. Turning a 3D Printer into a HPLC Fraction Collector: A Tool for Compound-Specific Stable Isotope Measurements. Hardware 2023, 1, 29-53. https://doi.org/10.3390/hardware1010004
Carvalho MC, Oakes JM. Turning a 3D Printer into a HPLC Fraction Collector: A Tool for Compound-Specific Stable Isotope Measurements. Hardware. 2023; 1(1):29-53. https://doi.org/10.3390/hardware1010004
Chicago/Turabian StyleCarvalho, Matheus C., and Joanne M. Oakes. 2023. "Turning a 3D Printer into a HPLC Fraction Collector: A Tool for Compound-Specific Stable Isotope Measurements" Hardware 1, no. 1: 29-53. https://doi.org/10.3390/hardware1010004