Article

Ultrasonic Non-Contact Air-Coupled Technique for the Assessment of Composite Sandwich Plates Using Antisymmetric Lamb Waves

1
Institute of Cybernetic, Mathematic and Physic (ICIMAF), La Habana CP 10400, Cuba
2
Dasel S.L., 28500 Madrid, Spain
3
AIMEN Technology Center, 36410 Pontevedra, Spain
4
ITEFI, 28006 Madrid, Spain
5
Engineering Program-COPPE, Federal University of Rio de Janeiro, Rio de Janeiro 21941-901, Brazil
*
Author to whom correspondence should be addressed.
NDT 2023, 1(1), 58-73; https://doi.org/10.3390/ndt1010006
Submission received: 7 September 2023 / Revised: 6 October 2023 / Accepted: 12 October 2023 / Published: 28 October 2023

Abstract

:
This paper describes the design and implementation of an ultrasonic non-contact air-coupled technique (UNCACT) using antisymmetric Lamb waves (ALW) for NDT assessments in novel composite sandwich plates of a car body shell. This technique is complemented with a C-Scan image implementation using guided waves. The finite element method (FEM) was developed using Comsol 6.1 for the interpretation of the several wave modes presented in the experiments, including the ALW mode. This FEM model is indispensable for the correct interpretation of the received signals and contributes to a better implementation of this technology. This is a novel contribution building upon previously reported work. Additionally, the phase velocity method (PVM) was applied for the verification of the ALW mode in the portion of the RF signal necessary for the C-Scan image.

1. Introduction

One of the most sustainable methods of transportation is by train. The continuous maintenance of railway vehicles plays a central role in enabling the correct functioning of this method of transportation. This should include a fast automatic testing method for the car body structure in order to find possible flaws in its plate shell, which can occur as a consequence of impacts from the external environment. Railway vehicles are at present being made with novel composite materials, like sandwich plates, which are composed of two layers of anisotropic CFRP of a few mm in thickness that cover a central foam layer.
The testing of a car body’s composite sandwich material is very complex because of the anisotropic material present in the CFRP and the greater attenuation of the foam and its plane geometry. Classical high-ultrasonic techniques in the MHz ranges cannot be applied in practical implementations. One possible solution is to use low ultrasound frequencies, which induce the antisymmetric Lamb wave (ALW) mode, and by using two air-coupled ultrasonic transducers, an emitter (Tx) and receiver (Rx).
The ultrasonic non-contact air-coupled technique (UNCACT) is considered an emerging NDT method [1,2]. The objective of this paper is to implement this technique based on the ALW mode, induced only on the upper CFRP layer of the sandwich material. This target is improved with a C-Scan image output presentation based on the mechanical scanning performance of the Tx and R
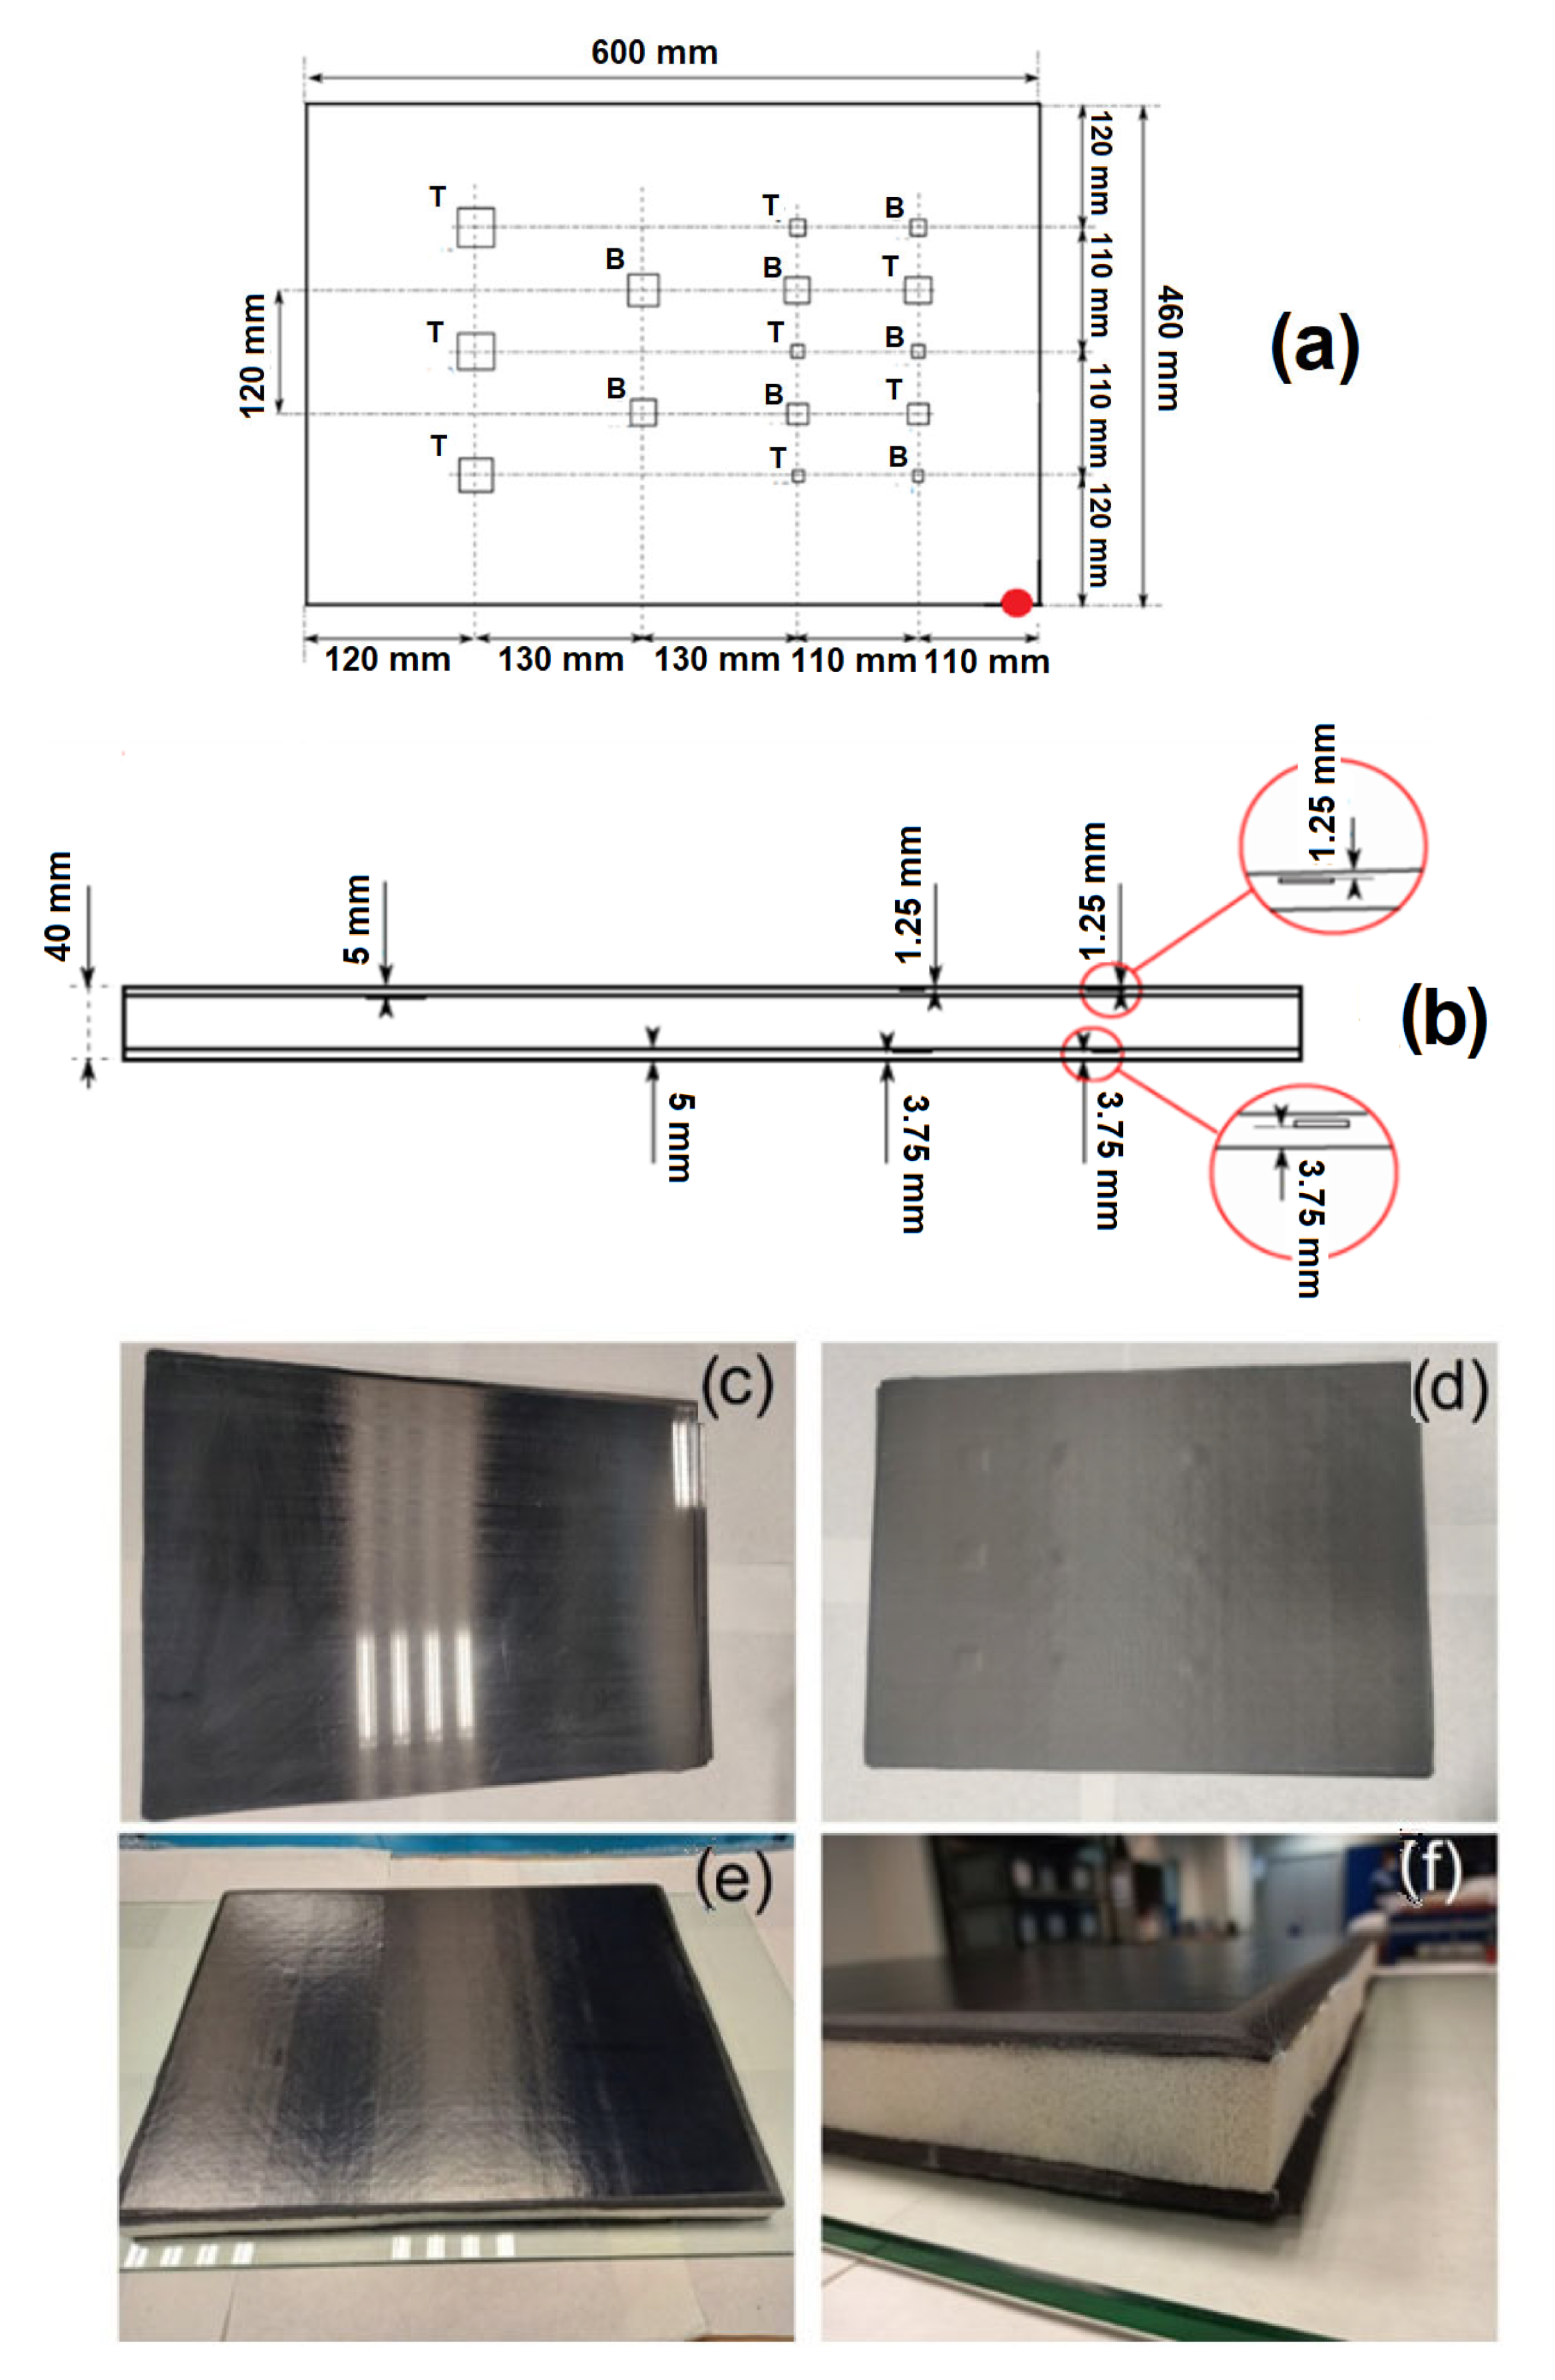
x transducers, moving as a whole at a fixed distance over the sample. Two images were obtained on both sides of a single sandwich plate, a sample that was made specifically for this work. This sandwich plate included defects of different sizes and positions in both CFRP layers.
We used the upper CFRP layer with the ALW mode for the evaluation of possible defects in the upper side of the car body shell induced by accidental impacts. The use of the ALW mode, which propagates in the upper CFRP plate, is justified because it is assumed that any defect in this layer changes its amplitude. Consequently, this would produce a color change in the C-Scan image. Thus, part of the objective of this paper includes the identification and selection of this ALW mode. This was performed on the RF signal received at Rx, as a consequence of the multiple modes induced by the emitter Tx. For these purposes, the phase velocity method (PVM) was included to help the identification of the Lamb mode, as a part of the RF signal [3,4,5,6].
Theoretical models were also developed, using the finite element method (FEM) in the Comsol software for the wave propagation in the sandwich plate. In these models, the CFRP layers were considered to be orthotropic material [7], whereas the foam was considered isotropic. Viscoelastic properties were not considered [8]. The aim of these models was to describe and identify the several propagation modes in the RF ultrasonic signal components. Analytical dispersion curves were also implemented for the single CFRP plate. This is a consequence of the relatively high frequency used in this work. However, there is a case of theoretical dispersion curves obtained for the whole sandwich, as can be found in the literature [9].
The FEM method is not the only model that could be used to describe wave propagation using air-coupling Lamb waves in plates. In [10], there is a description of the performance of the UNCACT technique using the impulse response method (IRM). This method allows for the RF signal to be obtained in the receiver. However, it was used in an isotropic plate, not in a sandwich sample with an anisotropic CFRP cover plate. Also, it is not possible to evaluate the possible reverberations between the emitter Tx and receiver Rx transducers. Nevertheless, this work could be considered a first step in the implementation of this technology.
Sandwich ultrasonic testing using Lamb waves is also mentioned in [11]. However, this study involved using small piezoelectric patches for the generation and reception of Lamb waves.
Hillger described the use of the UNCACT for aerospace components in his works [12,13,14,15], which included analyzing sandwich material with C-Scan images. The results obtained by this author also explored the through-transmission technique (TTT). However, these studies only addressed ultrasonic technology without the use of simulation tools. Hence, Hillger himself recommended the use of FEM models for this technology’s improvement and for the identification of the received ultrasonic signals [12].
The UNCACT technology is not the only one of its kind reported in the literature. Others have reported using lasers for Lamb wave generation and an IR thermographic system, developed in the last decade, for this sandwich material [16,17,18,19]. In [20], a theoretical model was developed for the evaluation of the impact damage in composite structures.
Overall, the main objective of this work is to use a C-Scan ultrasound system for the sandwich material in car body components, with novel FEM modeling for the interpretation of the ultrasonic signals obtained at the receiver. These signals were not only composed of Lamb waves, but also of the reverberation in the air between the transducers. It is well-known that the identification of the obtained signals is crucial for the correct interpretation of an ultrasound test.

2. Theoretical Models

2.1. Analytical Dispersion Curve of Orthotropic Materials

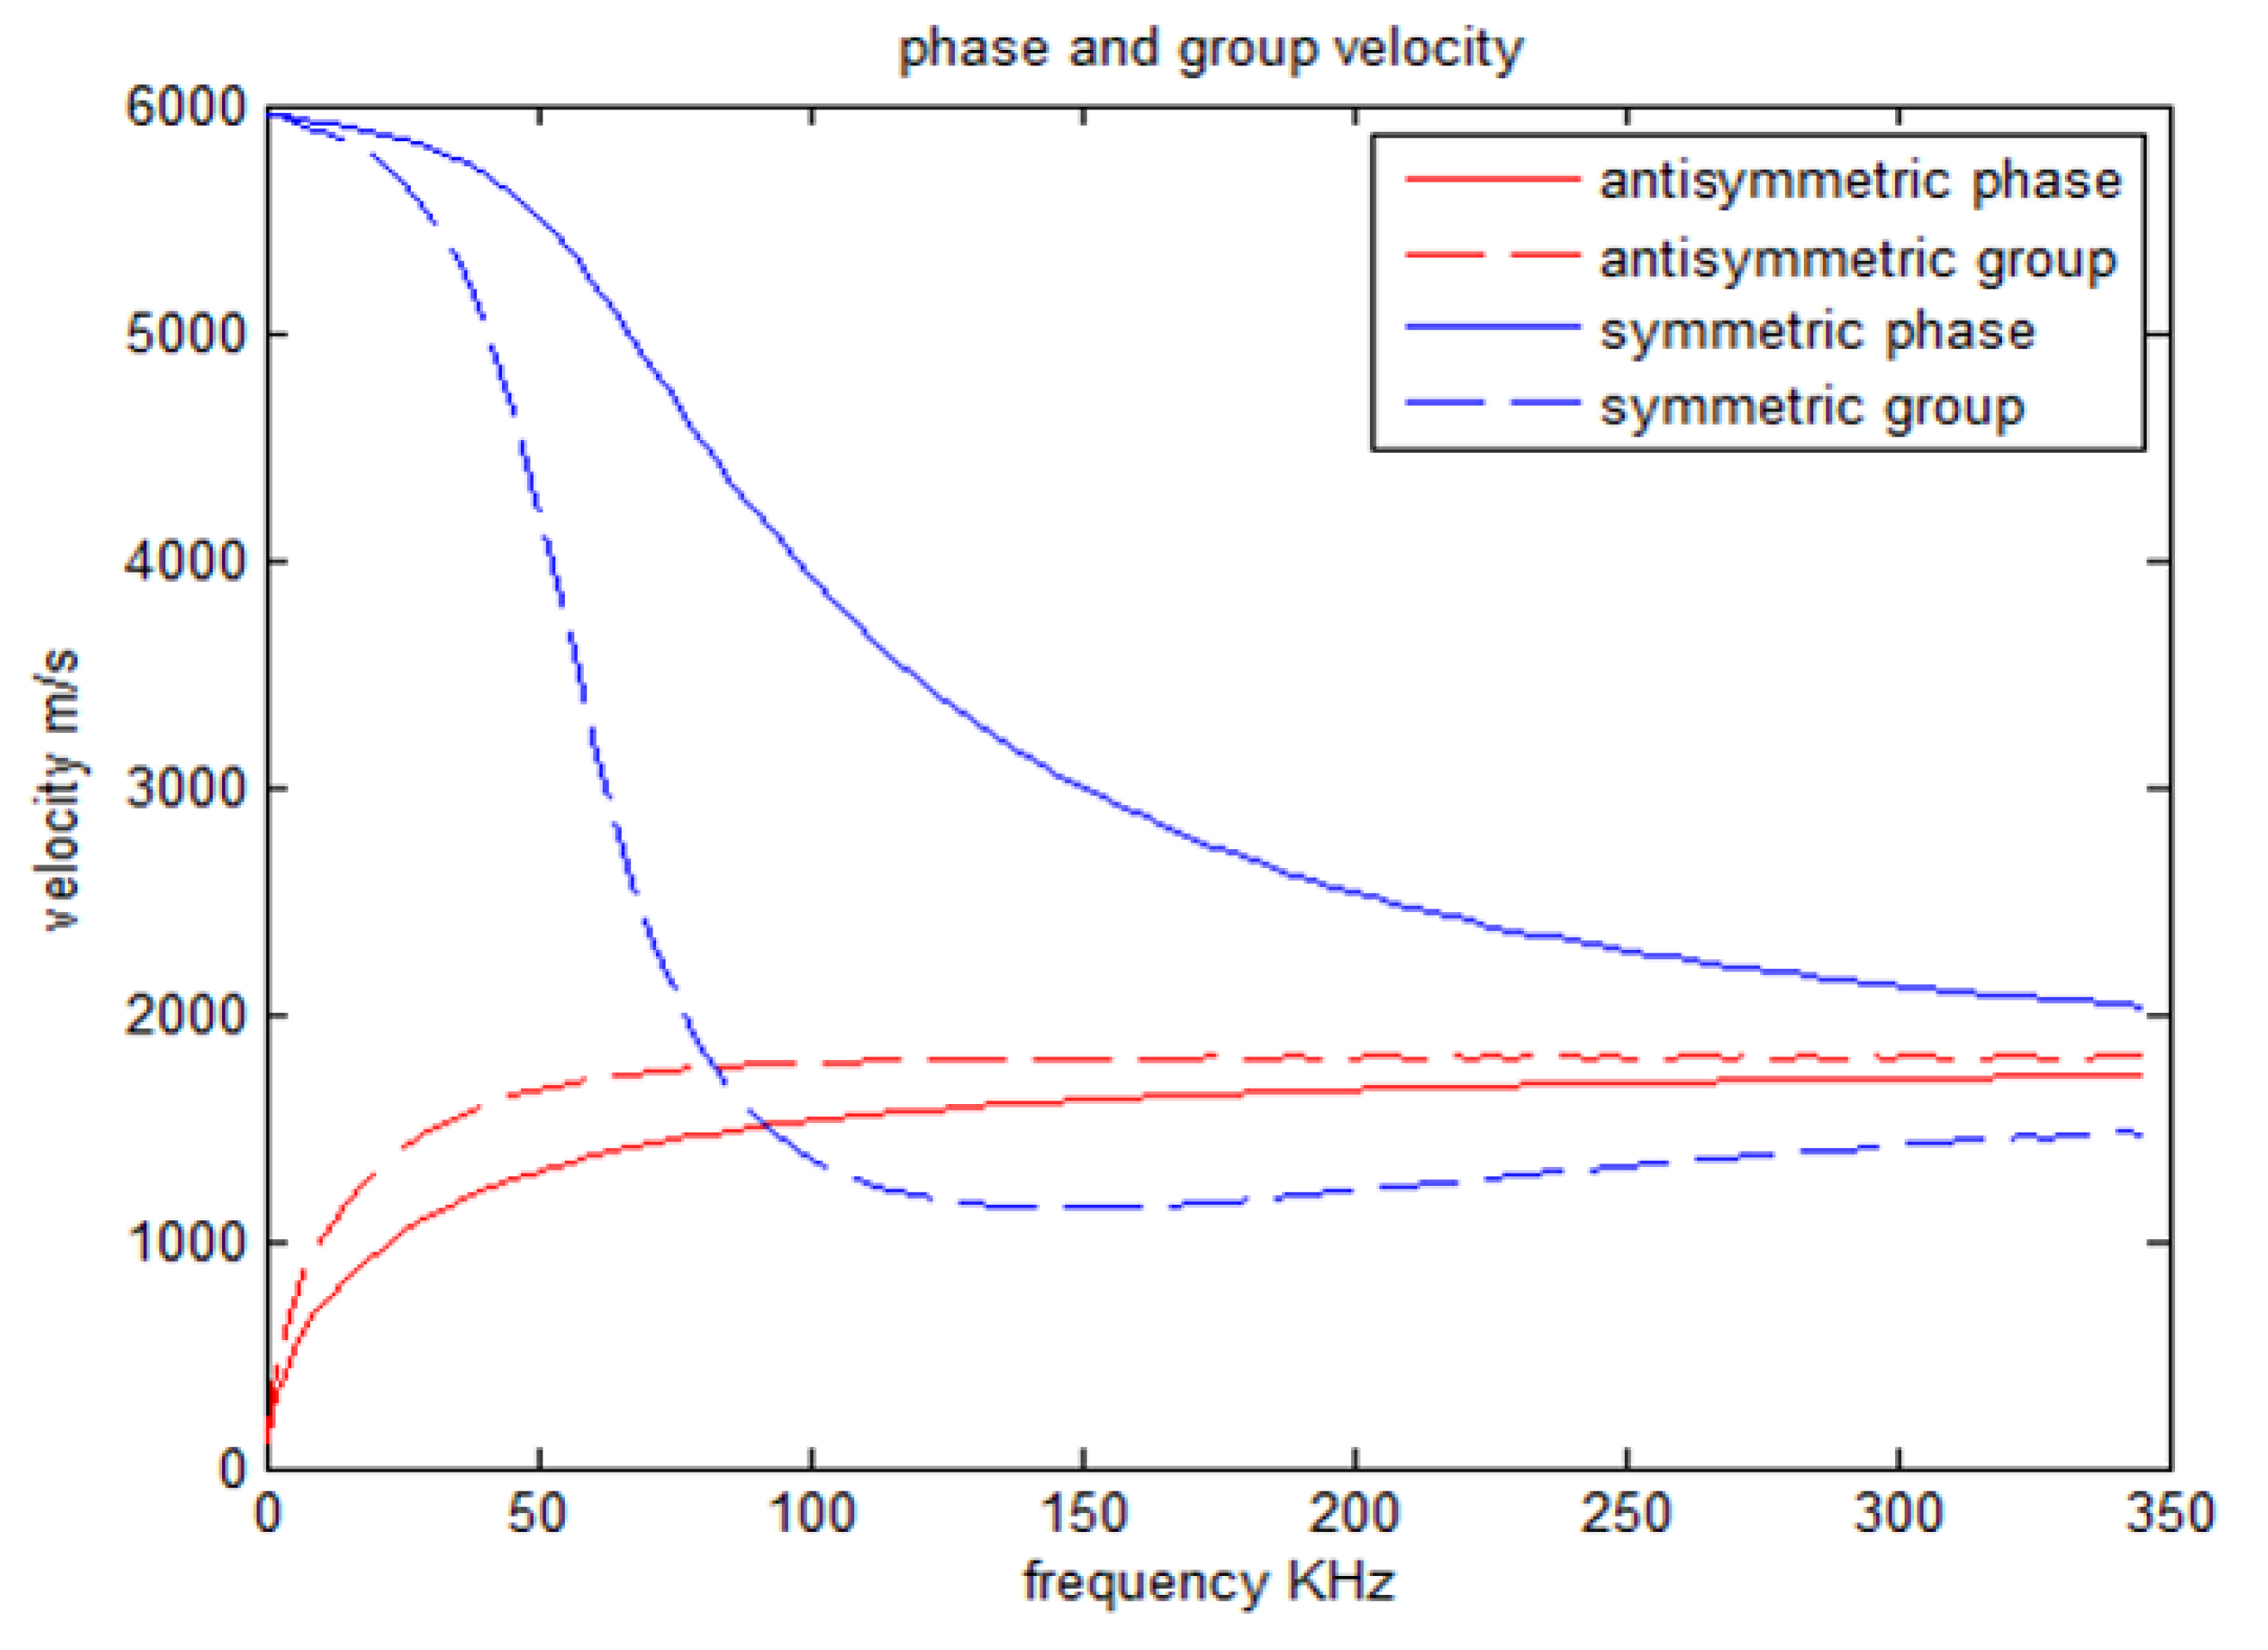
Dispersion phenomena affect Lamb waves. These include relations between the phase (and group velocity) and the frequency (or with the ratio of the thickness and wavelength). These relations are known as dispersion curves and, in the case of isotropic materials, they are obtained using the classic Lamé equations [21,22]. In [10], Castaing presented the basic formulation of a single orthotropic CFRP layer with similar results as those obtained previously.
Figure 1 shows the results of an example of dispersion curves for a CFRP plate with a thickness of 5 mm using the values of elastic constants obtained from a previous paper [7] (Table 1). As it is well known, these curves do not consider either excitation or pulse propagation.

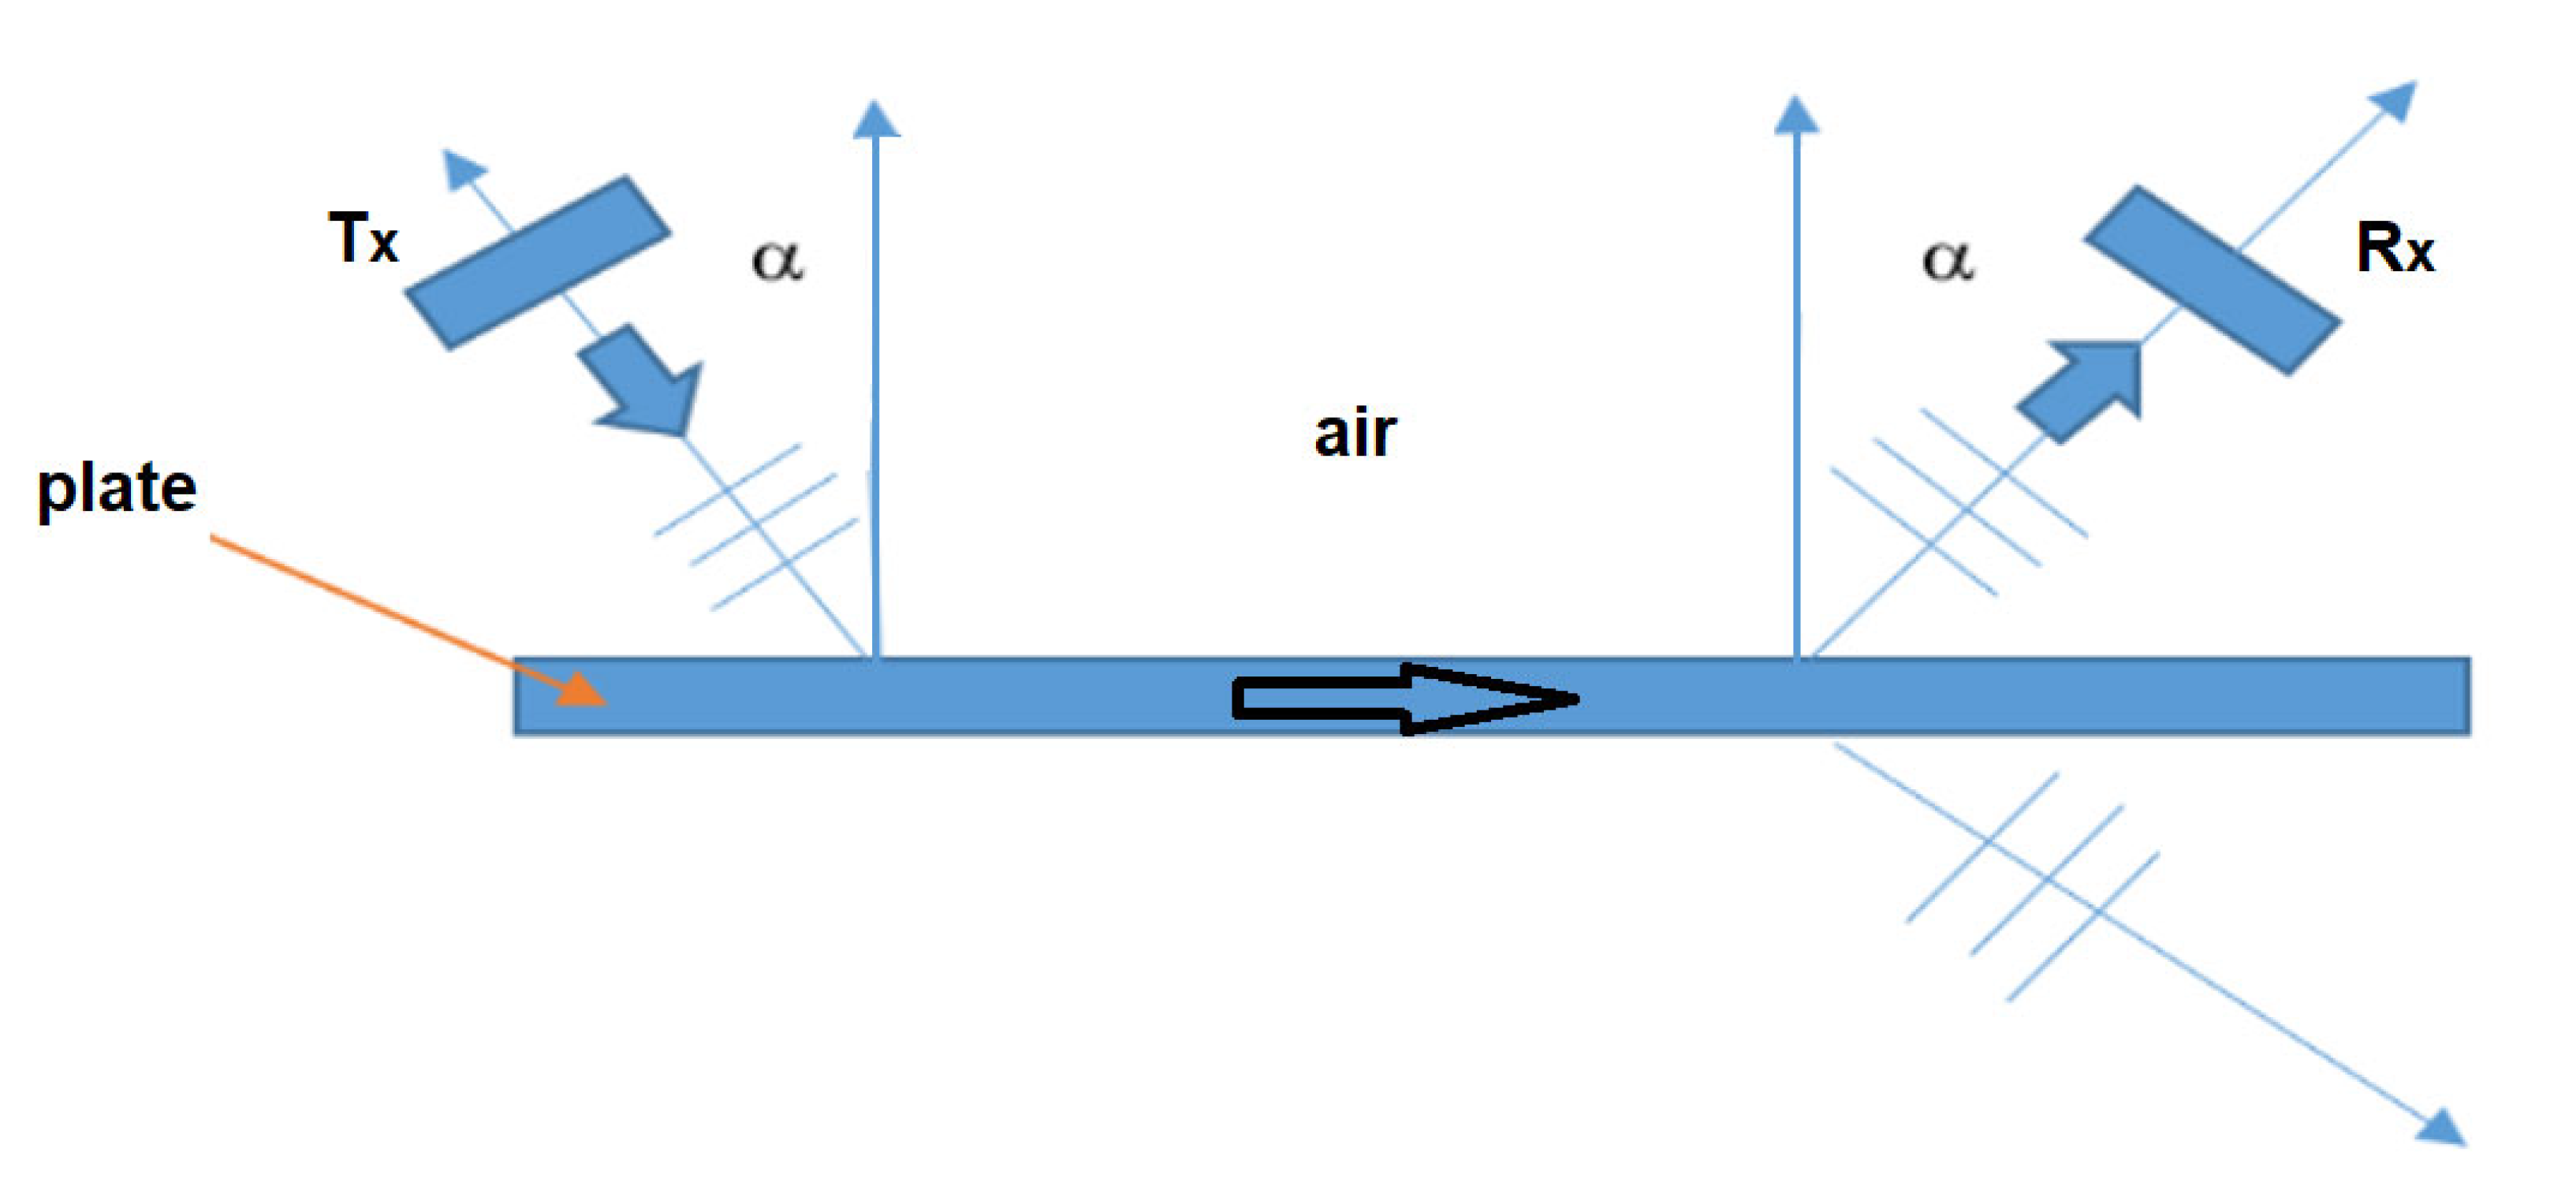
2.2. Excitation of the Lamb Wave Mode Using Non-Contact Air-Coupled Transducers

Figure 2 shows a diagram for the generation and detection of an ALW mode in a single plate, as a first theoretical model. Two air-coupled transducers (transmitter Tx and receiver Rx) are shown with the same angle α. In the case of Tx, a first simple model for the incident angle was obtained from Snell’s law (Equation (1)), assuming a refracted critical angle of 90°. In Equation (1), cair corresponds to the velocity of the longitudinal waves in the air (360 m/s) and c corresponds to the desired Lamb mode, at a specific frequency, from the dispersion curve of Figure 1.
s i n α = C a i r C
In Figure 2, a second air transducer (Rx), located close to Tx, was used to receive a complex RF signal. It is composed of the air leakage from the ALW propagation and a possible air reverberation between both transducers. The air leakage in the reception was not considered in the previous dispersion curves. Nevertheless, these were used according to the low acoustic impedance of the air. There are some references to the use of leaked Lamb waves in NDT testing [12,13,14], but these works assume a plate immersed in a fluid, generally water [15], which is not the same as our air case.
Equation (1) also shows a minimum condition for the phase velocity c. This value should be greater than the phase velocity of the longitudinal waves in the air (360 m/s). Then, for a frequency of 250 KHz, for example, it is possible to induce the ALW mode, because the phase velocity is still higher than air velocity according to the dispersion curves (Figure 1). This mode cannot be obtained, for instance, in an acrylic or rexolite wedge with a longitudinal velocity greater than 2000 m/s. An estimated angle, in this case, should be within an interval from approximately 10° to 15°.
In Equation (1), for the angle calculations, we assumed a dispersion curve of a single homogeneous and orthotropic plate. Therefore, this is a novel approach for the complex sandwich case, where only the upper CFRP plate for the ALW mode propagation was considered. To describe the wave propagation in this complex material, with two CFRP layers covering a foam plate, it is necessary to develop models based on the finite element method (FEM). These models include both air wedges with Tx and Rx transducers. Finally, pulse propagation should be included, which was not possible to consider in the previous single model plate.

2.3. Finite Element Method Models

As mentioned above, to describe the pulse propagation in the sandwich case with the UNCACT method, several FEM models were developed using Comsol 6.1. These models allowed us to obtain insights into the physics of the wave propagation in the sandwich plate.
In this case, the material components were considered as solids. 
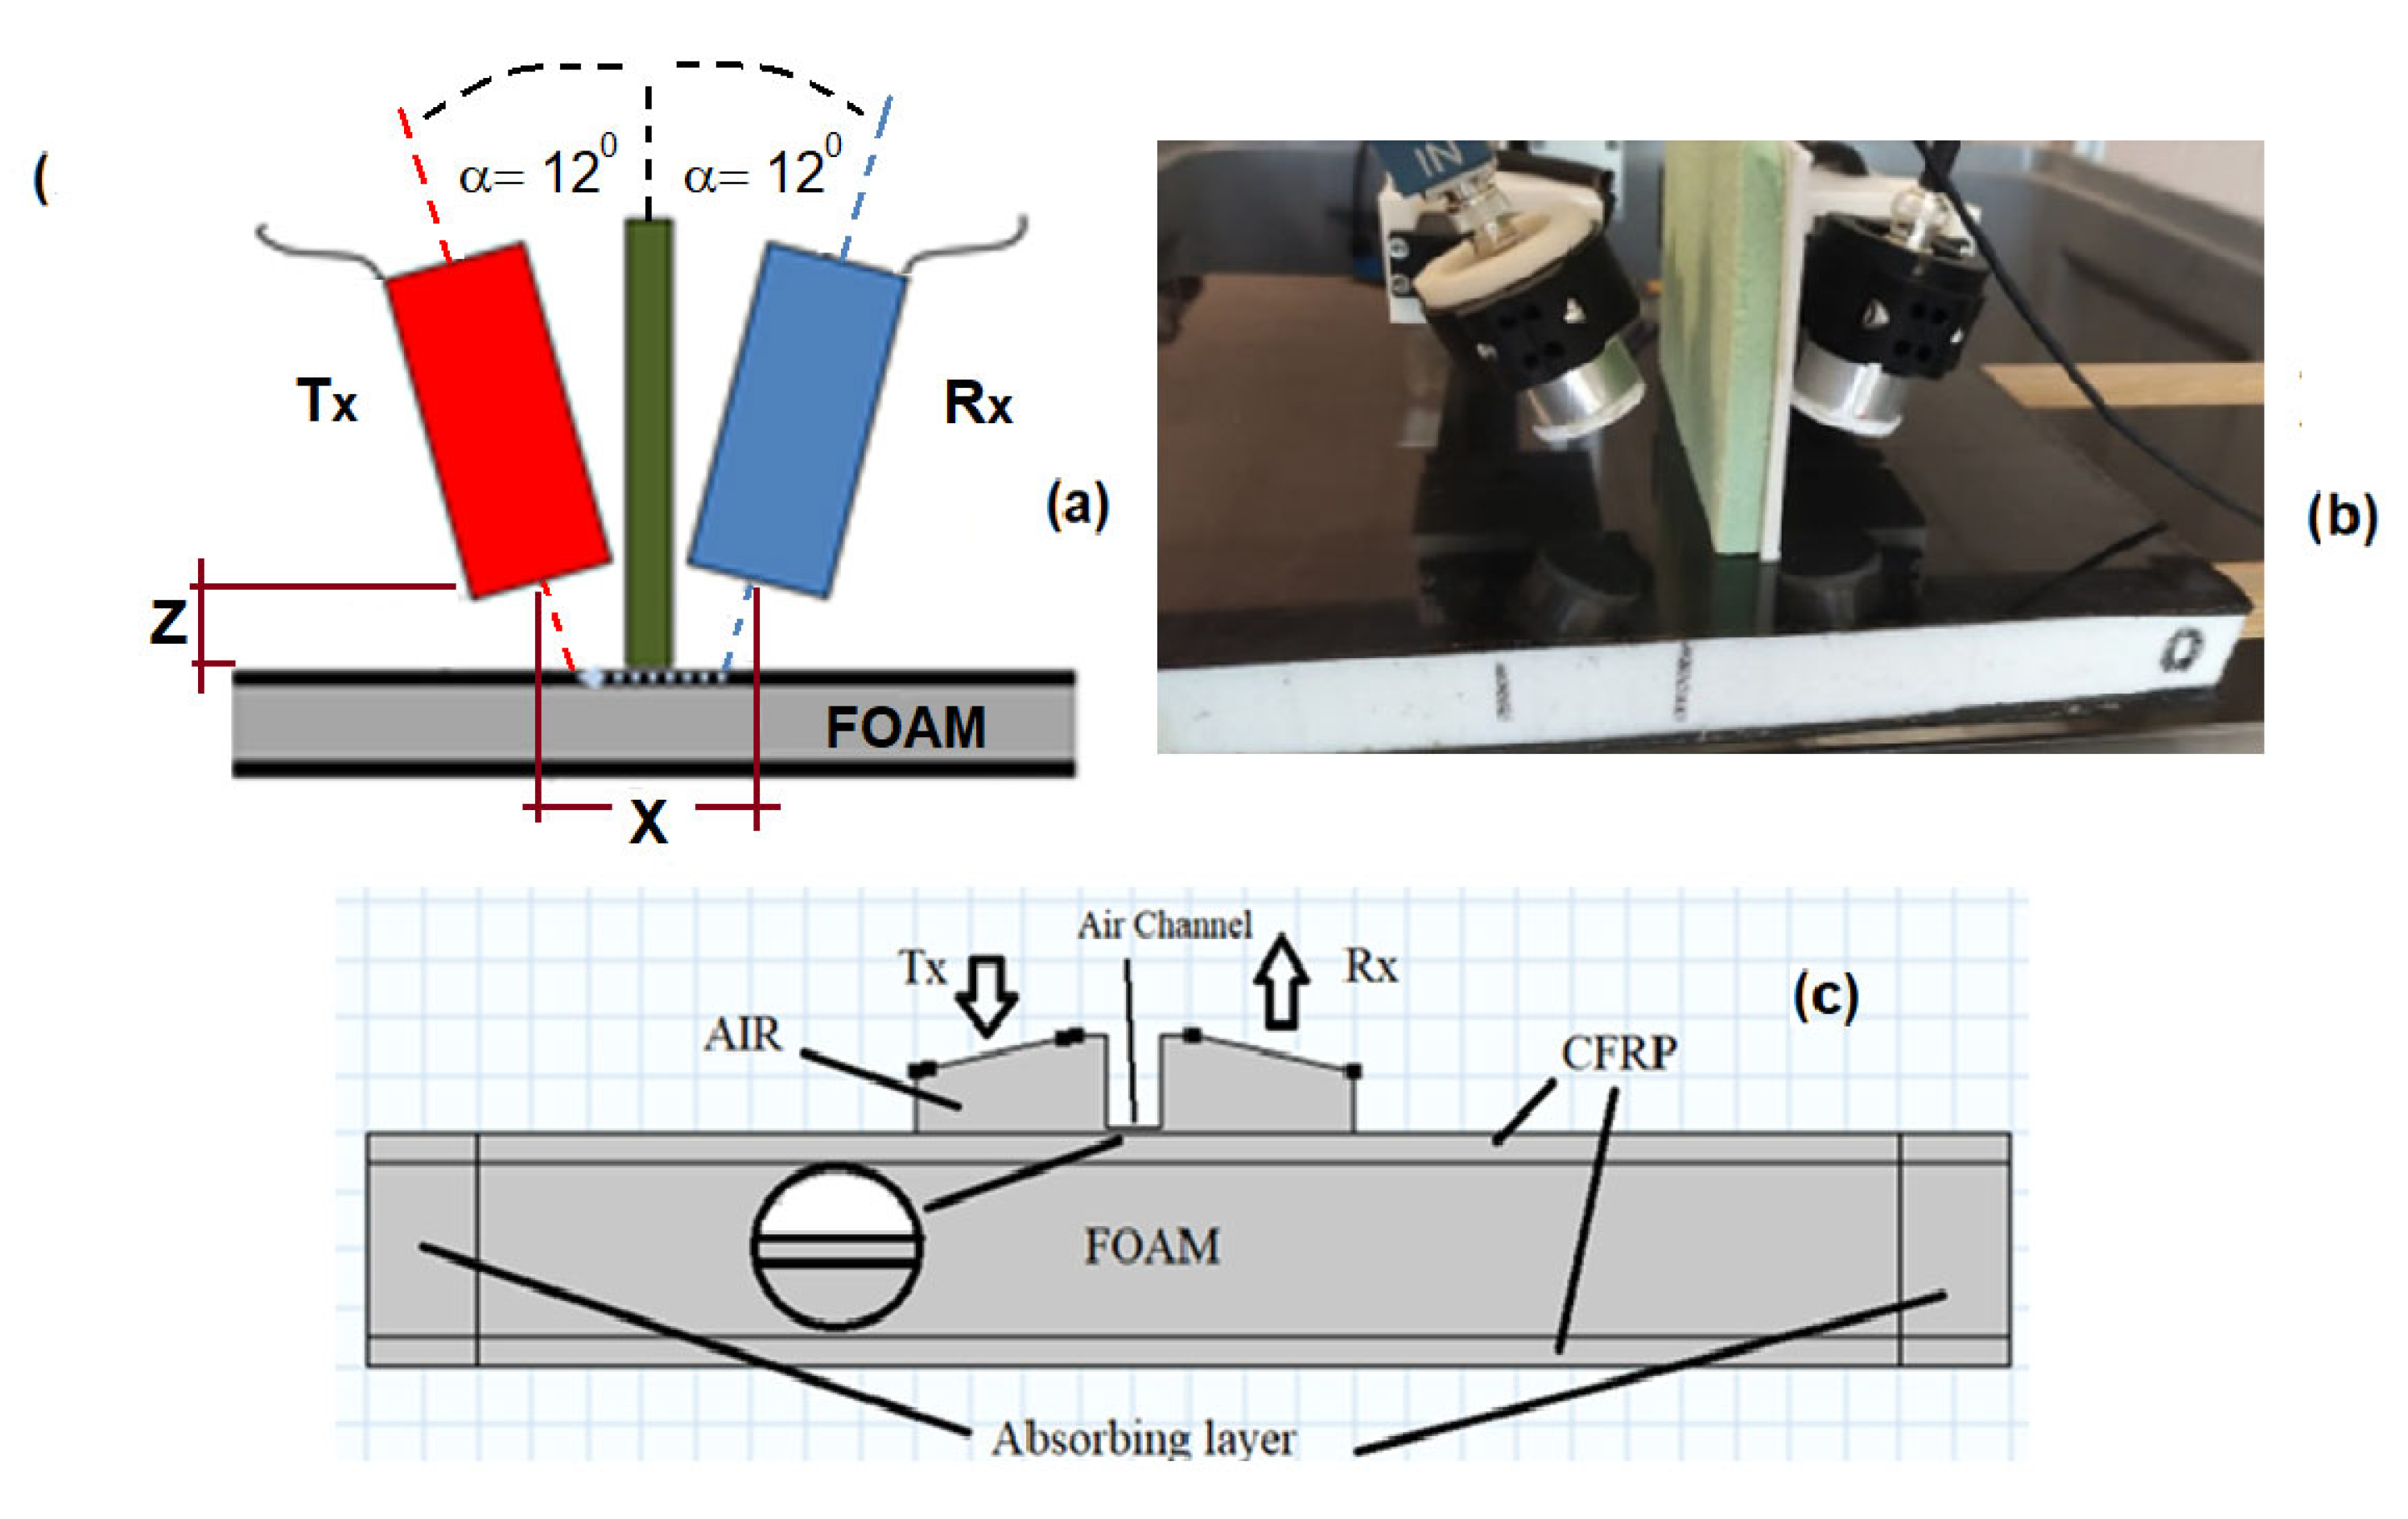
Figure 3c shows the Comsol domain compared with a diagram (Figure 3a) and a photo (Figure 3b) of the experimental configuration. The Tx and Rx transducers are represented as boundary conditions in the two air wedges. Additionally, there is an acoustic isolation barrier that separates both wedges with the exception of a small air layer in the lower part.
The models included in the Comsol Multiphysics 6.1 software were the following:
  • Elastic wave, time-explicit (named as elte in Comsol);
  • Acoustic pressure, time-explicit (named as pate in Comsol).
These two models run together based on the novel discontinuous Galerkin method (dG-FEM) that uses a time-explicit solver. The advantage of the dG-FEM method is that it solves the time wave propagation with a greater efficiency. Hence, the mesh of the maximum element size (MES) was defined according to the following expression:
MES = λ/1.5
Equation (2) represents the advantage added by the dG-FEM compared to the classic FEM, because it generates a lower density mesh. In Equation (2), λ should be evaluated for each component material in the sandwich plate. As a consequence, in the dG-FEM, lower degrees of freedom are generated compared to the classic FEM. This represents an improvement in the computing performance.
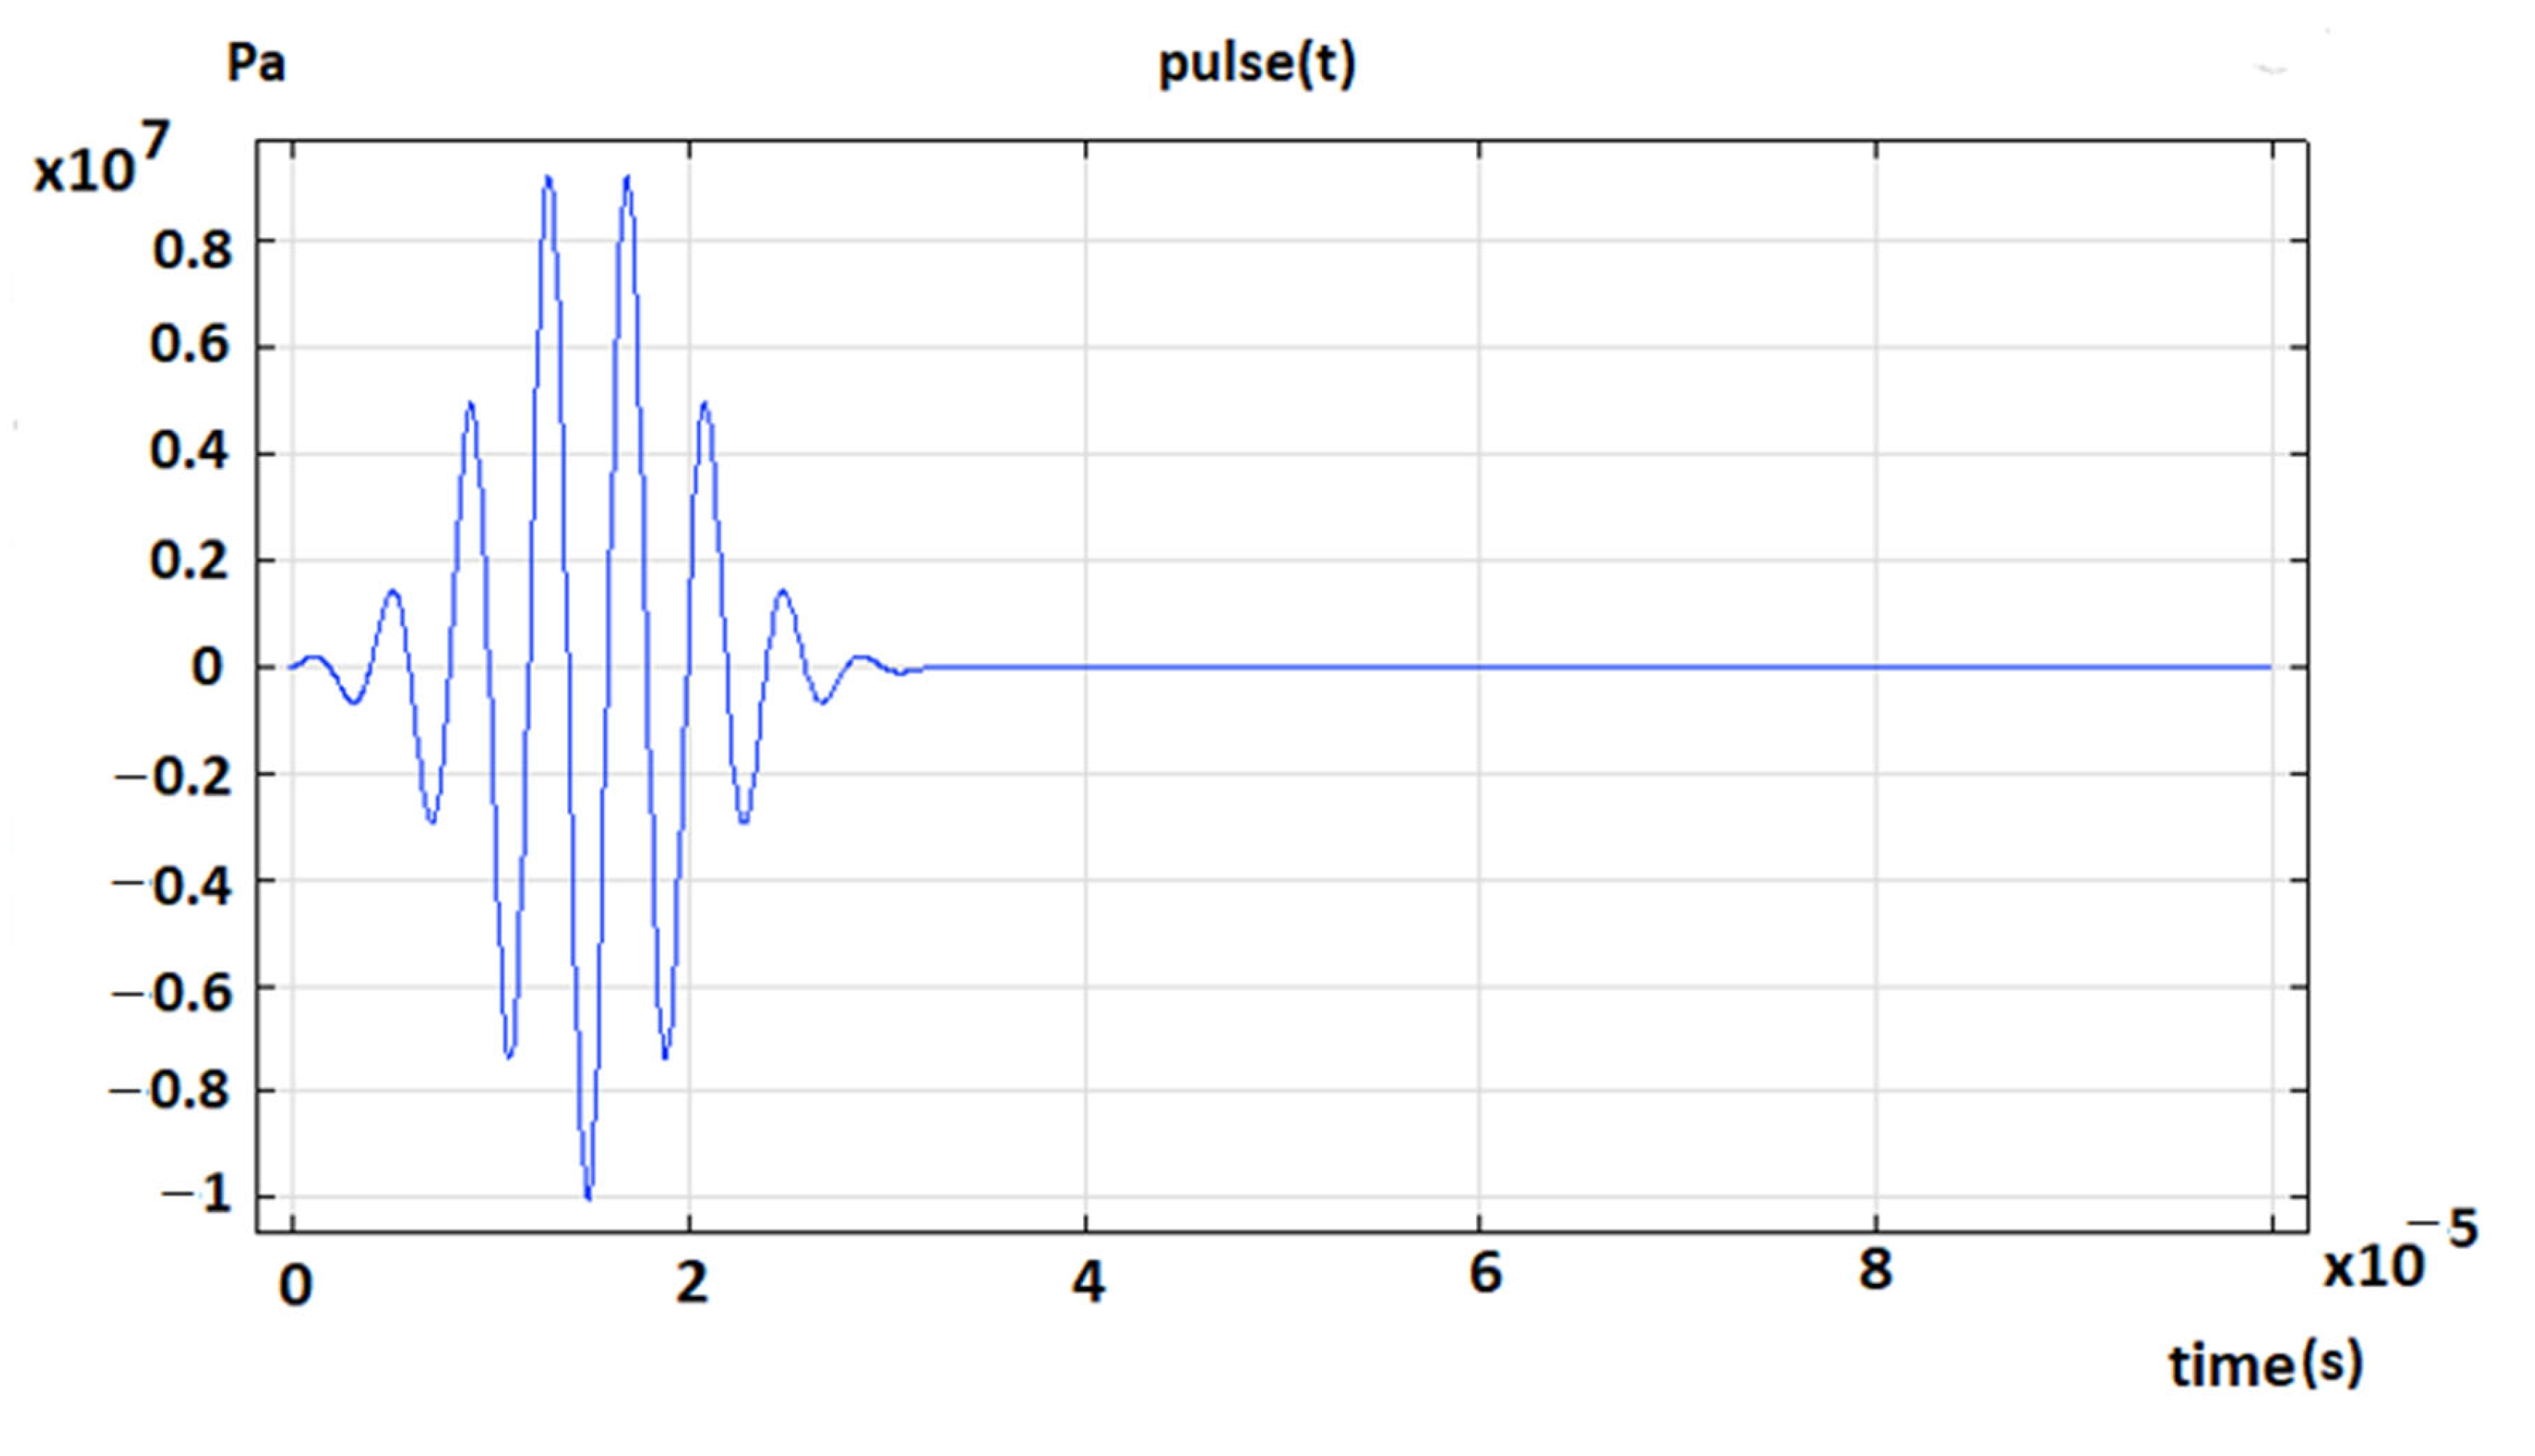
In Figure 4, the excitation pulse applied to the boundary Tx (Figure 3) is shown. The frequency was 250 KHz for both domain cases. The function used was a sinus function with a Gaussian envelope. The angle α of the “air wedge” was 12°, according to a previous evaluation using Equation (1). This value was evaluated according to an approximately c phase velocity of 1800 m/s, obtained from the dispersion curves in Figure 1 (using Table 1). With this specific angle, the model should describe an ALW mode propagation over the upper CFRP plate of the sandwich plate.
According to the domain in Figure 3, it is expected that the FEM models also describe additional wave propagation modes that arrive at boundary Rx. An average operator (non-local coupling in Comsol) was defined for this boundary. This allows the acquisition and display of a complex RF signal detected by this Rx transducer.
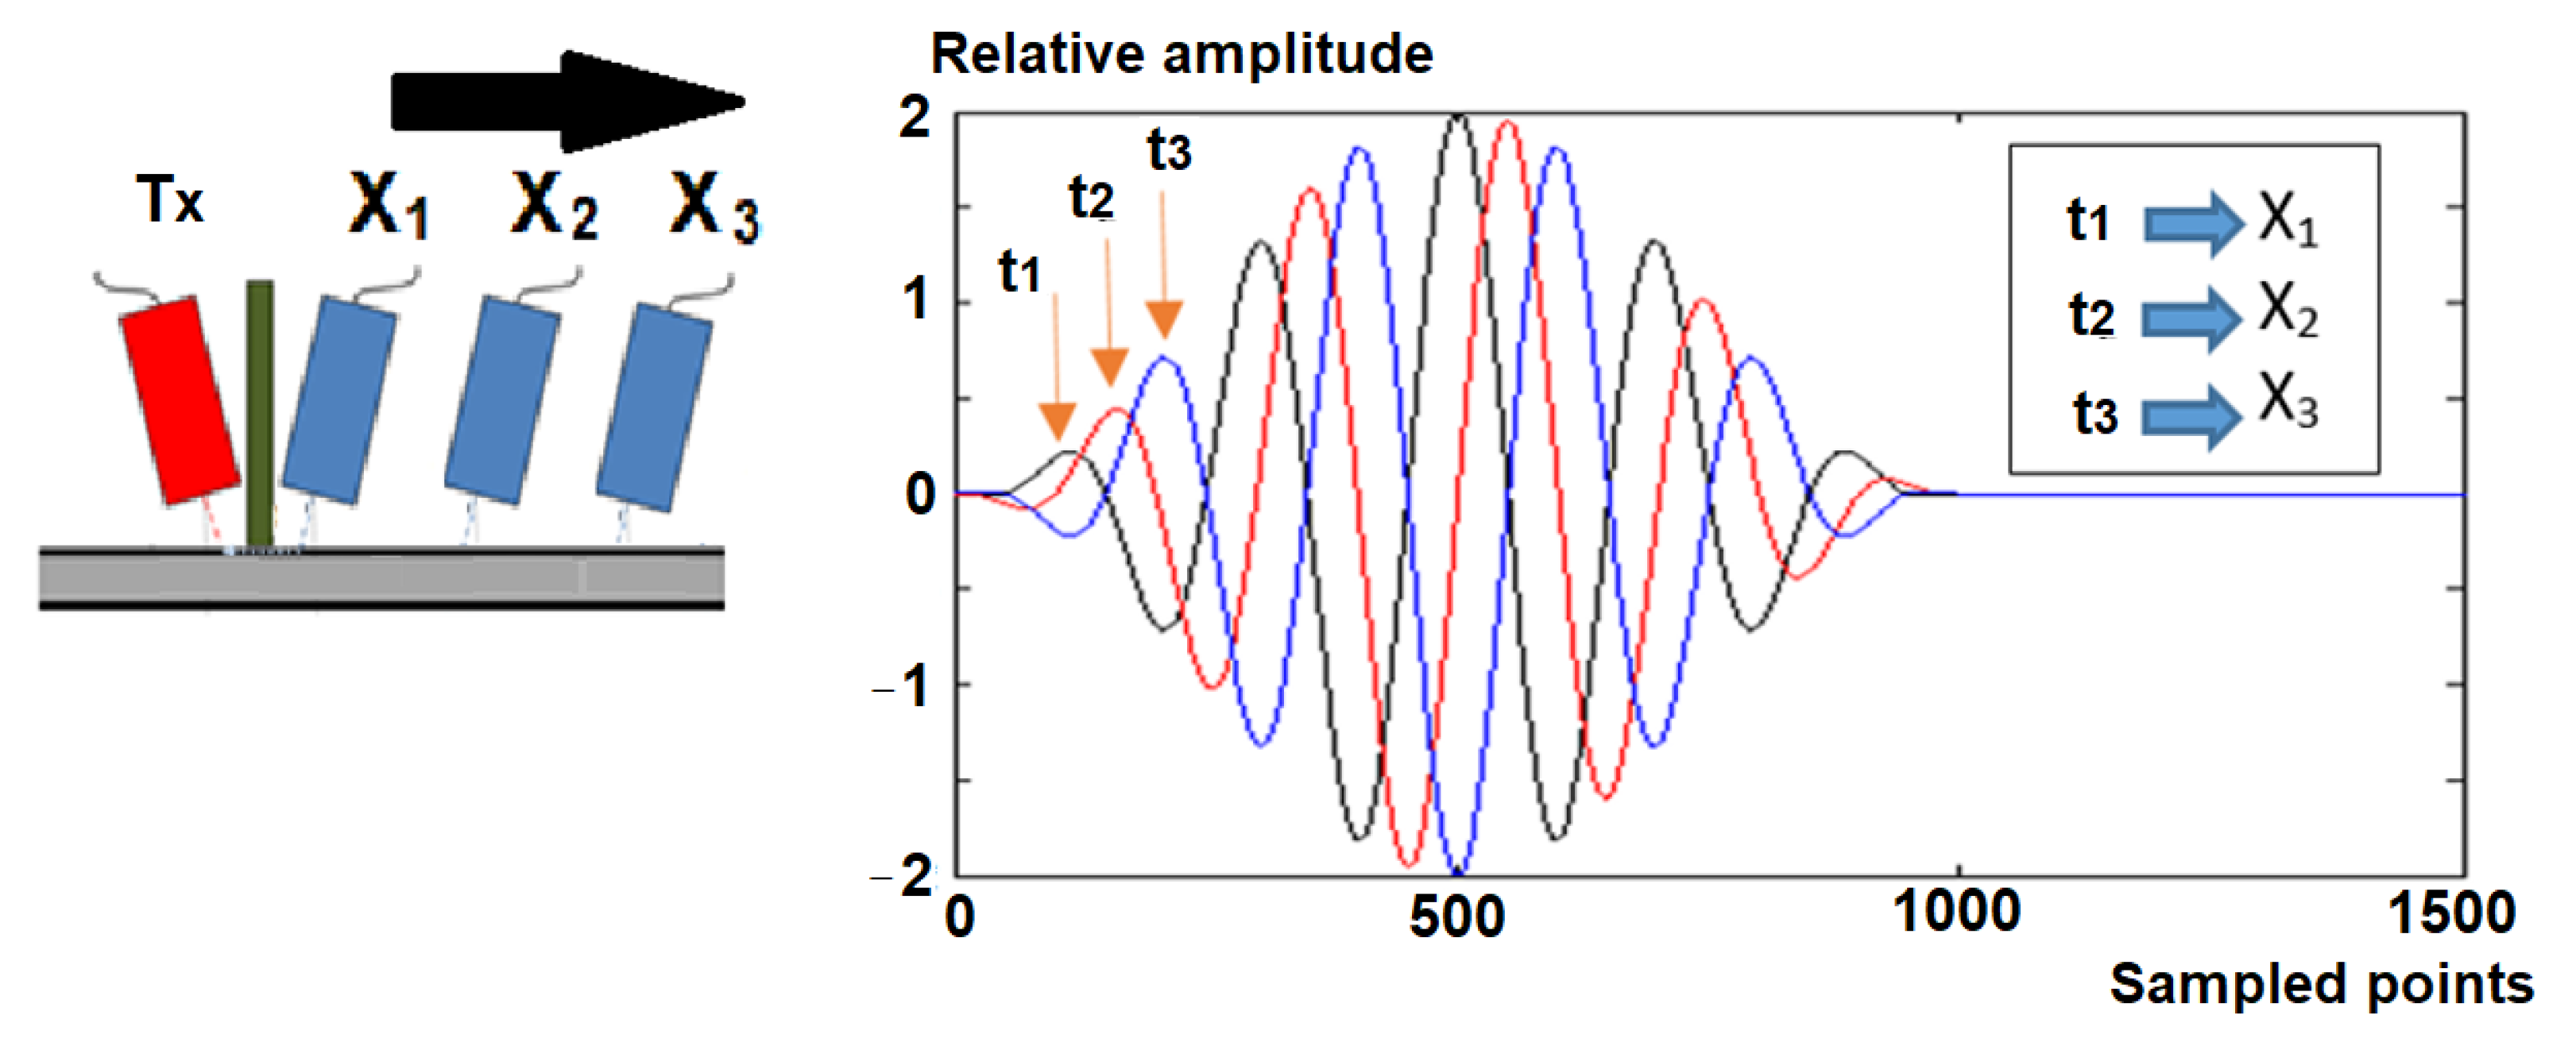
Although the transducers’ separation X was fixed, for a basic first simulation model for C-Scan images, we also considered a distance change between the transducers. This was conducted in order to evaluate, using FEM, the PVM, as is explained in subsequent sections.

3. Materials and Methods

3.1. The Sandwich Sample

A flat coupon was selected to reproduce the sandwich-based car body panels at a lab scale. This geometry was chosen to simplify the measurements and comparisons with the railway car body demonstrator. The sandwich sample was manufactured with a unidirectional epoxy/CF (epoxy–carbon fiber) pre-preg (pre-impregnated fabric) (TORAY P707AG-15) as the material for the skins and a 30 mm thick sheet of PET foam (supplied by DIAB, www.diabgroup.com) as the core material. Artificial defects were created by introducing small square-shaped pieces of PTFE film located between pre-preg plies and between the core and the skin of the sandwich structures. A schematic representation of the distribution of defects and of the laminate is shown in Figure 5a and b, respectively. For the manufacturing of the skins, these pre-pregs plies were sequentially piled up with quasi-isotropic stacking sequences (0, 90, +45, and −45), until reaching a thickness of 10 mm. Therefore, the resulting structure had a homogeneous strength and stiffness. Afterwards, the core material was introduced and then, the upper skin laminate was positioned on top to form the sandwich structure. The laminate was manufactured by curing the thermoset material in an oven with specific temperature and pressure values using a flat glass as a tool. The curing cycle that we followed was: (1) 6 h at 4 °C; (2) ramps up to 1 °C/min up to 80 °C; (3) 5 h at 80 °C; (4) ramps up to 132 °C; (5) 2 h at 132 °C; (6) cool down to room temperature; and (7) demolding when the coupon temperature was below 50 °C.
The surface of the laminate in contact with the glass tool had a smoother surface after manufacturing, as shown in Figure 5c. The other side, displayed in Figure 5d, presented a rougher texture since this surface was in contact with the vacuum bag consumables (the peel ply left a rough surface after manufacturing). Bumps originated by the presence of defects can be clearly observed in this picture. The cross-section and surface of the sandwich laminate is shown in Figure 5e, in which both components of this type of structure are clearly distinguished: carbon-fiber-based skins and PET foam core. The porous core can be observed in detail in Figure 5f. Table 2 shows a summary of the characteristic of the sample used in this paper. For the foam, 〉 = 232 kg/m3, Young’s modulus = 0.9 × 10⁸ Pa, and Poisson’s ratio = 0.33.

3.2. Ultrasonic Instruments and Experimental Methods

The Airscope system (DASEL [23]) was used as the ultrasonic equipment for the experiments. Two air-coupled transducers, made also by Dasel, were used, working in the emitter–receiver configuration of longitudinal waves. Figure 3a,b show a diagram and a photo of the air-coupled transducers over the sandwich sample, respectively. An acoustic isolation perpendicular barrier is also shown. Using this configuration, two kinds of experiments were performed, in which an excitation pulse of 250 KHz with five cycles was applied to the Tx using the Airscope and the received RF signal that reached Rx was collected according to the specific experiment.

3.2.1. Phase Velocity Method (PVM)

In the first one-dimensional experiment, the receiver Rx was displaced lineally, away from the transmitter Tx, at a step of 5 mm, from 55 to 115 mm approximately (black arrow in Figure 6, left) in a line region without defects. At each position of Rx, the RF signal was registered. This signal was composed of several consecutive pulses. The challenge is identifying which part corresponds to the ALW necessary for the conforming of the C-Scan image. For this purpose, the PVM was used [7].
Figure 6 shows a diagram of the PVM. On the left, there is a plate with three Rx transducer positions with the corresponding RF signal portion on the right. Each yellow arrow shows the same constant phase point with a relative displacement over the RF signal.
At the points X1, X2, and X3, the respective time values of t1, t2, and t3, of the constant phase value, are represented. Using a linear time–space diagram [7], we evaluated the phase velocity from the slope. Thus, we completed the identification of the ALW mode. The PVM could be also applied to the RF signals obtained from FEM simulations as well from the experimental results.

3.2.2. C-Scan Image Formation

The second two-dimensional scanner experiments were performed to obtain a C-Scan image from a portion selected from the RF signals, i.e., the ALW mode. In this case, both transducers move as a whole, keeping the distances X = 50 mm and Z = 10 mm fixed over the sample plate, as shown in Figure 3a,b. In Figure 7, the 2D scanner strategy can be observed, where the transducers move first in a horizontal line, capturing RF signals at each 2 mm position defined by the trigger encoder. Then, after the complete line acquisition, both transducers move to a second line at a 2 mm distance from the previous line defined by the auxiliary encoder. This process is repeated to cover the entire area of the sample plate, where several RF signals are obtained.

4. Results and Discussion

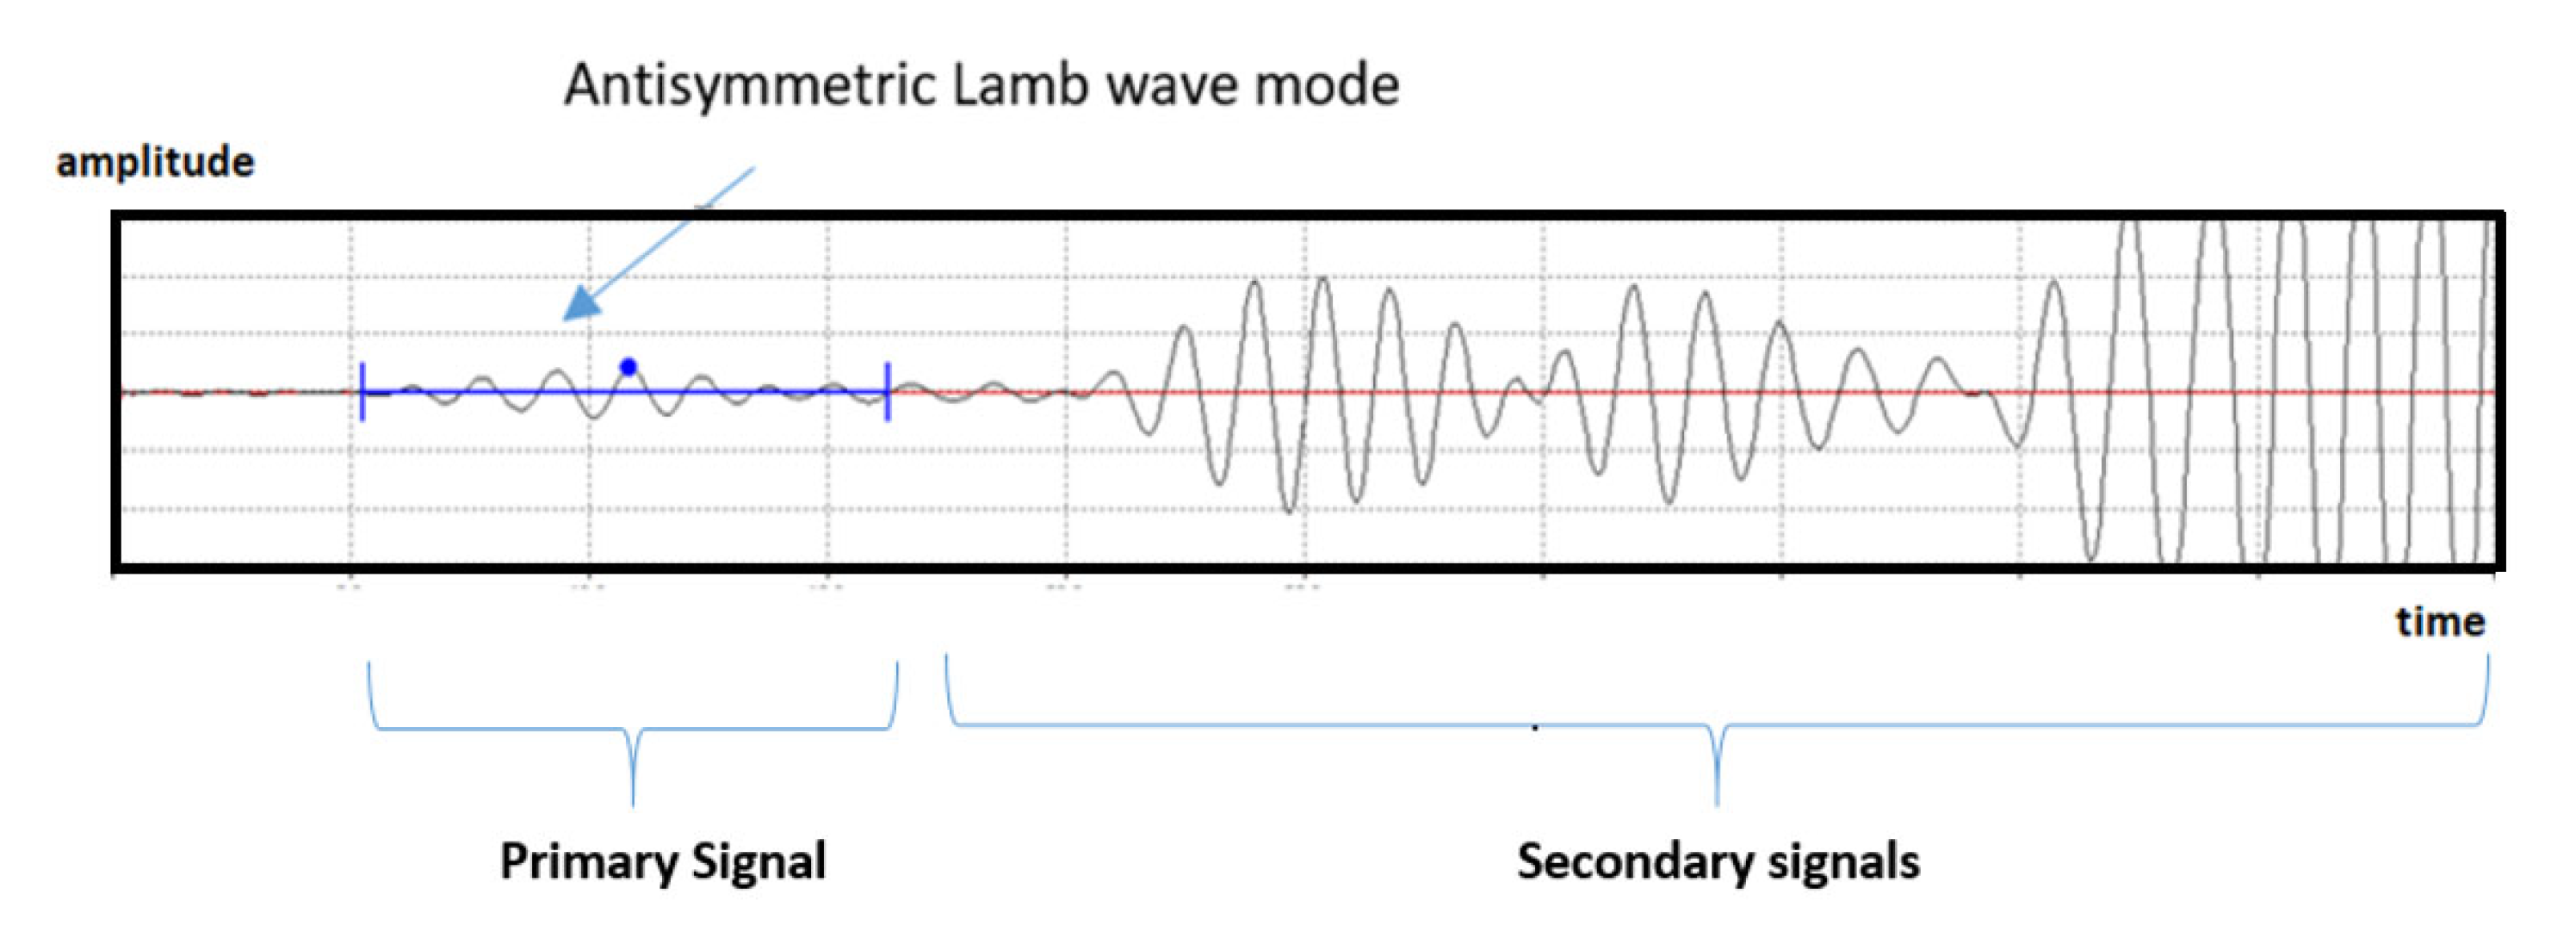
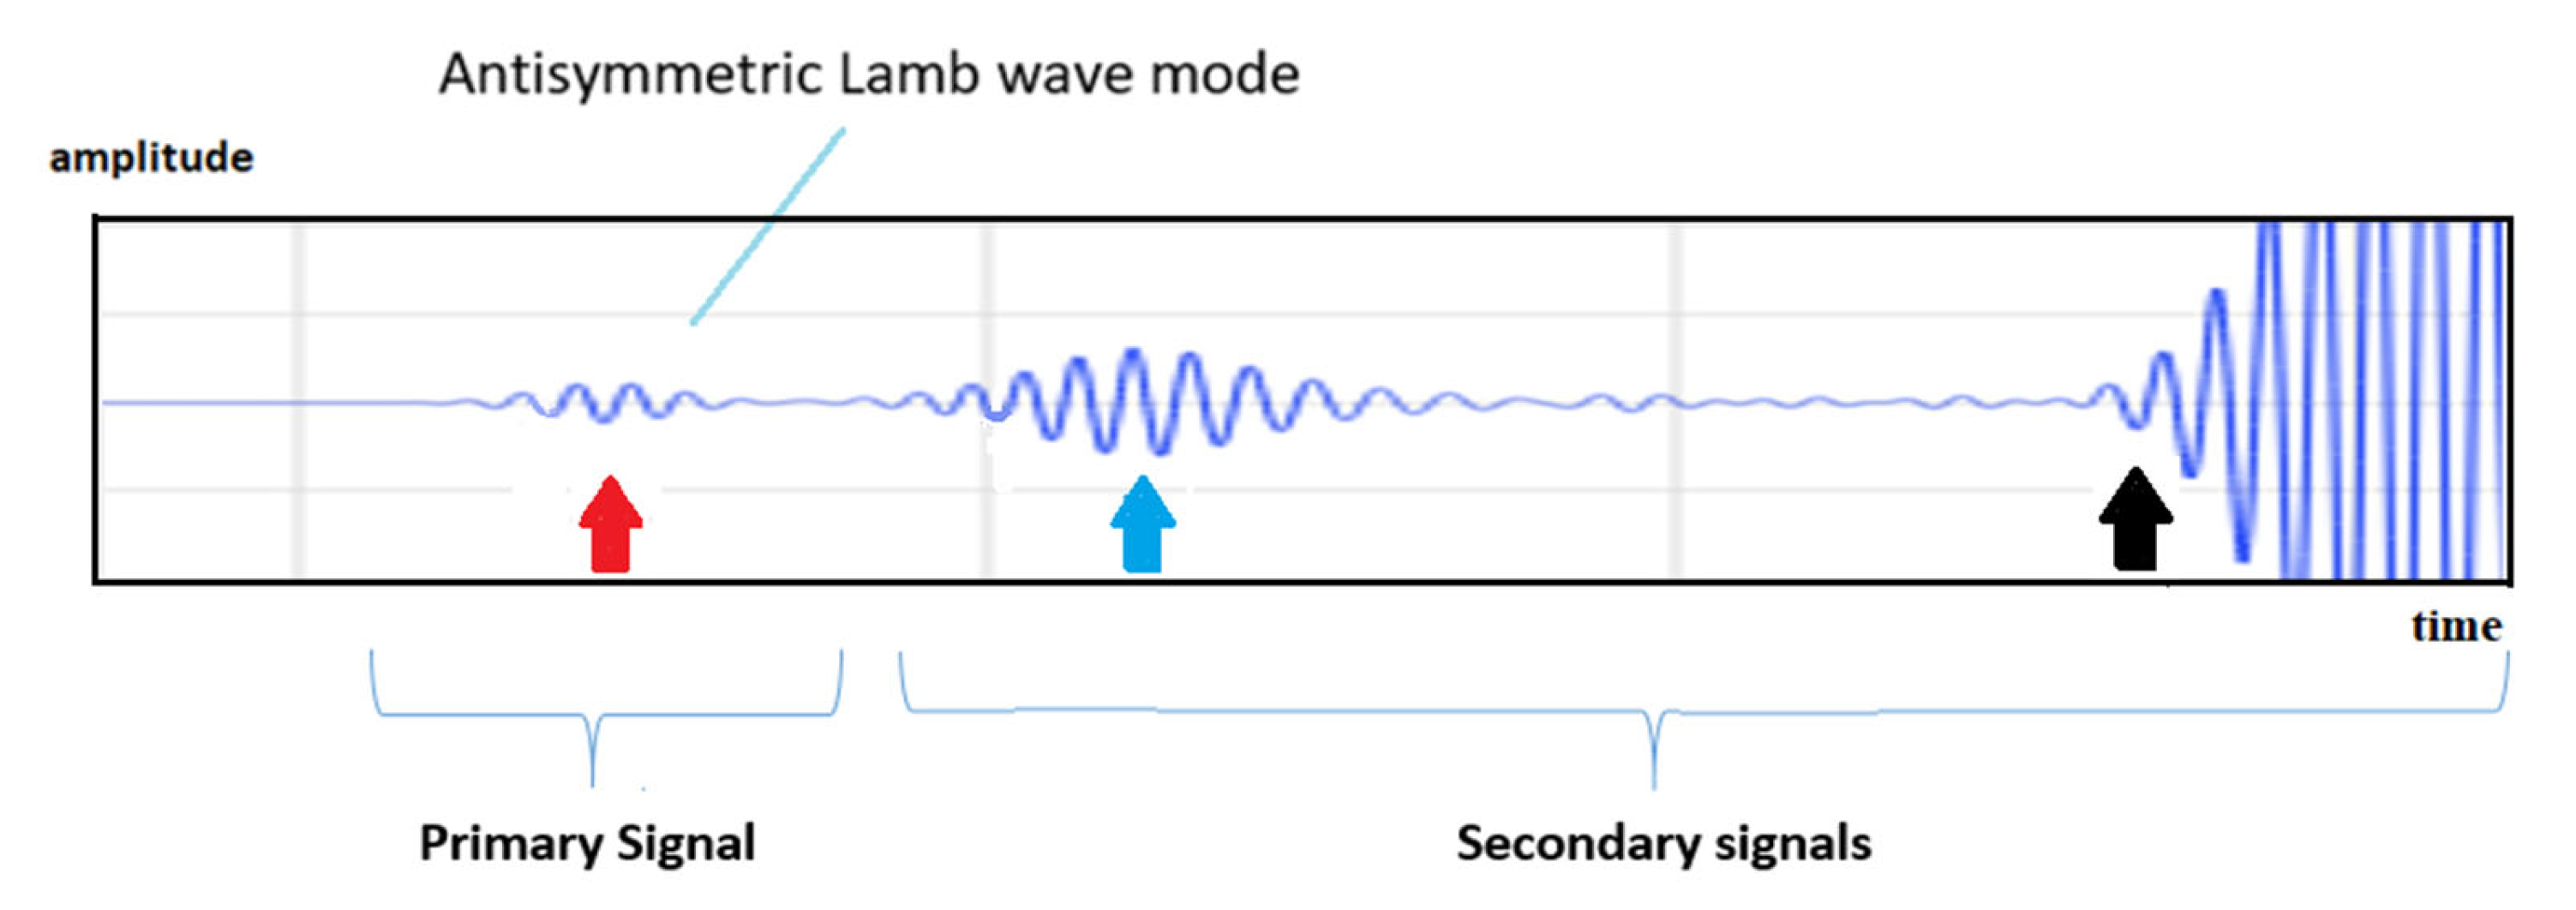
Figure 8 shows an experimental example of an RF signal obtained in the sandwich sample at 250 KHz. The blue gate in the figure represents the primary portion of the signal that is selected for the C-Scan image. This corresponds to the ALW mode, which was identified using the PVM. Secondary signals were rejected for the C-Scan as a consequence of the multiple reflections in the experimental setup. However, all these signals, primary and secondary, were evaluated with the FEM models as is shown in a later section.

4.1. FEM Simulation Results of RF Signals and Wave Propagation: Relation to the Dispersion Curve and the PVM Method

Figure 9 shows the simulation of the RF signal according to the FEM model of Figure 3. Comparing it with the previous results shown in Figure 8, similar characteristics were obtained.
As in the experimental case, the first part of the RF signal, named the primary signal, was identified as the ALW mode using the PVM. Figure 10 presents a summary of the results with the dispersion curve (continuous red line) [7], which corresponds with a single CFRP plate. Also, we obtained the discrete dispersion curve from the Comsol simulation at several frequencies (Figure 9) and, finally, only one experimental point obtained at 250 KHz with the same PVM method (Figure 8).
We used only one experimental frequency since a single transducer of 250 KHz was developed for this project. This frequency was selected in correspondence with the CFRP thickness of the sample. The obtained experimental phase velocity value and its correspondence with the theoretical models confirm that the primary signal is in the ALW mode.
In Figure 10, it is clear that it is not possible to detect a difference from a single CFRP plate with the same CFRP plate in the sandwich structure. In this latter case, we expect a leakage conversion from the ALW mode in the upper CFRP to the foam plate component of the sandwich. Hence, the phase velocity in the upper CFRP plate was not affected by the leakage into the foam.
In 
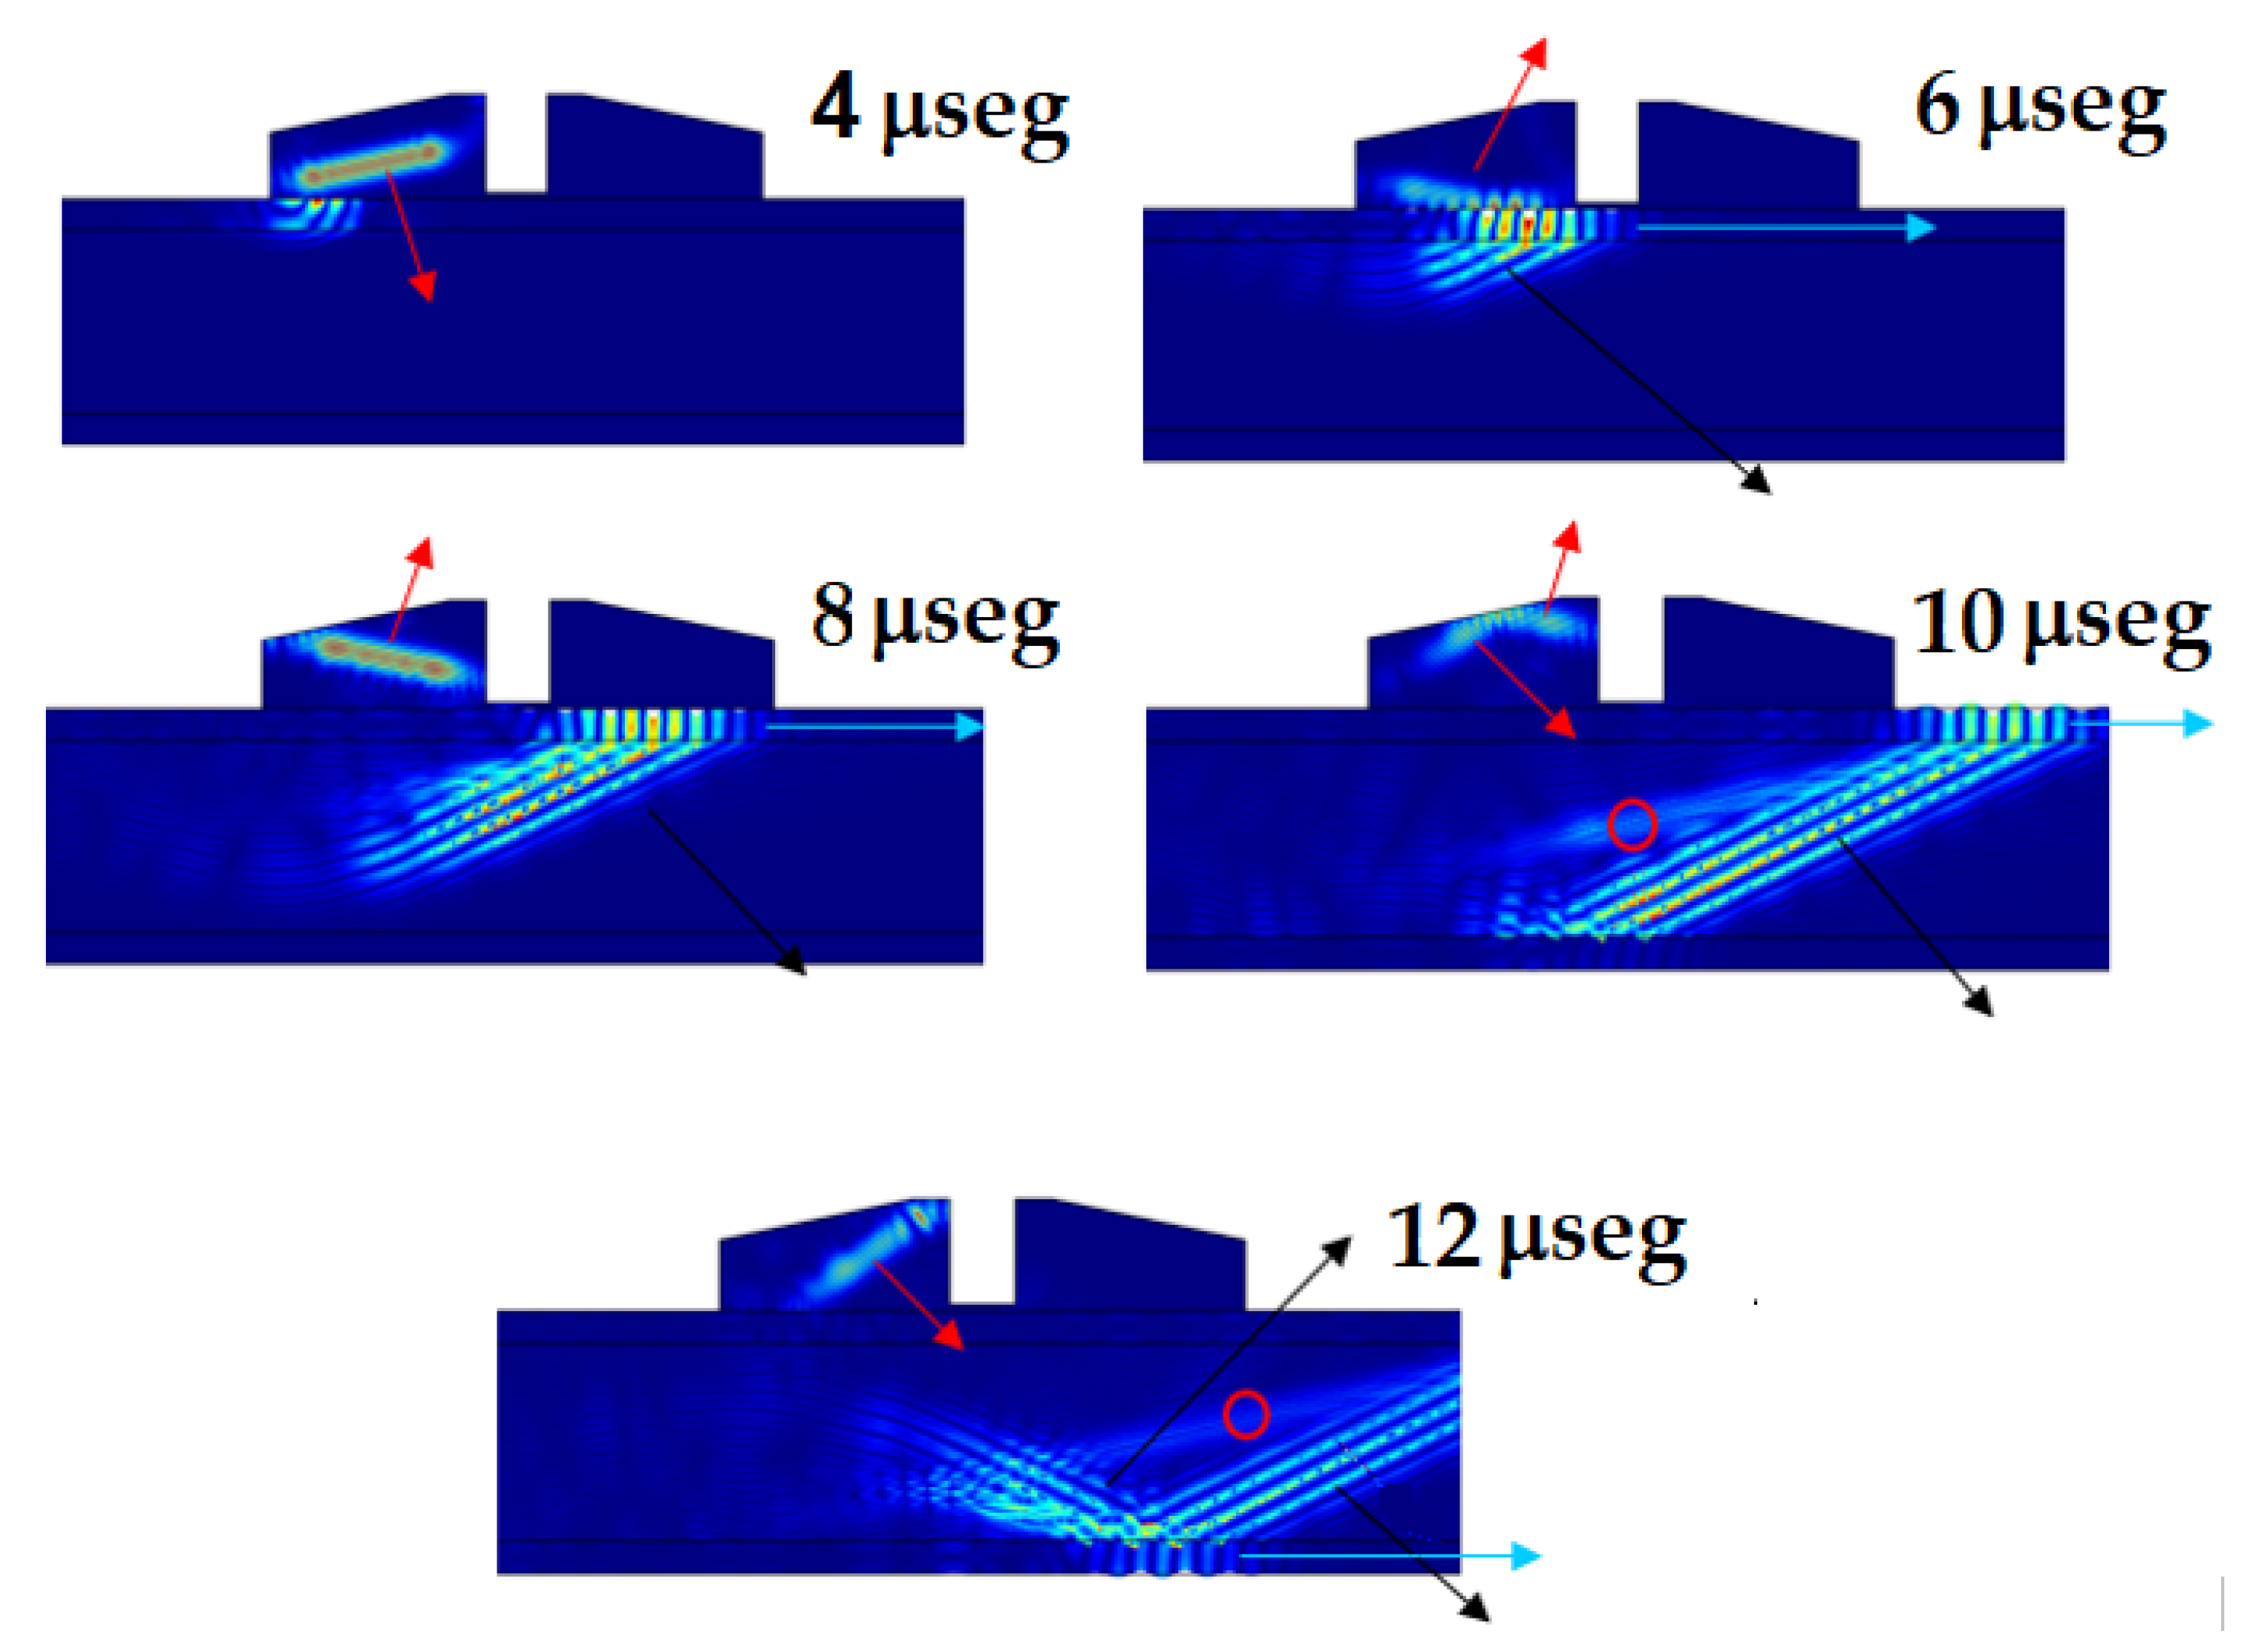
Figure 11, the time evolution of the wave propagation obtained through the FEM simulations can be seen. In this sequence, it is possible to observe the conversion of the longitudinal waves (red arrow) into the ALW mode in the upper CFRP layer (blue arrow). Simultaneously, the ALW mode produces a leakage (longitudinal wave, black arrow) that converts again to a second ALW mode on the lower CFRP layer.
Important details emerge from the previous figure. First, for the incident angle (12°), the FEM simulation confirms the ALW mode. Second, the longitudinal wave inside the air wedge in Tx shows multiple reflections. The comparison of the 4 μseg with the 12 μseg frame reveals a second longitudinal incident wave with an angle greater than 12°. Although this has no consequence to the other mode in the CFRP plate, it is important for the interpretation of the secondary signals, as is shown subsequently. In this sequence, it is not possible to observe any mode inside the second Rx wedge, as a consequence of the range of the color scale. Finally, the red circle in the last two frames of the time sequence shows another refracted wave that is of a shear type according to its minor angle.
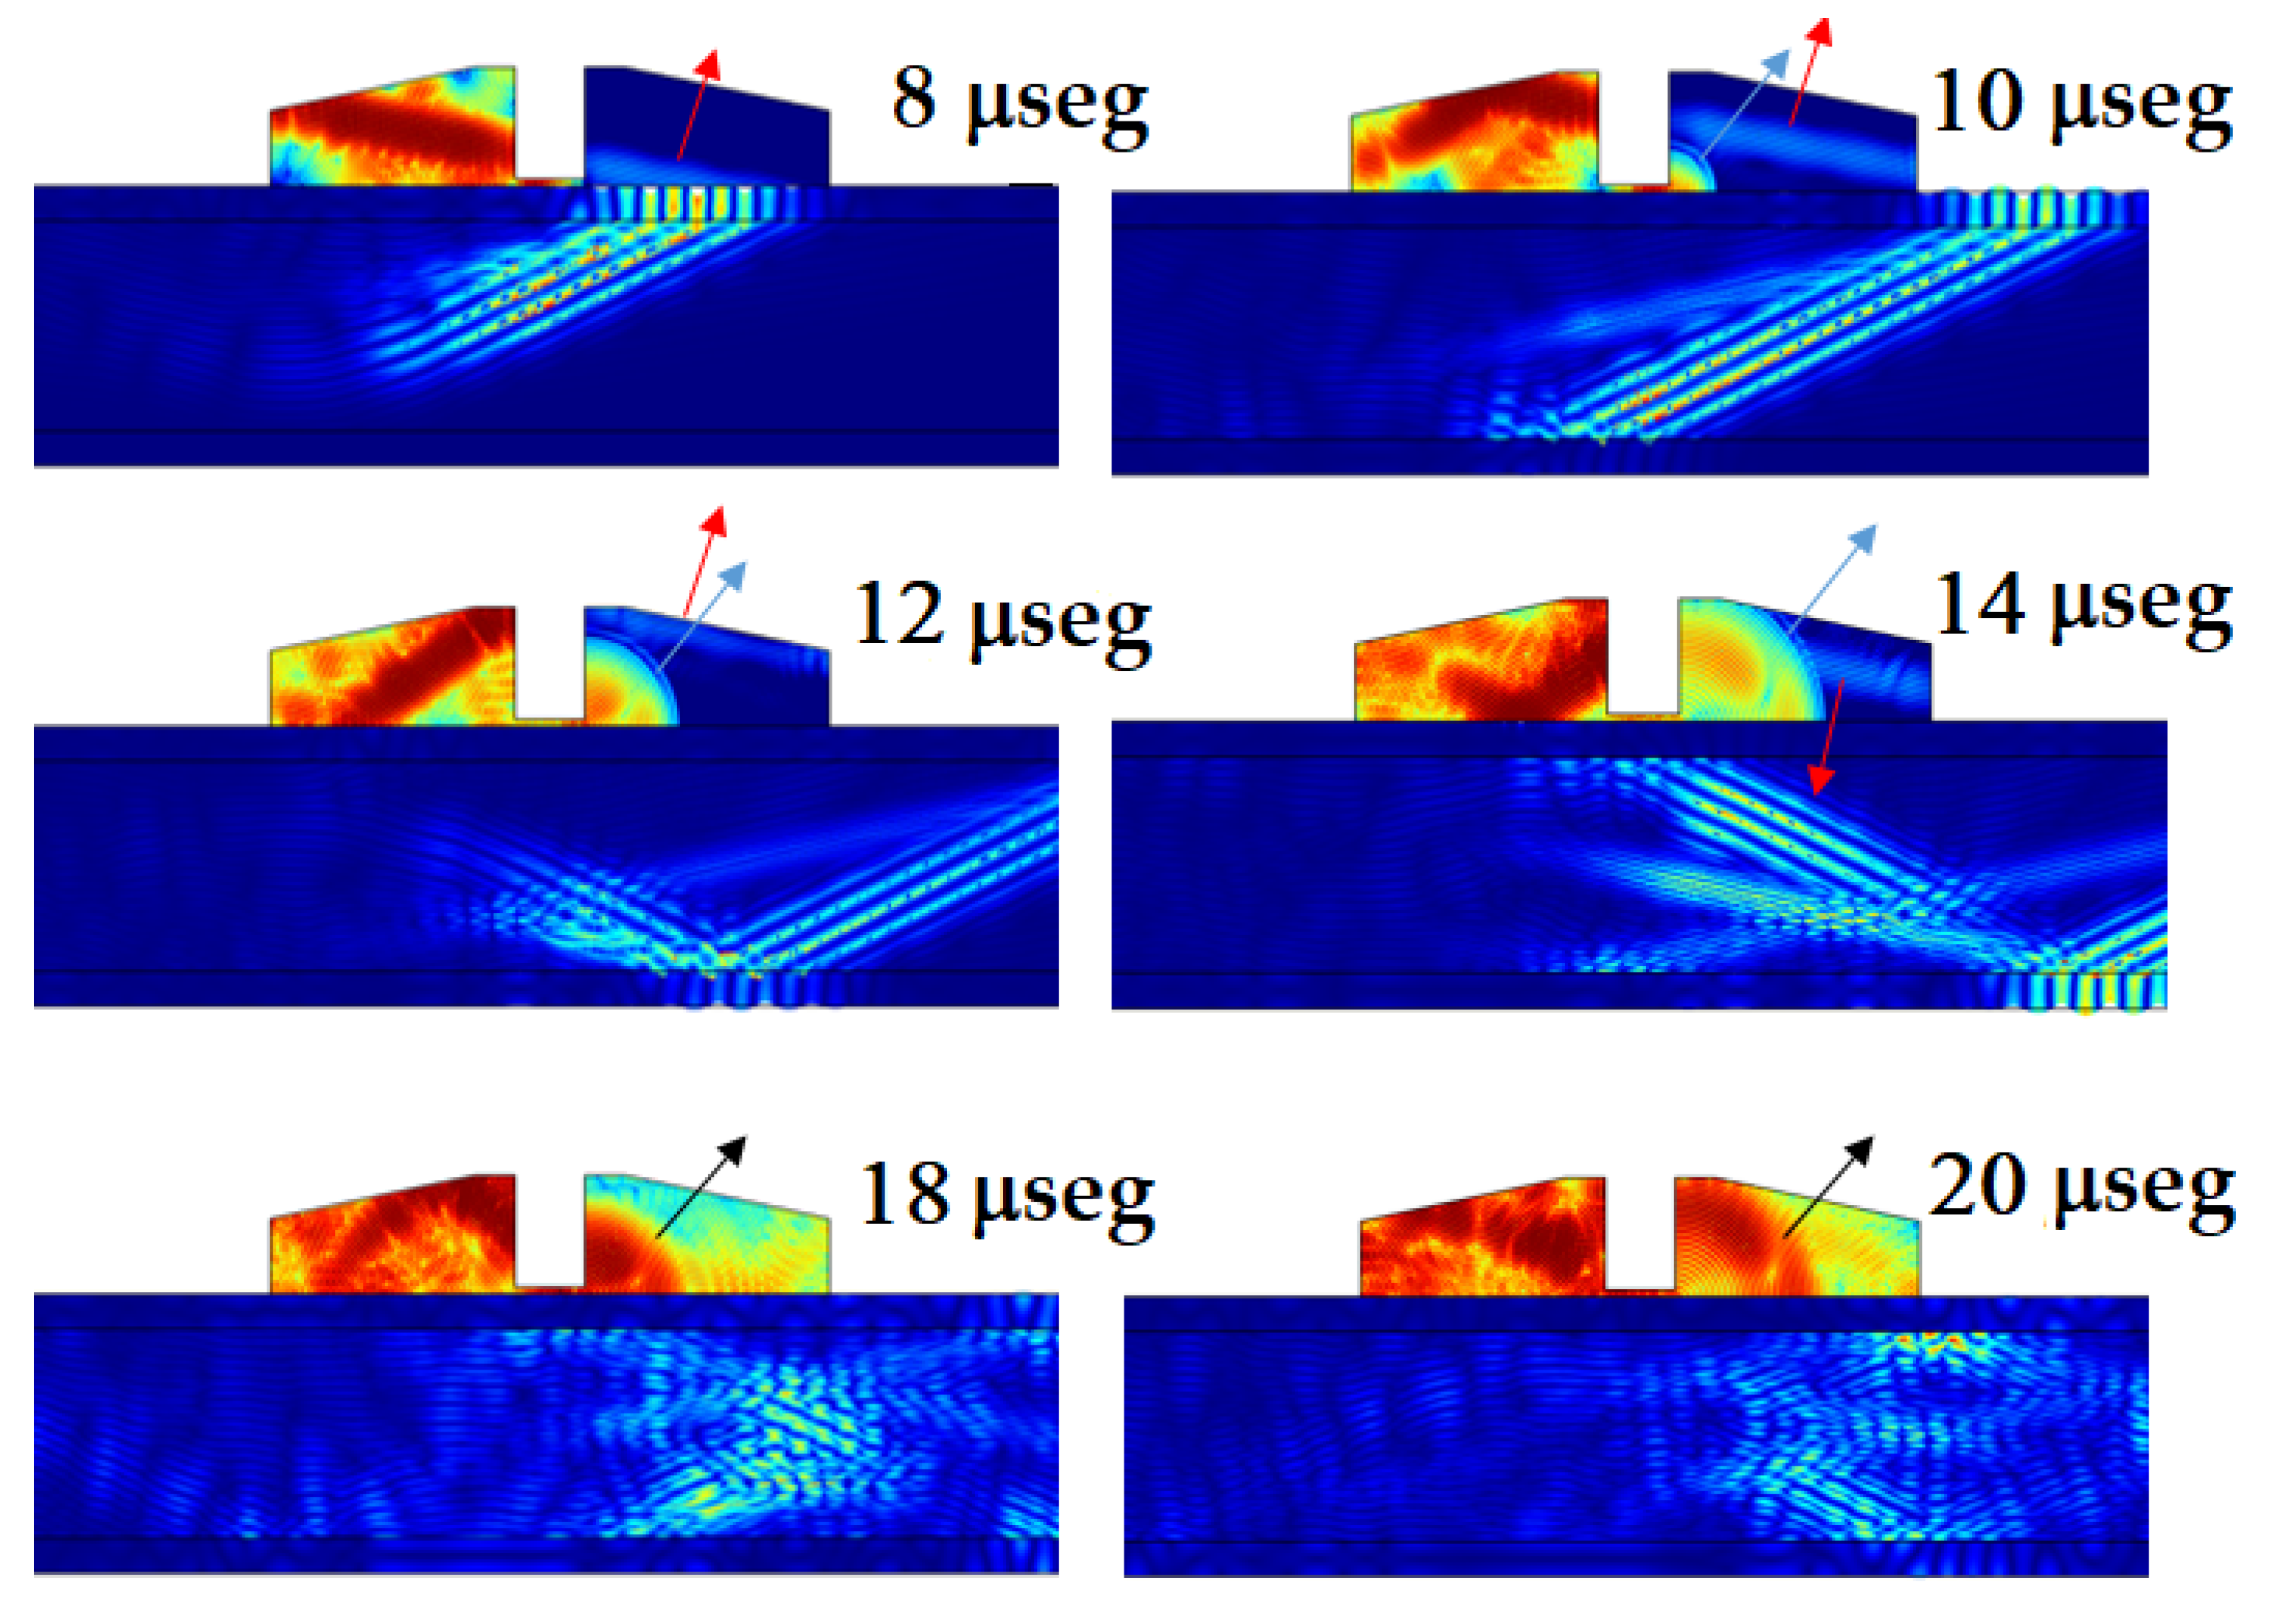
Figure 12 shows a similar sequence at 8, 10, 12, 14, 18, and 20 μseg. In this case, a logarithm scale was used in order to improve the details of the signals on the Rx air wedge. The red arrow shows the obtained signal as a consequence of the ALW mode leakage into this wedge. Following the sequence, a pulse (blue arrow) that corresponds to the longitudinal signal can be observed, which propagates through the gap between the sandwich surface and the acoustic barrier. This means that the acoustic barrier is not good enough for complete isolation. Finally, as a consequence of the multiple reflections in the Tx air wedge (Figure 10, Figure 11 and Figure 12, in μseg), a third signal arrives (black arrow). This last signal has a higher amplitude than the previous one. This is a consequence of a complex process of dependence of the amplitude with a different incident angle, which is beyond the scope of this paper. This amplitude increment was also observed in the experimental signal (Figure 8).
The obtained results show the convenience of simulations using FEM models, which allow us to understand the complex signal components obtained in the experiments. Of course, the experimental RF signal has another component in the secondary signal zone. This could be explained with another complex FEM model that includes the structure of the UT transducers with its internal components.
The most important consequence is that this FEM model can be used to improve UT technology with a new design for the components of future transducers.

4.2. C-Scan Image Mode Method
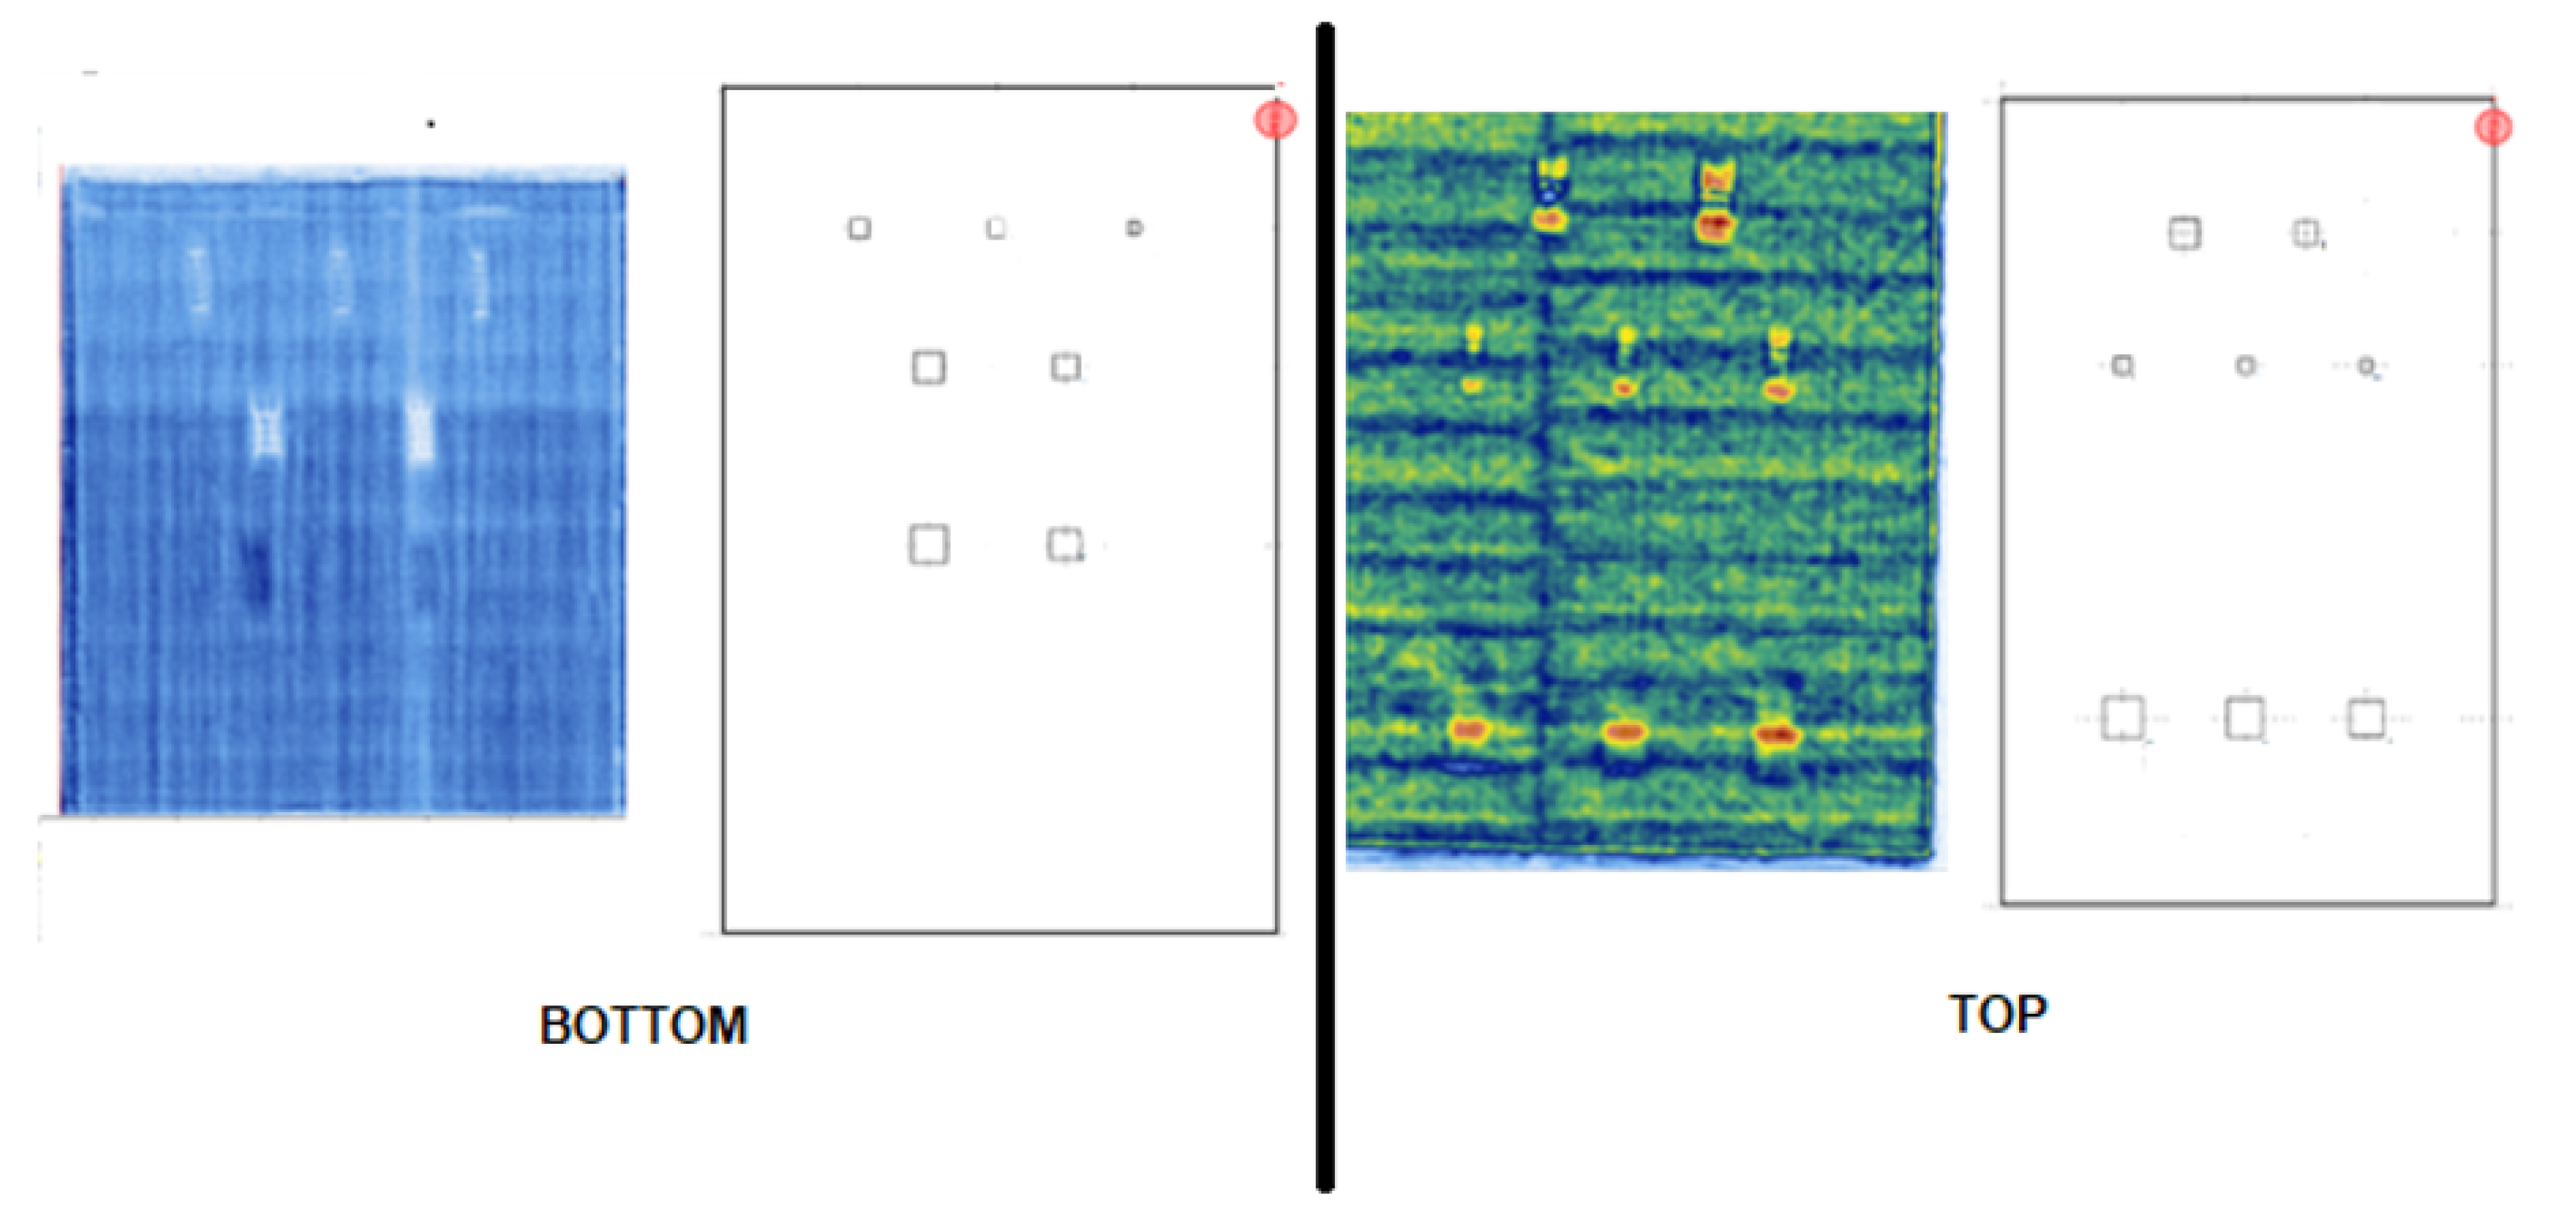
In Figure 13, two C-Scan images are shown at both sides of the sandwich plate. For these images, the AWL mode pulse, previously identified in the RF signal, was selected according to Figure 8. Then, the flaws associated with the upper part of the CFRP plate, disbonds and delaminations, were detected. This detection occurred because our principal objective was related to the external sandwich layer, which could be exposed by several impact accidents.
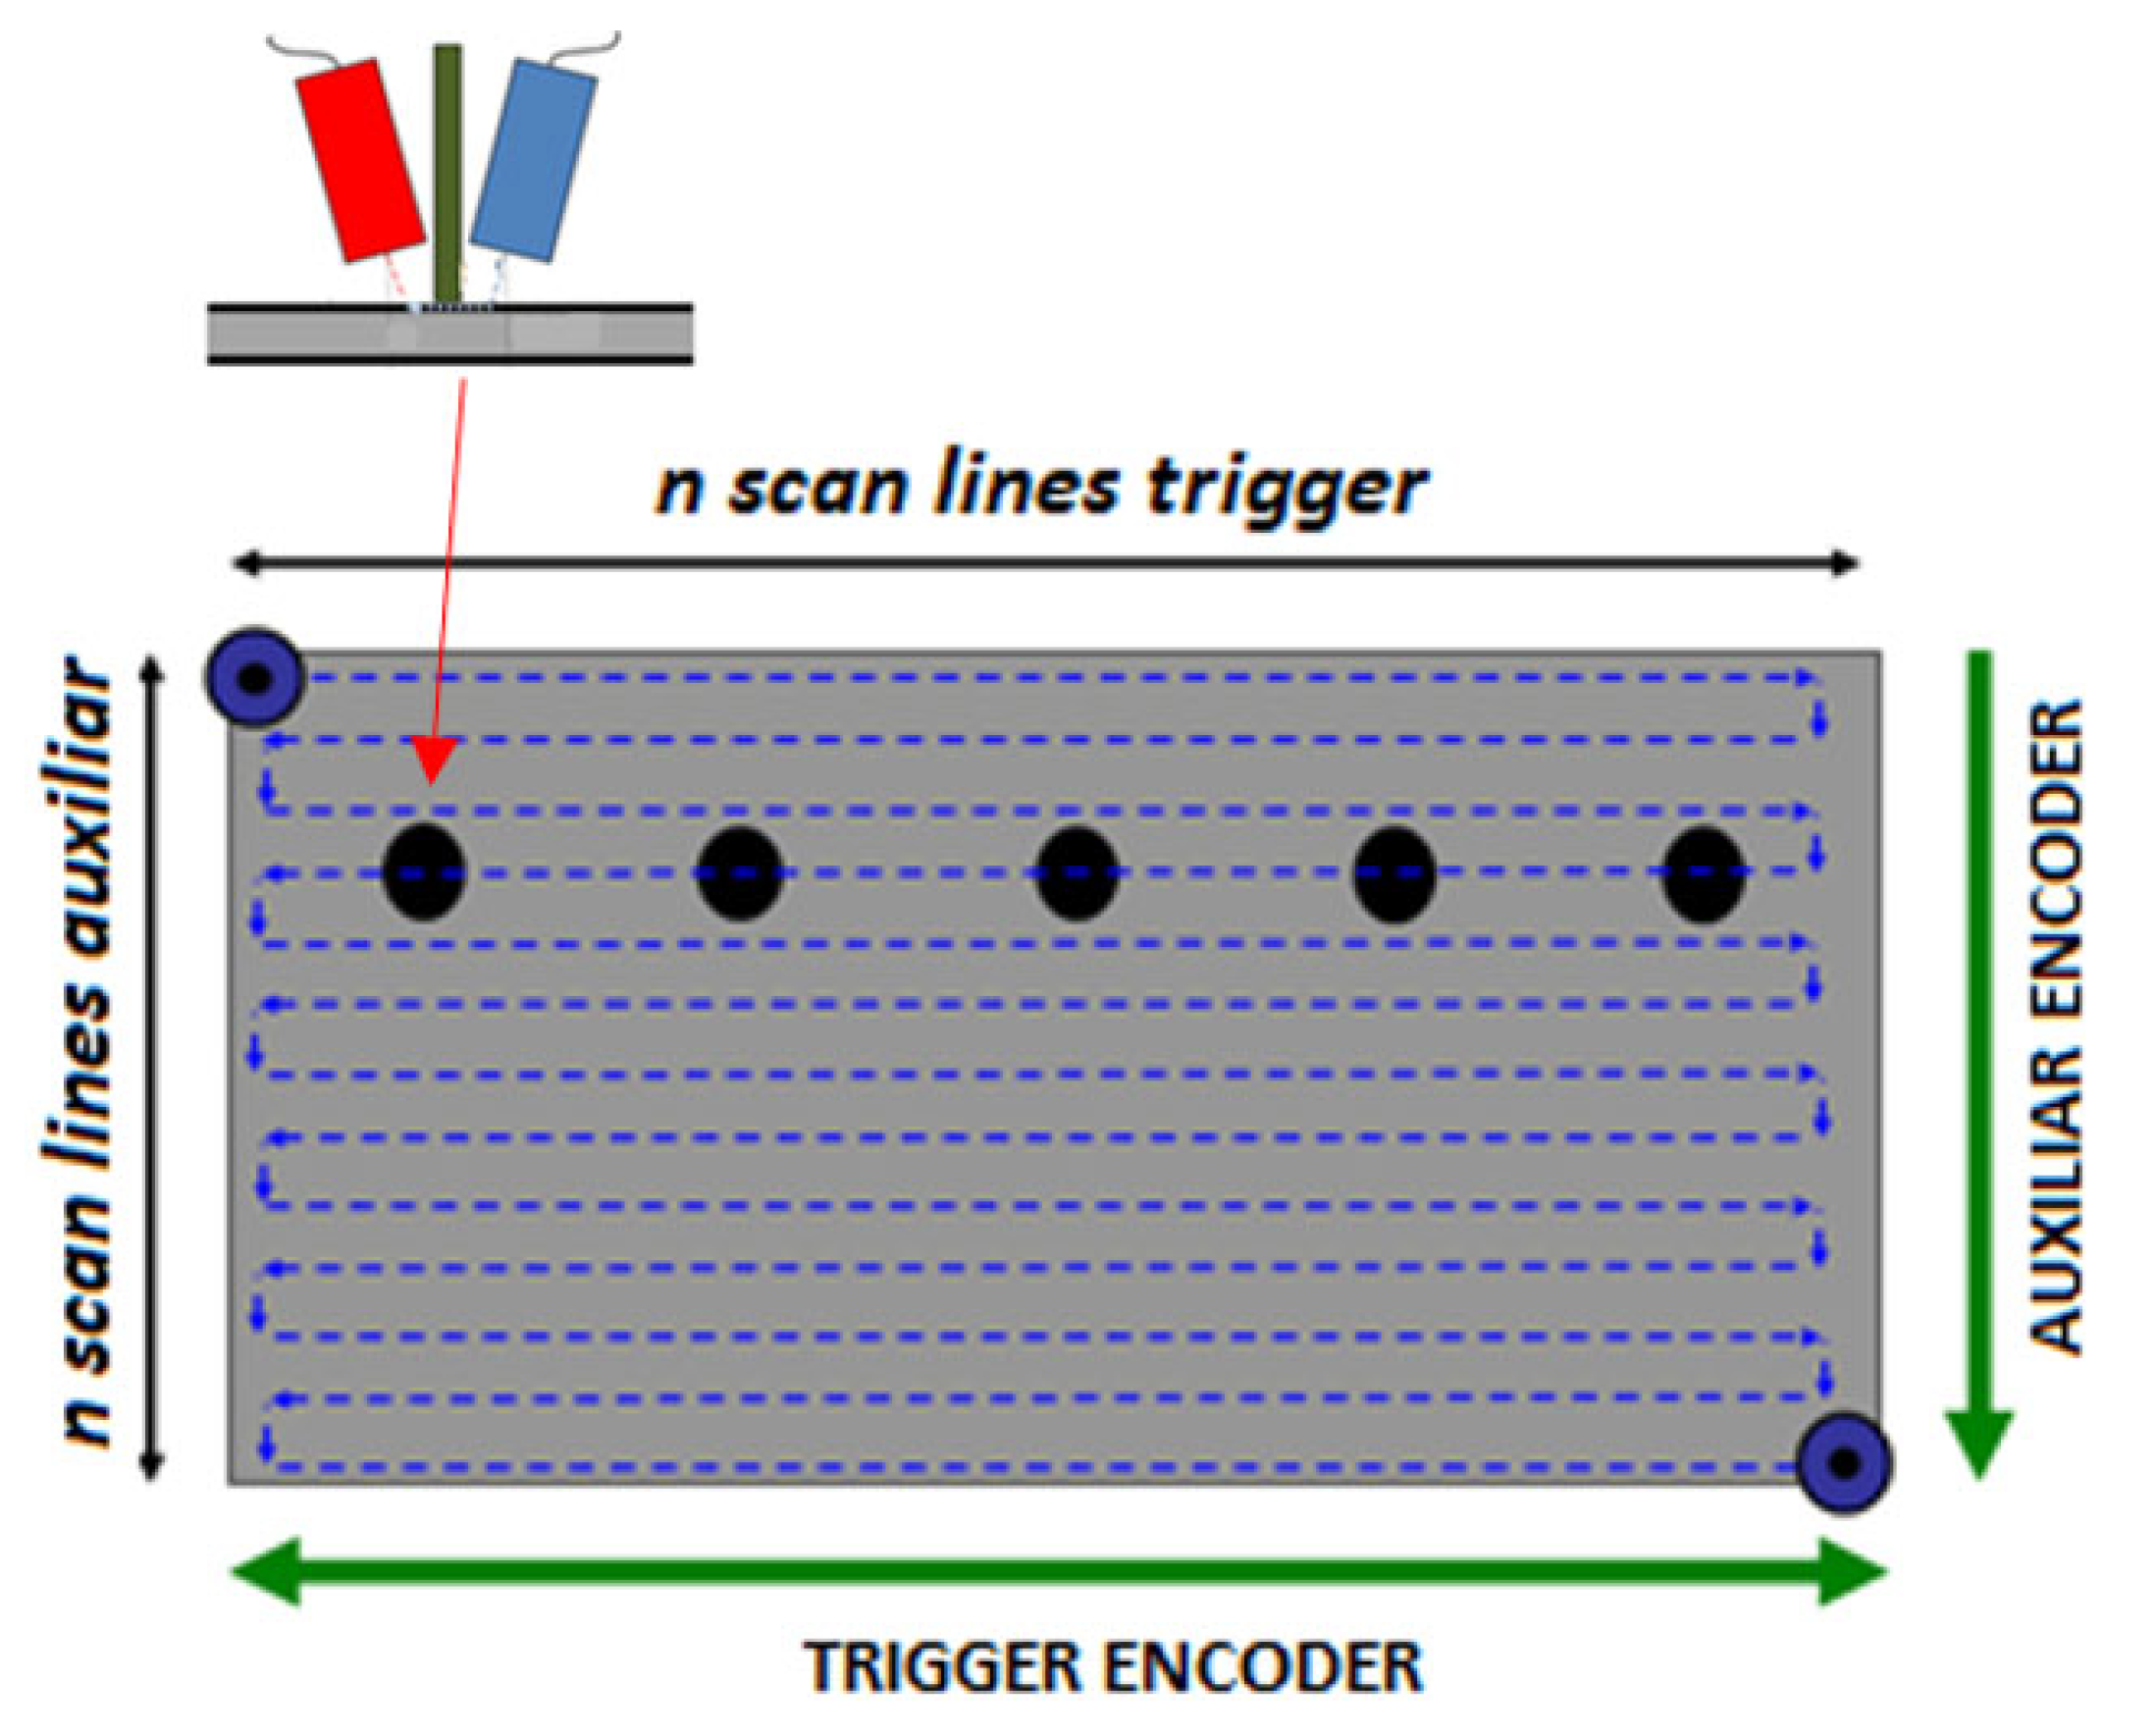
In this figure, it can be observed that images from the defect are rectangular and not square, according the sample design. This is a consequence of the scanner strategy shown in Figure 7 and also the transducer configuration (Figure 3a). This could be corrected by an additional image-processing algorithm.
The defects shown in Figure 13 depend on the change in the amplitude of the ALW pulse selected by a gate (Figure 8). It is expected that the amplitude increases with a disbond in the boundary of the CFRP with the foam. This could be explained by the interruption of the leakage. If the disbonds are separated from this boundary, the amplitude decreases. This could be explained by the change in the phase velocity according to the thickness reduction in the disbond plate and the dispersion curves [7]. This change demands a new angle according to Snell’s law, which was not achieved in the experiments. 
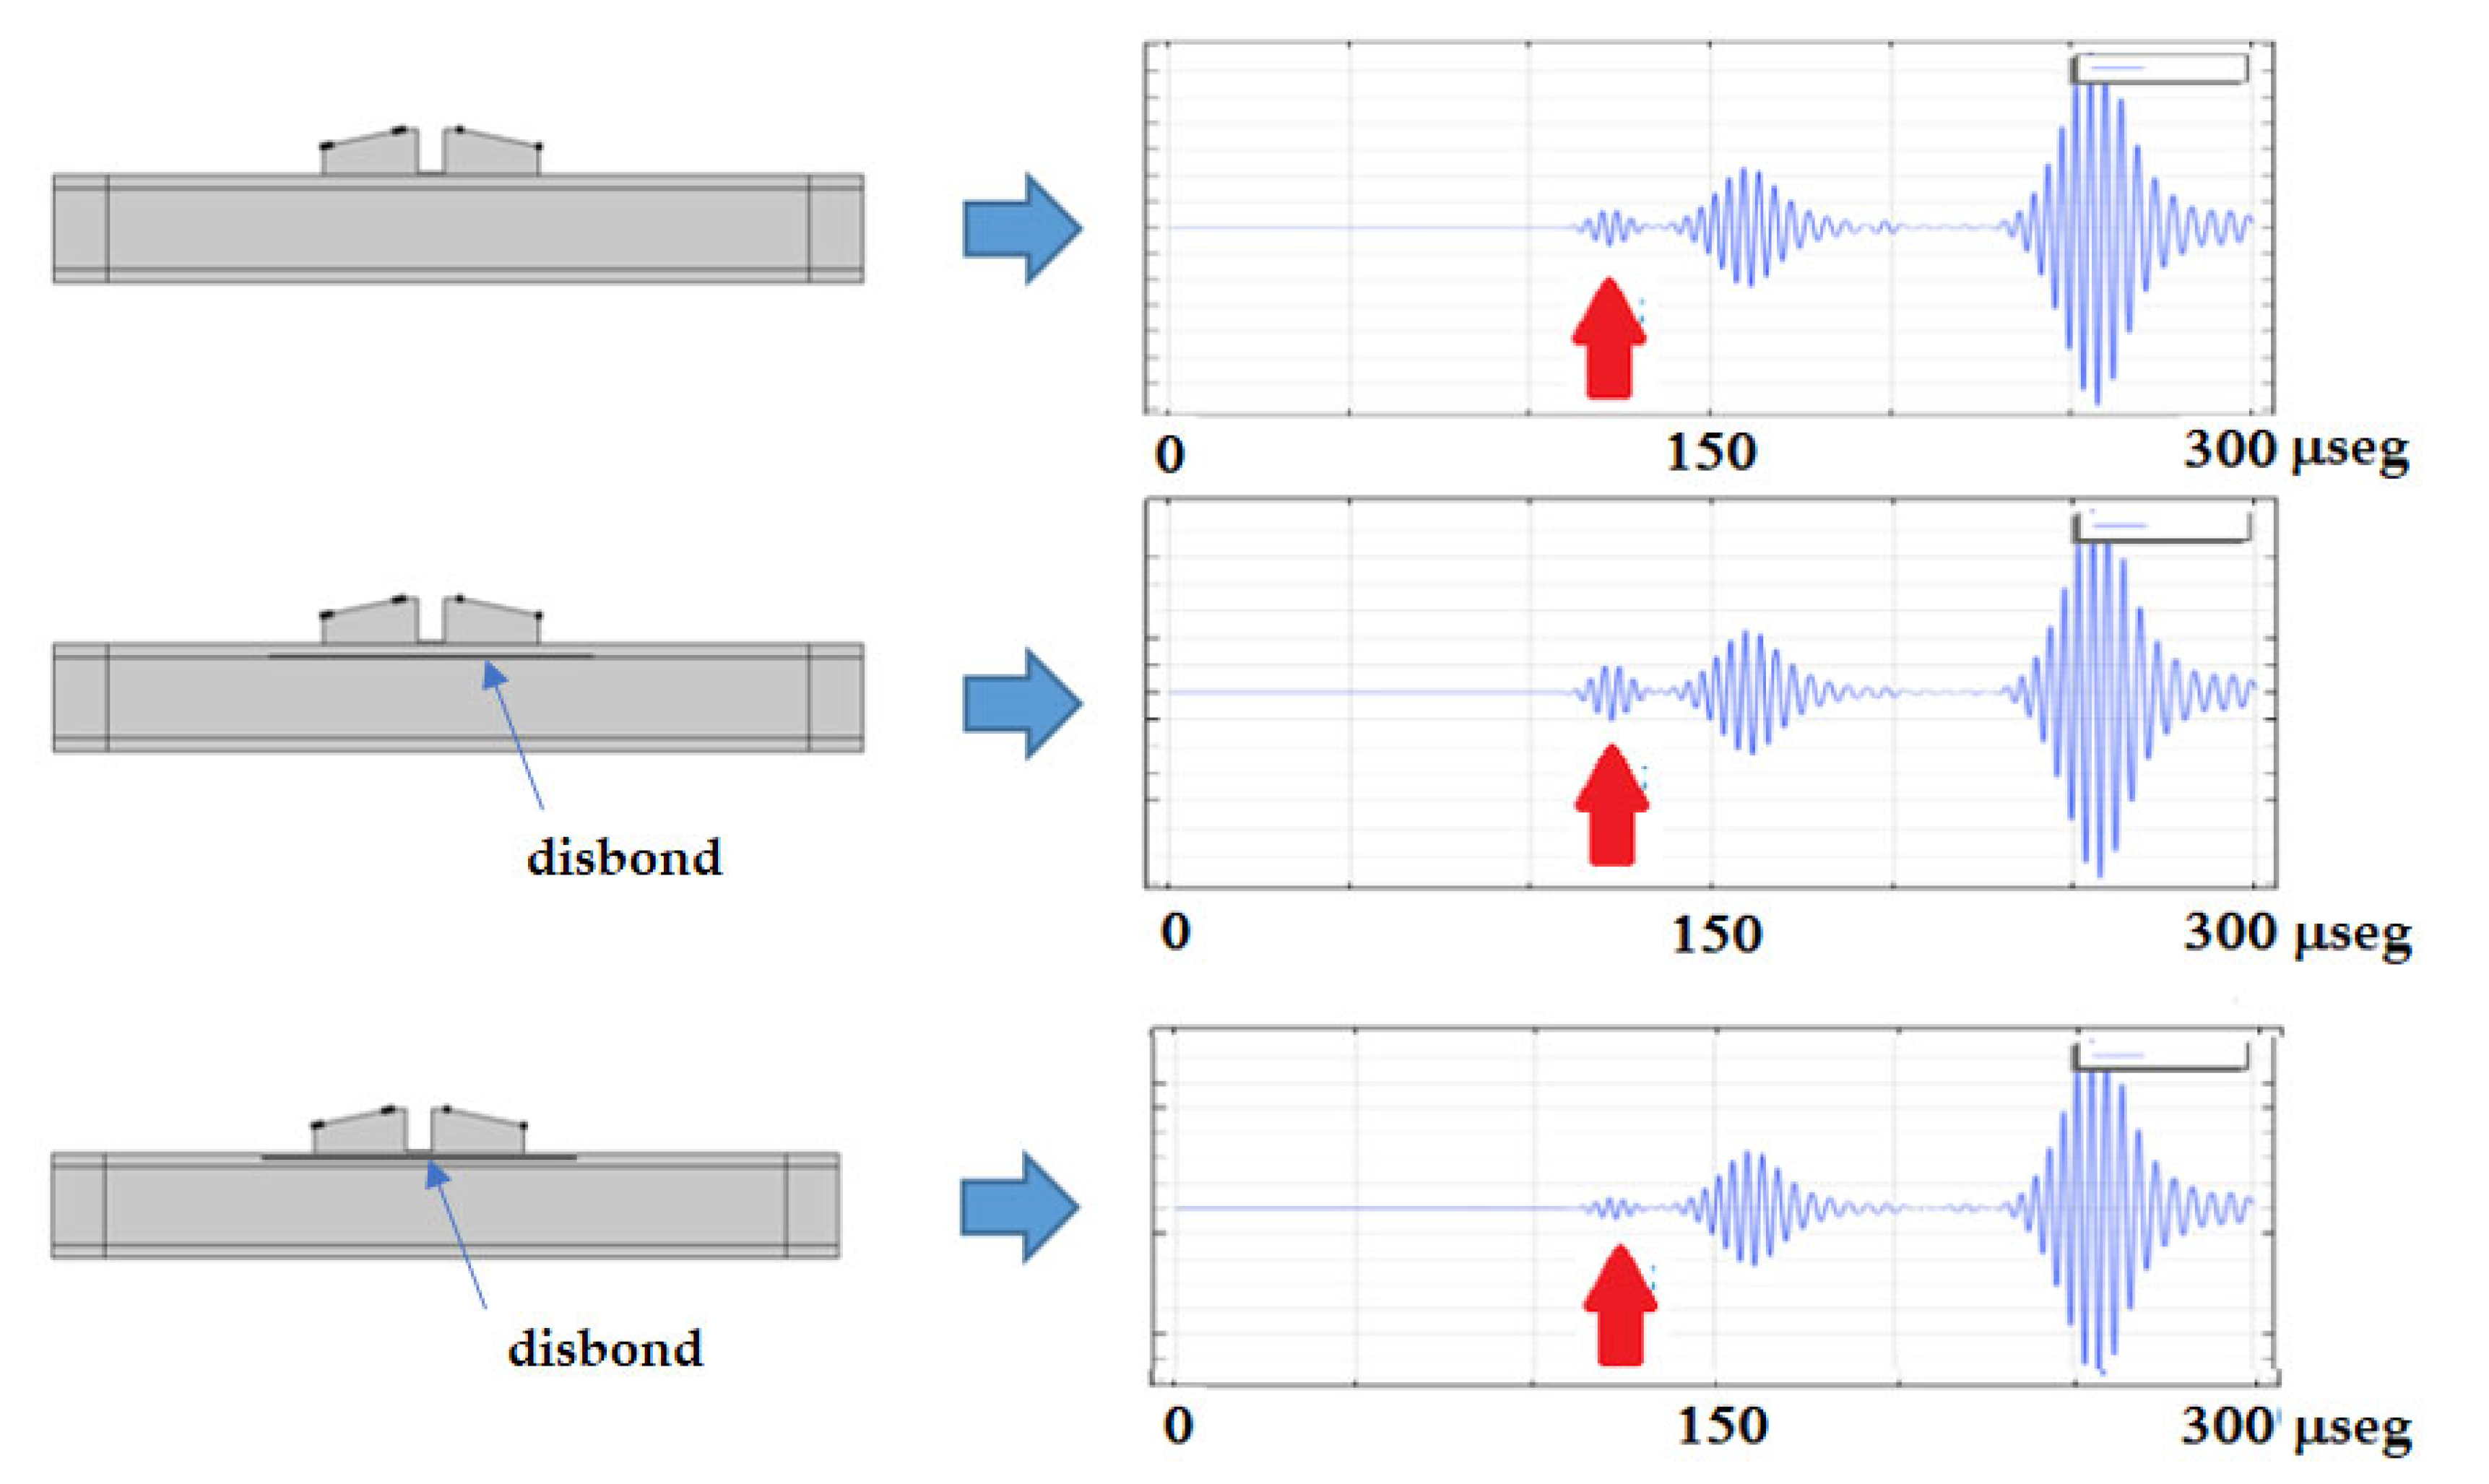
Figure 14 shows the development of the FEM models for these two disbond situations compared with the flawless case.
However, the models developed for the disbond situations do not explain the obtained C-Scan images. This could be due to the artificial defects in the sample being created, which introduced small square-shaped pieces of the PTFE film. However, this material does not represent a real disbond condition.
Finally, the FEM models could help us to understand a possible disbond case in a real impact situation of a car body. The fundamental idea is that the models explain the change in the amplitude of the ALW mode. The remainder signals are not affected by the defects. Therefore, only the ALW mode should be used for a C-Scan formation.
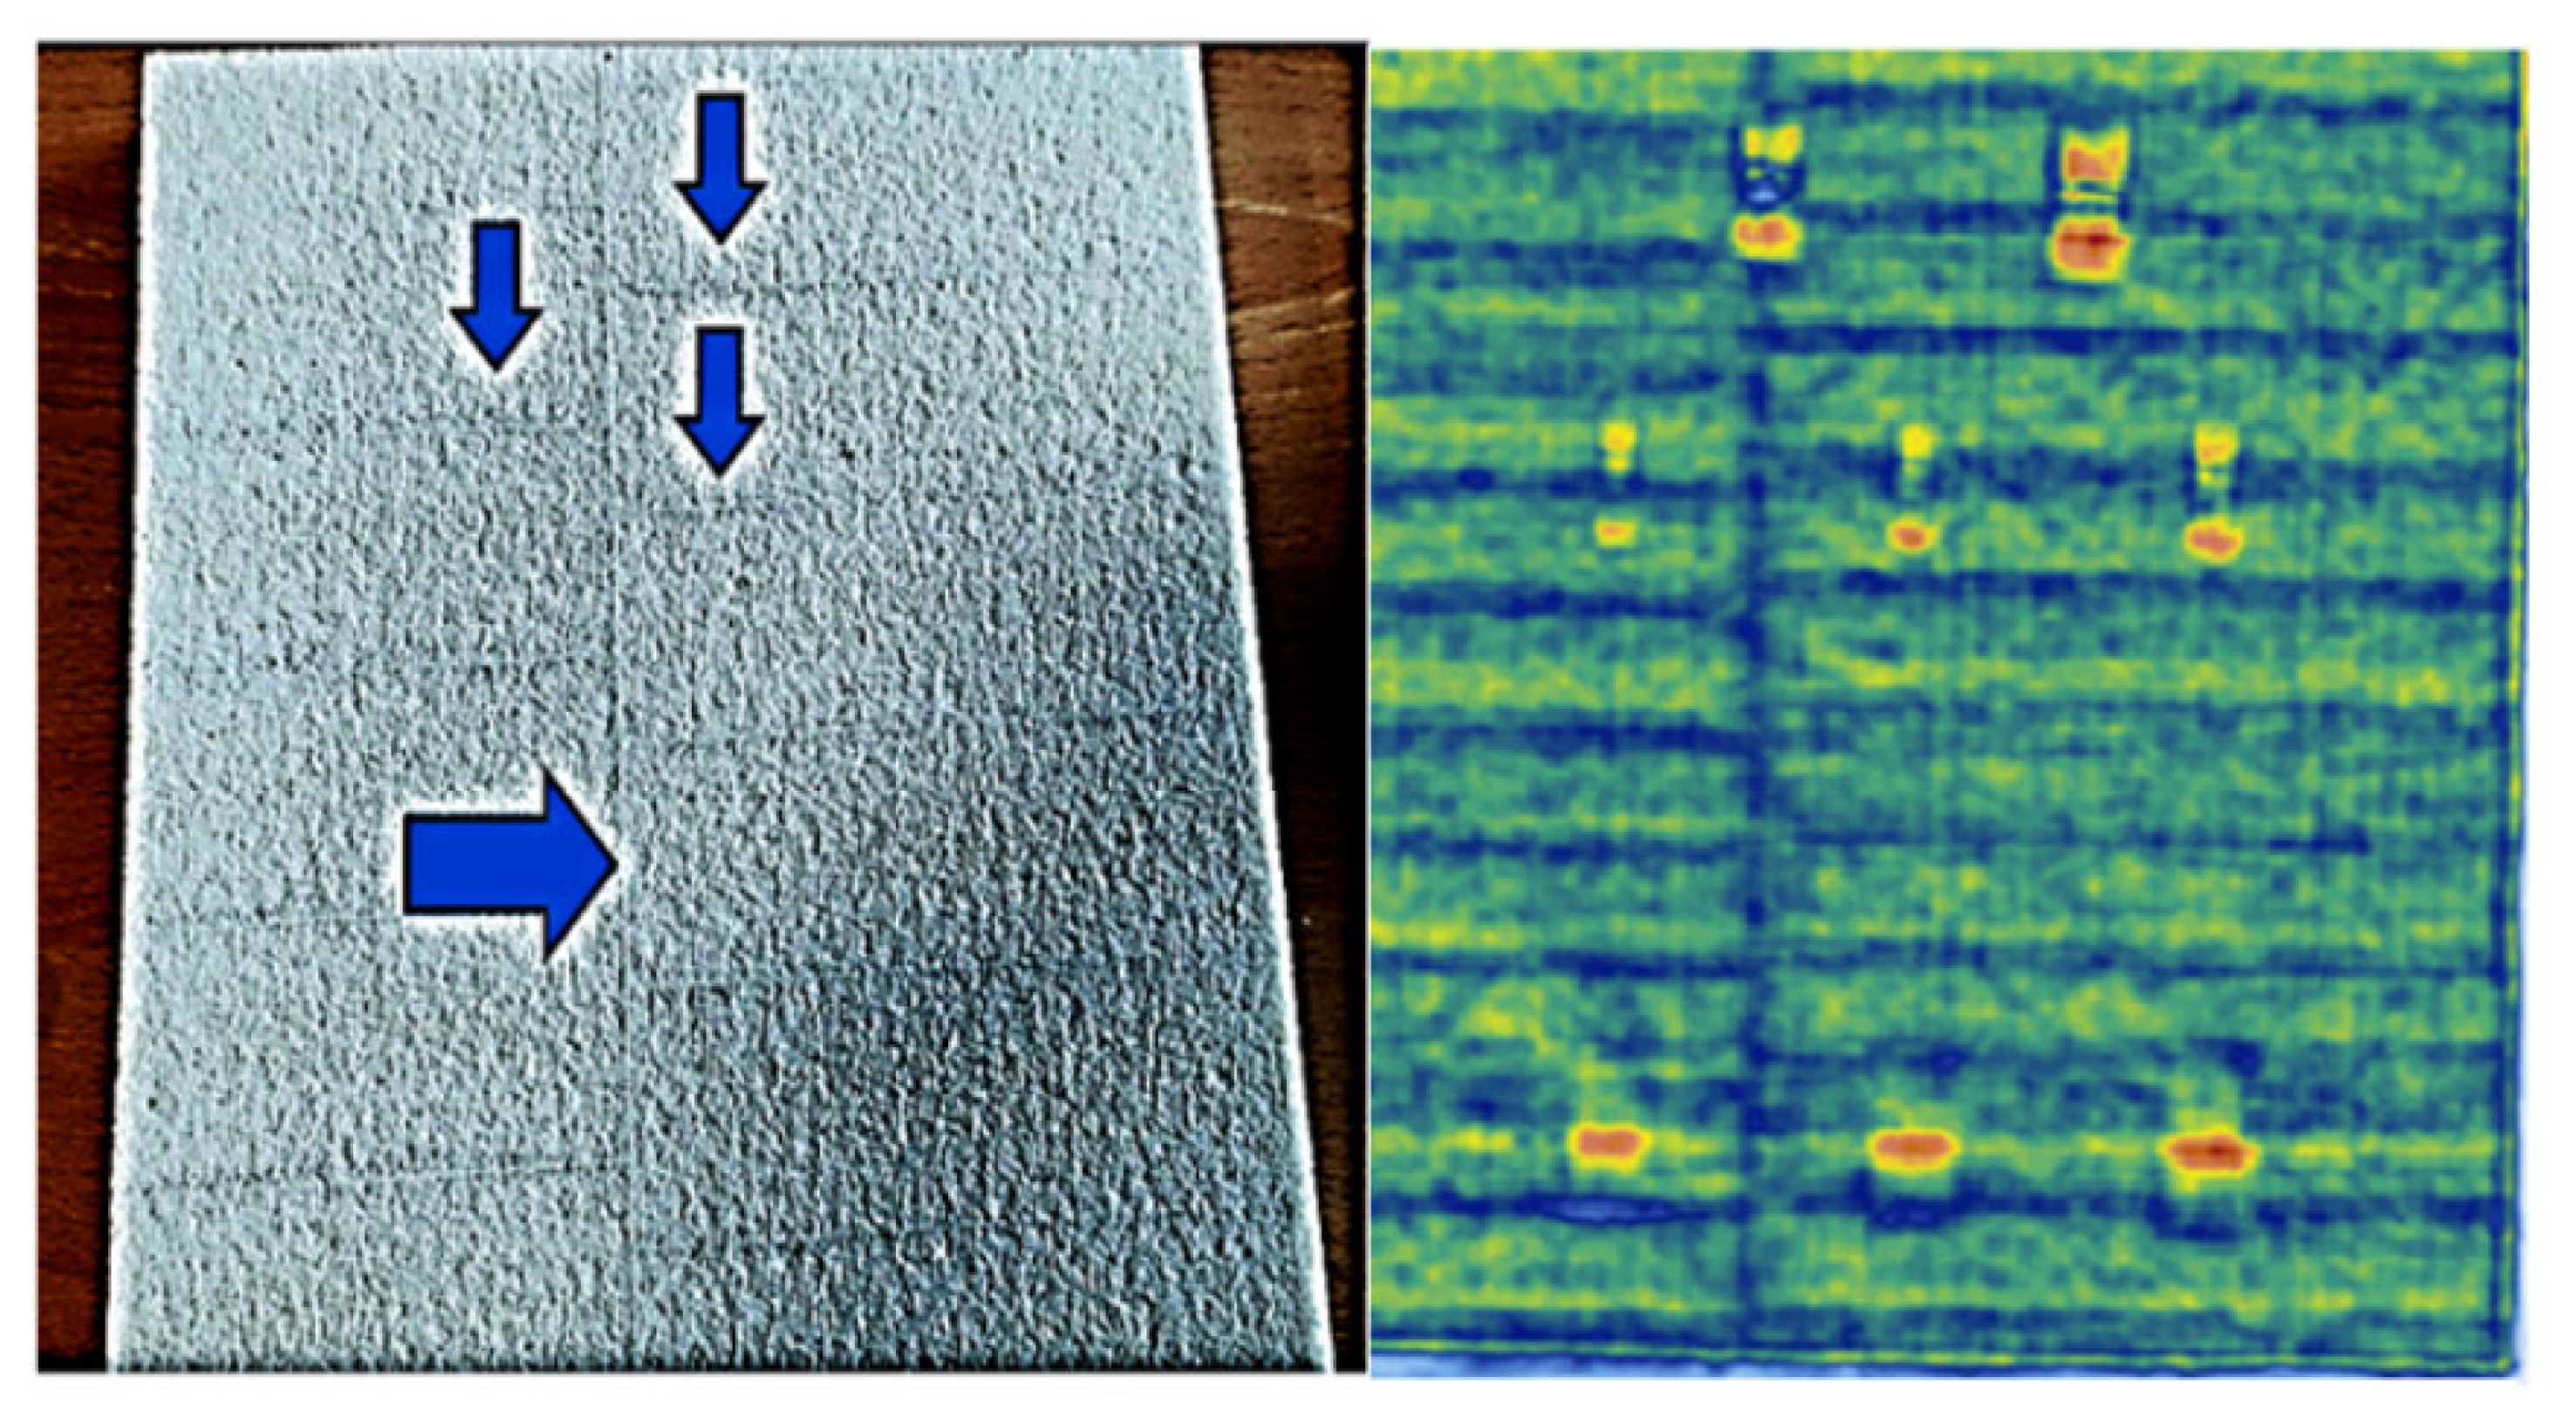
Finally, Figure 15 shows an interesting detail. Both sides of the C-Scan show several horizontal lines and one vertical line. This is associated with the foam structure that was composed of several blocks glued together, as shown in the figure. The arrows show some examples of the boundaries of these blocks. The impedance of the epoxy resin is higher than that of the foam, and then the ALW amplitude performs the contrast step in the C-Scan image.

5. Conclusions

For sandwich structure plane elements in a car body shell, UNCACT can be used for flaw detection over the upper CFRP layer. Excitation using an air transducer allows the generation of the antisymmetric Lamb wave (ALW) on the upper CFRP layer, which is not possible using conventional plastic wedge transducers. This mode was obtained using a specific angle according to the phase velocity from the analytical dispersion curves of the single CFRP plate, despite its sandwich structure.
The ALW mode propagating on the upper CFRP plate was identified as a part of a complex RF signal obtained at each Tx/Rx transducer position. The PVM was used to corroborate this mode. The mechanical scanning of these transducers, at a fixed distance, was used to obtain the C-Scan images according to the maximum amplitude of the ALW mode. Artificial flaws were detected in the sandwich sample plate at both faces.
Several novel FEM models were developed for the sandwich sample with the air-coupled transducers, which included an acoustic barrier. The reverberations of longitudinal waves in the Tx transducer introduced pulses under the barrier with several RF signals at the receiver. This was observed experimentally and also described using FEM models. This correlation between the experiments and theoretical FEM models has not been reported in the literature and could be used to improve this technology.
In the sandwich structure, the FEM model shows that the ALW mode propagating on the upper CFRP plate produces a leakage into the foam structure. Other FEM models were complemented by two kinds of disbonds according to their position in the CFRP layer. In this case, the used models did not correspond exactly with the conventional models. This could be a consequence of the technology used to induce defects in the sandwich sample. We showed the potential of FEM models for the interpretation of the several signals obtained with the ultrasonic technique.
The C-Scan images acquired in the ALW mode were obtained only in the upper layer of the sandwich plate. This is important considering the objective of using the UNCACT method to detect defects induced by an impact accident in the upside part of the car body shell. The use of air transducers helped us to obtain images faster than other UT-NDT methods with a good resolution.
The evaluation of the lower second CFRP layer of the composite sandwich plate still presents considerable challenges. In the propagation of the ALW mode in the first CFRP layer, a possible leakage into the foam material should be considered.

Author Contributions

Conceptualization, E.M. and R.G. (Ricardo Gonzalez); methodology, R.G. (Roberto Giacchetta) and R.G. (Ricardo Gonzalez); software, E.M., R.G. (Ricardo Gonzalez), W.C. and A.T.-P.; validation, D.S. and G.C.; formal analysis, D.S.; investigation, R.G. (Ricardo Gonzalez); resources, R.G. (Roberto Giacchetta) and O.S.-S.; data curation, E.M.; writing—original draft, E.M.; preparation, E.M. All authors have read and agreed to the published version of the manuscript.

Funding

Gearbodies project, no. 101013296, from the European Horizon 2020 program.

Institutional Review Board Statement

Shift to rail program and PIVOT Program.

Informed Consent Statement

Not applicable.

Data Availability Statement

Not applicable.

Acknowledgments

This paper was supported by the Gearbodies project, no. 101013296, from the European Horizon 2020 program.

Conflicts of Interest

The authors declare no conflict of interest.

References

  1. Essig, W.; Bernhardt, Y.; Döring, D.; Solodov, I.; Gautzsch, T.; Gaal, M.; Hufschläger, D.; Sommerhubee, R.; Brauns, M.; Marhenke, T.; et al. Air-coupled Ultrasound—Emerging NDT Method. ZfP-Zeitung 2021, 173, 32–43. [Google Scholar]
  2. Castaings, M.; Hosten, B. The use of electrostatic, ultrasonic, air-coupled transducers to generate and receive Lamb waves in anisotropic viscoelastic plates. Ultrasonics 1998, 36, 361–365. [Google Scholar] [CrossRef]
  3. Martincek, G.; Kadlecik, T. The use of wave propagation method in evaluations of road pavements stiffness. In Proceedings of the International Symposium of Bearing Capacity of Road and Airfields, Trondheim, Norway, 23–25 June 1982; pp. 119–127. [Google Scholar]
  4. Moreno, E.; Acevedo, P. Thickness measurement in composite material using Lamb wave. Ultrasonic 1998, 35, 581–586. [Google Scholar] [CrossRef]
  5. Cruz, M.; Hernandez, V.; Estrada, J.; Moreno, E.; Mansur, A. Numerical Solution of the wave propagation in a plate. J. Theor. Comput. Acoust. 2021, 30, 2150014. [Google Scholar] [CrossRef]
  6. Moreno, E.; Acevedo, P.; Castillo, M. Pulse propagation in plate elements. Eur. J. Mech. A Solids 2003, 22, 283–294. [Google Scholar] [CrossRef]
  7. Moreno, E.; Galarza, N.; Rubio, B.; Otero, J.A. Phase velocity method for guided wave measurements in composite. Phys. Procedia 2015, 63, 54–60. [Google Scholar] [CrossRef]
  8. Castaings, M.; Predoi, M.; Hosten, B. Ultrasound propagation in viscoelastic material guides. In Proceedings of the COMSOL Multiphysics User’s Conference 2005, Paris, France, 2–4 November 2005. [Google Scholar]
  9. Baid, H.; Schaal, C.; Samajder, H.; Mal, A. Dispersion of Lamb waves in a honeycomb composite sandwich panel. Ultrasonics 2015, 56, 409–416. [Google Scholar] [CrossRef] [PubMed]
  10. Prego Borges, J.L. LAMB: A Simulation Tool for Air-Coupled Lamb Wave. Ph.D. Thesis, Polytechnic University of Catalonia, Barcelona, Spain, 2010. [Google Scholar]
  11. Diamanti, K.; Soutis, C.; Hodgkinson, J. Lamb waves for the non-destructive inspection of monolithic and sandwich composite beams. Composites 2005, 36, 189–195. [Google Scholar] [CrossRef]
  12. Hillger, W.; Ilse, D.; Bühling, L. Lamb-Waves for Air-coupled Ultrasonic Testing with one-sided Access. In Proceedings of the 8th European Workshop on Structural Health Monitoring (EWSHM 2016), Bilbao, Spain, 5–8 July 2016. [Google Scholar]
  13. Hillger, W.; Ilse, D.; Bühling, L. Practical Applications of Air-Coupled Ultrasonic Technique. In Proceedings of the 4th International Symposium on NDT in Aerospace 2012, Augsburg, Germany, 13–15 November 2012. [Google Scholar]
  14. Hillger, W.; Bühling, L.; Ilse, D. Air-coupled Ultrasonic Testing-Method, System and practical Applications. In Proceedings of the 11th European Conference on Non-Destructive Testing (ECNDT 2014), Prague, Czech Republic, 6–10 October 2014. [Google Scholar]
  15. Hillger, W.; Ilse, D.; Bühling, L. Industrial applications of air-coupled ultrasonic technique. In Proceedings of the 7th International Symposium on NDT in Aerospace, Bremen, Germany, 15–17 November 2015. [Google Scholar]
  16. Swiderski, W.; Hlosta, P.; Chuda-Kowalska, M. Non-destructive evaluation of sandwich plates by an ultrasonic IR thermographic method. In Proceedings of the 13th International Conference on Quantitative Infrared Thermography, Gdańsk, Poland, 4–8 July 2016. [Google Scholar]
  17. Lee, S.E.; Liu, P.; Ko, Y.W.; Sohn, H.; Park, B.; Hong, J.W. Study on effect of laser-induced ablation for Lamb waves in a thin plate. Ultrasonics 2019, 91, 121–128. [Google Scholar] [CrossRef] [PubMed]
  18. Chong, S.Y.; Victor, J.; Todd, M.D. Full-field ultrasonic inspection for a composite sandwich plate skin-core debonding detection using laser-based ultrasonics. In Health Monitoring of Structural and Biological Systems; SPIE: Bellingham, WA, USA, 2017; p. 10. [Google Scholar]
  19. Zheng, S.; Luo, Y.; Xu, C.; Xu, G. A Review of Laser Ultrasonic Lamb Wave Damage Detection. Sensors 2023, 23, 26. [Google Scholar]
  20. Deng, P.; Saito, O.; Okabe, Y.; Soejima, H. Simplified modeling method of impact damage for numerical simulation of Lamb wave propagation in quasi-isotropic composite structures. Compos. Struct. 2020, 243, 12. [Google Scholar] [CrossRef]
  21. Rose, J.L. Guided Wave; Elsevier: Amsterdam, The Netherlands, 2015. [Google Scholar]
  22. Auld, B.A. Acoustic Field and Waves in Solids; Krieger Pub. Co.: Malabar, FL, USA, 1990. [Google Scholar]
  23. Available online: https://www.daselsistemas.com/en/ (accessed on 1 October 2023).
Figure 1. Analytical dispersion curves for the fundamental symmetric and antisymmetric modes for a single CFRP plate of 5 mm thickness. Phase = phase velocity; Group = group velocity. We assumed free boundary conditions [7].
Ndt 01 00006 g001
Figure 2. Description of the propagation modes, including the incident longitudinal waves in the air. Longitudinal leakage waves are produced on both sides of the air surrounding a single plate, where the Lamb wave propagates. Tx and Rx are the transmitter and receiver air transducers, respectively. Both are situated at angle α with the same value. The black arrow is a representation of the Lamb mode propagation.
Ndt 01 00006 g002
Figure 3. (a) Transducer configuration. Z = 10 mm, X = 50 mm. (b) Photo of the transducers used in the experiments over the sandwich plate. (c) Comsol domain diagram. Both transducers were simulated by a boundary condition over an air wedge (Tx and Rx). The air wedges are connected by a small air channel less than 1 mm in thickness (zoom circle).
Ndt 01 00006 g003
Figure 4. Excitation pulse applied to boundary Tx.
Ndt 01 00006 g004
Figure 5. Diagram and manufacturing details of the sandwich plate used in the experiments and simulation models. (a) Top view of the defect diagram. (b) Lateral view of the defect diagram. Delaminations in CFRP skin and disbonds between the foam and CFRP skins are shown. T and B represent the top and bottom flaws relative to each CFRP skin, respectively. (c) View of the smoother surface of the sandwich plate. (d) View of the rougher surface. (e) Cross-section of the sandwich plate. (f) Zoomed view of the cross-section.
Ndt 01 00006 g005
Figure 6. Phase velocity method (PVM). On the left, there is a sample plate with three space reference points Xi. On the right, the RF signal associated with the previous reference points at the plate can be observed. Black signal corresponds to X1 transducer position, red signal to X2 transducer position and blue signal to X3 transducer position. The scales in the RF are the relative displacement vertical amplitude vs. time. In the RF signals, the red arrows show a constant phase point relative to the first maximum.
Ndt 01 00006 g006
Figure 7. The 2D scanner diagram to obtain the C-Scan image. The black point represents the central position of both Tx and Rx transducers, which moves as a whole with fixed distances. Two encoders, on each axis, were used to control the displacements in these experiments.
Ndt 01 00006 g007
Figure 8. Example of an RF signal. The blue gate selects the antisymmetric Lamb wave mode (ALW). On this gate, the maximum amplitude at the blue point was used in the C-Scan image.
Ndt 01 00006 g008
Figure 9. FEM simulation of the RF signal at a fixed distance X = 10 and Z = 50 mm. The red arrow shows the ALW mode. The blue arrow shows the first secondary signal, and the black arrow shows the second secondary signal.
Ndt 01 00006 g009
Figure 10. Phase velocity method. On the left, the analytical dispersion curve for a single CFRP plate (free CFRP plate), the CFRP sandwich plate by PVM Comsol FEM, and the sandwich experimental point at 250 KHz can be observed.
Ndt 01 00006 g010
Figure 11. Time sequence (4, 6, 8, 10, and 12 μseg) of the emission of the longitudinal wave from Tx (red arrow) and the conversion to the ALW mode (blue arrow) and longitudinal leakage (black arrow). The red circle shows a shear wave.
Ndt 01 00006 g011
Figure 12. Time sequence of wave propagation at 8, 10, 12, 14, 18, and 20 μseg. A logarithmic scale was used to improve the Rx air wedge color scale. The red arrow shows the AWL mode leakage through the Rx wedge. The blue and black arrows in the Rx air wedge show the first and the second longitudinal waves that travel under the acoustic barrier, respectively. They are all related to the secondary RF signals shown in Figure 9.
Ndt 01 00006 g012
Figure 13. Two C-Scam images for both sides of the sandwich plate obtained with the selected ALW mode. The right image represents the top case and the left image is the bottom case in Figure 5a. Each section includes two diagrams of the flaws relative to the upper CFRP plate according to its orientation. These diagrams were extracted from Figure 5a for the T (top) and B (bottom) cases.
Ndt 01 00006 g013
Figure 14. The red arrows show the ALW mode used for the C-Scan images. The two disbond positions (middle and bottom) are compared with the flawless case (up).
Ndt 01 00006 g014
Figure 15. The foam structure observed in the C-Scan image. The dimension scales differ from the photo (left) to the C-Scan case.
Ndt 01 00006 g015
Table 1. Elastic constants used for a CFRP plate [7].
C11 (GPa)C22 (GPa)C12 (GPa)C66 (GPa)
38.47.732.6
Table 2. Characteristic sample used for UT testing.
SampleDimensionsFiber Orientation
Sandwich plate composed of two layers of CFRP and a foam core. Defects were included.600 × 460 × 5 (each skin)
600 × 460 × 30 (core)
0/90/+45/−45
Disclaimer/Publisher’s Note: The statements, opinions and data contained in all publications are solely those of the individual author(s) and contributor(s) and not of MDPI and/or the editor(s). MDPI and/or the editor(s) disclaim responsibility for any injury to people or property resulting from any ideas, methods, instructions or products referred to in the content.

