
Development of Non-Destructive Dynamic Characterization Technique for MMCs: Predictions of Mechanical Properties for Al@Al2O3 Composites

 , , , , and
Abstract
:1. Introduction
2. Materials
2.1. Experimentation
2.2. Characterization
3. Methods
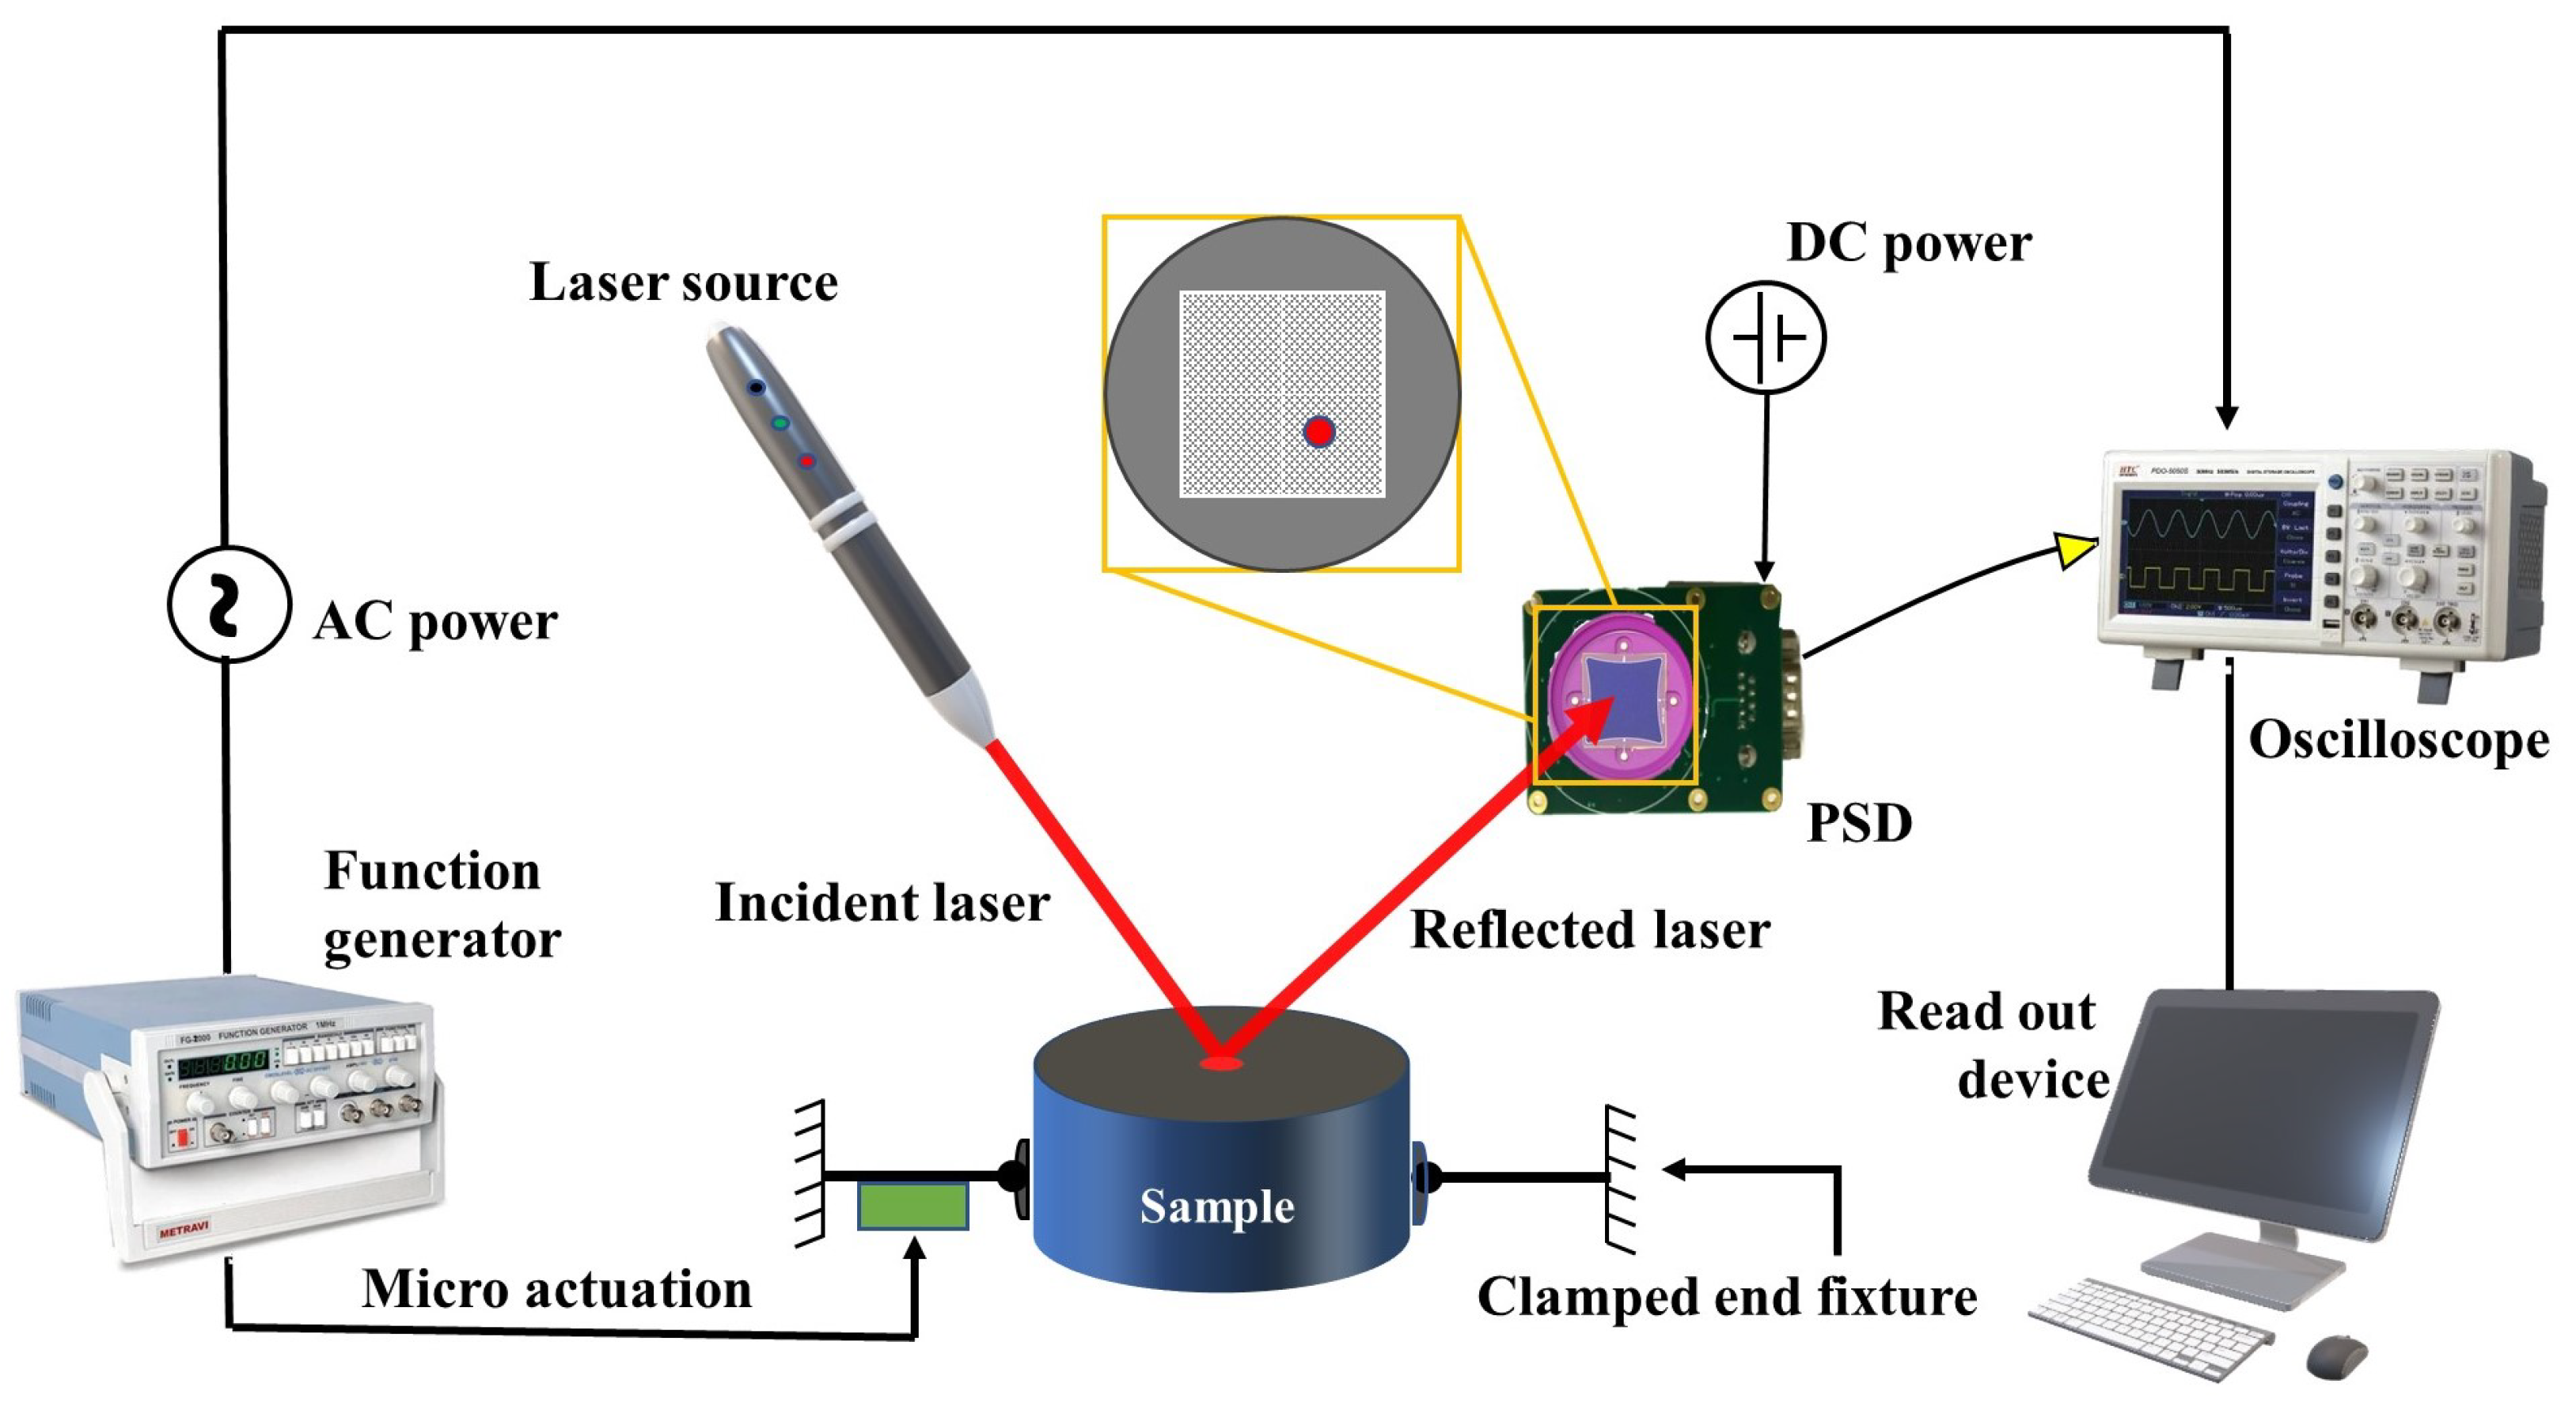
3.1. Non-Invasive PSD-Based Experimental Setup
3.2. Response Measurement
3.3. Evaluation of Young’s Modulus
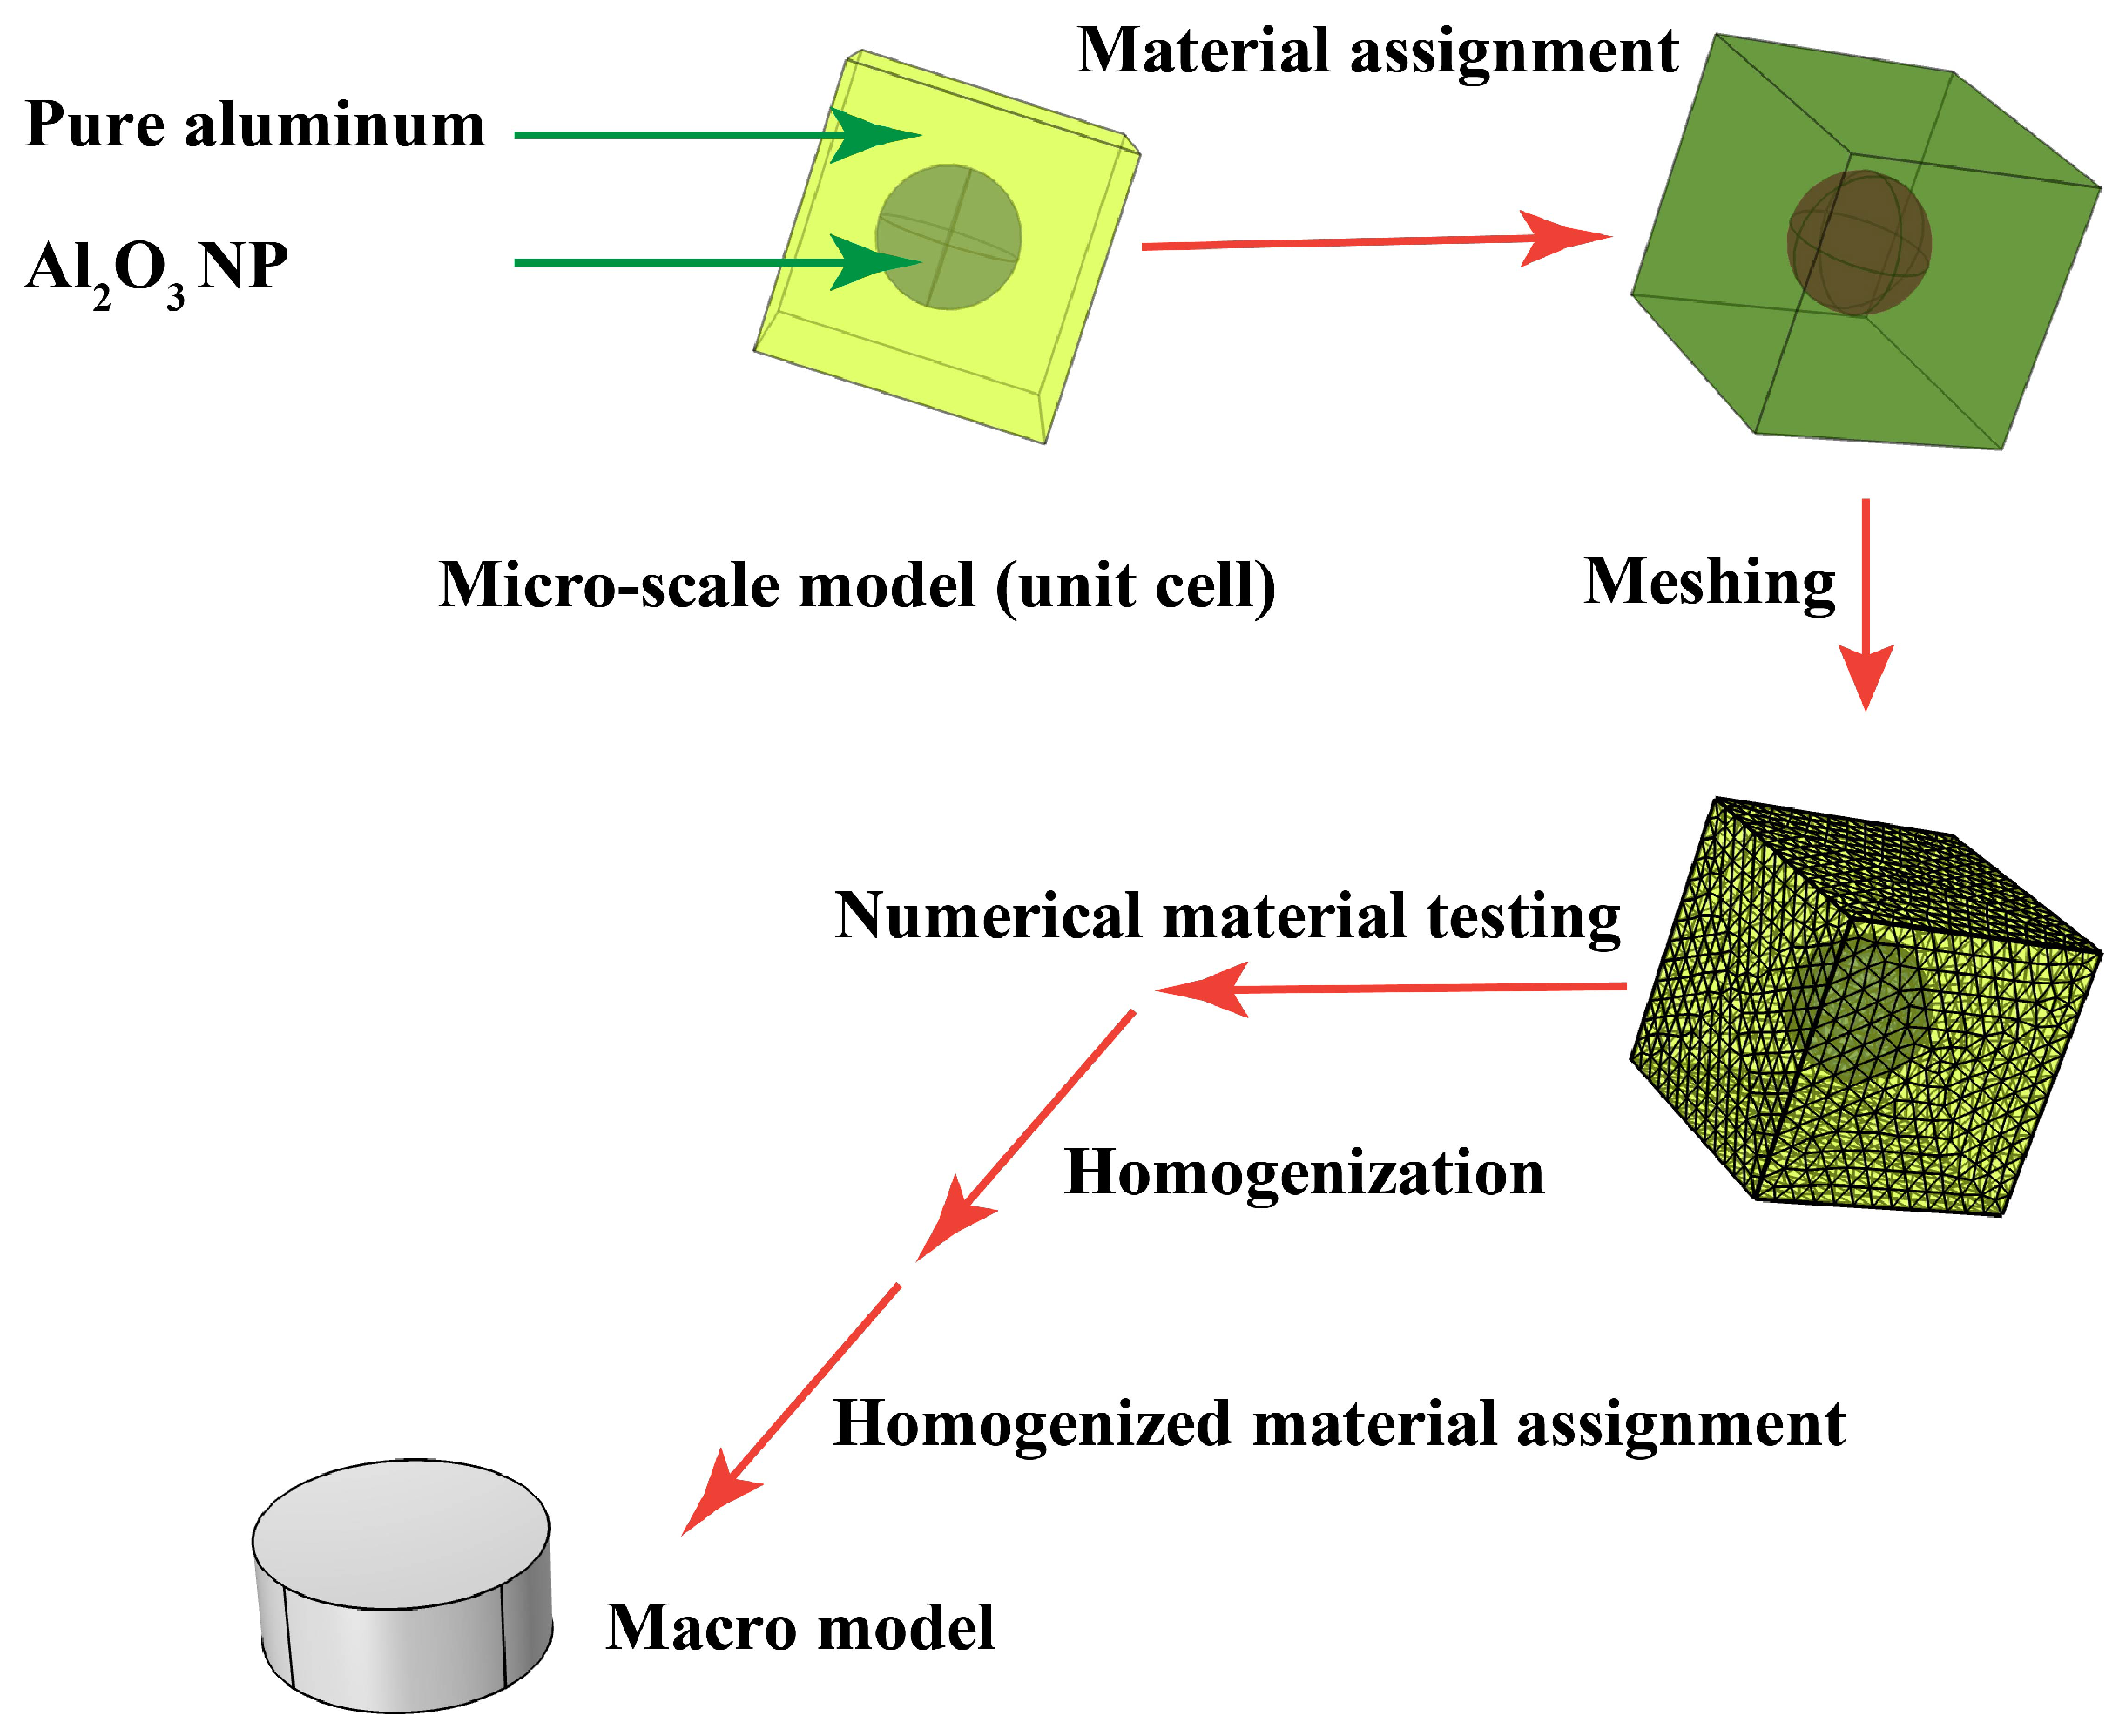
3.4. Numerical Modeling
3.4.1. Create a Unit Cell Model
3.4.2. Homogenization Analysis
- A macroscopic constitutive material model has been made after integrating the Equation (2).
- Conducting NMTs on a unit cell model using Finite Element mesh
- −
- Provide the macroscopic displacement gradient H followed by the relative displacement vector of the external points,
- −
- The BVP equations are illustrated as per the following equations.On imposing,where T is a tractive force vector, F is force vector, and P is a nominal stress vector.
- −
- Obtain 1st-Piola–Kirchhoff (PK) or nominal stress at each incremental step n for all loading patterns by directly solving the extended micro-scale BVP with the response force vector,where R and denote the reaction force and area, respectively.
- Identifying macroscopic parameters for materials
- −
- Calculate the macro-scale 2nd PK stress using NMT data.and the right-CG deformation tensors C[n,] and store all sets of data over
- −
- Create a function with the material parameters p
- −
- Identify the macroscopic material parameters p by solving the obtained algebraic Equation (8), where G and b are the coefficient matrix.
- −
- Macroscopic FE-analysis
Solve the macro-scale BVP using the assumed constitutive model with identified material parameters
3.4.3. Numerical Procedure for Macro Model
4. Results
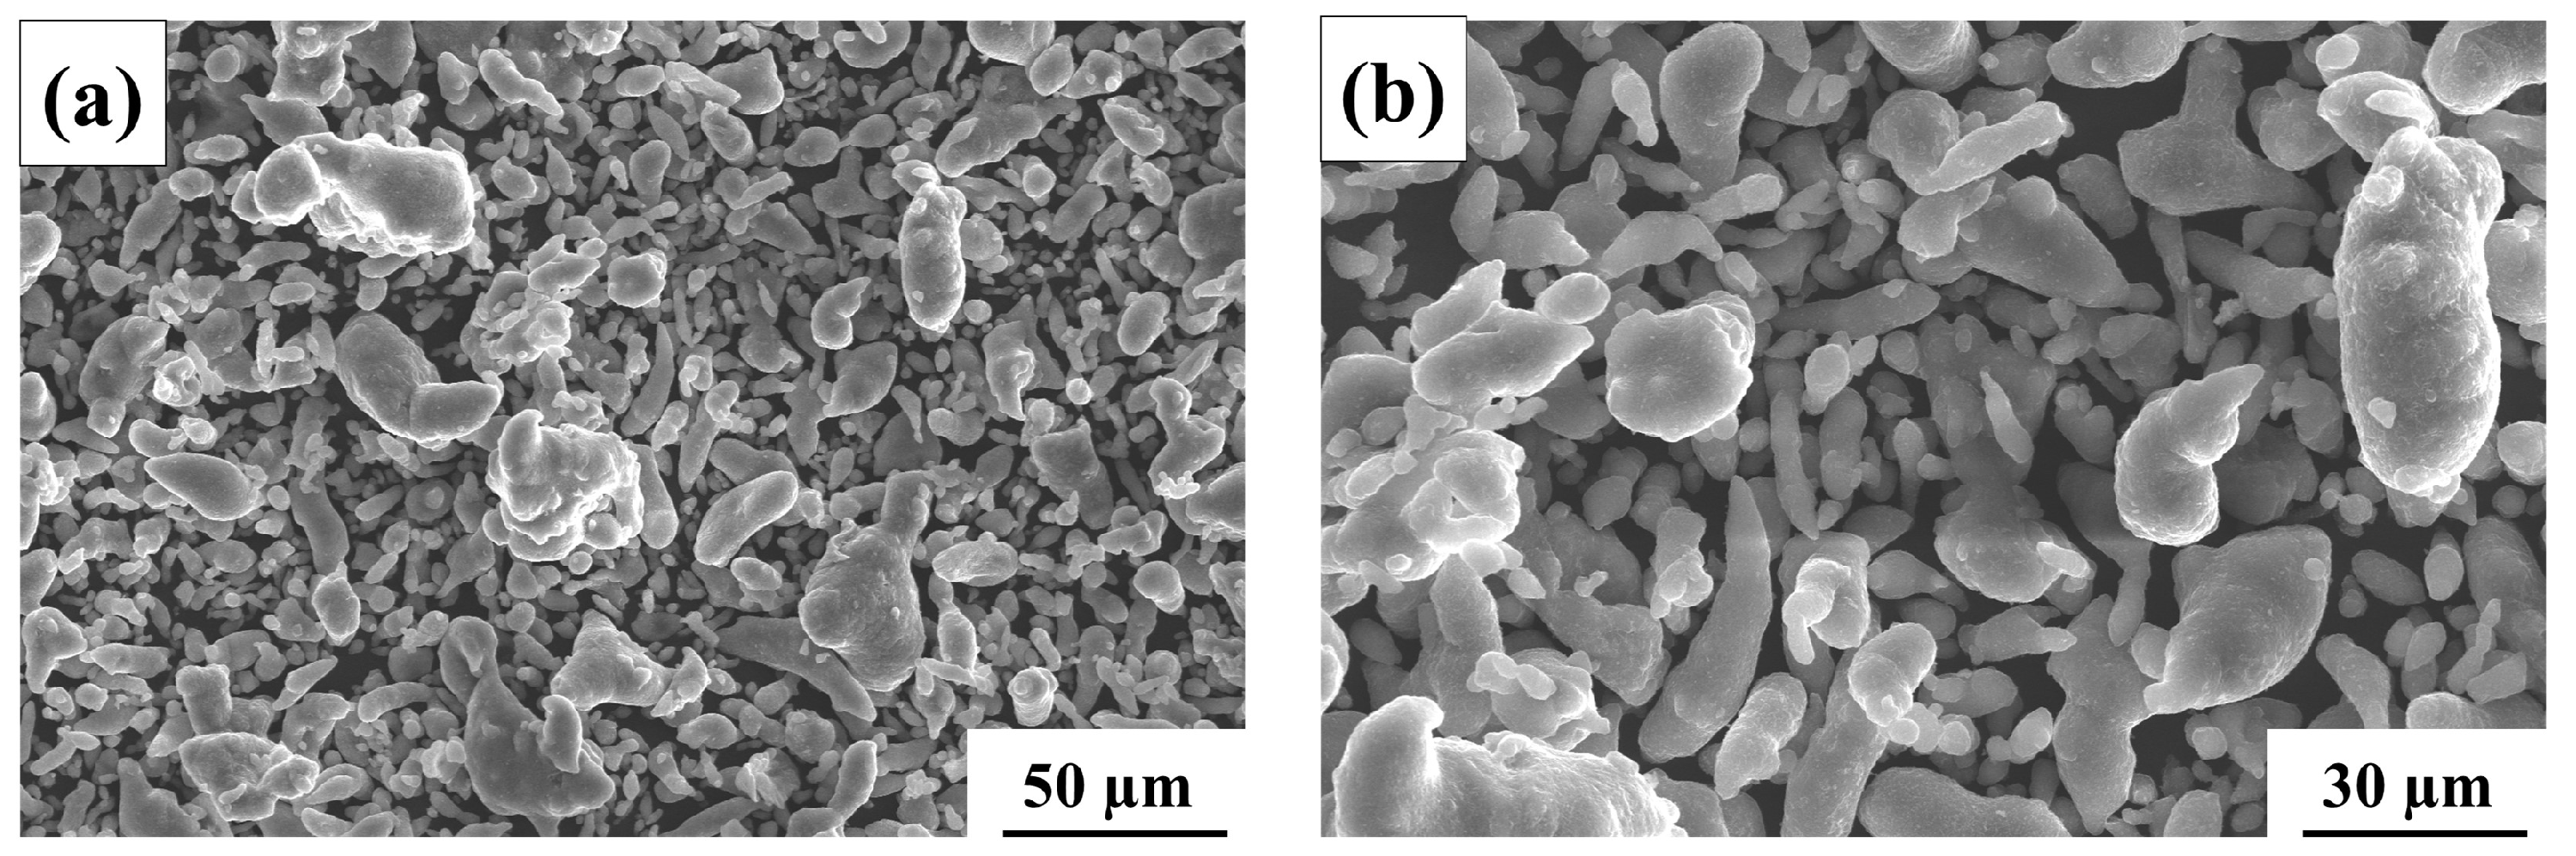
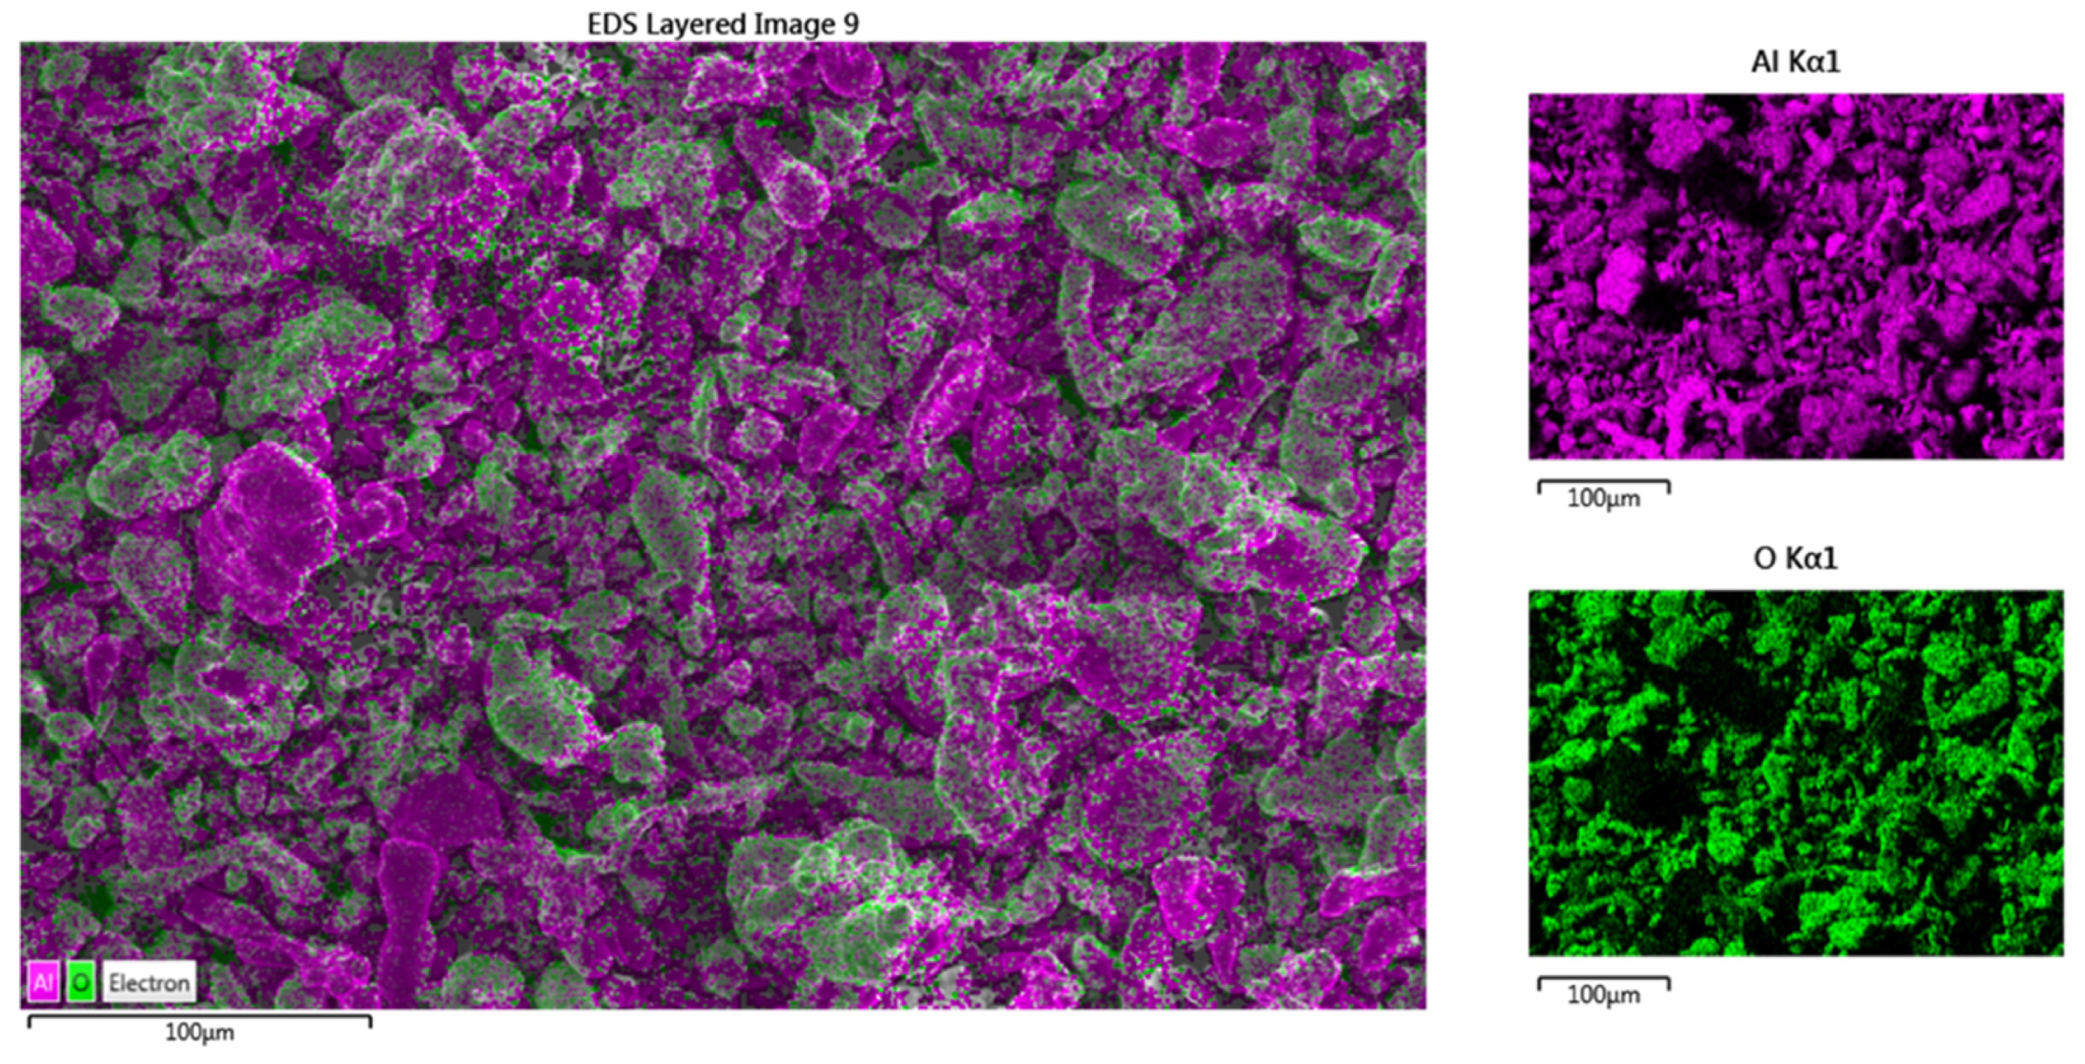
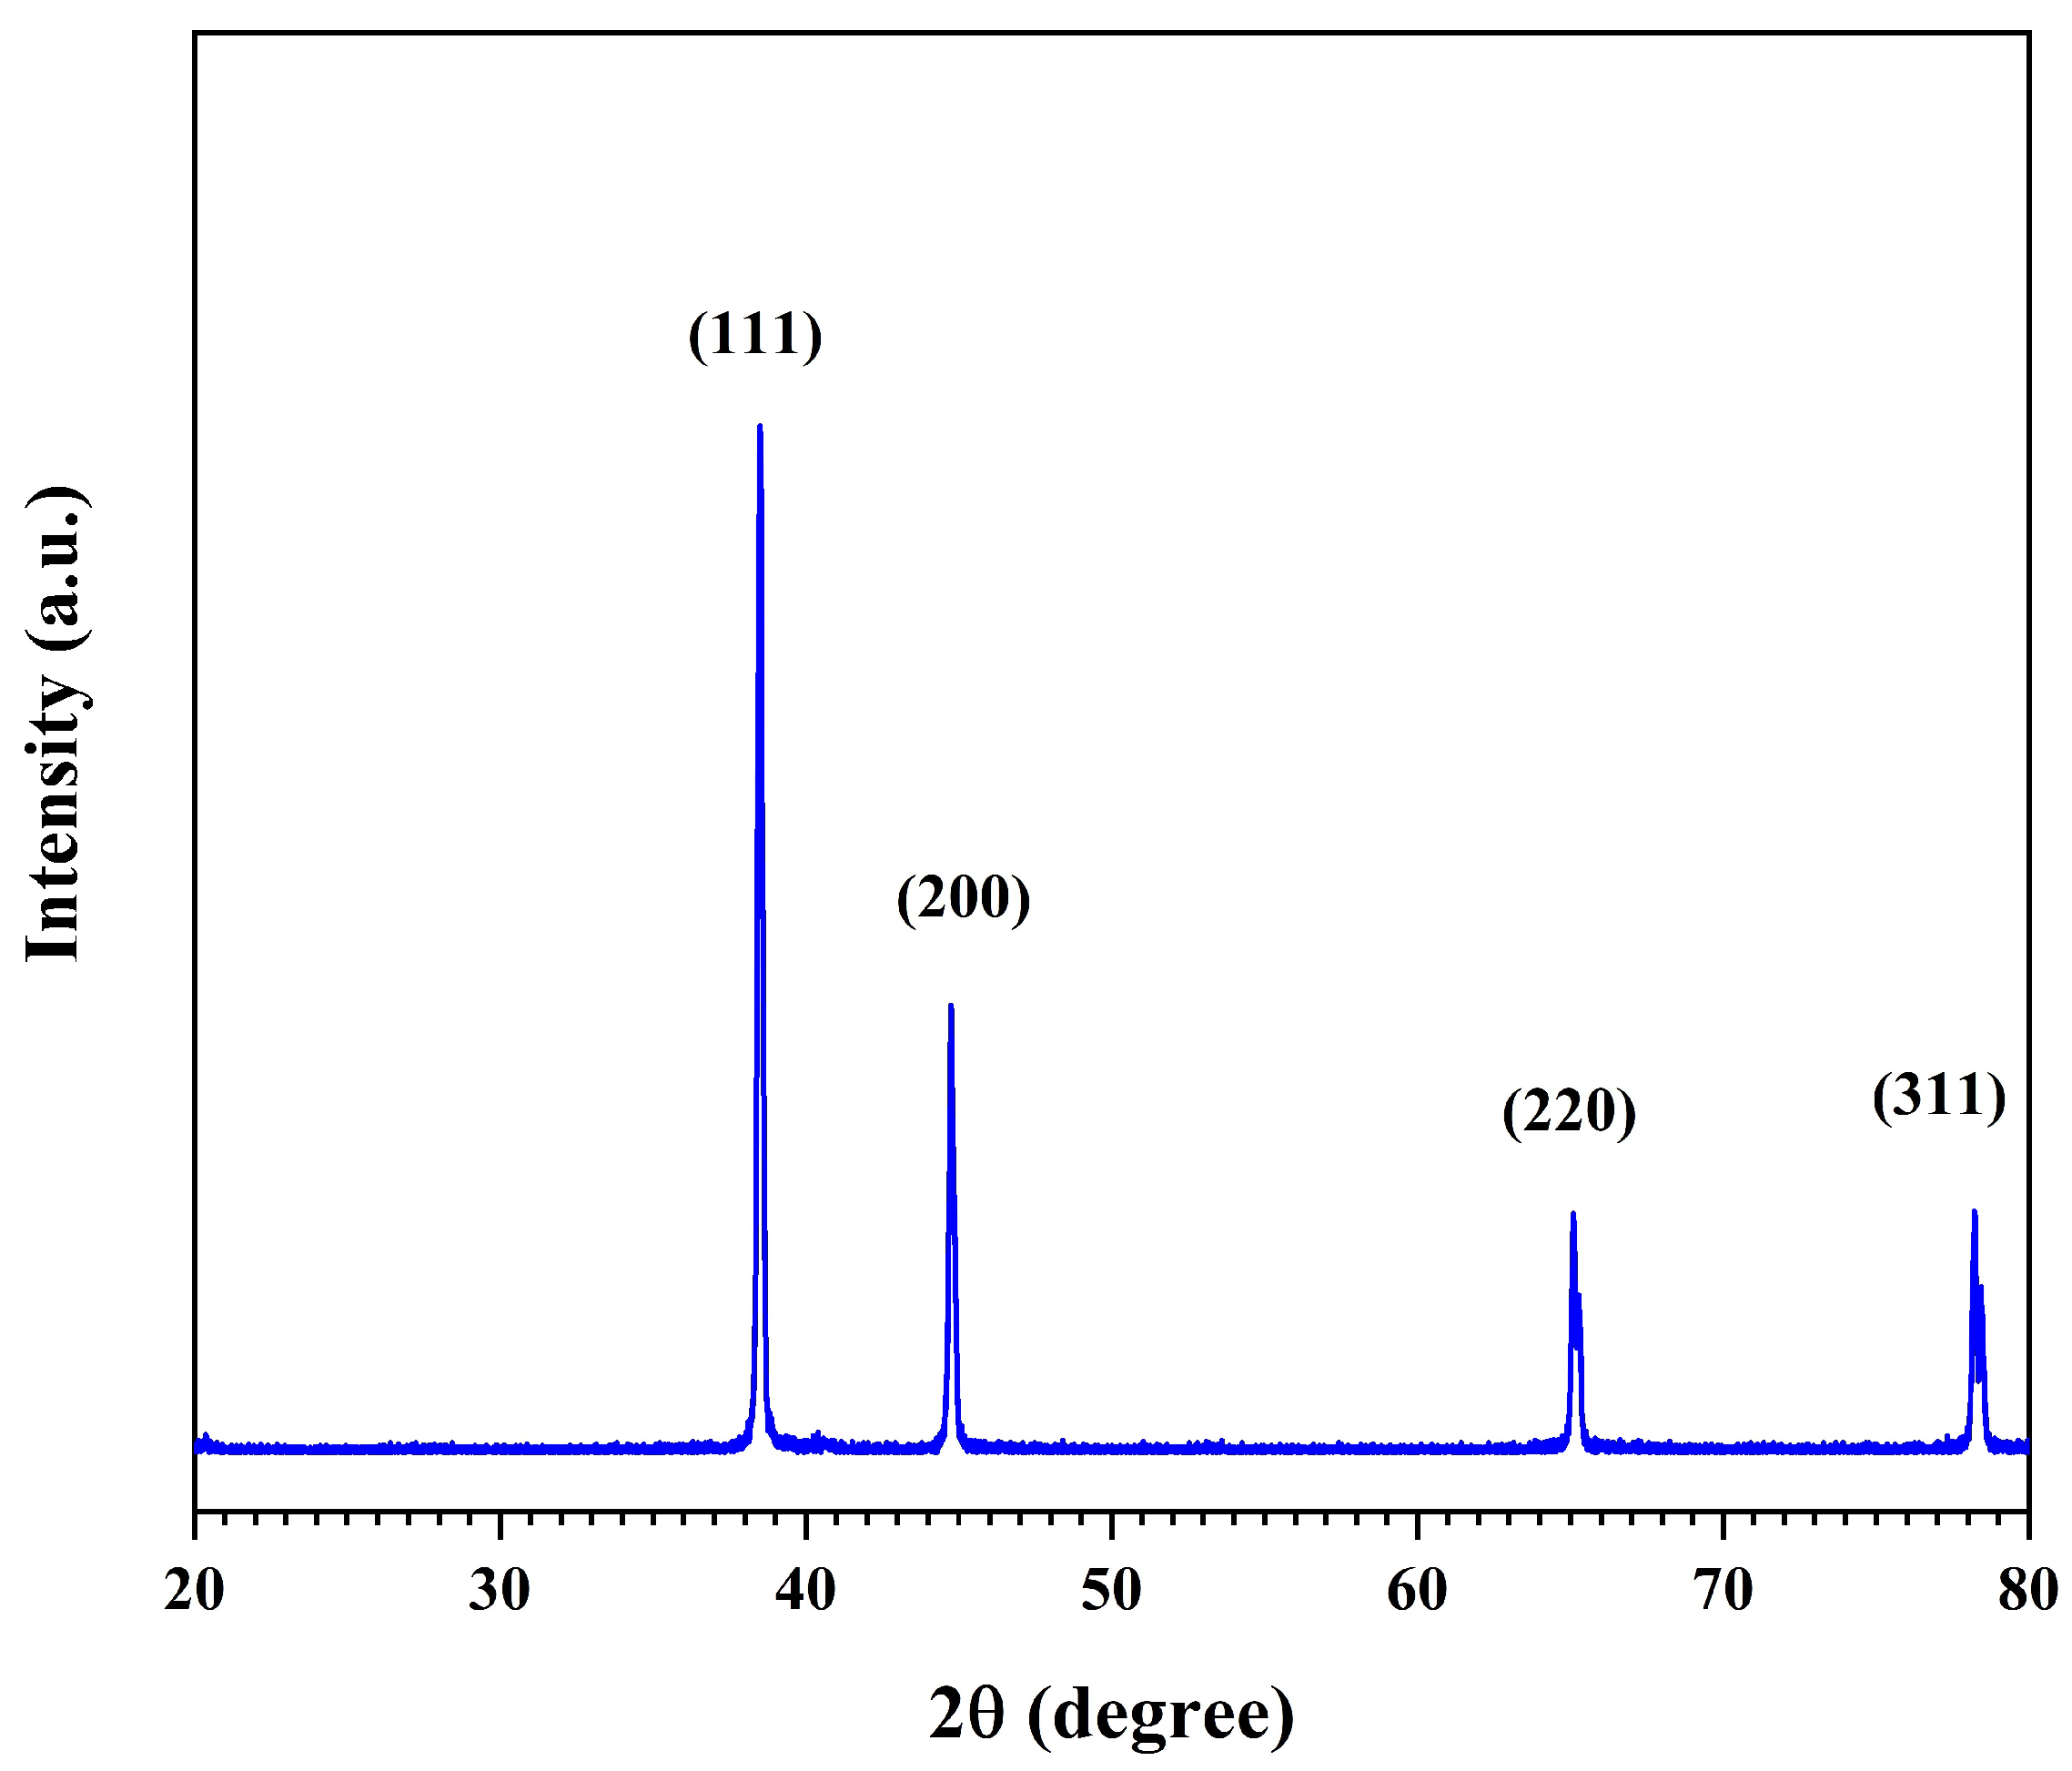
4.1. SEM, EDS and XRD Analysis of Al@AlO Composite Powder
4.2. Experimental Studies
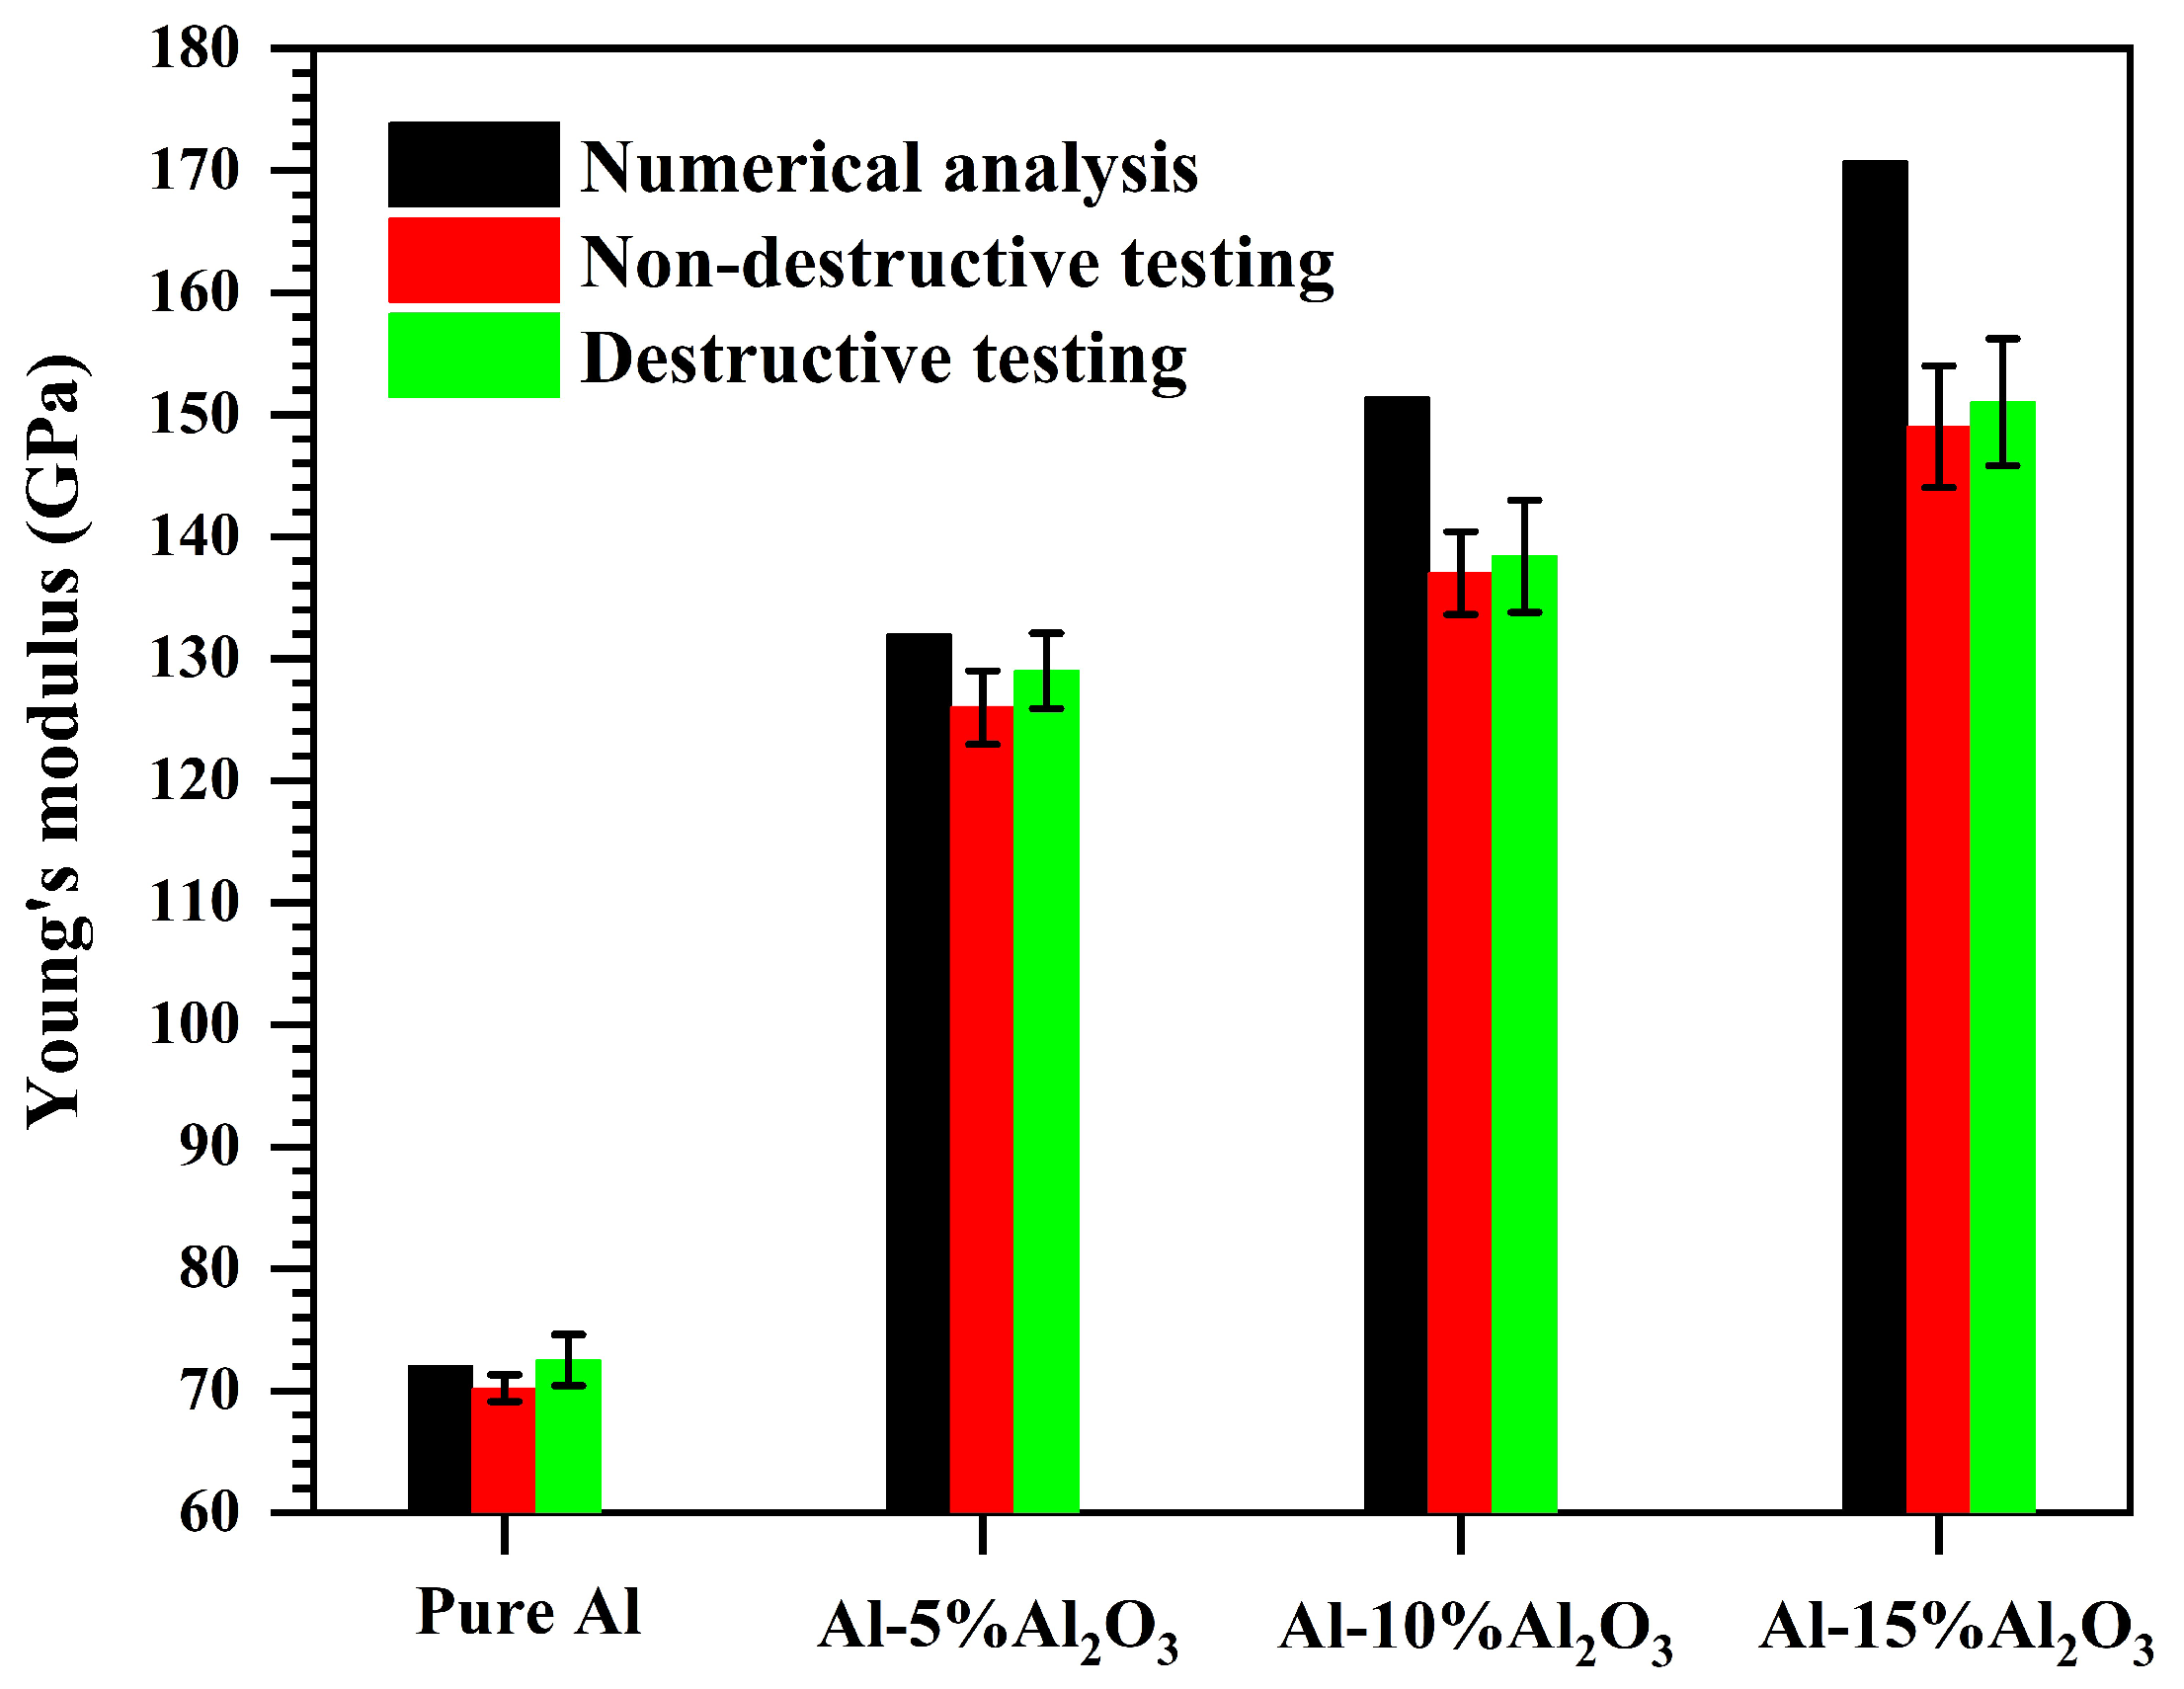
4.3. Comparison of Young’s Modulus for Validation
4.4. Numerical Studies
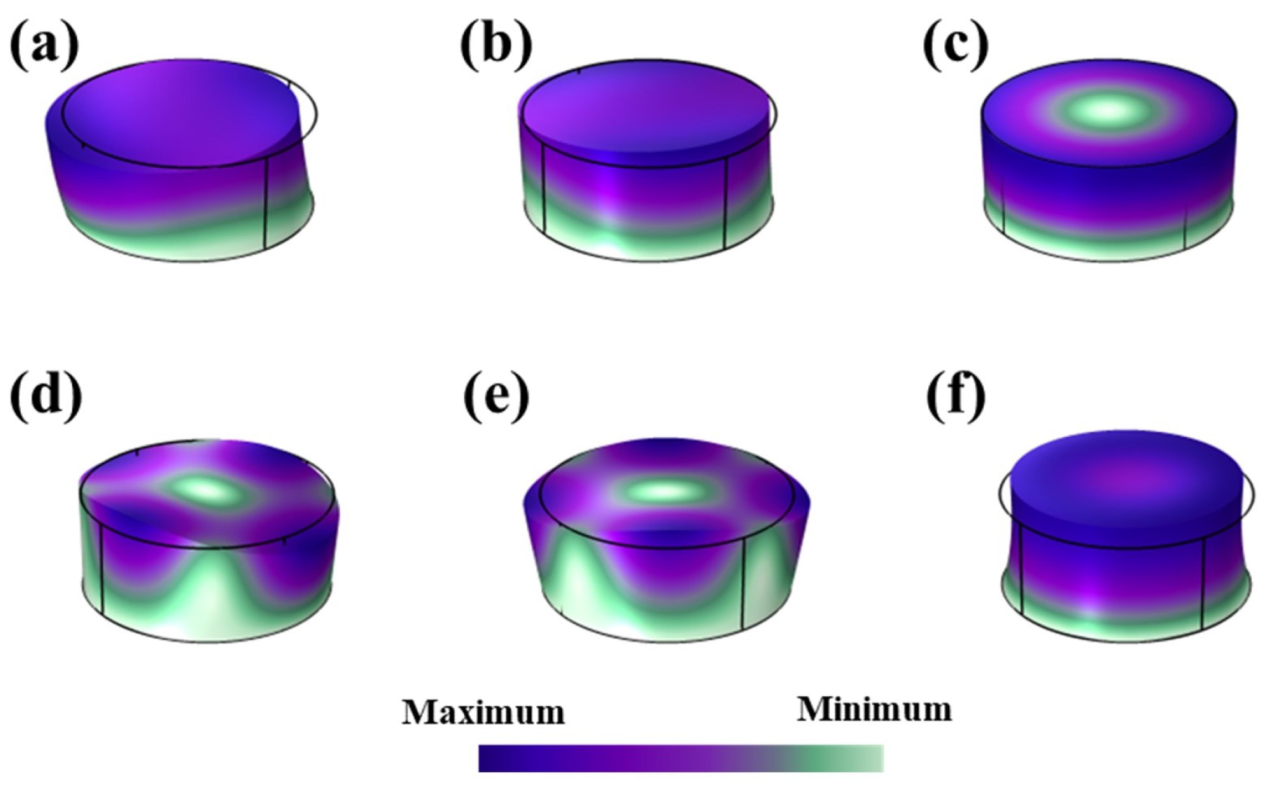
4.4.1. Modal Analysis
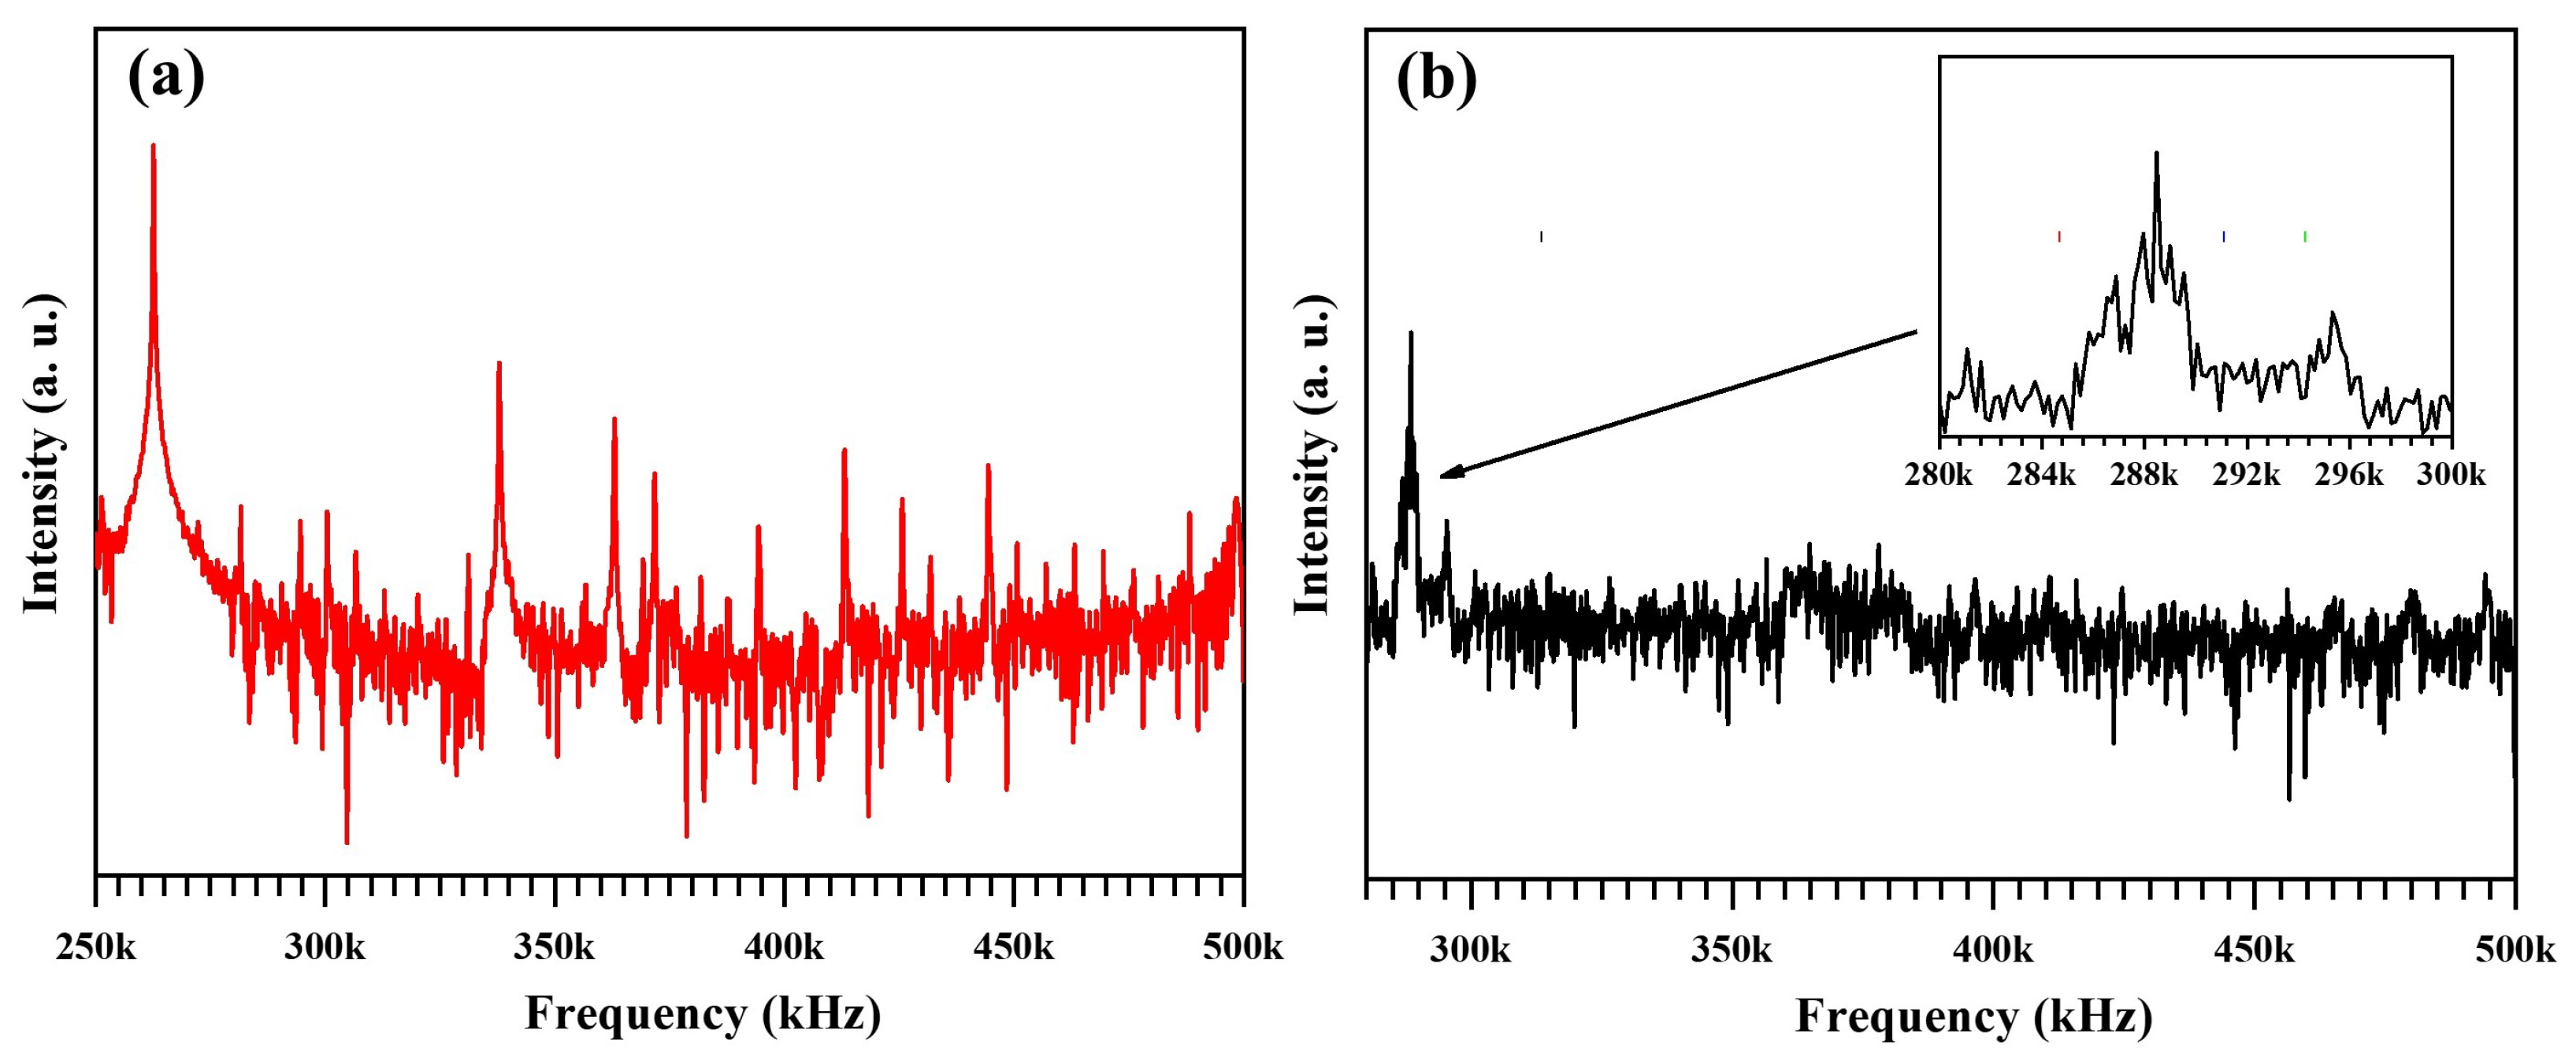
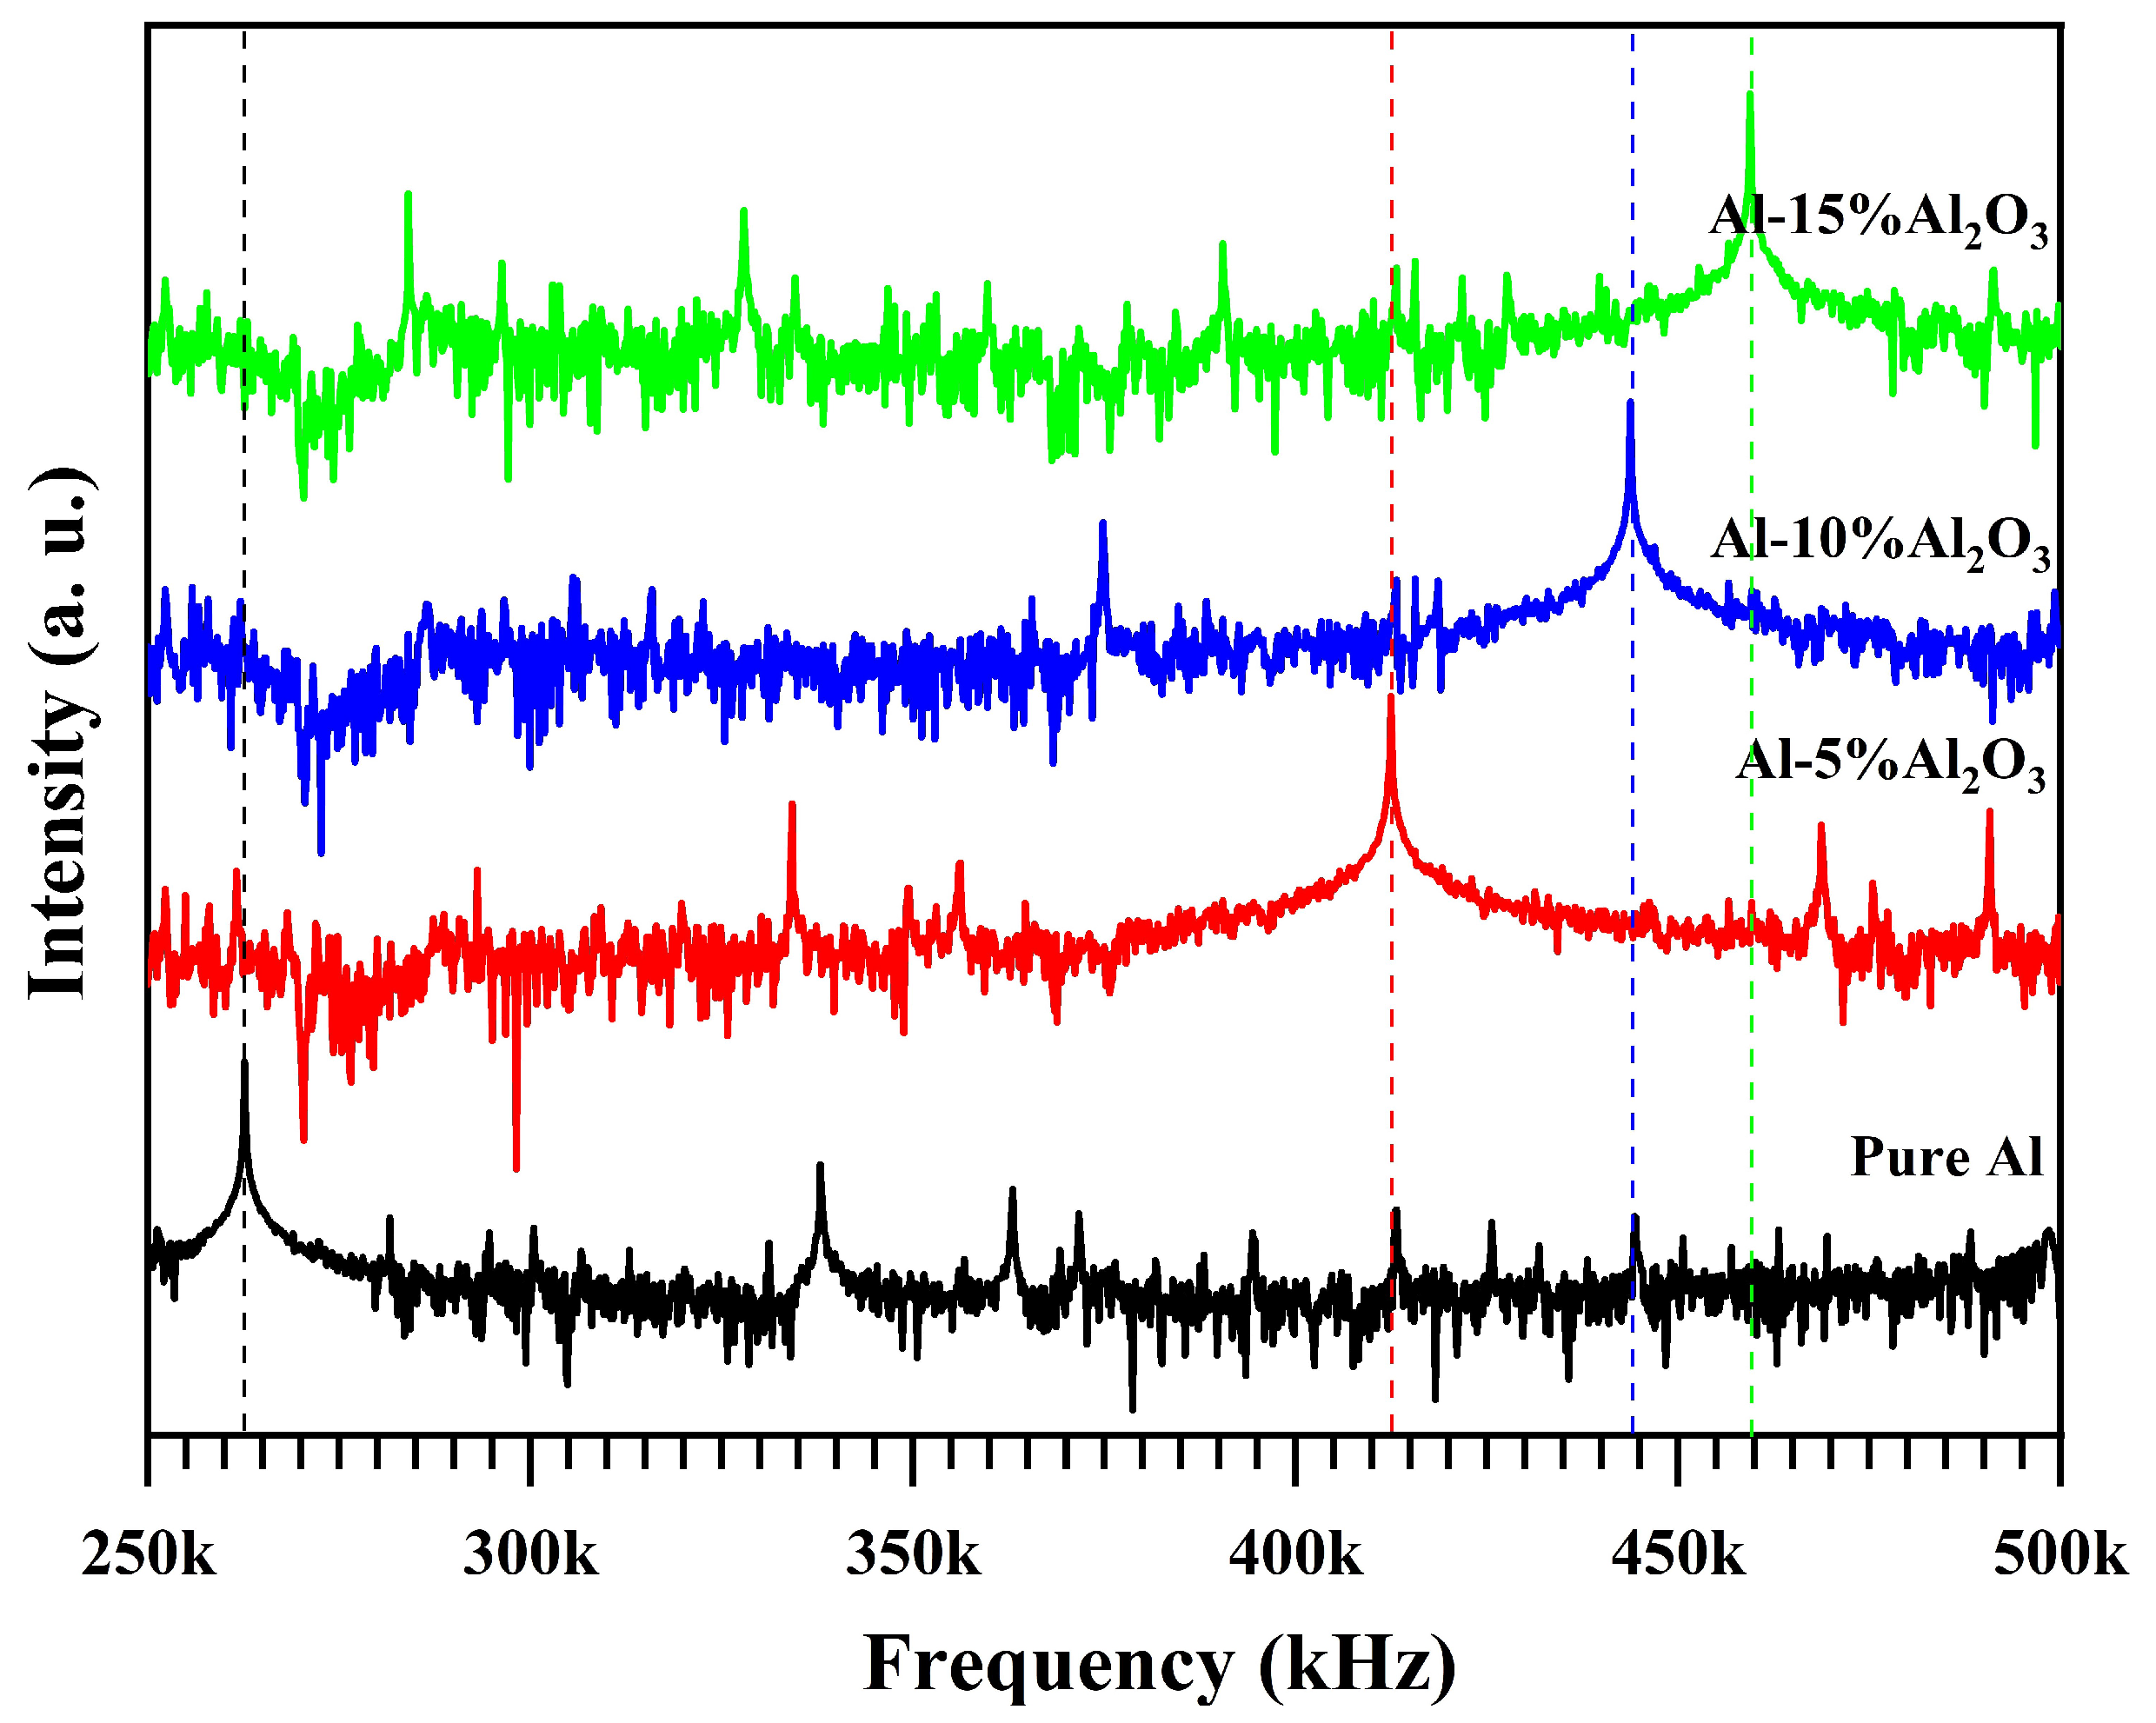
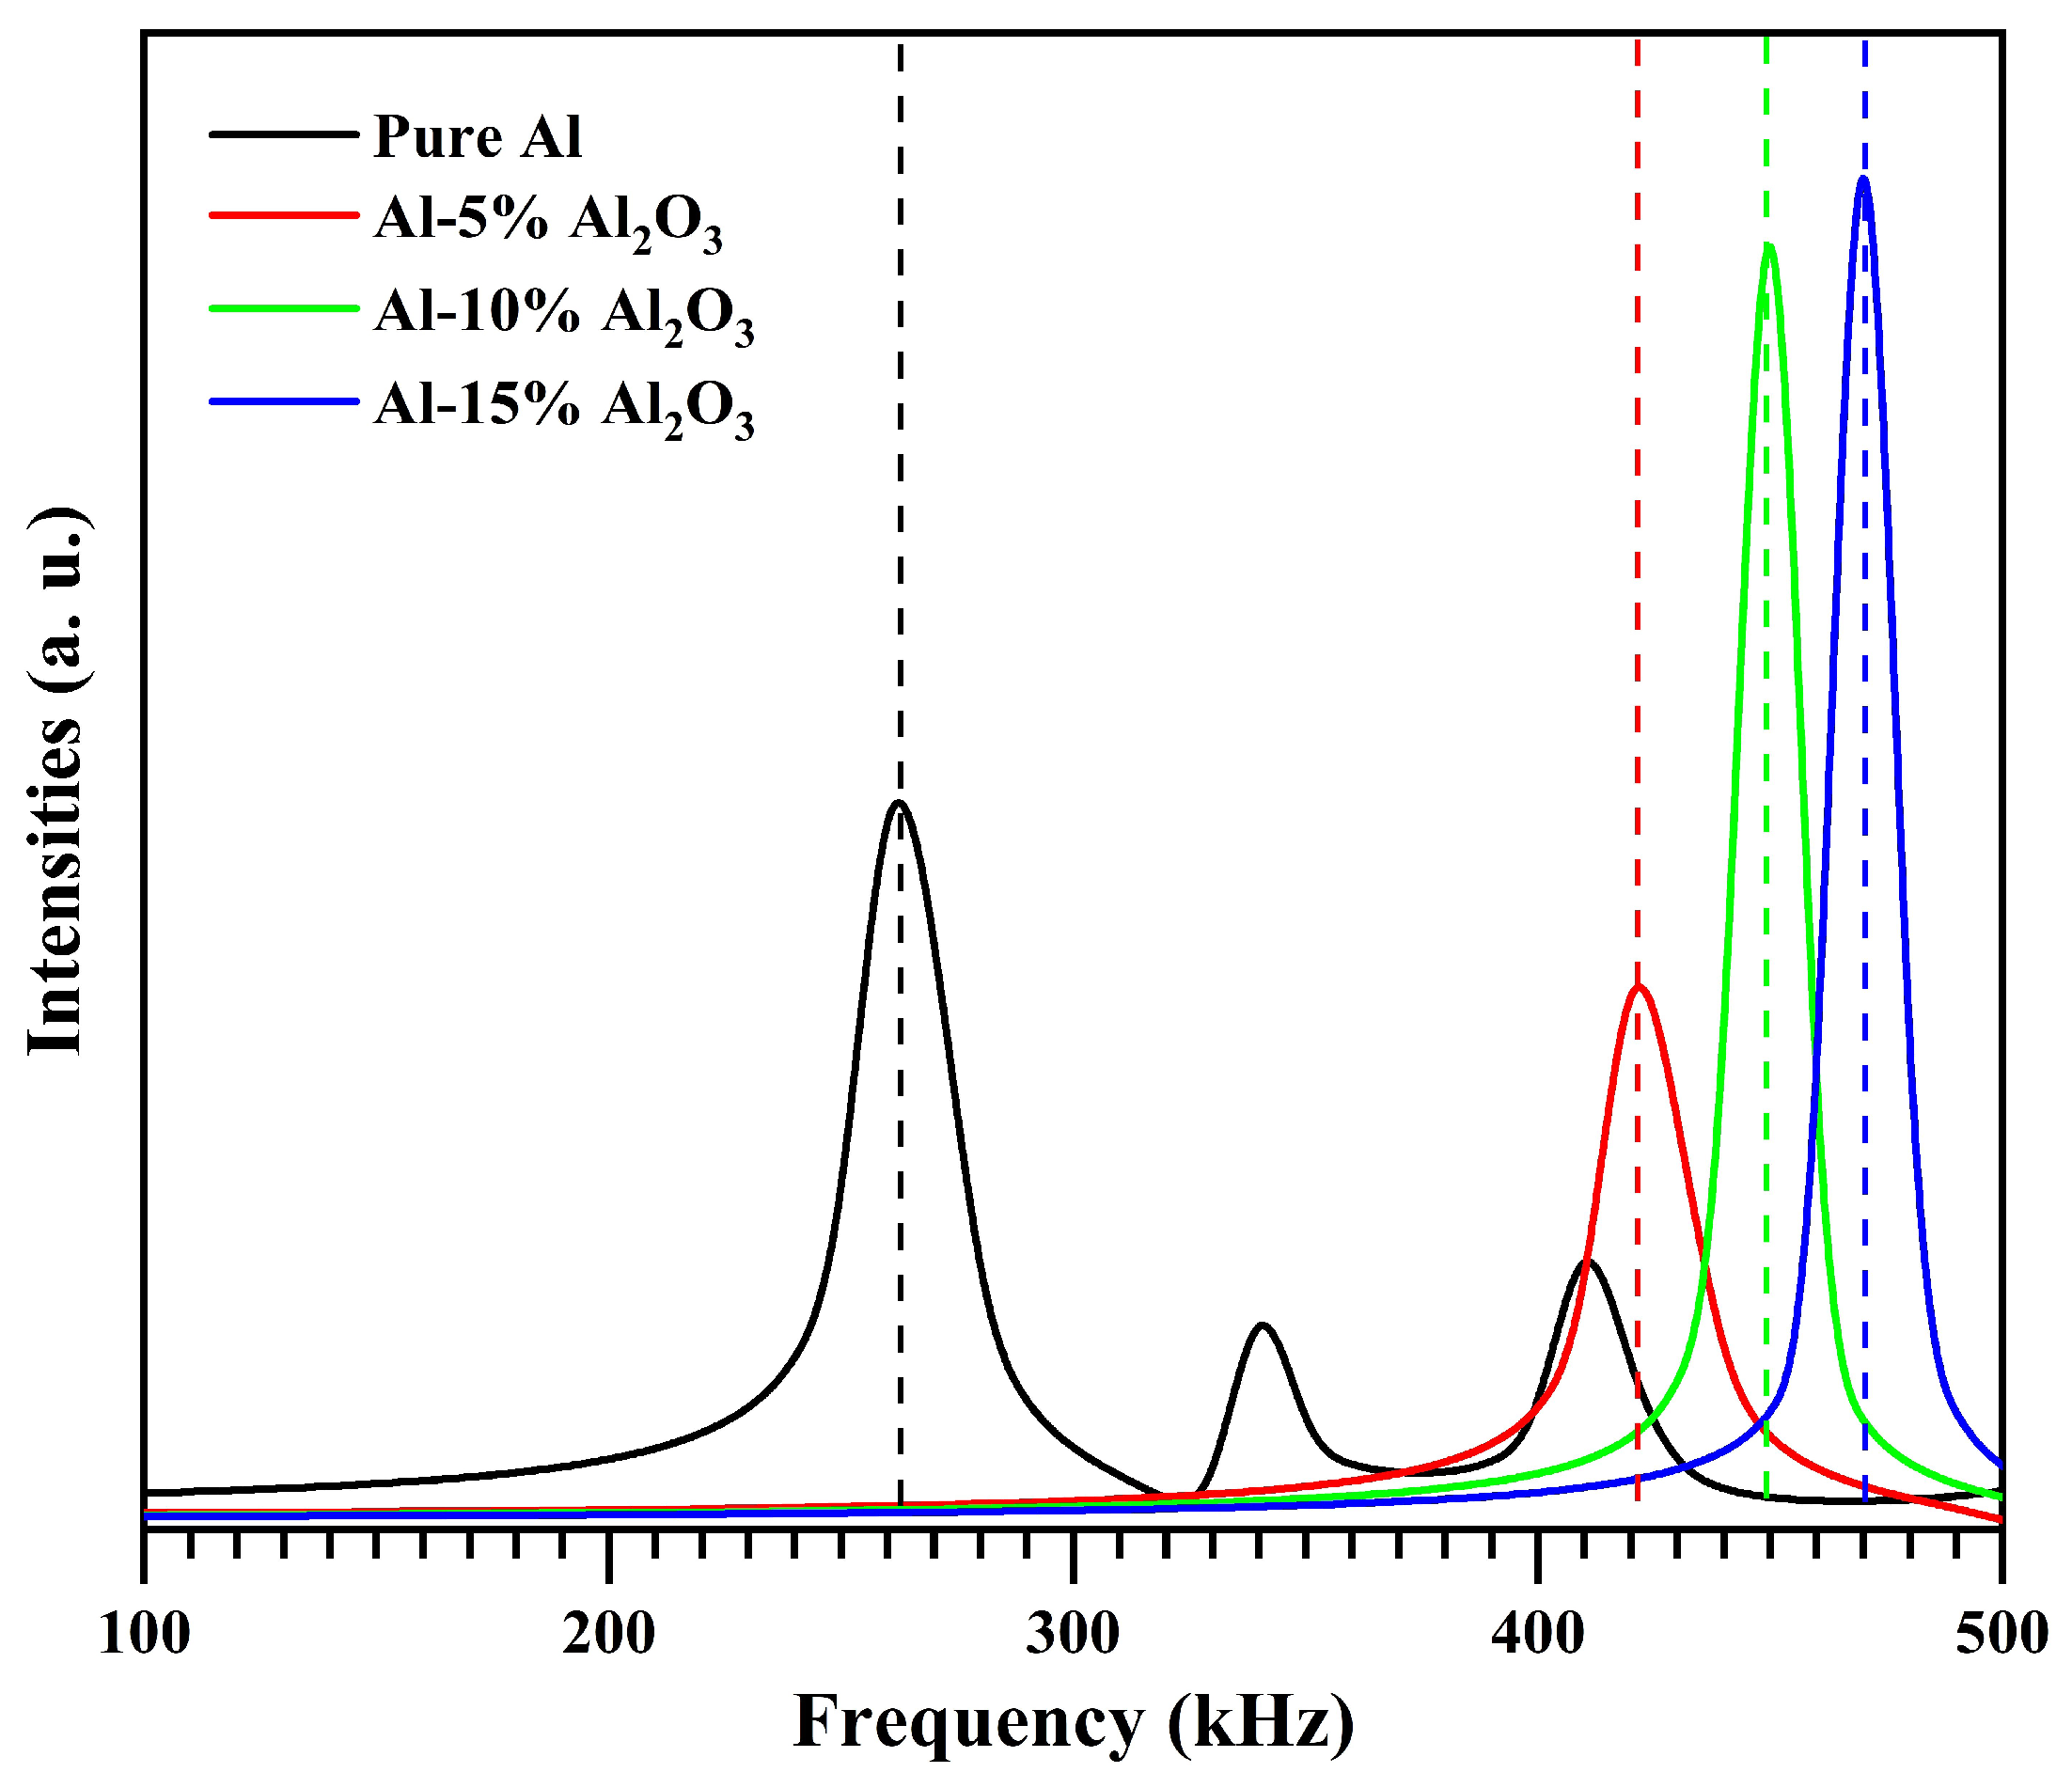
4.4.2. Frequency Response
5. Conclusions
Author Contributions
Funding
Institutional Review Board Statement
Informed Consent Statement
Data Availability Statement
Conflicts of Interest
References
- Kusoglu, I.M.; Gökce, B.; Barcikowski, S. Research trends in laser powder bed fusion of Al alloys within the last decade. Addit. Manuf. 2020, 36, 101489. [Google Scholar] [CrossRef]
- Read, N.; Wang, W.; Essa, K.; Attallah, M.M. Selective laser melting of AlSi10Mg alloy: Process optimisation and mechanical properties development. Mater. Des. 2015, 65, 417–424. [Google Scholar] [CrossRef] [Green Version]
- Wang, G. Superplastic Forming (SPF) of Complex Sheet Metal Parts and Structures. In Encyclopedia of Materials: Metals and Alloys; Elsevier: Amsterdam, The Netherlands, 2022; pp. 417–434. [Google Scholar] [CrossRef]
- Dyachkova, L.; Feldshtein, E.E. On the properties of composites based on sintered bronze with alumina additives. Compos. Part B Eng. 2013, 45, 239–247. [Google Scholar] [CrossRef]
- Masood, S.; Song, W. Development of new metal/polymer materials for rapid tooling using Fused deposition modelling. Mater. Des. 2004, 25, 587–594. [Google Scholar] [CrossRef]
- Walker, J.; Rainforth, W.; Jones, H. Lubricated sliding wear behaviour of aluminium alloy composites. Wear 2005, 259, 577–589. [Google Scholar] [CrossRef] [Green Version]
- Nai, S.; Wei, J.; Gupta, M. Improving the performance of lead-free solder reinforced with multi-walled carbon nanotubes. Mater. Sci. Eng. A 2006, 423, 166–169. [Google Scholar] [CrossRef]
- Balakrishnan, M.; Dinaharan, I.; Kalaiselvan, K.; Palanivel, R. Friction stir processing of Al3Ni intermetallic particulate reinforced cast aluminum matrix composites: Microstructure and tensile properties. J. Mater. Res. Technol. 2020, 9, 4356–4367. [Google Scholar] [CrossRef]
- Nieh, T.; Karlak, R. Aging characteristics of B4C-reinforced 6061-aluminum. Scr. Metall. 1984, 18, 25–28. [Google Scholar] [CrossRef]
- Nukami, T.; Flemings, M.C. In situ synthesis of TiC particulate-reinforced aluminum matrix composites. Metall. Mater. Trans. A 1995, 26, 1877–1884. [Google Scholar] [CrossRef]
- Zhang, J.; Alpas, A. Wear regimes and transitions in Al2O3 particulate-reinforced aluminum alloys. Mater. Sci. Eng. A 1993, 161, 273–284. [Google Scholar] [CrossRef]
- Pattnayak, A.; Madhu, N.; Panda, A.S.; Sahoo, M.K.; Mohanta, K. A Comparative study on mechanical properties of Al-SiO2 composites fabricated using rice husk silica in crystalline and amorphous form as reinforcement. Mater. Today Proc. 2018, 5, 8184–8192. [Google Scholar] [CrossRef]
- Kvashnin, D.G.; Firestein, K.L.; Popov, Z.I.; Corthay, S.; Sorokin, P.B.; Golberg, D.V.; Shtansky, D.V. Al BN interaction in a high-strength lightweight Al/BN metal matrix composite: Theoretical modelling and experimental verification. J. Alloy. Compd. 2019, 782, 875–880. [Google Scholar] [CrossRef]
- PK, J.; MC, G.; Sharma, S.; Shetty, R.; Hiremath, P.; Shettar, M. The effect of SiC content in aluminum-based metal matrix composites on the microstructure and mechanical properties of welded joints. J. Mater. Res. Technol. 2021, 12, 2325–2339. [Google Scholar] [CrossRef]
- Rosenberger, M.; Schvezov, C.; Forlerer, E. Wear of different aluminum matrix composites under conditions that generate a mechanically mixed layer. Wear 2005, 259, 590–601. [Google Scholar] [CrossRef]
- Prashar, G.; Vasudev, H. Surface topology analysis of plasma sprayed Inconel625-Al2O3 composite coating. Mater. Today Proc. 2021. [Google Scholar] [CrossRef]
- Pingale, A.D.; Belgamwar, S.U.; Rathore, J.S. A novel approach for facile synthesis of Cu-Ni/GNPs composites with excellent mechanical and tribological properties. Mater. Sci. Eng. B 2020, 260, 114643. [Google Scholar] [CrossRef]
- Xu, Z.; Shi, X.; Zhai, W.; Yao, J.; Song, S.; Zhang, Q. Preparation and tribological properties of TiAl matrix composites reinforced by multilayer grapheme. Carbon 2014, 67, 168–177. [Google Scholar] [CrossRef]
- Tjong, S.C. Recent progress in the development and properties of novel metal matrix nanocomposites reinforced with carbon nanotubes and graphene nanosheets. Mater. Sci. Eng. B Rep. 2013, 74, 281–350. [Google Scholar] [CrossRef]
- Qu, Z.; Jiang, P.; Zhang, W. Development and Application of Infrared Thermography Non-Destructive Testing Techniques. Sensors 2020, 20, 3851. [Google Scholar] [CrossRef]
- Gautam, D.; Rao, V.K.P. Nondestructive Evaluation of Mechanical Properties of Femur Bone. J. Nondestruct. Eval. 2021, 40, 22. [Google Scholar] [CrossRef]
- Díaz-Rodríguez, J.G.; Pertúz-Comas, A.D.; González-Estrada, O.A. Mechanical properties for long fibre reinforced fused deposition manufactured composites. Compos. Part B Eng. 2021, 211, 108657. [Google Scholar] [CrossRef]
- Melenka, G.W.; Cheung, B.K.; Schofield, J.S.; Dawson, M.R.; Carey, J.P. Evaluation and prediction of the tensile properties of continuous fiber-reinforced 3D printed structures. Compos. Struct. 2016, 153, 866–875. [Google Scholar] [CrossRef]
- Kim, J.; Jhang, K.Y. Evaluation of Ultrasonic Nonlinear Characteristics in Heat-Treated Aluminum Alloy (Al-Mg-Si-Cu). Adv. Mater. Sci. Eng. 2013, 2013, 1–6. [Google Scholar] [CrossRef] [Green Version]
- Kankolenski, K.P.; Hua, S.Z.; Yang, D.X.; Hicho, G.E.; Swartzendruber, L.J.; Zang, Z.; Chopra, H.D. Non-Destructive Evaluation of Mechanical Properties of Magnetic Materials. MRS Proc. 1999, 591, 157. [Google Scholar] [CrossRef]
- Leissa, A.W. Vibration of Plates; N70-18461, na; Scientific and Technical Information Division, National Aeronautics and Space Administration: Washington, DC, USA, 1969; p. 360. [Google Scholar]
- Bahri, A.; Guermazi, N.; Bargui, M.; Elleuch, K. Estimation of the elastic modulus of the alumina coated AA1050 aluminum: Modeling and experiments. Mater. Sci. Eng. A 2016, 670, 188–195. [Google Scholar] [CrossRef]
- Terada, K.; Kato, J.; Hirayama, N.; Inugai, T.; Yamamoto, K. A method of two-scale analysis with micro-macro decoupling scheme: Application to hyperelastic composite materials. Comput. Mech. 2013, 52, 1199–1219. [Google Scholar] [CrossRef]
- Gautam, D.; Rao, V.K.P. Modelling the Influence of Protein Expression Levels on the Mechanical Properties of Femur Bone. Trends Biomater Artif Organs 2019, 33, 98–105. [Google Scholar]
- Terada, K.; Saiki, I.; Matsui, K.; Yamakawa, Y. Two-scale kinematics and linearization for simultaneous two-scale analysis of periodic heterogeneous solids at finite strain. Comput. Methods Appl. Mech. Eng. 2003, 192, 3531–3563. [Google Scholar] [CrossRef]
- Greco, F.; Leonetti, L.; Lonetti, P.; Luciano, R.; Pranno, A. A multiscale analysis of instability-induced failure mechanisms in fiber-reinforced composite structures via alternative modeling approaches. Compos. Struct. 2020, 251, 112529. [Google Scholar] [CrossRef]
- Greco, F.; Leonetti, L.; Lonetti, P. A two-scale failure analysis of composite materials in presence of fiber/matrix crack initiation and propagation. Compos. Struct. 2013, 95, 582–597. [Google Scholar] [CrossRef]


| Parameters | Sample | ||
|---|---|---|---|
| Al-5%AlO | Al-10%AlO | Al-15%AlO | |
| Radius of AlO NP, R (nm) | 25 | 25 | 25 |
| Volume of AlO NP, Vn (nm) | 65,416.67 | 65,416.67 | 65,416.67 |
| Volume ratio, (Vn/[Vn+Vm]) | 0.05 | 0.1 | 0.15 |
| Volume of Al matrix, Vm (nm) | 621,458.3 | 588,750 | 55,6041.7 |
| Side length of unit cell, a (nm) | 85.33699 | 83.81279 | 82.23104 |
| Parameters | Sample | ||
|---|---|---|---|
| Al-5%AlO | Al-10%AlO | Al-15%AlO | |
| Young’s Modulus (GPa) | 131.97 | 151.68 | 170.76 |
| Poison Ratio | 0.3416 | 0.332 | 0.3288 |
| Density (g/cm) | 2.76 | 2.83 | 2.89 |
| Radius (mm) | 12.5 | 12.5 | 12.5 |
| Thickness (mm) | 10 | 10 | 10 |
Disclaimer/Publisher’s Note: The statements, opinions and data contained in all publications are solely those of the individual author(s) and contributor(s) and not of MDPI and/or the editor(s). MDPI and/or the editor(s) disclaim responsibility for any injury to people or property resulting from any ideas, methods, instructions or products referred to in the content. |
© 2023 by the authors. Licensee MDPI, Basel, Switzerland. This article is an open access article distributed under the terms and conditions of the Creative Commons Attribution (CC BY) license (https://creativecommons.org/licenses/by/4.0/).
Share and Cite
Pingale, A.D.; Gautam, D.; Owhal, A.; Deshwal, D.; Belgamwar, S.U.; Rao, V.K.P. Development of Non-Destructive Dynamic Characterization Technique for MMCs: Predictions of Mechanical Properties for Al@Al2O3 Composites. NDT 2023, 1, 22-34. https://doi.org/10.3390/ndt1010003
Pingale AD, Gautam D, Owhal A, Deshwal D, Belgamwar SU, Rao VKP. Development of Non-Destructive Dynamic Characterization Technique for MMCs: Predictions of Mechanical Properties for Al@Al2O3 Composites. NDT. 2023; 1(1):22-34. https://doi.org/10.3390/ndt1010003
Chicago/Turabian StylePingale, Ajay D., Diplesh Gautam, Ayush Owhal, Dhruv Deshwal, Sachin U. Belgamwar, and Venkatesh K. P. Rao. 2023. "Development of Non-Destructive Dynamic Characterization Technique for MMCs: Predictions of Mechanical Properties for Al@Al2O3 Composites" NDT 1, no. 1: 22-34. https://doi.org/10.3390/ndt1010003