
Imaging Follow-Up of MSU Crystal Depletion
1
UFR de Médecine, Université Paris Diderot, Sorbonne Paris Cité, 75025 Paris, France
2
Service de Rhumatologie, Hôpital Bichat, AP-HP, 75018 Paris, France
Gout Urate Cryst. Depos. Dis. 2024, 2(1), 34-44; https://doi.org/10.3390/gucdd2010003
Submission received: 13 September 2023
/
Revised: 10 January 2024
/
Accepted: 17 January 2024
/
Published: 24 January 2024
Abstract
:Imaging modalities such as ultrasonography (US) and dual-energy computed tomography (DECT) have been recognized for their abilities to detect monosodium urate (MSU) crystals. The main described features of gout detected by DECT (tophus) or US (tophus, double contour [DC] sign and aggregates) are very specific for the diagnosis of gout, but the impact of imaging on the follow-up of MSU deposits is not well known. US and DECT allow for visualization of the disappearance of MSU crystals under adequate urate-lowering therapy (ULT). An OMERACT US score and a DECT urate score have been described. The dissolution of the DC sign is detectable on US after 3 months, whereas a decreased size or volume in tophus can be observed on US or DECT after 6 months of ULT. Serum urate level decrease is associated with a reduction in MSU crystal deposition. Finally, the risk of gout flare is associated with the baseline MSU burden and with the degree of dissolution of crystal deposition. All these data confirm that imaging could be useful in managing gout, even if its exact place in routine practice remains unclear.
1. Introduction
Gout is a joint disease characterized by the deposition of monosodium urate (MSU) crystals in joints, tendons and/or soft tissues secondary to chronic hyperuricemia [1]. Experts from the gout, hyperuricemia and crystal-associated disease network previously defined gout as MSU crystal deposition associated with at least the following clinical manifestations: flares, persistent arthritis or tophi [2]. During the first disease stages, gout is characterized by recurrent self-limited flares. In the absence of or insufficiency of treatment, chronic arthritis with structural damages and tophi can appear, leading to disabilities and an impaired quality of life [3,4]. An increase in hospitalizations for gout has been observed in some countries [5,6]. Moreover, gout patients are at increased risk of cardiovascular disease and mortality [7], which is associated with the burden of MSU crystal deposition [8]. All these complications of gout can be reduced with appropriate treatment. The management of gout includes treating flares with colchicine, non-steroidal anti-inflammatory drugs or corticosteroids; preventing flares with colchicine; and dissolving MSU crystals with adequate urate-lowering therapy (ULT). The urate target depends on the guidelines of each country but is usually <0.30 mmol/L [9] or 0.36 mmol/L [10,11].
Although gout is a curable disorder, the disease is not well managed worldwide because of several factors: poor adherence to ULT, low or inefficient prescription of ULT by physicians [12], as well as an occasionally difficult diagnosis. Indeed, the gold standard for gout diagnosis is the identification of MSU crystals on synovial fluid analysis or in tophus aspiration in the absence of joint fluid. In the absence of joint effusion or tophus, the diagnosis of gout can be challenging. In such cases, imaging to detect MSU crystal deposition is recommended [13]. Because plain radiographs have limited value for gout diagnosis, the main imaging modalities are ultrasonography (US) and dual-energy CT (DECT).
In this review, we analyze the relevance of using imaging for managing gout, particularly the follow-up of ULT.
2. The Imaging Features of Gout
2.1. Ultrasonography
Several US features of gout have been described [14]. Non-specific signs including synovitis, joint effusion, synovial hypertrophy and erosions can be observed but have a low utility for diagnosis. Three specific features of gout need to be searched for to establish the gout diagnosis: the double contour (DC) sign, tophus and aggregates. The prevalence of these features varies depending on the stage of disease and the joint location. These US features have a high specificity (>90%) [15,16,17,18,19]. Despite this high specificity for gout, the same US detection of the DC sign can sometimes occur in calcium pyrophosphate disease (CPPD), for a pseudo-DC sign [20]. A recent study provided an anatomic explanation for this pseudo-DC sign [21]. On the dissection of elbows of CPPD patients, calcifications were present within the annular ligament but not the surface of the hyaline cartilage of the radial head. On US dynamic scanning, the pseudo-DC sign appears mobile and dissociated with the cartilage, whereas in gouty patients, the DC sign follows the movement of the cartilage. The importance of the dynamic evaluation of the DC sign was confirmed in another study. The addition of dynamic scanning assessment to static assessment increased the specificity of the DC sign for the diagnosis of gout, without a loss of sensitivity [22].
The outcome measures in rheumatology (OMERACT) US group validated a consensus-based definition of these US features of gout [23]. The interobserver reliability was good for tophus and DC but only fair to moderate for aggregates [24]. The OMERACT group recently proposed a new definition of aggregates, which resulted in increased interobserver reliability [25]. The definitions of the features are as follows:
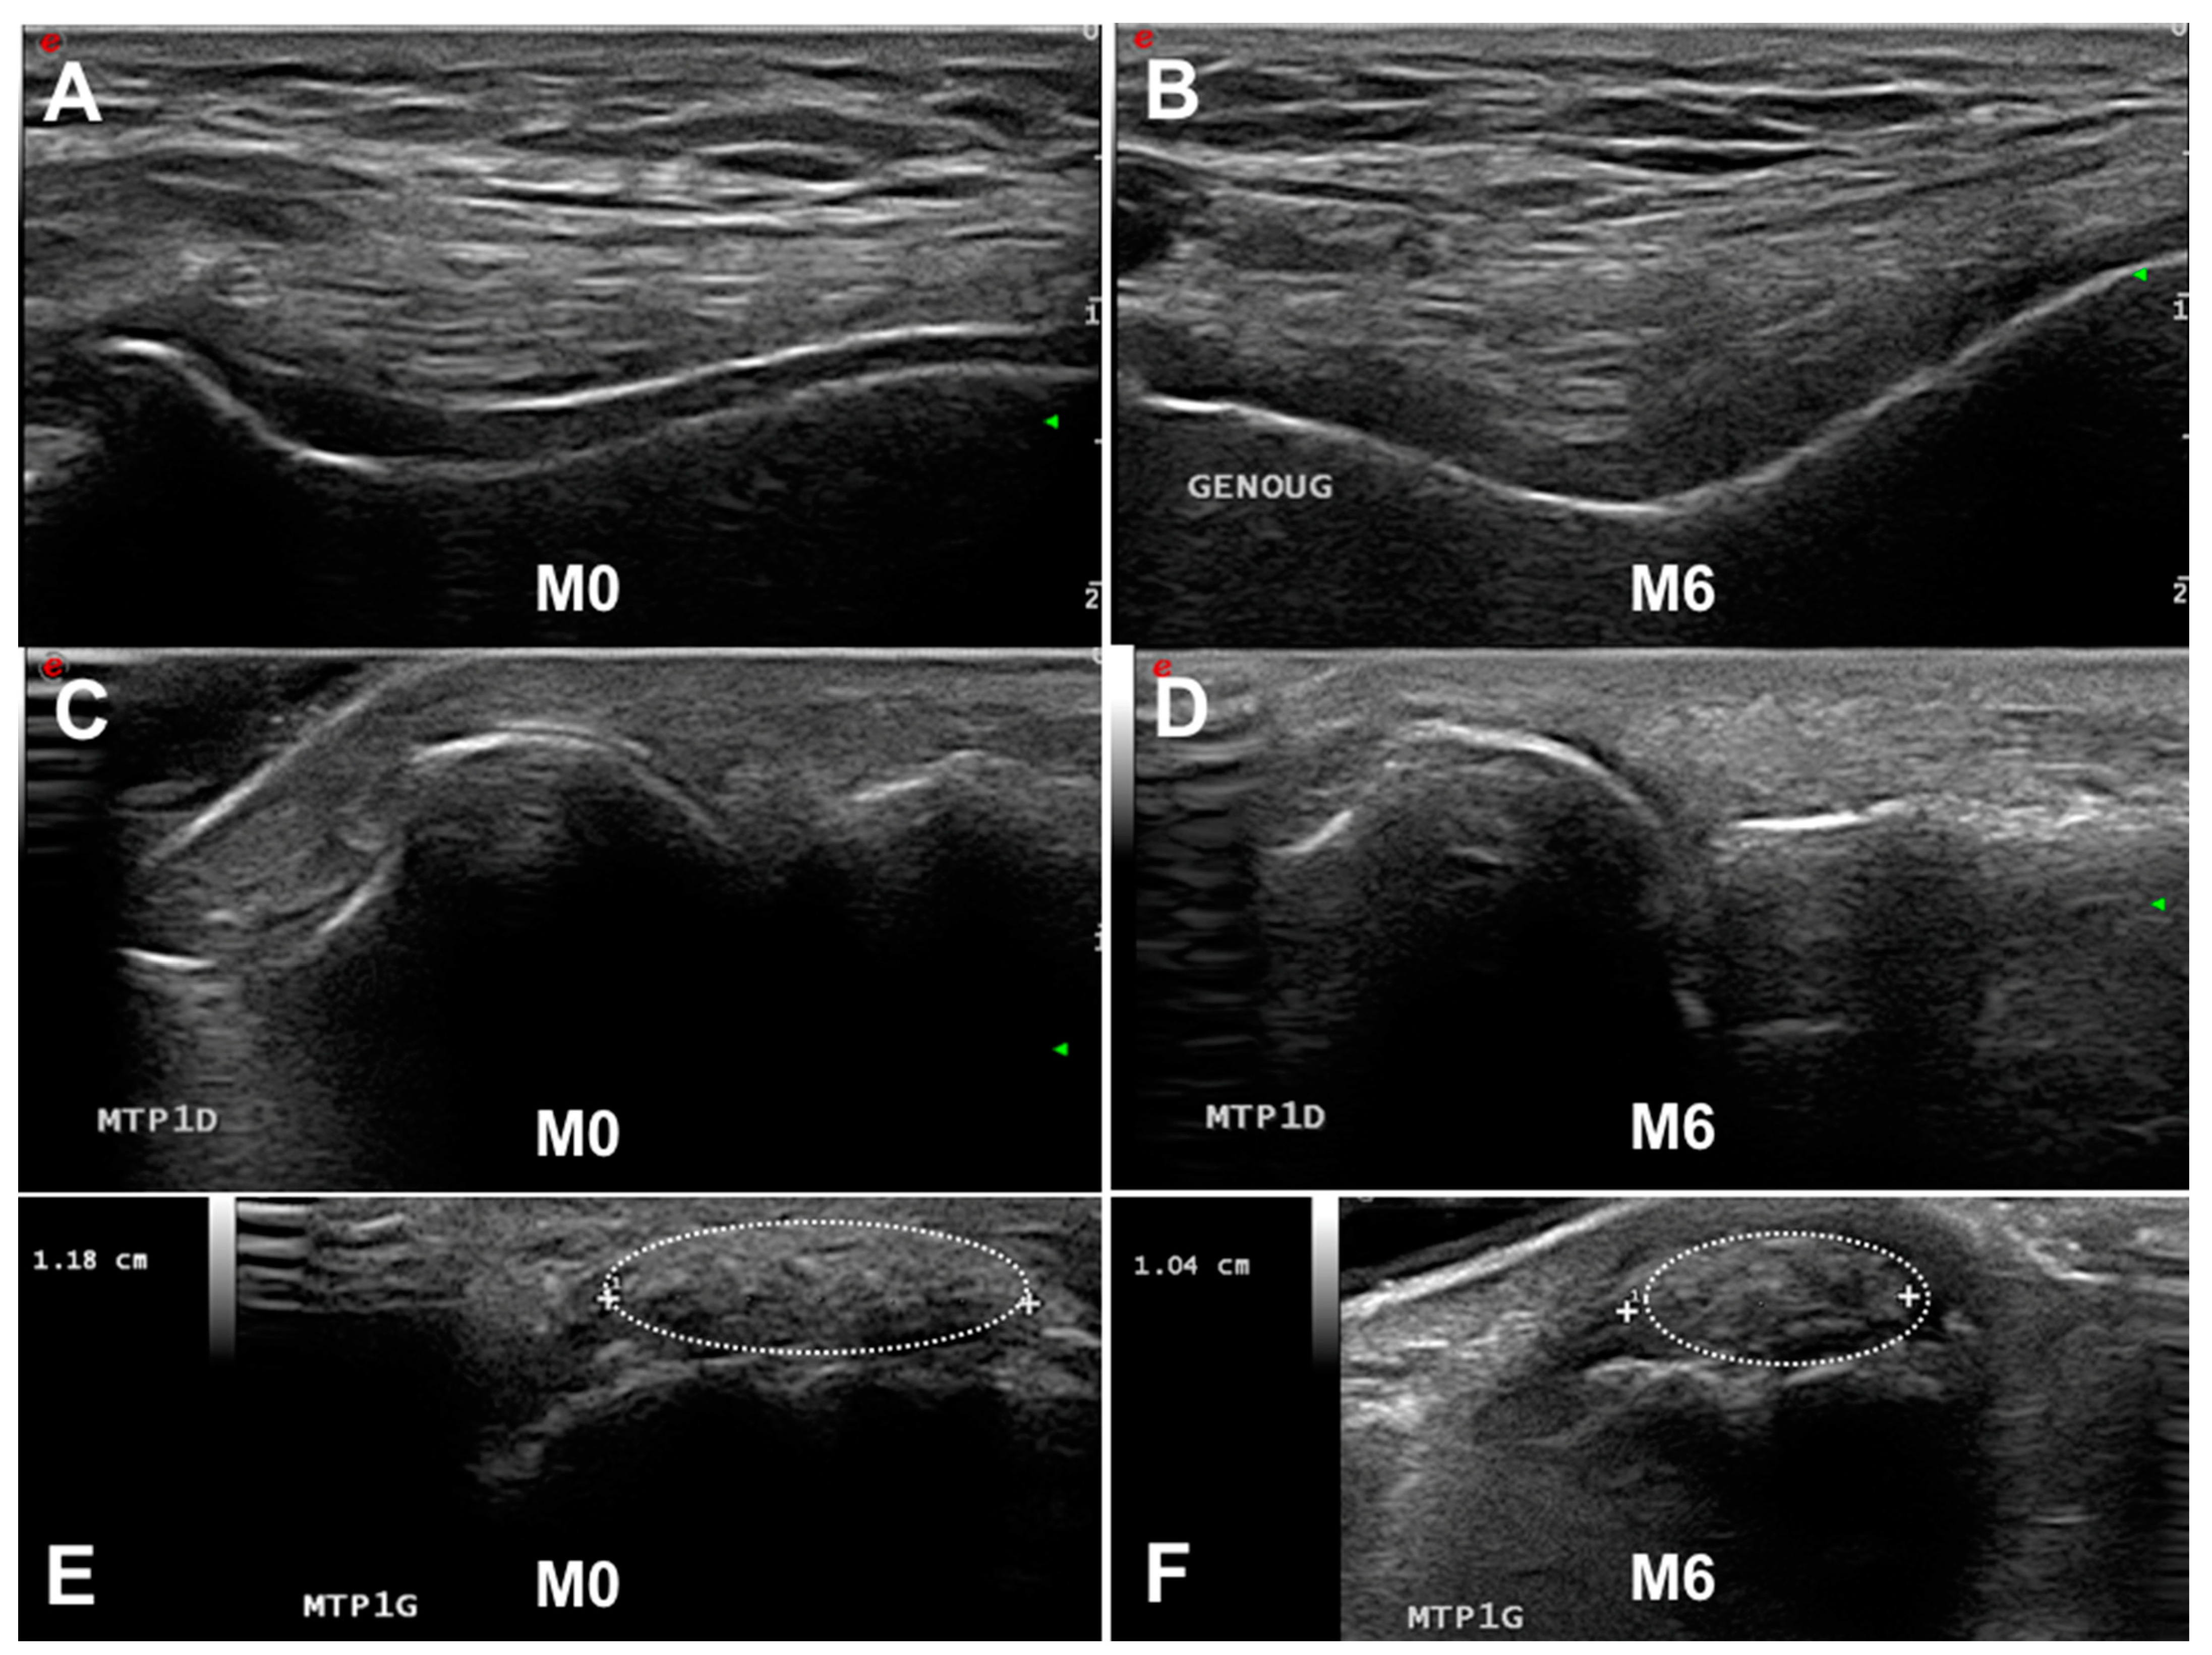
- Double contour sign: “abnormal hyperechoic band over the superficial margin of the anechoic cartilage, independent of the angle of insonation and which may be irregular, continuous, or intermittent and can distinguished from the cartilage interface sign” (Figure 1A,C). The DC sign must be searched preferentially at the first metatarsophalangeal joints (MTP1s), the trochleal cartilage of knees (suprapatellar plane in maximal flexion) and the talar cartilage.
- Tophus: “a circumscribed, inhomogenous, hyperechoic and/or hypoechoic aggregation (which may or may not generate a posterior acoustic shadow)” (Figure 1E,F). The main locations for detecting US tophus are the MTP1s and quadricipital and patellar tendons.
- Aggregates: “bright hyperechoic, isolated spots too small to fulfil the tophus definition and characterized by maintaining their high degree of reflectivity when the insonation angle is changed”.
2.2. Dual-Energy CT
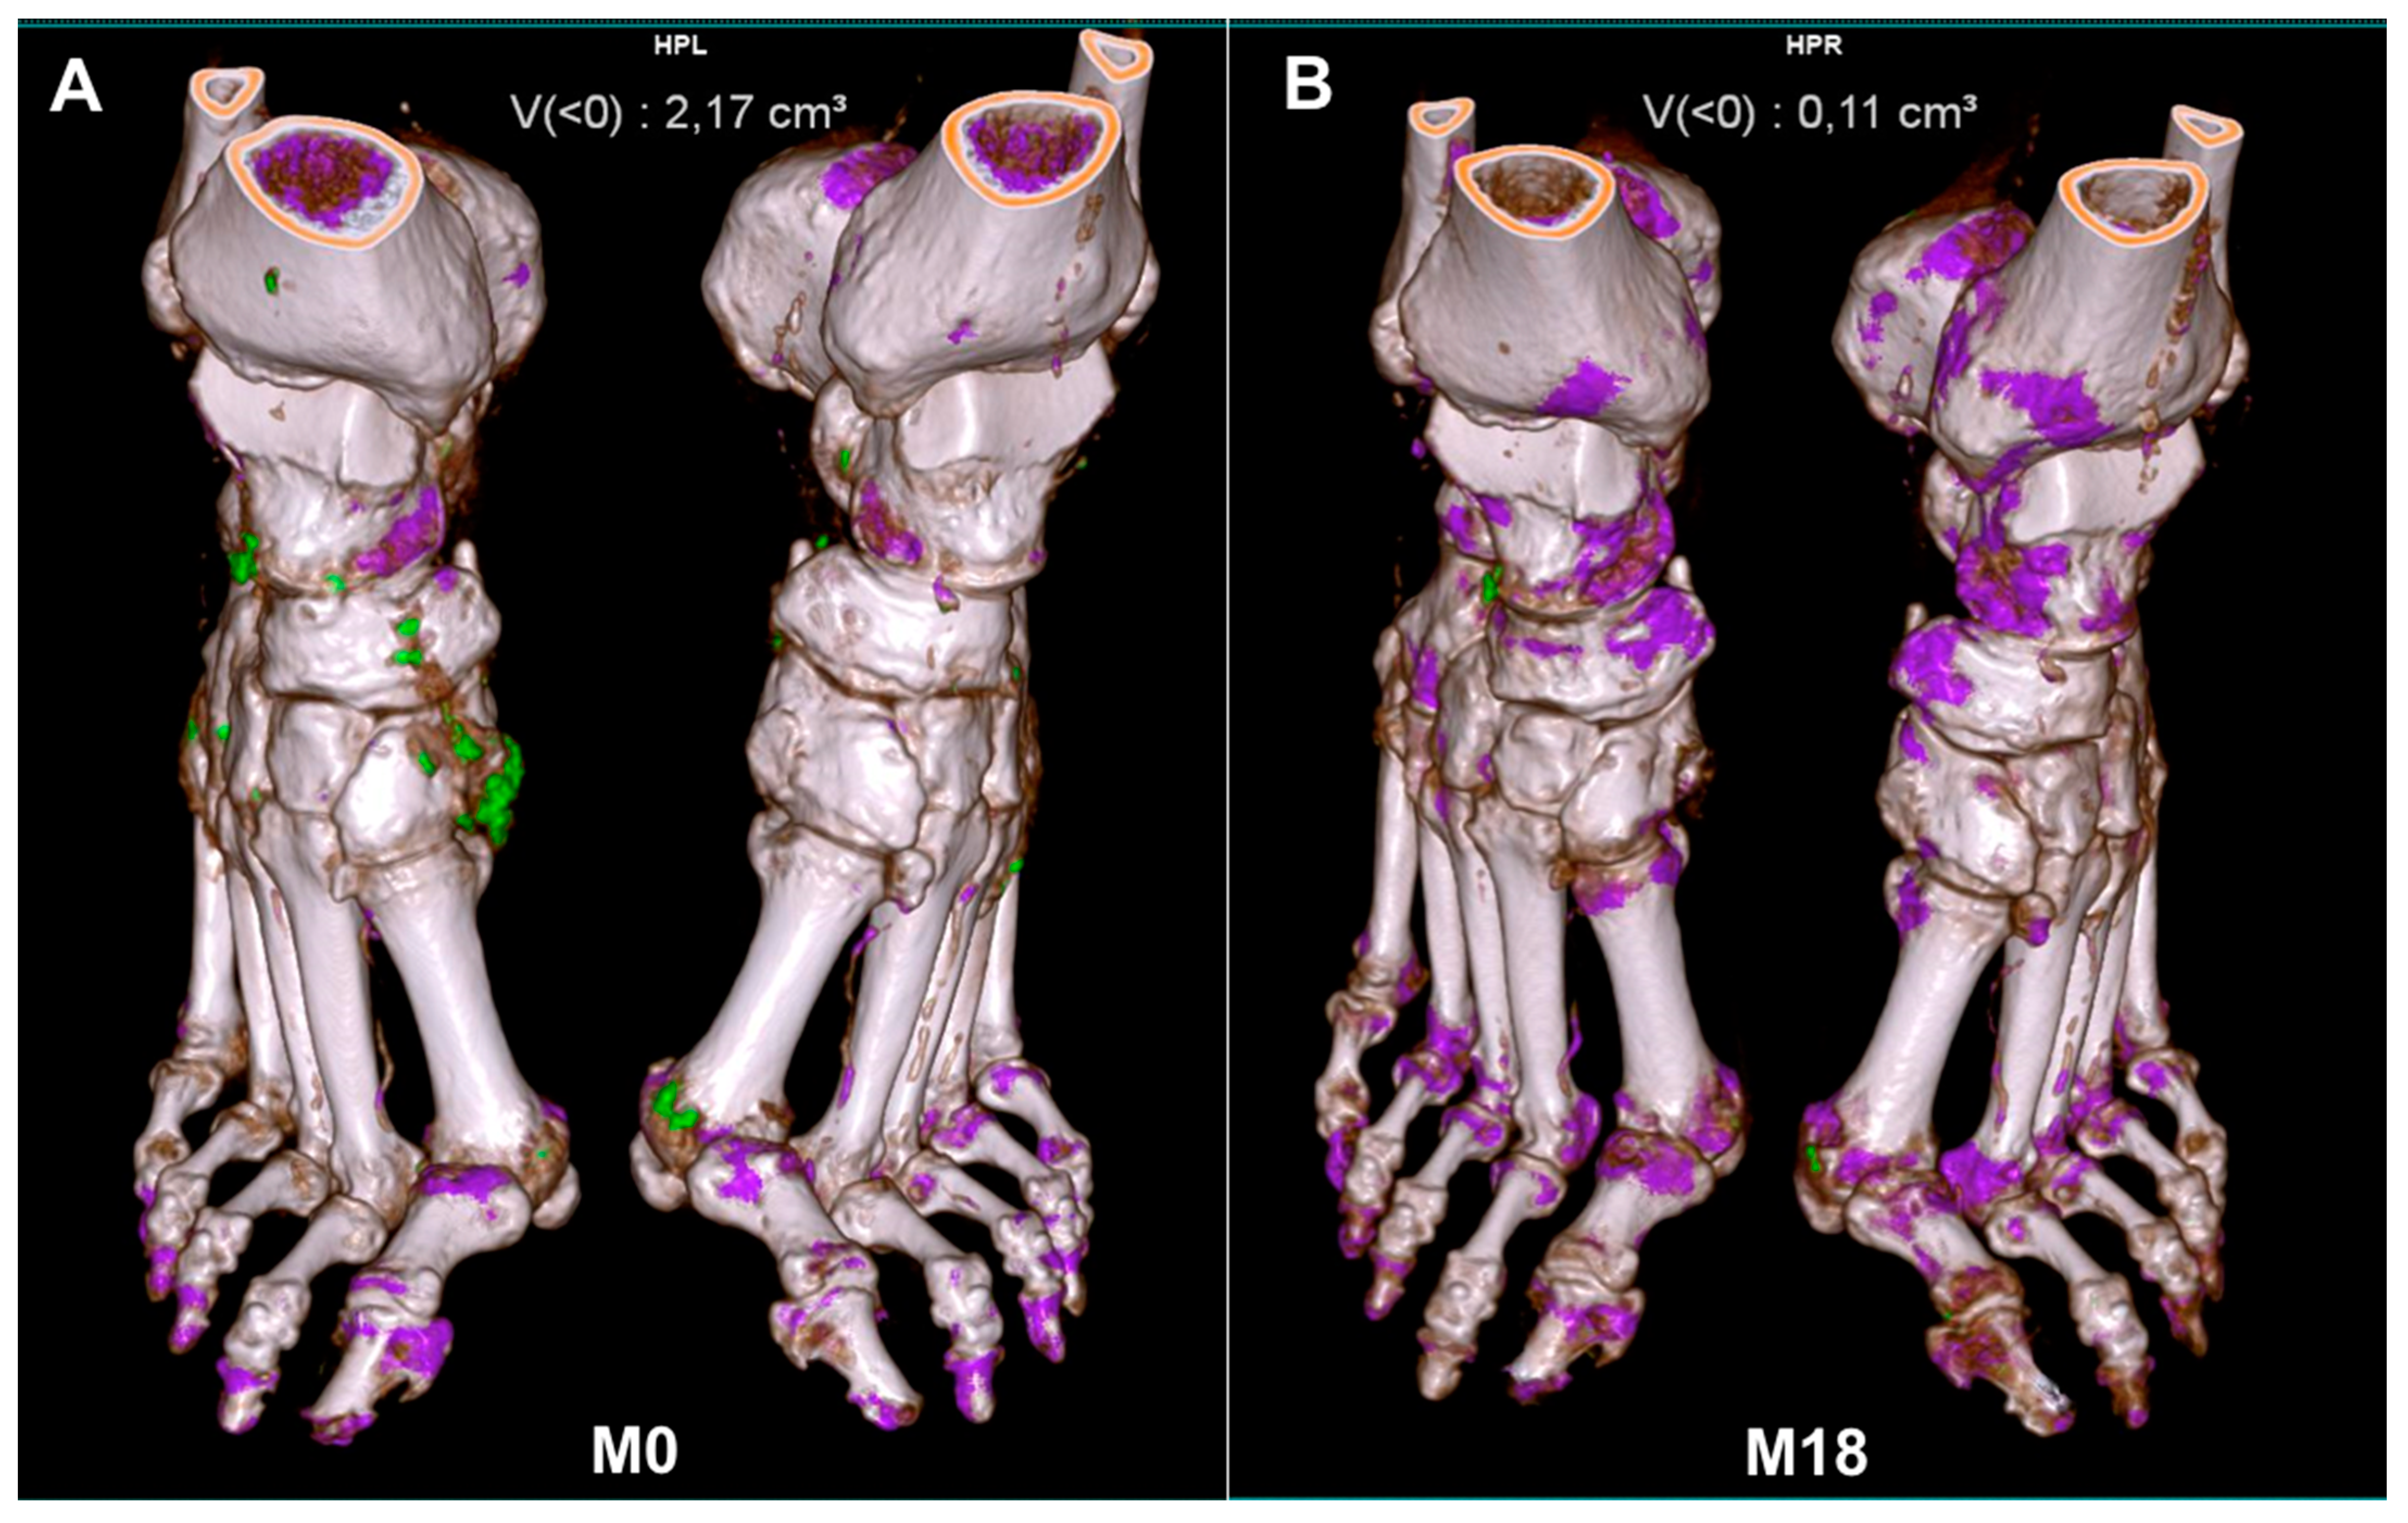
DECT relies on the combined attenuation properties of two X-ray beams of different energies projected at right angles [26]. The obtained difference in attenuation of the analyzed tissue allows for distinguishing urate and calcium in soft tissues surrounding bone. MSU crystals appear as color-coded images (Figure 2A). The ability of DECT to detect soft-tissue MSU crystal deposition is well known. DECT allows for the visualization of MSU crystal deposition in the vessels, kidneys and spine but also provides an automatic calculation of MSU crystal volume that could be useful for quantitative analysis. As for US, DECT had an important weight in the American College of Rheumatology/European Alliance of Associations for Rheumatology gout classification [27]. Some studies suggest that the accuracy for gout diagnosis by DECT differs by disease duration. Sensitivity is lower in patients with recent-onset disease. DECT is able to detect all MSU crystal depositions, except for the DC sign. This could be related to the required minimum amount of MSU deposits in tophi that could be detected by US (~50–100 μm) and DECT (~250 μm) [28,29]. Some data suggest a correlation between MSU burden and renal [30] or cardiovascular complications [8]. The overall sensitivity of DECT in the gout diagnosis ranges from 71% to 97% and specificity 84% to 95% [13].
3. Scoring Imaging Features of Gout
The ability of the two imaging modalities to detect MSU crystals suggests that the follow-up of MSU crystal dissolution under ULT is possible. However, the physician needs a practical imaging score allowing for intra-individual follow-up, as well as homogenization of the evaluation. Other unresolved questions are which and how many joints to analyze.
3.1. Ultrasonography
3.1.1. Scoring
Multiple scores have been used to monitor gout lesions during ULT. Most studies used a binary approach (present or not) for the DC sign. Regarding tophus scoring, a binary approach or measuring the size was most often used. The OMERACT initially validated the binary score for DC, tophus and aggregates for the follow-up of gout lesions [31]. Hammer et al. proposed a semi-quantitative score [32], which was incorporated in the OMERACT score and validated by the group [25]. For this score, the DC sign, tophus and aggregates are assessed according to OMERACT definitions. Each lesion is classified into four categories with scores as follows: 0 = absent; 1 = possible, 2 = definite but minimal and 3 = definite and severe.
The intra-reader reliability for the three gout lesions was >90%, but the inter-observer reliability was 0.61, 0.63 and 0.67 for aggregates, the DC sign and tophus, respectively [25]. The OMERACT group proposed scoring aggregates only when patients also had other US features of gout, thus emphasizing that aggregates are non-specific lesions of gout.
Of note, the benefit of the US monitoring of gout lesions in clinical practice has not been demonstrated. There is no study suggesting that such a US follow-up of gout decision might help the clinician change or stop ULT.
3.1.2. Which Joint to Analyze
As detailed in Table 1, the most-used sites for US analysis are the knees (cartilage and tendons) and MTP1s. Indeed, in clinical practice, these joints are the most affected, although any joints or the spine could also be affected [33,34]. A previous study evaluated by US the prevalence of tophus and the DC sign on 10 joints (MTP1-2, knees and MCP2-3). The frequency of the DC sign and tophus in MTPs, knees and MCPs was 67% and 74%, 57% and 42%, and 21% and 22%, respectively [14]. The OMERACT NOR-gout study assessed 28 joints and 26 tendons [32]. The DC sign and US tophus were mostly found in MTP1s. However, in clinical practice, screening a large number of locations is time-consuming. Some studies assessed the knees and MTP1s for the DC sign and measured the larger tophus as the index tophus, thus avoiding time-consuming US evaluation [35,36,37]. The Naredo et al. study used US analysis of 26 joints, 6 bursae, 8 tendons and 4 ligaments in patients with gout and controls [38]. The presence of intratendinous or intraarticular aggregates and the DC sign was recorded. The most involved joints for intraarticular aggregates were MTP1 and radiocarpal joints. Tendon abnormalities were most frequently found in the patellar (60%) and triceps tendon (42%), and the MTP1s were the main location for the DC sign. The combined assessment of one joint (radiocarpal joint), two tendons (patellar and triceps tendons) and three hyaline cartilages (MTP1, talar and femoral condyle cartilages) had the best balance between sensitivity (85%) and specificity (83%) [38]. Recently, Cipolletta et al. evaluated a targeted US protocol for the diagnosis of crystal diseases [39]. Patients with acute mono/oligoarthritis underwent a systematic US scanning protocol: MTP1s, ankles, knees, hip, shoulders, elbows, MCP2s and hips, searching for the DC sign, tophus or CPP deposits. The US assessment of two joints bilaterally (knees and MTPs for gout, wrists and knees for CPPD) and the targeted joints had an excellent sensitivity and specificity [39].
3.2. Dual-Energy CT
3.2.1. Scoring
As seen below, DECT cannot detect a DC sign, but its ability to measure the tophus volume allows for a quantitative measure of the tophus. Thus, most studies used the quantification of tophus volume as a primary criterion. A semi-quantitative score (DECT urate score) was proposed in 2016 by Bayat et al. [41]. This score included four locations of MSU crystal deposits: MTP1s, toes (proximal and distal interphalangeal joints, metacarpophalangeal joints 2–5), midfoot/ankle and soft tissue. MSU crystal deposition was quantified in each location as follows: 0 = no deposits, 1 = single deposit < 2 mm, 2 = single deposit > 2 mm and 3 = fused deposits.
The scores for each region were added to produce a score range of 0–12. The DECT urate score validated the OMERACT filter, and the inter-reader intraclass correlation coefficient was 0.98, with very high correlation between the score and volume quantification.
DECT also allows for quantifying urate volume and bone erosion. In a recent study, Dalbeth et al. associated DECT measurement of the urate volume in both feet with a semi-quantitative assessment of bone erosions [42]. The authors used the gout CT bone erosion scoring system to analyze seven bones: MTP1 head, 2nd–4th MTP base, cuboid, middle cuneiform and distal tibia. Each site was scored by using a semi-quantitative scale (0–10 according to the percentage of bone involvement).
3.2.2. Which Joint to Analyze
Because gout deposits mainly involve feet, most studies using DECT analyzed this region. Although US allows for multiple joint analysis, DECT is often restricted to one region. However, DECT allows for measuring all tophus occurrences in one region, which is more difficult with US. Moreover, measuring the tophus with US can be imprecise. Indeed, DECT only visualizes MSU crystals, whereas US visualizes the tophus and the cellular inflammatory processes around the tophus, for an approximate measure [43].
4. The Ability of Imaging to Visualize the Dissolution of MSU Crystal Deposition
4.1. Ultrasonography
US is able to visualize the disappearance of MSU crystals. Table 1 summarizes the main results of studies on this subject. Perez-Ruiz et al. first demonstrated that measuring tophus size by US was possible and fulfilled the OMERACT filter [37]. Other studies suggested that under efficient ULT, the DC sign could disappear [36,44] and the number of US-detected tophi might decrease [40]. Larger studies confirmed that the decrease in tophus volume and the number of DC signs was observable by US whatever the score used for measurement (OMERACT, tophus size, binary approach) [31,32,35]. Of note, the dissolution of the DC sign is detectable after 3 months of ULT, whereas the decrease in tophus size is observed after at least 6 months [35]. Most studies found a correlation between the decrease in serum urate level and dissolution of the DC sign but with discrepancies between studies in the correlation between the serum urate level and tophus size measured by US. These data suggested that (1) US is an interesting imaging modality for MSU deposition follow-up, (2) the DC sign represents an early sign of ULT efficacy (Figure 1A–D), and (3) the decrease in tophus size could be a late sign of MSU crystal dissolution (Figure 1C,D).
4.2. DECT
With its ability to detect MSU deposition and to automatically calculate the volume of the tophus, DECT seems a good imaging technique for MSU crystal follow-up (Table 2). As detailed in Table 2, all studies analyzed the tophus volume at the feet [42,45,46,47,48,49]. Sun et al. also used a semiquantitative approach with the quantification of small and large MSU crystals. Two studies used the DECT urate score (described below) [45,48]. Whatever the score used to quantify gout lesions, all DECT studies found a decrease in MSU crystal deposition under ULT. Of note, this decrease was correlated with a decrease in serum urate level only in ULT-naive patients [42,48,49] or in patients not reaching the target serum urate level and switching to pegloticase [47]. Patients not reaching the serum urate level target (<0.36 mmol/L) did not show a reduced DECT-detected urate volume [42,48]. Laurent et al. demonstrated that gouty patients reaching the <0.30 mmol/L SU target showed more extensive and rapid dissolution of MSU deposits than those reaching the <0.36 mmol/L target [50]. Only one study did not find any correlation between the change in tophus volume and serum urate level, but those patients were already under ULT [46]. Recently, Dalbeth et al. reported two gouty patients receiving pegloticase and methotrexate [51]. Serial DECT revealed the rapid depletion of MSU deposits associated with bone erosion remodeling. These data suggest that DECT is an appropriate imaging modality for monitoring MSU crystal deposition (Figure 2) but also for bone remodeling evaluation.
5. The Impact of Imaging on Relapse
5.1. Ultrasonography
In the 2-year NOR-gout study [45], MSU deposits were measured by DECT but also by US with the semi-quantitative score developed by Hammer et al. (see below) [32]. Colchicine was given for 3–6 months to prevent relapse. The sum-score at baseline was associated with the risk of flare after 9 months of ULT and up to 2 years [45]. Another study evaluated the risk of flare according to the MSU burden evaluated by US [52]. In this 1-year study, 71 patients with gout who had at least 6 months of stable ULT underwent US of the knees, elbows, MTP1s, wrists and second metacarpophalangeal joints. MSU crystal deposits (aggregates, the DC sign and tophus) were assessed with a binary score, with the calculation of a sum-score. Baseline US findings were independent predictors of gout flare over 12 months. The multicenter 1-year USEFUL-2 study [53] used another approach: 79 gouty patients starting ULT were followed by US (months 0, 6 and 12), with quantification of the number of joints with the DC sign and tophus but also the measurement of tophus size. Colchicine was given during the first 6 months and then stopped. The primary outcome of the second phase of the study was the proportion of patients experiencing a relapse between Months 6 and 12. The probability of relapse during this period was increased for patients with a decrease in tophus size < 50%. Finally, in a 12-month study, Cipolletta et al. found that US estimation of the MSU burden before initiating ULT could predict the fulfillment of the 2016 remission criteria for gout [54]. These data suggest that the duration of flare prophylaxis could be guided by changes in US-measured tophus size and that the ability to achieve remission can be affected by the initial amount of MSU deposits.
5.2. Dual-Energy CT
Some studies measured the impact of the MSU burden measured by DECT. In a 12-month longitudinal study, Pascart et al. compared the MSU burden measured by DECT and US of 78 gouty patients according to the occurrence of flare during this period [55]. The risk of flare was not associated with the number of joints with the DC sign at baseline but was associated with the DECT-detected MSU volume of the feet. With each 1-cm3 increase in MSU volume, the risk of flare was increased two-fold at 6 months [55]. Another study did not find any association between gout flare and DECT findings at 1 year but rather after 2 years [42]. In the treat-to-target NOR-gout study, the DECT urate score at baseline predicted flare after 9 months of ULT and up to 2 years [45]. Regarding the change in MSU crystal deposition measured by DECT and risk of flare, Hammer et al. published the results of the US and DECT assessment in the 2-year NOR-gout study that had been communicated at the 2023 EULAR congress. Patients experiencing flares had higher baseline US and DECT scores. US and DECT scores decreased in parallel during follow-up, and baseline DECT depositions predicted flare at 3 and 12 months [56].
6. Perspectives
Thus, imaging is playing an important role in the management of gout. US and DECT can detect MSU deposition with great sensitivity and specificity. The change in the US- or DECT-detected features of gout under ULT is well associated with urate level changes. The advantages and limitations of each imaging modality are summarized in Table 3. The main advantage of US is its availability. It is an inexpensive exam without irradiation that allows for full-body analysis and a dynamic approach. US features of gout are quite specific, even if some false-positive results in CPPD are possible (pseudo-DC sign). Other limitations are the inability to analyze some sites such as the spine or inaccessible ligaments and only a semiquantitative estimation of urate burden. In contrast, DECT allows for a direct quantification of MSU burden and analysis of spine or other inaccessible structures. However, its feasibility in clinical practice seems less than with US and the availability is limited. DECT analysis is limited to one site and the cost varies depending on the country, but it is higher than with US. Thus, the choice of imaging modality depends on all these variables.
Although imaging is a sensitive tool for quantifying MSU deposits under ULT, improved management of gout with systematic imaging follow-up has not been demonstrated as compared with classical follow-up (blood tests and clinical screening). In rheumatoid arthritis studies, systematic US follow-up failed to demonstrate a better rate of remission than usual management [57,58]. The scanning protocol for US varied according to the studies. A clear imaging approach is mandatory for routine practice. In this sense, the EULAR recommendations for the use of imaging in gout will soon be proposed. Finally, the close monitoring of urate load change could have some benefit of patient education. The absence of a decrease in gout deposits might reflect a low adherence to ULT. In some patients, ULT could be taken with irregularity and the available SU level may not be reflecting the exact urate load. Of those, the determination of urate load or slow decrease in the tophus size might help the physician to detect low adherence. Thus, the ability to visualize the dissolution of crystal deposits might help gouty patients to better understand their disease and improve their adherence to ULT.
7. Conclusions
DECT and US are performant imaging modalities allowing for visualizing changes in MSU crystal deposition. With US, the number of joints with the DC sign and measuring the index tophus volume seem the best features to follow. DECT is the modality of choice for measuring the tophus volume at the feet or calculating the urate score for quantifying gout lesions. The change in gout lesions under ULT measured by US and DECT seem to be correlated with the change in the serum urate level, the DC sign being the earlier gout lesion to disappear. Additionally, the risk of relapse is associated with the baseline MSU burden or the degree of change in gout lesions. All these data confirm that imaging could be useful in managing gout even if its exact place in routine practice remains unclear.
Funding
This research received no external funding.
Institutional Review Board Statement
Not applicable.
Informed Consent Statement
Not applicable.
Data Availability Statement
Not applicable.
Acknowledgments
The author thanks Laura Smales for copyediting.
Conflicts of Interest
The author declares no conflicts of interest.
References
- Richette, P.; Bardin, T. Gout. Lancet 2009, 375, 318–328. [Google Scholar] [CrossRef] [PubMed]
- Bursill, D.; Taylor, W.J.; Terkeltaub, R.; Abhishek, A.; So, A.K.; Vargas-Santos, A.B.; Gaffo, A.L.; Rosenthal, A.; Tausche, A.-K.; Reginato, A.; et al. Gout, Hyperuricaemia and Crystal-Associated Disease Network (G-CAN) consensus statement regarding labels and definitions of disease states of gout. Ann. Rheum. Dis. 2019, 78, 1592–1600. [Google Scholar] [CrossRef] [PubMed]
- Chandratre, P.; Roddy, E.; Clarson, L.; Richardson, J.; Hider, S.L.; Mallen, C.D. Health-related quality of life in gout: A systematic review. Rheumatology 2013, 52, 2031–2040. [Google Scholar] [CrossRef] [PubMed]
- Watson, L.; Belcher, J.; Nicholls, E.; Chandratre, P.; Blagojevic-Bucknall, M.; Hider, S.; A Lawton, S.; Mallen, C.D.; Muller, S.; Rome, K.; et al. Factors associated with change in health-related quality of life in people with gout: A 3-year prospective cohort study in primary care. Rheumatology 2022, 62, 2748–2756. [Google Scholar] [CrossRef]
- Kiadaliri, A.A.; Englund, M. Temporal trends and regional disparity in rheumatoid arthritis and gout hospitalizations in Sweden, 1998–2015. Clin. Rheumatol. 2018, 37, 825–830. [Google Scholar] [CrossRef]
- Lim, S.Y.; Lu, N.; Oza, A.; Fisher, M.; Rai, S.K.; Menendez, M.E.; Choi, H.K. Trends in Gout and Rheumatoid Arthritis Hospitalizations in the United States, 1993-2011. JAMA 2016, 315, 2345–2347. [Google Scholar] [CrossRef]
- Andrés, M.; Bernal, J.A.; Sivera, F.; Quilis, N.; Carmona, L.; Vela, P.; Pascual, E. Cardiovascular risk of patients with gout seen at rheumatology clinics following a structured assessment. Ann. Rheum. Dis. 2017, 76, 1263–1268. [Google Scholar] [CrossRef]
- Marty-Ané, A.; Norberciak, L.; Andrès, M.; Houvenagel, E.; Ducoulombier, V.; Legrand, J.; Budzik, J.-F.; Pascart, T. Crystal deposition measured with dual-energy computed tomography: Association with mortality and cardiovascular risks in gout. Rheumatology 2021, 60, 4855–4860. [Google Scholar] [CrossRef]
- Pascart, T.; Latourte, A.; Flipo, R.-M.; Chalès, G.; Coblentz-Baumann, L.; Cohen-Solal, A.; Ea, H.-K.; Grichy, J.; Letavernier, E.; Lioté, F.; et al. 2020 recommendations from the French Society of Rheumatology for the management of gout: Urate-lowering therapy. Jt. Bone Spine 2020, 87, 395–404. [Google Scholar] [CrossRef]
- Richette, P.; Doherty, M.; Pascual, E.; Barskova, V.; Becce, F.; Castañeda-Sanabria, J.; Coyfish, M.; Guillo, S.; Jansen, T.L.; Janssens, H.; et al. 2016 updated EULAR evidence-based recommendations for the management of gout. Ann. Rheum. Dis. 2016, 76, 29–42. [Google Scholar] [CrossRef]
- FitzGerald, J.D.; Dalbeth, N.; Mikuls, T.; Brignardello-Petersen, R.; Guyatt, G.; Abeles, A.M.; Gelber, A.C.; Harrold, L.R.; Khanna, D.; King, C.; et al. 2020 American College of Rheumatology Guideline for the Management of Gout. Arthritis Care Res. 2020, 72, 744–760. [Google Scholar] [CrossRef] [PubMed]
- Goossens, J.; Lancrenon, S.; Lanz, S.; Ea, H.-K.; Lambert, C.; Guggenbuhl, P.; Saraux, A.; Delva, C.; Sahbane, S.; Lioté, F. GOSPEL 3: Management of gout by primary-care physicians and office-based rheumatologists in France in the early 21st century – comparison with 2006 EULAR Recommendations. Jt. Bone Spine 2017, 84, 447–453. [Google Scholar] [CrossRef]
- Richette, P.; Doherty, M.; Pascual, E.; Barskova, V.; Becce, F.; Castaneda, J.; Coyfish, M.; Guillo, S.; Jansen, T.; Janssens, H.; et al. 2018 updated European League Against Rheumatism evidence-based recommendations for the diagnosis of gout. Ann. Rheum. Dis. 2019, 79, 31–38. [Google Scholar] [CrossRef] [PubMed]
- Ottaviani, S.; Bardin, T.; Richette, P. Usefulness of ultrasonography for gout. Jt. Bone Spine 2012, 79, 441–445. [Google Scholar] [CrossRef] [PubMed]
- Filippucci, E.; Gutierrez, M.; Georgescu, D.; Salaffi, F.; Grassi, W. Hyaline cartilage involvement in patients with gout and calcium pyrophosphate deposition disease. An ultrasound study. Osteoarthr. Cartil. 2009, 17, 178–181. [Google Scholar] [CrossRef] [PubMed]
- Ottaviani, S.; Allard, A.; Bardin, T.; Richette, P. Ultrasonography findings in early gout. Clin. Exp. Rheumatol. 2011, 29, 816–821. [Google Scholar] [PubMed]
- Ottaviani, S.; Richette, P.; Allard, A.; Ora, J.; Bardin, T. Ultrasonography in gout: A case-control study. Clin. Exp. Rheumatol. 2012, 30, 499–504. [Google Scholar]
- Thiele, R.G.; Schlesinger, N. Diagnosis of gout by ultrasound. Rheumatology 2007, 46, 1116–1121. [Google Scholar] [CrossRef]
- A Wright, S.; Filippucci, E.; McVeigh, C.; Grey, A.; McCarron, M.; Grassi, W.; Wright, G.D.; Taggart, A.J. High-resolution ultrasonography of the first metatarsal phalangeal joint in gout: A controlled study. Ann. Rheum. Dis. 2007, 66, 859–864. [Google Scholar] [CrossRef]
- Ogdie, A.; Taylor, W.J.; Neogi, T.; Fransen, J.; Jansen, T.L.; Schumacher, H.R.; Louthrenoo, W.; Vazquez-Mellado, J.; Eliseev, M.; McCarthy, G.; et al. Performance of Ultrasound in the Diagnosis of Gout in a Multicenter Study: Comparison With Monosodium Urate Monohydrate Crystal Analysis as the Gold Standard. Arthritis Rheumatol. 2016, 69, 429–438. [Google Scholar] [CrossRef]
- Filippou, G.; Miguel-Perez, M.; Coronel, L.; Sirotti, S.; Pacini, G.; Scanu, A.; Bong, D.; Möller, I.; EULAR Study Group on Anatomy for the Image. The ultrasonographic pseudo-double contour sign in calcium pyrophosphate deposition disease: An anatomic explanation and how to distinguish it from gout. Arthritis Rheumatol. 2023, 75, 639–640. [Google Scholar] [CrossRef] [PubMed]
- Cipolletta, E.; Abhishek, A.; Di Matteo, A.; Grassi, W.; Filippucci, E. Dynamic assessment of the double contour sign by ultrasonography helps to distinguish between gout and calcium pyrophosphate deposition disease. RMD Open 2023, 9, e002940. [Google Scholar] [CrossRef] [PubMed]
- Terslev, L.; Gutierrez, M.; Schmidt, W.A.; Keen, H.I.; Filippucci, E.; Kane, D.; Thiele, R.; Kaeley, G.; Balint, P.; Mandl, P.; et al. Ultrasound as an Outcome Measure in Gout. A Validation Process by the OMERACT Ultrasound Working Group. J. Rheumatol. 2015, 42, 2177–2181. [Google Scholar] [CrossRef] [PubMed]
- Terslev, L.; Gutierrez, M.; Christensen, R.; Balint, P.V.; Bruyn, G.A.; Sedie, A.D.; Filippucci, E.; Garrido, J.; Hammer, H.B.; Iagnocco, A.; et al. Assessing Elementary Lesions in Gout by Ultrasound: Results of an OMERACT Patient-based Agreement and Reliability Exercise. J. Rheumatol. 2015, 42, 2149–2154. [Google Scholar] [CrossRef]
- Christiansen, S.N.; Filippou, G.; Scirè, C.A.; Balint, P.V.; Bruyn, G.A.; Dalbeth, N.; Dejaco, C.; Sedie, A.D.; Filippucci, E.; Hammer, H.B.; et al. Consensus-based semi-quantitative ultrasound scoring system for gout lesions: Results of an OMERACT Delphi process and web-reliability exercise. Semin. Arthritis Rheum. 2021, 51, 644–649. [Google Scholar] [CrossRef]
- Filippou, G.; Pascart, T.; Iagnocco, A. Utility of Ultrasound and Dual Energy CT in Crystal Disease Diagnosis and Management. Curr. Rheumatol. Rep. 2020, 22, 1–8. [Google Scholar] [CrossRef]
- Neogi, T.; A Jansen, T.L.T.; Dalbeth, N.; Fransen, J.; Schumacher, H.R.; Berendsen, D.; Brown, M.; Choi, H.; Edwards, N.L.; Janssens, H.J.E.M.; et al. 2015 Gout classification criteria: An American College of Rheumatology/European League Against Rheumatism collaborative initiative. Ann. Rheum. Dis. 2015, 74, 1789–1798. [Google Scholar] [CrossRef]
- Bongartz, T.; Glazebrook, K.N.; Kavros, S.J.; Murthy, N.S.; Merry, S.P.; Franz, W.B., 3rd; Michet, C.J.; Veetil, B.M.; Davis, J.M., 3rd; Mason, T.G., 2nd; et al. Dual-energy CT for the diagnosis of gout: An accuracy and diagnostic yield study. Ann. Rheum. Dis. 2015, 74, 1072–1077. [Google Scholar] [CrossRef]
- A Singh, J.; Budzik, J.-F.; Becce, F.; Pascart, T. Dual-energy computed tomography vs ultrasound, alone or combined, for the diagnosis of gout: A prospective study of accuracy. Rheumatology 2021, 60, 4861–4867. [Google Scholar] [CrossRef]
- Bardin, T.; Tran, K.M.; Nguyen, Q.D.; Sarfati, M.; Richette, P.; Vo, N.T.; Bousson, V.; Correas, J.-M. Renal medulla in severe gout: Typical findings on ultrasonography and dual-energy CT study in two patients. Ann. Rheum. Dis. 2018, 78, 433–434. [Google Scholar] [CrossRef]
- Christiansen, S.N.; Østergaard, M.; Slot, O.; Keen, H.; Bruyn, G.A.W.; D’Agostino, M.A.; Terslev, L. Assessing the sensitivity to change of the OMERACT ultrasound structural gout lesions during urate-lowering therapy. RMD Open 2020, 6, e001144. [Google Scholar] [CrossRef] [PubMed]
- Hammer, H.B.; Karoliussen, L.; Terslev, L.; A Haavardsholm, E.; Kvien, T.K.; Uhlig, T. Ultrasound shows rapid reduction of crystal depositions during a treat-to-target approach in gout patients: 12-month results from the NOR-Gout study. Ann. Rheum. Dis. 2020, 79, 1500–1505. [Google Scholar] [CrossRef] [PubMed]
- Di Matteo, A.; Filippucci, E.; Cipolletta, E.; Ausili, M.; Martire, V.; Di Carlo, M.; Salaffi, F.; Grassi, W. The popliteal groove region: A new target for the detection of monosodium urate crystal deposits in patients with gout. An ultrasound study. Jt. Bone Spine 2018, 86, 89–94. [Google Scholar] [CrossRef] [PubMed]
- Di Matteo, A.; Filippucci, E.; Cipolletta, E.; Musca, A.; Di Donato, E.; Martire, V.; Jesus, D.; Salaffi, F.; Grassi, W. Ultrasound and clinical features of hip involvement in patients with gout. Jt. Bone Spine 2019, 86, 633–636. [Google Scholar] [CrossRef] [PubMed]
- Ebstein, E.; Forien, M.; Norkuviene, E.; Richette, P.; Mouterde, G.; Daien, C.; Ea, H.-K.; Brière, C.; Lioté, F.; Petraitis, M.; et al. Ultrasound evaluation in follow-up of urate-lowering therapy in gout: The USEFUL study. Rheumatology 2018, 58, 410–417. [Google Scholar] [CrossRef]
- Ottaviani, S.; Gill, G.; Aubrun, A.; Palazzo, E.; Meyer, O.; Dieudé, P. Ultrasound in gout: A useful tool for following urate-lowering therapy. Jt. Bone Spine 2015, 82, 42–44. [Google Scholar] [CrossRef]
- Perez-Ruiz, F.; Martin, I.; Canteli, B. Ultrasonographic measurement of tophi as an outcome measure for chronic gout. J. Rheumatol. 2007, 34, 1888–1893. [Google Scholar]
- Naredo, E.; Uson, J.; Jimenez-Palop, M.; Martinez, A.; Vicente, E.; Brito, E.; Rodríguez, A.; Cornejo, F.J.; Castañeda, S.; Martínez, M.J.; et al. Ultrasound-detected musculoskeletal urate crystal deposition: Which joints and what findings should be assessed for diagnosing gout? Ann. Rheum. Dis. 2014, 73, 1522–1528. [Google Scholar] [CrossRef]
- Cipolletta, E.; Filippucci, E.; Abhishek, A.; Di Battista, J.; Smerilli, G.; Di Carlo, M.; Silveri, F.; De Angelis, R.; Salaffi, F.; Grassi, W.; et al. In patients with acute mono/oligoarthritis, a targeted ultrasound scanning protocol shows great accuracy for the diagnosis of gout and CPPD. Rheumatology 2022, 62, 1493–1500. [Google Scholar] [CrossRef]
- Peiteado, D.; Villalba, A.; Martín-Mola, E.; Balsa, A.; De Miguel, E. Ultrasound sensitivity to changes in gout: A longitudinal study after two years of treatment. Clin. Exp. Rheumatol. 2017, 35, 746–751. [Google Scholar]
- Bayat, S.; Aati, O.; Rech, J.; Sapsford, M.; Cavallaro, A.; Lell, M.; Araujo, E.; Petsch, C.; Stamp, L.K.; Schett, G.; et al. Development of a Dual-Energy Computed Tomography Scoring System for Measurement of Urate Deposition in Gout. Arthritis Care Res. 2015, 68, 769–775. [Google Scholar] [CrossRef]
- Dalbeth, N.; Billington, K.; Doyle, A.; Frampton, C.; Tan, P.; Aati, O.; Allan, J.; Drake, J.; Horne, A.; Stamp, L.K. Effects of Allopurinol Dose Escalation on Bone Erosion and Urate Volume in Gout: A Dual-Energy Computed Tomography Imaging Study Within a Randomized, Controlled Trial. Arthritis Rheumatol. 2019, 71, 1739–1746. [Google Scholar] [CrossRef] [PubMed]
- Pascart, T.; Grandjean, A.; Norberciak, L.; Ducoulombier, V.; Motte, M.; Luraschi, H.; Vandecandelaere, M.; Godart, C.; Houvenagel, E.; Namane, N.; et al. Ultrasonography and dual-energy computed tomography provide different quantification of urate burden in gout: Results from a cross-sectional study. Arthritis Res. Ther. 2017, 19, 1–8. [Google Scholar] [CrossRef] [PubMed]
- Thiele, R.G.; Schlesinger, N. Ultrasonography shows disappearance of monosodium urate crystal deposition on hyaline cartilage after sustained normouricemia is achieved. Rheumatol. Int. 2009, 30, 495–503. [Google Scholar] [CrossRef]
- Uhlig, T.; Eskild, T.; Karoliussen, L.F.; Sexton, J.; Kvien, T.K.; A Haavardsholm, E.; Dalbeth, N.; Hammer, H.B. Two-year reduction of dual-energy CT urate depositions during a treat-to-target strategy in gout in the NOR-Gout longitudinal study. Rheumatology 2021, 61, SI81–SI85. [Google Scholar] [CrossRef] [PubMed]
- Rajan, A.; Aati, O.; Kalluru, R.; Gamble, G.D.; Horne, A.; Doyle, A.J.; McQueen, F.M.; Dalbeth, N. Lack of change in urate deposition by dual-energy computed tomography among clinically stable patients with long-standing tophaceous gout: A prospective longitudinal study. Arthritis Res. Ther. 2013, 15, R160. [Google Scholar] [CrossRef] [PubMed]
- Araujo, E.G.; Bayat, S.; Petsch, C.; Englbrecht, M.; Faustini, F.; Kleyer, A.; Hueber, A.J.; Cavallaro, A.; Lell, M.; Dalbeth, N.; et al. Tophus resolution with pegloticase: A prospective dual-energy CT study. RMD Open 2015, 1, e000075. [Google Scholar] [CrossRef]
- Ellmann, H.; Bayat, S.; Araujo, E.; Manger, B.; Kleyer, A.; Cavallaro, A.; Lell, M.; Schenker, H.; Simon, D.; Tascilar, K.; et al. Effects of Conventional Uric Acid-Lowering Therapy on Monosodium Urate Crystal Deposits. Arthritis Rheumatol. 2020, 72, 150–156. [Google Scholar] [CrossRef]
- Sun, Y.; Chen, H.; Zhang, Z.; Ma, L.; Zhou, J.; Zhou, Y.; Ding, Y.; Jin, X.; Jiang, L. Dual-energy computed tomography for monitoring the effect of urate-lowering therapy in gouty arthritis. Int. J. Rheum. Dis. 2015, 18, 880–885. [Google Scholar] [CrossRef]
- Laurent, V.; Jauffret, C.; Pacaud, A.; Ducoulombier, V.; Legrand, J.; Verdun, S.; Norberciak, L.; Budzik, J.-F.; Pascart, T. Factors influencing the kinetics of MSU crystal depletion measured with dual-energy CT in patients with gout. RMD Open 2023, 9, e003725. [Google Scholar] [CrossRef]
- Dalbeth, N.; Becce, F.; Botson, J.K.; Zhao, L.; Kumar, A. Dual-energy CT assessment of rapid monosodium urate depletion and bone erosion remodelling during pegloticase plus methotrexate co-therapy. Rheumatology 2022, 61, 4898–4904. [Google Scholar] [CrossRef]
- Cipolletta, E.; Abhishek, A.; Di Battista, J.; Grassi, W.; Filippucci, E. Ultrasonography in the prediction of gout flares: A 12-month prospective observational study. Rheumatology 2022, 62, 1108–1116. [Google Scholar] [CrossRef] [PubMed]
- Ebstein, E.; Forien, M.; Norkuviene, E.; Richette, P.; Mouterde, G.; Daien, C.; Ea, H.-K.; Brière, C.; Lioté, F.; Petraitis, M.; et al. UltraSound evaluation in follow-up of urate-lowering therapy in gout phase 2 (USEFUL-2): Duration of flare prophylaxis. Jt. Bone Spine 2020, 87, 647–651. [Google Scholar] [CrossRef] [PubMed]
- Cipolletta, E.; Di Battista, J.; Di Carlo, M.; Di Matteo, A.; Salaffi, F.; Grassi, W.; Filippucci, E. Sonographic estimation of monosodium urate burden predicts the fulfillment of the 2016 remission criteria for gout: A 12-month study. Arthritis Res. Ther. 2021, 23, 185. [Google Scholar] [CrossRef] [PubMed]
- Pascart, T.; Grandjean, A.; Capon, B.; Legrand, J.; Namane, N.; Ducoulombier, V.; Motte, M.; Vandecandelaere, M.; Luraschi, H.; Godart, C.; et al. Monosodium urate burden assessed with dual-energy computed tomography predicts the risk of flares in gout: A 12-month observational study: MSU burden and risk of gout flare. Arthritis Res. Ther. 2018, 20, 210. [Google Scholar] [CrossRef]
- Hammer, H.B.; Karoliussen, L.F.; Eskild, T.; Sexton, J.; Terslev, L.; Haavardsholm, E.A.; Uhlig, T. OP0296 CRYSTAL DEPOSITIONS ASSESSED BY ULTRASOUND AND DECT DECREASE DURING TREATMENT AND PREDICTS REDUCED NUMBERS OF FLARES; TWO-YEARS RESULTS FROM THE NOR-GOUT TREAT-TO-TARGET STUDY. In Proceedings of the EULAR 2023 European Congress of Rheumatology, Milan, Italy, 31 May–3 June 2023; pp. 192–193. [Google Scholar]
- Dale, J.; Stirling, A.; Zhang, R.; Purves, D.; Foley, J.; Sambrook, M.; Conaghan, P.G.; van der Heijde, D.; McConnachie, A.; McInnes, I.B.; et al. Targeting ultrasound remission in early rheumatoid arthritis: The results of the TaSER study, a randomised clinical trial. Ann. Rheum. Dis. 2016, 75, 1043–1050. [Google Scholar] [CrossRef]
- A Haavardsholm, E.; Aga, A.-B.; Olsen, I.C.; Lillegraven, S.; Hammer, H.B.; Uhlig, T.; Fremstad, H.; Madland, T.M.; Lexberg, S.; Haukeland, H.; et al. Ultrasound in management of rheumatoid arthritis: ARCTIC randomised controlled strategy trial. BMJ 2016, 354, i4205. [Google Scholar] [CrossRef]
Figure 1.
Follow-up of ultrasonography (US) and dual-energy CT gout lesions. (A,C,E). Baseline US features of gout with a double contour (DC) sign on the knee (A) and first metatarsophalangeal joints (MTP1s) (C) and a tophus on the MTP1s ((E), dotted oval). After 6 months of urate-lowering therapy, the disappearance of the DC sign (B,D) and slow decrease in tophus volume (F). M, month.

Figure 2.
Follow-up of dual-energy CT-detected gout lesions. Disappearance of gout deposits (in green) after 18 months of urate-lowering therapy. M, month. (A): 0 months; (B): 18 months.
Figure 2.
Follow-up of dual-energy CT-detected gout lesions. Disappearance of gout deposits (in green) after 18 months of urate-lowering therapy. M, month. (A): 0 months; (B): 18 months.


Table 1.
Ultrasonography studies with follow-up of monosodium urate (MSU) crystal deposition.
| References | No. of Patients | Follow-Up | Analyzed US Features of Gout | Scoring System | Location | Results | Correlation with Urate Serum Level |
|---|---|---|---|---|---|---|---|
| [37] | 22 | 12 months | Tophus | Tophus size | Knee, ankle | ↓ Tophus size | Yes |
| [18] | 5 | 7–18 months | DC sign | Binary | MCP2, Knee | Disappearance of DC sign (80% patients) | Yes |
| MTP1 | |||||||
| [36] | 16 | 6 months | DC sign | Binary | Knee, MTP1 | Disappearance of DC sign (75% patients) | Yes |
| Tophus | Index tophus size | Knee, MTP1 | ↓ Tophus size (75% patients) | Yes | |||
| [40] | 23 | 24 months | DC sign | Binary | Knee, MTP1 | ↓ Number of DC signs | Yes |
| Tophus | Binary | Knee, MTP1, patellar tendon | ↓ Number of tophus (except patellar tendon) | No | |||
| [35] | 79 | 6 months | DC sign | Binary | Knee, MTP1 | ↓ Number of DC signs | Yes |
| Tophus | Index tophus size | Knee, MTP1 | ↓ Tophus size | M3: No M6: Yes | |||
| [32] | 209 | 12 months | DC sign | Semi-quantitative (0–3) | Wrist, knee, MTP1, MCP2 | ↓ DC sum score (4.3–1.3) | Yes |
| Tophus | Wrist, knee, MTP1, MCP2 Achilles, triceps tendons | ↓ Tophus sum score (6.5–3.8) | No | ||||
| Aggregates | Wrist, knee, MTP1, MCP2 | ↓ Aggregates sum score (9.3–6.7) | No | ||||
| [31] | 50 | 6 months | DC sign | Binary | 28 joints and 26 tendons: MCP1-5, wrist, elbow, MTP1-5, tibiotalar, knee, tendons (triceps, quadriceps, patellar, Achilles, finger extensors, peroneus, tibial posterior) | ↓ DC sum score (3.2–1.3) | Yes |
| Tophus | Binary | ↓ Tophus sum score (2.7–1.8) | No | ||||
| Aggregates | Binary | ↓ Aggregates sum score (6.1–5.0) | No | ||||
| Erosion | Binary | No decrease in erosion score | No |
DC, double contour; MCP1-5, metacarpophalangeal joints 1–5; MTP1s, first metatarsophalangeal joints.
Table 2.
Dual-energy CT (DECT) studies with follow-up of MSU crystal deposition.
| References | No. of Patients | Follow-Up | ULT-Naïve at Baseline | Scoring System | Location of DECT Analysis | Results | Correlation with Urate Serum Variation |
|---|---|---|---|---|---|---|---|
| [46] | 73 | 12 months | No | Tophus volume | Feet | ↓ Volume of 0.01 cm3 | No |
| [47] | 10 | 13.3 weeks | Yes (switch to pegloticase) | Tophus volume | Feet (n = 10) Hands (n = 2) | ↓ Volume of 74% | Yes |
| [48] | 83 | 18 months | Yes | Tophus volume | Feet | ↓ Volume (0.33–0.2 cm3) | Yes |
| DECT urate score | ↓ Score (4.2–2.5) | Yes | |||||
| [49] | 44 | 6–24 months | Yes | Number of crystals < or >3 mm | Feet | ↓ Number of crystals | Yes |
| Maximal tophus volume | ↓ Maximal volume (3.5–2.7 cm3) | Yes | |||||
| [42] | 87 | 24 months | Yes | Index tophus volume | Feet | ↓ Volume | Yes |
| [45] | 187 | 24 months | Yes | DECT urate score | feet | ↓ Score (4.6–1.5) | Yes |
MSU, monosodium urate.
Table 3.
Advantages and limitations of US and DECT.
| Ultrasonography | DECT | |
|---|---|---|
| Advantages | Availability Cost Feasibility in clinical practice Possible whole-body assessment No irradiation Good sensibility to changes Associated with changes in serum urate level | Good sensibility to change Associated with changes in serum urate level Direct quantification of urate volume Able to analyze bone erosion Able to analyze spine |
| Limitations | Operator-dependent Some sites are not accessible (e.g., spine) False positive results: pseudo-DC sign Semi-quantitative measure of urate deposition | Availability Cost Feasibility in clinical practice Irradiation One analyzed site False positive results (e.g., nail artefact) |
Disclaimer/Publisher’s Note: The statements, opinions and data contained in all publications are solely those of the individual author(s) and contributor(s) and not of MDPI and/or the editor(s). MDPI and/or the editor(s) disclaim responsibility for any injury to people or property resulting from any ideas, methods, instructions or products referred to in the content. |
© 2024 by the author. Licensee MDPI, Basel, Switzerland. This article is an open access article distributed under the terms and conditions of the Creative Commons Attribution (CC BY) license (https://creativecommons.org/licenses/by/4.0/).
Share and Cite
MDPI and ACS Style
Ottaviani, S. Imaging Follow-Up of MSU Crystal Depletion. Gout Urate Cryst. Depos. Dis. 2024, 2, 34-44. https://doi.org/10.3390/gucdd2010003
AMA Style
Ottaviani S. Imaging Follow-Up of MSU Crystal Depletion. Gout, Urate, and Crystal Deposition Disease. 2024; 2(1):34-44. https://doi.org/10.3390/gucdd2010003
Chicago/Turabian StyleOttaviani, Sébastien. 2024. "Imaging Follow-Up of MSU Crystal Depletion" Gout, Urate, and Crystal Deposition Disease 2, no. 1: 34-44. https://doi.org/10.3390/gucdd2010003