Technical Note

Optimizing the Use of Ultrasound in Calcium Pyrophosphate Deposition (CPPD): A Review from the Ground Up

by
Georgios Filippou
1,2,*,†,
Silvia Sirotti
1,†,
Edoardo Cipolletta
3 and
Emilio Filippucci
3
1
Rheumatology Department, IRCCS Galeazzi—Sant’Ambrogio Hospital, 20157 Milan, Italy
2
Department of Biomedical and Clinical Sciences, University of Milan, 20157 Milan, Italy
3
Rheumatology Unit, Department of Clinical and Molecular Sciences, Polytechnic University of Marche, 60126 Ancona, Italy
*
Author to whom correspondence should be addressed.
These authors contributed equally to this work.
Gout Urate Cryst. Depos. Dis. 2024, 2(1), 17-33; https://doi.org/10.3390/gucdd2010002
Submission received: 18 September 2023 / Revised: 17 December 2023 / Accepted: 15 January 2024 / Published: 24 January 2024

Abstract

:
Ultrasound is a pivotal exam in calcium pyrophosphate deposition (CPPD) identification. It has been demonstrated to be feasible, accurate, and reliable for CPPD diagnosis. Even if standardized definitions and a scoring system for CPPD have been established by the OMERACT ultrasound working group, ultrasound is still considered one of the most operator-dependent techniques. This is because in ultrasound, both the acquisition and the interpretation phases of the diagnostic process are in the hands of one operator and are performed simultaneously, in contrast to what happens with other imaging exams, where the acquisition process is standardized and independent from the interpretation process. Therefore, the scanning technique and machine setting acquire a central role, almost as important as the interpretation of the images, as erroneous scanning may lead to interpretative mistakes. In this review, we will delve into the appearance of CPPD on ultrasound, based on the latest research findings, passing through its pathogenesis, and focusing on machine settings and ultrasound scanning techniques, providing some tips and tricks to facilitate accurate CPPD recognition in the most frequently affected sites.

1. Introduction

Musculoskeletal ultrasound has gained a central role in characterizing calcium pyrophosphate crystal deposition (CPPD) during the last decade, owing to significant advancements in technology and the growing body of supportive evidence in the literature. It is widely recognized that ultrasound offers several advantages over other imaging modalities for CPPD: it is safe, as it does not involve radiation exposure; feasible, allowing for the examination of multiple anatomic areas in a relatively short time; and it boasts a high diagnostic accuracy and reliability [1]. Moreover, its ability to assess inflammatory activity and joint damage directly at the bedside during patient visits, as well as its capability to safely and reliably guide the aspiration of synovial fluid (even small amounts) or the administration of medications, have significantly contributed to enhancing its value in rheumatological practice. The importance of ultrasound in CPPD diagnosis is further highlighted in the 2023 ACR/EULAR classification criteria for CPPD disease [2], where ultrasound evidence of CPPD in symptomatic joints, as well as the presence of CPPD in peripheral joints on ultrasound, regardless of symptoms, are considered in the scoring criteria and given a considerable weight.
On the other hand, one of the most important issues regarding imaging, and especially ultrasound, is the validation of internationally accepted and standardized imaging protocols [3]. The progress made by the OMERACT ultrasound working group—CPPD subgroup has been critical for developing validated ultrasonographic definitions for diagnosis and a standardized scoring system for monitoring CPPD extent [4,5,6,7]. However, despite the efforts to standardize ultrasound practice in CPPD, there are still limitations and technical issues which could potentially lead to misdiagnosis. It should be kept in mind that ultrasound, while valuable, does have some intrinsic limitations, mainly related to difficulties in accessing some anatomical areas, and it is still considered one of the most “operator-dependent” techniques, because a correct use of ultrasound requires mastery of acquisition techniques and adequate knowledge of the pathogenetic and clinical features of the disease under examination to correctly search and interpret the ultrasonographic findings [8].
In this review, we provide a brief insight into the pathogenetic mechanisms of CPPD and then a focus on the identification of Calcium Pyrophosphate Crystals (CPP) on ultrasound, with particular attention given to the optimization of crystal visualization through appropriate machine settings and scanning tips and tricks.

2. Crystal Formation and Deposition in Joints: Brief Review

The complex process of articular cartilage calcification remains largely unknown. Most studies propose that CPPD is a result of a systemic pro-calcifying predisposition that impacts both peripheral and axial joints, extending beyond the cartilage environment [9,10], affecting also other joint structures and periarticular tissues, including tendons, ligaments, the synovial membrane, and joint capsules. In contrast to gout, which is associated with elevated serum urate levels, CPPD (at least in the sporadic forms) does not show abnormal serum phosphate or calcium levels, indicating that the anomalies responsible for CPP depositions occur at the joint level. Several factors have been identified as potential contributors to this phenomenon, including genetics, aging, modifications in the extracellular matrix, altered properties of articular cartilage secretory vesicles, an imbalance between substances that inhibit calcification and those that promote it, disturbances in the metabolism of extracellular inorganic pyrophosphate (PPi) and phosphate (Pi), and alterations in chondrocytes differentiation [11].
Histologic studies have suggested that CPP crystals are primarily formed within the cartilage located near the chondrocytes, typically in the extracellular matrix [12]. Extracellular PPi plays a central role in CPP crystal formation, as an excess of PPi levels can lead, under optimized conditions, to CPP crystal formation through the complexation of PPi with calcium [3,13]. High local levels of calcium and alterations in the extracellular cartilage matrix are also likely to contribute to CPP deposition [11]. Extracellular PPi can derive either from the breakdown of adenosine triphosphate (ATP), wherein ectonucleotide pyrophosphatase phosphodiesterase 1 (ENPP1) enzymatically releases pyrophosphate [14], or it can be directly secreted from chondrocytes into the extracellular milieu by a transmembrane protein highly expressed in chondrocytes, the ankylosis human protein (ANKH) [15]. Gain-of-function mutations of the ANKH have been observed in individuals with familial CPPD disease [16], and ANKH up-regulation may also occur secondarily in the setting of cartilage damage, thereby promoting CPP crystal formation [15]. As previously mentioned, the amount of extracellular ATP influences the levels of extracellular PPi, and, consequently, CPP crystal formation; a significant amount of ATP is generated in response to mechanical loading and chondrocyte stress and injury [17], suggesting a role of articular degeneration on CPPD pathogenesis.
CPP crystals typically appear as rhomboid or rod-shaped structures with a size of 1–20 µm. Once formed in the tissues, they may shed into the synovial fluid, where they get involved in several inflammatory processes through various mechanisms, for example, by activating the NLRP3 inflammasome or inducing neutrophil extracellular traps (NETs) [18]. They can also interact with phagocytic cells, resulting in the release of cytokines and thus causing a more subacute inflammatory response [19]. CPP crystals have also been implicated in chronic joint damage and worsening of osteoarthritis (OA) due to their persistent inflammatory effects [11]; this notion is supported by the observation that CPPD patients often exhibit degenerative changes in non-weight-bearing joints (such as the metacarpophalangeal joints and the wrist), which are frequently spared in classic OA. The presence of CPP crystals in tissues can further alter the normal biomechanical properties and overall joint integrity, hastening the progression of joint damage [20]. However, a significant gap in our understanding of CPPD pathogenesis remains, primarily due to the absence of animal or transgenic models that mimic CPPD.
The formation of CPP crystals primarily occurs in hyaline and fibrocartilage, or in regions of chondroid metaplasia [21]. Fuerst and colleagues reported for the first time that hyaline cartilage (HC) calcification was constantly present in patients with end-stage OA undergoing total knee replacement, with BCP crystals detected in all patients, whereas CPP crystals were detected in 40% of cases [22]. Interestingly, the two types of crystals were rarely found together in the same zone of the cartilage [22]. This observation can be explained by the balance between PPi and Pi metabolism; while excess PPi promotes CPP formation, low levels inhibit CPP and favor BCP deposition [23]. According to a radiological study by Neame et al., the most-affected structure in CPPD was meniscal fibrocartilage, in 95% of cases, while only 45% showed calcification in HC and 30% in joint capsules or the synovial membrane [24]. The exact mechanism underlying crystal deposition is quite controversial. Ultrasonographic findings indicate that CPP crystals preferentially deposit in the middle layer of HC or fibrocartilage [25]. Additionally, studies utilizing micro X-ray diffraction have demonstrated the presence of CPP crystals in the intermediate cartilage layer [26]. However, recent histological investigations have proposed a different perspective, suggesting that they are mostly found in the superficial layer of cartilage [27]. Moreover, there is some evidence suggesting that CPP crystals can also deposit over the cartilage, leading to the so-called “pseudo double contour” (pseudoDC) sign on ultrasound [28], which was first described in 2009 [25], and subsequently confirmed by studies revealing a prevalence from 7% to 20% and a sensitivity of 78.9% in CPPD [29,30,31,32]. The most plausible explanation for this phenomenon comes from a cadaver study by Filippou et al., which highlighted that CPP crystals do not deposit on the HC, similar to gout’s DC, but rather, they can deposit in the capsule/ligaments located just above the HC [28]. Another explanation for the pseudoDC involves the “shedding theory”, suggesting that crystals shed into the synovial space and then deposit over the cartilage surface [25]. Much less is known about the mechanisms of deposition on fibrocartilage, the synovial membrane, ligaments, and tendons, indicating the need for future studies to address this gap and to gain a comprehensive understanding of this complex process.

3. Ultrasound Definitions for Crystal Identification in Tissues

The work carried out by the OMERACT ultrasound working group—CPPD subgroup over the last 10 years has been crucial for the development of validated and standardized ultrasound definitions for CPPD that can be effectively used in clinical practice and research. This effort has played a pivotal role in unifying ultrasound terminology, leading to substantial improvements in patient management within clinical settings and facilitating result comparisons in research studies. In comparison to other rheumatological diseases, we can confidently assert that in CPPD, despite its still being a neglected disease, remarkable progress has been made on the role of ultrasound for its nosological characterization.
OMERACT defines CPP deposits based on their shape, echogenicity, localization, and behavior during dynamic assessment. CPP crystals are localized within different anatomical structures, and appear as hyperechoic deposits, exhibiting an echogenicity similar to the bone cortex, without creating acoustic shadowing. In fibrocartilage, HC, and synovial fluid, they present as deposits of variable size and shape, while in tendons, they appear as multiple linear deposits parallel to the tendon’s fibers and not continuous with the bone profile. They typically remain fixed, and, on dynamic scanning, they move together with the structure they are located in [4,5].
During the validation process, the definitions demonstrated a good reliability in only two joints, the knee and the wrist, and specifically in only two structures, HC and fibrocartilage (knee menisci k: 0.68, knee HC k: 0.58 and wrist triangular fibrocartilage complex (TFCC) k: 0.82) [4,5]. Other joints and structures, including tendons, ligaments, capsule, and synovial fluid, show low inter-reader agreement, although intra-reader agreement was consistently substantial for all sites. This suggests that each sonographer applied the definitions consistently, but differed from other sonographers except for meniscal fibrocartilage, femoral HC, and TFCC of the wrist. However, it also indicates that the definitions can be reliably used by the same operator. Nonetheless, when conducting a clinical study, it becomes essential to ensure consistent interpretations among different readers through inter-reader training and agreement testing, especially for tendons, ligaments, capsule, and synovial fluid.
Subsequently, the definitions were tested for criterion validity at the knee level, using a rigorous reference standard such as histology [6], and demonstrated to be accurate for CPPD diagnosis (accuracy of 75%), with sensitivity and specificity that range from 0.71 to 0.88 and 0.68 to 0.91, respectively, across different sites. Menisci, being the structures most commonly affected by CPPD [24], demonstrate higher sensitivity, while HC showed higher specificity.
The burden of CPP deposition can be assessed using a semiquantitative scoring system, recently released by the OMERACT ultrasound working group—CPPD subgroup [7]. The ultrasound scoring system evaluates the presence of CPPD in the knees (menisci and HC) and wrists (TFCC) on a scale from 0 to 3, with grade 0: no findings consistent with CPPD, grade 1: ≤3 single spots or 1 small deposit, grade 2: >3 single spots or >1 small deposit or ≥1 larger deposit occupying ≤50% of the structure under examination in the reference image, and grade 3: deposits that occupy more than 50% of the structure under examination in the reference image. The score showed almost perfect intra- and inter-reader reliability on static images (k 0.90 and 0.84, respectively), and a substantial intra- and inter-reader reliability on patients (k 0.72 and 0.66). This could be crucial to ensure homogeneity in clinical research and it could offer valuable insights into CPPD pathogenesis and natural history.
Although ultrasound has proven to be an excellent tool for CPPD identification, with validated and reliable definitions and a scoring system that can assess the extent of deposition and potentially enhance patient monitoring, operator training and a certain degree of expertise in acquisition techniques remain fundamental for the proper use of this tool in both clinical practice and research.

4. Scanning Technique and Machine Setting Optimization for Crystal Visualization

4.1. General Considerations

As discussed, according to the OMERACT definitions, CPP deposits appear hyperechogenic, similarly to the bone profile, and typically do not create posterior acoustic shadowing. This last aspect has been recently demonstrated in a proof-of-concept study involving the scanning of phantoms with increasing concentrations of CPP crystals, and it was found that these crystals did not generate posterior shadowing, in contrast to other calcium crystals, which exhibited beam attenuation at increasing concentrations [33]. The exact explanation of this phenomenon remains unclear, but it is probably related to the three-dimensional structure of the crystals, which may result in lower acoustic impedance and thus less attenuation of the ultrasound beam.
On the other hand, the echogenicity of the deposits is more difficult to assess, as it depends both on machine settings and the scanning technique. To provide a reference standard, the OMERACT group suggested to compare the echogenicity of the deposit to that of the bone profile, as they should display similar echogenicity. However, this approach may present several drawbacks. Of note, the echogenicity of the bone profile is not uniform and, in some cases, may appear iso- or hypoechoic. The bone profile, in fact, exhibits some degree of anisotropy, and if the ultrasound beam is not perfectly perpendicular, the reflexed beam may not be captured by the probe, resulting in anisotropy. This is known as the bone pseudo-defect artifact. Currently, it has not been established if CPPD could present different degrees of echogenicity depending on the angle of insonation, but it would be wise to keep in mind some degree of elasticity when applying the definition, as CPP deposits also may change their echogenicity slightly, depending on the probe position. A practical rule could be to compare the echogenicity of the deposit with a portion of bone ideally located beneath the deposit and insonated exactly at a 90-degree angle (resulting in the bone appearing horizontally on the screen). In case such an image is not feasible to obtained, for example, when CPP deposits are located deep in the meniscus, then priority should be given to the angle of insonation that maximizes the echogenicity of the deposit, comparing it with a portion of bone that is as perpendicular as possible to the US beam within the same frame.

4.2. How to Set the Machine in Order to Enhance Crystal Appearance

Many sonographers are used to adopting the standard presets of the machine during scanning, which are typically adequate for general purposes of ultrasound. However, when it comes to identifying crystals, some fine tuning of the settings may improve the correct identification of CPP deposits.
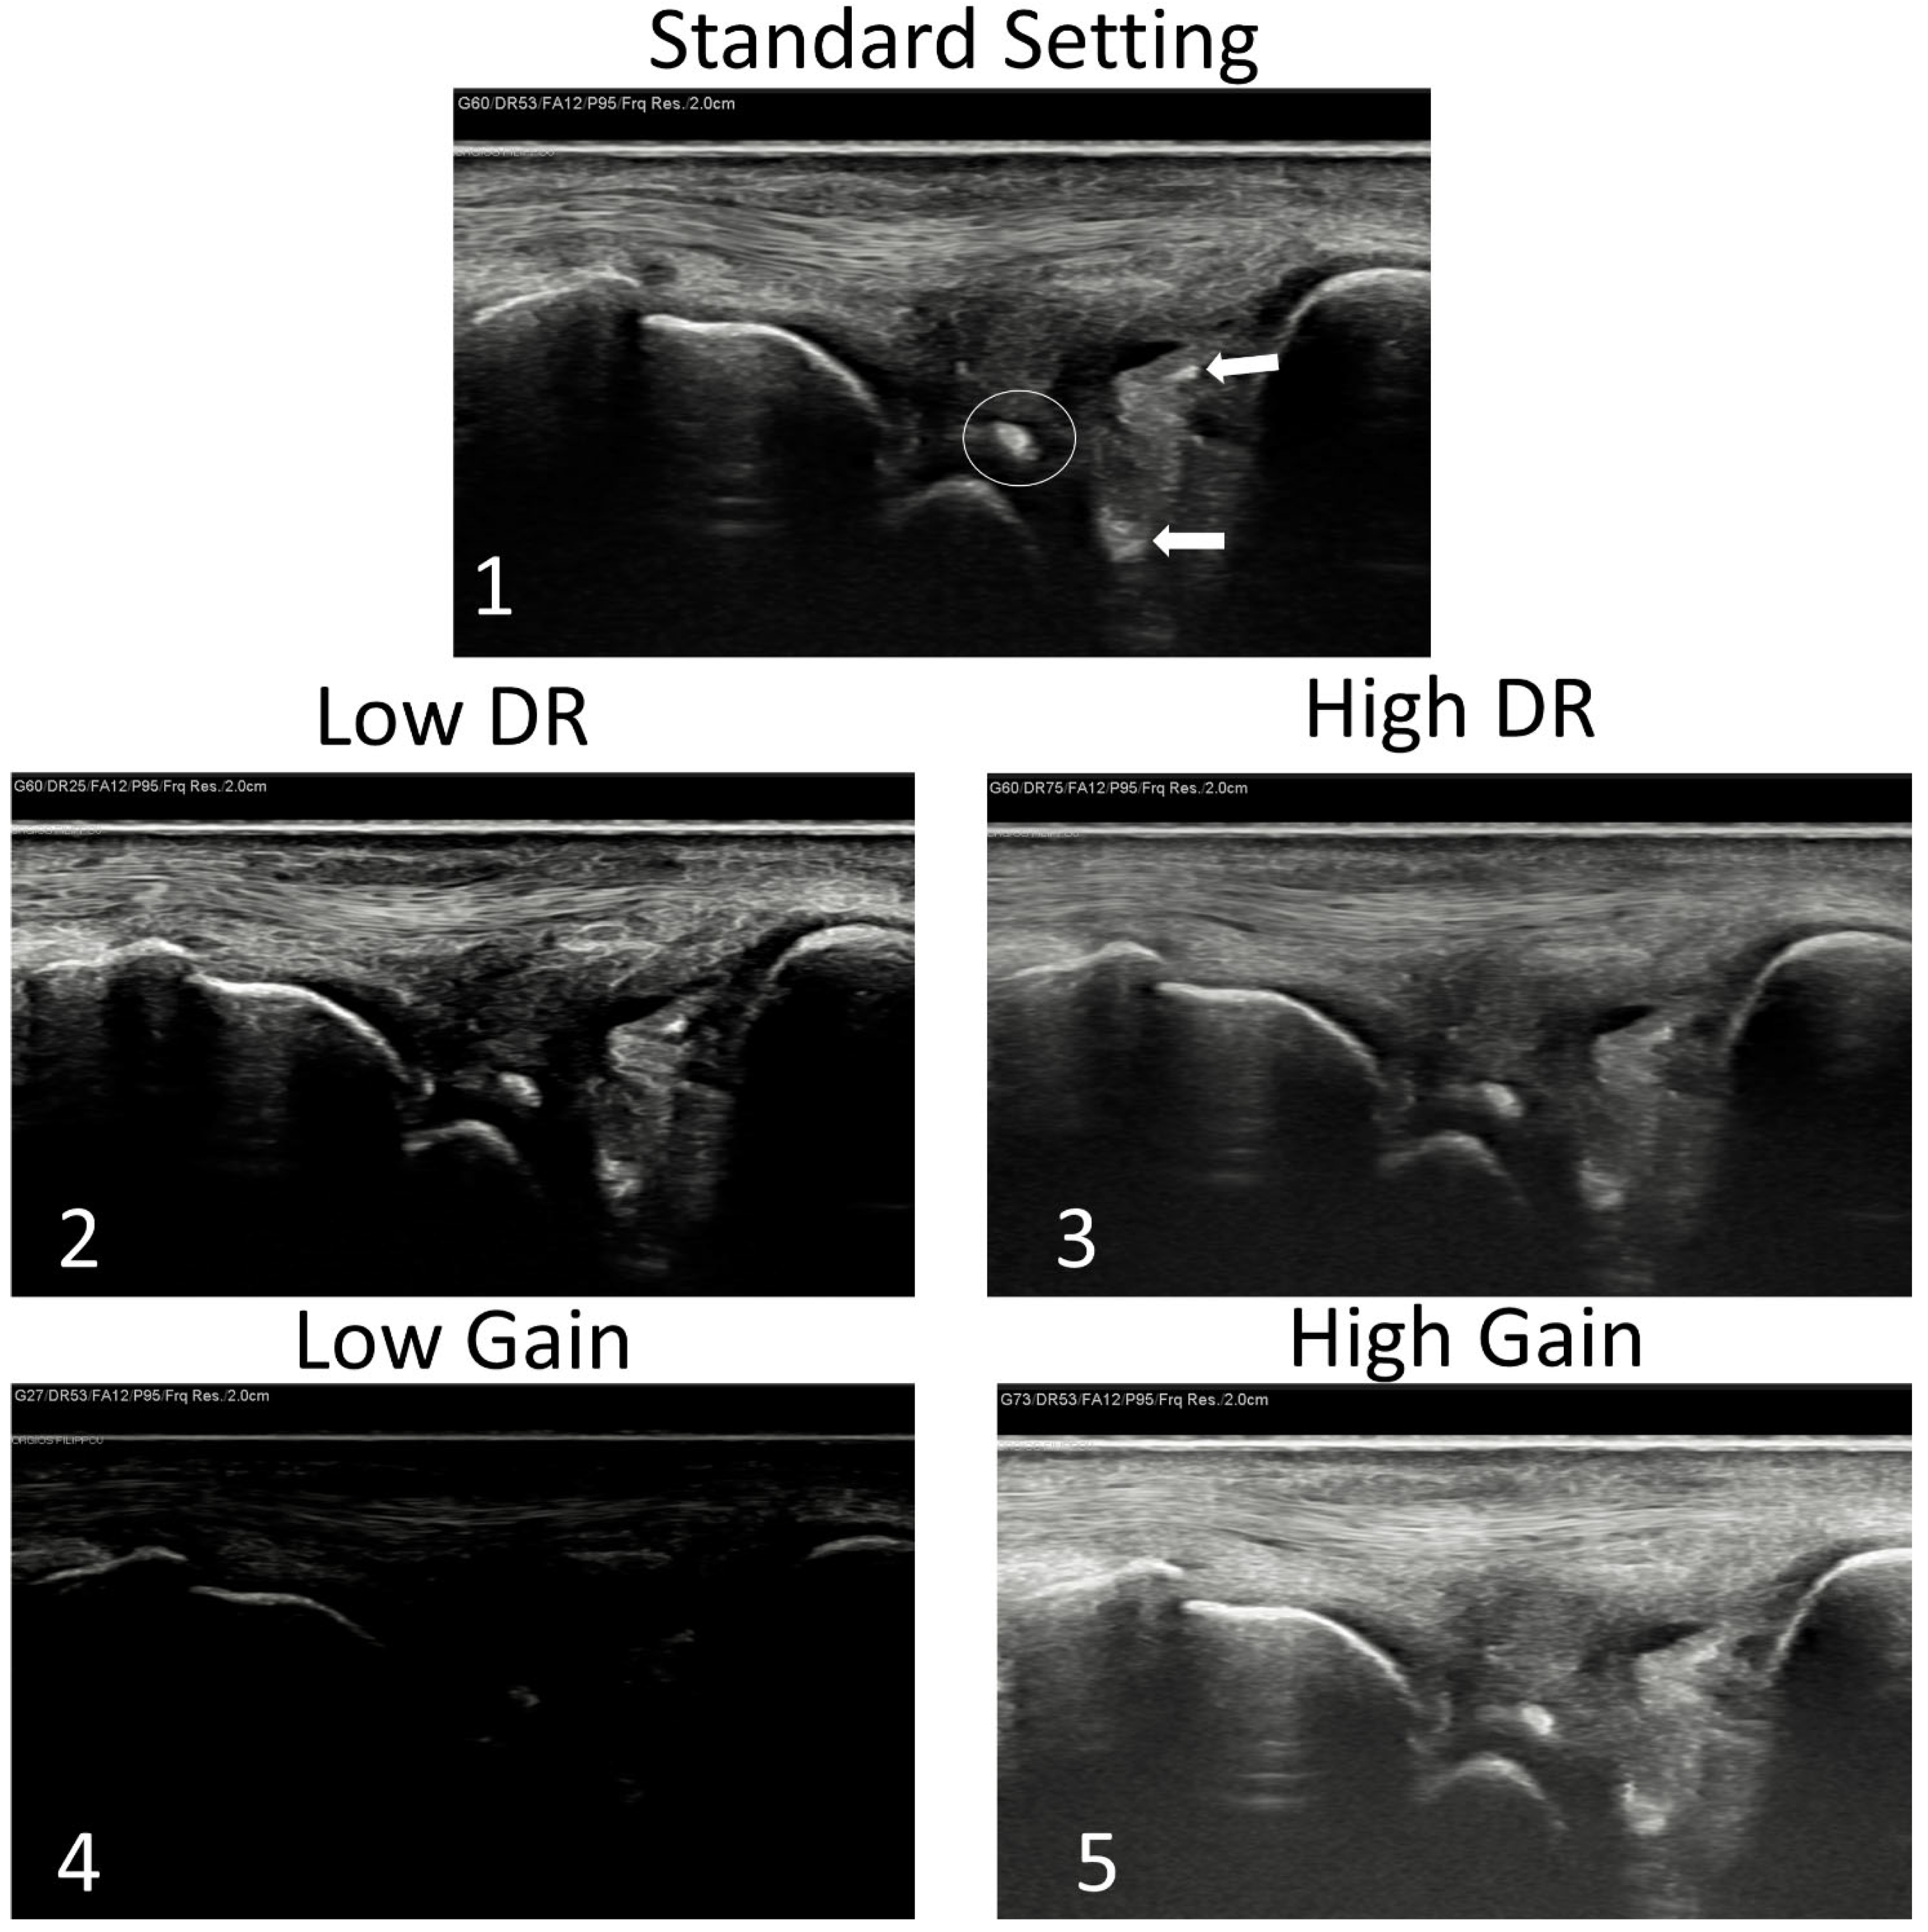
Two setting parameters that can be easily adjusted and can help in correctly identifying CPPD are the gain and the dynamic range. Gain is an algorithm that regulates the amplification of the reflected ultrasound waves captured by the probe, and thus determining the brightness of the signals on the screen [34]. A higher gain value will result in a very bright image, while a lower gain setting will produce a darker image. On the other hand, the dynamic range (DR) determines the echo strengths displayed on the monitor and represents them as various shades of gray. In simpler terms, reducing the DR yields a more contrasted image, while increasing it results a final ultrasound image having a broader range of grey shades but with lower overall contrast [34].
In order to better identify CPP deposition, an image with high contrast is desirable, meaning that a lower DR could improve the ability to distinguish crystals from the surrounding tissues. When setting a lower DR, we force the machine to place a certain signal in a scale with a lower number of gray shades; thus, if that signal is close to the bone signal, it will appear brighter and similar to the bone, while a signal similar to the soft tissues will appear darker. This kind of adjustment can be helpful in case of doubts on the echogenicity of the deposits. If, by lowering the DR, the deposition appears still bright and more similar to bone, there is a higher possibility that it is a CPP deposit. Conversely, if the suspected deposition becomes darker, the likelihood of it being a CPP deposit is reduced.
Gain alone, on the other hand, could increase or decrease the luminosity of the signals on the screen, but it will not alter the relative brightness proportions between different signals. This means that by increasing the gain, bone and CPP deposition will both appear brighter, but they will maintain the same “proportion” of brightness. Similarly, by decreasing the gain, the entire screen will appear darker, but the relative proportion of brightness between various tissues will not change. So, if a part of the screen appears white and similar to bone with a midrange gain and we decrease it, it will appear darker, with a similar brightness of the bone in the new setting also. This kind of adjustment could be useful for beginners, as it allows switching to a new kind of mindset where comparison of shades of grey becomes fundamental for identification of crystals (Figure 1).

4.3. Site-Specific Scanning Techniques—The Wrist

The wrist, and especially the TFCC, is frequently involved in CPPD [35] and is probably the most challenging area to scan. From the anatomical point of view, the main components of the TFCC are a triangular-shaped fibrocartilaginous disc that originates from the cartilage overlying the distal radius and inserts onto the fovea of the ulnar styloid process, and the dorsal and palmar radio-ulnar ligaments, which play a major role in the stabilization of the distal radio-ulnar joint and surround the disc. However, several other structures are included in the TFCC, such as the meniscus homologue (another fibrocartilaginous structure), the ulnar collateral ligament, and the lunotriquetral ligament. On the palmar side of the wrist, the ulnotriquetral and the ulnolunate ligaments further reinforce the TFCC [36]. This brief, though non-exhaustive, description of the TFCC makes immediately clear the complexity of the ultrasound examination of this area. The large number of ligaments are oriented in different axes and may exhibit varying levels of tension depending on wrist positioning. Additionally, the health status of the TFCC (previous lesions, microtraumas, wrist fractures, OA, and many other conditions) may create areas of hypo-, iso-, or hyperechogenicity that coexist in the same scanning plane. Even in normal conditions, the disc is not easily accessible by the ultrasound beam, as it is often hidden beneath the styloid. Moreover, the meniscus homologue located at the center of the TFCC presents an iso/hypoechoic aspect that is not easily distinguishable from the surrounding ligaments.
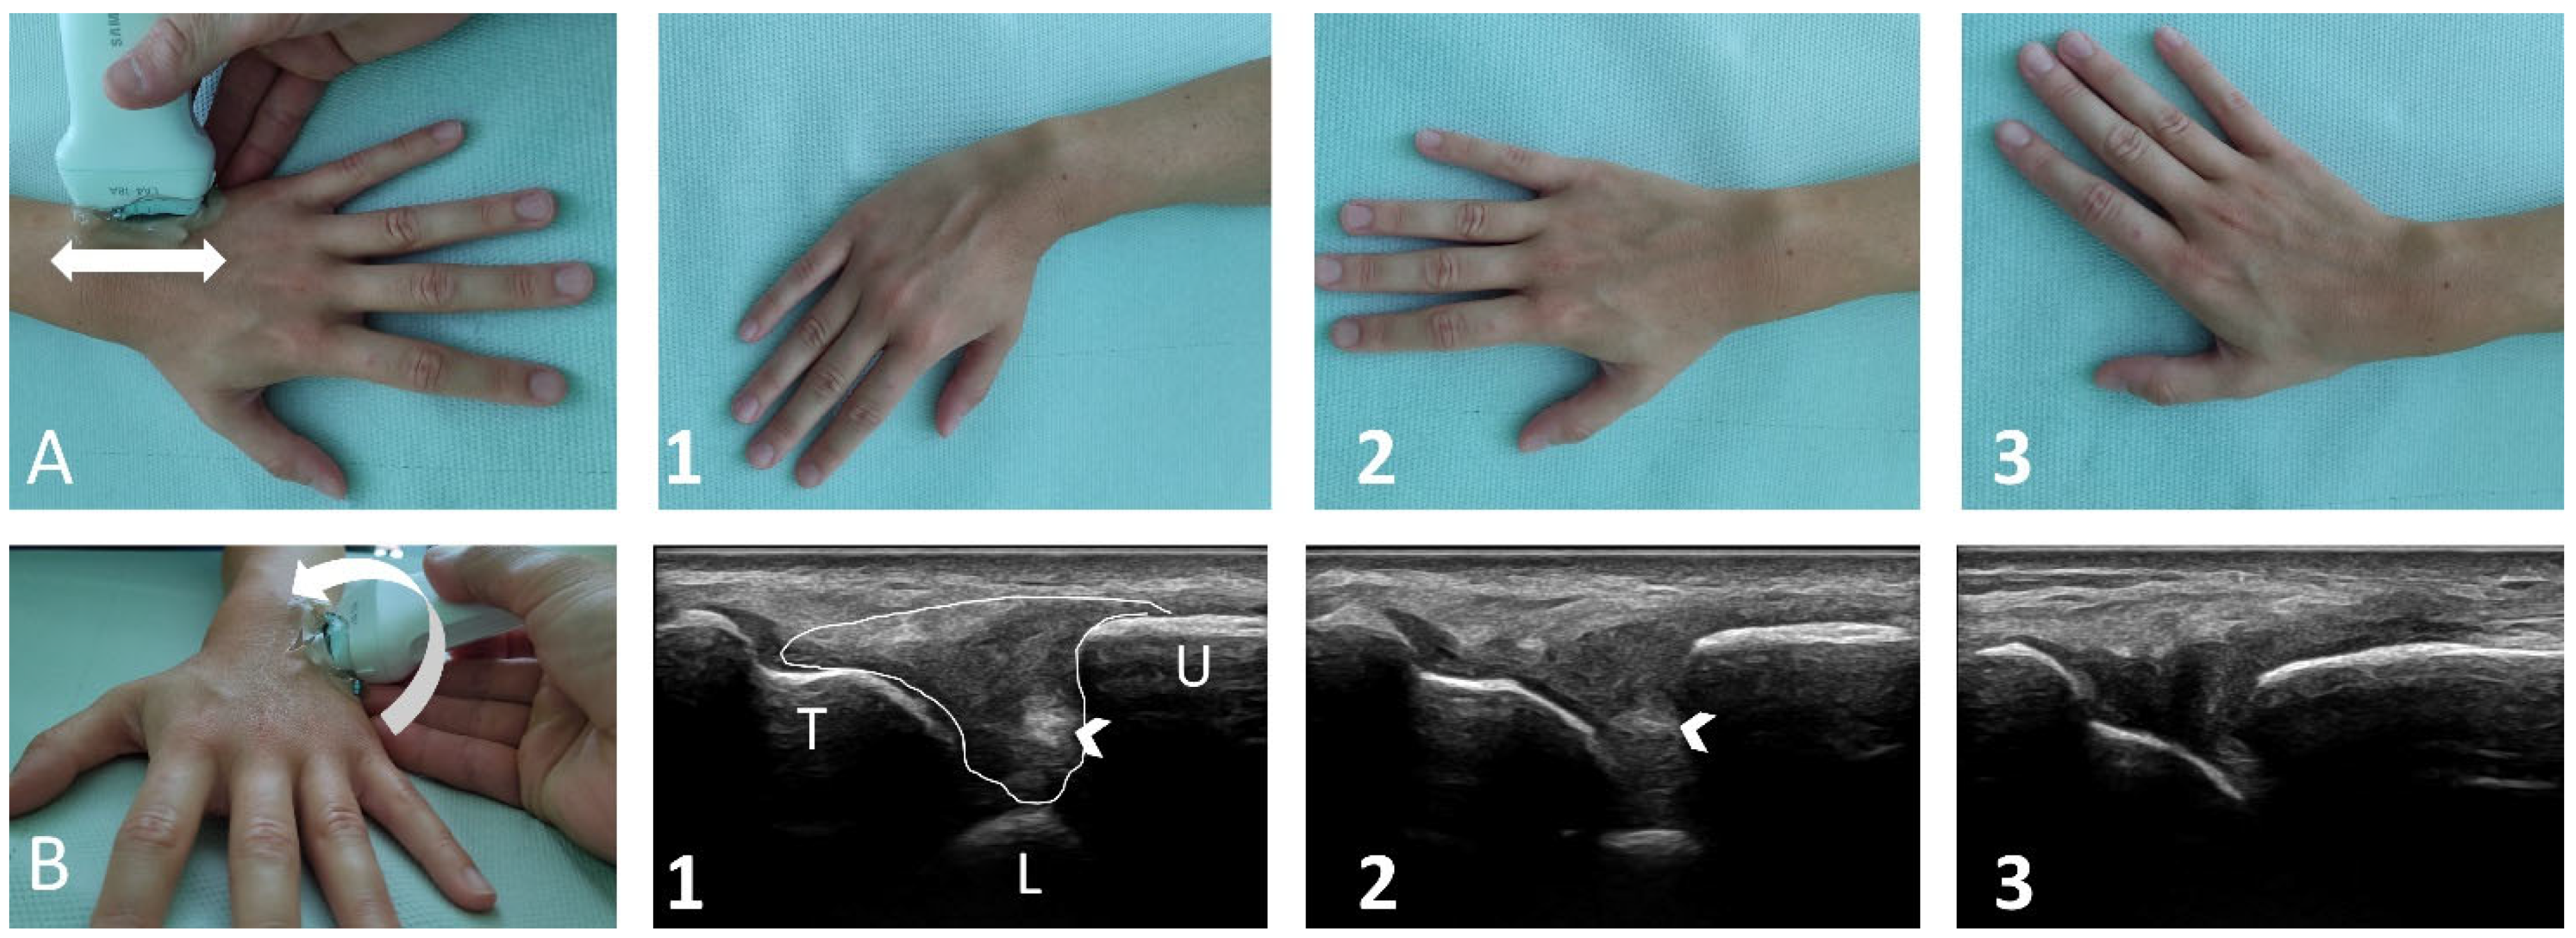
Taking into account these anatomical considerations, how can this area be effectively scanned? The TFCC should be scanned in both the longitudinal and axial planes by placing the probe on one side of the wrist and then sliding slowly to the opposite side without lifting it. During scanning, tilting movements should be made with the probe to identify areas exhibiting anisotropy, which typically correspond to ligaments. It is crucial to keep in mind always that calcium deposits do not present anisotropy. During scanning, the position of the wrist should also be modified by moving the hand in abduction or adduction to increase/decrease ligament tension, which may facilitate an easier distinction between hyperechoic collagen fibers and crystal deposits (
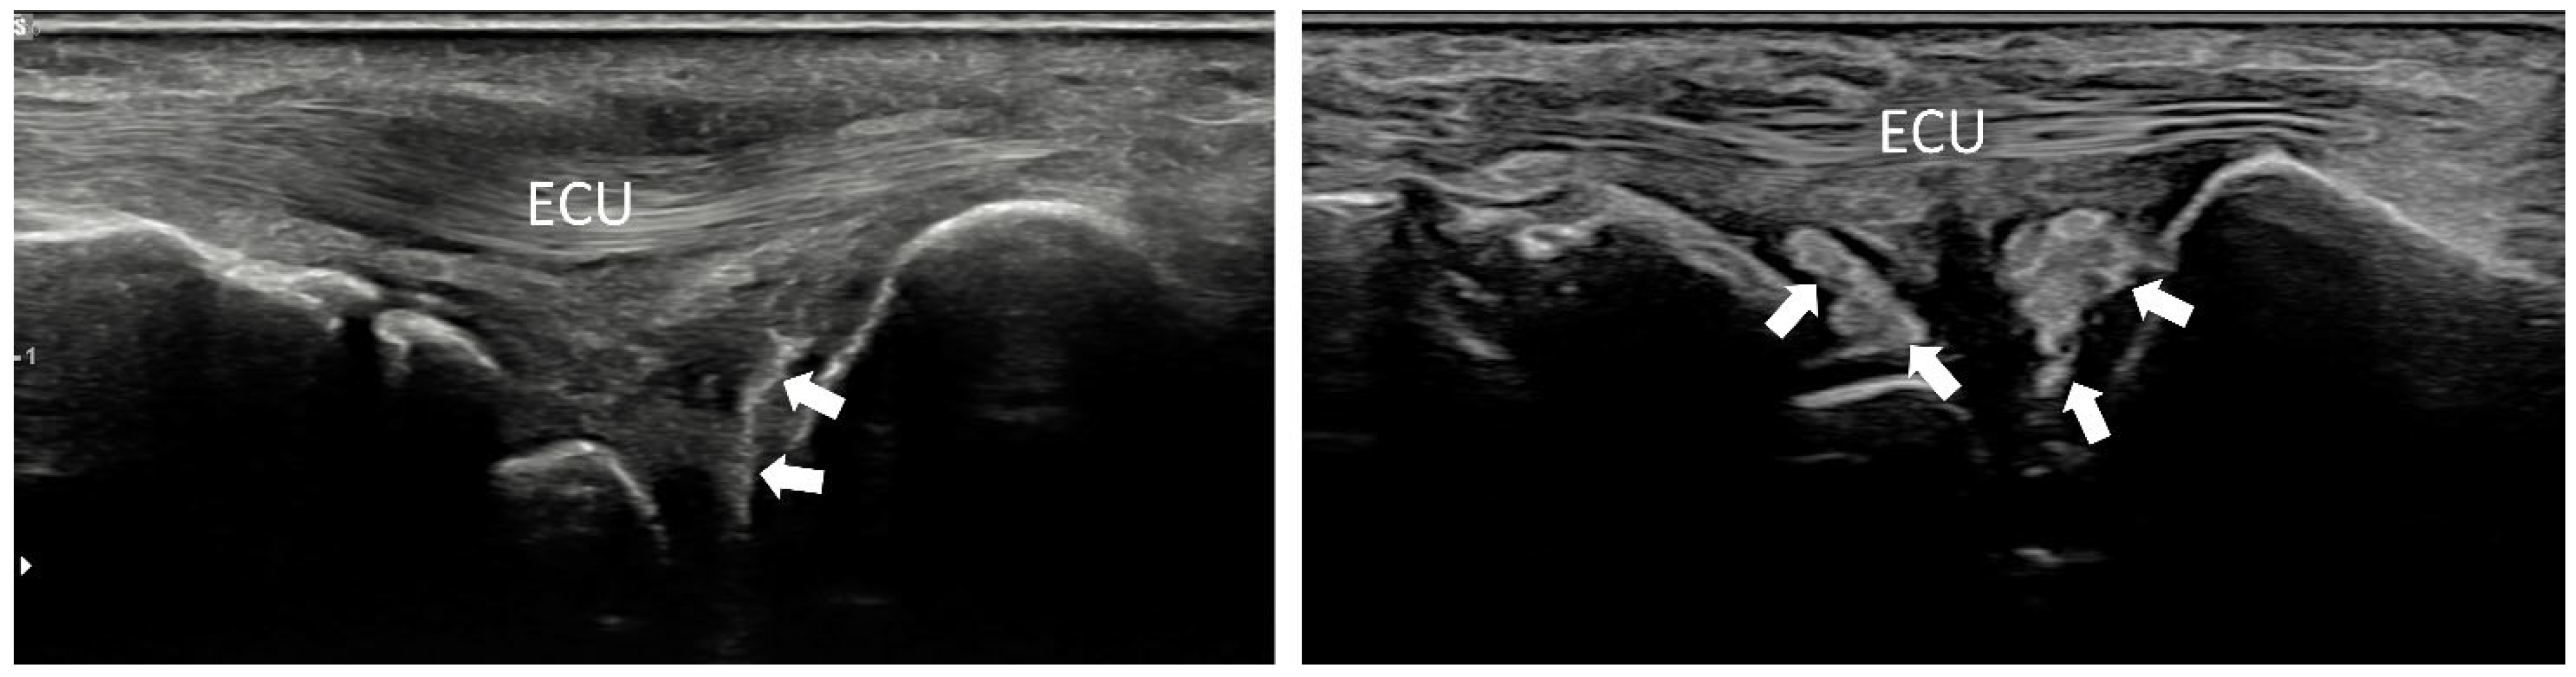
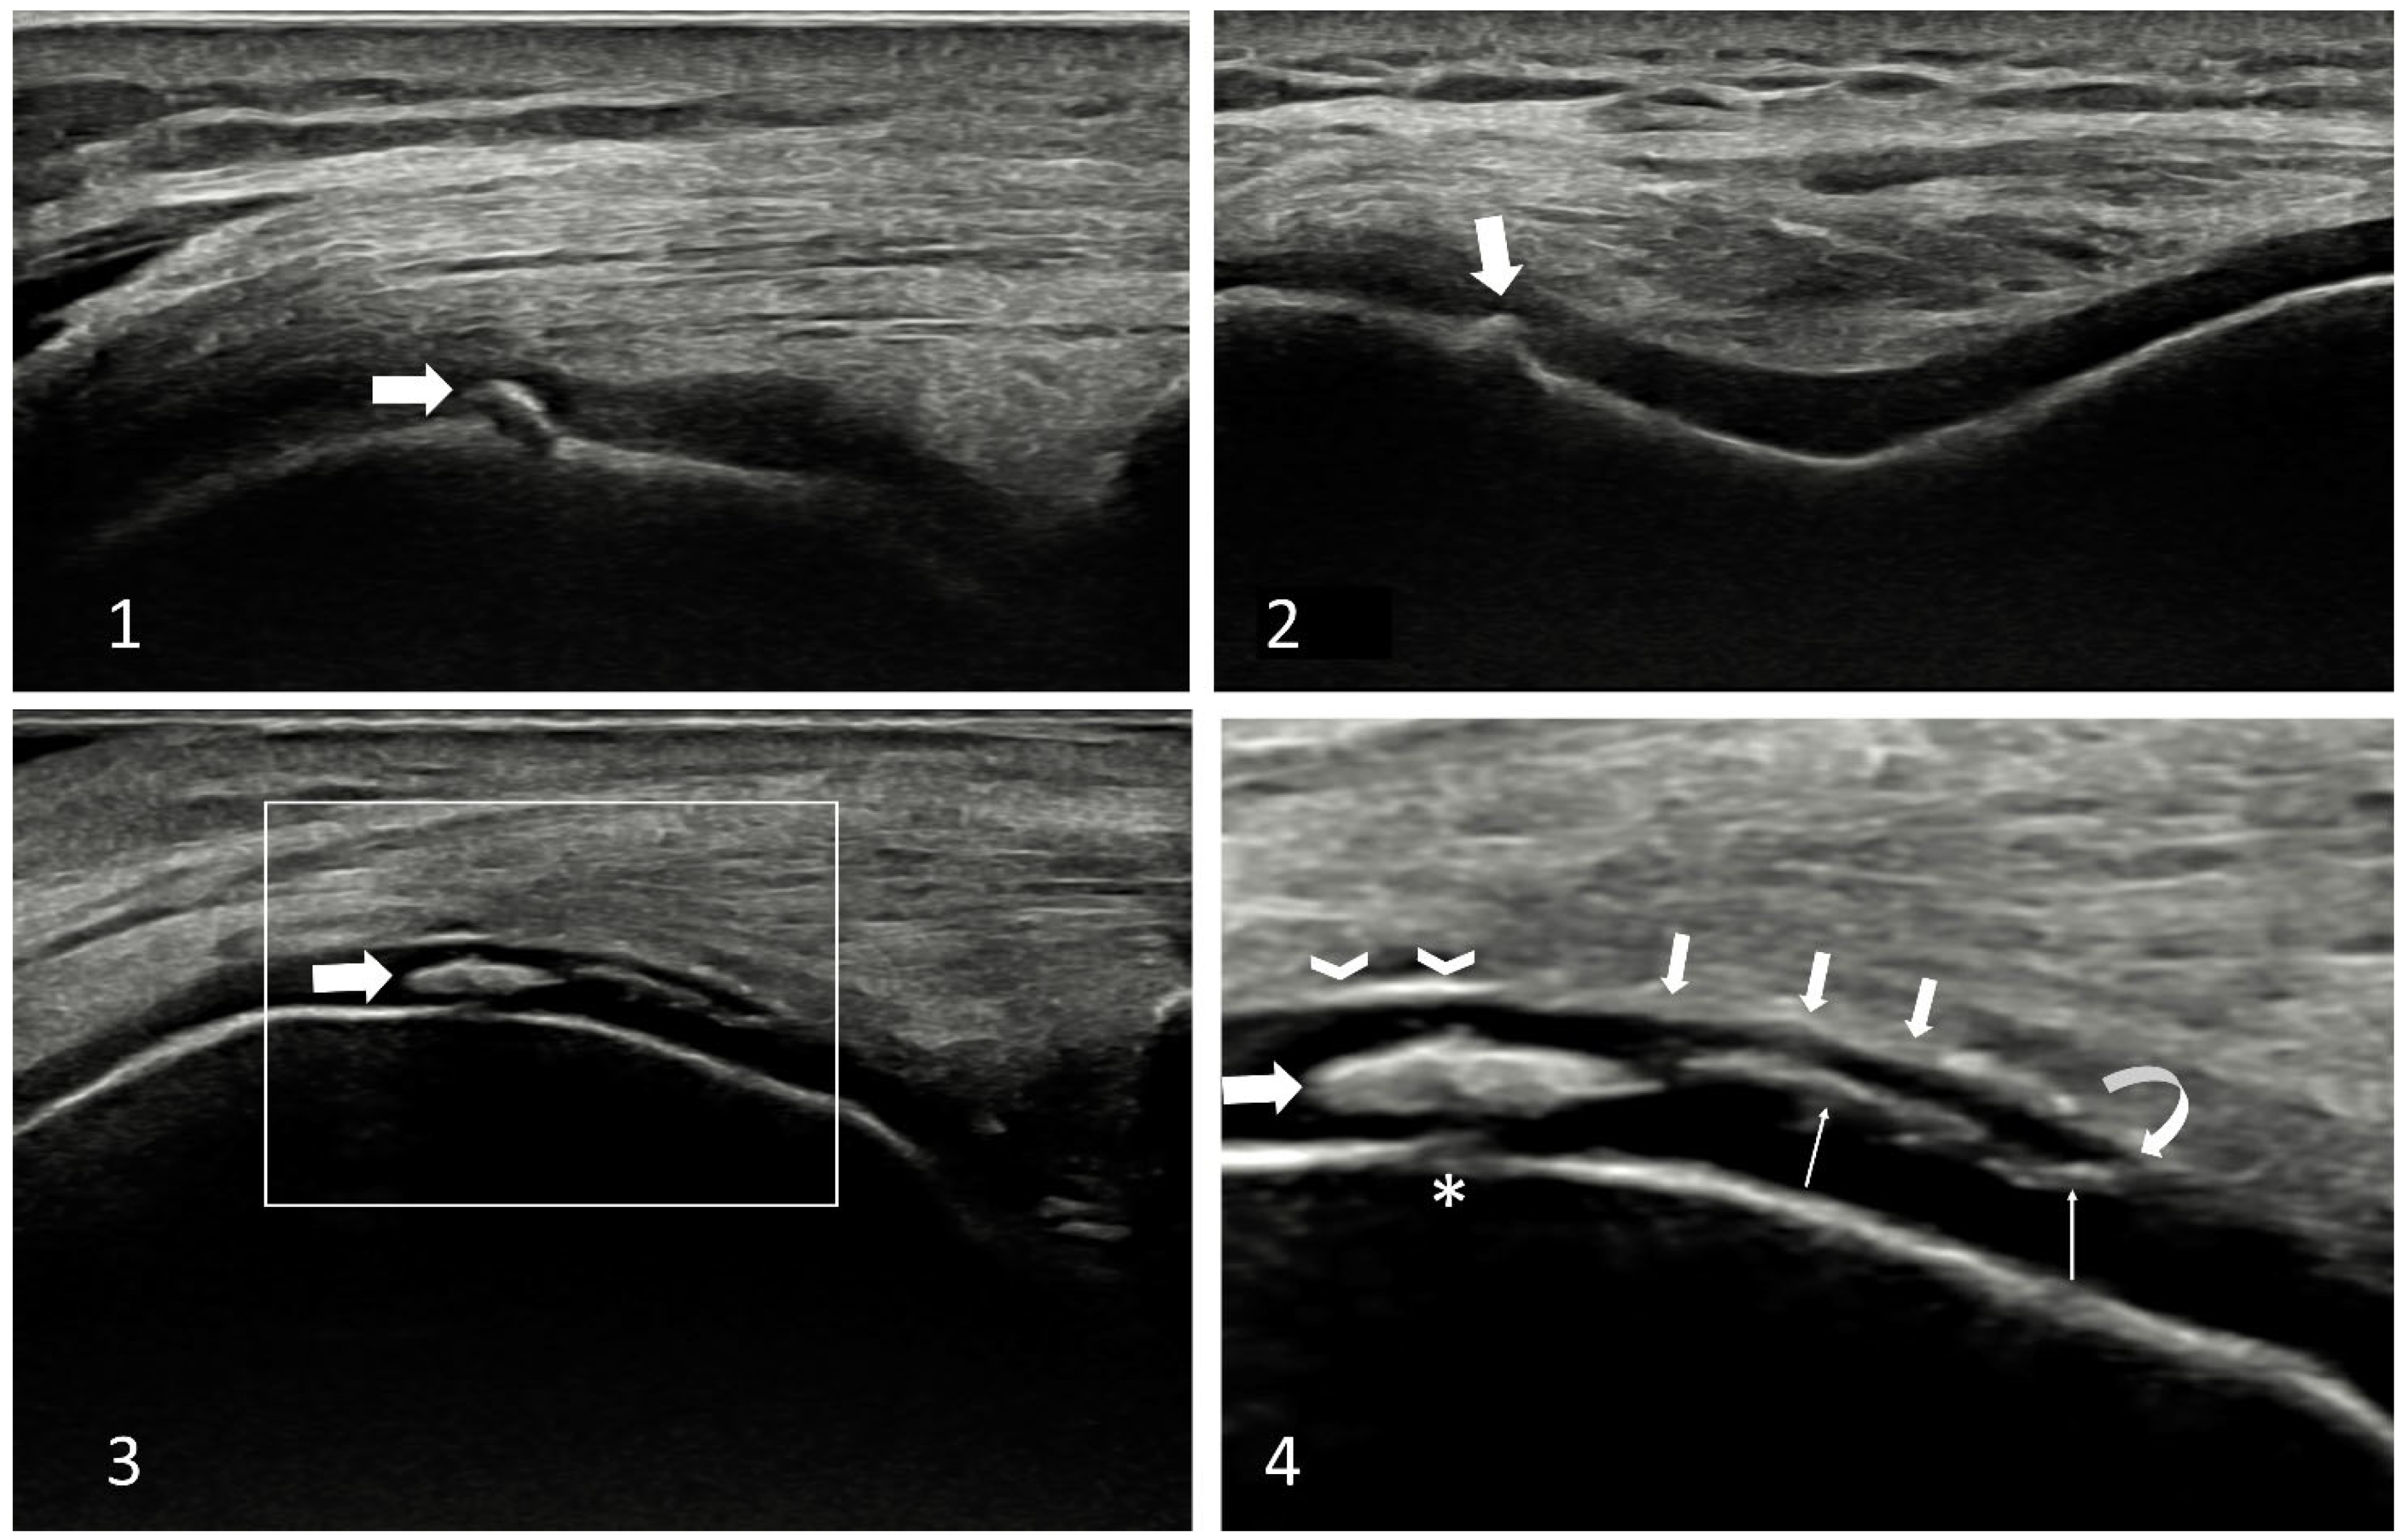
Figure 2). There is no standard location to identify CPP deposits, but generally, calcifications are located at the margins of the TFCC, both proximal and distal. On the proximal side, probably the fibrocartilaginous disc is the main site of deposition, and calcifications may appear as lines that go deep to the TFCC following the ulnar bone’s profile or as “cloudy” hyperechogenic deposition (sometimes inhomogeneous hyperechogenicity). On the distal side, calcifications are probably located within the ligaments (Figure 3). It is quite uncommon to find isolated deposits in the center of the TFCC where the meniscus homologue should be located. To the best of our knowledge, there is no explanation for this, but probably bio-mechanical factors could play a role.
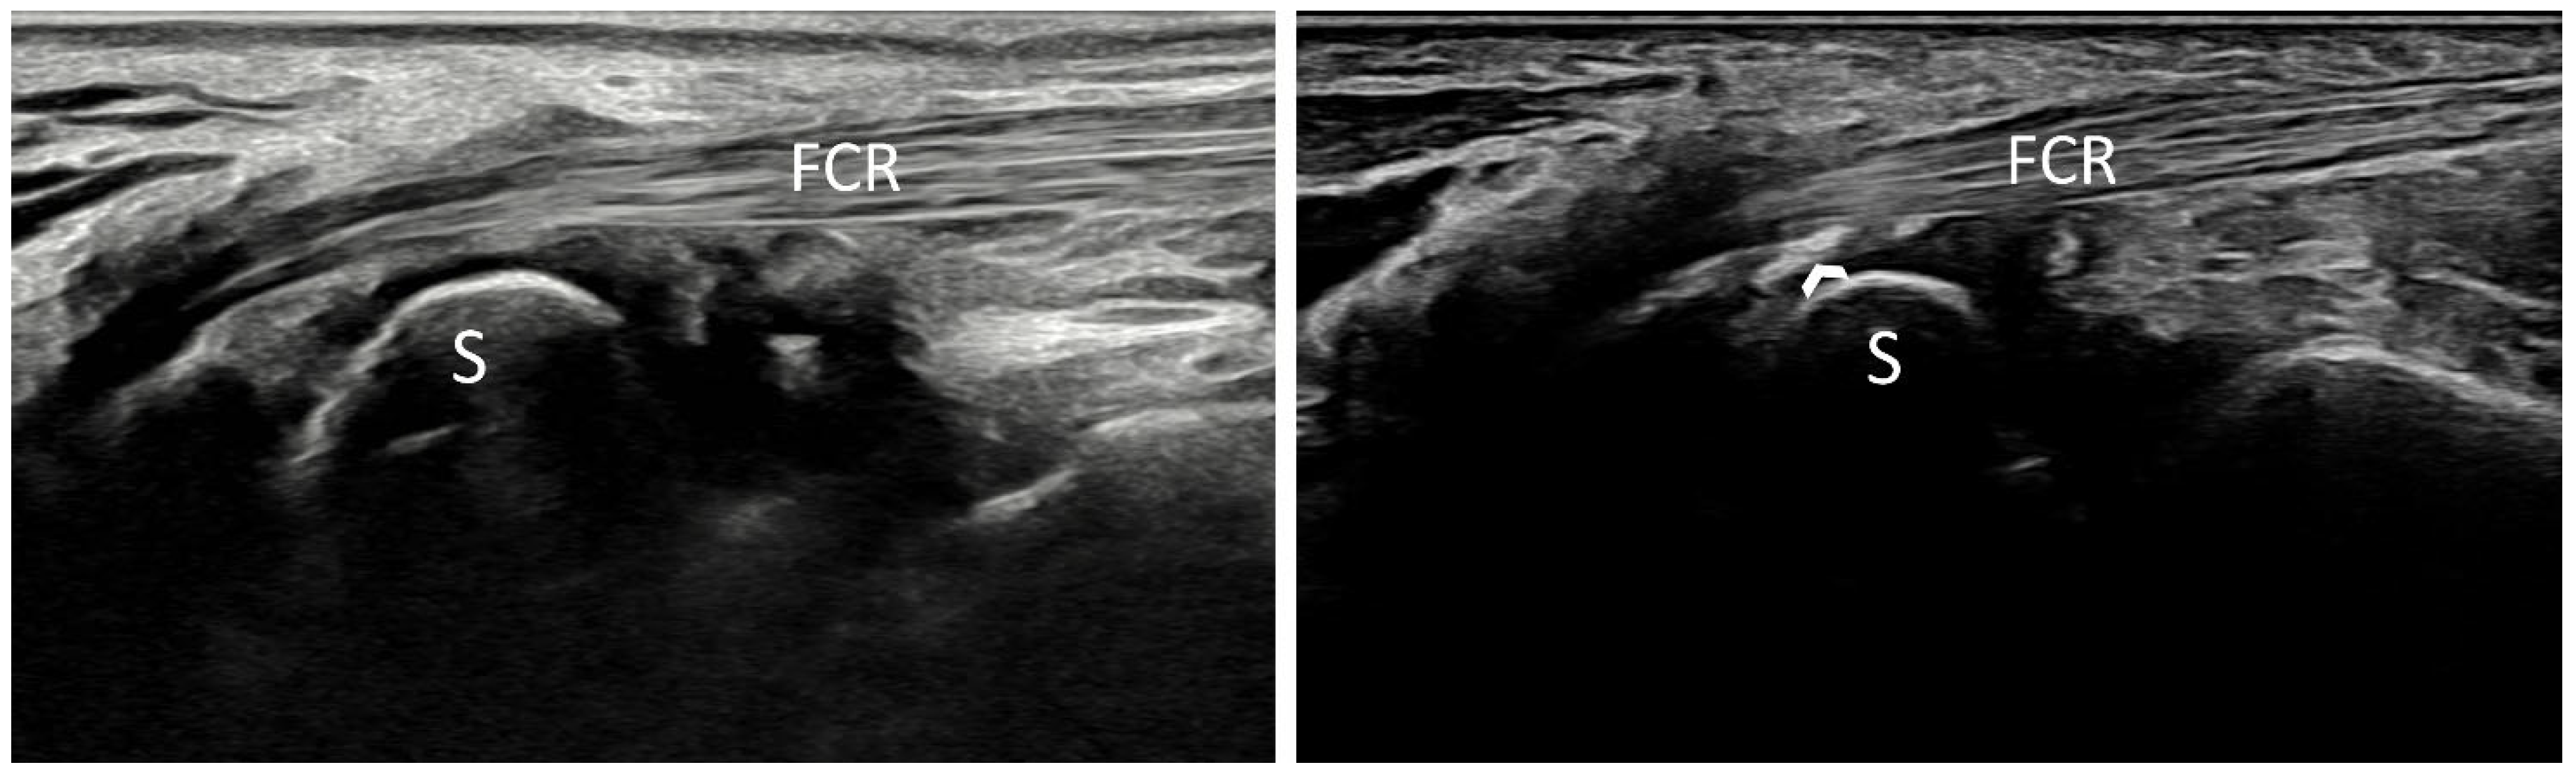
A second place where CPPD can be found is within the flexor carpi radialis tendon (FCR) fibro-osseous tunnel [37]. In this region, the FCR passes through a tunnel bounded on the radial side by the trapezium, the trapezial crest, and transverse carpal ligament on the volar side, and a retinacular septum connected to the transverse ligament on the ulnar side. At this site, the FCR is enveloped in a synovial sheath [38]. It is common to find CPP deposition both within the tendon and on the transverse ligament, in the portion above the trapezium crest. The anatomic explanation for this is not clear, but probably this site has also a fibrocartilaginous component, as described by McGonagle et al., being from the functional point of view a “synovio-entheseal complex” (SEC) [39] that could give origin to CPP deposition. The longitudinal view of the tendon at this point is quite easy to perform, and CPPD identification is facilitated by the natural anisotropy of the FCR that bends at that site to move deep down its insertion at the metacarpal bones (Figure 4). Short-axis views with tilting can easily demonstrate that hyperechoic deposits at that site do not present anisotropy, reinforcing the possibility of their being calcium deposits.
CPPD may also be found in other sites at the wrist. The scapholunate ligament is frequently involved, such as the volar aspect of the radiocarpal capsule [37,40], but in such cases, standard scanning [41] can be sufficient to identify deposition.

4.4. Site-Specific Scanning Techniques—The Knee

The knee is the most frequently, and probably also precociously, involved joint in CPPD [35]. CPPD is typically found in the meniscal fibrocartilage and in the HC of the femoral trochlea. Regarding the HC, the scanning technique is quite easy and is carried out with patient comfortably lying on the examination table with the knees flexed at the highest possible degree. In this position, a large portion of the HC of the femoral trochlea becomes uncovered by the patellar bone and can be easily accessible to ultrasound. Some pitfalls may occur in cases of advanced degeneration, damage, or thinning of the HC, as repairing processes may create hyperechoic interfaces that may mimic CPPD. The margins of the HC should be always searched with attention as, in these cases, they are frequently damaged, revealing these pitfalls (Figure 5). A second area where CPPD can be identified is the posterior aspect of the HC on both condyles. To examine this region, the patient should assume a prone position with the knees fully extended. CPPD deposits are most frequently encountered at the proximal part of the HC. However, not all patients can comfortably maintain this position, and the duration of the ultrasound examination may be extended, posing feasibility issues. Therefore, in our opinion, scanning this site should be reserved for cases where there is a strong suspicion of CPPD but other anterior knee sites have yielded negative results, or for research purposes.
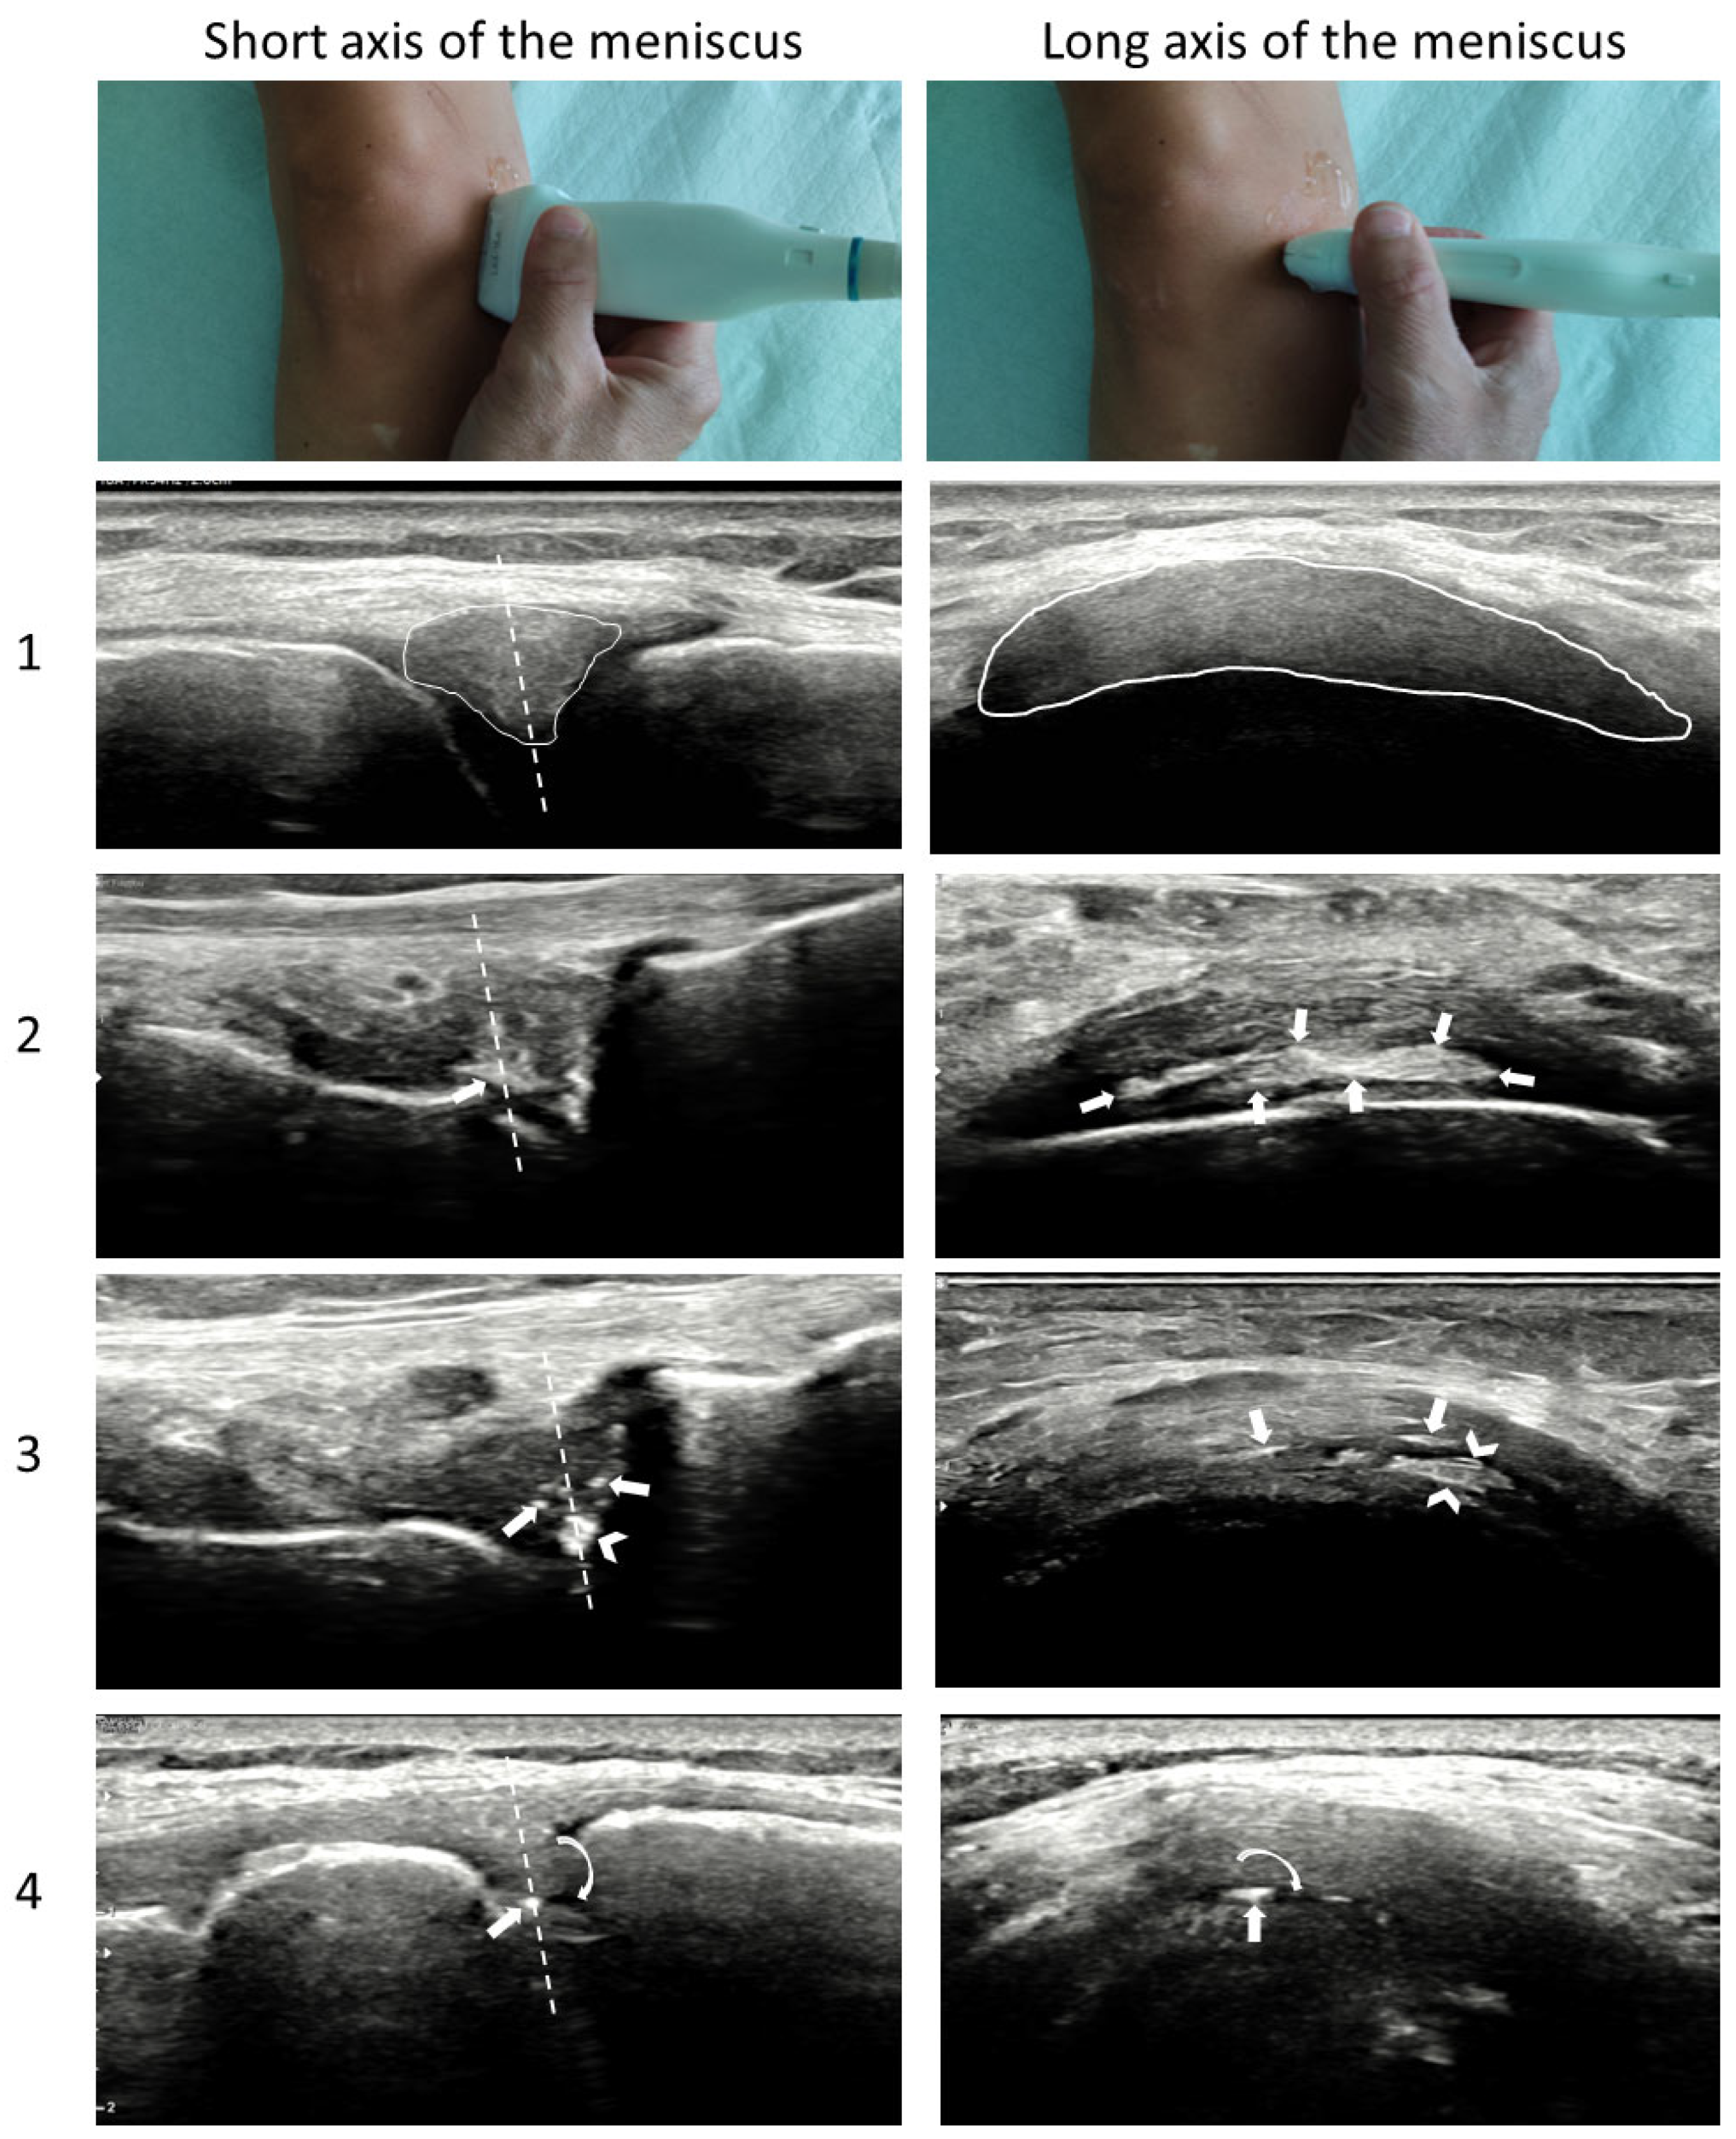
The menisci should probably be the first site to scan for CPPD identification as they are the most frequently involved site at the knee, often presenting bilaterally with both menisci involved [6]. The scanning technique is generally similar to that described for the TFCC, with the probe sliding from the anterior to the posterior part of the meniscus without lifting it, adjusting its inclination by slight and continuous tilting in order to enhance ultrasound beam penetration between the bones and improve meniscus visualization. Scanning should be carried out with the knee completely extended, and, in case of doubts, also with the knee slightly or moderately flexed. However, also in this case, there are some pitfalls to be aware of. One common trap is a small vessel that may run within the meniscus, especially on the lateral one, which can create posterior enhancement of the ultrasound beam, resembling CPP deposition. Using power Doppler in such cases can reveal the vessel and clarify the hyperechoic aspect beneath it. Another challenging scenario arises when scanning the meniscus in patients with severe OA, resulting in a reduced rim, meniscal protrusion, and advanced degeneration. In such cases, the echotexture of the meniscus can range from hypoechoic to partially or diffusely hyperechoic, or even with focal hyperechoic spots, which could resemble CPPD but may actually be due to reparative processes (scar tissue) or lesions of the meniscus with interfaces created by the penetration of synovial fluid/debris in the lesion space. In these cases, the axial scan of the meniscus could be helpful in distinguishing between these conditions [42]. The operator should display the meniscus in the center of the screen using a longitudinal view for the knee and then slowly rotate the probe to place it along the “long axis” of the meniscus. A crescent-shaped structure with mainly a fibrillar aspect should appear on the screen, representing the meniscus. CPPD deposition is more easily identified in this axis, as calcifications generally follow the orientation of the fibers, appearing elongated and hyperechoic, making them distinguishable from fibrous tissue or lesions/interfaces (Figure 6).
Finally, CPPD can also be found in the tendons of the knee, but previous OMERACT exercises revealed a very low reliability for CPPD identification in tendons and synovial fluid. Therefore, findings at these sites should be interpreted cautiously.

4.5. Site-Specific Scanning Techniques—Other Sites

CPPD is a systemic disease that can potentially involve every joint and extra-articular tissue where chondrocytes (or cells capable to differentiate in chondrocytes) are present. In a recent ultrasound study examining the prevalence of CPPD in several joints and anatomical structures [43], it emerged that hips and shoulders can be also frequently involved in CPPD.
In the hip joint, the anterior part of the acetabular labrum is easily accessible and is involved in 59.3% (at least one side) of affected patients. For scanning the anterior site of the hip, the EULAR scanning standardized procedures are sufficient [40] for correct visualization of the fibrocartilage, and no particular pitfalls have been observed by the authors in this area. Some expertise may be required only in cases of labrum lesions that could create hyperechoic interfaces within the fibrocartilage, resembling CPPD.
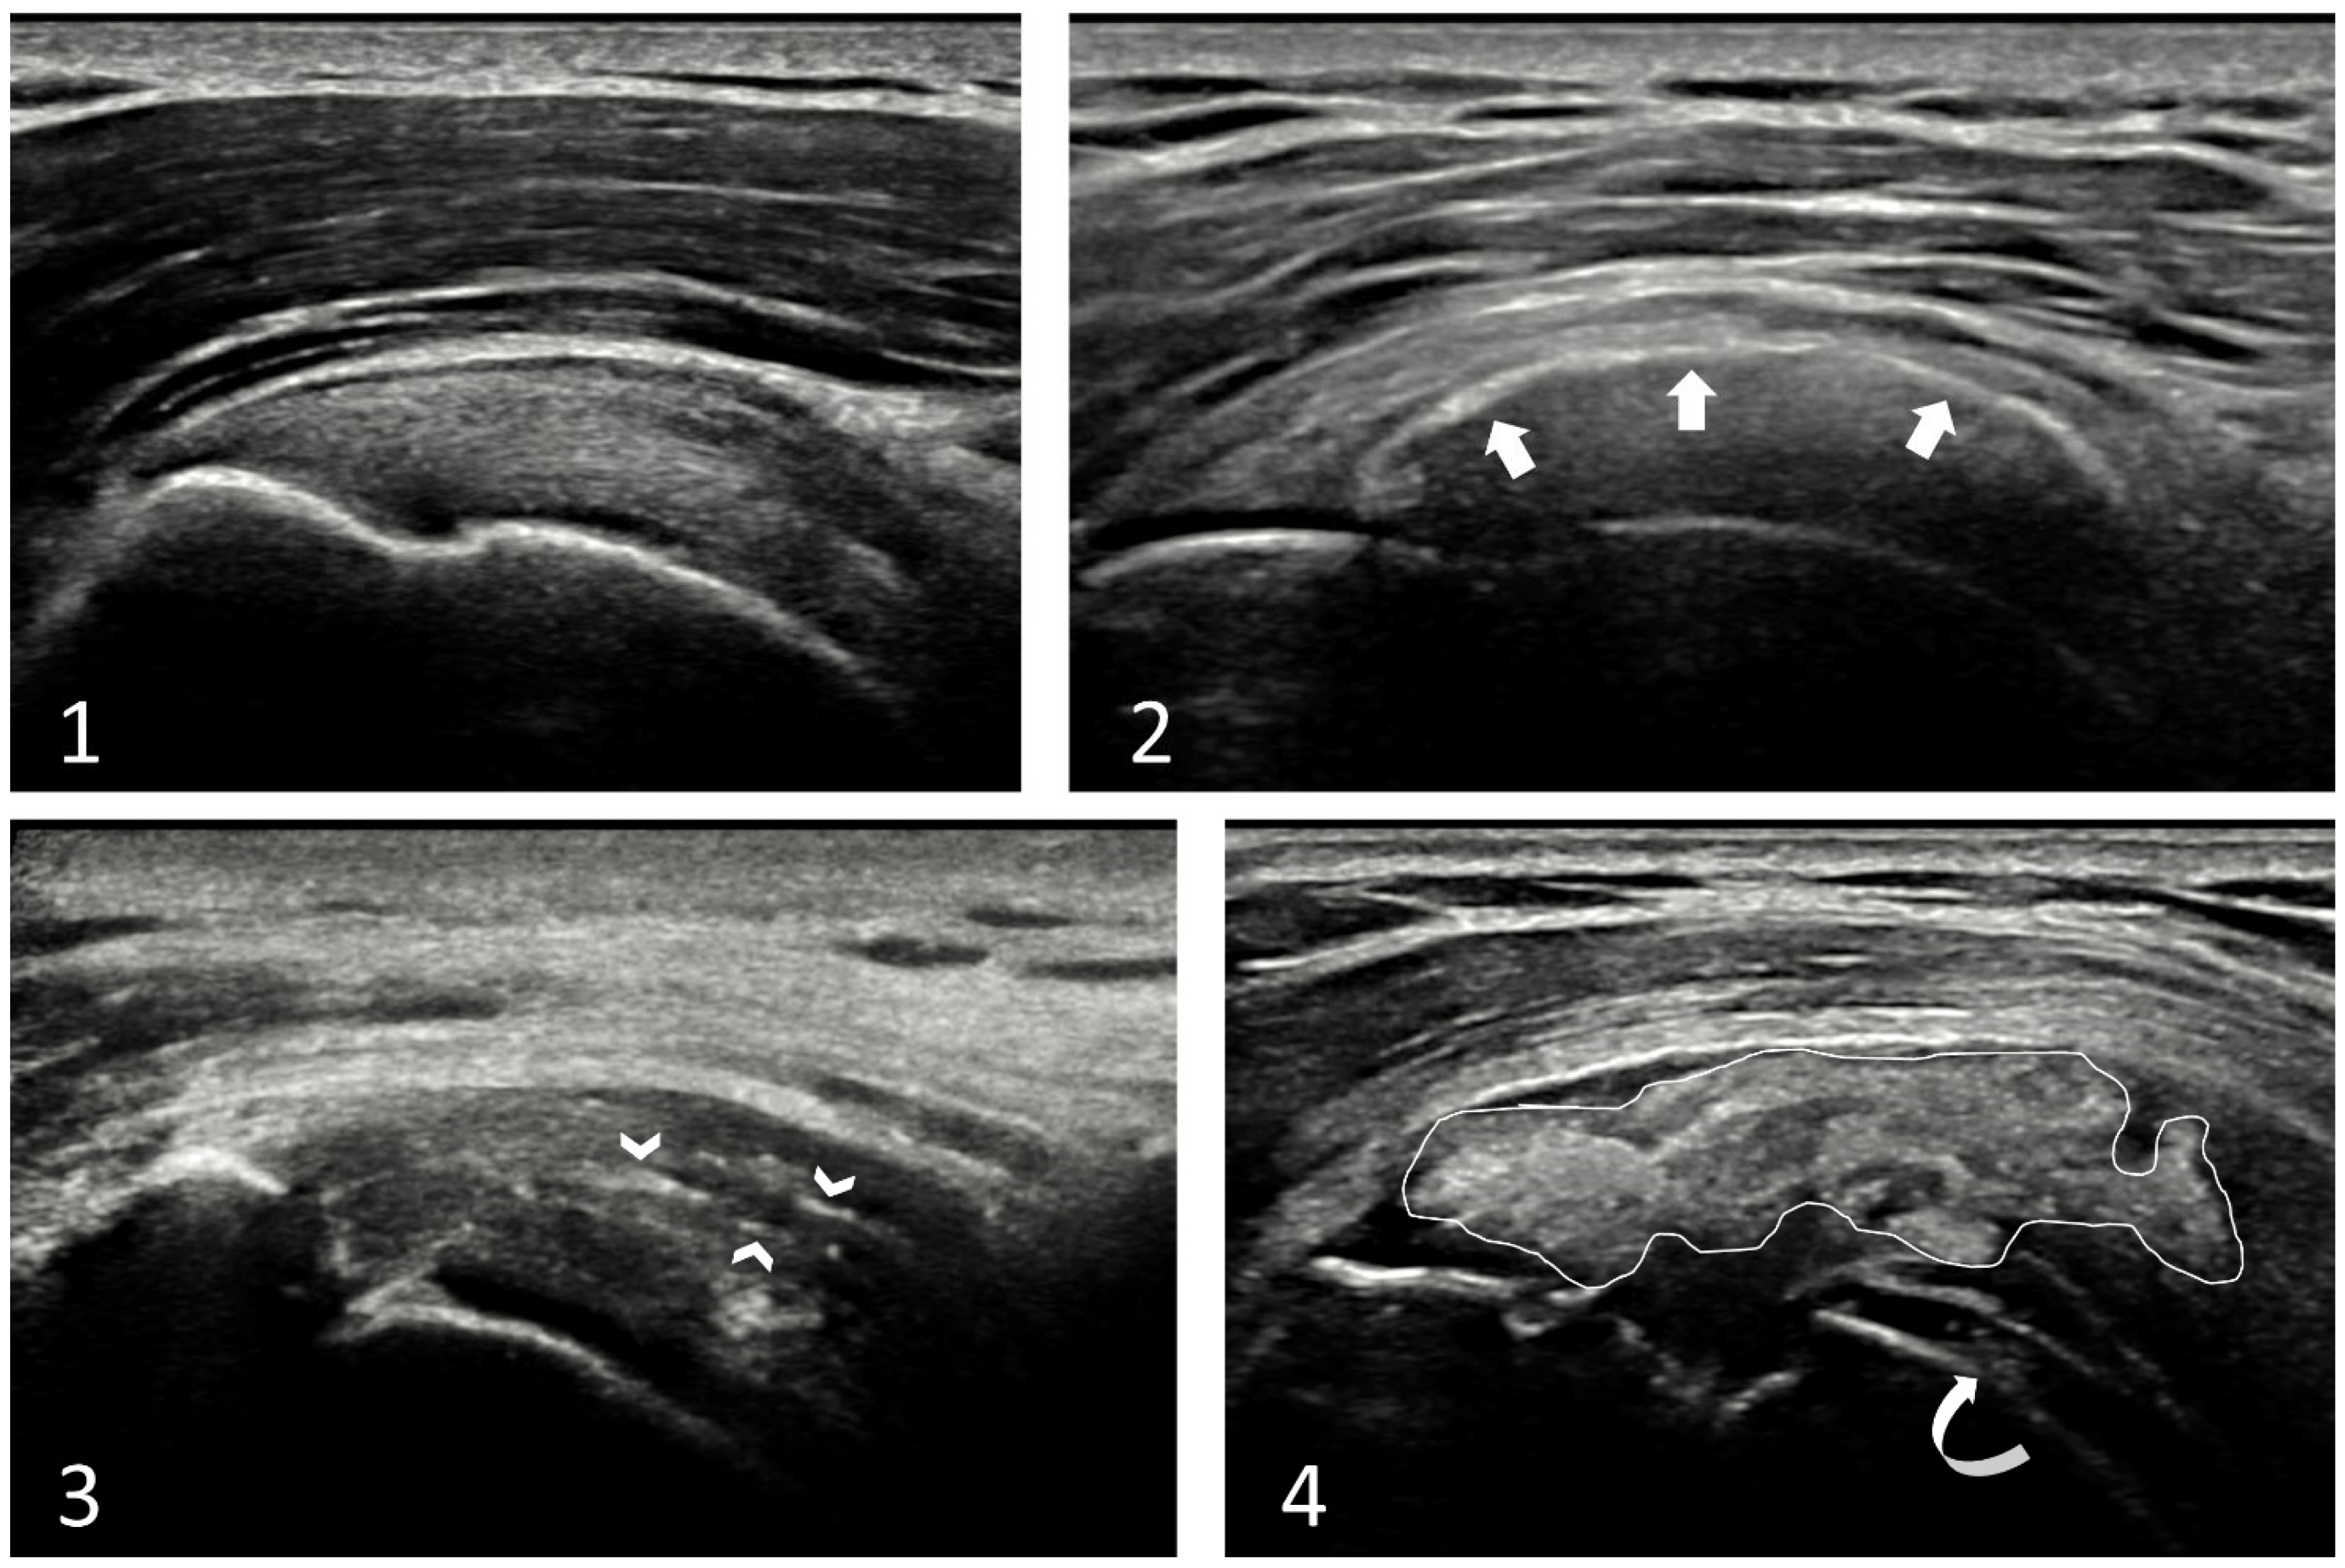
Another site frequently affected by CPPD is the shoulder. Potentially, all articular and periarticular structures in the shoulder can be involved, and CPPD may be observed in the rotator cuff, HC, shoulder ligaments, labrum, bursae, and the capsule, and in the disc of the acromion-clavicular joint. The release of CPP crystals within the joint space or bursa can lead to acute arthritis with important functional limitation, which could bring the patient to the emergency department. CPPD of the rotator cuff is the most challenging to distinguish. A crucial distinction is that CPP deposition does not create posterior shadowing, while basic calcium crystals generally do (calcific tendonitis) [33]. Additionally, CPP deposits within the tendons generally appear linear following the long axis of the tendon fibers, or less frequently as inhomogeneous deposition, with a “cloudy” shape and not-well-defined margins (Figure 7). Nonetheless, in case of doubts, it would be wise to scan the knees and wrists, which are commonly involved and easier to scan. Confirming CPPD in these joints can increase the probability of identifying CPP deposition in the rotator cuff also.

4.6. The Pseudo-Double Contour Sign—A New Hallmark of CPPD

The DC sign, a hyperechoic line on the top of the HC of joints, was traditionally considered typical of urate crystal deposition [44]. As previously said, it has also been described in patients with CPPD [45], and recently, an anatomical explanation of this phenomenon has been provided in a cadaveric model [
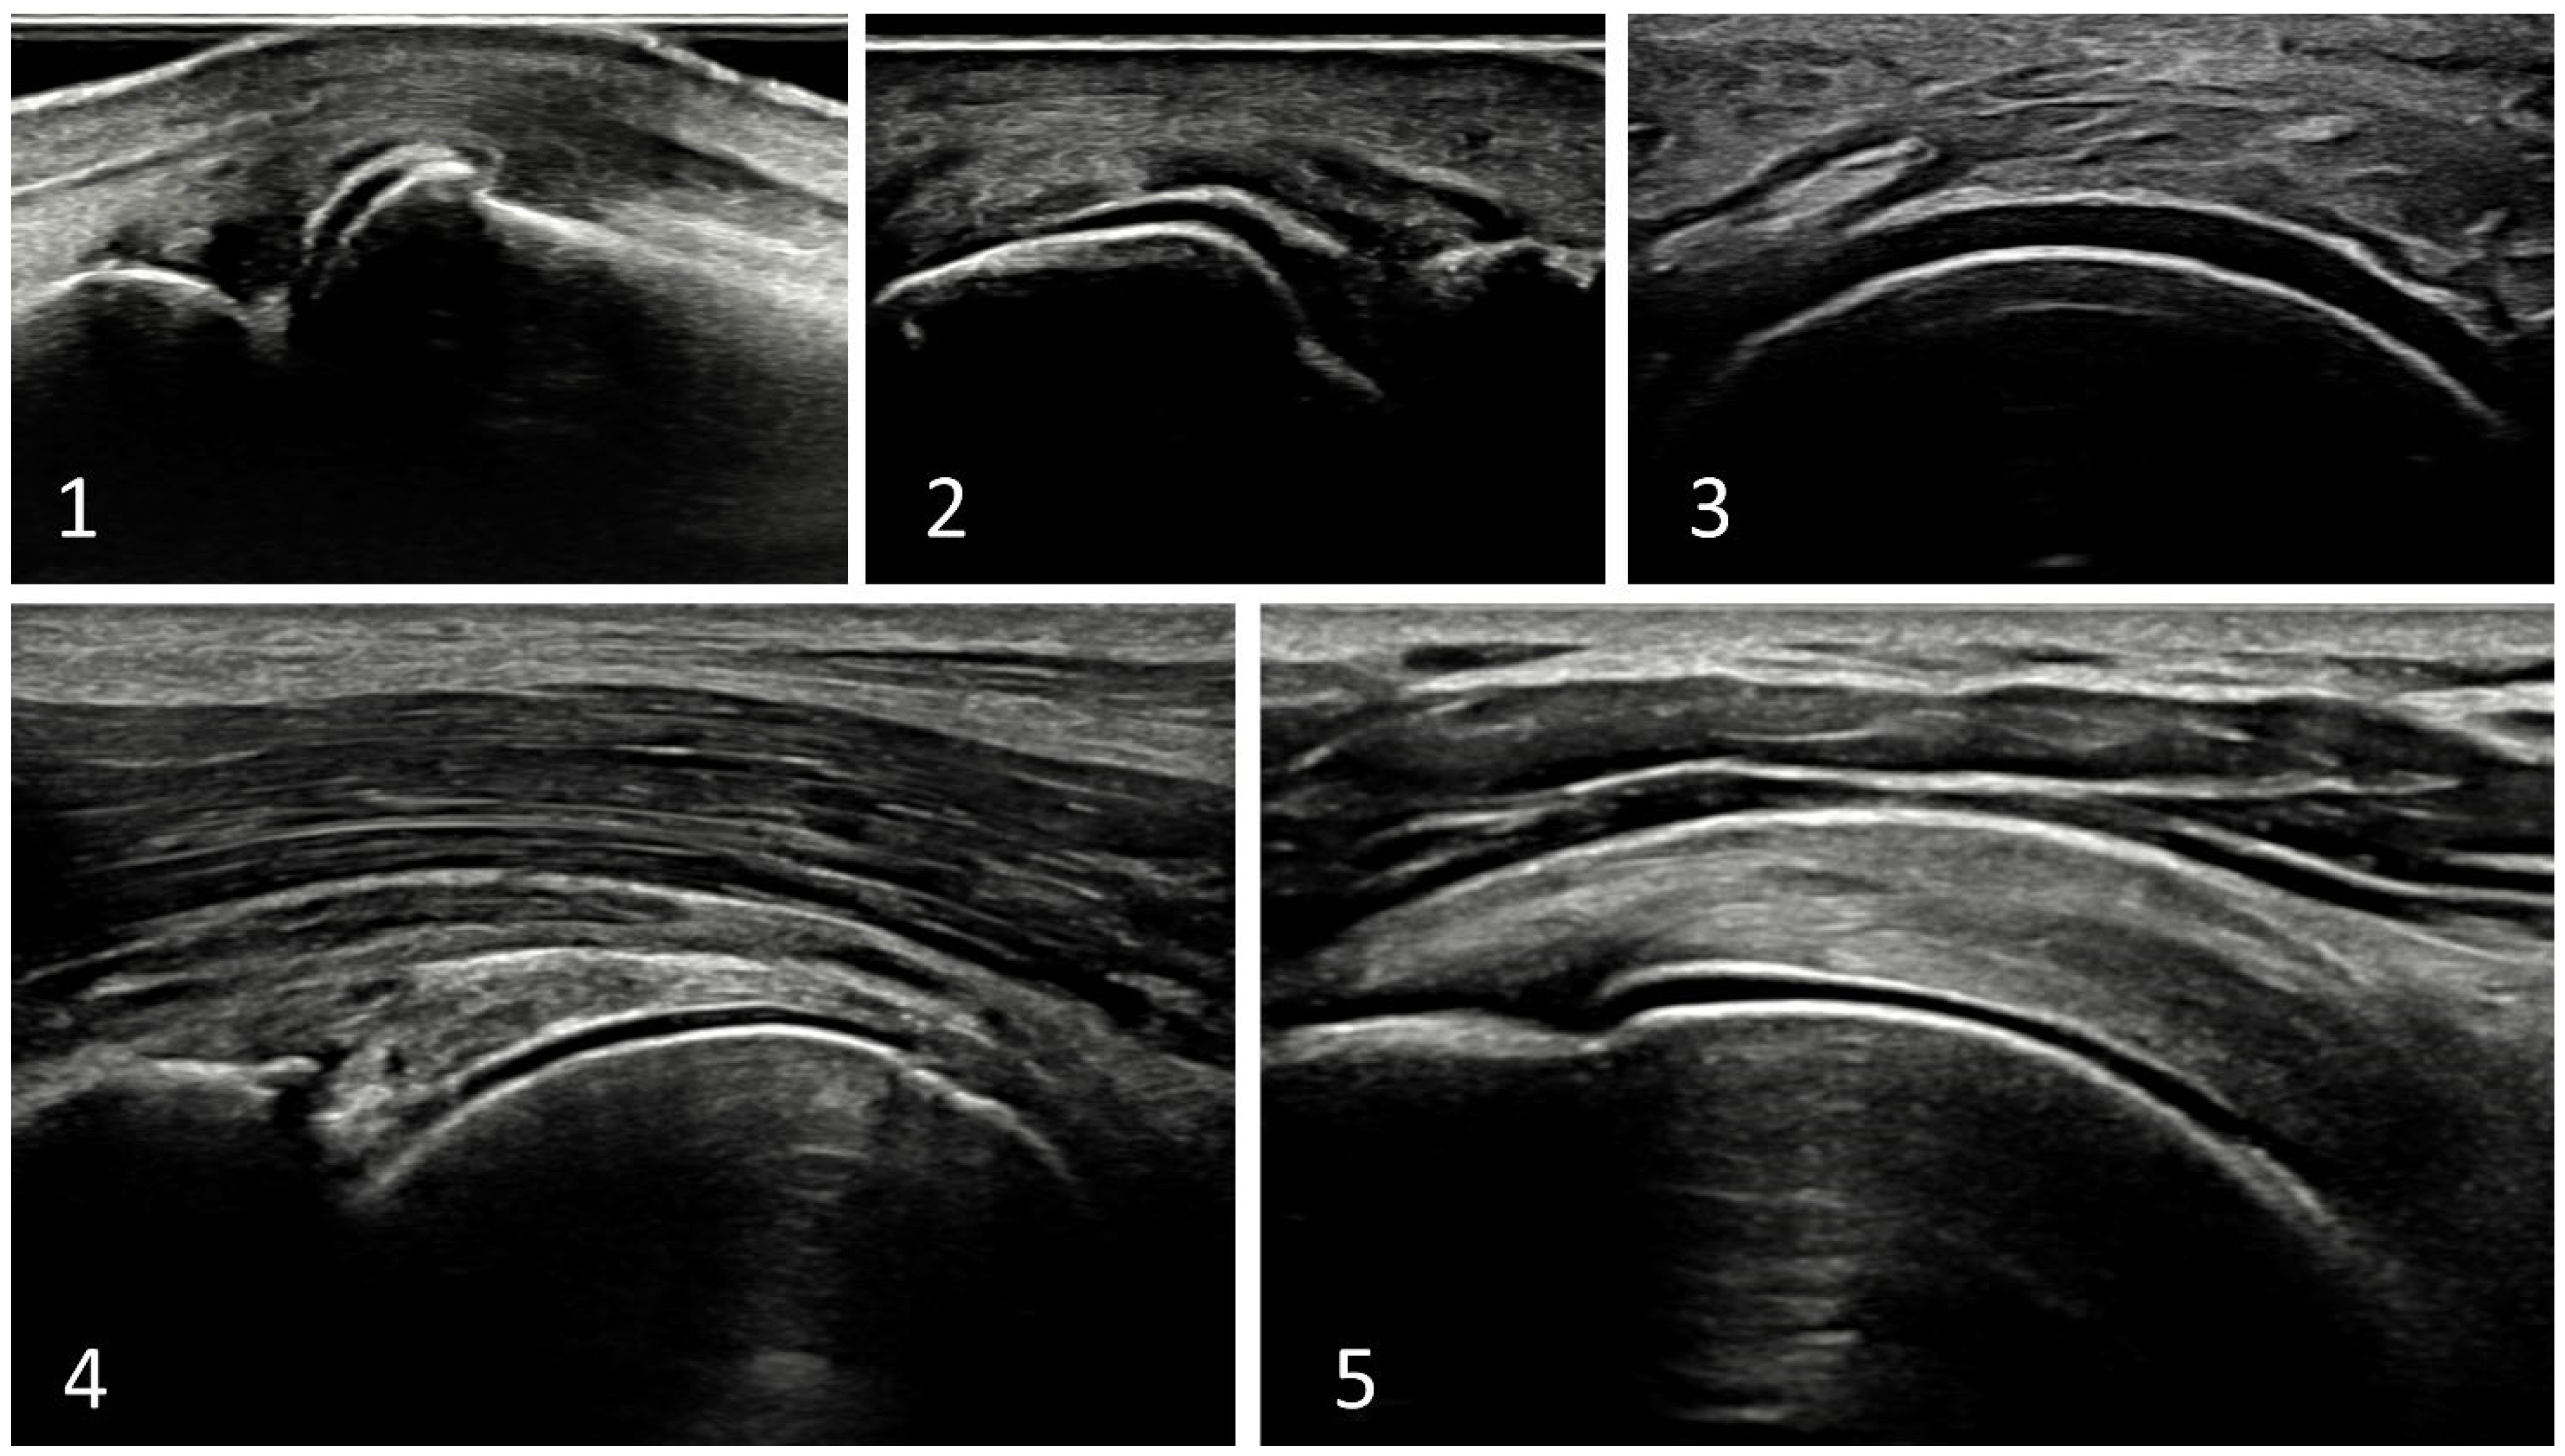
28]. Briefly, CPP deposition in these cases does not occur in the HC itself; rather, crystal deposits are located within the ligament that overlies the HC, creating an image resembling the DC, the pseudoDC sign. Generally, the pseudoDC could be thicker and may extend also over the edge of the HC, following the ligament or capsule, as opposed to the DC sign of gout. However, the key distinction between the two findings lies in their behavior during dynamic scanning. The DC sign moves in a synchronous manner with the HC since uric acid crystals adhere to the cartilage’s surface. Conversely, the pseudoDC sign moves independently and asynchronously with the HC. In most joint sites, during the extension/flexion or abduction/adduction movements, the pseudoDC will move in the opposite direction of the HC, as the ligament remains still and tightens while the underlying HC moves in the opposite direction. However, in some anatomical sites, this effect may not be as pronounced. A typical example is the shoulder, where the pseudoDC is caused by calcification within the deeper part of the rotator cuff (capsule/cable) that move in the same direction as the humeral head, making differential diagnosis challenging. A recent study evaluating the ability of dynamic scanning to correctly classify patients with DC sign as having gout or CPPD demonstrated that the pseudoDC sign (moving in opposition to the HC) was associated with CPPD. However, it is worth noting that the DC/pseudoDC sign was identified and tested only in some joints (e.g., shoulders and hips were not included), and the results probably cannot be generalized to every joint [32]. Typical appearance of pseudoDC in different sites is illustrated in Figure 8.

5. Conclusions

In conclusion, ultrasound has emerged as a key tool for detecting CPPD. However, it is important to be aware of potential pitfalls during CPPD assessment that can mimic various other conditions. In this technical note, many pitfalls and some tip and tricks have been described. Unfortunately, it is not possible to exhaustively discuss all the possible scanning techniques and settings in a single paper and, further, differences between the machines (software, probes, etc.) and patients play a central role for the final image quality. This paper should be considered as a starting point for the optimization of the US machine, which requires time and experimentation. However, with adequate training and with the adoption of standardized scanning techniques, the accuracy of this imaging modality should improve, thus reducing the notorious issue of operator dependence traditionally associated with ultrasound.

Author Contributions

G.F. and S.S. conceived the study, oversaw study design and acquisition and interpretation of data, and drafted the first version of the manuscript. G.F., S.S., E.C. and E.F. substantially revised the manuscript. All authors have read and agreed to the published version of the manuscript.

Funding

This research received no external funding.

Conflicts of Interest

The authors declare no conflicts of interest.

References

  1. Cipolletta, E.; Filippou, G.; Scirè, C.; Di Matteo, A.; Di Battista, J.; Salaffi, F.; Grassi, W.; Filippucci, E. The diagnostic value of conventional radiography and musculoskeletal ultrasonography in calcium pyrophosphate deposition disease: A systematic literature review and meta-analysis. Osteoarthr. Cartil. 2021, 29, 619–632. [Google Scholar] [CrossRef] [PubMed]
  2. Abhishek, A.; Tedeschi, S.K.; Pascart, T.; Latourte, A.; Dalbeth, N.; Neogi, T.; Fuller, A.; Rosenthal, A.; Becce, F.; Bardin, T.; et al. The 2023 ACR/EULAR classification criteria for calcium pyrophosphate deposition disease. Ann. Rheum. Dis. 2023, 82, 1248–1257. [Google Scholar] [CrossRef]
  3. Abhishek, A.; Neogi, T.; Choi, H.; Doherty, M.; Rosenthal, A.K.; Terkeltaub, R. Review: Unmet Needs and the Path Forward in Joint Disease Associated with Calcium Pyrophosphate Crystal Deposition. Arthritis Rheumatol. 2018, 70, 1182–1191. [Google Scholar] [CrossRef] [PubMed]
  4. Filippou, G.; Scirè, C.A.; Damjanov, N.; Adinolfi, A.; Carrara, G.; Picerno, V.; Toscano, C.; Bruyn, G.A.; D’agostino, M.A.; Sedie, A.D.; et al. Definition and Reliability Assessment of Elementary Ultrasonographic Findings in Calcium Pyrophosphate Deposition Disease: A Study by the OMERACT Calcium Pyrophosphate Deposition Disease Ultrasound Subtask Force. J. Rheumatol. 2017, 44, 1744–1749. [Google Scholar] [CrossRef] [PubMed]
  5. Filippou, G.; Scirè, C.A.; Adinolfi, A.; Damjanov, N.S.; Carrara, G.; Bruyn, G.A.W.; Cazenave, T.; D’agostino, M.A.; Sedie, A.D.; Di Sabatino, V.; et al. Identification of calcium pyrophosphate deposition disease (CPPD) by ultrasound: Reliability of the OMERACT definitions in an extended set of joints—An international multiobserver study by the OMERACT Calcium Pyrophosphate Deposition Disease Ultrasound Subtask Force. Ann. Rheum. Dis. 2018, 77, 1195–1200. [Google Scholar] [CrossRef]
  6. Filippou, G.; Scanu, A.; Adinolfi, A.; Toscano, C.; Gambera, D.; Largo, R.; Naredo, E.; Calvo, E.; Herrero-Beaumont, G.; Zufferey, P.; et al. Criterion validity of ultrasound in the identification of calcium pyrophosphate crystal deposits at the knee: An OMERACT ultrasound study. Ann. Rheum. Dis. 2020, 80, 261–267. [Google Scholar] [CrossRef]
  7. Sirotti, S.; Terslev, L.; Filippucci, E.; Iagnocco, A.; Moller, I.; Naredo, E.; Vreju, F.A.; Adinolfi, A.; Becce, F.; Hammer, H.B.; et al. Development and validation of an OMERACT ultrasound scoring system for the extent of calcium pyrophosphate crystal deposition at the joint level and patient level. Lancet Rheumatol. 2023, 5, e474–e482. [Google Scholar] [CrossRef]
  8. Filippou, G.; Sirotti, S. How can ultrasonography help in the management of CPPD? From diagnosis to clinical subset identification. Curr. Opin. Rheumatol. 2023, 35, 185–193. [Google Scholar] [CrossRef]
  9. Abhishek, A.; Doherty, S.; Maciewicz, R.; Muir, K.; Zhang, W.; Doherty, M. Evidence of a Systemic Predisposition to Chondrocalcinosis and Association Between Chondrocalcinosis and Osteoarthritis at Distant Joints: A Cross-Sectional Study. Arthritis Care Res. 2013, 65, 1052–1058. [Google Scholar] [CrossRef]
  10. Filippou, G.; Filippucci, E.; Tardella, M.; Bertoldi, I.; Di Carlo, M.; Adinolfi, A.; Grassi, W.; Frediani, B. Extent and distribution of CPP deposits in patients affected by calcium pyrophosphate dihydrate deposition disease: An ultrasonographic study. Ann. Rheum. Dis. 2013, 72, 1836–1839. [Google Scholar] [CrossRef]
  11. Williams, C.J.; Rosenthal, A.K. Pathogenesis of calcium pyrophosphate deposition disease. Best Pract. Res. Clin. Rheumatol. 2021, 35, 101718. [Google Scholar] [CrossRef]
  12. Nguyen, C.; Bazin, D.; Daudon, M.; Chatron-Colliet, A.; Hannouche, D.; Bianchi, A.; Côme, D.; So, A.; Busso, N.; Lioté, F.; et al. Revisiting spatial distribution and biochemical composition of calcium-containing crystals in human osteoarthritic articular cartilage. Arthritis Res. Ther. 2013, 15, R103. [Google Scholar] [CrossRef]
  13. Rosenthal, A.K.; Ryan, L.M. Calcium Pyrophosphate Deposition Disease. N. Engl. J. Med. 2016, 374, 2575–2584. [Google Scholar] [CrossRef]
  14. Bertrand, J.; Nitschke, Y.; Fuerst, M.; Hermann, S.; Schäfers, M.; Sherwood, J.; Nalesso, G.; Ruether, W.; Rutsch, F.; Dell‘Accio, F.; et al. Decreased levels of nucleotide pyrophosphatase phosphodiesterase 1 are associated with cartilage calcification in osteoarthritis and trigger osteoarthritic changes in mice. Ann. Rheum. Dis. 2012, 71, 1249–1253. [Google Scholar] [CrossRef] [PubMed]
  15. Abhishek, A.; Doherty, M. Pathophysiology of articular chondrocalcinosis—Role of ANKH. Nat. Rev. Rheumatol. 2010, 7, 96–104. [Google Scholar] [CrossRef] [PubMed]
  16. Williams, C.J.; Pendleton, A.; Bonavita, G.; Reginato, A.J.; Hughes, A.E.; Peariso, S.; Doherty, M.; McCarty, D.J.; Ryan, L.M. Mutations in the amino terminus of ANKH in two US families with calcium pyrophosphate dihydrate crystal deposition disease. Arthritis Rheum. 2003, 48, 2627–2631. [Google Scholar] [CrossRef] [PubMed]
  17. Abhishek, A.; Doherty, M. Update on calcium pyrophosphate deposition. Clin. Exp. Rheumatol. 2016, 34, 32–38. [Google Scholar]
  18. Pang, L.; Hayes, C.P.; Buac, K.; Yoo, D.-G.; Rada, B. Pseudogout-Associated Inflammatory Calcium Pyrophosphate Dihydrate Microcrystals Induce Formation of Neutrophil Extracellular Traps. J. Immunol. 2013, 190, 6488–6500. [Google Scholar] [CrossRef] [PubMed]
  19. Campillo-Gimenez, L.; Renaudin, F.; Jalabert, M.; Gras, P.; Gosset, M.; Rey, C.; Sarda, S.; Collet, C.; Cohen-Solal, M.; Combes, C.; et al. Inflammatory Potential of Four Different Phases of Calcium Pyrophosphate Relies on NF-κB Activation and MAPK Pathways. Front. Immunol. 2018, 9, 2248. [Google Scholar] [CrossRef] [PubMed]
  20. Liu, Y.; Jackson, A.; Cosgrove, S. Contribution of calcium-containing crystals to cartilage degradation and synovial inflammation in osteoarthritis. Osteoarthr. Cartil. 2009, 17, 1333–1340. [Google Scholar] [CrossRef]
  21. Beutler, A.; Rothfuss, S.; Clayburne, G.; Sieck, M.; Ralph, H.S. Calcium pyrophosphate dihydrate crystal deposition in synovium. relationship to collagen fibers and chondrometaplasia. Arthritis Rheum. 1993, 36, 704–715. [Google Scholar] [CrossRef] [PubMed]
  22. Fuerst, M.; Bertrand, J.; Lammers, L.; Dreier, R.; Echtermeyer, F.; Nitschke, Y.; Rutsch, F.; Schäfer, F.K.W.; Niggemeyer, O.; Steinhagen, J.; et al. Calcification of articular cartilage in human osteoarthritis. Arthritis Rheum. 2009, 60, 2694–2703. [Google Scholar] [CrossRef] [PubMed]
  23. Thouverey, C.; Bechkoff, G.; Pikula, S.; Buchet, R. Inorganic pyrophosphate as a regulator of hydroxyapatite or calcium pyrophosphate dihydrate mineral deposition by matrix vesicles. Osteoarthr. Cartil. 2009, 17, 64–72. [Google Scholar] [CrossRef] [PubMed]
  24. Neame, R.L.; Carr, A.J.; Muir, K.; Doherty, M. UK community prevalence of knee chondrocalcinosis: Evidence that correlation with osteoarthritis is through a shared association with osteophyte. Ann. Rheum. Dis. 2003, 62, 513–518. [Google Scholar] [CrossRef]
  25. Filippucci, E.; Gutierrez, M.; Georgescu, D.; Salaffi, F.; Grassi, W. Hyaline cartilage involvement in patients with gout and calcium pyrophosphate deposition disease. An ultrasound study. Osteoarthr. Cartil. 2009, 17, 178–181. [Google Scholar] [CrossRef] [PubMed]
  26. Bjelle, A.O.; Sundström, B.K.G. An ultrastructural study of the articular cartilage in calcium pyrophosphate dihydrate (CPPD) crystal deposition disease (Chondrocalcinosis Articularis). Calcif. Tissue Int. 1975, 19, 63–71. [Google Scholar] [CrossRef]
  27. Stücker, S.; Bollmann, M.; Garbers, C.; Bertrand, J. The role of calcium crystals and their effect on osteoarthritis pathogenesis. Best Pract. Res. Clin. Rheumatol. 2021, 35, 101722. [Google Scholar] [CrossRef]
  28. Filippou, G.; Miguel-Pérez, M.; Bong, D.; Coronel, L.; Sirotti, S.; Pacini, G.; Scanu, A.; Möller, I.; The “Anatomy for Image” EULAR Study Group. The ultrasonographic “pseudo-double contour” sign in calcium pyrophosphate deposition disease. Arthritis Rheumatol. 2022, 75, 639–640. [Google Scholar] [CrossRef]
  29. Ogdie, A.; Taylor, W.J.; Neogi, T.; Fransen, J.; Jansen, T.L.; Schumacher, H.R.; Louthrenoo, W.; Vazquez-Mellado, J.; Eliseev, M.; McCarthy, G.; et al. Performance of Ultrasound in the Diagnosis of Gout in a Multicenter Study: Comparison With Monosodium Urate Monohydrate Crystal Analysis as the Gold Standard. Arthritis Rheumatol. 2016, 69, 429–438. [Google Scholar] [CrossRef]
  30. Löffler, C.; Sattler, H.; Peters, L.; Löffler, U.; Uppenkamp, M.; Bergner, R. Distinguishing Gouty Arthritis from Calcium Pyrophosphate Disease and Other Arthritides. J. Rheumatol. 2014, 42, 513–520. [Google Scholar] [CrossRef]
  31. Adinolfi, A.; Picerno, V.; Di Sabatino, V.; Bertoldi, I.; Galeazzi, M.; Frediani, B.; Filippou, G. Inquiry Is Fatal to Certainty-Is the Ultrasonography Double Contour Sign Specific for Uric Acid-Induced Arthritis? Arthritis Rheum. 2013, 65, 1952. [Google Scholar] [CrossRef]
  32. Cipolletta, E.; Abhishek, A.; Di Matteo, A.; Grassi, W.; Filippucci, E. Dynamic assessment of the double contour sign by ultrasonography helps to distinguish between gout and calcium pyrophosphate deposition disease. RMD Open 2023, 9, e002940. [Google Scholar] [CrossRef] [PubMed]
  33. Filippou, G.; Pacini, G.; Sirotti, S.; Zadory, M.; Carboni, D.; Damiani, A.; Fiorentini, E.; Cipolletta, E.; Filippucci, E.; Froehlich, J.M.; et al. Comparison of ultrasound attenuation by calcium pyrophosphate, hydroxyapatite and monosodium urate crystals: A proof-of-concept study. Ann. Rheum. Dis. 2022, 81, 1199–1201. [Google Scholar] [CrossRef] [PubMed]
  34. Zander, D.; Hüske, S.; Hoffmann, B.; Cui, X.-W.; Dong, Y.; Lim, A.; Jenssen, C.; Löwe, A.; Koch, J.B.; Dietrich, C.F. Ultrasound Image Optimization (“Knobology”): B-Mode. Ultrasound Int. Open 2020, 6, E14–E24. [Google Scholar] [CrossRef] [PubMed]
  35. Adinolfi, A.; Sirotti, S.; Sakellariou, G.; Cipolletta, E.; Filippucci, E.; Porta, F.; Zanetti, A.; Ughi, N.; Sarzi-Puttini, P.; Scirè, C.A.; et al. Which are the most frequently involved peripheral joints in calcium pyrophosphate crystal deposition at imaging? A systematic literature review and meta-analysis by the OMERACT ultrasound—CPPD subgroup. Front. Med. 2023, 10, 1131362. [Google Scholar] [CrossRef] [PubMed]
  36. Wu, W.-T.; Chang, K.-V.; Mezian, K.; Naňka, O.; Yang, Y.-C.; Hsu, Y.-C.; Hsu, P.-C.; Özçakar, L. Ulnar Wrist Pain Revisited: Ultrasound Diagnosis and Guided Injection for Triangular Fibrocartilage Complex Injuries. J. Clin. Med. 2019, 8, 1540. [Google Scholar] [CrossRef] [PubMed]
  37. Gout, Hyperuricemia and Crystal-Associated Disease Network. Gout, Hyperuricemia and Crystal-Associated Disease Network (G-CAN) Conference 2022: Early-Career Investigators’ Abstracts. Gout Urate Cryst. Depos. Dis. 2023, 1, 167–191. [Google Scholar] [CrossRef]
  38. Bishop, A.T.; Gabel, G.; Carmichael, S.W. Flexor carpi radialis tendinitis. Part I. Minerva Anestesiol. 1994, 76, 1009–1014. [Google Scholar] [CrossRef]
  39. McGonagle, D.; Aydin, S.Z.; Tan, A.L. The Synovio-entheseal Complex and Its Role in Tendon and Capsular Associated Inflammation. J. Rheumatol. 2012, 89, 11–14. [Google Scholar] [CrossRef]
  40. Cipolletta, E.; Smerilli, G.; Mirza, R.M.; Di Matteo, A.; Carotti, M.; Salaffi, F.; Grassi, W.; Filippucci, E. Sonographic assessment of calcium pyrophosphate deposition disease at wrist. A focus on the dorsal scapho-lunate ligament. Jt. Bone Spine 2020, 87, 611–617. [Google Scholar] [CrossRef]
  41. Möller, I.; Janta, I.; Backhaus, M.; Ohrndorf, S.; Bong, D.A.; Martinoli, C.; Filippucci, E.; Sconfienza, L.M.; Terslev, L.; Damjanov, N.; et al. The 2017 EULAR standardised procedures for ultrasound imaging in rheumatology. Ann. Rheum. Dis. 2017, 76, 1974–1979. [Google Scholar] [CrossRef]
  42. Filippou, G.; Picerno, V.; Adinolfi, A.; Di Sabatino, V.; Bertoldi, I.; Galeazzi, M.; Frediani, B. Change perspective to increase diagnostic accuracy of ultrasonography in calcium pyrophosphate dihydrate deposition disease! A new approach: The axial scan of the meniscus. Reumatismo 2014, 66, 318–321. [Google Scholar] [CrossRef]
  43. Cipolletta, E.; Moscioni, E.; Sirotti, S.; Di Battista, J.; Abhishek, A.; Rozza, D.; Zanetti, A.; Carrara, G.; Scirè, C.A.; Grassi, W.; et al. Diagnosis of calcium pyrophosphate crystal deposition disease by ultrasonography: How many and which sites should be scanned? Rheumatology 2023, kead565. [Google Scholar] [CrossRef] [PubMed]
  44. Christiansen, S.N.; Filippou, G.; Scirè, C.A.; Balint, P.V.; Bruyn, G.A.; Dalbeth, N.; Dejaco, C.; Sedie, A.D.; Filippucci, E.; Hammer, H.B.; et al. Consensus-based semi-quantitative ultrasound scoring system for gout lesions: Results of an OMERACT Delphi process and web-reliability exercise. Semin. Arthritis Rheum. 2021, 51, 644–649. [Google Scholar] [CrossRef] [PubMed]
  45. Filippucci, E.; Scirè, C.A.; Sedie, A.D.; Iagnocco, A.; Riente, L.; Meenagh, G.; Gutierrez, M.; Bombardieri, S.; Valesini, G.; Montecucco, C.; et al. Ultrasound imaging for the rheumatologist. XXV. Sonographic assessment of the knee in patients with gout and calcium pyrophosphate deposition disease. Clin. Exp. Rheumatol. 2010, 28, 2–5. [Google Scholar] [PubMed]
Figure 1. An example of how modifying the dynamic range (DR) or the gain could impact the final image. (1) Image of the triangular fibrocartilage of the wrist with standard settings showing a hyperechoic deposit that satisfies the OMERACT definitions (circle). The arrows indicate hyperechogenic spots that could be CPPD but are less echogenic than the circled one, raising some doubts. (2) The same image with low DR (high contrast). The machine increased the echogenicity of the small deposits indicated in subfigure (1) (arrows) that now are more similar to the bone profile. (3) High DR (low contrast) decreased the overall echogenicity of the small deposits, but they are still distinguishable as hyperechoic when compared with the surrounding tissues. (4) In the low-gain image (keeping only the bone profile as visible on the screen), only the large deposit (circle in (1)) is still visible. (5) In the high-gain image, the small deposits appear more echogenic, similarly to what happens to the bone profile, keeping an overall similar ratio of bone/deposition echogenicity. In conclusion, the DR modification pushed the machine to increase the echogenicity of the small deposits, which looked more similar to the bone profile, increasing the possibility of those deposits being calcium crystals. The gain variation modifies the brightness of the image, but the “ratio” of echogenicity between bone and deposits remains the same. In conclusion, changing these settings could be helpful in some circumstances, but requires a certain degree of experience in the use of ultrasound. In case of strong doubts, scanning other sites for CPPD could be also useful in increasing the diagnostic confidence.
Gucdd 02 00002 g001
Figure 2. (A) and (B) show the position of the probe on the wrist in order to scan the triangular fibrocartilage complex (TFCC) in a healthy subject. The sonographer should seek the best visualization of the TFCC by sliding the probe both moving from proximal to distal (A) and from the volar to the dorsal side (B) without lifting the probe. A large amount of gel may be necessary, as the styloid process could hinder direct contact of the probe with the skin. In panels (1), (2), and (3), the position of the hand and the respective ultrasound image can be observed. The white line in panel ultrasound (1) indicates the area of the TFCC. Notice how areas of different echogenicity and pattern (homogeneous or fibrillar in some points) are alternated but there is no clear visualization of the meniscus homologue or of the disc. The arrowhead indicates an area of hyperechogenicity that presents fibrillar echostructure, being probably a part of a ligament. By changing the position of the wrist (panels (2) and (3)), the hyperechogenic area disappears, probably due to the loosening of the ligament. Dynamic scanning of the TFCC should always be performed since CPPD deposition generally remains visible regardless of wrist position. T: triquetrum; U: ulna; L: lunate. Arrow in (A): sliding of the probe from proximal to distal. Arrow in (B): sliding of the probe from the volar to the dorsal side.
Gucdd 02 00002 g002
Figure 3. Two examples of patterns of deposition at the triangular fibrocartilage complex (TFCC). (left) A linear deposition following the ulnar bone profile, probably indicating deposition on the top or within the fibrocartilage disc that is located at that place. (right) Cloudy deposition both on the proximal and the distal edge of the TFCC. The central part of the TFCC, where the meniscus homologue should be located, does not exhibit areas of deposition (arrows: indicate CPPD, ECU: indicate extensor carpi ulnaris tendon).
Gucdd 02 00002 g003
Figure 4. (left) A normal flexor carpi radialis tendon (FCR) at its entrance at the fibro-osseous tunnel. (right) The arrowhead indicates hyperechogenic deposits (similar to the bone profile) of the floor of the tunnel, composed of fibers from the transverse ligament of the wrist, compatible with CPPD. (S. scaphoid bone profile).
Gucdd 02 00002 g004
Figure 5. Examples of challenging conditions in the hyaline cartilage (HC) of the knee. In (1) and (2), the long- and short-axis views of the same hyperechogenic line (arrow) of the medial condyle of the knee. In (1), an interruption of the bone profile under the lesion may be observed. This could be due to the presence of posterior acoustic shadowing or due to the detachment of a small piece of cortical bone (trauma). The short-axis view shows clearly that the lesion is in continuation with the bone profile. Independently of the nature of that hyperechogenic deposition, it is not typical of CPP deposition, and other diagnosis should be considered. In (3), a large deposition (arrow) can be observed within the HC, just next to two thin hyperechoic lines that are better seen in the enlargement (white box) in (4) (thin arrows). The large deposit creates some posterior attenuation (asterisk), not typical of CPPD. Furthermore, the thin hyperechogenic lines are placed on the most superficial side of the HC (arrows indicate the superficial margin of the HC) and appear to be somehow in continuity with it at the right end (curved arrow). This kind of lesion is not unequivocal and could be due to repair processes of lesions of the cartilage. In these cases, scanning of other sites is strongly recommended in order to support/exclude CPPD. Arrowheads represent the normal enhancement of the cartilage margin when insonated perpendicular (normal cartilage interface).
Gucdd 02 00002 g005
Figure 6. Short-axis view of the meniscus (left) and respective long axis (right) of three different cases with possible CPPD (rows (2), (3), and (4)). In the top row is illustrated the position of the probe in order to obtain the short and the long axis of the meniscus. In row (1), the US aspect of a normal meniscus (circumscribed with a white line). The dashed line indicates the position of the meniscus where the long axis view was obtained. For a detailed description of how to obtain the long axis view of the meniscus, please refer to Filippou et al. [42]. In the first case with CPPD, row (2), the thick arrow indicates the large deposit in short and long axes. The bone profile at the bottom of the meniscal structure can be used as landmark, as that deposition is placed in the more proximal part of the meniscus just above the edge of the femoral joint margin. Row (3) displays a short axis of a meniscus with some small deposits (arrows) and a large one (arrowhead). In this case, at the long axis, the bone profile at the bottom of the meniscus is not visible, being the deposits placed in the middle (dashed line indicates the slice of the meniscus obtained at the long axis view). The arrowheads indicate the large deposit seen in the short axis, and the arrows indicate the thin deposits that appear as spots in the short axis view. You may note that in both cases, CPPD deposition in the long axis of the meniscus appears as linear deposition of variable thickness that follows the axis of the “fibers” of the meniscus. In row (4), a single hyperechogenic spot can be observed in the middle portion of the medial meniscus (thick arrow). In the long axis view, the same deposit can be identified, resembling CPPD. However, in both scans, a clear hypoechogenic line next and around of the white spot may be identified (curved arrows). This is probably a lesion of the meniscus, and the white deposition is due to the presence of synovial fluid/debris/fibrin or other material that creates an interface. An easy test that could clarify this is “echo-palpation” on the long axis. While observing the meniscus in the long axis, pressing down with the probe will cause compression on the meniscus and the movement of the white spot along the lesion. On the other hand, CPPD stays still within the meniscus. The palpation of the meniscus does not work on the short axis as the probe crashes on the bone profiles and cannot compress the meniscus properly. On the long axis, there are no bony obstacles, and the meniscus can be compressed adequately.
Gucdd 02 00002 g006
Figure 7. Calcium crystal deposition at the supraspinatus tendon. In (1), a normal supraspinatus tendon. In (2), the typical aspect of basic calcium crystal deposition in the tendon. The arrows indicate the superior hyperechogenic profile of an oval-shaped calcification that creates almost complete posterior shadowing. In (3), the aspect of calcium pyrophosphate (CPP) crystal deposition, which appears as hyperechoic lines that follow the orientation of the tendon fibers (arrowheads indicate some of them). In (4), a voluminous deposit of CPP crystal (white line). Note that, despite the volume, it does not create posterior shadowing. Further, the aspect of the deposition appears inhomogeneous with areas of different echogenicity, probably depending on the crystal load. The curved arrow indicates CPP deposition also within the hyaline cartilage (HC) of the humeral head. Also note the enhancement of the superficial margin of the HC, indicating an initial pseudo-double contour sign (see the dedicated paragraph).
Gucdd 02 00002 g007
Figure 8. PseudoDC may potentially be found on every diarthrodial joint. (1) Dorsal side of a III metacarpal-phalangeal joint, (2) Medial aspect of I metatarsal-phalangeal joint, (3) long-axis view on the lateral condyle of a knee, (4) long-axis view of the anterior side of a hip joint, (5) humeral head at the level of sovraspinatus tendon (seen here at the long axis).
Gucdd 02 00002 g008
Disclaimer/Publisher’s Note: The statements, opinions and data contained in all publications are solely those of the individual author(s) and contributor(s) and not of MDPI and/or the editor(s). MDPI and/or the editor(s) disclaim responsibility for any injury to people or property resulting from any ideas, methods, instructions or products referred to in the content.

