
Emission of Particulate Inorganic Substances from Prescribed Open Grassland Burning in Hirado, Akiyoshidai, and Aso, Japan
Abstract
:1. Introduction
2. Materials and Method
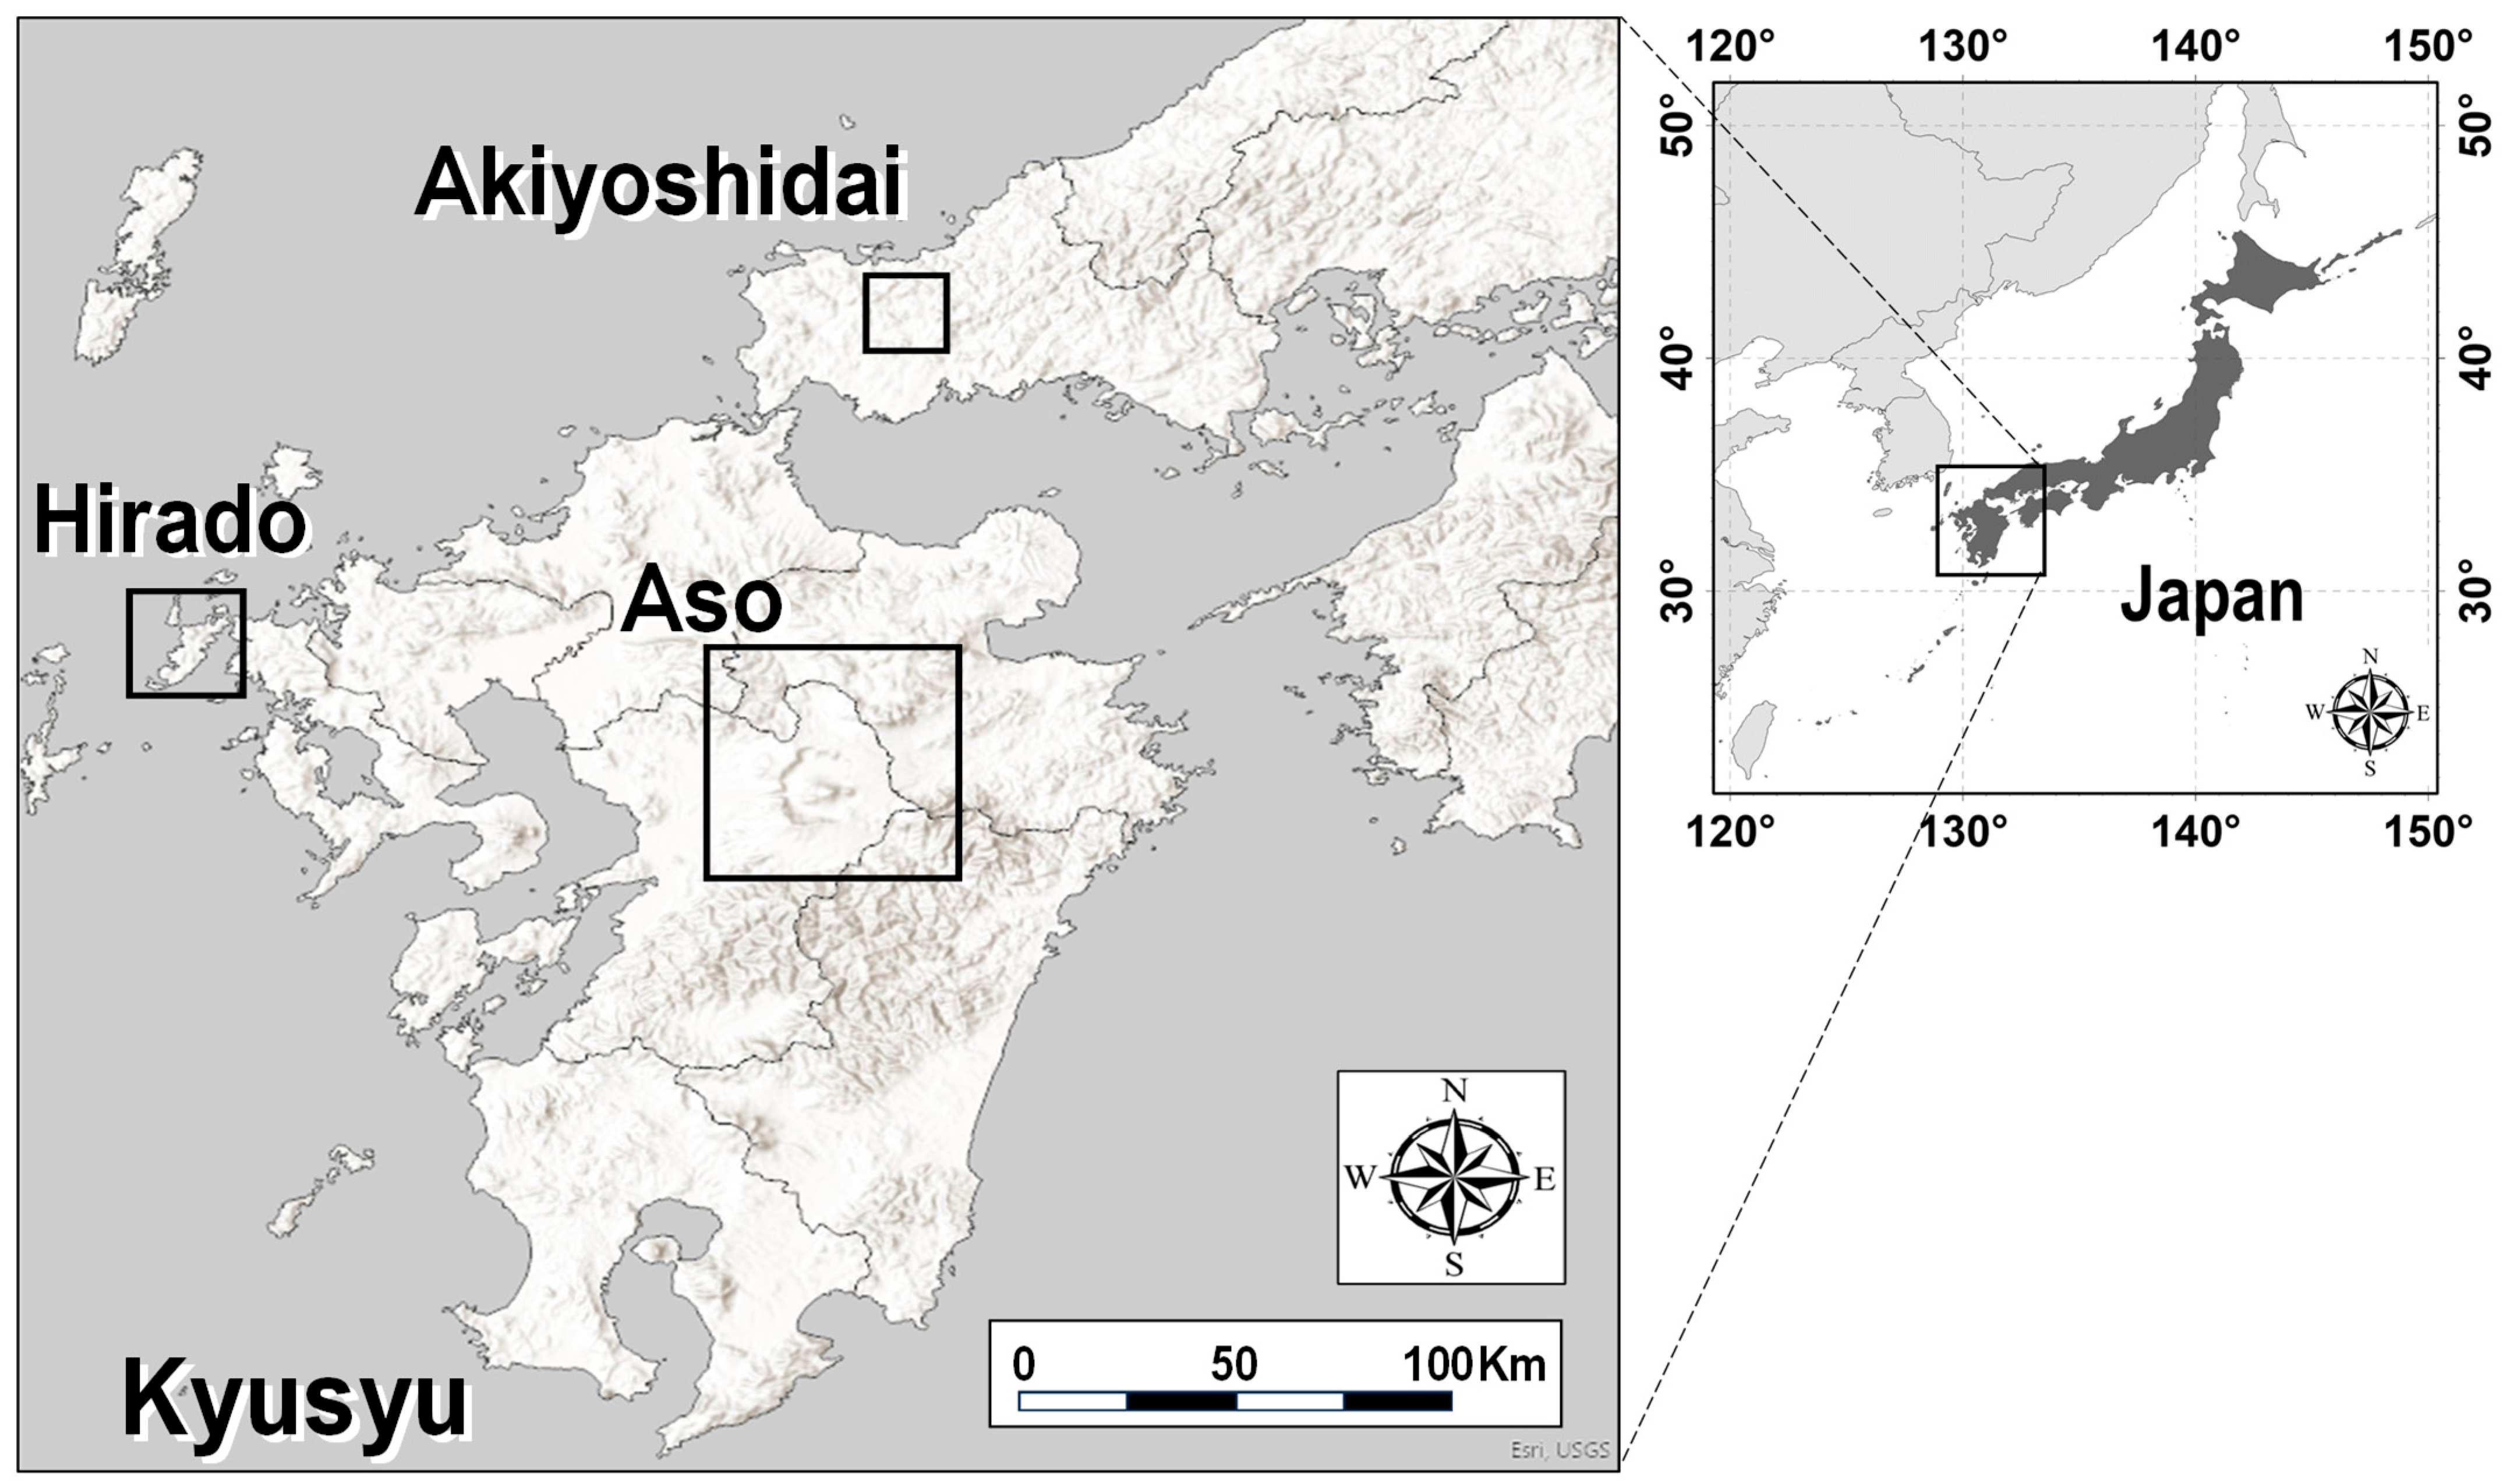
Sample Collection
3. Results and Discussion
3.1. Blank Values, Detection Limits, and Background Concentrations

| Na+ | NH4+ | K+ | Mg2+ | Ca2+ | |
| BLK (this study) | 2.6 ± 0.5 | 0.6 ± 0.2 | 0.2 ± 0.1 | 0.03 ± 0.02 | 1.2 ± 0.3 |
| DL (this study) | 0.04 ± 0.01 | 0.05 ± 0.04 | 0.02 ± 0.02 | 0.13 ± 0.05 | 0.3 ± 0.1 |
| BLK/DL (this study) | 65 | 12 | 10 | 0.2 | 5 |
| BKG (this study) | 1.2 ± 0.9 | 0.6 ± 0.3 | 0.4 ± 0.4 | 0.06 ± 0.02 | 0.2 ± 0.1 |
| Kumamoto/Nagasaki # | <0.05–0.6 | 0–9 | 0–2.5 | <0.01–0.17 | 0.01–0.13 |
| Fukuoka ° | 0.023 | 0.018 | 0.039 | 0.024 | 0.040 |
| 9 locations in Khyushu/Okinawa | 1.0–5.7 | 0.9–3.6 | 0.18–0.48 | 0.14–0.99 | 0.48–3.1 |
| Cl− | Br− | NO3− | PO43− | SO42− | |
| BLK (this study) | 0.05 ± 0.02 | n.d. † | 0.111 ± 0.004 | n.d. † | 0.17 ± 0.03 |
| DL (this study) | 0.05 ± 0.03 | 0.03 ± 0.02 | 0.11 ± 0.09 | 0.06 ± 0.20 | 0.13 ± 0.12 |
| BLK/DL (this study) | 1.0 | n.a. § | 1.0 | n.a. § | 1.3 |
| BKG (this study) | 0.48 ± 0.33 | 0 ± 0 ‡ | 1.6 ± 1.7 ‡ | 0.4 ± 0.8 ‡ | 2.8 ± 2.1 |
| Kumamoto/Nagasaki # | 0–1.4 | n.a. | 0–7 | n.a. | 0–24 |
| Fukuoka ° | 0.036 | n.a. | 0.062 | n.a. | 0.096 |
| 9 locations in Khyushu/Okinawa *** | 1.3–8.3 | n.a. | 0.05–9.5 | n.a. | 5.1–10.1 |
3.2. Particulate Inorganic Substances Emitted from Grassland Burning
3.3. Comparison with Other Biomass Burning Emission Studies
4. Conclusions
Author Contributions
Funding
Institutional Review Board Statement
Informed Consent Statement
Data Availability Statement
Acknowledgments
Conflicts of Interest
References
- Solomon, S.; Qin, D.; Manning, M.; Alley, R.B.; Berntsen, T.; Bindoff, N.L.; Chen, Z.; Chidthaisong, A.; Gregory, J.M.; Hegerl, G.C.; et al. 2007: Technical Summary. In Climate Change 2007: The Physical Science Basis. Contribution of Working Group I to the Fourth Assessment Report of the Intergovernmental Panel on Climate Change; Solomon, S., Qin, D., Manning, M., Chen, Z., Marquis, M., Averyt, K.B., Tignor, M., Miller, H.L., Eds.; Cambridge University Press: Cambridge, UK; New York, USA, 2007. [Google Scholar]
- Dockery, D.W.; Pope, C.A., 3rd. Health effects of fine particulate air pollution: Lines that connect. J. Air Waste Manag. Assoc. 2006, 56, 709–742. [Google Scholar]
- Crutzen, P.J.; Heidt, L.E.; Kransnec, J.P.; Pollock, W.H.; Seiler, W. Biomass burning as a source of atmospheric trace gases CO, H2, N2O, NO, CH3Cl, and COS. Nature 1979, 282, 253–256. [Google Scholar] [CrossRef]
- Ito, A.; Penner, J.E. Global estimates of biomass burning emissions based on satellite imagery for the year 2000. J. Geophys. Res. 2004, 109, D14S05. [Google Scholar] [CrossRef]
- Friedli, H.R.; Arelino, F.A.; Cinnirella, S., Jr.; Pirrone, N. Chapter-8 Mercury emissions from global biomass burning: Spatial and temporal distribution. In Mercury Fate and Transport in the Global Atmosphere: Measurements, Models and Policy Implications; Pirrone, N., Mason, R., Eds.; Interim Report of the UNEP Global Mercury Partnership Mercury Air Transport and Fate Research Partnership Area; UNEP: Nairobi, Kenya, 2008; pp. 145–167. [Google Scholar]
- Andreae, M.O. Soot carbon and excess fine potassium: Long-range transport of combustion-derived aerosols. Science 1983, 220, 1148–1151. [Google Scholar] [CrossRef]
- Tsuji, A.; Hioki, T. Detailed analysis of transboundary transport of Kosa and anthropogenic substances by size-segregated and highly time-resolved observations of ionic components and inorganic elements in ambient aerosols. J. Jpn. Soc. Atmos. Environ. 2013, 48, 82–91. (In Japanese) [Google Scholar]
- Sasaki, A.; Sasaki, N. Chapter 8: The history of grassland and human activity in the Aso Kuju region from the perspective of phytolith, pollen, and fine particulate carbon. In The Environmental History of Wildland; Volume 2, the Series of 35000 Years of Environmental History of Human and Nature; Bunichi Sougou Shuppan: Tokyo, Japan, 2011; pp. 169–182. (In Japanese) [Google Scholar]
- Irei, S. Development of fast sampling and high recovery extraction method for stable isotope measurement of gaseous mercury. Appl. Sci. 2020, 10, 6691. [Google Scholar] [CrossRef]
- Irei, S. Isotopic characterization of gaseous mercury and particulate water-soluble organic carbon emitted from open grass field burning in Aso, Japan. Appl. Sci. 2022, 12, 109. [Google Scholar] [CrossRef]
- Irei, S.; Kameyama, S.; Sakuma, A.; Shimazaki, H.; Yonemura, S. Chapter: Mercury Emission from Prescribed Open Grassland Burning in the Aso region, Japan. In Grasslands—Conservations and Development; IntechOpen: London, UK, 2023. [Google Scholar]
- Ministry of Environment, Japan. The Analytical Method for Ionic Chemical Species (Ion Chromatograph), The 3rd Edition. In The Manual for the Analysis of Chemical Compositions of Airborne Fine Particulate Matter. Available online: https://www.env.go.jp/air/osen/pm/ca/manual.html (accessed on 28 December 2023). (In Japanese)
- Mihara, Y.; Ichikawa, Y. Analysis of the inorganic components of PM2.5 at Seta Hill, Shiga Prefecture. Kankyo Gijyutsu. 2016, 45, 146–154. (In Japanese) [Google Scholar] [CrossRef]
- Lee, C.-T.; Lin, N.-H.; Wang, J.-L.; Sheu, G.-R.; Chang, S.-C.; Wang, S.-H.; Huang, H.; Chen, H.-W.; Liu, Y.-L.; Weng, G.-H.; et al. The enhancement of PM2.5 mass and water-soluble ions of biosmoke transported from Southeast Asia over the Mountain Lulin site in Taiwan. Atmos. Environ. 2011, 45, 5784–5794. [Google Scholar] [CrossRef]
- Lee, C.T.; Ram, S.S.; Nguyen, D.L.; Chou, C.C.; Chang, S.Y.; Lin, N.H.; Chang, S.C.; Hsiao, T.C.; Sheu, G.R.; Ou-Yang, C.F.; et al. Aerosol chemical profile of near-source biomass burning smoke in Sonla, Vietnam during 7-SEAS campaigns in 2012 and 2013. Aerosol Air Qual. Res. 2016, 16, 2603–2617. [Google Scholar] [CrossRef]
- Mkoma, S.I.; Kawamura, K.; Fu, P.Q. Contributions of biomass/biofuel burning to organic aerosols and particulate matter in Tanzania, East Africa, based on analysis of ionic species, organic and elemental carbon, levoglucosan and mannosan. Atmos. Chem. Phys. 2013, 13, 10325–10338. [Google Scholar] [CrossRef]
- Pani, S.K.; Lee, C.-T.; Chou, C.C.-K.; Shimada, K.; Hatakeyama, S.; Takami, A.; Wang, S.-H.; Lin, N.-H. Chemical characterization of wintertime aerosols over Islands and Mountains in East Asia: Impacts of the continental Asian outflow. Aerosol Air Qual. Res. 2017, 17, 3006–3036. [Google Scholar] [CrossRef]
- Irei, S. The Distribution of Aerosol Particulate Size and Its Chemical Composition in Okinawa Island. Bachelor’s. Thesis, Department of Chemistry, The University of the Ryukyus, Okinawa, Japan, 1996. [Google Scholar]
- Toyonaga, S.; Suito, Y.; Kitaoka, H. Analysis of the Influence of PM2.5 from Transboundary/Local Origins Based on the Chemical Composition Analysis. The Annual Report of the Kumamoto Prefectural Institute for Health and Environmental Science. 2014, Volume 44, pp. 57–66. Available online: https://www.pref.kumamoto.jp/uploaded/attachment/3800.pdf (accessed on 1 November 2023). (In Japanese).
- Oishi, O.; Hamamura, K.; Murano, K.; Mukai, H. Long-term trends in the component concentration data of gas-aerosols in Fukuoka Prefecture for the period of 1998–2012 compared to those of wet depositions. J. Jpn. Soc. Atmos. Environ. 2019, 54, 85–95. (In Japanese) [Google Scholar]
- Utsunomiya, A.; Hourai, S.; Yamashita, T.; Anai, K.; Morisaki, S.; Imamura, O.; Kawaida, T.; Kinjyo, Y.; Yamato, Y.; Oishi, O.; et al. Characteristics of aerosol concentration variation in the Kyushu-Okinawa district. J. Jpn. Soc. Atmos. Environ. 1996, 31, 132–140. [Google Scholar]
- Andreae, M.O. Emissions of trace gases and aerosols from biomass burning—An updated assessment. Atmos. Chem. Phys. 2019, 19, 8523–8546. [Google Scholar] [CrossRef]
- Rogers, C.F.; Hudson, J.G.; Zielinska, B.; Tanner, R.L.; Hallett, J.; Watson, J.G. Cloud condensation nuclei from biomass burning. In Global Biomass Burning Atmospheric, Climatic, and Biospheric Implications; Levine, J.E., Ed.; The MIT Press: Cambridge, MA, USA, 1991. [Google Scholar]
- Ezcurra, A.T.; de Zarate, O.; Lacaux, J.P.; Dinh, P.V. Atmospheric impact of cereal-waste burning in Spain. In Biomass Burning and Global Change Vol. 2: Biomass Burning in South America, South East Asia, and Temperate and Boreal Ecosystems, and the Oil Fires in Kuwait; Levine, J.E., Ed.; The MIT Press: Cambridge, MA, USA, 1996. [Google Scholar]
- Novakov, T.; Corrigan, C.E. Influence of sample composition on aerosol organic and black carbon determination. In Biomass Burning and Global Change Vol. 1: Remote Sensing, Modeling, and Inventory Development, and Biomass Burning in Africa; Levine, J.E., Ed.; The MIT Press: Cambridge, MA, USA, 1996. [Google Scholar]
- Kondo, Y.; Matsui, H.; Moteki, N.; Sahu, L.; Takegawa, N.; Kajino, M.; Zhao, Y.; Cubison, M.J.; Jimenez, J.L.; Vay, S.; et al. Emissions of black carbon, organics, and inorganic aerosols from biomass burning in North America and Asia in 2008. J. Geophys. Res. Atmos. 2011, 116, D08204. [Google Scholar] [CrossRef]
- Agarwal, S.; Aggarwal, S.G.; Okuzawa, K.; Kawamura, K. Size distribution of dicarboxylic acids, ketoacids, a-dicarbonyls, sugars, WSOC, OC, EC and inorganic ions in atmospheric particles over Northern Japan: Implication for long-range transport of Siberian biomass burning and East Asian polluted aerosols. Atmos. Chem. Phys. 2010, 10, 5839–5858. [Google Scholar] [CrossRef]
- Hayashi, K.; Ono, K.; Kajiura, M.; Sudo, S.; Yonemura, S.; Fushimi, A.; Saitoh, K.; Fujitani, Y.; Tanabe, K. Trace gas and particle emissions from open burning of three cereal crop residues: Increase in residue moistness enhances emissions of carbon monoxide, methane, and particulate organic carbon. Atmos. Environ. 2014, 95, 36–44. [Google Scholar] [CrossRef]
- Fuzzi, S.; Decesari, S.; Facchini, M.C.; Cavalli, F.; Emblico, L.; Mircea, M.; Andreae, M.O.; Trebs, I.; Hoffer, A.; Guyon, P.; et al. Overview of the inorganic and organic composition of size-segregated aerosol in Rondonia, Brazil, from the biomass-burning period to the onset of the wet season. J. Geophys. Res. Atmos. 2007, 112, D01201. [Google Scholar] [CrossRef]
- Maenhaut, W.; Koppen, G.; Artaxo, P. Long-term atmospheric study in Cuiaba, Brazil: Multielemental composition, sources, and impact of biomass burning. In Biomass Burning and Global Change Vol. 2: Biomass Burning in South America, South East Asia, and Temperate and Boreal Ecosystems, and the Oil Fires in Kuwait; Levine, J.E., Ed.; The MIT Press: Cambridge, MA, USA, 1996. [Google Scholar]
- Park, S.-S.; Sim, S.Y.; Bae, M.-S.; Schauer, J.J. Size distribution of water-soluble components in particulate matter emitted from biomass burning. Atmos. Environ. 2013, 73, 62–72. [Google Scholar] [CrossRef]
- Formenti, P.; Elbert, W.; Maenhaut, W.; Haywood, J.; Osborne, S.; Andreae, M.O. Inorganic and carbonaceous aerosols during the Southern African Regional Science Initiative (SAFARI 2000) experiment: Chemical characteristics, physical properties, and emission data for smoke from African biomass burning. J. Geophys. Res. 2003, 108, 8488. [Google Scholar] [CrossRef]
- Ambade, B.; Kumar, A.; Kumar, A.; Sahu, L.K. Temporal variability of atmospheric particulate-bound polycyclic aromatic hydrocarbons (PAHs) over central east India: Sources and carcinogenic risk assessment. Air Qual. Atmos. Health 2022, 15, 115–130. [Google Scholar] [CrossRef] [PubMed]


| Year and Date | Sampling Time (min) | Flow Rate (L min−1) | Type of Filter | Air Volume (m3) | |
|---|---|---|---|---|---|
| 2023 Hirado | 5 February 2023 | 93 | 80 | Quartz fiber | 7.4 |
| 2023 Akiyoshidai | 23 February 2023 | 122 | 80 | Quartz fiber | 9.8 |
| 2023 Aso_Nishihara | 26 February 2023 | 68 | 80 | Quartz fiber | 5.4 |
| 2023 Aso_Minamioguni 1 | 5 March 2023 | 92 | 80 | Quartz fiber | 7.4 |
| 2023 Aso_Minamioguni 2 | 12 March 2023 | 114 | 80 | Quartz fiber | 9.1 |
| 2023 Aso_Ubuyama 1 | 20 March 2023 | 129 | 80 | Quartz fiber | 10 |
| 2023 Aso_Ubuyama 2 | 29 March 2023 | 75 | 65 | Quartz fiber | 4.9 |
| 2023 Aso_Minamioguni 3 | 5 March 2023 | 37 | 80 | Quartz fiber | 3.0 |
| 2023 Aso_Minamioguni 4 | 11 March 2023 | 123 | 80 | Quartz fiber | 9.8 |
| 2023 Aso_Ubuyama 3 | 29 March 2023 | 99 | 80 | Quartz fiber | 7.9 |
| 2023 Aso_Minamioguni 5 | 5 March 2023 | 132 | 80 | Quartz fiber | 11 |
| s2022 Aso_Oguni | 25 March 2022 | 219 | 83 | PTFE-coated glass fiber | 18 |
| 2022 Aso_Minamioguni | 13 March 2022 | 252 | 80 | PTFE-coated glass fiber | 20 |
| 2022 Aso city 1 | 6 March 2022 | 43 | 80 | PTFE-coated glass fiber | 3.4 |
| 2022 Aso city 2 | 6 March 2022 | 15.7 | 69 | PTFE-coated glass fiber | 16 |
| 2022 Background Kurokawa | 2 June 2022 | 150 | 80 | Quartz fiber | 12 |
| 2022 Background Waita | 3 June 2022 | 120 | 83 | Quartz fiber | 9.9 |
| 2023 Background Hirado | 4 February 2023 | 300 | 80 | Quartz fiber | 24 |
| 2023 Background Akiyoshidai | 12 February 2023 | 301 | 80 | Quartz fiber | 24 |
| Temp (°C) | Wind Direction | Wind Speed (m s−1) | Humidity (%) | |
|---|---|---|---|---|
| 2023 Hirado | 8.2 | E | 1.8 | 50 |
| 2023 Akiyoshidai | 5.0 | W | 1.2 | 88 |
| 2023 Aso_Nishihara | 7.4 | NNE | 5.3 | na ‡ |
| 2023 Aso_Minamioguni 1 | 12.3 | NE | 2.1 | 42 |
| 2023 Aso_Minamioguni 2 | 18.1 | SSW | 2.1 | 58 |
| 2023 Aso_Ubuyama 1 | 17.3 | ESE | 2.8 | 47 |
| 2023 Aso_Ubuyama 2 | 14.1 | SE | 1.8 | 33 |
| 2023 Aso_Minamioguni 3 | 12.3 | NE | 2.1 | 42 |
| 2023 Aso_Minamioguni 4 | 18.1 | SSW | 2.1 | 58 |
| 2023 Aso_Ubuyama 3 | 14.1 | SE | 1.8 | 33 |
| 2023 Aso_Minamioguni 5 | 12.3 | NE | 2.1 | 42 |
| 2022 Aso_Oguni | 8.3 | N | 2.6 | na ‡ |
| 2022 Aso_Minamioguni | 17.6 | S | 2.4 | na ‡ |
| 2022 Aso city 1 | 8.4 | N | 5 | |
| 2022 Aso city 2 | 8.2 | E | 1.775 | 50 |
| 2022 Background Kurokawa | 27.8 | SSW | 2.45 | na ‡ |
| 2022 Background Waita | 26.3 | NW | 2.1 | na ‡ |
| 2023 Background Hirado | 5.3 | NNE | 1.6 | 57 |
| 2023 Background Akiyoshidai | 13.3 | S | 2.1 | 59 |
| Temp (°C) | Monthly Precipitation (mm) | Prevailing Wind Direction | Wind Speed (m s−1) | Humidity (%) | |
|---|---|---|---|---|---|
| February Hirado | 7.6 | 93.6 | NW | 3.6 | 65 |
| February Akiyoshidai | 4 | 91.4 | na ‡ | 2.5 | na ‡ |
| March Minamioguni | 6.8 | 162 | S | 1.2 | na ‡ |
| Sample | Na+ | NH4+ | K+ | Mg2+ | Ca2+ | Cl− | Br− | NO3− | PO43− | SO42− |
|---|---|---|---|---|---|---|---|---|---|---|
| 2023 Hirado | 0.6 | 1.2 | 1.1 | 0.98 | 1.8 | 0.14 | n.d. ‡ | 0.27 | n.d. ‡ | 0.12 |
| 2023 Akiyoshidai | 0.5 | 2.9 | 2.5 | 0.85 | 4.4 | 0.77 | n.d. ‡ | 0.62 | n.d. ‡ | 0.60 |
| 2023 Aso_Nishihara | 1.8 | 4.5 | 10.1 | 5.16 | 24.6 | 1.16 | n.d. ‡ | 0.28 | n.d. ‡ | 1.10 |
| 2023 Aso_Minamioguni 1 | 4.7 | 20.3 | 10.9 | 3.46 | 35.6 | 5.06 | n.d. ‡ | 0.67 | 0.3 | 1.75 |
| 2023 Aso_Minamioguni 2 | 1.5 | 10.6 | 6.5 | 2.32 | 23.4 | 0.15 | n.d. ‡ | 0.04 | 1.1 | 0.16 |
| 2023 Aso_Ubuyama 1 | 0.9 | 5.4 | 5.6 | 1.59 | 11.1 | 0.11 | n.d. ‡ | 0.03 | 0.1 | 0.09 |
| 2023 Aso_Ubuyama 2 | 0.4 | 4.2 | 4.6 | 1.45 | 9.0 | 0.80 | n.d. ‡ | 0.15 | n.d. ‡ | 0.51 |
| 2023 Aso_Minamioguni 3 | 0.2 | 2.0 | 0.6 | 0.46 | 0 † | 0.13 | n.d. ‡ | 0.42 | n.d. ‡ | 0.39 |
| 2023 Aso_Minamioguni 4 | 1.4 | 8.3 | 4.2 | 1.37 | 15.1 | 0.09 | n.d. ‡ | 0.02 | n.d. ‡ | 0.13 |
| 2023 Aso_Ubuyama 3 | 1.6 | 6.8 | 12.8 | 3.27 | 14.4 | 3.49 | n.d. ‡ | 0.82 | n.d. ‡ | 2.43 |
| 2023 Aso_Minamioguni 5 | 1.3 | 14.1 | 5.0 | 1.44 | 19.4 | 3.29 | n.d. ‡ | 0.48 | n.d. ‡ | 1.12 |
| 2022 Aso_Oguni | 1.6 | 0.6 | 0.8 | 0.25 | 2.0 | 0.55 | n.d. ‡ | 1.11 | n.d. ‡ | 2.44 |
| 2022 Aso_Minamioguni | 1.7 | 0.6 | 1.2 | 0.31 | 2.8 | 1.62 | n.d. ‡ | 0.52 | n.d. ‡ | 2.80 |
| 2022 Aso city 1 | 8.6 | 0.8 | 4.8 | 1.80 | 10.0 | 8.05 | n.d. ‡ | 1.41 | n.d. ‡ | 5.03 |
| 2022 Aso city 2 | 2.5 | 6.3 | 6.7 | 1.41 | 5.4 | 16.96 | n.d. ‡ | 1.74 | n.d. ‡ | 4.59 |
| Sample | ΔNa+ | ΔNH4+ | ΔK+ | ΔMg2+ | ΔCa2+ | ΔCl− | ΔNO3− | ΔSO42− |
|---|---|---|---|---|---|---|---|---|
| 2023 Hirado | −0.6 | 0.6 | 0.8 | 0.92 | 1.5 | −0.34 | −1.32 | −2.69 |
| 2023 Akiyoshidai | −0.7 | 2.4 | 2.1 | 0.80 | 4.2 | 0.28 | −0.96 | −2.21 |
| 2023 Aso_Nishihara | 0.7 | 4.0 | 9.7 | 5.10 | 24.4 | 0.68 | −1.30 | −1.71 |
| 2023 Aso_Minamioguni 1 | 3.5 | 19.7 | 10.5 | 3.41 | 35.3 | 4.58 | −0.92 | −1.06 |
| 2023 Aso_Minamioguni 2 | 0.4 | 10.0 | 6.1 | 2.27 | 23.2 | −0.34 | −1.55 | −2.65 |
| 2023 Aso_Ubuyama 1 | −0.3 | 4.9 | 5.2 | 1.53 | 10.8 | −0.37 | −1.56 | −2.71 |
| 2023 Aso_Ubuyama 2 | −0.7 | 3.7 | 4.2 | 1.39 | 8.7 | 0.32 | −1.44 | −2.30 |
| 2023 Aso_Minamioguni 3 | −0.9 | 1.5 | 0.2 | 0.40 | −0.6 | −0.36 | −1.16 | −2.42 |
| 2023 Aso_Minamioguni 4 | 0.3 | 7.7 | 3.8 | 1.31 | 14.9 | −0.40 | −1.56 | −2.68 |
| 2023 Aso_Ubuyama 3 | 0.4 | 6.3 | 12.4 | 3.21 | 14.2 | 3.00 | −0.76 | −0.38 |
| 2023 Aso_Minamioguni 5 | 0.1 | 13.6 | 4.6 | 1.38 | 19.2 | 2.81 | −1.10 | −1.69 |
| 2022 Aso_Oguni | 0.5 | 0.0 | 0.4 | 0.19 | 1.8 | 0.06 | −0.48 | −0.37 |
| 2022 Aso_Minamioguni | 0.5 | 0.0 | 0.8 | 0.25 | 2.6 | 1.13 | −1.06 | 0.00 |
| 2022 Aso city 1 | 7.5 | 0.2 | 4.4 | 1.74 | 9.7 | 7.57 | −0.18 | 2.23 |
| 2022 Aso city 2 | 1.3 | 5.7 | 6.3 | 1.35 | 5.2 | 16.48 | 0.15 | 1.78 |
| ΔNa+ | ΔNH4+ | ΔK+ | ΔMg2+ | ΔCa2+ | ΔCl− | ΔNO3− | ΔSO42− | |
|---|---|---|---|---|---|---|---|---|
| ΔNa+ | 1 | 0.014 | 0.074 | 0.063 | 0.087 | 0.261 | 0.317 | 0.517 |
| ΔNH4+ | 1 | 0.357 | 0.208 | 0.718 | 0.020 | 0.024 | 0.027 | |
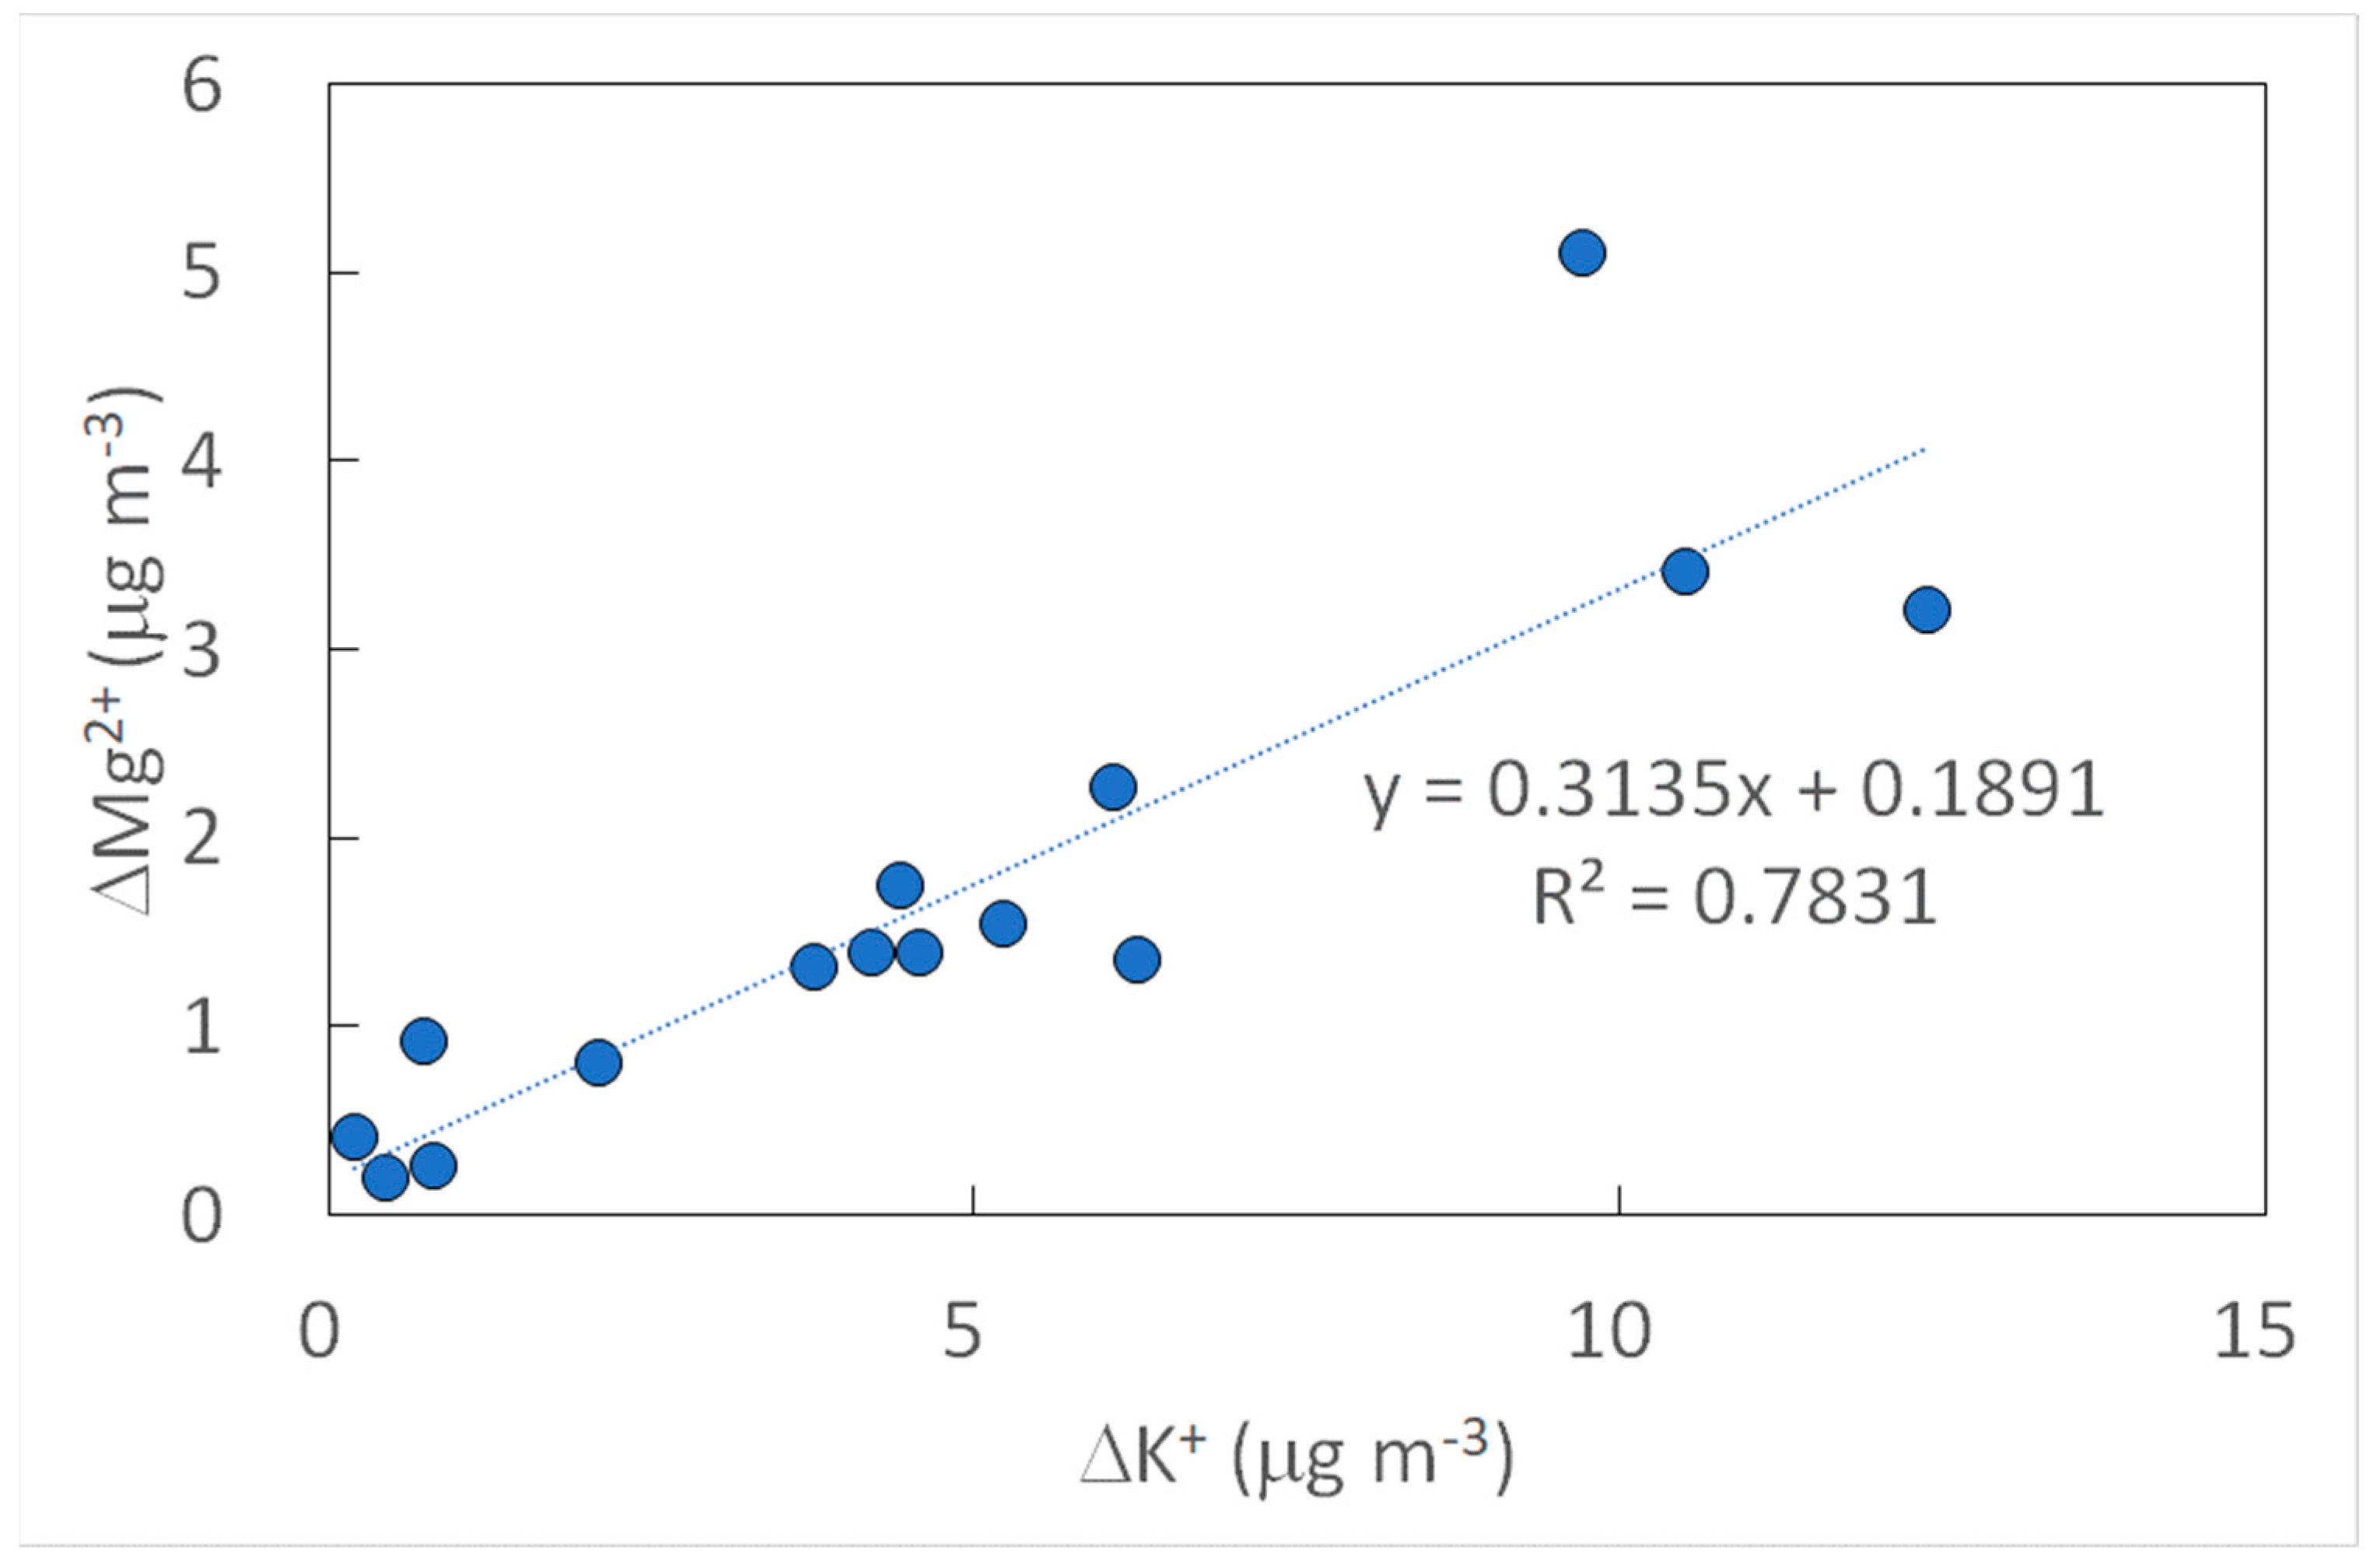
| ΔK+ | 1 | 0.783 | 0.589 | 0.089 | 0.005 | 0.024 | ||
| ΔMg2+ | 1 | 0.628 | 0.008 | 0.011 | 0.000 | |||
| ΔCa2+ | 1 | 0.000 | 0.055 | 0.016 | ||||
| ΔCl− | 1 | 0.683 | 0.641 | |||||
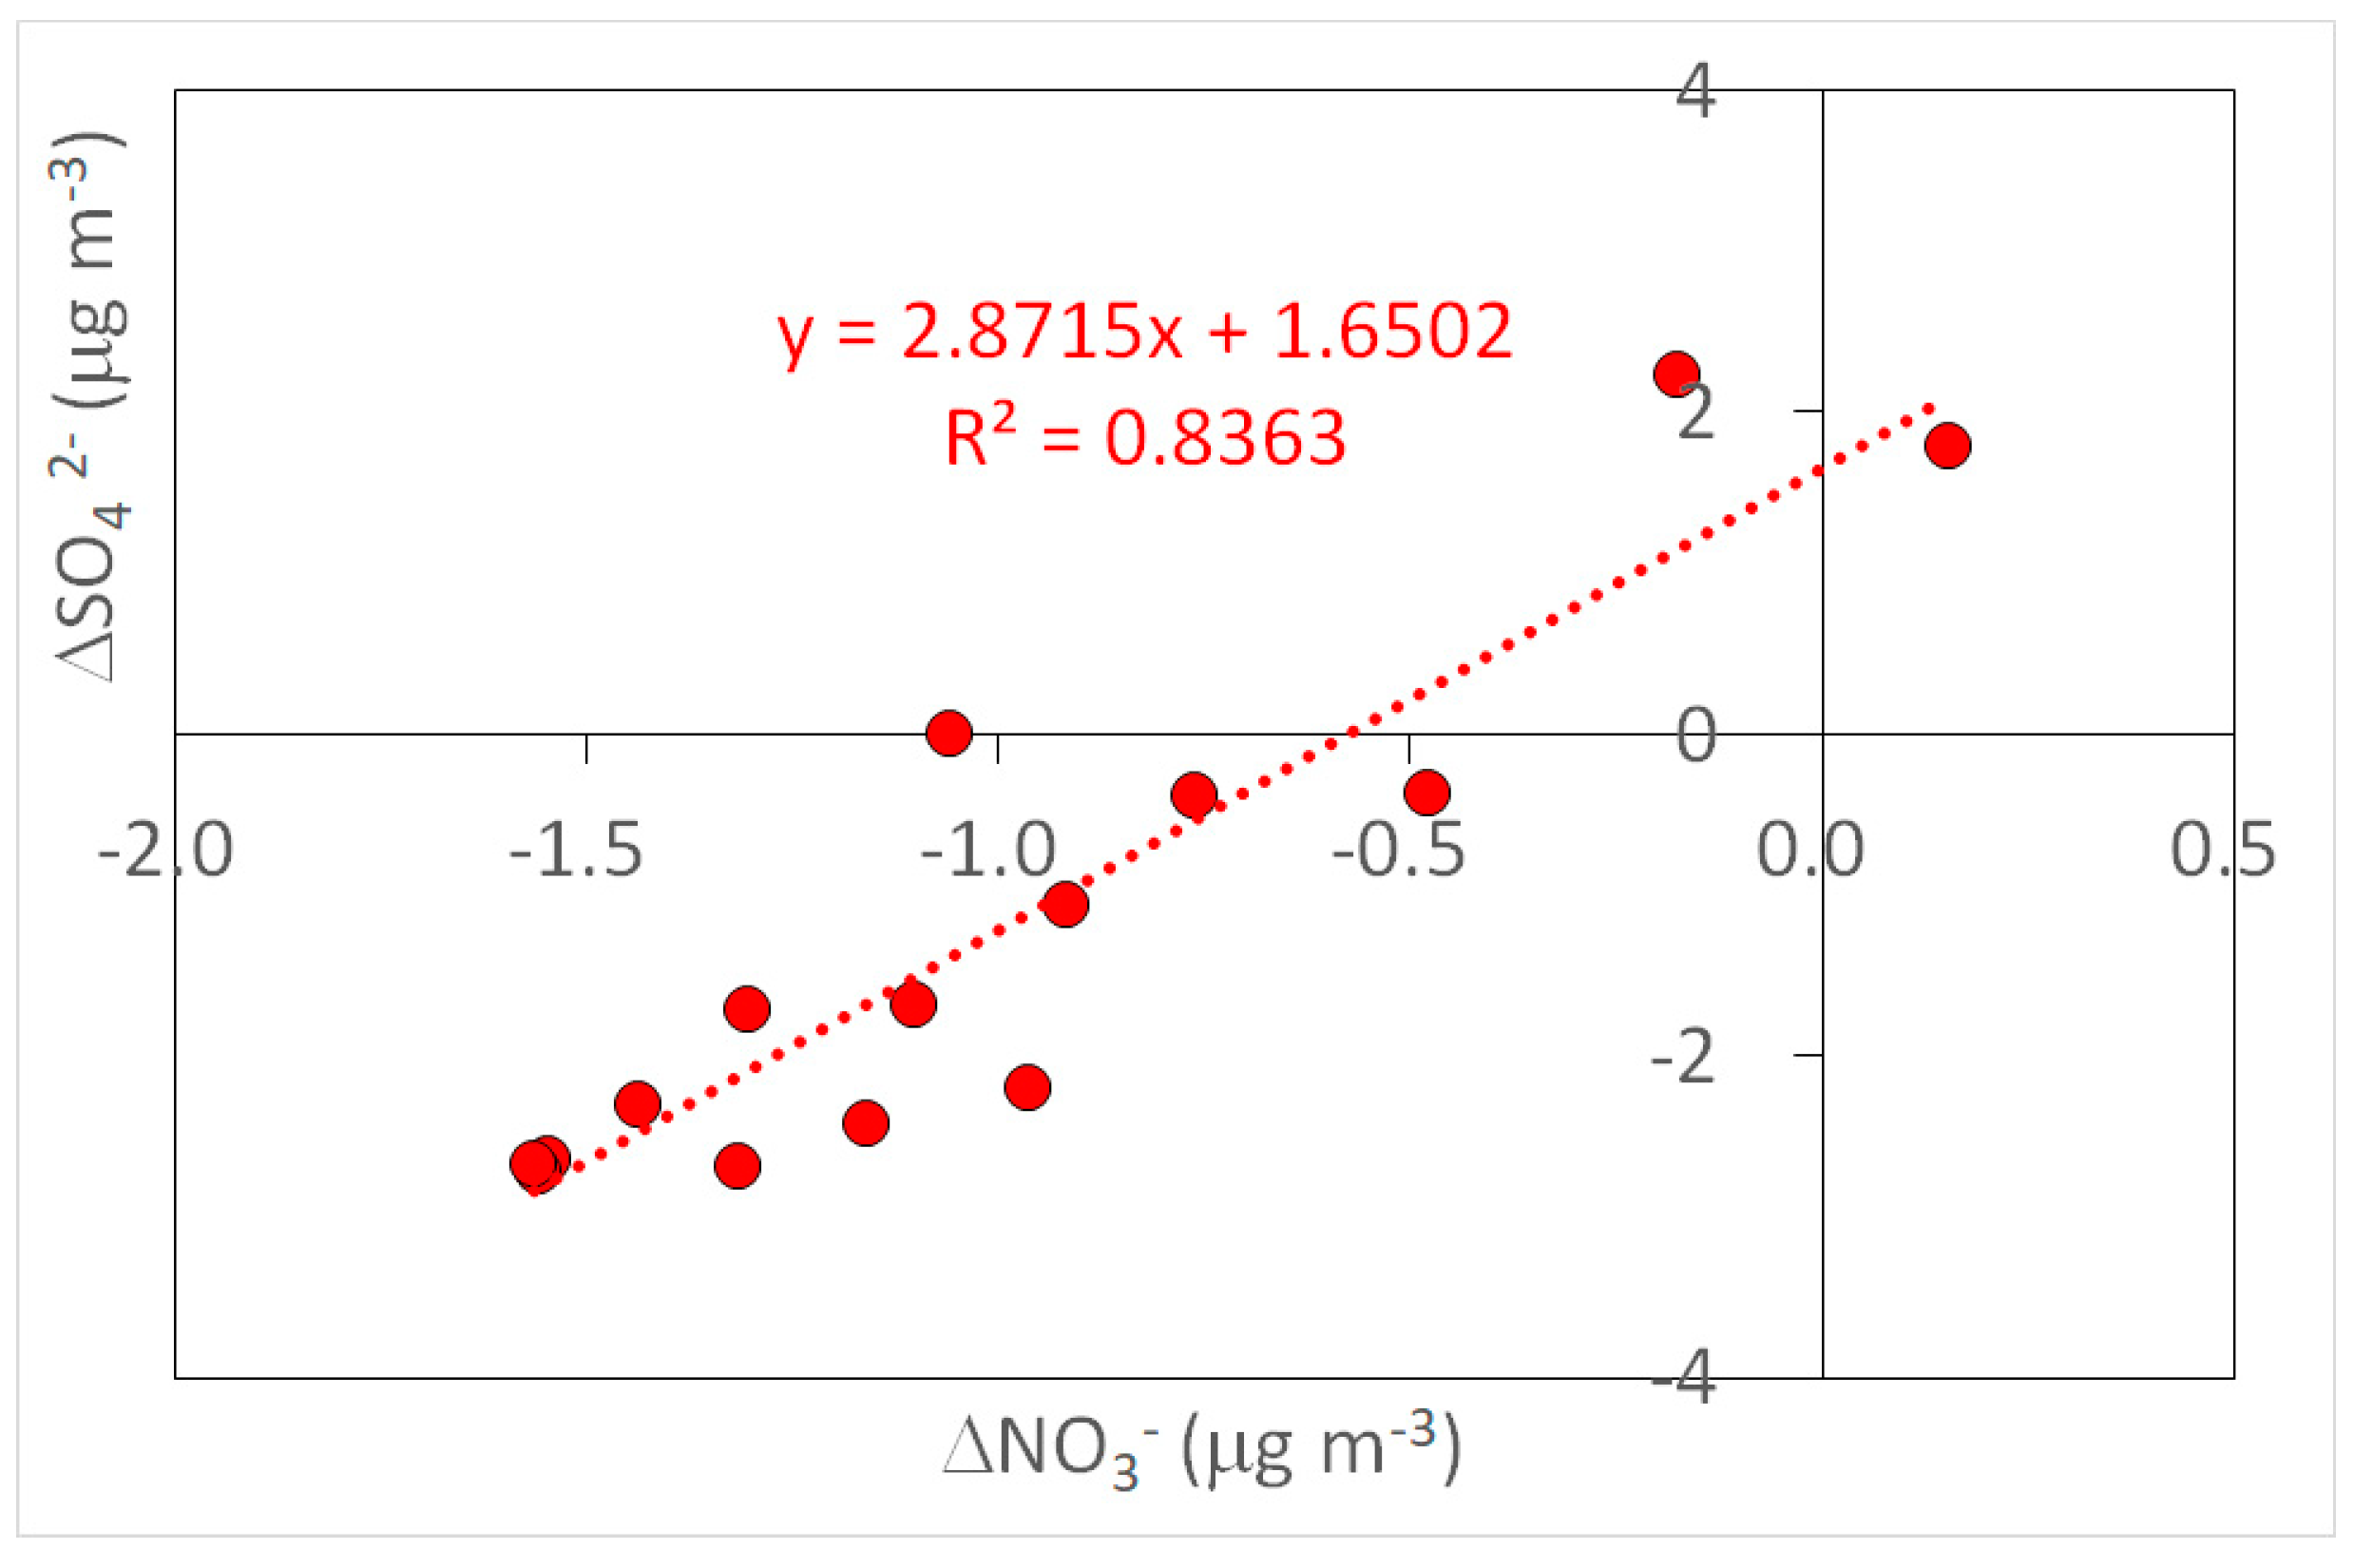
| ΔNO3− | 1 | 0.836 | ||||||
| ΔSO42− | 1 |
| Sample | Na+ | NH4+ | K+ | Mg2+ | Ca2+ | Cl− | NO3− | SO42− |
|---|---|---|---|---|---|---|---|---|
| This study ** | 1.0 | 5.3 | 4.8 | 1.7 | 12 | 2.6 | 0.22 | 0.46 |
| California chaparral (mass %) *** | 0.33 | 0.82 | 4.86 | n.a. * | n.a. * | 4.15 | 1.34 | 2.2 |
| Oregon rye grass (mass %) *** | 0.24 | 0.16 | 0.89 | n.a. * | n.a. * | 1.17 | 0.11 | 1 |
| Burning period (μg m−3) † | 0.8 | 0.8 | 1.2 | n.a. * | 1.9 | 0.8 | n.a. * | 3.2 |
| Smoke samples (average mass fraction) ‡ | 0.0235 | n.a. * | 0.0775 | n.a. * | n.a. * | 0.1075 | n.a. * | 0.025375 |
| BB plumes in Asia (μg m−3) ‖ | n.a. * | 0.398 | n.a. * | n.a. * | n.a. * | 0.0192 | 0.138 | 1.67 |
| Biomass burning (μg m−3) § | n.a. * | 1 | 0.11 | 0.005 | 0.01 | <0.01 | 0.15 | 2 |
| 10.6% moist. rice straw (g kg−1) ˦ | n.a. * | 0.083 | n.a. * | n.a. * | n.a. * | 0.3 | 0.006 | 0.027 |
| 12% moist. wheat straw (g kg−1) ˦ | n.a. * | 0.034 | n.a. * | n.a. * | n.a. * | 0.12 | 0.006 | 0.031 |
| 11.2% moist. barley straw (g kg−1) ˦ | n.a. * | 0.081 | n.a. * | n.a. * | n.a. * | 1.53 | 0.005 | 0.121 |
| 13.1% moist. rice husk (g kg−1) ˦ | n.a. * | 0.043 | n.a. * | n.a. * | n.a. * | 0.13 | 0.007 | 0.02 |
| Dry (biomass burning) period (μg m−3) ˩ | n.a. * | 1.41 | 0.95 | n.a. * | n.a. * | n.a. * | 2.23 | 1.44 |
| Average agricultural crop (mass %) | 0.35 | 0.79 | 8.9 | 0.063 | 0.55 | 4.9 | 0.37 | 2.5 |
| PM2.5 dry season in Tanzania (μg m−3) | 0.62 | 0.93 | 1.5 | 0.079 | 0.30 | 0.08 | 0.18 | 0.26 |
| PM10 dry season in Tanzania (μg m−3) | 2.2 | 0.65 | 1.9 | 0.46 | 1.7 | 0.33 | 0.44 | 0.56 |
| Fine PM from fresh smoke during SAFARI 2000 (μg m−3) | n.a. * | n.a. * | 4.5 | n.a. | 0.10 | 0.27 | 1.4 | 1.9 |
| Coarse PM from fresh smoke during SAFARI 2000 (μg m−3) | n.a. * | n.a. * | 1.4 | 0.64 | 2.2 | 0.26 | 4.2 | 1.3 |
| CMB biomass burning profile (unitless) # | 33 | n.a. * | 89 | n.a. * | 4 | 100 | n.a. * | n.a. * |
Disclaimer/Publisher’s Note: The statements, opinions and data contained in all publications are solely those of the individual author(s) and contributor(s) and not of MDPI and/or the editor(s). MDPI and/or the editor(s) disclaim responsibility for any injury to people or property resulting from any ideas, methods, instructions or products referred to in the content. |
© 2024 by the authors. Licensee MDPI, Basel, Switzerland. This article is an open access article distributed under the terms and conditions of the Creative Commons Attribution (CC BY) license (https://creativecommons.org/licenses/by/4.0/).
Share and Cite
Irei, S.; Yonemura, S.; Kameyama, S.; Sakuma, A.; Shimazaki, H. Emission of Particulate Inorganic Substances from Prescribed Open Grassland Burning in Hirado, Akiyoshidai, and Aso, Japan. Air 2024, 2, 61-72. https://doi.org/10.3390/air2010004
Irei S, Yonemura S, Kameyama S, Sakuma A, Shimazaki H. Emission of Particulate Inorganic Substances from Prescribed Open Grassland Burning in Hirado, Akiyoshidai, and Aso, Japan. Air. 2024; 2(1):61-72. https://doi.org/10.3390/air2010004
Chicago/Turabian StyleIrei, Satoshi, Seiichiro Yonemura, Satoshi Kameyama, Asahi Sakuma, and Hiroto Shimazaki. 2024. "Emission of Particulate Inorganic Substances from Prescribed Open Grassland Burning in Hirado, Akiyoshidai, and Aso, Japan" Air 2, no. 1: 61-72. https://doi.org/10.3390/air2010004