Review

Contribution of Road Transport to Pakistan’s Air Pollution in the Urban Environment

by
Abdullah Umair Bajwa
1 and
Hassan Aftab Sheikh
2,*
1
Department of Engineering Science, University of Oxford, Parks Rd, Oxford OX1 3PJ, UK
2
Department of Earth Sciences, University of Cambridge, Downing St., Cambridge CB2 3EQ, UK
*
Author to whom correspondence should be addressed.
Air 2023, 1(4), 237-257; https://doi.org/10.3390/air1040018
Submission received: 25 September 2023 / Revised: 18 October 2023 / Accepted: 25 October 2023 / Published: 2 November 2023

Abstract

:
The urban areas of Pakistan exhibit some of the world’s highest levels of air pollution, primarily due to sub-2.5 μm particulate emissions. This issue significantly impairs both the country’s economy and the quality of life of its residents. Road transport is a significant contributor to anthropogenic air pollution but there are discrepancies about the extent of its share. Source apportionment and sectoral inventory studies attribute anywhere between 5 and >80% of the total air pollution to vehicular sources. This uncertainty propagates into the transport policy interventions that are informed by such studies and can thus hinder the achievement of desired pollution mitigation targets. In an effort to reconcile such discrepancies and guide future studies and policy-making efforts, this paper critically reviews source apportionment studies conducted in the urban centres of Pakistan over the past two decades. The strengths and weaknesses of different approaches are compared, and results from the studies are discussed based on the emissions profile of Pakistan’s automotive fleet that emerges. Inconsistencies in the reporting of pollutant concentrations and interpreting their impacts without accounting for the relative disease burden of different pollutant species are found to be the major reasons for the large variations in the reported sectoral shares. At the end, a framework for regular air pollution monitoring and source tracking is proposed in which high-fidelity receptor-based studies inform lower-fidelity but economical sectoral inventory assessments.

1. Introduction and Background

The global transport system accounts for around 16% of the world’s greenhouse gas (GHG) emissions, and around half of these originate from road passenger vehicles, which are at present, mostly powered by internal combustion (IC) engines running on fossil fuels [1]. Moreover, harmful pollutants emitted by vehicles are significant contributors to local air pollution. Globally, around 27% of urban air pollution is attributed to road transport [2]. Pakistan, the world’s fifth most populous country with a population of over 240 million [3], contributes minimally to the global warming problem with its humble sub-0.5% share of the total GHG emissions [4]. Around 23% of Pakistan’s GHG emissions originate from road transport [5]. The transport emissions are also associated with dangerously high levels of air pollution present in Pakistan’s urban centres [6,7,8]. The country’s air quality is currently ranked as the worst (180 out of 180) in the world [9]. Air pollution has been estimated to reduce the average life expectancy in Pakistan by nearly four years [10]. However, significant uncertainty exists about the extent of the road transport sector’s contribution to air pollution in Pakistan’s urban centres. Some source apportionment/sectoral inventory studies have estimated the share of transport to be below 5% [5], while others have reported values above 70% [6,11]. This large variation is believed to result from: (i) the scarcity of high-fidelity, primary pollutant emissions data, which necessitates indirect estimation approaches, and (ii) differences in interpretation and reporting of the contributions of various pollutant species.
This paper attempts to reconcile these differences by providing a background of the primary source of road transport emissions in Pakistan, i.e., the internal combustion (IC) engine. Based on a survey of source apportionment studies, the relative strengths and weaknesses of different apportionment modelling approaches are compared. It is hoped that the comparison will support policymakers in the interpretation of source apportionment results and researchers in designing suitable studies. This can, in turn, help design suitable transport interventions to improve air quality and provide tools to monitor their impact. The discussion includes the major urban centres of Pakistan: Karachi, Lahore, Rawalpindi/Islamabad, Faisalabad, Peshawar, Gujranwala, and Quetta (Figure 1).
After presenting a background to the air quality problem, the production of pollutants from vehicles in Pakistan is discussed (Section 2 and Section 3), followed by a thorough review of source apportionment studies from Pakistan’s urban centres (Section 4); based on these studies, at the end (Section 5 and Section 6), recommendations are given for monitoring the contribution of vehicular emissions to Pakistan’s urban air pollution.

1.1. The Air Quality Problem

Air quality is a broad term used to characterise ambient air pollution levels. Common airborne pollutants that are of concern for human health include: carbon monoxide (CO), nitrogen dioxide (NO2), tropospheric (ground level) ozone (O3), particulate matter (PM), and sulphur dioxide (SO2) [13]. These pollutants are responsible for multiple cardiovascular, respiratory, and neurological ailments [6,14,15,16,17,18,19,20]. There is no safe level of air pollution [21], and vulnerable populations (children, the elderly, and people with co-morbidities) are most at risk. For example, school children in Lahore have been found to be exposed to high concentrations of toxic metals like chromium in the air [22], and the cognitive performance of school children in Lahore and Islamabad has been reported to be significantly associated with exposure to air pollution [23], with children in the relatively more polluted city (Lahore) performing poorly on cognitive tests. Similarly, vehicular and industrial dominated pollution in Quetta [24] and Malakand [25] found associations of physical health deterioration (particularly related to allergies and respiratory diseases) among the surveyed population.
Unlike climate change, air quality degradation is a regional problem, i.e., its sources and solutions lie at the local/regional level. Thus, there is a strong impetus to address the problem for Pakistan by introducing appropriate interventions to mitigate the local causes and realise health benefits for its inhabitants. Doing so also can yield co-benefits for climate change mitigation [5].

1.1.1. Indexing Air Quality

To effectively communicate the overall quality of ambient air, the concentration of harmful pollutants is frequently summarised as an Air Quality Index (AQI). Such indices are scaled, weighted averages of airborne pollutant concentrations based on their relative harm potential (i.e., disease burden). The most common AQI is the one developed by the US Environmental Protection Agency (EPA), originally in 1976 [26]. It considers six pollutant species (O3, PM2.5, PM10, CO, NO2, SO2) and ranks air quality on a “good” to “severely unhealthy” scale [27]. The pollutant with the highest score is taken to be the AQI value. The AQI can thus be regarded as a conservative index of air pollution, as it does not consider the cumulative health effects of all pollutants [26]. The AQI used by Punjab’s (Pakistan’s most populous province, home to around 53% of the country’s population [28]) Environmental Protection Department (EPD) is a variant of the US EPA index. It is based on the same six criteria pollutants [29]; however, the choice of pollutant weighting factors and air quality categorisation is not in conformance with international standards. It, thus, under-states the severity of air pollution, e.g., “very unhealthy” as per US EPA’s AQI is considered “moderately polluted” as per Punjab EPD’s AQI [7]. Moreover, air quality reports published by the EPD only include PM2.5 and PM10 concentrations [30].

1.1.2. Particulate Matter—The Principal Pollutant and Air Quality Index

Particulate matter (PM) refers to emissions of small solid or semi-solid particles, as opposed to gaseous pollutants like NO2, CO, or SO2. PM can vary in size, based on its sources and transport mechanisms, from a few nm to hundreds of μm [16]. Smaller particles are more harmful to human health because they can penetrate deeper into the respiratory system and seep into the bloodstream [16]. In air pollution measurements, PM is commonly divided into two subgroups based on the average aerodynamic particle diameter: fine particles up to 2.5 µm are binned under PM2.5, and coarse particles up to 10 µm in size are collectively reported as PM10.
Another term used in reference to particulate matter is aerosols. This refers to suspended PM which results when fine particles (in the so-called “transient range”) grow by the coagulation of multiple particles and condensation of volatile organic compounds (VOCs). “VOCs” is used herein to be consistent with the air quality literature. In the IC engine context, “unburned hydrocarbons” is a more apt descriptor. Gaseous pollutants present in the air, most notably oxides of nitrogen (NOx) and sulphur (SOx), and ammonia, also contribute to the growth of fine particulates. Aerosols up to 2 µm can stay suspended in the atmosphere for 1–2 weeks and are capable of long-range transport. Mechanically generated PM, e.g., re-suspended and wind-blown dust, road, and tyre wear, are larger in size (2–100 µm) and settle down via sedimentation [16].
The dispersal of aerosols in the air depends strongly on local meteorological conditions. Generally, dispersal is poor in winter when the air density is high and wind velocities are low, and during temperature inversion events. Fine aerosol particles can be rained or washed out via precipitation. It is the net effect of these meteorological conditions that the lowest PM2.5 concentrations in Lahore have been reported during the monsoon season (July to September) [6], and winter concentrations have been found to be four times greater than summer levels [31].
Urban smog: A visible manifestation of poor air quality in Pakistani cities in the plains during the winter is the occurrence of smog. Smog, a portmanteau of smoke and fog, is formed by reactions between O3, PM, VOCs, NOx, and SOx, with PM2.5 being a main precursor [8,32]. In the cold and humid conditions common during winter in these cities, suspended PM2.5 act as condensation nuclei, forming fog droplets and leading to severely reduced visibility [16,33]. Up to 70% of the smog in Lahore has been reported to be comprised of NOx, a major source of which are road vehicles [34]. Smog can cause multiple adverse health impacts, including exacerbation of asthma, allergies, eye and respiratory infections, diabetes, and cardiac ailments [32,35].
PM as an AQI: Frequently, the concentration of PM is used as a proxy for AQI, as it has the strongest effect on air quality and pulmonary health, especially PM2.5, which even in small quantities (55 µg/m3 over 24 h) renders air “unhealthy” [27,36]. The World Health Organisation (WHO) air quality guidelines recommend 15 and 45 µg/m3 over 24 h for PM2.5 and PM10, respectively [37]. Pakistan’s National Ambient Air Quality Standards (NAAQS), introduced in 2005, are higher than the WHO guidelines at 35 and 75 µg/m3, respectively [13,36]. Because of the very high disease burden of PM2.5, achieving PM2.5 NAAQS targets has been set as a priority in the recently launched Pakistan’s National Clean Air Policy of 2023 [38]. Urban centres in Pakistan report hazardous PM2.5 levels during most of the year [6,31,39], e.g., Lahore reported PM2.5 levels up to 123 µg/m3 in 2019 [38] and PM2.5 concentration in Peshawar averaged at around 80 µg/m3 in 2018 [40]. In such scenarios, the reported AQI is effectively a PM2.5 index as that is always the species with the highest pollution score.

2. Vehicle Pollutant Emissions

The combustion of common petroleum fuels like petrol and diesel in IC engines releases the following major species: nitrogen, water, CO2, O2, NOx, CO, unburned hydrocarbons (VOCs), and PM in the exhaust. Secondary species like SO2, N2O, aldehydes, and ammonia can also be produced [41]. CO2 is a GHG and is thus harmful to the global environment but in the amounts leaving automotive exhaust, it is not harmful to human health directly. Water and nitrogen are benign species. The remaining species (CO, NOx, VOCs, PM, and SO2) are pollutants and have harmful health implications. In addition to these exhaust emissions, non-exhaust emissions (as PM) are also produced by vehicles, most notably from brake, tyre, and road wear, and re-suspension of previously deposited roadside dust [42]. While in automotive markets with strong exhaust emissions regulations (e.g., the Euro 6d or Carb LEV III [43]), non-exhaust emissions are becoming the predominant source of PM emissions [1], in a market like Pakistan with weak emissions regulations (Euro 2), exhaust emissions are of greater concern. In fact, modern engines emit harmful exhaust pollutants in incredibly low amounts—so much so that it is starting to be claimed that “we have effectively solved the exhaust pollutant emission problem from internal combustion engine vehicles” [1].

2.1. Pollutant Production in IC Engines

Oxides of nitrogen (NOx) are formed by the combination of nitrogen and oxygen from the air at the high temperatures present during combustion. Engine designs and combustion regimes that lower combustion temperatures reduce NOx emissions.
CO and VOCs are products of incomplete combustion, and can be reduced by improving the mixing of fuel and air to promote complete combustion. VOCs also arise from misfiring combustion, wall wetting, crevice release, and direct evaporation from fuel tanks, especially in warm climates. Unburned hydrocarbon emissions from compressed natural gas (CNG) vehicles also include methane, which is a very potent GHG and contributes to ground-level O3 formation.
Particulate emissions result from the combustion of locally concentrated (rich), especially liquid, hydrocarbon fuel parcels. Most PM from the exhaust is composed of very fine particles (transient nuclei) but they grow rapidly via VOC (most notably polycyclic hydrocarbons, PAHs) condensation to form larger (accumulation range) particles [16]. Previous studies have found that PAHs in combustion engines are formed due to incomplete combustion during thermal synthesis [44]. PAHs are therefore considered molecular markers for combustion sources in source apportionment studies [15]. PM emissions are higher for engines with poor air–fuel mixing.
SO2 emissions result from the oxidation of sulphur in the fuel or lube oil. Sulphur is a naturally occurring component of crude oil but is removed during fuel refinement to comply with regulatory limits (Table 1). Thus, SO2 emissions are controlled not via combustion and emissions control technologies (as is the case for NOx, PM, CO, and VOC emissions) but by removing the feedstock needed for its generation. SO2 emissions are negligible in markets with strong fuel regulations. In the UK, for example, atmospheric SO2 levels dropped by 95% from 1970 to 2014 because of the removal of sulphur from petroleum fuels [1].

2.2. Determinants of IC Engine Emissions

Some important engine design and operating parameters that affect pollutant production are listed below [1,46].
Air-to-fuel ratio: If more air is supplied than is needed to completely oxidise the available fuel (the stoichiometric amount), the mixture is considered fuel-lean and leads to more complete and cooler combustion. This reduces emissions of VOCs, CO, and NOx. Burning stoichiometric or rich is desirable from a drivability perspective, even though doing so can impose an efficiency (fuel consumption) penalty.
Engine combustion mode: The two most common engine combustion systems are compression ignition and spark ignition systems. Engines employing these are colloquially referred to as diesel and petrol engines, respectively, because of the predominant fuels traditionally used in them even though spark ignition engines are commonly used to burn other fuels (e.g., CNG, LPG, ethanol) as well. Compression ignition engines operate fuel-lean but are direct fuel-injected, whereby locally rich fuel–air parcels combust in a globally lean combustion process that is limited by the mixing of the injected fuel with air. This leads to the formation of soot and high PM emissions, but low CO and VOC emissions. Petrol engines mostly operate on stoichiometric mixtures and have relatively high VOC and notable CO emissions.
Fuel metering system: Fuel can be admitted into an engine via (direct or indirect) injection, or carburetion. Injection-based metering provides precise control over mixture air–fuel ratios. Direct (in-cylinder) injection can form spatially stratified mixtures and improve engine efficiency and stability, which reduces CO and VOC emissions. This can, however, lead to higher PM emissions. Petrol engines have in the past been carburetted or indirectly injected, but modern engines increasingly have direct injection systems. Resultantly, PM emissions, which have traditionally been very low for petrol engines, have become notable. Modern emissions regulations like Euro 6 thus have strict PM (4.5 mg/km) and particle number (6 × 10¹¹/km) limits [43].
Engine operating cycle: IC engines usually operate on a two-stroke (2SC) or a four-stroke cycle (4SC). Although 2SC engines have the advantage of having higher specific power (better drivability) and simpler design (higher reliability, lower cost), they have traditionally suffered from high exhaust pollutant emissions, especially the small engines used in 2/3 wheelers. Such engines are crank-case scavenged, whereby they cannot have a lube oil sump and thus require oil to be mixed with fresh air (at a ratio of around 1:40) [47]. The combustion of this lube oil leads to high VOC, PM [15], and SO2 [48] emissions. Moreover, traditional 2SC designs suffer from low levels of mixing of fuel with air, which leads to increased CO, PM, and VOC emissions.
Fuel properties: The chemical and physical properties of fuels also affect the production of emissions, e.g., fuels with higher sulphur and aromatic (benzene derivatives) compounds produce more PM emissions, fuels with low carbon to hydrogen ratio (e.g., natural gas) produce low CO emissions, gaseous fuels produce lower PM emissions, and oxygenated fuels (e.g., ethanol-blended petrol) tend to have higher aldehyde emissions. Requirements about fuel composition are defined by fuel quality standards (Table 1). A fuel’s propensity to generate PM emissions can be indexed by so-called PM Indices [49].
After-treatment systems: If pollutant concentrations cannot be reduced via combustion management, they should be lowered in the vehicle exhaust through “after-treatment” systems. Some common after-treatment devices used in countries with strict emissions regulations are:
  • Three-way catalysts simultaneously reduce exhaust concentrations of CO, VOCs, and NOx in spark ignition engines. They require stoichiometric engine operation.
  • Selective catalytic reduction catalysts are used in lean-burning engines, mostly diesel engines, to reduce NOx emissions. An on-board reservoir of an ammonia-releasing compound like urea is required for their operation.
  • Oxidation catalysts oxidise unburned fuel and products of incomplete combustion (CO and VOCs) to CO2. They are also known as two-way catalysts or catalytic converters [1].
  • Particulate filters trap PM emissions and regenerate periodically via rich burning events. Originally made for diesel engines (as diesel particulate filters, DPFs) such filters are now increasingly being used for direct injected petrol engines (as gasoline particulate filters, GPFs).
Many of these after-treatment systems use precious metals as catalysts that can be “poisoned” if the fuel is not of sufficiently high quality, e.g., diesel particulate filters and selective catalytic converters require sub-50 ppm levels of sulphur to operate effectively as “soot-free” vehicles, and three-way catalysts can be poisoned by high sulphur content fuel [45]. The lack of modern standard fuels thus not only causes high emissions production (e.g., of SO2, PM) directly but also indirectly by hindering the adoption of vehicles with advanced after-treatment systems. A related example is from 2017 when Honda stopped the production of its Civic sedan in Pakistan purportedly because of high manganese levels in the fuel [50].

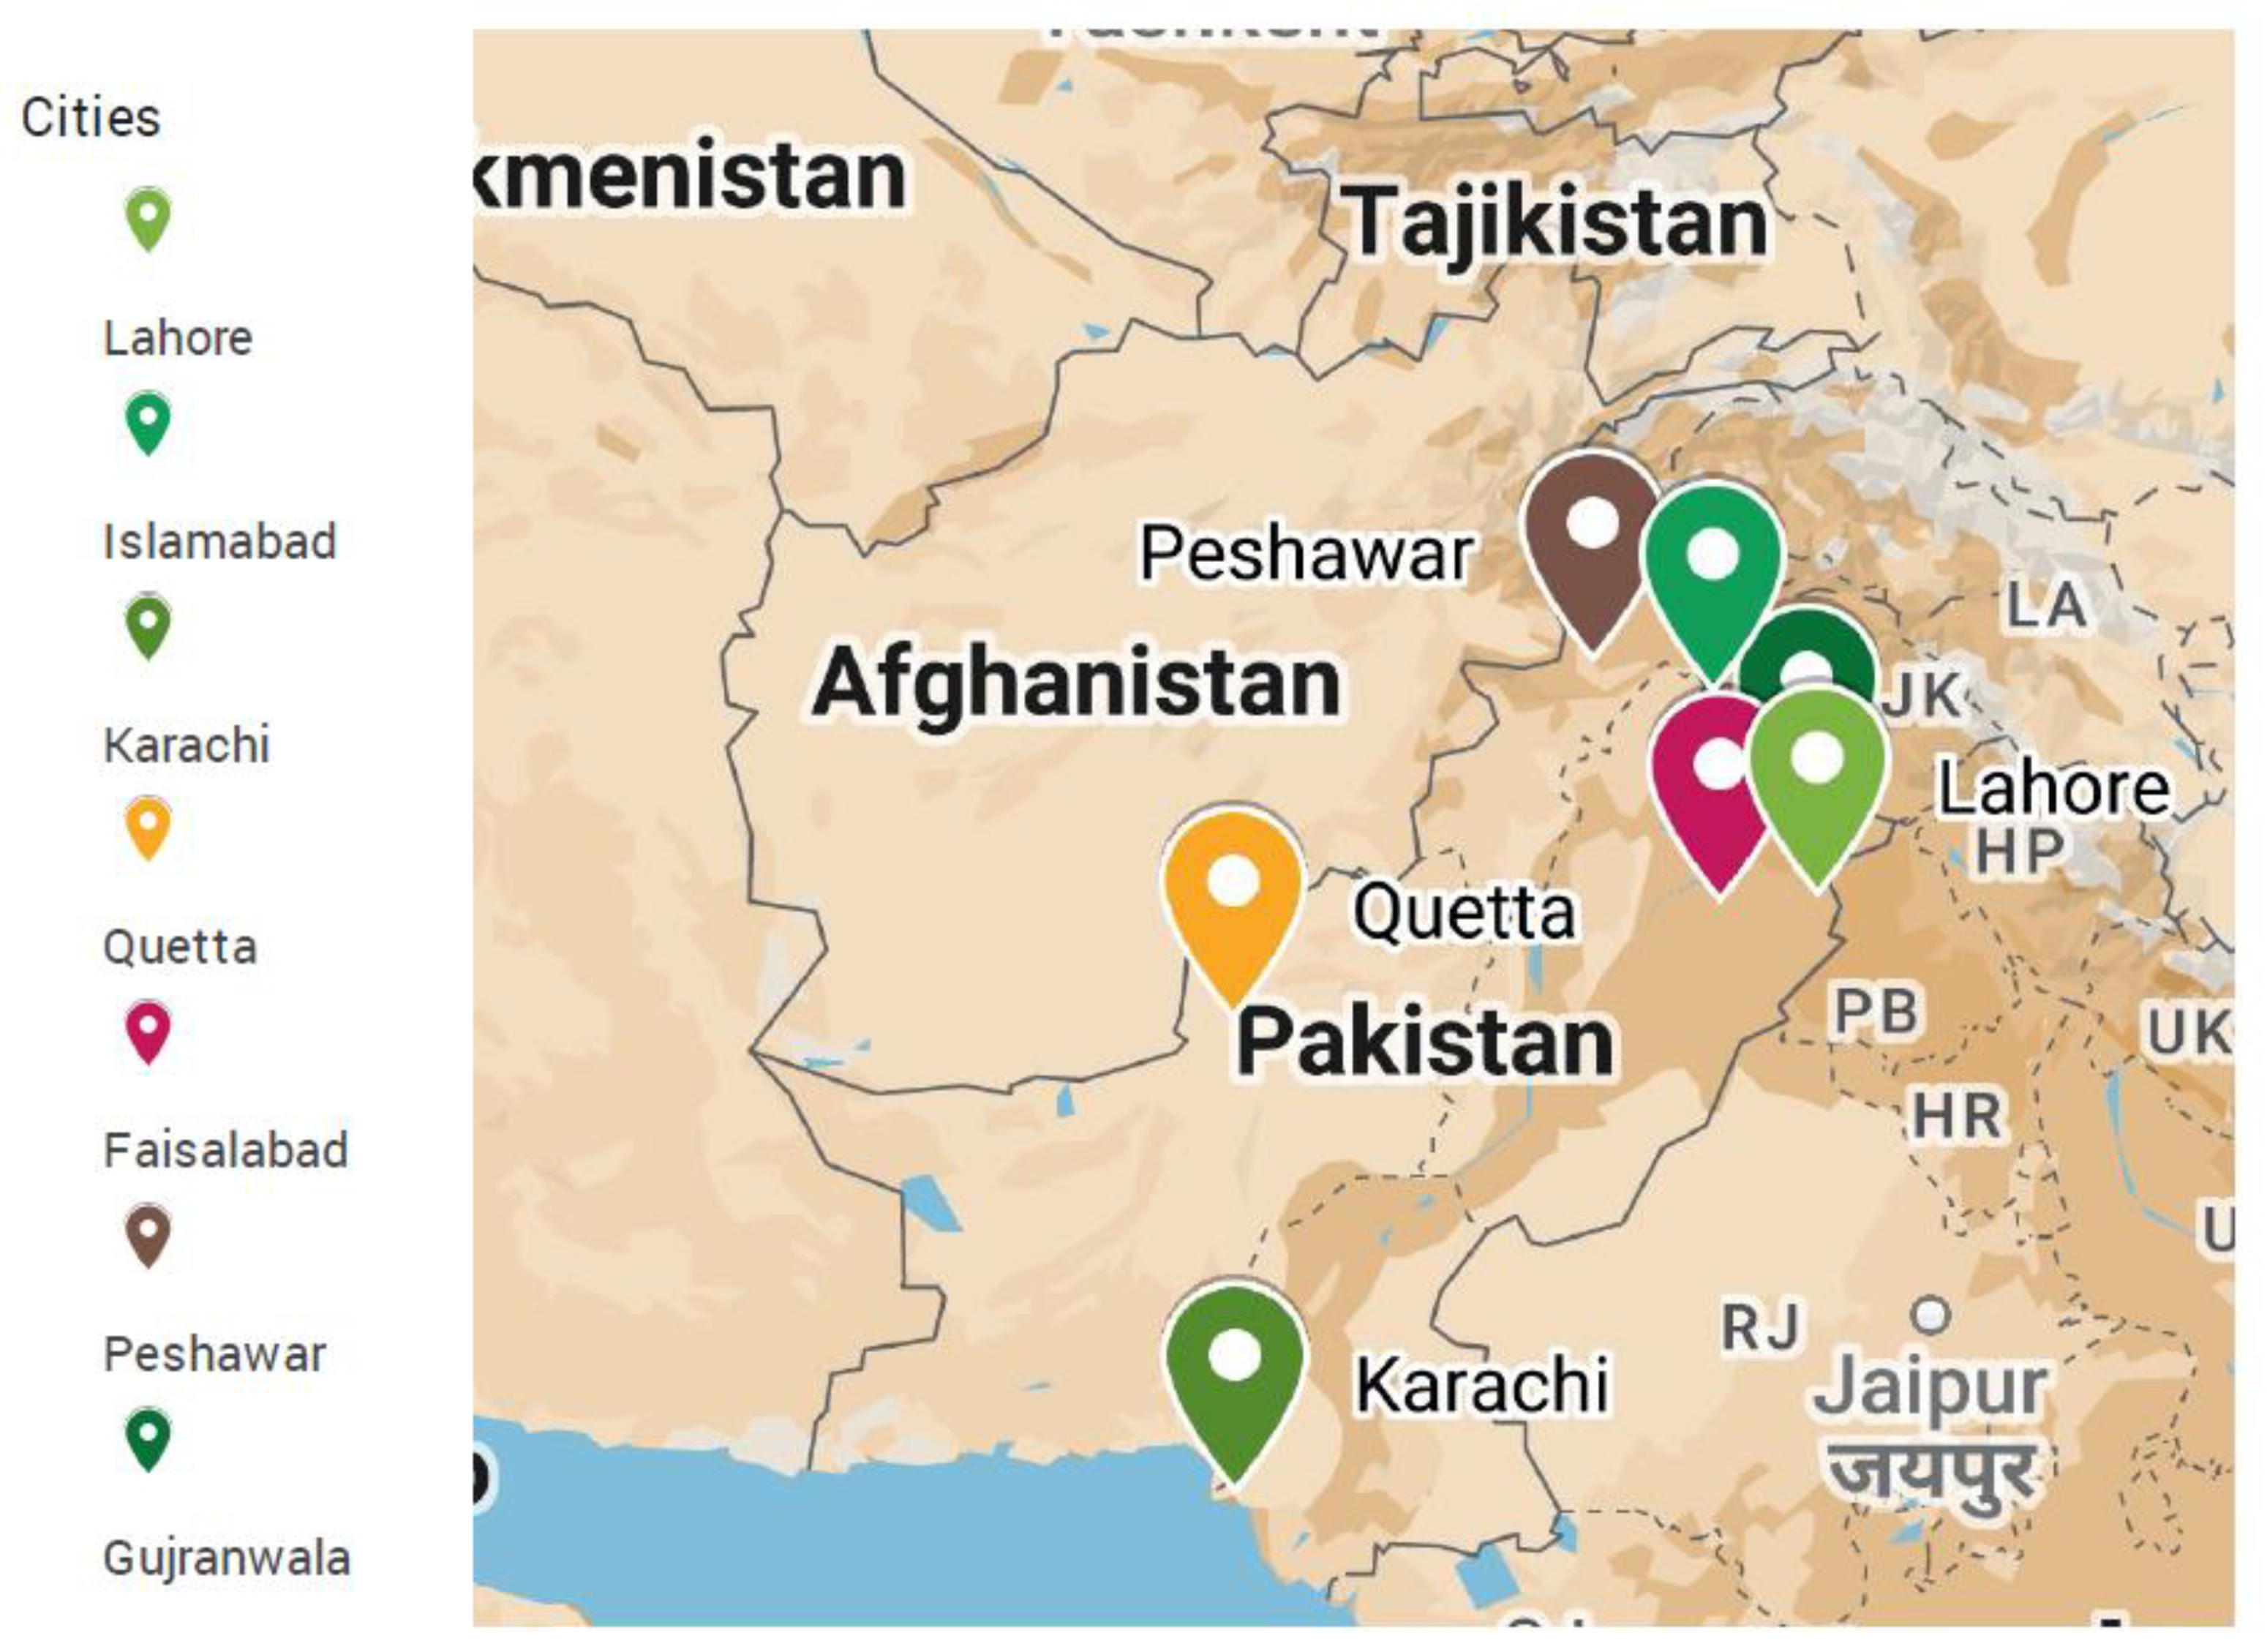
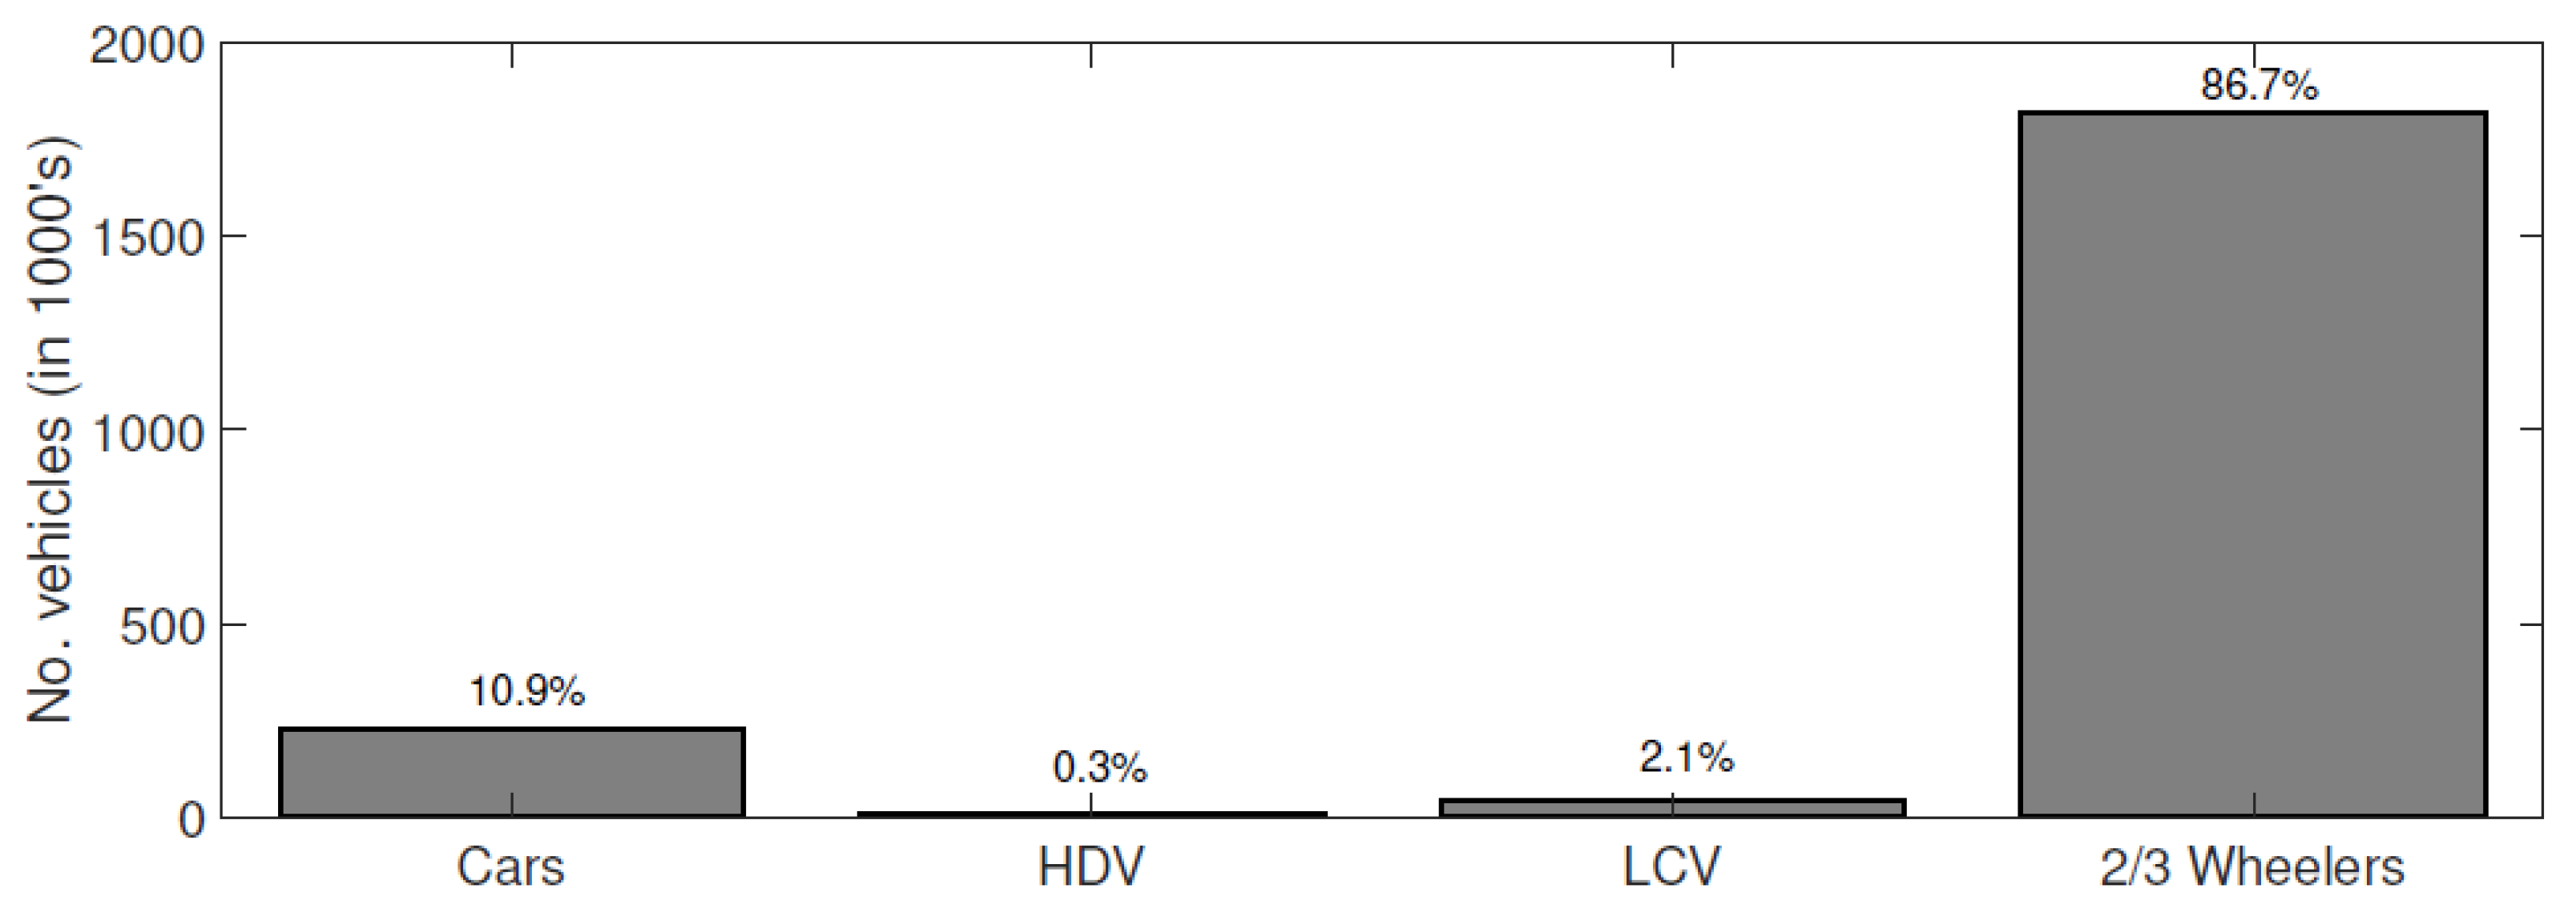
3. Sectoral Profile of Pakistan’s Urban Automotive Fleet

Pakistan’s urban road traffic makeup, similar to that of other South Asian cities [51], is heterogeneous [6,52], as can be seen from vehicle sales data for the year 2021–2022 shown in Figure 2. The urban automotive fleet includes:
  • 2/3 wheelers (motorcycles, scooters, autorickshaws, and “loaders”) make up 70–90% of the total fleet by vehicle numbers. Newer models are predominantly powered by 4SC, carburetted [53], petrol engines, while older models have 2SC engines [54]. Autorickshaws (around 3% of the total fleet) have traditionally been powered by 2SC petrol engines (frequently retrofitted to operate on liquefied petroleum gas, LPG), but are now increasingly running on 4SC petrol [55], CNG [56], or retrofitted LPG engines [11]. Most 2/3 wheelers are either Euro 2 compliant [57] or are not rated for any emissions norms (as per publicly available technical specifications).
  • Cars make up 10–15% of the total fleet. They are powered by 4SC engines, fuelled predominantly by petrol and diesel, with a notable tertiary share of petrol engines retrofitted to run on CNG. Newer petrol engines are likely majorly indirect (port) fuel injected [58,59,60], while older ones are carburetted. The majority of the locally produced cars are Euro 2 compliant, while a few meet Euro 4 norms [58,61].
  • Heavy duty vehicles (HDVs) (trucks and buses) make up around 3% of the fleet, and around 2% of the fleet is composed of light commercial vehicles (LCVs) (vans, pick-up trucks, and SUVs). They are predominantly powered by diesel 4SC engines for high-power applications, and by petrol or CNG 4SC engines for lower-power uses. New buses and trucks are Euro 2 or 3 compliant [62,63].
To account for differences in typical engine size, sales data [52] are used to determine the average and total engine capacity for each vehicle class. The engine capacity determines the amount of air breathed by an engine (ignoring supercharging) and consequently, the amount of pollutants produced by a vehicle (assuming the same emissions factors gpollutant/km). Doing so accounts for the small engine sizes of typical 2/3 wheelers and presents a more realistic picture of the emissions production potential of different vehicle classes. The results, shown in Figure 3, reveal that around 46% of the total engine capacity belongs to cars, followed by 30% to 2/3 wheelers, 15% to LCVs, and around 9% to HDVs. This is substantially different from the vehicle number-based breakdown in Figure 2, where cars made up around 11% of the fleet and 2/3 wheelers possessed the greatest share (around 87%).
In terms of the overall fuel consumption by road transport, 90% is liquid petroleum fuels with petrol and diesel having almost equal (43 and 47%, respectively) shares, and minor shares of LPG and kerosene. The remaining 10% consumption is of CNG [8,64,65]. Current regulations require fuel quality to comply with the outdated Euro 2 standards. As a result, fuel in Pakistan, especially diesel, has high levels (351–550 ppm) of sulphur in it [45].
Pakistan also has one of the highest concentrations of benzene in petrol, reaching >5% [66], while modern Euro standards require less than 1% [67]. Recently there has been a move towards shifting to Euro 5 petrol, which will reduce benzene and sulphur content by 98 and 80%, respectively [68]. However, diesel fuel sulphur limits remain high. The recently announced National Clean Air Policy by the federal government has set aspirations for enhancing fuel quality standards to Euro 5 by 2025 and Euro 6 by 2030, and has declared it the highest priority for reducing air pollutants from the transport sector [38].

4. Review of Source Apportionment Studies from Pakistan

A survey of source apportionment studies from Pakistan over the past two decades was conducted to compare different approaches, and to develop a general emissions profile of Pakistan’s urban automotive fleet. A summary of this survey is presented in Table 2.
Broadly, source apportionment studies can be divided into two categories [69]:
  • Top-down studies that use air samples (or a proxy [14]) and compare physical and chemical properties of pollutants (predominantly PM) to reference source profiles.
  • Bottom-up studies that identify pollution sources, estimate their emissions factors (intensity), and calculate sectoral contributions based on each sector’s activity.
Some of the reviewed top-down and bottom-up approaches used to characterise air pollutants from roadside environments in Pakistani cities are described next.

4.1. Top-Down Approaches

4.1.1. Ground Sampling and Chemical Analysis (Receptor Based)

These approaches analyse particulate emissions from sampled air to determine their origins, and have been used in multiple studies in Pakistan over the years.
Lodhi et al. [31] sampled air from Lahore (Johar Town) from 2005 to 2007 and chemically analysed PM in it for 25 different tracer species. A regression based Positive Matrix Factorisation (PMF) receptor model was used to predict likely sources by grouping highly correlated tracer species together as “factors.” The factor groups relevant to transport were “vehicular emissions” and “vehicular/industrial oil burning.” The former had high concentrations of Cd, Pb, Sb, and Zn (found in lube oil, brake lining, tyres, and bearings), and the latter had high secondary aerosol (sulphate and nitrate) levels. Of the total PM2.5 emissions, 5% were attributed to vehicular traffic and 18% to oil burning. Assuming an annual average PM2.5 level of 190 µg/m3 and that a third of the oil burning emissions were from vehicles (2SC engines), the transport sector would be responsible for 21 µg/m3 (11%) of airborne PM2.5. In a following study [70], the authors used air samples collected in 2010 from Lahore to source apportion PM10. The PFM analysis included carbonaceous tracer species as well and identified five emissions sources. The “vehicular emissions” factor, the only transport-related factor, was responsible for 107 µg/m3 (around 26.5%) of all PM10 emissions.
Raja et al. [71] also used a PFM model to source apportion PM2.5 in Lahore’s air using samples collected from the Punjab University campus in the winter of 2005. They considered 25 trace elements, identified six key sources, and reported high correlation coefficients. Transport-related sources were diesel engines and 2SC vehicles, which, respectively, contributed 28.3% and 7.7% to the ambient PM2.5 concentration. For the average recorded PM2.5 level of 190 µg/m3, this translates to around 54 µg/m3 and 14.6 µg/m3, respectively. The 2SC vehicle group was identified based on the presence of tracer species (including sulphates) that are produced by lube oil combustion. The diesel combustion group was identified by high concentrations of organic carbon and sulphates. PM2.5 originating from 2SC were higher during the day, while those of diesel origins were higher at night due to the respective activity patterns of 2/3 wheelers and heavy duty vehicles.
Stone et al. [15] performed one of the most rigorous top-down source apportionment assessments of Lahore’s air pollution. Air samples were collected from the University of Engineering and Technology campus every six days for an entire year (2007). Particulates in the samples were chemically assayed to measure the fractions of their carbon constituents (elemental and organic carbon), water-soluble ions, and selected organic molecular markers. The lack of marker profile data for non-traditional fuels like rubber/coal used in brick kilns resulted in a notable fraction (up to 35% of organic carbon) of PM2.5 not being assigned to a source. The source profile library was then used for PM2.5 and PM10 source apportionment using a chemical mass balance model developed by the US EPA. The results showed that the major (≈40%) portion of fine PM2.5 was carbonaceous in nature (mostly organic carbon), suggesting combustion origins. Sulphates were the next most significant component (6%),followed by nitrates (3%). Monthly averaged organic carbon contributions varied from 26 to 152 µg/m3. The single largest contributor to the organic carbon of PM2.5 was non-catalysed petrol vehicles (including 2SC vehicles) ranging from 20 to 51 µg/m3 (29–86%). Diesel vehicles contributed around 4 µg/m3 (6.8%). Organic carbon constituted around 37% of the PM2.5 mass, bringing the PM2.5 contribution from petrol vehicles to 10–32%, and that from diesel engines to around 2%.

4.1.2. Ground Sampling with Meteorological Measurements

Continuous, ground-based sampling using dust collectors that report PM2.5 and PM10 concentrations have been used in multiple studies in Pakistan’s urban centres [6,36,39]. These studies only report the total PM concentration and not its composition. Khanum et al. [36] used ground-based sampling data at two locations in Lahore (Township and Townhall) from 2007 to 2011 and measured ambient concentrations of PM2.5, NOx, SO2, and O3. A positive correlation between CO, SO2, and NOx identified combustion engines as the likely emissions source, as all three species are produced from their operation. Rasheed et al. [39] attributed changes in PM2.5 emissions corresponding to the diurnal cycle to morning rush hour traffic and the movement of heavy-duty vehicles at night.

4.1.3. Ground-Based Radiometer

Another ground-based approach uses automated sun and sky scanning radiometers (AERONET) to calculate ambient PM concentration and size distribution from the optical characteristics of air. Such studies have found that the PM in Lahore in summer and spring are majorly composed of coarse particles because of increased dust storm frequency, while in winter, fine aerosols become prominent. Additionally, the concentration of fine particles does not change significantly across the year, while that of coarse particles increases during summer and spring [36,71,72].
Khokhar et al. [33,73] used multi-axis differential optical absorption spectroscopy that measures the spectra of scattered sunlight at different viewing angle elevations to measure NO2 emissions in Islamabad, Rawalpindi, and along the N5 highway to Lahore. They reported an increase in NO2 levels when CNG was not available in Islamabad/Rawalpindi, suggesting that CNG vehicles emitted less NOx.

4.1.4. Satellite Data

Satellite air quality data can measure the total aerosol concentration and also distinguish between various components and thus be used for monitoring pollution levels and broadly identifying emissions sources. In a recent report by the Government of Punjab [6], PM2.5 data from 2011–2021 for Lahore from the Copernicus Atmospheric Monitoring Services (CAMS) portal was used to discuss trends in PM2.5 concentration and the concentration of black carbon, sulphates, organic carbon, and dust. A recent source apportionment study from Peshawar [40] used CAMS data from 2011 to 2020. After analysing the aerosols, the study estimated that the transport sector was responsible for 58.46% of the air pollution in Peshawar. Ahmed et al. [74] used satellite image data for “aerosol index”, methane, CO, formaldehyde, NO2, O3, and SO2 with a neural network model to predict PM2.5 concentrations for Islamabad, Lahore, Peshawar, and Karachi, and reported good agreement with measurements from ground-based PM2.5 monitoring stations. However, they did not dissect the aerosols to identify their sources.

4.1.5. Biomagnetic Characterisation

Biomagnetic methods can characterise air pollution sources from the magnetic signatures of collected samples [75,76], but such techniques have not been used extensively in Pakistan. Sheikh et al. [14] used magnetic analysis, coupled with electron microscopy and X-ray diffraction, to characterise fine particulates (i.e., PM2.5) in Lahore’s air based on their morphologies, chemistry, and magnetic properties. Unlike receptor-based approaches, PM was not analysed from traditional gravimetric air samples. The study collected and analysed particles deposited on the surface of bottlebrush tree leaves from a high traffic density area (Canal Road). To identify vehicular sources of PM, reference samples were collected from brake pads and exhaust pipes of local cars, diesel freight vehicles, and rickshaws. Signatures of exhaust and non-exhaust PM emissions from petrol and diesel vehicles were found on leaf samples. Particles from diesel vehicles were coarser than those from petrol vehicles, and diesel PM emissions had high sulphur content. Although the study did not quantitatively apportion the sources of PM2.5, it provided useful, high-resolution information about Lahore’s ambient airborne particulates. After further development (e.g., calibration for local leaf PM accumulation capacity and meteorological conditions), such approaches can potentially be used for economically monitoring roadside particulate pollution and quantitative source apportionment.

4.1.6. Remote, on-Road Sensing

On-road emissions sensing has been used internationally (e.g., South Korea [77], USA [78]) to measure emissions of NOx, VOC, CO, and PM of vehicles on the road. By tracking details about the vehicle (class, model year, engine/fuel type) from registration information, emissions profiles of various vehicle classes can be developed, which can help interpret and reconcile results from source apportionment studies using directly measured emissions data. The literature survey did not find extensive studies of this sort for Pakistan.
Yasar et al. [79] measured emissions of different vehicle classes in Lahore including buses (CNG, diesel), autorickshaws (2SC LPG, 4SC CNG, 4SC petrol), vans (CNG, diesel, and petrol), motorcycles (2SC petrol, 4SC petrol), and cars (CNG, diesel, and petrol), seemingly under semi-controlled conditions using portable emissions analysers. CNG vehicles produced substantially higher CO than diesel vehicles but slightly lower than comparable petrol vehicles. The NO2 emissions from CNG vehicles were lower than those of diesel vehicles but higher than petrol vehicles. SO2 emissions from CNG and petrol vehicles were comparable, while those from diesel vehicles were around five times higher. Smoke opacity (a proxy for PM emissions) was the highest for diesel vehicles and 2SC LPG autorickshaws, while those for petrol vehicles were low. 2SC motorcycles had slightly higher opacity than 4SC motorcycles. Diesel vehicles also emitted high levels of VOCs, suggesting rich combustion and/or poor fuel–air mixing. CO emissions from diesel vehicles were very low and were the highest from 2SC motorcycles and autorickshaws. Other petrol and CNG vehicles also had high CO levels.

4.2. Bottom-Up Approaches

The bottom-up approaches, as defined herein, found for Pakistan were what are normally referred to as “sectoral emissions inventory” assessments. Emissions inventories index anthropogenic emissions and the relative impact of different economic activities. Sectoral inventory assessments use information about the composition of key emissions sources (type, number of vehicles, etc.), their activity levels, and emission intensity to estimate sectoral emissions. Commonly used methods are those proposed by the Intergovernmental Panel on Climate Change (IPCC). These methods are classified from Tier 1 to Tier 3, in increasing level of granularity and accuracy. Higher tiers require more detailed and stratified country-specific data, and uncertainty estimates [79]. The Tier 1 method is used when extensive data about local energy consumption and technology are not available. It uses default emissions factors and annual activity rates. This method was used in the reviewed studies from Pakistan. Country-specific inventory methods have also been developed [80].
In 2019, the Food and Agriculture Organization (FAO) of the UN carried out a sectoral emissions inventory study for Punjab across 10 years (2008–2017) [8]. It used a Tier 1 approach with default emissions factors. The results ascribed 43% of the total emissions (by mass) to transport, and 74% of transport emissions were of CO. Transport contributed 7.7% to the total PM2.5 emissions.
Recently, a sectoral inventory assessment (“the first district scale effort in Punjab”) was performed for Lahore by the Urban Unit of the Government of Punjab [6]. The IPCC Tier 1 approach was used with activity data from government agencies and published literature (2020–2021), and emissions factors from IPCC and European Environment Agency databases. Major transport apportionment results reported are as follows: 83% of the total pollutant emissions (by mass) stem from the transport sector, while 35% of PM2.5 emissions originate from this sector. Around 80% of the total transport emissions were of CO, and the most polluting vehicle category was motorcycles and scooters, contributing 82% of the total transport emissions.
Peshawar’s Clean Air Alliance (PCAA) recently developed a sectoral emissions profile for Peshawar based on energy use estimates and emissions factors from IPCC and International Energy Agency databases [40]. Around 85% of the total emissions (by mass) were estimated to have transport origins, with CO making up around 70% of the transport emissions.
The GHG–Air Pollution Interaction and Synergies (GAINS) model developed by the International Institute for Applied Systems Analysis has also been used to generate source emissions inventories for Punjab [8] and Pakistan [5,69].
Table 2. Summary of surveyed source-apportionment studies focusing on traffic-related pollution.
StudyApproachResults
Khan et al. 1996 [81]Top-down quantitative approach to monitor CO pollution from vehicle
exhausts at roadside environments [Peshawar]
High levels of CO in different locations of Peshawar.
Barletta et al. 2002 [82]Top-down approach to quantify the amount of hydrocarbon and VOCs from exhaust emissions [Karachi]Vehicular emissions are a leading source of O3 production in Karachi.
Khan et al. 2008 [83]Top-down quantitative approach to monitor pollution from vehicle exhausts at roadside environments [Peshawar]High levels of CO and NOxin roadside environments of Peshawar.
Lodhi et al. 2009 [31]Top-down using Positive Matrix Factorisation [Lahore]10–21 µg/m3 PM2.5 (5–11%) from vehicles (Nov–March 2005–7).
Faiz et al. 2009 [84]Top-down approach to quantify road dust pollution [Islamabad]Cu and Pb from road dust may have anthropogenic origin, i.e., vehicles.
Stone et al. 2010 [15]Top-down approach using chemical markers with EPA’s chemical mass balance model [Lahore]Non-catalysed petrol vehicles (including 2SC engines): 20 to 51 µg/m3 PM2.5 (10–32%),
diesel vehicles: 4 µg/m3 PM2.5 (2%) (2007).
Raja et al. 2010 [71]Top-down method using Positive Matrix Factorisation [Lahore]54 µg/m3 PM2.5 (28.3%) from diesel vehicles,
14.6 µg/m3 PM2.5 (7.7%) from 2SC vehicles (Winter 2005).
Mansha et al.
2012 [85]
Top-down source apportionment of PM2.5 using Positive Matrix Factorisation [Karachi]Major contributors of PM2.5 in Karachi are vehicular emissions, secondary aerosols, industrial emissions, and soil/road dust.
Hassan et al. 2013 [86]Top-down approach to quantify pollution levels from heavy traffic and industry [Islamabad]High traffic flow (247,447 vehicles per day) at IJP road related to high levels of pollution.
Ali et al. 2014 [70]Top-down but qualitative source apportionment [Lahore]Coarse particle concentrations decreased in winter (2009-11).
Alam et al. 2014 [77]Top-down using Positive Matrix Factorisation [Lahore]107 µg/m3 PM10 (26.5%) from vehicles (March, 2010).
Ali et al. 2015 [87]Top-down quantitative approach using a Dust Trak DRX (Model 8533, TSI Inc.) [Lahore]Positive correlation of high PM levels with a number of vehicles.
Javed et al. 2015 [88]Top-down approach to quantify spatial and temporal PM levels in [Faisalabad]The highest PM concentrations were observed at industrial sites, followed by vehicular emissions.
Kamal et al. 2016 [89]Top-down approach to quantify PAH levels [Gujranwala, Lahore, Islamabad]High levels of low molecular (LM) PAH levels associated with traffic emissions.
Khanum et al.
2017 [36]
Top-down but qualitative source apportionment [Lahore]Peak PM2.5 above 350 µg/m3, annual average 136 µg/m3 (2007-11).
FAO 2019 [8]Bottom-up sectoral inventory using IPCC Tier 1 approach with default emission factors [Punjab]43% of total emissions from transport; 74% of transport emissions were CO. 7.7% of total PM2.5 emissions from transport (2008–2017).
Sheikh et al. 2022 [14]Top-down but qualitative source apportionment using PM deposited on leaves [Lahore]Identified particulates from petrol/diesel vehicles on leaves.
Zahra et al. 2022 [90]Top-down approach to quantify NO2, SO2, COx, and suspended particulate matter (SPM) [Faisalabad]SO2 levels were between 418–652 and 423–661 µg/m3, SPM concentrations were
555–667 and 581–682 µg/m3 for winter and summer, respectively.
Mir et al. 2022 [5]Bottom-up sectoral inventory using GAINS model [Pakistan]4% of PM2.5, 46% of NOx, and 9% of SO2 emissions from transport (2015).
Peshawar Clean Air Alliance 2022 [40]Bottom-up sectoral inventory and satellite data [Peshawar]Transport contributes to 58.46% of total air pollution.
Lahore Urban Unit 2023 [6]Bottom-up sectoral inventory using IPCC Tier 1 approach with default emission factors [Lahore]83% of total emissions from transport. Around 80% of transport emissions were of CO, <1% were PM2.5, 35% of total PM2.5
emissions from transport (2020–2021).

5. Discussion

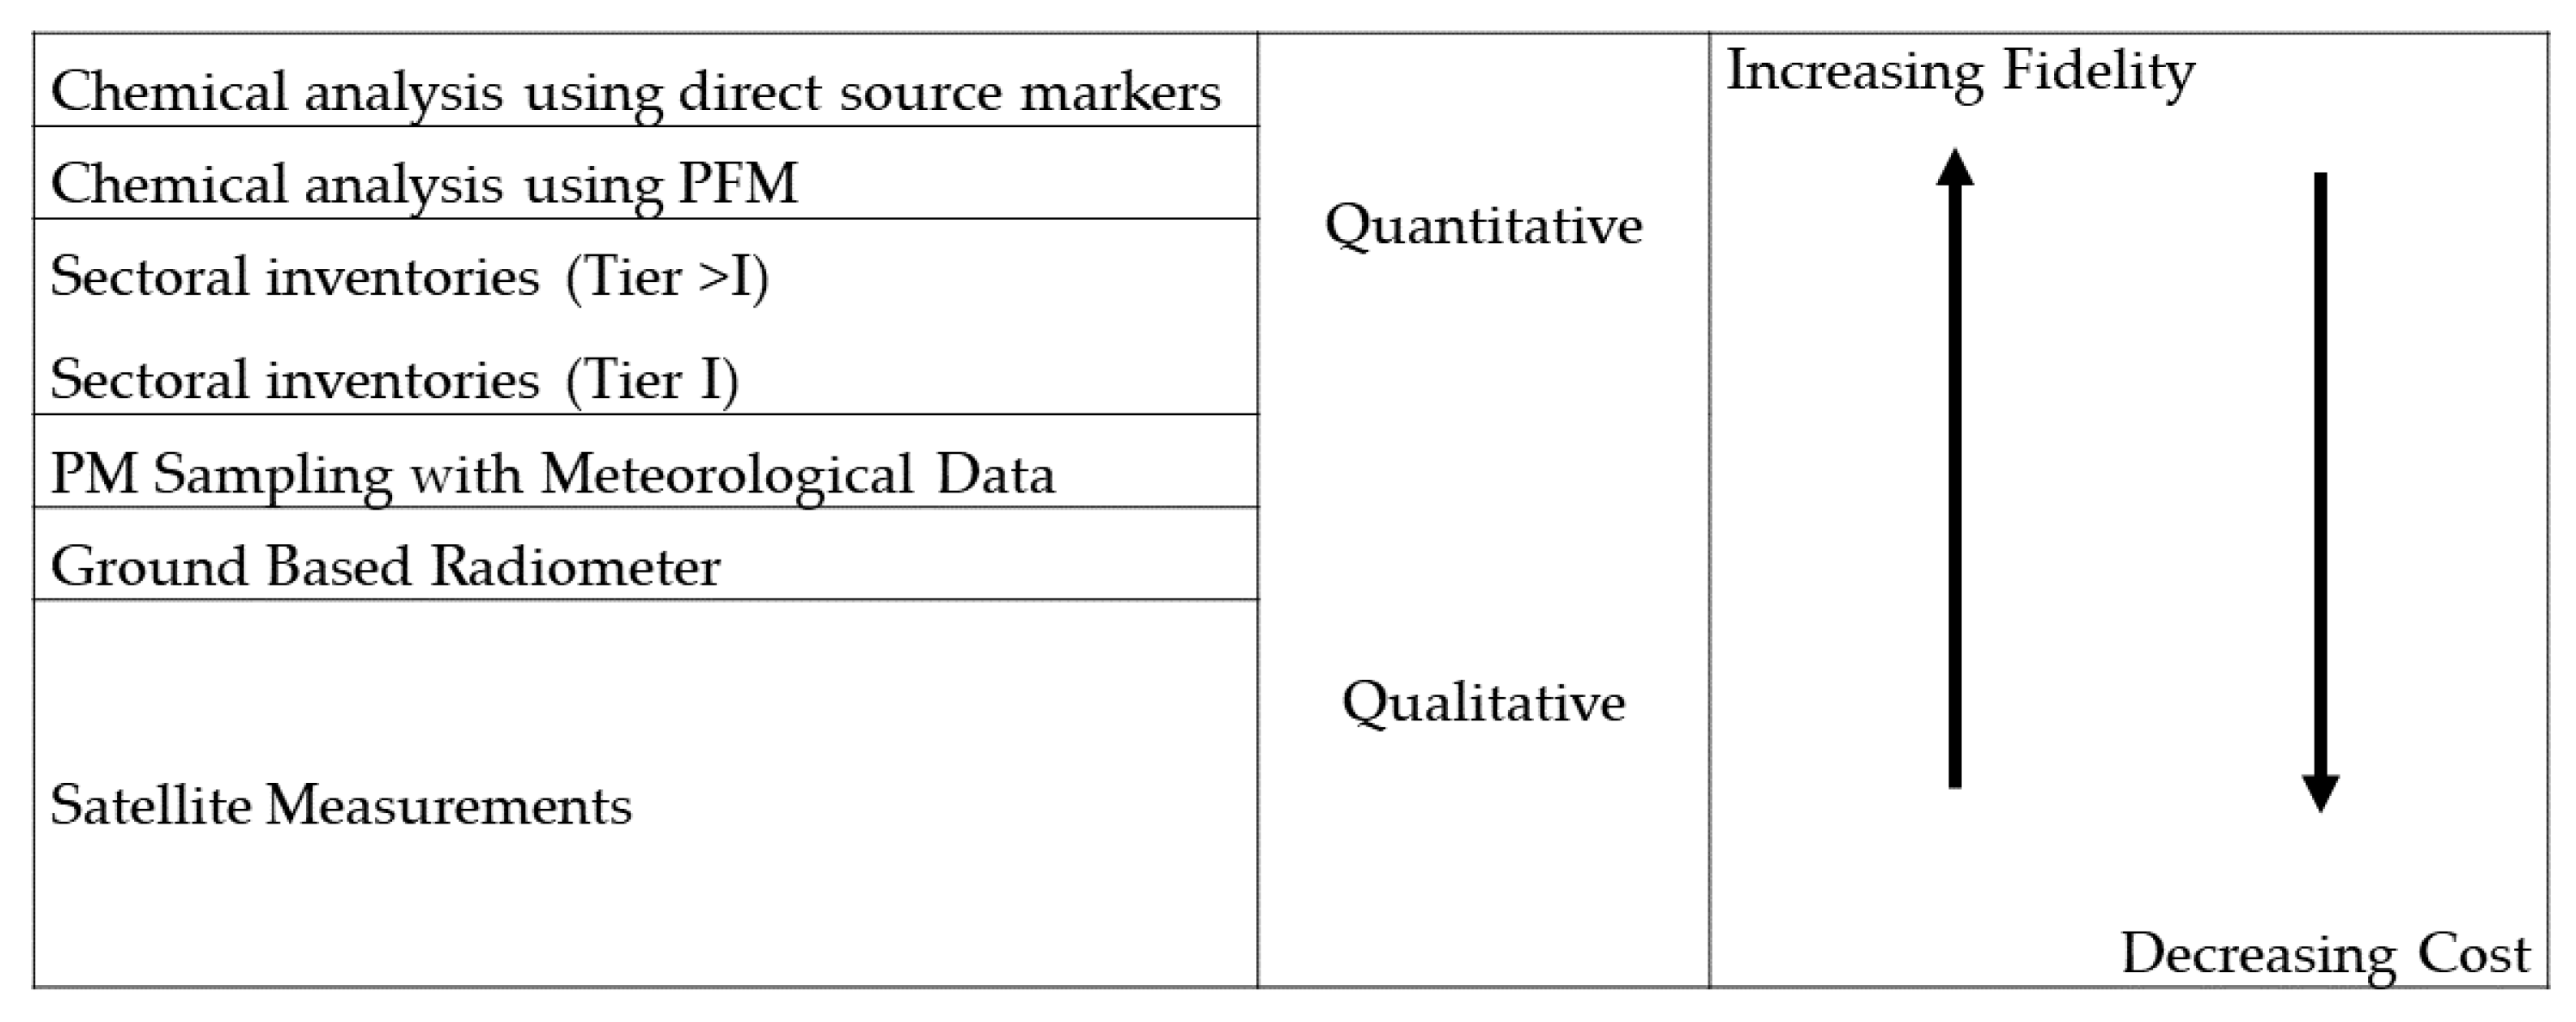
5.1. Comparing Different Approaches

Top-down, chemical analysis-based source apportionment approaches use primary pollution data instead of estimates of pollution production, as is the case for bottom-up (sectoral inventory) approaches, to quantify the pollution burden of different sources. Thus, results from such studies can be considered to be more reliable. The surveyed chemical analysis-based studies used only one pollutant, i.e., PM, to identify pollutant sources and the contribution of each source [15,39,69,70]. This is an appropriate choice as particulate matter is the most problematic (both in terms of prevalence and disease burden) pollutant in the Pakistani context.
Across the chemical analysis-based techniques, results from studies that use direct markers of PM emissions from various sources [14,15], instead of relying on regression-based approaches like PMF [39,69] are of higher fidelity. The assignment of different factor groups to emissions sources in PMF studies is based on expected sources in the particular context of the study and can be arbitrary and subjective. Moreover, there can be an overlap between different source groups, e.g., some vehicular emissions also appeared in the “vehicular/industrial oil burning” group in Lodhi et al. [31] and in “secondary aerosols” in Raja et al. [71].
Chemical analysis-based methods are limited in their use by their resource intensive and demanding requirements. Sophisticated analysers requiring regular maintenance and calibration, and specialised handling and operation are needed. Sectoral assessments, on the other hand, are more economical and can provide useful general information about the contributions of various sectors. However, they are highly susceptible to variability from the underlying assumptions, especially the choice of emissions factors, and reliability of activity data [6,40], e.g., the Peshawar Clean Air Alliance sectoral inventory expects underestimations in sectoral inventory figures because of assumptions and missing data [40].
A general fidelity and cost ranking of various source apportionment approaches is presented in Figure 4. The higher fidelity, resolution, and cost studies can be carried out periodically (maybe every five years) to develop a rich, granulated understanding of the emissions profile of different urban centres of Pakistan, results from which can then inform lower-fidelity and resolution investigations that are relatively economical and can be carried out more frequently (maybe annually). Knowledge gained from studies ranked high on the list can be used to fill in gaps and interpret results from lower-ranked studies. For example, since satellite data-based apportionment studies [40] do not conduct chemical composition-based sectoral segregation, their results can be read/calibrated with data from chemical analysis-based apportionment studies.

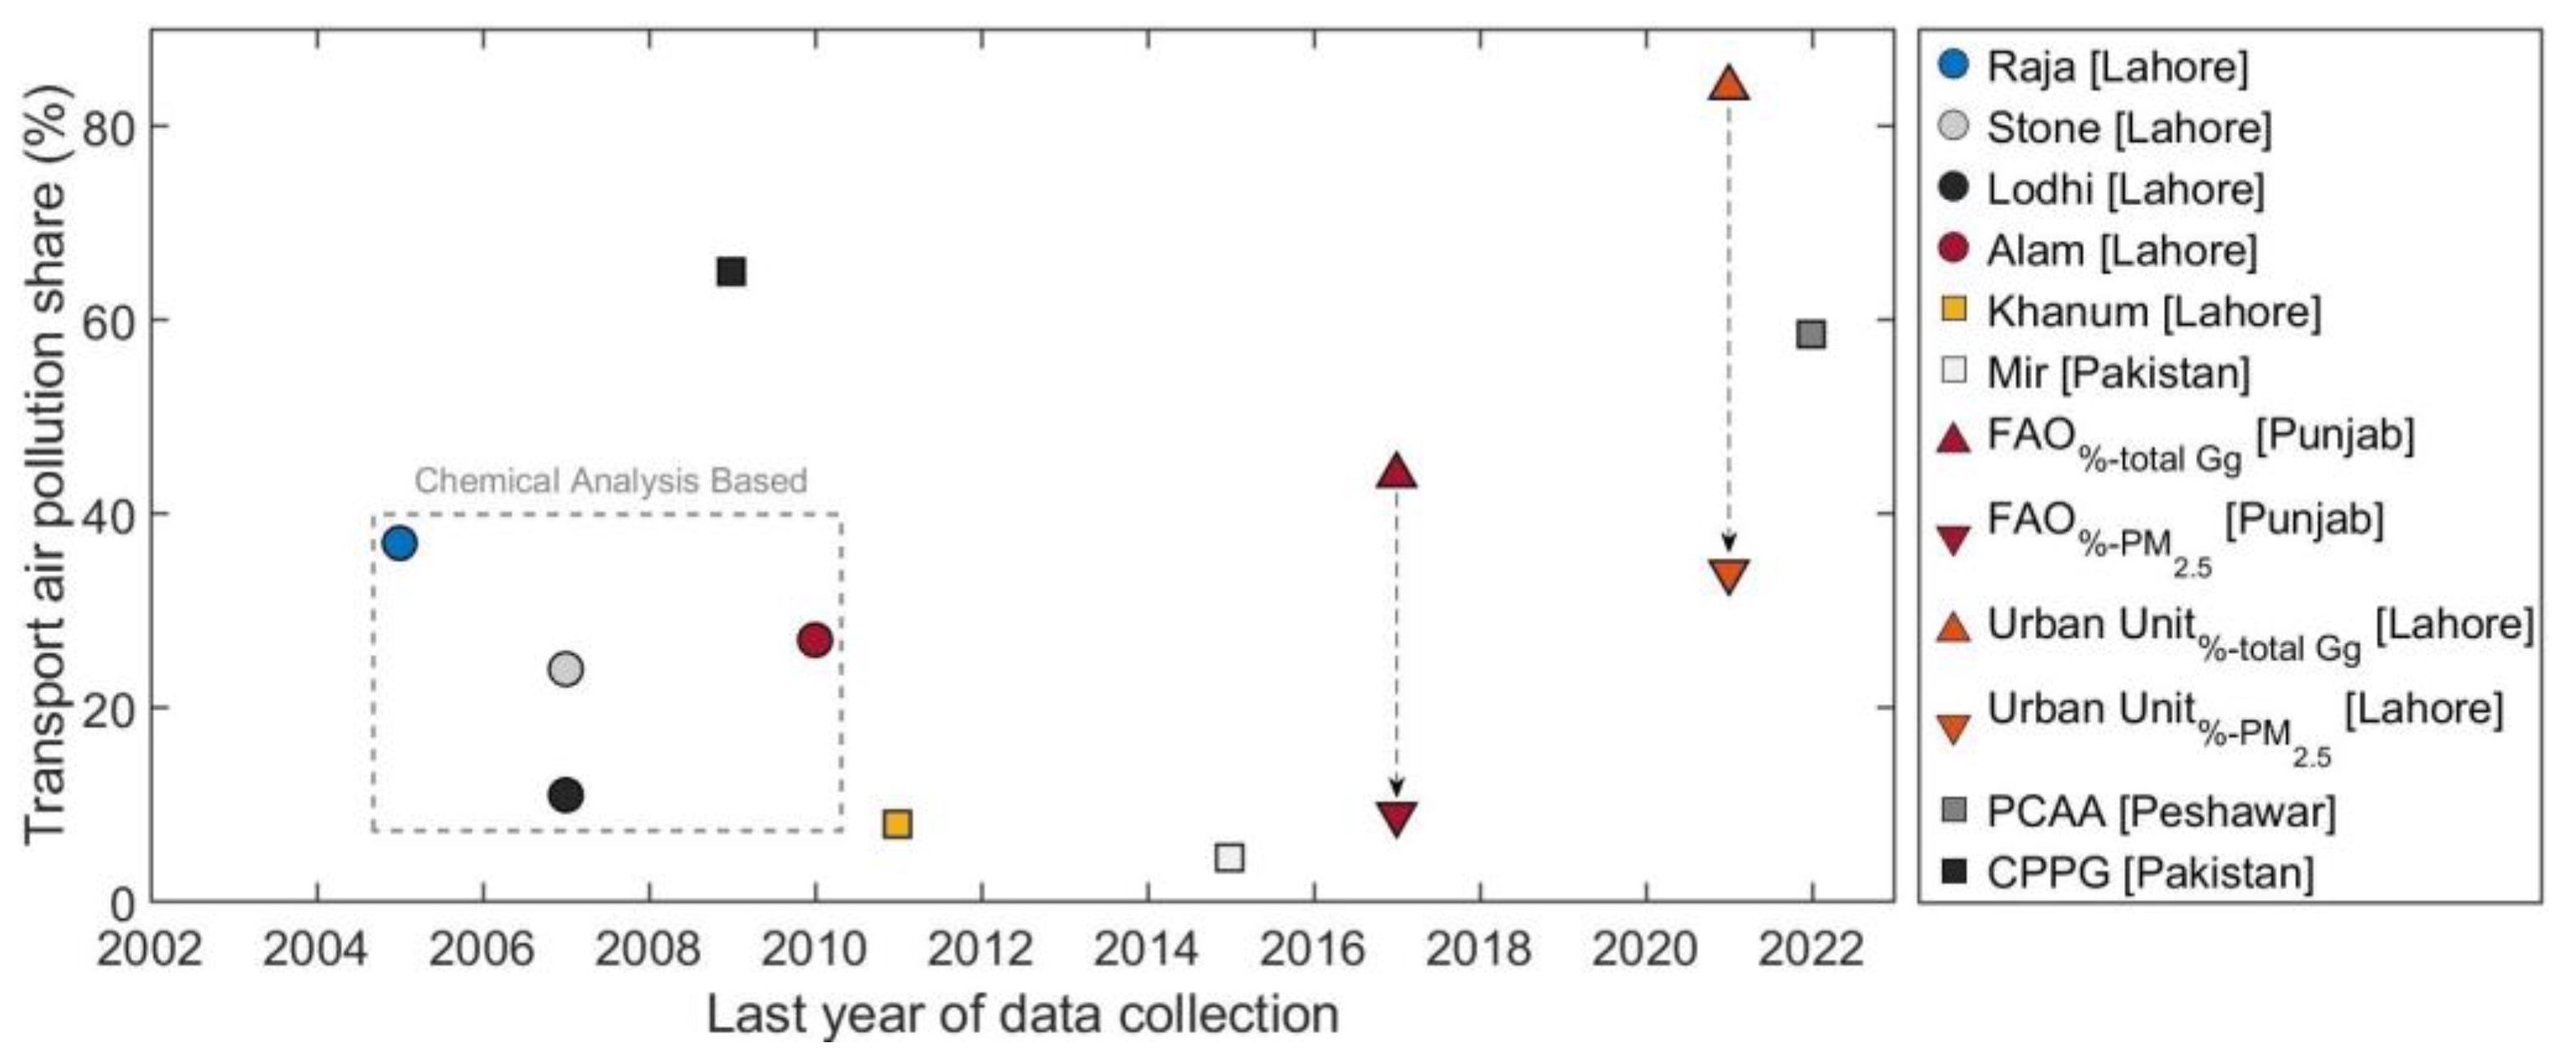
5.2. Interpreting Results—How Much Do Vehicles Contribute to Pakistan’s Air Pollution?

Three different indices have been used in the preceding discussion to quantify air pollution intensity:
  • AQI, which reports the weighted value of the most hazardous pollutant.
  • Concentration of PM2.5, the most problematic airborne pollutant, reported in µg/m3 in source apportionment studies.
  • Total mass (in Gg or tons) of all emitted species, used in sectoral inventory assessments.
The first two indices, to varying degrees, account for the differences in the disease burden of different species, i.e., 1 g of PM2.5 and 1 g of CO are not equally harmful to human health, whereas emissions inventories, if used to ascribe sectoral pollution share, treat the damage potential of 1 g of CO and 1 g of PM2.5 as being equal. As a result, because of the disproportionately high CO emissions from Pakistan’s transport sector, its contribution to air pollution appears to be higher than it would be if the harm potential of different pollutants were considered. Therefore, it is recommended to either use AQI or PM2.5 concentration while reporting sectoral contributions. Sectoral shares can be reported in terms of AQI by converting all emissions quantities into concentrations (in ppm or µg/m3) and then reporting the contribution of each sector in the total AQI, e.g., by reporting the AQI with and without including emissions from the transport sector.
In addition to source apportionment studies, quantitative health impact and burden of disease assessments should also be carried out as they can play an important role in understanding and communicating the health costs of transport-related exposures, including air pollution. By coupling pollution data with epidemiological information, such studies can estimate the mortality and ill-health burdens from different sectors and report the sectoral shares as premature deaths or other similar metrics [91,92].
In light of the above, it can be reasoned that conclusions like “83% of Lahore’s air pollution caused by transport sector” based on the sectoral inventory report by Lahore’s Urban Unit [6] paint an incomplete picture, considering that 80% of the transport emissions by mass were CO and the contribution of transport to PM2.5 emissions was only around 35%. Similarly, the 43% contribution of the transport sector reported by FAO [8] is many times higher than the 7.7% contribution of the transport sector to Punjab’s PM2.5. This 43% number has been used multiple times in government policymaking, including in the National Electric Vehicle Policy (2019) and the National Clean Air Policy (2023) [38].
Figure 5 presents a summary of the percentage contribution of the transport sector to pollution as reported in the surveyed studies. Because of the way in which contributions were determined from sectoral inventory studies, “FAO” and “Urban Unit” results appear as outliers, but once the contributions are calculated based on PM2.5 (indicated by the dashed arrows), they fall in the same range as the source apportionment studies. Results from chemical analysis-based studies, which are of higher fidelity, are highlighted in the figure. Among these studies, Lodhi et al. [31] had low correlation coefficients. From the remaining three studies, the contribution of transport to Lahore’s air pollution ranges between 20 and 40%, which puts it in the “one-third” range. However, these studies used air samples from at least 12 years ago and warrant repeating to get more up-to-date data.

5.3. Emissions Profile of Pakistan’s Urban Automotive Fleet

To illustrate the relative pollutant production potential of various vehicle classes, emissions factors assumed based on the general understanding of Pakistan’s vehicular PM emissions (Section 3) and emissions data from the literature [11,79,93] are used with engine capacity estimates from Figure 3. The emissions factors are sensitivity parameters and represent the likely range of the relative particulate emissions production potential of different vehicle classes relative to cars, which are taken to be the baseline and assigned a value of 100. Differences in volumetric efficiency across different vehicle classes are ignored in the calculations. The relative emissions potential calculated for HDVs, LCVs, and 2/3 wheelers is shown in Figure 6. The relative emissions can be taken to be a proxy for the relative contribution of different vehicle classes to Pakistan’s air quality degradation. 2/3 wheelers emerge as the largest contributors, with a share ranging from 38 to 64% for the assumed emissions factor range. Cars are the second largest contributor at around 32%, and HDVs and LCVs make up the balance with around 10% each. Systematic measurements of exhaust emissions of Pakistan’s automotive fleet are needed to substantiate these sensitivity analysis estimates.
A few salient features of the emerging emissions profile are discussed below and summarised in Table 3.

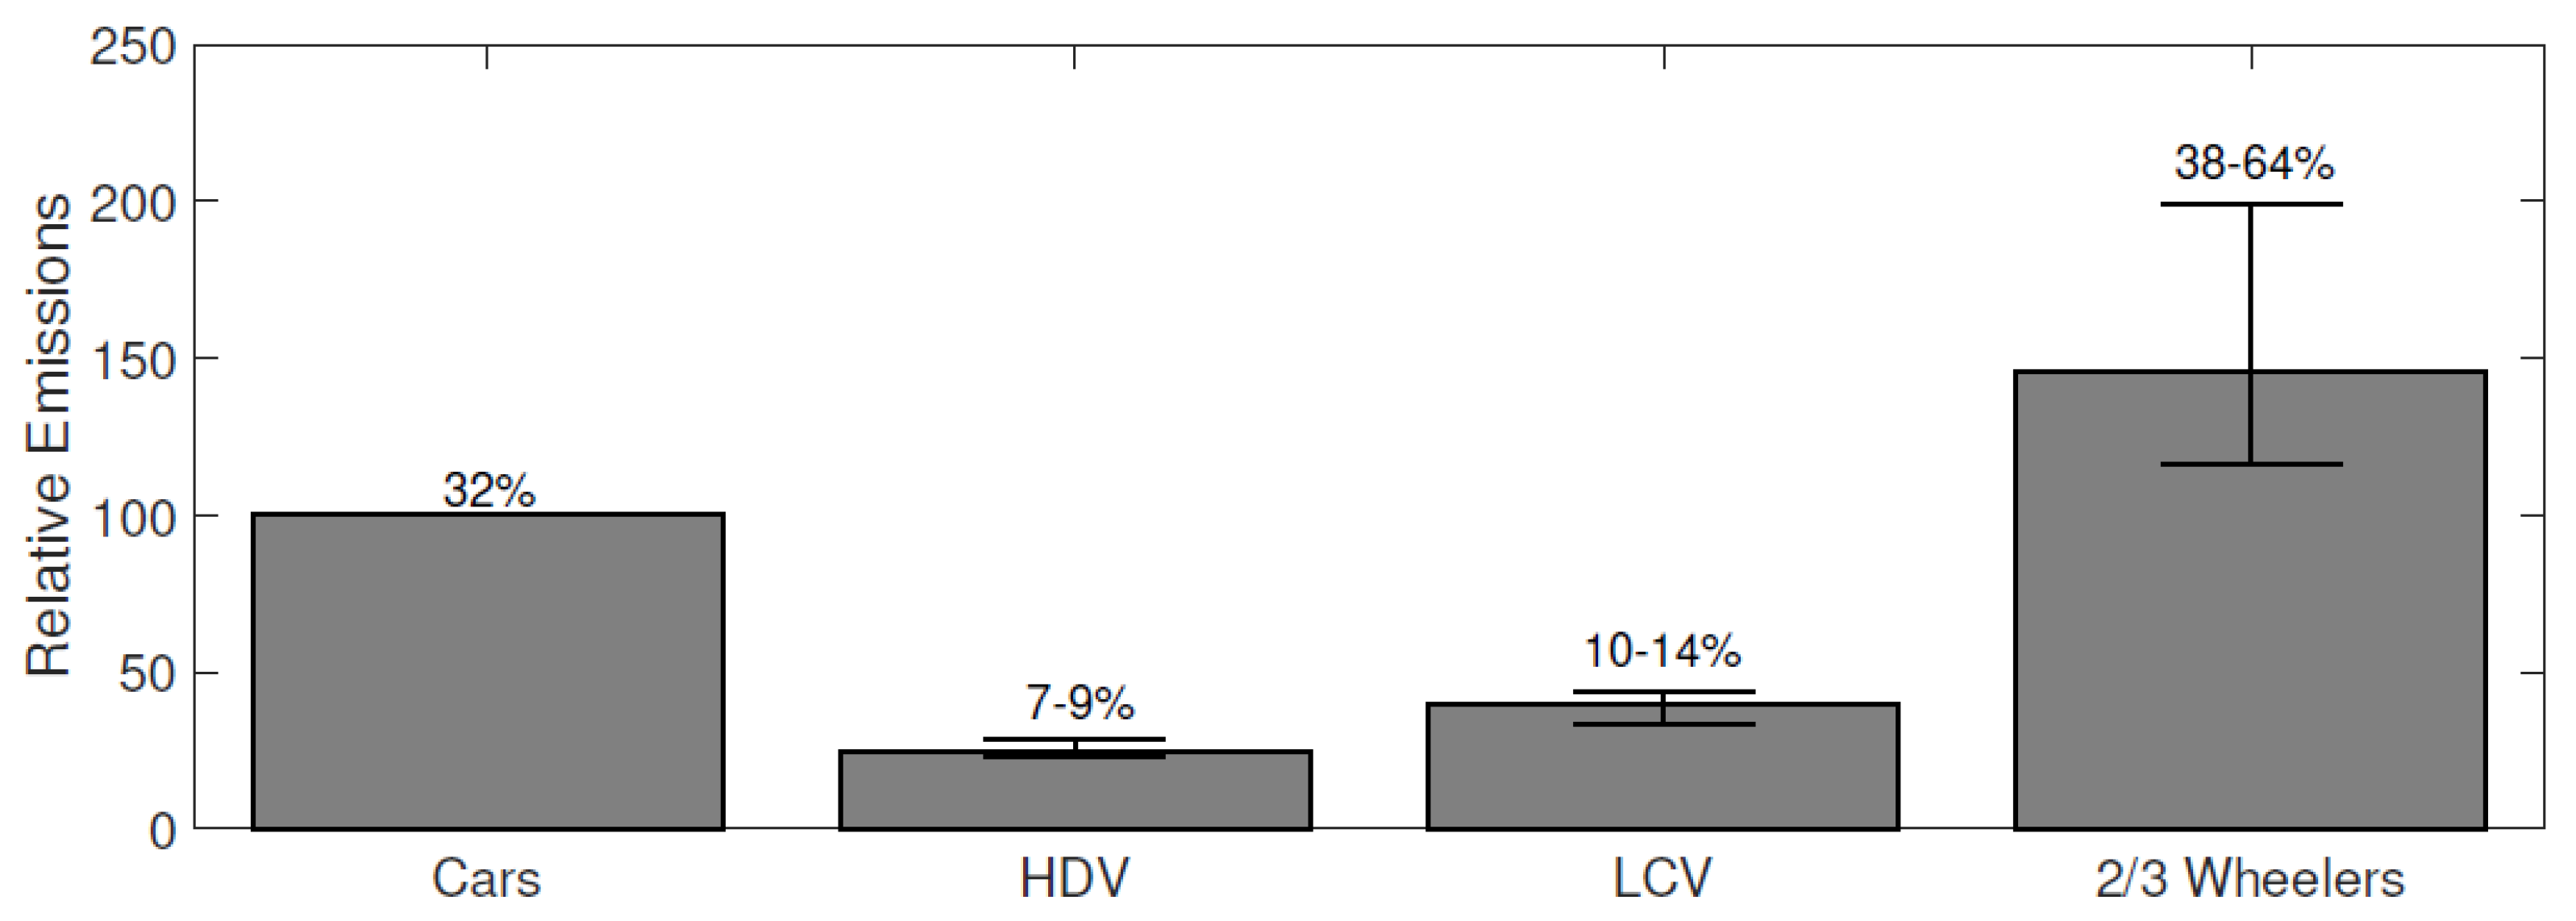
5.3.1. Polluting 2/3 Wheelers

As noted above, the most polluting vehicle category is 2/3 wheelers. A recent study attributed around 80% (by mass) of the total transport emissions in Lahore to motorcycles and scooters [6].
Causes: This can be explained in part by the volume of the sector, whereby it constitutes around 80% of the total fleet [54]. On the technology front, most 2/3 wheelers are carburetted, and a significant fraction have 2SC engines, which, because of poor fuel–air mixing and short-circuiting [94], produce high CO, VOC, and PM emissions.
Recommendations: Introduction of injection-based fuelling systems and/or electrification. At its lower end, which might represent a medium-term target (e.g., complete phase-out of 2SC engines and improved inspection and maintenance), the contributions of 2/3 wheelers can become comparable to those of cars (Figure 6) despite being almost 8 times greater in number (Figure 2).

5.3.2. High CO Emissions

The majority (>70%) of pollutant emissions from transport are of CO [6,8], which are considerably higher than in neighbouring India [69]. The second highest emissions are of VOCs.
Causes: Spark ignition (petrol, CNG, LPG) engines. Most of these engines are either indirect injected or carburetted, which does not permit precise air–fuel ratio control. This can lead to rich combustion, especially during transient operation and if the carburettor is not properly tuned. VOC emission levels are also elevated for the same reason. High benzene and aromatic content in petrol likely also contribute to high VOC emissions. Moreover, oxidation or three-way catalysts that can reduce CO and VOC emissions are rare.
Recommendations: Improved engine tuning and maintenance requirements to reduce incomplete combustion episodes. Mandating oxidation or three-way catalysts. Shifting to modern petrol fuel standards that have low benzene, aromatic, and sulphur content.

5.3.3. High SO2 Emissions

High levels of SO2 emissions from transport were significantly higher than in neighbouring India [69], and are responsible for high concentrations of secondary sulphate based aerosols [31].
Causes: High sulphur content in diesel fuel and lube oil burning in 2SC engines [71]. Major sources of PM were 2SC engines followed by diesel vehicles [15]. Particles from diesel vehicles were coarser than those from petrol vehicles, and diesel PM emissions had high sulphur content [14]. For 2SC engines, the use of low quality, high sulphur lube oil [11] and overuse of it (12.5% instead of required 2–3%) [95] exacerbated the problem.
Recommendations: Move to 50 ppm or preferably 10 ppm sulphur fuel and phase out 2SC engines, potentially by replacing 2SC motorcycles and autorickshaws with electric ones, and mandating particulate filters.

5.3.4. Lack of Exhaust After-Treatment

Most vehicles, with the exception of modern high-end petrol vehicles that have oxidation catalysts [58], do not have after-treatment devices.
Causes: Lack of emissions regulations and low-quality fuel that can poison after-treatment devices.
Recommendations: Move to modern fuel quality standards and introduction of emissions regulations, currently set (since 2012) to the outdated Euro 2 standard that was released in 1997 [1]. This will mandate the use of after-treatment systems, especially three-way-catalysts, oxidation catalysts and particulate filters.
Non-exhaust emissions were not investigated in detail in the reviewed studies and warrant a deeper look. In their receptor-based study, Stone et al. [15] attributed around 1.4% of the total coarse emissions in Lahore to tyre wear.

6. Conclusions and Recommendations

A critical review of source apportionment studies conducted in the urban centres of Pakistan was undertaken, the strengths and weaknesses of different approaches were discussed, and based on its automotive fleet composition, an emissions profile for Pakistan was presented. The review was limited to studies conducted over the past two decades, and prioritised peer-reviewed publications, which might have resulted in an uneven discussion across Pakistan’s urban centres. Moreover, because of the lack of direct emissions data, assumed emissions factors were used to discuss the air pollution potential of various vehicle classes. A few recommendations about the utilisation of different source apportionment approaches and reporting their results are made below.

6.1. Source Apportionment Approaches

The cost and complexity of different source apportionment methods are related to their accuracy. It is recommended that high-fidelity studies be carried out periodically to develop a rich, granulated understanding of the emissions profile of different urban centres of Pakistan. This can then inform lower-fidelity and resolution investigations that are relatively economical and can be carried out more frequently. Knowledge gained from high-fidelity studies can be used to fill in gaps and interpret results from lower-fidelity studies. A practical mechanism to monitor air pollution and gauge the effects of policy interventions can thus be established. Additionally, it is recommended that for sectoral inventories, the choice of the emissions factors — which, for the Tier I approach used in the surveyed studies, are not developed and calibrated for Pakistan’s energy systems — be critically analysed, and national emissions factors be developed. The transport contribution to the air quality problem should be revisited, as estimates from previous sectoral inventory reports are based on significant assumptions.

6.2. Reporting

It is important that while reporting the contribution of different sectors to air quality degradation, differences in the relative risk potential of pollutant species are accounted for. This can be done either by calculating sectoral shares based on the emissions of PM2.5, which is the most problematic of pollutant species because of its high disease burden and prevalence, or by using an appropriately weighted AQI. Estimating air pollution share based on the total mass of a specific pollutant species from sectoral inventories should be avoided. The total mass of a pollutant may not be representative of the health implications it may have. This can overstate the contribution of vehicle emissions because of the disproportionately high CO emissions from Pakistan’s road transport. The currently available sectoral inventory results for transport should preferably be read as a percentage of particulate emissions and not as a percentage of the total emissions mass. Quantitative health impact and burden of disease assessments should also be carried out to better understand and communicate the health costs of transport-related exposures.

6.3. Vehicular Emissions

The emissions profile presented for Pakistan’s urban automotive fleet identifies 2/3 wheelers, almost all of which are carburetted and a significant fraction are powered by 2SC engines, as the largest (36–64%) vehicular pollution source. High sulphur content in fuel (especially diesel) and lube oil, poorly tuned and maintained engines that burn rich, and lack of exhaust after-treatment systems are recognised as reasons for Pakistan’s disproportionately high vehicular emissions. Replacing current Euro 2 emissions and fuel regulations with modern (Euro 5 or higher) regulations can address these challenges. A gradual replacement of Euro 2 petrol with Euro 5 is underway, but progress on the diesel fuel front is slower. This should be prioritised, as it will not only directly lower emissions of SO2 and PM, but will also enable the use of modern engine control and after-treatment technologies that can substantially lower the emissions of CO, NOx, VOC, and PM.

Author Contributions

Conceptualization, A.U.B.; writing—original draft preparation, A.U.B. and H.A.S.; writing—review and editing, A.U.B. and H.A.S. All authors have read and agreed to the published version of the manuscript.

Funding

This publication arises from activities funded by the Policy Support Fund through the Oxford Policy Engagement Network (OPEN) Seed Fund. HAS would like to thank the Cambridge Trust for his PhD funding.

Institutional Review Board Statement

Not applicable.

Informed Consent Statement

Not applicable.

Data Availability Statement

Only publicly available data is used in the review paper. It can be found in the referenced sources.

Acknowledgments

Sincere thanks are extended to Imran Saqib and Sanval Nasim for guidance and constructive conversations about the air pollution problem in Pakistan.

Conflicts of Interest

The authors declare no conflict of interest.

Nomenclature

2SCTwo-Stroke Cycle
4SCFour-Stroke Cycle
AERONETAutomated Sun and Sky Scanning Radiometers
AQIAir Quality Index
CAMSCopernicus Atmospheric Monitoring Services
CNGCompressed Natural Gas
DIDirect Injection
DPFDiesel Particulate Filter
EPAEnvironmental Protection Agency (US)
EPDEnvironmental Protection Department (Punjab)
FAOFood and Agriculture Organization
GAINSGHG–Air Pollution Interaction and Synergies
GHGGreenhouse Gas
GPFGasoline Particulate Filter
HDVHeavy Duty Vehicle
ICInternal Combustion
IPCCIntergovernmental Panel on Climate Change
LCVLight Commercial Vehicle
LPGLiquified Petroleum Gas
NAAQSNational Ambient Air Quality Standards
NOxOxides of Nitrogen
PAHPolycyclic Aromatic Hydrocarbon
PCAAPeshawar Clean Air Alliance
PMParticulate Matter
PMFPositive Matrix Factorisation
SOxOxides of Sulphur
VOCVolatile Organic Compound
WHOWorld Health Organisation

References

  1. Senecal, K.; Leach, F. Racing Toward Zero: The Untold Story of Driving Green; SAE International: Warrendale, PA, USA, 2021. [Google Scholar]
  2. Heydari, S.; Tainio, M.; Woodcock, J.; de Nazelle, A. Estimating traffic contribution to particulate matter concentration in urban areas using a multilevel Bayesian meta-regression approach. Environ. Int. 2020, 141, 105800. [Google Scholar] [CrossRef] [PubMed]
  3. World Population Review. Pakistan Population 2023. 2023. Available online: https://worldpopulationreview.com/countries/pakistan-population (accessed on 1 January 2020).
  4. Ritchie, H. Who Has Contributed Most to Global CO2 Emissions? Our World Data. 2021. Available online: https://ourworldindata.org/contributed-most-global-co2 (accessed on 1 January 2020).
  5. Mir, K.A.; Purohit, P.; Cail, S.; Kim, S. Co-benefits of air pollution control and climate change mitigation strategies in Pakistan. Environ. Sci. Policy 2022, 133, 31–43. [Google Scholar] [CrossRef]
  6. The Urban Unit. Sectoral Emission Inventory of Lahore; Technical Report; The Urban Unit (Government of Punjab): Lahore, Pakistan, 2023. [Google Scholar]
  7. Habib, A.; Nasim, S.; Shahab, A. Charting Pakistan’s Air Quality Policy Landscape; International Growth Centre: London, UK, 2021. [Google Scholar]
  8. Remote Sensing for Space-Time Mapping of Smog in Punjab and Identification of the Underlying Causes Using Geographic Information System (R-SMOG); Technical Report; Food and Agriculture Organization of the United Nations: Rome, Italy, 2019.
  9. Yale Energy Performance Index; Technical Report; Yale Center for Environmental Law Policy: New Haven, CT, USA, 2022; Available online: https://epi.yale.edu/epi-results/2022/country/pak (accessed on 1 January 2020).
  10. Pakistan AQ Life Index Fact Sheet; Technical Report; Energy Policy Institute at the University of Chicago: Chicago, IL, USA, 2022; Available online: https://aqli.epic.uchicago.edu/wp-content/uploads/2021/08/PakistanFactSheetupdate.pdf (accessed on 1 January 2020).
  11. Ul Haque, R. Rickshaw and Environmental Pollution: Assessing Punjab Government’s Rickshaw Policy; Technical Report; Centre for Public Policy and Governance (CPPG), FC College: Lahore, Pakistan, 2009. [Google Scholar]
  12. Map from Google Maps. Available online: www.google.com/maps (accessed on 18 October 2023).
  13. Kyrkilis, G.; Chaloulakou, A.; Kassomenos, P.A. Development of an aggregate Air Quality Index for an urban Mediterranean agglomeration: Relation to potential health effects. Environ. Int. 2007, 33, 670–676. [Google Scholar] [CrossRef] [PubMed]
  14. Sheikh, H.A.; Maher, B.A.; Karloukovski, V.; Lampronti, G.I.; Harrison, R. Biomagnetic characterization of air pollution particulates in Lahore, Pakistan. Geochem. Geophys. Geosystems 2022, 23, e2021GC010293. [Google Scholar] [CrossRef]
  15. Stone, E.; Schauer, J.; Quraishi, T.A.; Mahmood, A. Chemical characterization and source apportionment of fine and coarse particulate matter in Lahore, Pakistan. Atmos. Environ. 2010, 44, 1062–1070. [Google Scholar] [CrossRef]
  16. Harrison, R.M. Pollution: Causes, Effects and Control; Royal Society of Chemistry: London, UK, 2001. [Google Scholar]
  17. Seaton, A.; Godden, D.; MacNee, W.; Donaldson, K. Particulate air pollution and acute health effects. Lancet 1995, 345, 176–178. [Google Scholar] [CrossRef]
  18. Schwarze, P.E.; Øvrevik, J.; Låg, M.; Refsnes, M.; Nafstad, P.; Hetland, R.B.; Dybing, E. Particulate matter properties and health effects: Consistency of epidemiological and toxicological studies. Hum. Exp. Toxicol. 2006, 25, 559–579. [Google Scholar] [CrossRef]
  19. Vimercati, L. Traffic related air pollution and respiratory morbidity. Lung India 2011, 28, 238. [Google Scholar] [CrossRef]
  20. Manisalidis, I.; Stavropoulou, E.; Stavropoulos, A.; Bezirtzoglou, E. Environmental and Health Impacts of Air Pollution: A Review. Front. Public Health 2020, 8, 14. [Google Scholar] [CrossRef]
  21. Weichenthal, S.; Pinault, L.; Christidis, T.; Burnett, R.T.; Brook, J.R.; Chu, Y.; Crouse, D.L.; Erickson, A.C.; Hystad, P.; Li, C.; et al. How low can you go? Air pollution affects mortality at very low levels. Sci. Adv. 2022, 8, eabo3381. [Google Scholar] [CrossRef]
  22. Rehman, A.; Liu, G.; Yousaf, B.; Zia-ur Rehman, M.; Ali, M.U.; Rashid, M.S.; Farooq, M.R.; Javed, Z. Characterizing pollution indices and children health risk assessment of potentially toxic metal(oid)s in school dust of Lahore, Pakistan. Ecotoxicol. Environ. Saf. 2020, 190, 110059. [Google Scholar] [CrossRef]
  23. Naveed, Z.; Khayyam, U. Smog and cognitive issues in the school going children of Lahore and Islamabad, Pakistan. Int. J. Environ. Sci. Technol. 2023, 20, 4151–4166. [Google Scholar] [CrossRef]
  24. Ilyas, S.Z.; Khattak, A.I.; Nasir, S.M.; Qurashi, T.; Durrani, R. Air pollution assessment in urban areas and its impact on human health in the city of Quetta, Pakistan. Clean Technol. Environ. Policy 2010, 12, 291–299. [Google Scholar] [CrossRef]
  25. Ullah, S.; Ullah, N.; Rajper, S.A.; Ahmad, I.; Li, Z. Air pollution and associated self-reported effects on the exposed students at Malakand division, Pakistan. Environ. Monit. Assess. 2021, 193, 708. [Google Scholar] [CrossRef] [PubMed]
  26. Ott, W.R.; Hunt, W.F., Jr. A quantitative evaluation of the pollutant standards index. J. Air Pollut. Control Assoc. 1976, 26, 1050–1054. [Google Scholar] [CrossRef] [PubMed]
  27. Technical Assistance Document for the Reporting of Daily Air Quality–The Air Quality Index (AQI); Technical Report; United States Enviornmental Protection Agency: Washington, DC, USA, 2020. Available online: https://www.airnow.gov/sites/default/files/2020-05/aqi-technical-assistance-document-sept2018.pdf (accessed on 1 January 2020).
  28. Population Profile Punjab; Government of Punjab: Lahore, Pakistan, 2018. Available online: https://pwd.punjab.gov.pk/populationprofile (accessed on 1 January 2020).
  29. Standing Instructions for Management of Episodes of Poor Air Quality in the Punjab; Technical Report; Environmental Protection Department, Government of the Punjab: Lahore, Pakistan, 2018. Available online: https://epd.punjab.gov.pk/system/files/AnnexD3.pdf (accessed on 1 January 2020).
  30. Punjab EPD Air Quality Reports. 2023. Available online: https://epd.punjab.gov.pk/aqi (accessed on 1 January 2020).
  31. Lodhi, A.; Ghauri, B.; Khan, M.R.; Rahman, S.; Shafique, S. Particulate matter (PM2.5) concentration and source apportionment in Lahore. J. Braz. Chem. Soc. 2009, 20, 1811–1820. [Google Scholar] [CrossRef]
  32. Raza, W.; Saeed, S.; Saulat, H.; Gul, H.; Sarfraz, M.; Sonne, C.; Sohn, Z.H.; Brown, R.J.; Kim, K.H. A review on the deteriorating situation of smog and its preventive measures in Pakistan. J. Clean. Prod. 2021, 279, 123676. [Google Scholar] [CrossRef]
  33. Khokhar, M.F.; Yasmin, N.; Chishtie, F.; Shahid, I. Temporal variability and characterization of aerosols across the Pakistan region during the winter fog periods. Atmosphere 2016, 7, 67. [Google Scholar] [CrossRef]
  34. Ashraf, A.; Butt, A.; Khalid, I.; Alam, R.U.; Ahmad, S.R. Smog analysis and its effect on reported ocular surface diseases: A case study of 2016 smog event of Lahore. Atmos. Environ. 2019, 198, 257–264. [Google Scholar] [CrossRef]
  35. Riaz, R.; Hamid, K. Existing smog in Lahore, Pakistan: An alarming public health concern. Cureus 2018, 10, e2111. [Google Scholar] [CrossRef]
  36. Khanum, F.; Chaudhry, M.N.; Kumar, P. Characterization of five-year observation data of fine particulate matter in the metropolitan area of Lahore. Air Qual. Atmos. Health 2017, 10, 725–736. [Google Scholar] [CrossRef] [PubMed]
  37. WHO Global Air Quality Guidelines; Technical Report; World Health Organization: Geneva, Switzerland, 2021; Available online: https://www.who.int/publications/i/item/9789240034228 (accessed on 1 January 2020).
  38. National Clean Air Policy; Technical Report; Ministry of Climate Change, Government of Pakistan: Lahore, Pakistan, 2023.
  39. Rasheed, A.; Aneja, V.P.; Aiyyer, A.; Rafique, U. Measurement and analysis of fine particulate matter (PM2.5) in urban areas of Pakistan. Aerosol Air Qual. Res. 2015, 15, 426–439. [Google Scholar] [CrossRef]
  40. Status of Air Pollution in Peshawar; Technical Report; Peshawar Clean Air Alliance: Washington, DC, USA, 2022; Available online: https://pcaakp.org/wp-content/uploads/2022/05/APP-Report-15.04.22.pdf (accessed on 1 January 2020).
  41. Bajwa, A.U.; Shankar, V.; Leach, F.C.P. Engine-Out Ammonia Emissions from a Gasoline Direct Injection Engine; SAE Technical Paper; SAE International: Warrendale, PA, USA, 2023. [Google Scholar]
  42. Kukutschová, J.; Moravec, P.; Tomášek, V.; Matejka, V.; Smolík, J.; Schwarz, J.; Seidlerová, J.; Šafárová, K.; Filip, P. On airbornenano/micro-sized wear particles released from low-metallic automotive brakes. Environ. Pollut. 2011, 159, 998–1006. [Google Scholar] [CrossRef] [PubMed]
  43. Joshi, A. Year in Review: Progress towards Decarbonizing Transport and Near-Zero Emissions; SAE Technical Paper; SAE International: Warrendale, PA, USA, 2023. [Google Scholar]
  44. Chang, K.F.; Fang, G.C.; Chen, J.C.; Wu, Y.S. Atmospheric polycyclic aromatic hydrocarbons (PAHs) in Asia: A review from 1999 to 2004. Environ. Pollut. 2006, 142, 388–396. [Google Scholar] [CrossRef] [PubMed]
  45. Xie, Y.; Posada, F.; Minjares, R. Diesel sulfur content impacts on Euro VI soot-free vehicles: Considerations for emerging markets. Front. Environ. Sci. Eng. 2020, 10. [Google Scholar]
  46. Heywood, J.B. Internal Combustion Engine Fundamental; McGraw-Hill: New York, NY, USA, 1988. [Google Scholar]
  47. Heywood, J. Two-Stroke Cycle Engine: Its Development, Operation and Design; Routledge: Abingdon, UK, 2017. [Google Scholar]
  48. Ravimohan, A.; Gupta, M.; Bhat, U.; Sabnis, S. India 2000 Emission Norms and Fuel Economy Opportunity for Lubricant Technology in Small Two Stroke Engines; Technical Report; SAE International: Warrendale, PA, USA, 2003. [Google Scholar]
  49. Leach, F.; Chapman, E.; Jetter, J.J.; Rubino, L.; Christensen, E.D.; John, P.C.S.; Fioroni, G.M.; McCormick, R.L. A review and perspective on particulate matter indices linking fuel composition to particulate emissions from gasoline engines. SAE Int. J. Fuels Lubr. 2021, 15, 3–28. [Google Scholar] [CrossRef]
  50. Dawn. Honda Complaint Fuels Confusion. 2007. Available online: https://www.dawn.com/news/1368203 (accessed on 1 January 2020).
  51. Jalihal, S.A.; Ravinder, K.; Reddy, T. Traffic characteristics of India. East. Asia Soc. Transp. Stud. 2005, 5, 1009–1024. [Google Scholar]
  52. Historic Vehicle Sales and Production Data; Technical Report; Pakistan Automotive Manufacturers Association: Karachi, Pakistan; Available online: https://pama.org.pk/annual-sales-production/ (accessed on 1 January 2020).
  53. Honda CD70 2020 Technical Specifications. 2020. Available online: https://bikez.com/motorcycles/atlashondacd702020.php (accessed on 1 January 2020).
  54. Ahmad, D. The Motorcycle Story. Profit. 2022. Available online: https://profit.pakistantoday.com.pk/2022/10/30/the-motorcycle-story/ (accessed on 1 January 2020).
  55. United Auto Rickshaw 200CC (3-Seater) Technical Specifications. 2023. Available online: https://www.unitedmotorcycle.com.pk/3seater.php (accessed on 1 January 2020).
  56. Sazgar Autos Products Technical Specifications. 2023. Available online: https://sazgarautos.com/product/deluxe-xl/ (accessed on 1 January 2020).
  57. Suzuki GS150 Technical Specifications. 2023. Available online: https://suzukipakistan.com/media/products/GS%20150/GS%20150%20Brochure.pdf (accessed on 1 January 2020).
  58. Honda Civic 2023 Technical Specifications. 2023. Available online: https://honda.com.pk/civic-rs-turbo (accessed on 1 January 2020).
  59. Toyotal Corolla 2023 Technical Specifications. 2023. Available online: https://toyota-indus.com/corolla-x/ (accessed on 1 January 2020).
  60. Suzuki Alto 2023 Technical Specifications. 2023. Available online: https://suzukipakistan.com/automobile-detail?automobile=49r4xpn9fhdksr54wt6assjtmaprod-tab-specifications (accessed on 1 January 2020).
  61. Ansari, U. Two Years and Still No Euro-5 Cars? CarspiritPK. 2022. Available online: https://carspiritpk.com/two-years-and-still-no-euro-5-cars/ (accessed on 1 January 2020).
  62. Hino Pak Technology. 2023. Available online: https://hinopak.com/technology/ (accessed on 1 January 2020).
  63. Fuso Master Medium Duty Trucks. 2023. Available online: https://fusomaster.com/en/lineup/truck/index.html (accessed on 1 January 2020).
  64. Mir, K.A.; Purohit, P.; Mehmood, S. Sectoral assessment of greenhouse gas emissions in Pakistan. Environ. Sci. Pollut. Res. 2017, 24, 27345–27355. [Google Scholar] [CrossRef]
  65. Malik, A. Fuel Demand in Pakistan’s Transport Sector; MPRA Paper 103455; University Library of Munich: Munich, Germany, 2018. [Google Scholar]
  66. Yasin, G.; Ansari, T.M.; Naqvi, S.M.S.R.; Talpur, F.N. Analytical studies on the quality and environmental impact of commercial Motor gasoline available in Multan region of Pakistan. Pak. J. Anal. Environ. Chem. 2008, 9, 8. [Google Scholar]
  67. EU Fuels––Diesel and Gasoline. TransportPolicy.net. Available online: https://www.transportpolicy.net/standard/eu-fuels-diesel-and-gasoline/ (accessed on 1 January 2020).
  68. Another First By PSO––Launch of Euro 5 Standard Fuel in Pakistan; Ministry of Energy (Government of Pakistan): Lahore, Pakistan, 2020. Available online: https://petroleum.gov.pk/NewsDetail/Zjg5NWMxZjItNzgwYS00NzRkLWE3NzEtNGU5ODA5NmVkNjVm (accessed on 1 January 2020).
  69. Scoping Study for South Asia Air; Technical Report; The Energy and Resources Institute: Maharashtra, India, 2019.
  70. Ali, M.; Tariq, S.; Mahmood, K.; Daud, A.; Batool, A.; Zia-ul-Haq. A study of aerosol properties over Lahore (Pakistan) by using AERONET data. Asia-Pac. J. Atmos. Sci. 2014, 50, 153–162. [Google Scholar] [CrossRef]
  71. Raja, S.; Biswas, K.F.; Husain, L.; Hopke, P.K. Source Apportionment of the Atmospheric Aerosol in Lahore, Pakistan. Water Air Soil Pollut. 2010, 208, 43–57. [Google Scholar] [CrossRef]
  72. Imran, H.; Maqsood, Z.; Ullah, A.; Butt, N.Z. Effective Prediction of Transmission of Solar Irradiance through Dusty Solar Panels using Atmospheric Aerosol Data for Lahore, Pakistan. In Proceedings of the 2019 IEEE 46th Photovoltaic Specialists Conference (PVSC), Chicago, IL, USA, 16–21 June 2019; pp. 2889–2893. [Google Scholar] [CrossRef]
  73. Shabbir, Y.; Khokhar, M.F.; Shaiganfar, R.; Wagner, T. Spatial variance and assessment of nitrogen dioxide pollution in major cities of Pakistan along N5-Highway. J. Environ. Sci. 2016, 43, 4–14. [Google Scholar] [CrossRef] [PubMed]
  74. Ahmed, M.; Xiao, Z.; Shen, Y. Estimation of Ground PM2.5 Concentrations in Pakistan Using Convolutional Neural Network and Multi-Pollutant Satellite Images. Remote Sens. 2022, 14, 1735. [Google Scholar] [CrossRef]
  75. Matzka, J.; Maher, B. Magnetic biomonitoring of roadside tree leaves: Identification of spatial and temporal variations in vehicle-derived particulates. Atmos. Environ. 1999, 33, 4565–4569. [Google Scholar] [CrossRef]
  76. Singh, B.; Kaushik, A. Application of biomagnetic analysis technique using roadside trees for monitoring and identification of possible sources of atmospheric particulates in selected air pollution hotspots in Delhi, India. Atmos. Pollut. Res. 2021, 12, 101113. [Google Scholar] [CrossRef]
  77. Alam, K.; Mukhtar, A.; Shahid, I.; Blaschke, T.; Majid, H.; Rahman, S.; Khan, R.; Rahman, N. Source Apportionment and Characterization of Particulate Matter (PM10) in Urban Environment of Lahore. Aerosol Air Qual. Res. 2014, 14, 1851–1861. [Google Scholar] [CrossRef]
  78. Meyer, M.; Khan, T.; Dallmann, T.; Yang, Z. Particulate Matter Emissions from US Gasoline Light-Duty Vehicles and Trucks; United States of America: Washington, DC, USA, 2023. [Google Scholar]
  79. Yasar, A.; Haider, R.; Tabinda, A.B.; Kausar, F.; Khan, M. A comparison of engine emissions from heavy, medium, and light vehicles for CNG, diesel, and gasoline fuels. Pol. J. Environ. Stud 2013, 22, 1277–1281. [Google Scholar]
  80. Chen, S.; Dietrich Brauch, M. Comparison Between the IPCC Reporting Framework and Country Practice. Columbia Cent. Sustain. Investig. 2021. Available online: https://scholarship.law.columbia.edu/sustainable_investment_staffpubs/200 (accessed on 1 January 2020). [CrossRef]
  81. Khan, A.; Akif, M.; Khattak, M. Atmospheric pollution due to carbon monoxide from vehicular exhaust in Peshawar. J. Chem. Soc. Pak. 1996, 18, 178. [Google Scholar]
  82. Barletta, B.; Meinardi, S.; Simpson, I.J.; Khwaja, H.A.; Blake, D.R.; Rowland, F. Mixing ratios of volatile organic compounds (VOCs) in the atmosphere of Karachi, Pakistan. Atmos. Environ. 2002, 36, 3429–3443. [Google Scholar] [CrossRef]
  83. Khan, M.; Khan, A.; Aslam, M.; Anwer, T.; Shah, J. Study of atmospheric pollution due to vehicular exhaust at the busy cross roads in Peshawar City (Pakistan) and its minimizing measures. J. Chem. Soc. Pak. 2008, 30, 16. [Google Scholar]
  84. Faiz, Y.; Tufail, M.; Javed, M.T.; Chaudhry, M.; Naila-Siddique. Road dust pollution of Cd, Cu, Ni, Pb and Zn along Islamabad Expressway, Pakistan. Microchem. J. 2009, 92, 186–192. [Google Scholar] [CrossRef]
  85. Mansha, M.; Ghauri, B.; Rahman, S.; Amman, A. Characterization and source apportionment of ambient air particulate matter (PM2.5) in Karachi. Sci. Total Environ. 2012, 425, 176–183. [Google Scholar] [CrossRef] [PubMed]
  86. Hassan, M.; Malik, A.; Waseem, A.; Abbas, M. Air pollution Monitoring in Urban Areas due to Heavy Transportation and Industries: A Case Study of Rawalpindi and Islamabad. J. Chem. Soc. Pak. 2013, 35, 1623–1629. [Google Scholar]
  87. Ali, Z.; Rauf, A.; Sidra, S.; Nasir, Z.A.; Colbeck, I. Air quality (particulate matter) at heavy traffic sites in Lahore, Pakistan. J. Chem. Soc. Pak. 2015, 25, 644–648. [Google Scholar]
  88. Javed, W.; Wexler, A.S.; Murtaza, G.; Ahmad, H.R.; Basra, S.M.A. Spatial, temporal and size distribution of particulate matter and its chemical constituents in Faisalabad, Pakistan. Atmósfera 2015, 28, 99–116. [Google Scholar] [CrossRef]
  89. Kamal, A.; Syed, J.H.; Li, J.; Zhang, G.; Mahmood, A.; Malik, R.N. Profile of Atmospheric PAHs in Rawalpindi, Lahore and Gujranwala Districts of Punjab Province (Pakistan). Aerosol Air Qual. Res. 2016, 16, 1010–1021. [Google Scholar] [CrossRef]
  90. Zahra, S.I.; Iqbal, M.J.; Ashraf, S.; Aslam, A.; Ibrahim, M.; Yamin, M.; Vithanage, M. Comparison of Ambient Air Quality among Industrial and Residential Areas of a Typical South Asian City. Atmosphere 2022, 13, 1168. [Google Scholar] [CrossRef]
  91. Hyder, A.; Ghaffar, A.; Sugerman, D.; Masood, T.; Ali, L. Health and road transport in Pakistan. Public Health 2006, 120, 132–141. [Google Scholar] [CrossRef]
  92. Khreis, H.; Nieuwenhuijsen, M.; Zietsman, J.; Ramani, T. Traffic-Related Air Pollution; Elsevier: Amsterdam, The Netherlands, 2020. [Google Scholar]
  93. Haider, R.; Yasar, A.; Tabinda, A.B. Impact of transport sustainability on air quality in Lahore, Pakistan. Curr. Sci. 2018, 114, 2380–2386. [Google Scholar] [CrossRef]
  94. Bajwa, A.U.; Patterson, M.; Jacobs, T.J. Trapped equivalence ratio determination in two-stroke engines. Proc. Inst. Mech. Eng. Part D J. Automob. Eng. 2023, 237, 2006–2021. [Google Scholar] [CrossRef]
  95. Khan, M.R. Banning Two-stroke Auto-rickshaws in Lahore: Policy Implications. Pak. Dev. Rev. 2006, 45, 1169–1185. [Google Scholar] [CrossRef]
Figure 1. Major urban centres of Pakistan reviewed in this study [12].
Air 01 00018 g001
Figure 2. Annual sales of vehicles in Pakistan from 2021–2022 [52]. The data do not include imported vehicles and vehicles from manufacturers that are not a part of the Pakistan Automotive Manufacturers Association. Tractor sales have been excluded.
Air 01 00018 g002
Figure 3. Total engine capacity of different vehicle classes calculated from sales data for 2021–2022 [52] by assuming average engine capacity values of: 1077 cc for cars, 7000 cc for trucks, 8000 cc for busses, 1818 cc for LCVs, 88 cc for 2/3 wheelers. The values are calculated based on vehicle sale numbers and publicly available technical specifications.
Air 01 00018 g003
Figure 4. Comparison of different source apportionment approaches.
Air 01 00018 g004
Figure 5. Contribution of the transport sector to air pollution in Pakistan from a selection of the surveyed studies (Table 2). Average contribution as a % of PM2.5 mass from FAO and Urban Unit studies are calculated by the authors. FAO: Food and Agriculture Organisation [8], CPPG: Centre for Public Policy and Governance [11], PCAA: Peshawar Clean Air Alliance [40].
Air 01 00018 g005
Figure 6. Estimated relative emissions of different vehicle classes in Pakistan assuming cars as the baseline and other vehicle classes having the following relative emissions factors: HDV 1.2–1.5, LCV 1–1.3, 2/3 wheelers 1.75–3.
Air 01 00018 g006
Table 1. Sulphur level limits in European fuel regulations [45].
RegulationApplication Date (in Europe)Sulphur Level Limit (ppm)
Euro 21996500 (diesel)
Euro 32000350 (diesel), 150 (petrol)
Euro 4200550 (diesel, petrol)
Euro 5200810 (diesel, petrol)
Euro 6201310 (diesel, petrol)
Table 3. Summary of notable pollution-related problems across different engine types used in Pakistan’s automotive fleet. DI: direct injection, IDI: indirect injection.
Engine TypeProblems (Likely Causes)Vehicles
Petrol (DI)Inadequate after-treatmentSome cars and SUVs
Petrol (IDI, carburetted)High CO (stoichiometric/rich combustion and potentially poor mixing), lacking after-treatmentMost cars and autorickshaws, majority of motorcycles
DieselHigh SO2 and PM (poor mixing and high-sulphur fuel), lacking after-treatmentHeavy duty vehicles, some light duty vehicles
2SC (Carburetted)High VOCs, CO, PM, and SO2 (poor mixing, lube oil combustion, and indirect fuel metering), lacking after-treatmentOld motorcycles and autorickshaws
CNGHigh CO (stoichiometric/rich combustion) Higher NO than petrol vehicles, lacking after-treatmentLight-duty vehicles and buses
Disclaimer/Publisher’s Note: The statements, opinions and data contained in all publications are solely those of the individual author(s) and contributor(s) and not of MDPI and/or the editor(s). MDPI and/or the editor(s) disclaim responsibility for any injury to people or property resulting from any ideas, methods, instructions or products referred to in the content.

