1. Introduction
Ammonia (NH
3) is a highly reactive and highly soluble alkaline trace gas in the atmosphere, emitted by both natural and anthropogenic sources [
1]. Atmospheric NH
3 emissions from agriculture can be broken down into two categories: animal husbandry and arable agriculture. Within these, many facets contribute various amounts of NH
3 to the atmosphere. However, the four major components are synthetic fertilizer application (10%), grazing (12%), manure management housing and storage (48%), and manure land spreading (30%) [
2]. While fertilizer application accounts for the least of the atmospheric NH
3 emitted, it is also the least researched area in Ireland in terms of emissions. Emission and deposition vary both spatially and temporally, resulting in emission “hot spots” correlating to areas with a high density of agricultural activity [
3]. Additional emissions of NH
3 associated with agriculture include fertilizer production and biomass burning.
From an emission intensity standpoint, grassland would be a more likely candidate for study as it accounts for a larger portion of the landmass. However, the emissions arising from arable agriculture in Ireland are much less explored, and indeed reported, while grasslands are studied with a much higher frequency. Additionally, while greenhouse gas emissions are higher in areas where the main land cover type is grassland, the atmospheric component of interest (NH
3) is not defined as a greenhouse gas. Therefore, emissions of NH
3 gas are not included when reviewing and discussing greenhouse gases [
4]. Therefore, this study aided in filling in this gap through selecting study sites where the main economic activity was arable agriculture, building monitoring networks measuring NH3 and aerosol NH
4+, and weather stations measuring variables such as micrometeorology.
Ireland’s land use is primarily invested in agriculture, with a leading 66.1%. Arable agriculture accounts for 15.4%, with the remainder being permanent pasture. Forestry makes up 10.9%, and 23% is classified as ‘other’, including 1.8% for settlement [
5]. In Ireland, agriculture is responsible for 99% of NH
3 emissions to the atmosphere [
4]. NH
3 emission from fertilizer application arises through the process of volatilization, a physical process highly dependent on temperature and pH [
6]. As NH
3 enters the atmosphere, it generally moves laterally with a relatively short half-life. It can be deposited within a small radius (a few hundred meters) of the source clinging to nearby surfaces. However, the atmospheric residence time of NH
3 depends on various factors, such as the conversion rate of NH
3 to NH
4+ and the rate of deposition of each species. A residence time between 0.8 and 4 days for NH
3 and 5 and 19 days for NH
4+ is generally accepted [
7].
Overall, NH
3 emitted to the atmosphere is either dry-deposited back onto surfaces (for example, to foliage), is wet-deposited onto surfaces, or undergoes atmospheric reactions (transforming into different atmospheric species). In the atmosphere, NH
3 will also be converted to ammonium (NH
4+), which also undergoes the deposition processes mentioned above. From an environmental perspective, elevated concentrations of NH
3 can lead to deleterious impacts, including the formation of secondary aerosols, biodiversity losses, and eutrophication [
3]. These impacts also have ramifications for human health, including premature mortality, decreased lung functionality, and increased cardiovascular problems [
8].
In the atmosphere, NH
3 gas can react with sulfur dioxide (SO
2) and nitrogen oxides (NO
x) to form secondary inorganic aerosols (SIAs). Since NH
3 is an alkaline gas, it can also undergo neutralization reactions with acids present in the atmosphere (sulfuric acid (H
2SO
4), nitric acid (HNO
3), and in certain cases hydrochloric acid (HCl)) [
9,
10]. NH
3 aerosols comprise a significant portion of aerosols in the atmosphere, making up approximately 30–50% of aerosol mass of particulate matter [
11]. The Irish Environmental Protection Agency (EPA) currently monitors atmospheric particulate NH
4+ at three representative sites (Carnsore, County Wexford; Oak Park, County Carlow; and Malin, County Donegal) in agreement with the European Monitoring and Evaluation Programme (EMEP). However, unlike in other EU countries and the United Kingdom, there is currently no continuous monitoring network in place for NH
3 gas concentration in Ireland [
12].
In contrast to Ireland, under the UK National Ammonia Monitoring Network (NAMN), Northern Ireland has three continuous monitoring sites for NH3 gas in the atmosphere. NH3 is also a pollutant that is currently not covered by the CAFÉ Directive under ambient air quality (Directive 2008/50/EC) and does not fall under the national ambient air quality network, which the EPA manages. Consequently, there are significant uncertainties and gaps in knowledge regarding NH3 fluxes and SIA levels.
The primary aim of this paper is to highlight and demonstrate the relationships between the variables measured, the emission levels detected, and the key role of agricultural practices and management, with a cross-examination of policy implications and emission mitigation potentials. As such, this paper reviews and contributes recommendations which aid compliance with directives such as the National Emissions Ceiling and the National Clean Air Strategy (Directive 2001/81/EC).
2. Materials and Methods
2.1. Description of Study Sites
Two arable agricultural site and a remote control site were monitored during the study period. The two agricultural sites were assigned the labels Site 1 and 2, and the control site was assigned the label Site 3. Site 1 was 11.2 ha, where winter wheat (Triticum aestivum), winter barley (Hordeum vulgare), and field beans (commonly known as fava beans, Vicia faba) are cultivated in rotation. Prior to field beans, rapeseed (Brassica napus subsp. napus) was cultivated on the farm (the change was made circa 2019). Site 2 was 8.4 ha, and similarly to Site 1, wheat and barley were cultivated. However, Site 2 was commercially rented. Sites 1 and 2 used inorganic (chemical) fertilizer to augment soil nutrition levels during the study period.
In the case of Site 1, the nitrogen-based fertilizer applied throughout the growing season is calcium ammonium nitrate (CAN). This is a widely used fertilizer and accounts for approx. 4% of globally utilized synthetic fertilizer. Additionally, sulfate of ammonia is also applied as fertilizer. However, due to its tendency to increase soil acidification, this fertilizer is used sparingly (21 units = 21 kg per annum). In terms of the wheat grown, 110 units of fertilizer were used per annum, and barely 190 units were used per annum. Teagasc carries out the yearly monitoring of soil pH for this site, and lime is applied when pH is out of balance. The rest of the practices and management are carried out locally, with no external party involvement. While this information was available for Site 1, Site 2 only disclosed the use of inorganic fertilizer and the types of arable crops grown at the site.
The agricultural sites underwent standard arable practices, including ploughing, harvesting, tilling, sowing, irrigation, and cultivation. Both Sites 1 and 2 have loam soil with a homogenous metamorphic bedrock derived from shale-type sedimentary rock known as slate. Site 3 was in a remote area in the Wicklow mountains, in a protected habitat, making anthropogenic interaction and activity as low as possible. Fauna such as red deer (Cervus elaphus), hare (Lepus timidus hibernicus), and a variety of birds were prevalent. While there was no agricultural activity at the site, sheep were also observed in the area.
2.2. Monitoring
The passive samplers chosen for ambient NH3 monitoring were the CEH ALPHA® (Adapted Low-cost Passive High Absorption) (UK Centre for Ecology & Hydrology, Oxfordshire, UK) samplers. At Sites 1 and 2, metal rods were driven into the ground and the sampler housing units (SHUs) were attached at a minimum of 1.5 m from the ground. The SHUs contained three ALPHA (Adapted Low-cost Passive High Absorption) samplers each, attached using Velcro. At Site 3, a research platform has been erected in order to minimize interaction with natural flora and fauna, and the housing units containing the ALPHA samplers were attached to posts on this platform, facing away from the platforms and towards the peat.
Similarly, for the active sampling of NH
3 and the sampling of SIA, CEH DELTA
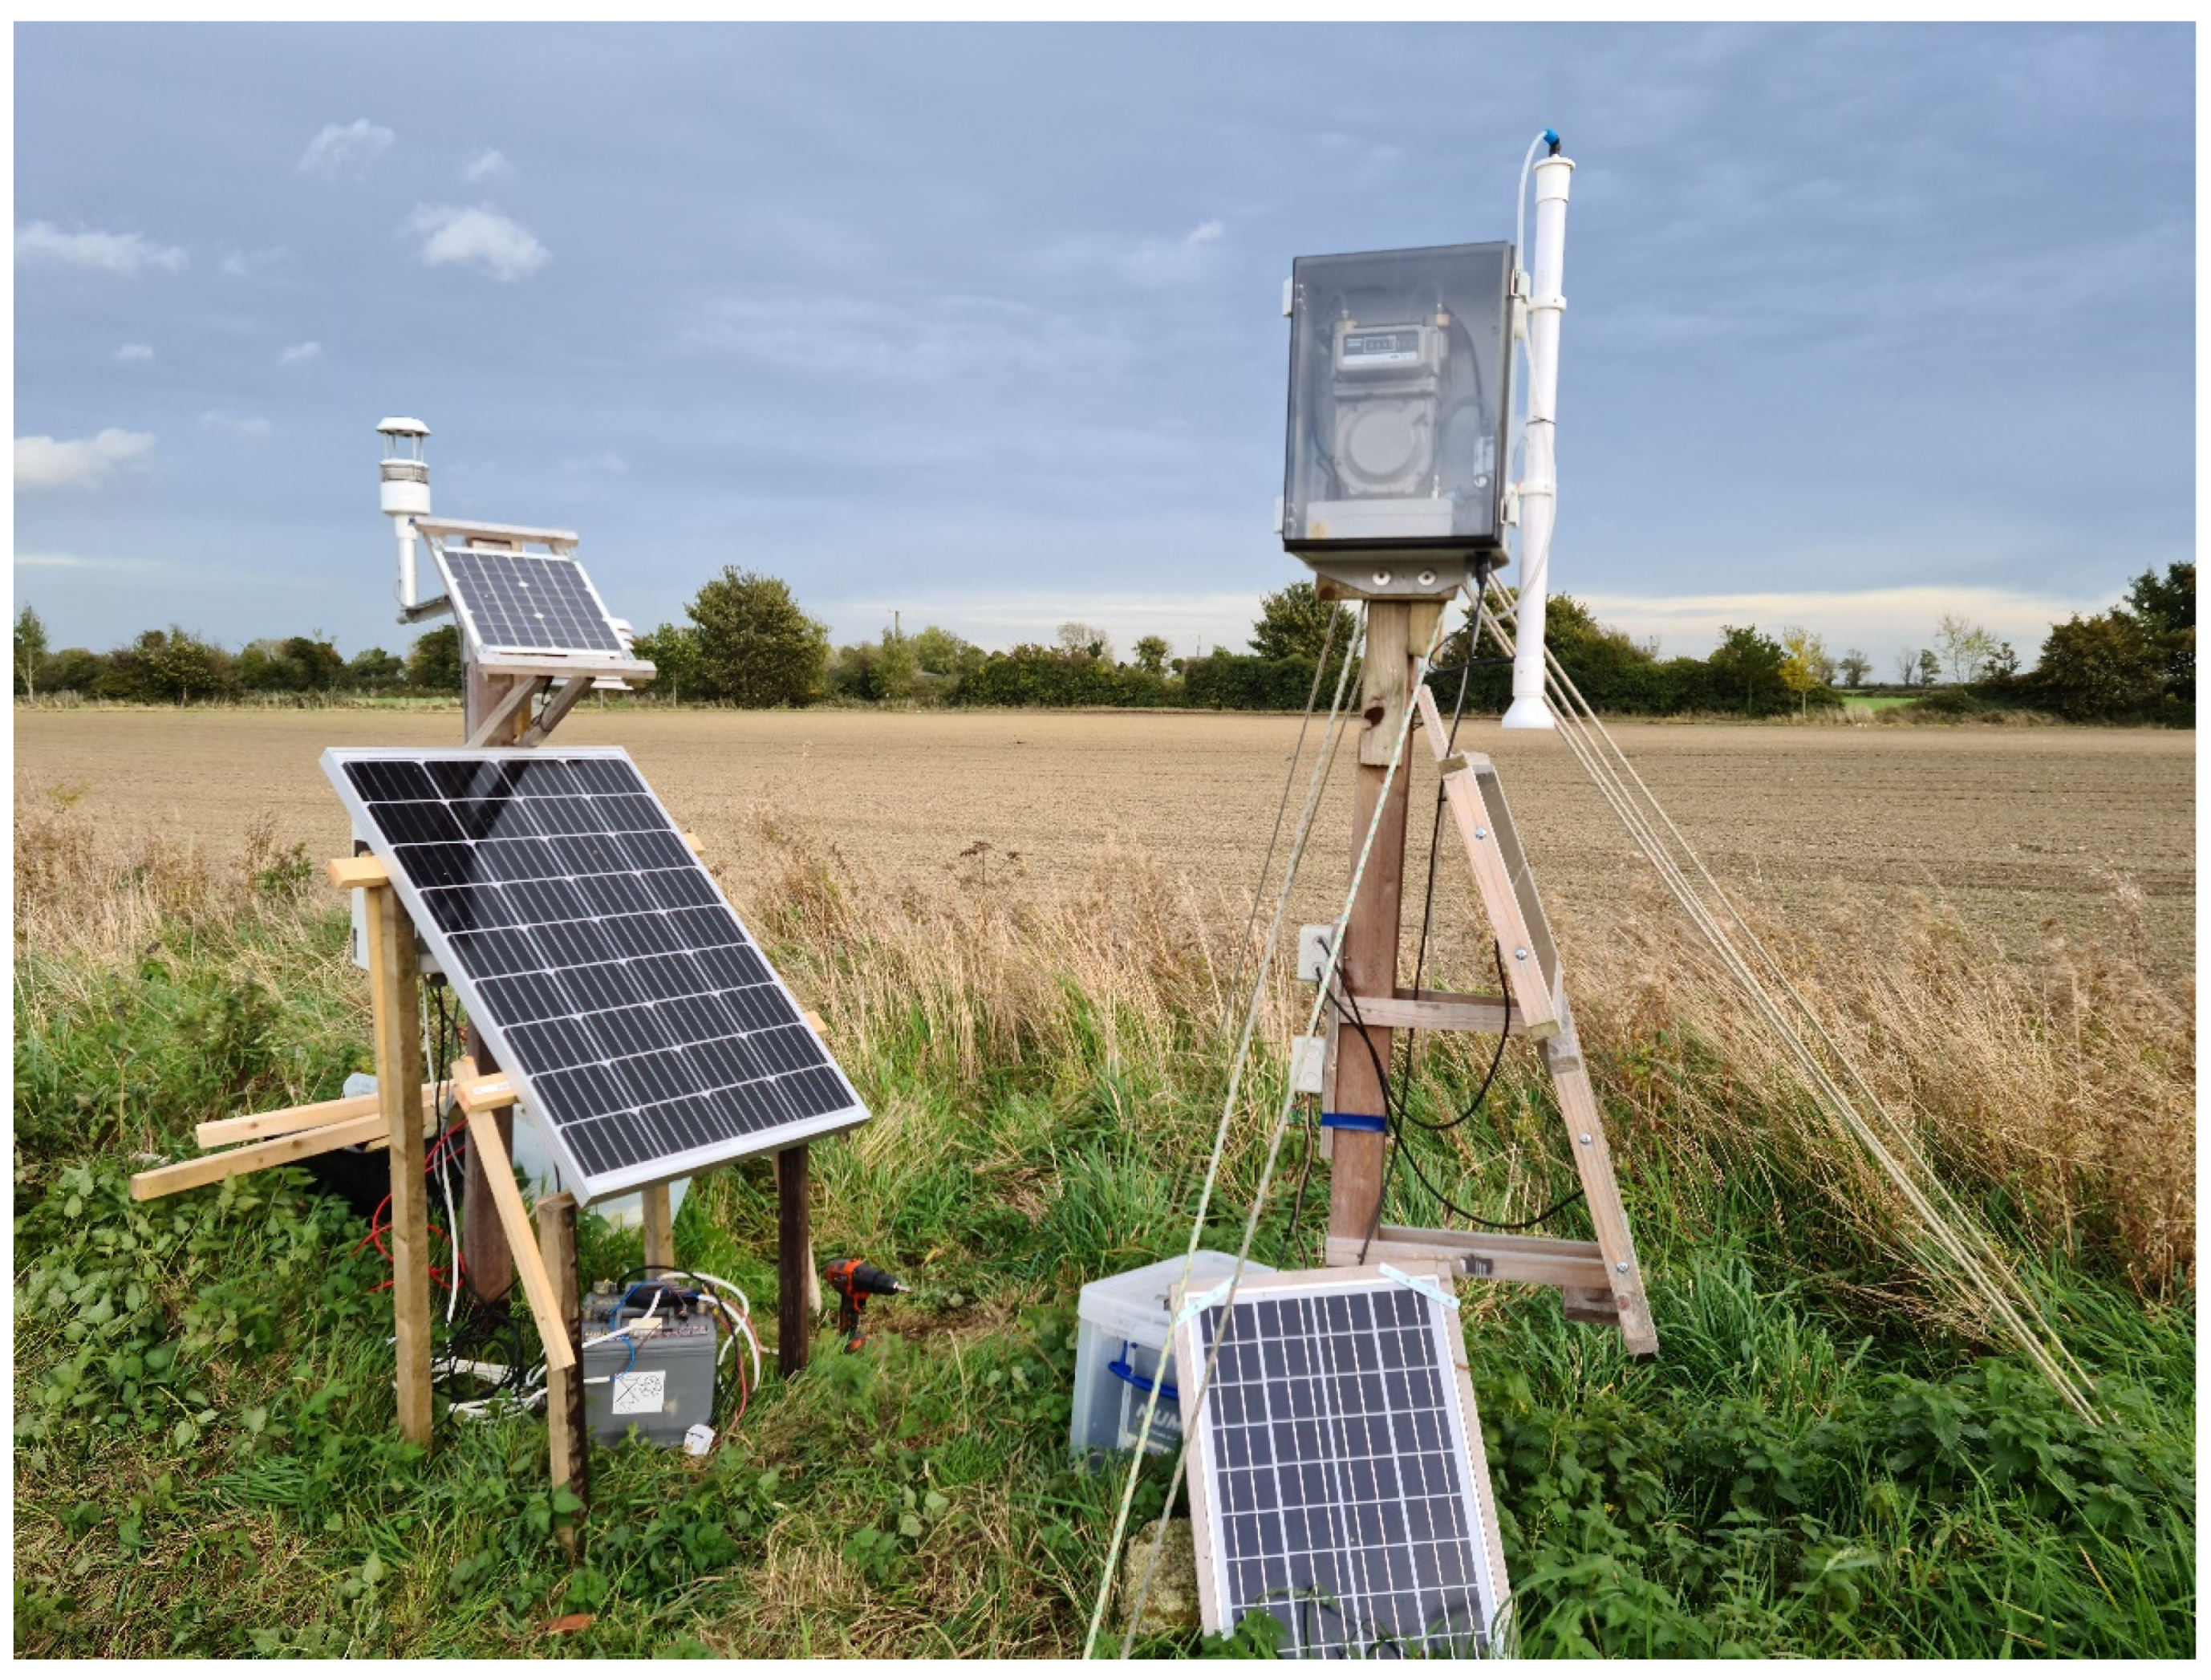
® II (DEnuder for Long-Term Atmospheric) (UK Centre for Ecology & Hydrology, Oxfordshire, UK) samplers were chosen. These samplers required electricity to run. Therefore, a sustainable power station was built on Site 1 to facilitate a DELTA II sampler. Environmental factors such as air and soil temperature, and precipitation, which affect these emissions and consequent aerosol formation, were also monitored to determine the capacity of the effect. Additionally, a MetOne weather station was also set up at Site 1, measuring temperature, relative humidity (RH), wind direction (WD), wind speed (WS), and barometric pressure (BP) (
Figure 1). HOBOware© v3.7.2 rain gauges and additional temperature probes were also set up at Sites 1 and 2, which were run using software designed for HOBOware© (HOBO, Bourne, MA, USA).
2.3. ALPHA and DELTA II Sampler Preparation
All samplers were prepared in the Environmental Sustainability and Health Institute (ESHI) laboratories. ALPHA samplers were taken to the site approximately every 30 days (site accessibility and weather conditions introduced slight variations, especially at Site 3 due to the location of the site). DELTA II samplers were taken to the site approximately every 21 days. In addition to variations stemming from site accessibility and weather, the power supply to the power station operating the DELTA II sampler introduced another potential variability to the data obtained. Any variations in exposure times introduced by these variables were accounted for during analysis, as well as during the calculations carried out to determine atmospheric concentrations of NH3 and SIA. Monitoring with ALPHA samplers was carried out from November 2020 to January 2022 for Sites 1 and 2, and from March 2021 to March 2022 for Site 3. DELTA II sampler monitoring was carried out from February 2021 to January 2022. All samplers were prepared according to the standard protocols set forth by the UK Center for Ecology and Hydrology.
The samplers were transported to and from sites in sealed bags, inside sealed containers, and refrigerated (at 4 °C). For quality control and validation purposes, travel and laboratory blanks were also prepared with each cycle of samplers for both ALPHA and DELTA II samplers. Each ALPHA SHU contained three samplers, one of which was a field blank. For DELTA II samplers, each sampling cycle contained two glass denuders, connected in parallel for sampling, and a filter sample containing SIA samples. Any arable agricultural activity which had the potential to affect NH3 and SIA sampling was noted while on site; however, all sites were remote, therefore, these observations were restricted to site visits during sampler switches. The previous month’s samplers were returned to the laboratory for extraction and analysis with each switch.
2.4. Ion Chromatography Analysis of Atmospheric NH3 and NH4+ SIA Concentrations
All samples were analyzed using ion chromatography. The ion chromatography system used was a Dionex™ Aquion™ system, equipped with a Dionex™ CERS™ 500 suppressor (ThermoFisher Scientific, Hertfordshire, UK). The eluent for the mobile phase used during the analysis was 30 mM Methanesulfonic acid (MSA), prepared from Dionex™ MSA (0.4 M). The eluent was filtered using a 0.45 µm filter and degassed prior to use. All samples were prepared with ultra-pure water (UPW) and filtered prior to analysis, using a 0.22 µm PES syringe filter. The standard used for analysis was Dionex™ Six Cation Standard II (ThermoFisher Scientific, Hertfordshire, UK). Standards were prepared ranging from 0.02 ppm to 8 ppm ammonium (NH4+). The stationary phase used was an IonPac CS16 column (with a CG16 guard column to ensure column performance), which consisted of a unique hydrophilic macroporous polymeric substrate made up of ethylvinylbenzene crosslinked with divinylbenzene, facilitating carboxylate functionalized cation exchange (ThermoFisher Scientific, Hertfordshire, UK). When compared to the IonPac CS12 column (used with its equivalent guard column) at low NH4+ concentrations, the CS16 achieved baseline separation between the sodium (Na+) and NH4+ ions, whereas the CS12 could not provide sufficient separation between the two ions. The run time of each sample was 30 min, with a subsequent UPW run after each standard and sample to flush the column and ensure no carry-over between samples and/or standards.
2.5. Calculation of Air Concentrations
The atmospheric concentrations of NH
3 and NH
4+ SIA were calculated from the results obtained during the analysis of samples. The quantity of NH
3 collected on a filter of the ALPHA sampler is given as follows:
where
Q is the quantity of NH
3,
ce is the concentration of filter extract of exposed filter (µg/mL),
cb is the concentration of filter extract of field blank filter (µg/mL), and
v is the total volume of extract (mL).
The ambient atmospheric concentration of NH
3 in μg/m
3 is given as:
where
V is the effective volume of air sampled for a passive sampler; this is calculated using the following equation:
where
D is the diffusion coefficient of NH
3 in air,
A is the cross-sectional area of the sampler,
t is the sampling duration, and
L is the length of the sampler. The value of
D at 10 °C was taken as 2.09 × 10
−5 m
2 s
−1 [
13].
In the case of the DELTA II denuder system, the amount of trace gas (in this case NH
3) collected on a denuder is determined following the same calculation method shown above for the ALPHA sampler, with the only difference that the effective volume of air sampled is taken from the flow meter reading directly, located on the instrument. Using two glass denuders connected in series also allows for the determination of the system’s capture efficiency, through allowing for a comparison of the amount of NH
3 captured by both denuders [
13]. An infinite series correction factor is then applied to account for any NH
3 not adsorbed by the glass denuders, based on this capture efficiency. The corrected air concentration (C
a (corrected NH3)) is determined as follows:
Data analysis was carried out on all data obtained (GraphPad Prism, San Diego, CA, USA). The data were tested for normality (Shapiro–Wilk test) and homoscedasticity (F-test). Depending on the p-value obtained, if p < 0.05, student’s t-test for paired or independent samples was applied. If p > 0.05, a Mann–Whitney test (independent samples) or Wilcoxon test (paired samples) were applied.
2.6. Imaging of Particulate Matter
A filter from each season was imaged using an Olympus CX23 binocular brightfield microscope (Mason Technology, Dublin, Ireland), with an ISH500 camera (Tucsen Photonics Co., Ltd., Fuzhou, China) attachment. The images were analyzed using ImageJ (an image analysis software produced by the National Institutes of Health and the Laboratory for Optical Computational Instrumentation at the University of Wisconsin, Madison, Wisconsin, USA). The diameter of the particles and the particle population density (PPD) were calculated using their surface area measurement.
3. Results
The average concentration of NH
3 measured during the monitoring period was 1.49 μg m
−3 using ALPHA samplers (
Table 1). The average values over the monitoring period for individual sites ranged from 0.52 μg m
−3 at Site 3 to 1.70 μg m
−3 at Site 2, with an average concentration of 1.45 μg m
−3 for the two active sites between November 2020 and January 2022.
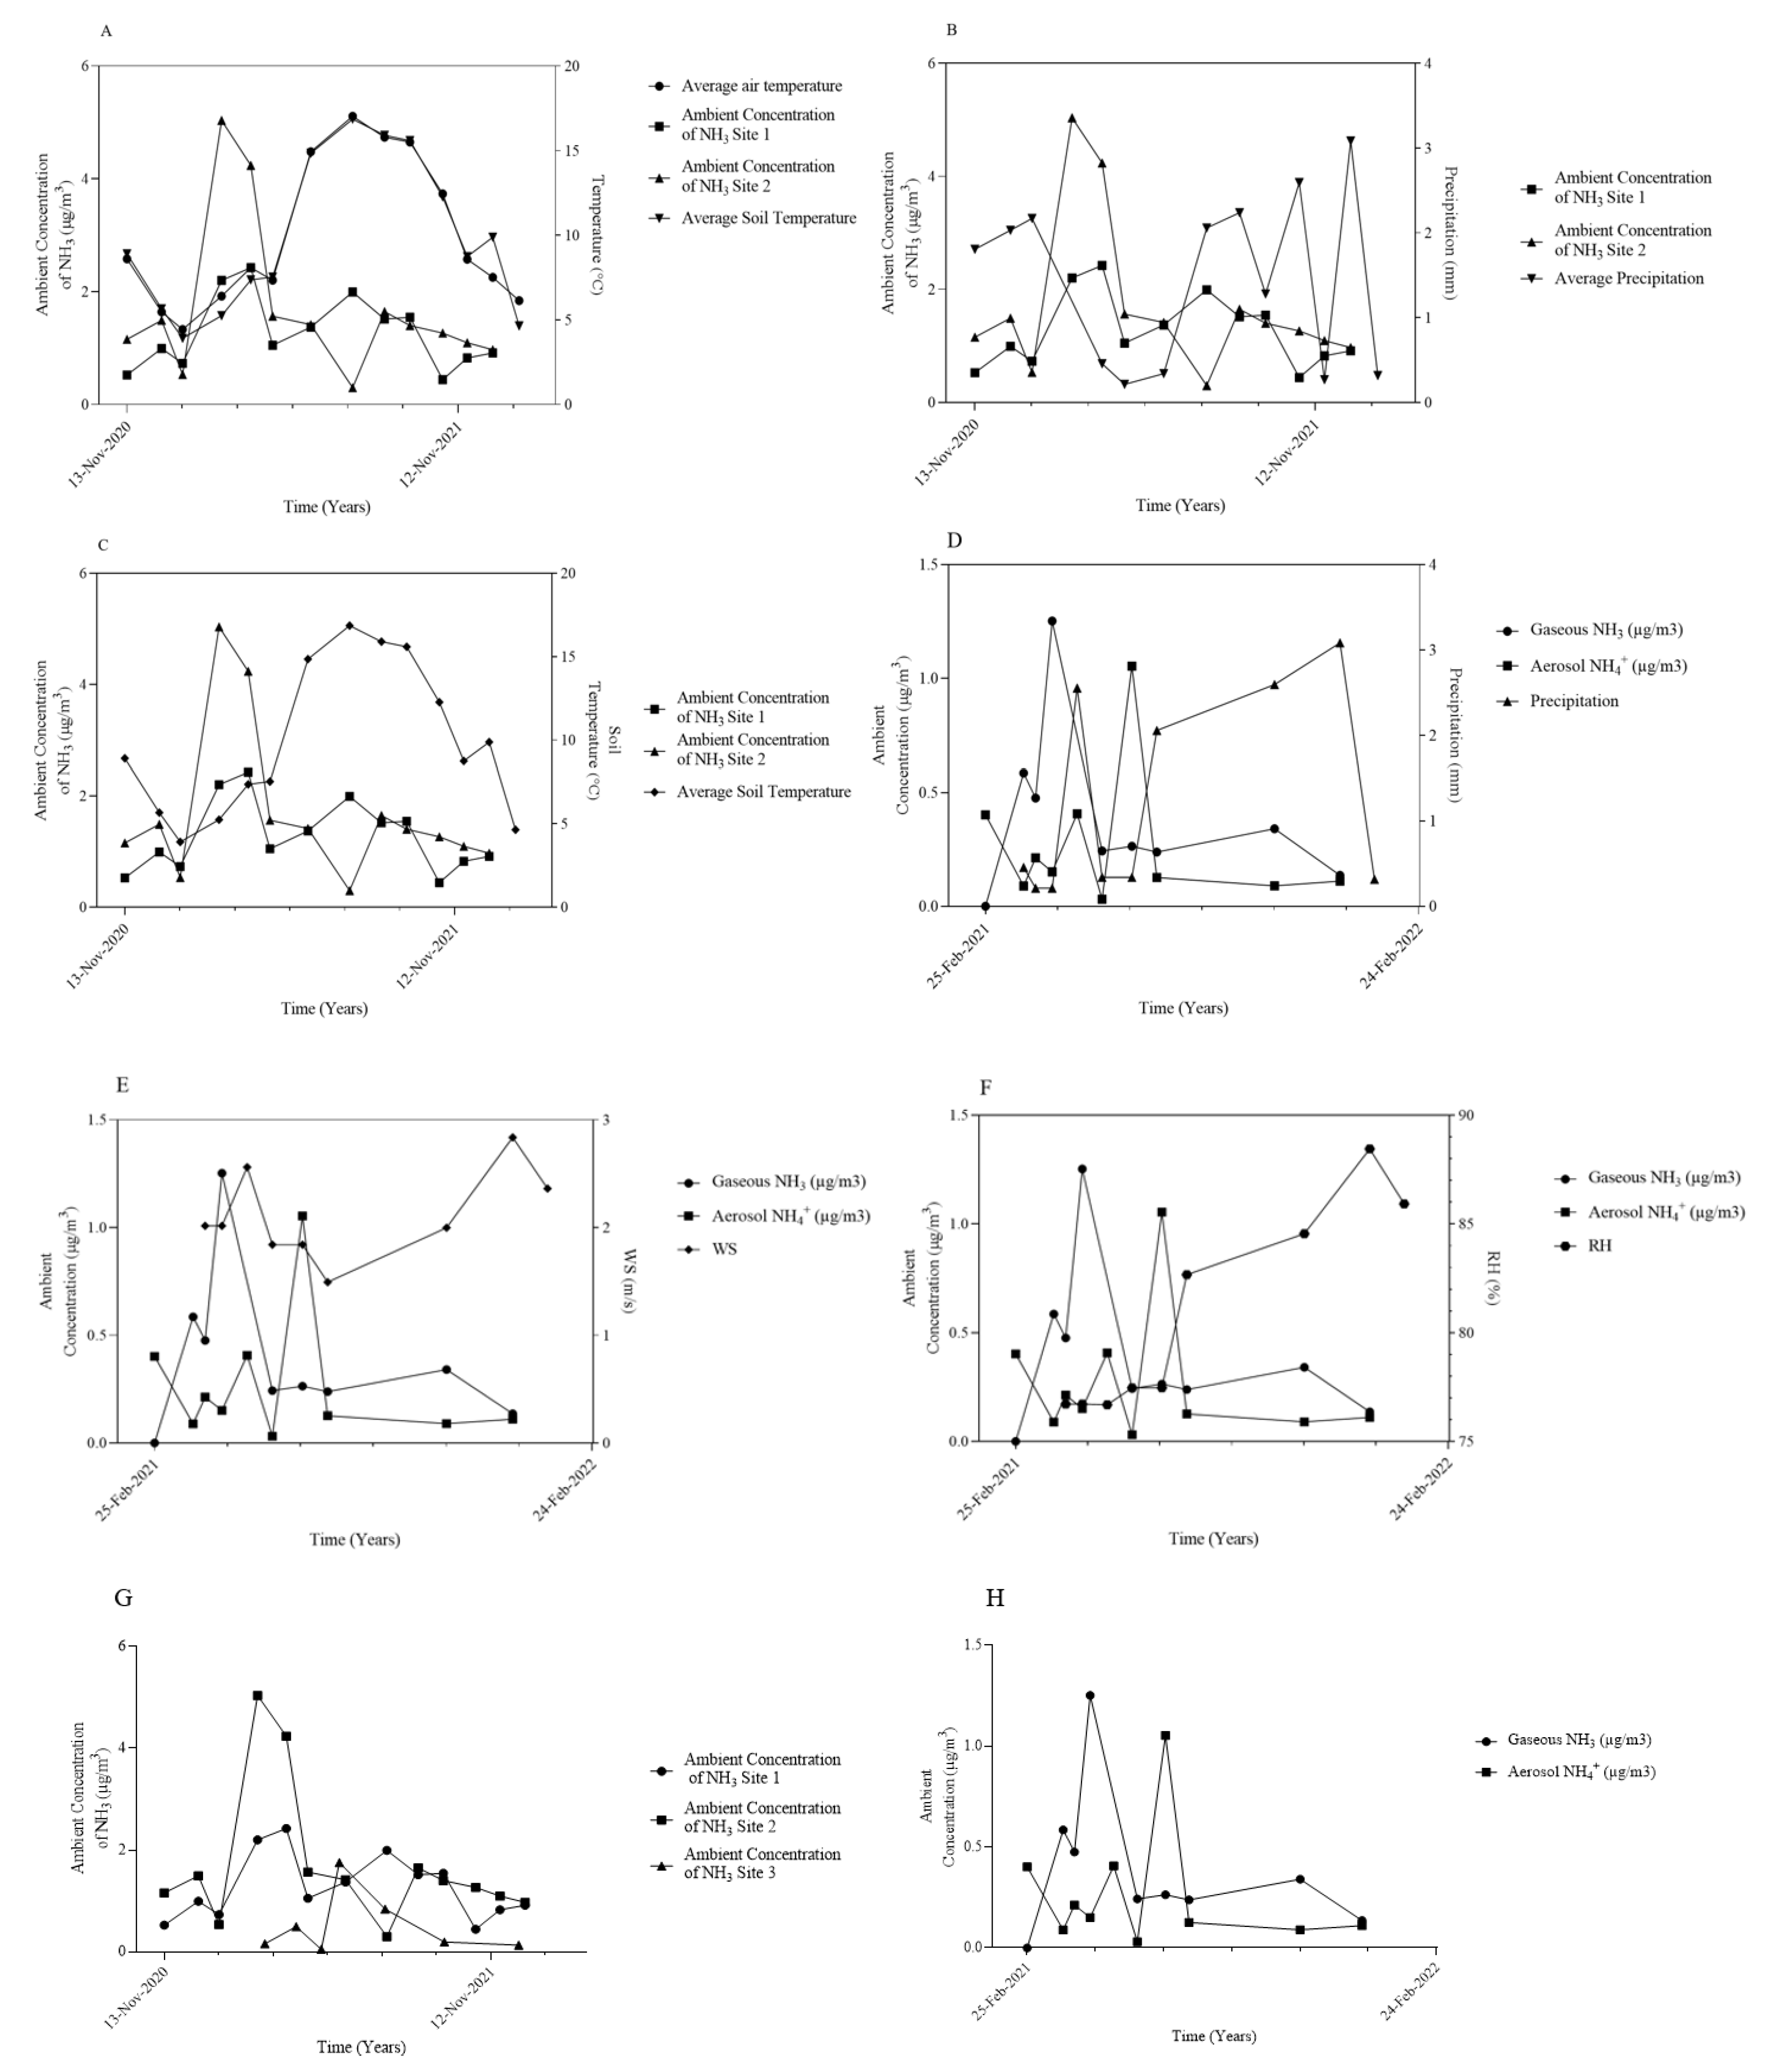
The maximum concentration, measured at 5.04 μg/m
3, was recorded at Site 2 during the period of February–March 2021 (
Figure 2G). Concentrations were highly variable between sites, with the greatest 4-week exposure range obtained in the February–March period of 2021 at Site 2. A 2-sample
t-test (n = 24) was also carried out in order to determine if there is a site-specific concentration difference between the active sites. The data analysis of the agricultural sites showed no significant effect of location on atmospheric NH
3 concentrations [t = 1.026, df = 24].
The average concentrations measured during the monitoring period were 0.39 μg m
−3 and 0.27 μg m
−3 gaseous ambient atmospheric NH
3 and aerosol NH
4+, respectively, using DELTA II samplers (
Table 2). The maximum concentrations measured for gaseous NH
3 were 1.25 μg m
−3, recorded during the period of April–May 2021, and 1.05 μg m
−3 aerosol NH
4+, recorded during the period of June–July 2021 (
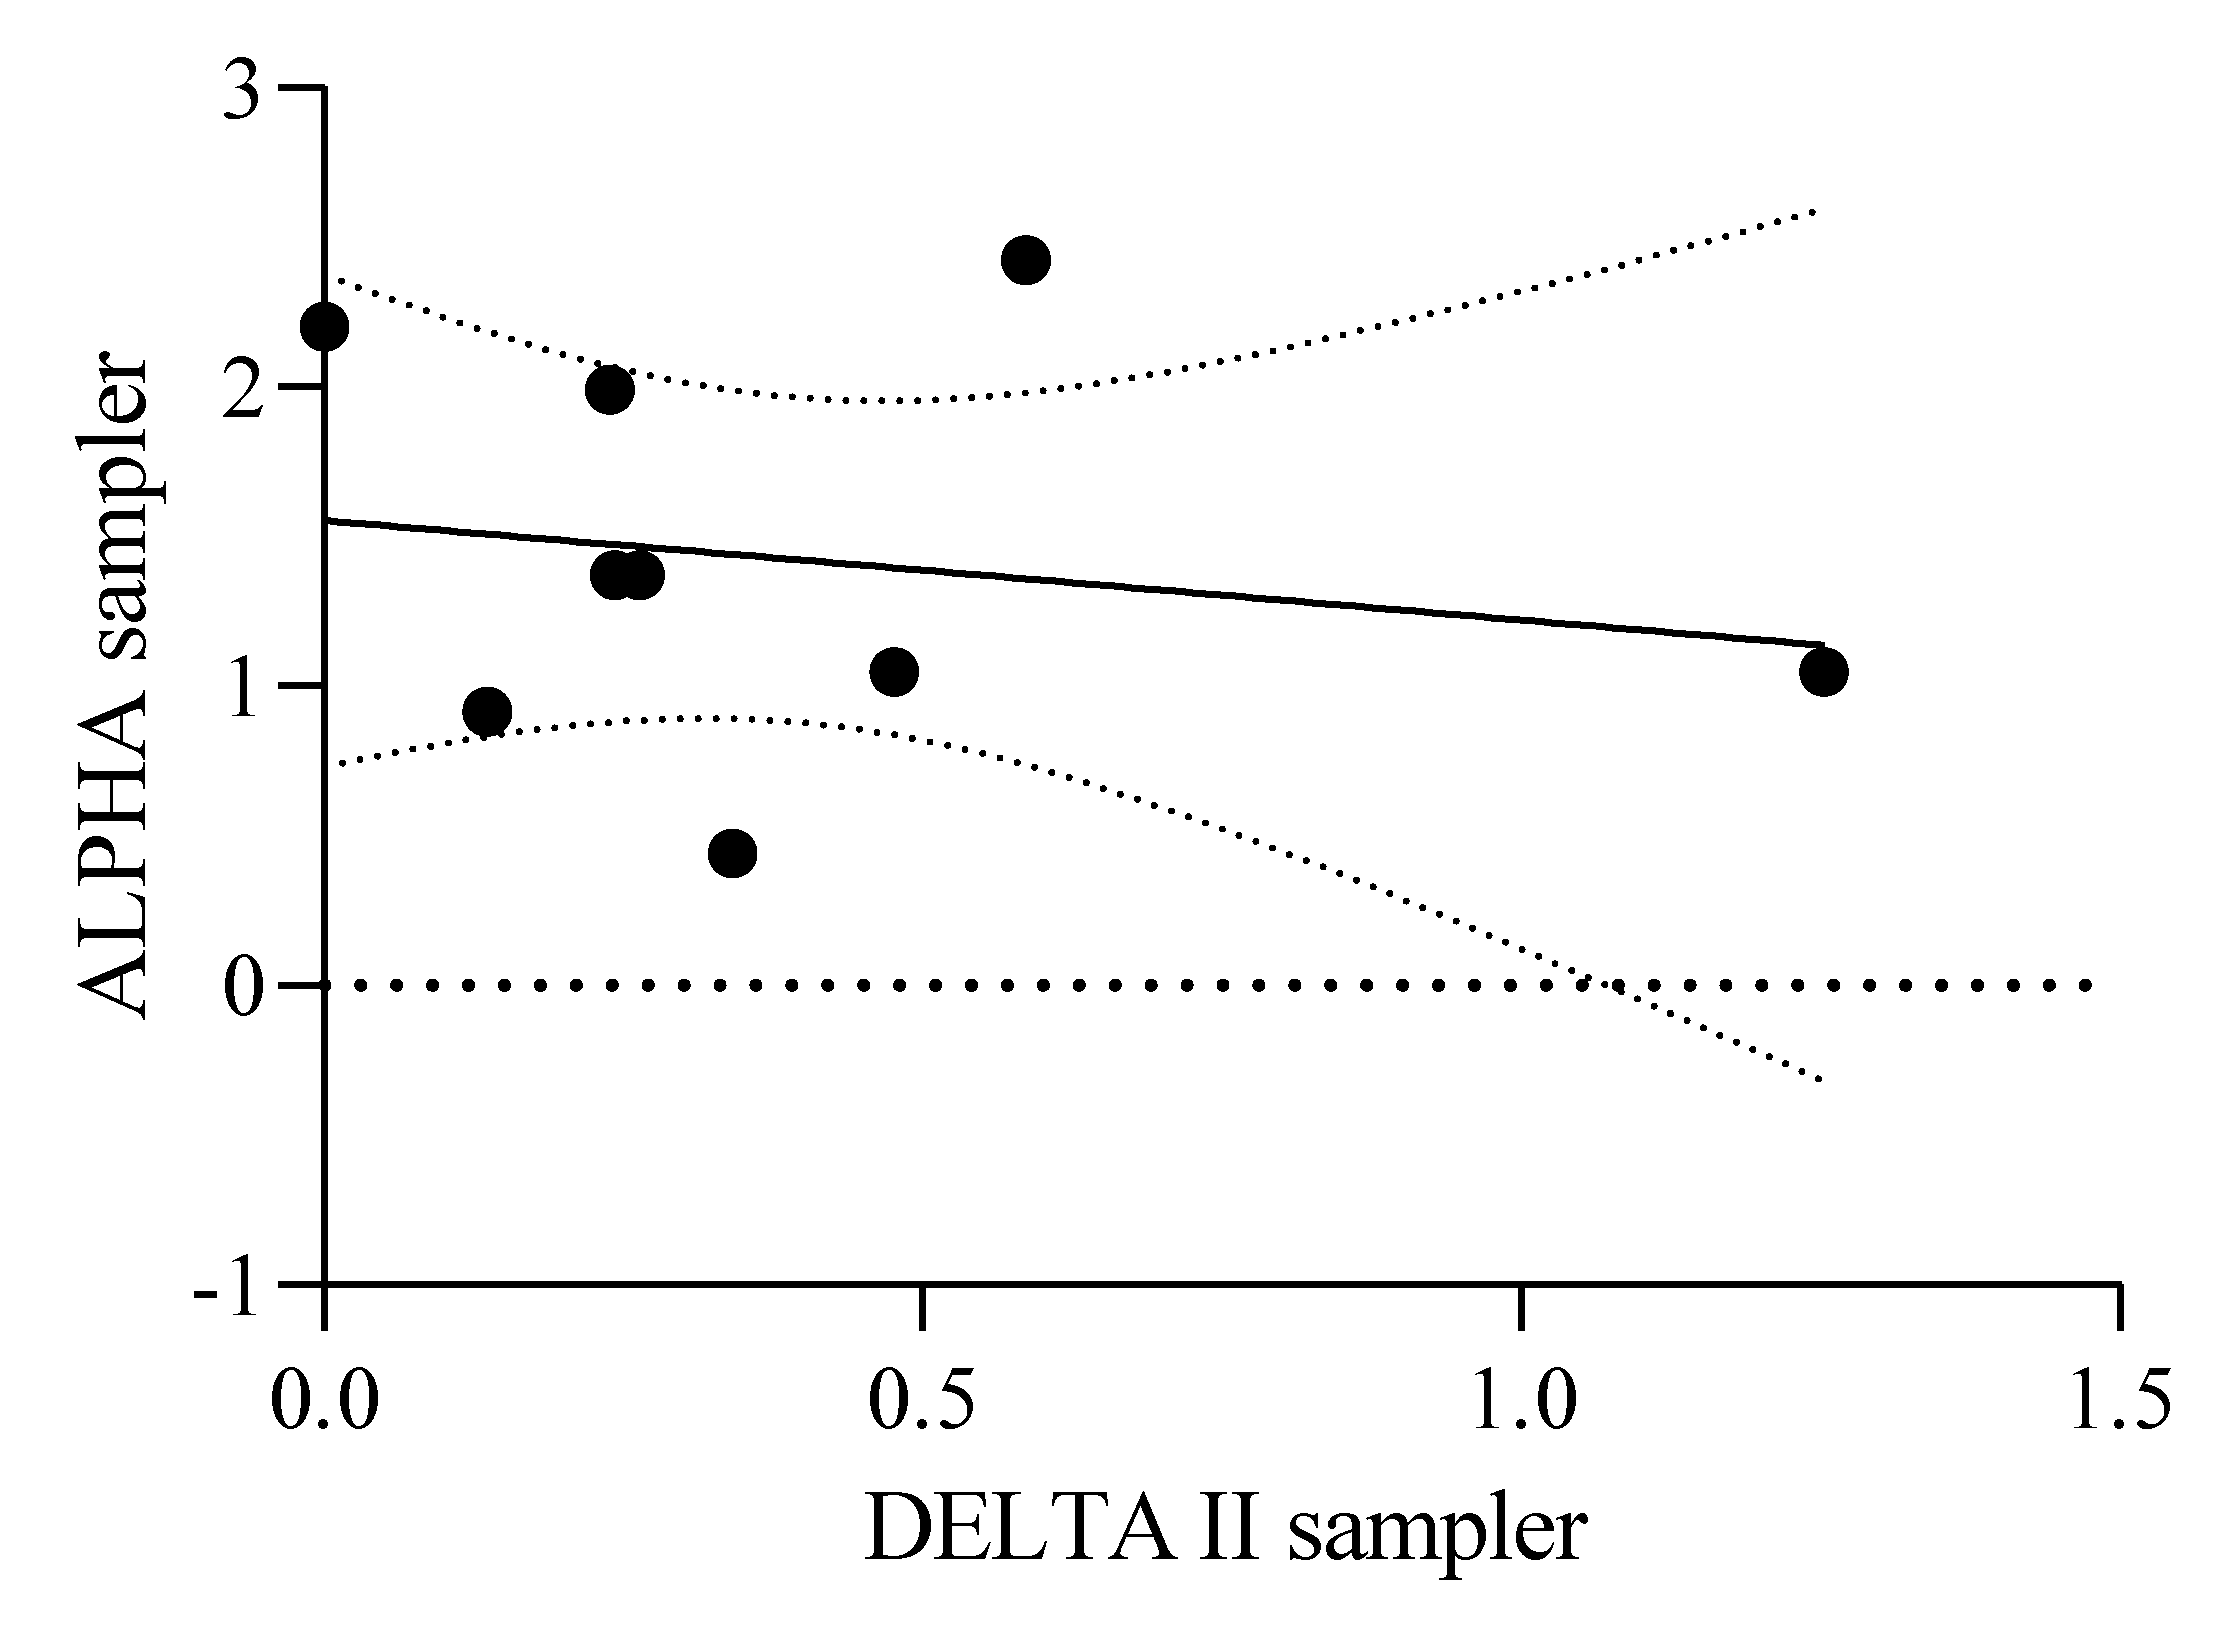
Figure 2H). The concentrations of gaseous NH
3 measured using the ALPHA samplers were higher compared to concentrations measured by DELTA II sampler (
Figure 3).
3.1. Temporal Variation in Gaseous NH3 and Aerosol NH4+ Concentrations
Temporal variations were observed in the concentration of NH
3 and aerosol NH
4+ during the monitoring period of November 2020–January 2022. The greatest relative variance of NH
3 for an individual site was obtained for Site 2. Factors such as agricultural activities and weather patterns during the year are the two potential main drivers for variation between sites, as well as concentrations observed. This is shown in
Figure 2G.
The highest recorded concentrations observed in early spring would be indicative of the first fertilizer application, while the second highest concentration occurring in late autumn would indicate a second application of fertilizer, one with potentially lower N content based on the data obtained. Temperature shows a potential effect on atmospheric NH
3 and, consequently, aerosol NH
4+ concentrations. When temperature begins to rise, atmospheric NH
3 concentrations also increase (
Figure 2A).
RH has the potential to increase aerosol NH
4+ concentration, indicating a link between aerosol concentrations and RH (
Figure 2F). Peaks in concentrations of atmospheric aerosol NH
4+ measured are concurrent with increases in RH and high atmospheric concentrations (compared to baseline) of gaseous NH
3 at Site 1. Wind speed had an inversely proportional relationship with both atmospheric NH
3 and aerosol NH
4+ concentrations (
Figure 2E). As wind speeds increased, concentrations of both NH
3 and aerosol NH
4+ decreased.
Soil temperature plays a principal role in NH3 emissions to the atmosphere from fertilizer as increasing temperatures soil moisture is reduced and the soil’s surface dries. Similarly, air temperature, soil temperature, and ambient atmospheric NH3 concentrations have a potential effect. This is due to increased emission rates occurring when soil temperature increases due to increased rates of NH3 volatilization.
Precipitation tends to reduce NH
3 emissions, as it reduces the influence and absolute values of the drivers listed above, hence increasing precipitation is associated with decreasing atmospheric NH
3 and aerosol concentrations (
Figure 2B,D). This is due to precipitation being a deposition pathway, reducing atmospheric concentrations of NH
3 and aerosols.
3.2. Imaging and Size Distribution of Aerosols
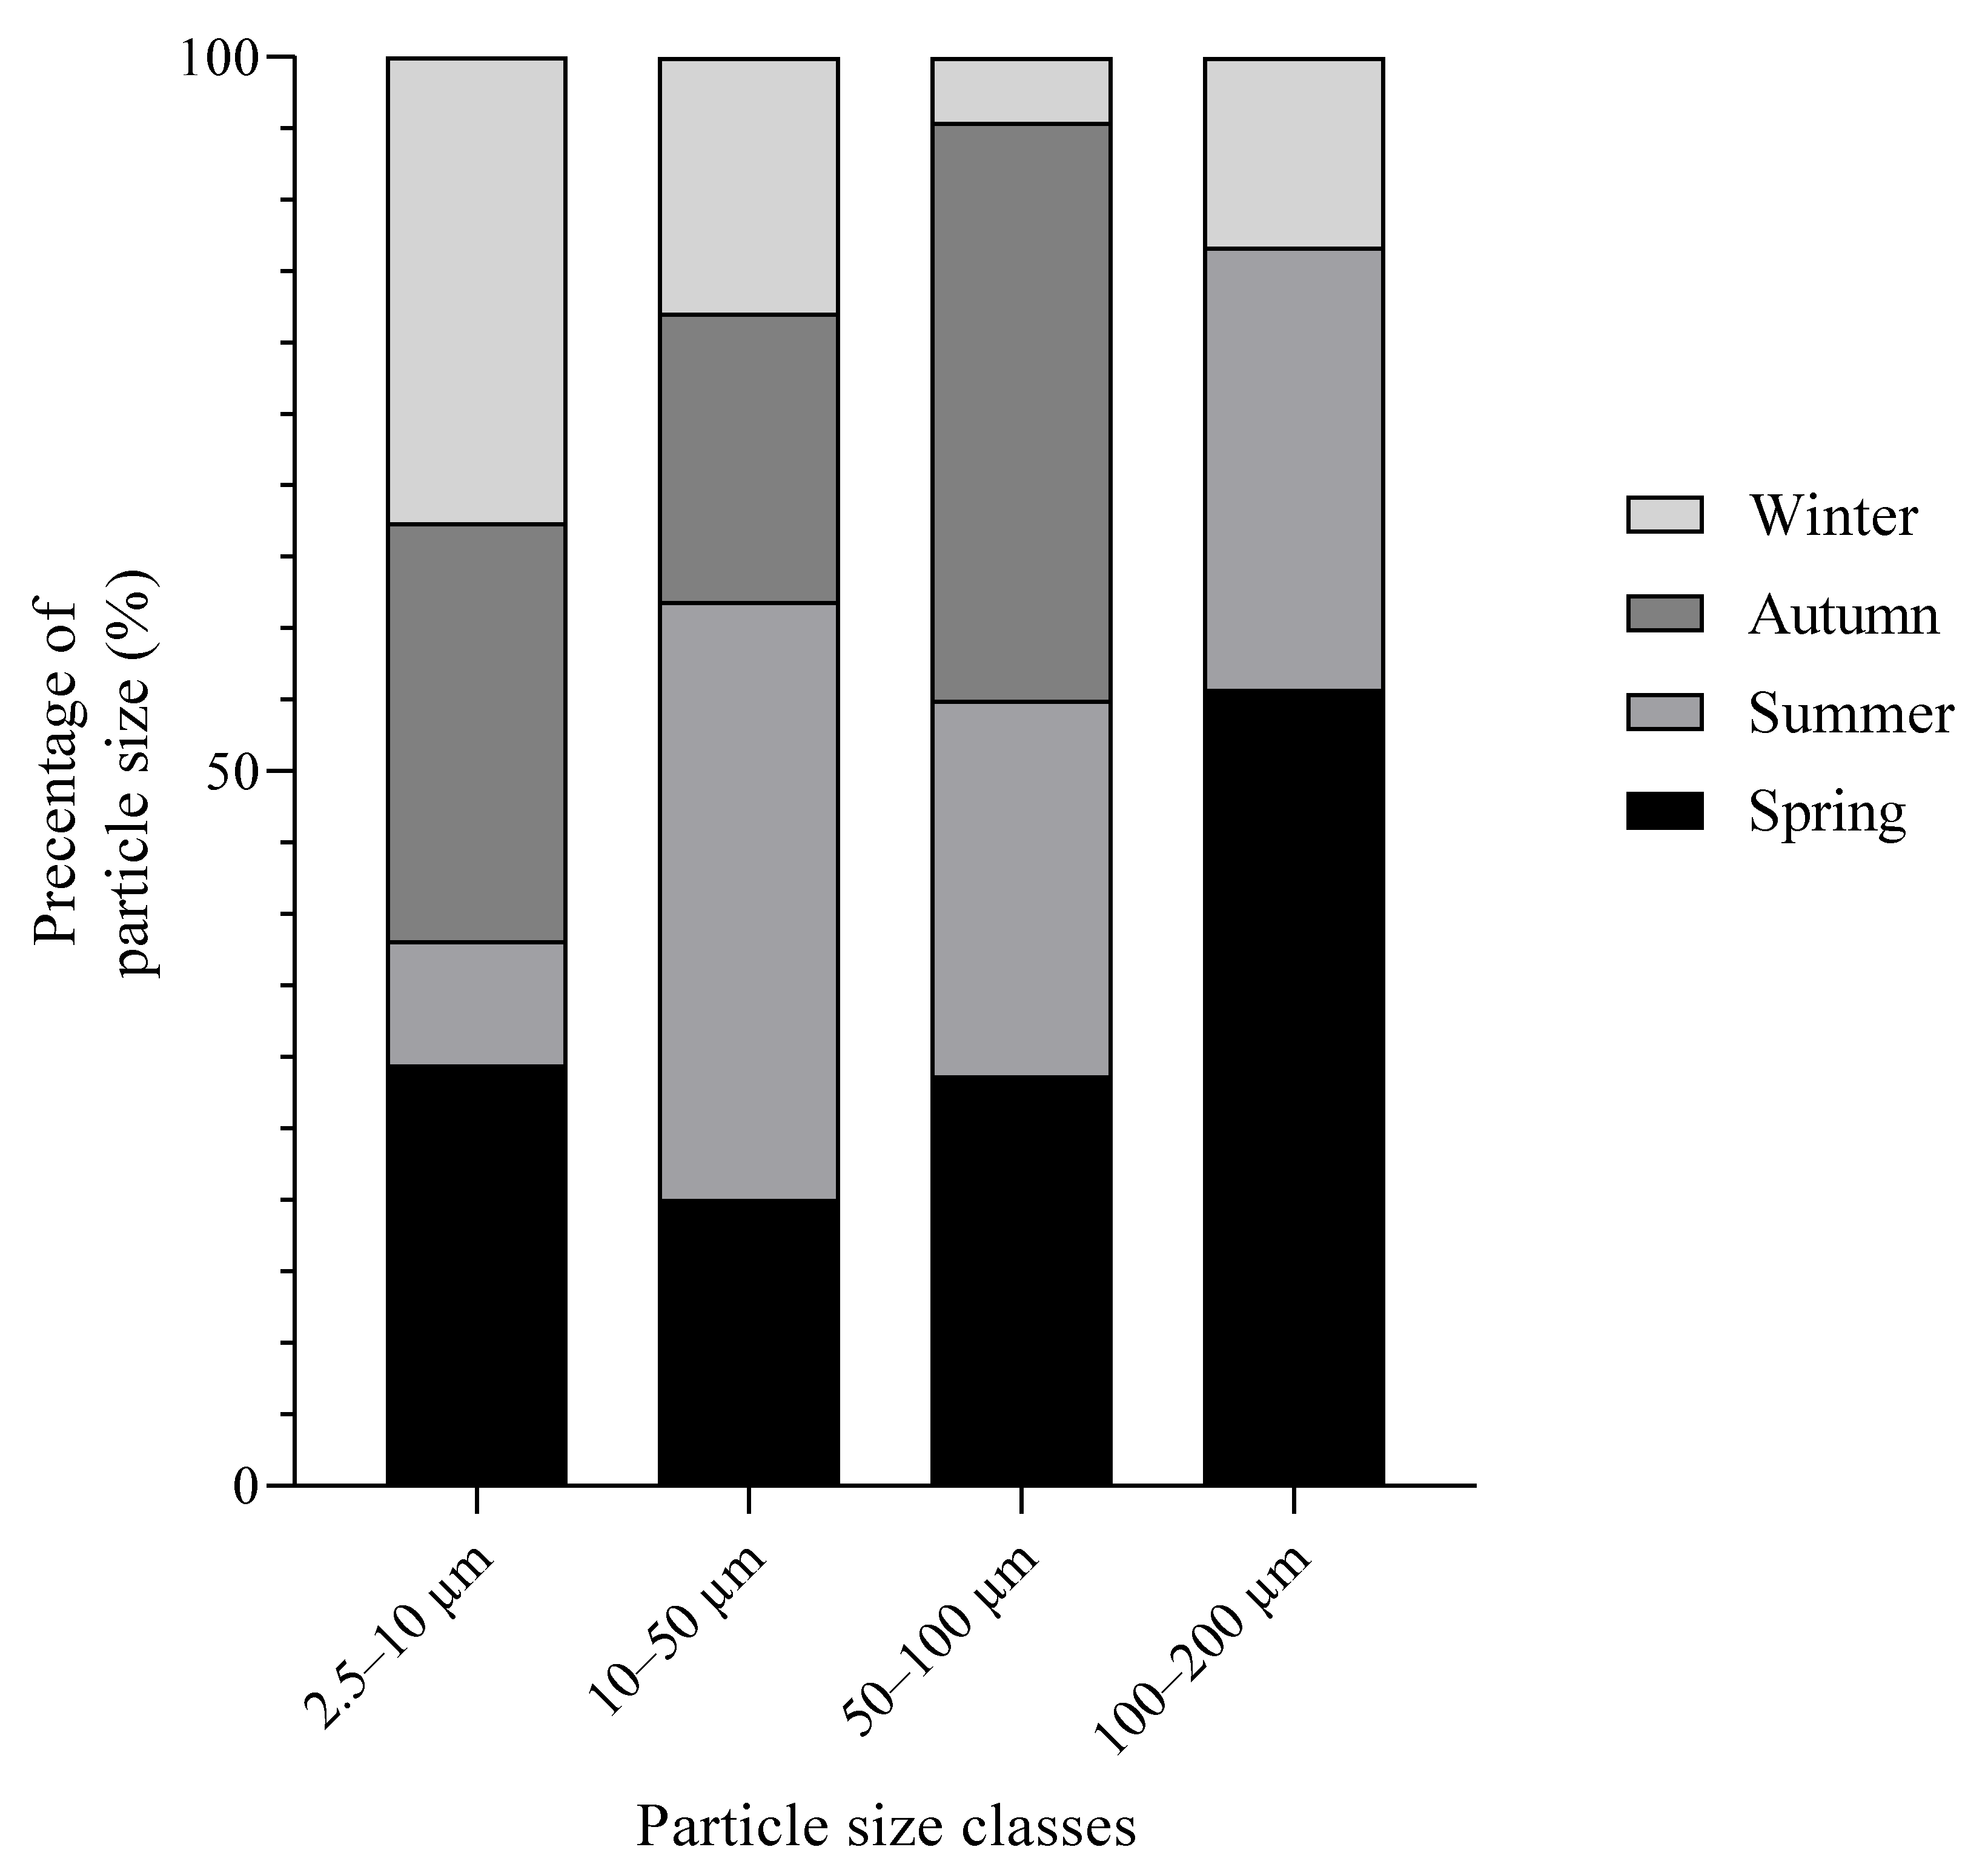
A filter from each season (winter, spring, summer, autumn) during the monitoring period of November 2020–January 2022 was imaged. Size distribution analysis was performed to determine the size distribution of aerosols representative of each season (
Figure 4). The PPD and average particle size for each season were also determined (
Table 3).
The particles collected by the filters were predominantly in the total suspended particulate matter (TSP) size fractions. Generally, particles were observed to fall within the 2.5–10 μm size fraction, with the exception of summer, when particles were predominantly in the 10–50 μm size fraction. Particulate matter in the size fraction 2.5–10 accounted for 68%, 56%, 17%, and 58% of total particles sampled in winter, spring, summer, and autumn, respectively. The highest PPD was obtained during winter with 1.351 particle mm−2, while the lowest PPD was obtained during summer with 0.587 particles mm−2.
4. Discussion
The main emission source for atmospheric NH
3 and aerosol NH
4+ at Site 1 and 2 was identified as agricultural practices, such as the application of fertilizer, coupled with management practices, with minor contributions attributed to emissions from transport and natural sources. Two samplers were deployed to measure the atmospheric NH
3 and aerosol NH
4+. The concentrations for gaseous NH
3 reported using the ALPHA samplers were generally higher compared to those of the DELTA II sampler (
Figure 2G,H and
Figure 3). One potential cause for differences in the obtained NH
3 concentrations could be the difference in the exposure periods of the two samplers. While the ALPHA samplers were generally collected on a 4-weekly basis, the DELTA II samplers were only exposed for a maximum of 3 weeks at a time (
Figure 3).
Another possible factor which may cause the differences observed could potentially be due to the uptake rate of the DELTA II sampler. The DELTA II sampler was set up with a flow rate of 0.2 dm3 min−1, as the sampler was directly at an emission source. This could have potentially affected the sample loading onto the denuders and resulted in the variations observed in the data. A comparison of ALPHA passive and DELTA II active sampling methods yielded an R2 value of 0.3, which shows that the correlation between the two sampling methods is moderate.
The average values for atmospheric NH
3 over the monitoring period for individual sites ranged from 0.52 μg m
−3 at Site 3 to 1.70 μg m
−3 at Site 2, with an average concentration of 1.49 μg m
−3 for the two agricultural sites between November 2020 and January 2022 (
Figure 2G). Atmospheric NH
3 emissions are known to contribute to secondary aerosol NH
4+ formation; therefore, the monitoring and analysis of NH
3 components within atmospheric aerosol NH
4+ were also carried out during the monitoring period [
7,
9]. The average atmospheric NH
4+ in aerosol concentration was 0.27 μg m
−3 during the monitoring period, with the particle size predominantly in the 2.5–10 μm range (
Figure 2 and
Figure 4).
The highest PPD filter collected during the monitoring period was collected during winter with 1.351 particle mm−2, while the lowest PPD was obtained during summer with 0.587 particles mm−2. PPD therefore was approximately twice as high for samples collected during winter, as opposed to those collected during the summer season for these filters. This could be indicative of PM from domestic sources, such as heating. During winter, domestic heating increases, which leads to increased levels of primary PM emissions to the atmosphere and, therefore, higher PPD values on filters during winter. Another potential cause for this is due to the lack of cover crops during winter, giving rise to the increased erosion of soil.
4.1. Temporal Variation in Gaseous NH3 and Aerosol NH4+ Concentrations
The average values for atmospheric NH
3 over the monitoring period for individual sites ranged from 0.52 μg m
−3 at Site 3 to 1.70 μg m
−3 at Site 2, with an average concentration of 1.49 μg m
−3 for the two active sites between November 2020 and January 2022. The maximum concentration measured 5.04 μg m
−3 and was recorded at Site 2 during the period of February–March 2021. This is in approximate agreement with the previous two sampling campaigns carried out in Ireland, where the average concentrations detected were 1.45 μg m
−3 during the Ammonia1 study [
14] and 1.72 μg m
−3 during the Ammonia2 study [
7]. The main emission source for atmospheric NH
3 was identified as agricultural practices, such as the application of fertilizer, with minor contributions attributed to emissions from transport. Similarly to the Ammonia2 study, while there were temporal variations observed in the data, the trends were weak, and the seasonal variation of NH
3 concentrations was not significant at a
p < 0.05 level [
7]. The temporal atmospheric NH
3 concentration trends observed throughout the study period are like the trends reported in 2007 in the United Kingdom, with a main peak observed in March, followed by a decrease in April. Atmospheric concentrations of NH
3 increase again in August, leading to a smaller peak in October [
15].
Both atmospheric NH3 and aerosol NH4+ were cross-examined with the localized environmental data collected during the monitoring period to determine if there are any meteorological factors which have potential effects on emissions. Atmospheric NH3 and aerosol NH4+ concentrations show a proportional relationship with air and soil temperature. Atmospheric concentrations of NH3 and aerosol NH4+ increase when air temperature remains stable, and concentrations decrease when temperatures increase. This indicates that air temperature instability can potentially result in reduced atmospheric NH4+ aerosol concentrations. One possible explanation for this is the relationship between RH and air temperature being inversely proportional (when air temperature increases, RH decreases).
In contrast, NH3 and aerosol NH4+ showed an inversely proportional relationship with precipitation. Both atmospheric NH3 and aerosol NH4+ concentrations decrease with increased precipitation (from August 2021 until January 2022). Precipitation is a form of wet deposition, a removal process of atmospheric gases and aerosols, hence the decrease in atmospheric NH3 and NH4+ seen during periods of elevated levels of precipitation. During the monitoring period, wind speed and RH were also measured. Wind speed had an inversely proportional relationship with both atmospheric NH3 and aerosol NH4+ concentrations. This is potentially due to increased off-site transport effects of both atmospheric NH3 and aerosol NH4+, resulting in a decrease in their respective concentrations at the site level. This indicates that increases in emission concentrations observed can be highly influenced at the source level.
Increasing RH can consequently increase aerosol NH
4+ concentration, indicating a direct link between aerosol concentrations and RH. Generally, PM mass concentrations and numbers increase significantly for RH values of 75% [
16]. Peaks in concentrations of atmospheric aerosol NH
4+ measured are concurrent with increases in RH and high atmospheric concentrations (compared to baseline) of gaseous NH
3 at Site 1.
4.2. Agricultural Practices and Management, and NH3 Dynamics
Combining these environmental factors and knowledge of agricultural practices allow for a more complete understanding of the fluctuations reported for atmospheric NH
3 concentrations at the study sites. The biggest influence, however, remains agricultural activities and management practices on both agricultural sites, especially when cross-examined with the control site (Site 3). The spreading of fertilizer and the timing of spreading, the type of fertilizer used, and the types of crops grown all affect atmospheric NH
3 emissions. One example of this is the difference in atmospheric concentrations measured at the active sites (
Figure 2G). While both sites use a synthetic inorganic fertilizer, only cereal crops (barley and wheat) are grown at Site 2, while at Site 1, cereal crops and legumes (beans) were grown in rotation during the study period.
Legumes are plants capable of forming symbiotic relationships with nitrogen-fixing bacteria, resulting in a symbiotic relationship between the plant and the bacteria, within which the atmospheric N converted to bioavailable NH
3 is available for the plant to use [
17]. Due to this self-sustaining system, less fertilizer is applied, thus reducing emissions, and potentially resulting in the differences seen between the two sites.
Another factor which may affect emissions and, therefore, potentially influence the atmospheric concentrations of NH
3 (and, consequently, aerosol NH
4+) is the timing of the fertilizer application. As the two sites are under different management practices, the timing of fertilizer application is not exactly the same. This is also indicated by the data collected during the study (
Figure 2H). During the monitoring period, two instances were identified where concentrations rose (“peak” concentrations). These increases in concentration coincide with general fertilizer-spreading practices in Ireland. Currently, chemical (inorganic) fertilizer has a banned period under which no fertilizer can be spread on the soil from the 15th of September until the 12th of January in County Dublin. It must be noted that while the ban lifts in January for the spreading of inorganic fertilizer, general practice dictates that fertilizer be applied to the soil during the drier weather in spring, as opposed to the wet weather still present in late winter in Ireland. This is also reflected in the data obtained throughout the monitoring period.
The highest concentration was recorded during spring, after the ban on the spreading of fertilizer was lifted for County Dublin. A second “peak” in atmospheric NH3 concentration can also be seen, when concentration levels increased in autumn, just before the fertilizer ban came back into effect for the county. The second increase in the levels of atmospheric NH3 detected during the monitoring period is lower than the one observed in the spring; however, one potential reason for this is due to the changing of the season bringing increased precipitation levels. This could affect the emission levels measured due to deposition effects, which merits further analysis in the future. It also increases NH3 transport throughout the biosphere, through leaching from the soil and run-off into the water sources (ponds) on site, reducing the amount of NH3 available for volatilization to the atmosphere. Therefore, the timing of fertilizer application could have key potential effects on emissions of NH3 to the atmosphere and, thus, the formation of aerosol NH4+, due to the availability of precursor gases (NH3).
4.3. Policy Implications
EU-wide initiatives have been directed at bringing about a reduction in nitrogen (N) emissions through legislative measures, such as the Gothenburg Protocol and the establishment of National Emission Ceilings (NECs). Existing permitted emission levels are required to be continuously assessed, and as emission inventories are compiled with the aid of newly surfacing scientific data, emission limits and ceilings are revised to accommodate these changes. The primary aim of these legislative measures has been to lessen acidification and eutrophication in natural and semi-natural ecosystems.
The NEC (Directive 2001/81/EC) established emission ceilings for pollutants such as NH3, which is classified as an eutrophying pollutant. Signatories to the convention (including Ireland) are under obligation to mitigate, limit, and negate NH3 pollution. To achieve the goals for air quality as set out by the EU, the development of strategies and policies regarding NH3 production is required, based on monitoring, consultation, and a greater understanding of the processes and dynamics involved. In addition to the NEC directive, NH3 emission abatement is also required under the Directive on Industrial Emissions (Directive 2010/75/EU), the Nitrates and Water Framework Directives (Directive 91/676/EEC, Directive 2000/60/EC), and the National Clean Air Strategy (Directive 2001/81/EC).
Aerosols such as PM2.5 and PM10 have been acknowledged as important atmospheric pollutants with no safe threshold currently established from a human health perspective. Both the recent Gothenburg Protocol 2020 and the NEC Directive 2030 have listed ceilings for PM emissions in recognition of their associated health impacts and the transboundary nature of the pollutant.
In Ireland, the nationwide emissions of NH
3 continue to exceed the levels set by the NEC, which has been breached since 2016 with no decrease or stagnation in the upward trajectory currently seen in emissions [
18]. The established national emissions ceiling limit for NH
3 emissions is 116 kilotons per annum. NH
3 trends differ from other transboundary trace gas pollutant emissions such as SO
2 and NO
x, which have seen a steady decrease. Indeed, NH
3 emissions remained static for nearly a decade before rising again in 2016 and continued to breach the NEC limit. This is partially due to agricultural intensification resulting from policies such as Food Harvest 2020 and Food Wise 2025 [
19] which are currently in place in Ireland.
As a result of these incentives, agricultural activity has steadily increased, which consequently led to the use of fertilizer also increasing. Without the correct systems in place, such as monitoring networks measuring for atmospheric NH3 and aerosols arising from NH3, mitigation measures may not yield the desired results. The study presented here has contributed to the narrowing of this gap through building a monitoring network to measure emissions at the source level. The atmospheric NH3 and aerosol NH4+ concentrations and their relationship with arable agriculture and local meteorology aid in the understanding of aerosol formation, the component of NH4+ in aerosols, and how arable agricultural practices can affect atmospheric NH3 emissions even on a localized basis. Through reducing NH3 emissions to the atmosphere, the NH4+ component of aerosols would also be reduced because of less precursor gas availability for atmospheric reactions to occur. Discrepancies between agricultural practices, such as those seen at the active sites under study, can affect NH3 emissions to the atmosphere, presenting a potential error in reporting atmospheric NH3 emission values, especially with consideration to the fact that Ireland currently does not have a continuous monitoring network in place to measure NH3. This can lead to over- and under-estimations of atmospheric NH3 levels and a failure to maintain NH3 emissions below the NEC guidelines.
The failure to maintain emission levels below NEC ceilings and the continuation of the upward trajectory of emission levels in light of sustainable practices leaves current outdated management practices to be questioned. One such measure which could be employed is a nutrient assessment carried out on a yearly basis for the soil. If the nutrient supply requirements of given crops and soils are assessed appropriately, nutrient augmentation has the potential to be not only more sustainable but also cost-effective, as unnecessary losses would also be reduced as a result. This would provide increased yields and increased profits, by way of a reduction in costs.
The results of this study have produced a number of recommendation to aid in the moderation of NH3 emissions to the atmosphere and the consequent lowering of SIA resulting from NH3 emissions, such as a narrowing of fertilization windows during the year, which would also decrease the potential of NH3 entering and leaving the system. Applications during wetter seasons such as late August and early September lead to higher volumes of run-off, as well as excessive application in order to reach desired crop yields due to wash-out. If the application window was narrowed, emissions would be reduced and both EU and national directives and emission limits such as the NEC limits could be met.
Management practices such as establishing over-winter crop cover at both sites would improve soil health and fertility, potentially reducing nutrient augmentation requirements and, therefore, emissions of NH3. The timing of practices such as ploughing can also boost soil health, for example, if ploughing is done during autumn as opposed to spring. This is due to the soil moisture content of soils. If ploughing is done during the initial stages of the rainy season, the soil is more compact; therefore, it does not raise dust and loose soil.
In terms of policies currently in action, such as Food Wise 2025 [
19], calling for the intensification of agricultural production, it is in complete contrast with environmental policies and agreements such as the Gothenburg Protocol, for example, which Ireland is a part of. Thus, unification and common ground have to be reached when policies are devised so that agricultural intensification is achieved in a sustainable way, which curbs emissions instead of leading to their increase, especially atmospheric NH
3.

 ,
, 


