Article

Composition, Distribution, and Biodiversity of Zooplanktons in Tropical Lentic Ecosystems with Different Environmental Conditions

by
Wahidah Ahmad Dini Umi
1,2,
Fatimah M. Yusoff
2,3,*,
Zetty Norhana Balia Yusof
3,4,
Norulhuda Mohamed Ramli
3,5,
Artem Y. Sinev
6 and
Tatsuki Toda
7
1
Aquatic Animal Health and Therapeutics Laboratory (AquaHealth), Institute of Bioscience, Universiti Putra Malaysia, UPM, Serdang 43400, Selangor, Malaysia
2
Department of Aquaculture, Faculty of Agriculture, Universiti Putra Malaysia, UPM, Serdang 43400, Selangor, Malaysia
3
International Institute of Aquaculture and Aquatic Sciences, Universiti Putra Malaysia, UPM, Port Dickson 71050, Negeri Sembilan, Malaysia
4
Department of Biochemistry, Faculty of Biotechnology and Biomolecular Sciences, Universiti Putra Malaysia, UPM, Serdang 43400, Selangor, Malaysia
5
Department of Biological and Agricultural Engineering, Faculty of Engineering, Universiti Putra Malaysia, UPM, Serdang 43400, Selangor, Malaysia
6
Department of Invertebrate Zoology, Biological Faculty, Lomonosov Moscow State University, Leninskie Gory 112, 119991 Moscow, Russia
7
Laboratory of Restoration Ecology, Faculty of Engineering, Soka University, 1-236 Tangi-cho, Hachioji 192-8577, Tokyo, Japan
*
Author to whom correspondence should be addressed.
Arthropoda 2024, 2(1), 33-54; https://doi.org/10.3390/arthropoda2010003
Submission received: 22 November 2023 / Revised: 20 January 2024 / Accepted: 26 January 2024 / Published: 31 January 2024
(This article belongs to the Special Issue Integrative Taxonomy of Cladocera and Copepoda)

Abstract

:
A study was conducted to evaluate zooplankton species composition, abundance, and diversity in both natural and artificial lakes with varying trophic levels and to determine the relationship between zooplankton community structure and lake environmental conditions. This study hypothesized that correlations exist between zooplankton community structures and environmental parameters associated with eutrophication in natural and artificial lakes. Sampling was conducted across 16 distinct freshwater lentic ecosystems in Malaysia, including natural lakes/swamps, reservoirs, constructed lakes/ponds, and old mining lakes, spanning a range of trophic levels from mesotrophic to hypereutrophic conditions. Physicochemical parameters were measured in situ, while water and zooplankton samples were collected for nutrient analyses, as well as for zooplankton identification and enumeration. Throughout this study, a total of 58 zooplankton species, consisting of 36 species of rotifers, 12 species of cladocerans, and 10 species of copepods, were recorded. The highest zooplankton density (365.7 ± 13.7 ind L−1) was recorded in constructed lakes/ponds while the lowest density was recorded in natural shallow lakes/swamps (200.5 ± 25.5 ind L−1). On the other hand, significantly higher (p < 0.05) mean species diversity was observed in natural lakes/swamps (H’ = 2.2 ± 0.0); whereas, the lowest diversity was in old mining lakes (H’ = 1.5 ± 0.1). The canonical correspondence analysis (CCA) scores indicated that Polyarthra vulgaris and Chydorus ventricosus were the discriminating species in natural shallow lakes/swamps associated with high water transparency. Meanwhile, the small-sized cladocerans (Ceriodaphnia cornuta) and rotifers (Keratella spp., Brachionus spp., and Trichocerca spp.) were the most discriminating species in lakes with high turbidity, nutrients, and chlorophyll a concentrations, which are the main features of reservoirs and constructed lakes/ponds. Low density and diversity in old mining lakes were due to a low species number and the dominance of two species, Lophocharis curvata (38.8%) and Ptygura libera (39.7%). Overall, the high dominance of a specific zooplankton species resulted in lower biodiversity in artificial ecosystems compared to natural ecosystems. This study elucidated that zooplankton community structure in lakes was significantly influenced by the environmental conditions related to the lake trophic status.

1. Introduction

The composition of freshwater zooplankton communities is primarily dominated by rotifers, cladocerans, and copepods. These organisms collectively play significant roles in the processes of nutrient cycling and energy transmission from primary producers to elevated trophic levels within aquatic food webs [1] and serve as a major food source for invertebrates and planktivorous fish [2]. They can also function as bioindicators for evaluating water quality and eutrophication status [3,4,5,6]. Zooplankton species within freshwater ecosystems demonstrate adaptability to a wide range of environmental fluctuations. They thrive by responding and adjusting to abiotic factors (nutrient concentrations, water temperature, pH, dissolved oxygen, turbidity, chlorophyll a, transparency, salinity, and pollutants) and biotic factors (predation, competition, and food availability) [7,8,9,10]. Thus, environmental parameters play a pivotal role in influencing the presence and spatial distribution of zooplankton. For a stable and resilient zooplankton community, optimal conditions are crucial for key biological processes, including metabolic rate, reproduction, nutritional composition, and population growth [11,12,13]. On the other hand, adverse environmental conditions can reduce zooplankton abundance, decrease biodiversity, and lead to the disappearance of certain species.
Zooplankton community structure, characterized mainly by composition, abundance, and diversity, differs in both natural (shallow/deep natural lakes, swamps, and rivers) and artificial (reservoirs, constructed lakes/ponds, and old mining lakes) ecosystems, with varying eutrophication levels [14,15,16,17,18]. Eutrophication influences the diversity and composition of zooplankton through mortality, reduced reproductive capacity, and dispersal due to adverse environmental conditions within the habitats [19]. The progressive buildup of nutrients, predominantly phosphorus and nitrogen, expedites the process of lake eutrophication, primarily due to activities in the catchment area. The use of fertilizers, pesticides, herbicides, and insecticides in agricultural areas can potentially increase the nutrient and chemical pollutant runoffs to the water and contaminate lakes with hazardous substances [20,21]. Lakes situated in urbanized and densely populated areas often receive inputs of municipal wastewater discharges, inadequately functioning septic systems, and instances of sewage overflow, which accelerate the degradation of water quality and the onset of eutrophication [22]. Additionally, activity within waterbodies, such as aquaculture practices, also contributed to higher nutrient concentrations in the water due to undigested food and fish excrement being directly released into the water [23].
Zooplankton’s occurrence is also influenced by food availability. As filter feeders, zooplankton effectively filter a range of waterborne particles, including phytoplankton, bacterioplankton, and heterotrophic flagellates, which serve as their nutritional resources [21,22,23,24,25]. The presence of high-quality phytoplankton is extremely important for facilitating zooplankton growth [26]. Eutrophication contributes to the restructuring community of zooplankton from bigger- to smaller-sized species. In eutrophic environments, diminutive zooplankton, such as rotifers (Brachionus spp., Keratella spp., and Trichocerca spp.) and cladocerans (Ceriodaphnia spp.), tend to prevail due to their capacity to subsist on bacteria and detrital matter, which are prolifically present in eutrophic environments [27,28]. Severe eutrophication can lead to algal blooms that have deteriorating effects on water quality and aquatic biodiversity [29]. The process of eutrophication gives rise to the emergence of harmful algal blooms (HABs), resulting in the synthesis of harmful toxins that exert adverse impacts on the developmental, locomotor, immunological, neurological, and reproductive functionalities of aquatic organisms [30,31,32]. Another study also reported that secondary metabolites produced by toxic algae affect the feeding, survival, and reproduction of zooplankton, which are sufficiently potent to cause a decline in survival over the life span [33]. However, the susceptibility of certain zooplankton species to the adverse impacts of cyanobacteria toxin, along with their capacity for deploying inducible defenses, enable them to thrive in eutrophic waters.
The focal point of this investigation lies in the evaluation of zooplankton communities within both natural and artificial ecosystems susceptible to eutrophication. The zooplankton response to eutrophication is complex due to the interplay between environmental processes and the specific attributes of other aquatic organisms. Therefore, this study was conducted: (1) to analyze zooplankton species composition, abundance, distribution, and biodiversity in different freshwater ecosystems, including natural and artificial ecosystems, and (2) to examine the relationship between physical and chemical parameters linked to eutrophication in influencing the structure of zooplankton communities within both natural and artificial ecosystems. This information is crucial for comprehending the progression of the zooplankton community, which is intricately tied to environmental shifts stemming from eutrophication. This study hypothesized that zooplankton composition and diversity differ in natural and artificial ecosystems based on the levels of eutrophication that would affect the zooplankton community structure.

2. Material and Methods

2.1. Study Sites

Malaysia is located in Southeast Asia which is composed of two regions: Peninsular (West Malaysia) and East Malaysia (Borneo). Both regions are separated by the South China Sea. Malaysia has a tropical climate with hot and rainy weather throughout the year. This study was carried out at several lakes in Peninsular Malaysia, comprising 4 natural (natural shallow swamps) and 12 artificial (reservoirs, constructed lakes/ponds, and old mining lakes) ecosystems from 2019 to 2022 (Figure 1; Table 1). The selection of the studied sites was based on various activities occurring within the lakes or their respective catchment areas, which have the potential to impact the water quality and trophic status of the waterbodies. The trophic status index of the sampling sites ranged from eutrophic to hypereutrophic. Detailed descriptions of the studied sites can be found in Table 1.

2.2. Field Sampling and Laboratory Analyses

At each sampling site, in situ physical and chemical parameters, including temperature, pH, dissolved oxygen (DO), and turbidity, were recorded using the YSI multiparameter. Water transparency was measured using a Secchi disc. Water samples for nutrient (total nitrogen, TN; total phosphorus, TP; and chlorophyll a) analyses were collected using a Van Dorn water sampler from three different strata to represent the surface, middle, and bottom layers of the water. Overall, 96 water samples (n) were collected (16 sampling sites × 2 stations × 3 layers = 96 samples) in this study. Water samples were put in polyethylene bottles and kept in an ice box during transportation back to the laboratory. Concurrent with the water sampling, duplicate zooplankton samples were collected with a 60 µm mesh net from about 30 cm from the bottom to the surface. Samples were transferred into 500 mL screw-cap bottles and preserved using 5% buffered formalin (final concentration) for zooplankton identification and enumeration in the laboratory. Overall, 64 zooplankton samples (n) were collected (16 sampling sites × 2 stations × 2 replicates = 64 samples) in this study. Nutrients and chlorophyll a analyses were measured according to standard methods, as described by Umi et al. [8]. For enumeration, a sample of 1–5 mL (depending on the density) was placed in a Sedgewick-Rafter counting chamber and left to settle for half an hour prior to the microscopic analysis. Random non-overlapping fields were examined until at least 150 individuals of the dominant species were counted and reported as number of L−1. Zooplankton identification was accomplished according to descriptions, taxonomic keys, and illustrations from previous studies [34,35,36,37,38,39]. Zooplankton density was calculated using the following formula:
Population density, ind. L−1 = N   ×   K V / 1000 ;  
N = the numbers of individuals in the subsample, mL;
K = the proportion of subsample volume to the total volume, mL;
V = volume of water filtered by the sampling net, mL.
where:
V = mouth area of the net (A) × depth (D).

2.3. Data Analyses

Environmental data were assessed for normality by the Shapiro–Wilk test and log (x + 1) transformed prior to one-way analysis of variance (ANOVA) using SPSS v. 25 (IBM SPSS Statistical, Chicago, IL, USA). All environmental and zooplankton data (fourth root transformed to balance the common and rare species) were ordinated by the correlation-based principal component analysis (PCA) using PRIMER software (Plymouth Routine in Multivariate Ecological Research v. 7 PRIMER E-Ltd, Plymouth, UK) to identify the key factors contributing to variations and patterns in datasets. In addition, the Shannon–Wiener diversity index (H’) calculation, the similarity percentage analysis (SIMPER), biotic-environmental analysis (BIO-ENV), and canonical correspondence analysis (CCA) were performed using XLSTAT software to determine various aspects of the zooplankton community structure and to ascertain relationships between the zooplankton and the environmental variables. The occurrence of zooplankton species and the discriminant species in each site was further illustrated by a shade plot to show clear distributions of each species in different lakes.

3. Results

3.1. Zooplankton Species Composition, Abundance, and Diversity

A total of 58 zooplankton species, consisting of 12 species of cladocerans (seven families), 10 species of copepods (two families), and 36 species of rotifers (twelve families), were recorded throughout the sampling period in all lakes (Table 2). The significantly (p < 0.05) higher numbers of zooplankton species were recorded in both reservoir and constructed lakes, with 43 zooplankton species, followed by natural shallow lakes/swamps, with 41 species; meanwhile, the lowest number of zooplankton species was recorded in old mining lakes, with only 29 species. Among the lakes, the highest (p < 0.05) zooplankton density (365.7 ± 13.7 ind L−1) was recorded in the constructed lakes/ponds, followed by reservoirs (308.8 ± 34.9 ind L−1) and old mining lakes (243.4 ± 28.5 ind L−1). The lowest zooplankton density (200.5 ind L−1) was observed in natural lakes (Table 2).
The rotifers formed the most dominant group, accounting for over 50% of total zooplankton in all studied lakes, especially in the old mining lakes, with 87.8%. The Brachionidae family contributed the most rotifer species, with 14 species. In the natural ecosystem, the abundances of Polyarthra vulgaris (Carlin, 1934) (30.3 ind L−1; 15.1%), Chydorus ventricosus (Daday, 1898) (30.0 ind. L−1; 15.0%), and Keratella cochlearis (Gosse, 1851) (16.8 ind. L−1; 8.5%) were significantly higher (p < 0.05) compared to the other species (Table 2). Some species, such as C. ventricosus, Eucyclops taiwanensis (Sukhikh and Alekseev, 2015), Mesocyclops affinis (van de Velde, 1987), Microcyclops francisci (Holynska, 2000), and Microcyclops sumatranus (Kiefer, 1933), were only found in natural ecosystems (Table 2; Figure 2). In the reservoir, Bosminopsis africanus (Daday, 1908) (71.2 ind. L−1; 23.1%), Ceriodaphnia cornuta (G.O. Sars, 1885) (32.1 ind. L−1; 10.4%), K. cochlearis (26.5 ind. L−1; 8.6%), and Ptygura libera (25.1 ind. L−1; 8.1%) showed significantly higher (p < 0.05) mean density compared to other species. A similar trend was observed in the constructed lakes, where the density of C. cornuta (54.9 ind. L−1; 15.0%), K. cochlearis (26.5 ind. L−1; 8.6%), and Ptygura libera (Myers, 1934) (25.1 ind. L−1; 8.1%) was significantly higher (p < 0.05) compared to other species. Zooplankton abundance in old mining lakes showed a clear domination of P. libera (96.7 ind. L−1; 39.7%) and Lophocharis curvata (Berzin, 1982) (94.4 ind. L−1; 38.8%) among the total zooplankton (Table 2; Figure 2).
In all artificial ecosystems, it was found that copepod nauplii was significantly higher (p < 0.05) compared to copepodites and adult copepods. Meanwhile, adult copepods were the most dominant form in a natural ecosystem. Based on the Shannon–Wiener species diversity index, the zooplankton diversity in natural shallow swamps was significantly (p < 0.05) higher (H’ = 2.2 ± 0.0) compared to reservoirs (H’ = 1.9 ± 0.1) and constructed lakes (H’ = 1.7 ± 0.1). The lowest species diversity was recorded in old mining lakes (p < 0.05, H’ = 1.5 ± 0.1) (Table 2).

3.2. Physicochemical Parameters of Studied Sites

The range of temperature recorded in the natural ecosystem was between 27.68 °C and 29.68 °C while, in the artificial ecosystem, it was between 28.34 °C and 30.53 °C (Table 3). The range of pH values recorded in the natural ecosystem ranged between pH 4.87 and pH 6.46; whereas, in the artificial ecosystem, the values were between pH 5.70 and pH 7.80. Dissolved oxygen (DO) concentrations ranged from 1.97 mg L−1 to 4.58 mg L−1 while, in the artificial ecosystem, DO levels ranged from 0.74 mg L−1 to 8.40 mg L−1. Turbidity levels in the natural ecosystem ranged from 14.82 NTU to 17.29 NTU. Meanwhile, the range of turbidity levels in the artificial ecosystem was from 12.74 NTU to 42.00 NTU. In the natural ecosystem, total phosphorus (TP) and total nitrogen (TN) concentrations showed no significant difference (p > 0.05) among sites. However, in artificial ecosystems, significantly higher (p > 0.05) TP concentrations, ranging from 0.03 mg L−1 to 0.69 mg L−1, and TN concentrations, ranging from 0.17 mg L−1 to 2.26 mg L−1, were recorded compared to the natural ecosystem. In terms of chlorophyll a concentrations, the values recorded in the natural ecosystem ranged between 3.88 µg L−1 and 11.15 µg L−1. Significantly more (p < 0.05) chlorophyll a was observed in the artificial ecosystem, with concentrations ranging from 8.70 µg L−1 to 97.18 µg L−1, compared to the natural ecosystem. The range of water transparency levels recorded in the natural ecosystem was from 0.82 m to 1.10 m while, in the artificial ecosystem, it ranged from 0.25 m to 1.70 m.

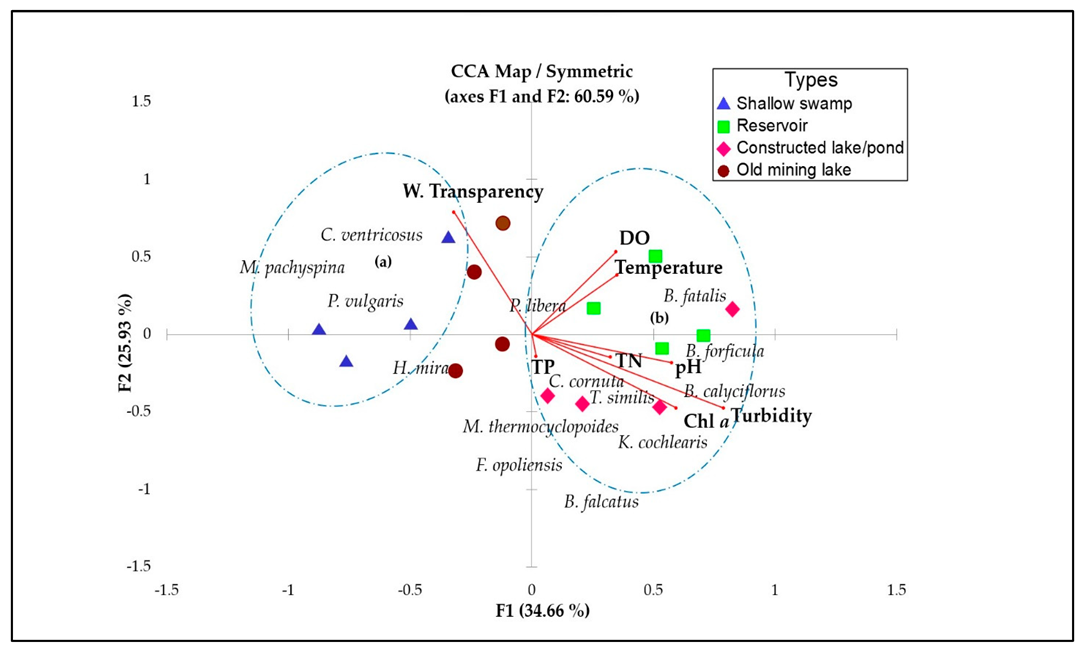
3.3. Relationship between Zooplankton and Physicochemical Parameters

Canonical correspondence analysis (CCA) was used to determine the relationship between zooplankton species and physicochemical characteristics and the results showed that environmental factors explained 60.59% of the variance in the weighted means of the species with respect to the eight parameters (Figure 3). Axis 1, which accounted for a total variance of 34.66%, was positively correlated with turbidity, chlorophyll a, pH, and total nitrogen (TN) and negatively correlated with water transparency. From the biplot, Ceriodaphnia cornuta, Brachionus calyciflorus, B. falcatus, Trichocerca similis, and Keratella cochlearis, which were found in high densities in the artificial ecosystem (reservoirs and constructed lakes/ponds), were positively influenced by Axis 1, marked by high nutrient, turbidity, and chlorophyll a concentrations. Meanwhile, Polyarthra vulgaris, which was found abundantly in the natural ecosystem, was negatively associated with total nitrogen (r = −0.669), chlorophyll a (r = −0.666), and total phosphorus (TP) (r = −0.522) (Table 4). A positive correlation was found between C. cornuta and turbidity (r = 0.597), chlorophyll a (r = 0.543), TN (r = 0.529), and total phosphorus (TP) (r = 0.438). Brachionus calyciflorus was positively correlated with turbidity (r = 0.713) and chlorophyll a (r = 0.714) (Table 5). Similarly, T. similis showed a positive correlation with chlorophyll a (r = 0.752), turbidity (r = 0.735), and TP (r = 0.426), respectively. Meanwhile, K. cochlearis showed a positive correlation with turbidity (r = 0.540), chlorophyll a (r = 0.526), and TN (r = 0.506). In contrast, P. vulgaris showed a negative correlation with TN (r = −0.669), chlorophyll a (r = −0.666), and TP (r = −0.522). Overall, the high density of zooplankton was positively correlated with chlorophyll a (r = 0.571), turbidity (r = 0.496), and TN (r = 0.457) and negatively associated with water transparency (r = −0.487). Further analysis was performed to find the correlation between zooplankton and physical and chemical parameters using biotic-environmental (BIO-ENV) analysis. The global test from BIO-ENV showed that zooplankton density was significantly (p < 0.05) correlated with physical and chemical parameters (Table 5. From the BIO-ENV analysis, chlorophyll a, total nitrogen, and turbidity were best correlated to zooplankton density with ρ = 0.508.

4. Discussion

A total of 58 zooplankton species, consisting of 36 species of rotifers, 12 species of cladocerans, and 10 species of copepods, were recorded throughout the sampling period. The number of zooplankton species recorded in this study was higher compared to the 45 zooplankton species found by Abd Razak and Sharip [22] and the 49 zooplankton species reported by Ismail et al. [40] in Malaysian lakes. However, the number of zooplankton species obtained in this study was lower compared to the 112 zooplankton species in Tondano Lake, Indonesia [41], and the 65 zooplankton species in Baiyangdian Lake, China [42]. Rotifers, in general, represent the main contributors to the zooplankton density and diversity in freshwater ecosystems [7,43,44]. This fact is confirmed by our results as rotifers contributed to more than 50% of the total zooplankton population observed in almost all sampling sites. The prevalence of rotifers could potentially be attributed to their growth patterns aligned with r-strategy traits and their phenotypic attributes linked to specific functions. As r-species, they have thrived due to their opportunistic nature, short life cycles, and ability to endure unfavorable environmental circumstances and resource scarcity; their smaller size makes them less susceptible to predation [45]. Additionally, in this study, the rotifer assemblage was dominated by Brachionus spp., Keratella spp., and Trichocerca spp.
Zooplankton composition, abundance, and diversity differed between natural and artificial ecosystems. In shallow natural swampy lakes, zooplankton density was significantly lower (p < 0.05, 200.5 ± 25.5 ind. L−1) but diversity (H’ = 2.2 ± 0.0) was significantly higher (p < 0.05) compared to artificial lakes. Zooplankton diversity recorded in this study was higher compared to the zooplankton diversity in Tondano Lake, Indonesia (H’ = 1.73–1.85) [41], and in several urban lakes in Malaysia (H’ = 1.41–2.34) [22]. However, zooplankton diversity was low compared to the zooplankton diversity in Ulansuhai Lake, China (H’ = 2.75) [17]. Low zooplankton density is a characteristic of a nutrient-poor lake with low primary productivity. In addition, floods and droughts might influence zooplankton dynamics by affecting both local (food availability) and regional (increasing connection and dispersion) environmental conditions [46]. Flood-pulse dynamics also will have an impact on the degree of connectivity between the lakes and the river and will affect the zooplankton structure as a result of less stable environmental conditions. However, high diversity in the natural ecosystem might be due to the presence of macrophytes, which can provide habitat heterogeneity for hydrobiont communities, especially zooplanktonic species [47]. Observation during the sampling period found that natural lakes harbor more aquatic plants/macrophytes, such as Nelumbo nucifera, pandanus helicopus, Eleocharis dulcis, and Lepironia articulata, compared to artificial lakes, which can provide habitat, food sources, and refuge for zooplankton. This observation aligned with Brito et al. [48] who reported that the high occurrence of zooplankton species within floodplain regions can be attributed, in part, to the substantial presence of extensive aquatic macrophyte cover. Submerged or free-floating macrophytes foster an elevated species diversity by expanding the available colonization area, enhancing the availability of food resources, and providing a refuge from predation [49,50,51]. Prior investigations have also demonstrated that habitat intricacy, brought about by aquatic macrophytes, functions as a predictive factor for biodiversity. This complexity contributes to species richness and facilitates the expansion of a more extensive genetic reservoir within the zooplankton community [46,51,52].
High zooplankton density was observed in artificial ecosystems, especially reservoirs (308.8 ± 34.9 ind. L−1) and constructed lakes (365.7 ± 13.7 ind. L−1). This is probably due to longer residence time in deeper reservoirs compared to shallow natural lakes, which could allow time for zooplankton community development. However, due to the protracted retention period inherent to reservoirs and constructed lakes relative to natural lakes, the former are predisposed to eutrophication when exposed to unregulated nutrient enrichment. Elevated nutrient levels facilitate the proliferation of phytoplankton, thereby serving as a nutritional source for zooplankton. This is in line with the findings of Moody and Wilkinson [53], who noted an increase in zooplankton abundance within nutrient-enriched lakes, attributed to the availability of food resources. Furthermore, the comparatively elevated quantity of both zooplankton species and their abundance detected in lakes with high eutrophication can also be attributed to the prevalence of microbial sustenance. Generally, high biomasses of decomposed phytoplankton within eutrophic waters lead to increased concentrations of detritus and bacteria, which assume significance as pivotal dietary resources for zooplankton. Consequently, within more eutrophic lake environments, the potential for a high abundance of zooplankton species becomes more pronounced. Zooplankton structure in both reservoirs and constructed lakes/ponds in this study showed a typical zooplankton community structure of a eutrophic ecosystem with high density but low species diversity due to the domination of certain species (Table 2).
From the BIO-ENV and CCA analyses, environmental parameters related to eutrophication, such as chlorophyll a, total nitrogen, and turbidity, were the major contributors to shaping the structure and function of the zooplankton community. Howarth et al. [54] reported that the productivity of aquatic ecosystems was mainly influenced by nutrient concentrations, especially nitrogen and phosphorus in the water bodies. Previous studies on zooplankton communities under different disturbance levels due to human interference pointed out that inorganic nitrogen (ammonia, nitrate, and nitrite nitrogen) and total phosphorus (TP), including soluble reactive phosphorus (PO43−), were determinants constraining the zooplankton community, particularly for eutrophic indicators [19,55,56]. The bottom-up effect derived from nutrients could be seen in the interaction between phytoplankton and zooplankton, in which zooplankton growth was controlled by phytoplankton that require nitrogen and phosphorus for their growth [57].
In this study, nutrient concentrations in natural shallow swamps (Chini and Bera lakes) were relatively low, likely limiting phytoplankton growth, as depicted by lower chlorophyll a concentrations (3.88–5.72 µg mL−1). This condition indirectly affected the zooplankton population due to inadequate food source availability. Additionally, low pH reduced the growth in phytoplankton populations, which served as food for herbivorous zooplankton. Furthermore, low dissolved oxygen (DO) in swamps at S3 and S4 (1.97 ± 0.25 mg L−1 and 2.30 ± 0.30 mg L−1, respectively) indicated a hypoxic environment, which directly hampered zooplankton growth in these lakes; only tolerant species would survive. In fact, DO values below 5 mg L−1 would affect the functioning and survival of biological communities. Previous studies also reported that low DO concentration could potentially emerge as a principal contributing factor to the reduction in both the species composition and density of zooplankton within a given habitat due to hypoxia conditions [53,58]. Several studies have reported that hypoxia could cause negative physiological impacts on zooplankton species [59,60,61]. Therefore, these might be the strong contributors to the lower density of zooplankton in natural lakes compared to artificial lakes found in this study.
In this study, higher nutrient concentrations were found in artificial lakes (Table 4). In terms of the reservoirs, both the Sembrong and Chenderoh reservoirs exhibited significantly higher (p < 0.05) nutrient levels, especially total nitrogen (2.26 ± 0.33 mg L−1), compared to the other lakes. The palm oil plantations, agriculture activities, and animal husbandry operations altered the Sembrong Reservoir’s catchment area, leading to the accumulation of nutrients via surface runoff, resulting in an excessive buildup of nutrient concentrations in this reservoir [62,63]. Furthermore, aquaculture activities conducted at the Chenderoh Reservoir also contributed to higher nitrogen (2.05 ± 0.10 mg L−1) concentrations in this reservoir. The elevation in nutrient concentrations in this reservoir was primarily caused by the direct release of undigested food and fish excrement from fish cages into the water [23]. This finding aligned with that of Zhang et al. [64] who reported that aquaculture operations resulted in the substantial discharge of a significant quantity of organic nutrients (nitrogen, phosphorus, and carbon), primarily originating from unconsumed feed pellets and fecal matter, into the water. In the constructed lakes/ponds, high nutrient concentrations were recorded both in Sri Serdang Pond and Cempaka Lake. According to Sharip and Mohamad [65], direct discharges of wastewater containing high nutrients from markets and stalls, along with inadequate wastewater treatment facilities, are the main contributors to nutrients and other pollutants in urban lakes/ponds. Higher phosphorus (TP) concentrations observed in Sri Serdang Pond (0.69 ± 0.10 mg L−1) and Cempaka Lake (0.52 ± 0.02 mg L−1) were presumably due to the wastewater discharge from nearby restaurants, stalls, and settlements. Previous studies have also reported that nutrients were the main factors affecting the spatial differentiation pattern of zooplankton [17,42,66,67,68,69,70].
Significantly higher (p < 0.05) chlorophyll a concentrations were recorded in Sembrong Reservoir (97.18 ± 4.70 µg L−1) and Sri Serdang Pond (95.00 ± 17.9 µg L−1) compared to the other lakes. Chlorophyll a concentration indicates the phytoplankton biomass in water bodies. Chlorophyll a was positively correlated with TN (r = 0.676) (Table 4), suggesting the importance of this nutrient to phytoplankton productivity, which serves as a food source for zooplankton. This factor contributed to the high density of zooplankton in both waterbodies. Previous studies also reported that the abundance of zooplankton in eutrophic waters was associated with chlorophyll a, indicating that high phytoplankton biomass could support the growth of zooplankton [41,64,71] (Table 5). High zooplankton densities found in reservoirs and constructed lakes/ponds were also correlated with turbidity. Turbid water in Cempaka Lake (42.00 ± 8.55 NTU) and Sri Serdang Pond (39.94 ± 5.02 NTU) might be due to the surface runoff that carried particles from the watershed and the high phytoplankton biomass in the waterbodies. High turbidity level also limits the visual distance of planktivorous fish [72], which may result in a reduction in the rate of foraging, thereby enabling an augmented survival rate for the zooplankton. In this study, zooplankton density and diversity values were lower in old mining lakes compared to other lake types, especially the SKVE and The Mines lakes, probably due to the low dissolved oxygen (0.91–2.59 mg L−1) values, as recorded in these lakes.
Zooplankton community structure differs in response to varying degrees of eutrophication, in which eutrophication causes a change in the species composition and increases the abundance of tolerant zooplankton species. The responses of zooplankton communities to lake eutrophication can be categorized in a taxonomically specific manner, where characteristics of the zooplankton community species richness and body size have been observed to exhibit an inverse correlation with increasing eutrophication [42]. Generally, small-bodied zooplankton, such as rotifers, especially from the genera Keratella, Brachionus, and Trichocerca, tend to dominate plankton communities in highly eutrophic conditions [7,22,27,28,66,73,74,75,76,77] (Table 5). One of the factors contributing to this phenomenon could be the adaptability of defensive morphological traits in Brachionus sp. and Keratella sp., which enhances their capacity to endure diverse predation pressures. Zhang et al. [78] reported that these species exhibit the elongation of their spines in response to elevated predation by cyclops copepods and modulate the length of their spines to a shorter state when confronted with heightened predation from fish. Additionally, previous studies also documented that Brachionus exhibit notable resilience to cyanobacterial toxins and this resilience enables them to effectively exploit colonial blue-green algae and endure their blooms [79]. The capacity of Brachionus and Keratella to endure these adverse influences elucidates their positioning as two of the genera capable of thriving in eutrophic environments.
Furthermore, cladoceran species recorded in this study exhibited the typical community structure of a eutrophic ecosystem, with a high abundance of tolerant species. Earlier research has shown that as eutrophication increases, the predominance of tolerant species leads to a shift in communities from being dominated by large cladocerans (Diaphanosoma sp.) to small-sized cladocerans (Ceriodaphnia sp. and Bosmina sp.) [8,53,66] (Table 5). The prevalence of small-sized cladocerans, such as C. cornuta and Bosmina fatalis, might be elucidated by their activation of inducible defensive mechanisms and their ability to withstand the presence of toxic filamentous cyanobacteria that are dominant in eutrophic waters. Prior research has similarly indicated the susceptibility of cladocerans to the adverse impacts of cyanobacteria, along with their capacity for deploying inducible defenses [33,80,81]. In addition, the filter-feeding mechanism of large cladocerans (Diaphanosoma sp.) is susceptible to potential harm due to obstructions caused by entanglement with cyanobacterial filaments or the adhesive mucilage generated by cyanobacterial colonies [82]. In fact, the thoracic appendage movements were mechanically or chemically inhibited by cyanobacteria toxins [83]. A decrease in filtration rates resulted in reduced energy for growth and reproduction in cladoceran species. Conversely, smaller cladoceran species like C. cornuta, characterized by minute carapace apertures, may possess the capability to deter the filtration of sizable cyanobacterial colonies, thereby conferring them a competitive advantage over larger-bodied cladocerans.
Moreover, small-sized zooplankton are pointed out as eutrophic environmental indicators as they can tolerate high concentrations of nutrients and feed on bacteria, detritus, and algae, which are characteristics of eutrophic waters. This observation underscores that the diverse array of food particles exploited by those species (rotifers and cladocerans) affords them the ability to sustain themselves through notably distinct dietary preferences, including bacterioplankton and heterotrophic flagellates [25,84,85]. For copepods, densities of cyclopoids, especially Thermocyclops and Mesocyclops, were high in nutrient-rich environments [8,44,86] (Table 5). Valencia-vargas et al. [87] reported that cyclopoids can feed on rotifers and the high density of cyclopoids in eutrophic lakes might be associated with the high rotifer densities in those conditions. Moreover, the density of immature copepods (nauplii and copepodites) also increased in nutrient-rich conditions. Above all, the former species (Keratella sp., Brachionus sp., Trichocerca sp., and Ceriodaphnia sp.) can serve as good indicators for nutrient-rich water. This can be explained by their positive correlation with chlorophyll a, as shown in this study. Generally, eutrophic conditions result in high chlorophyll a levels, indicating a high phytoplankton biomass that serves as a food source for zooplankton. Meanwhile, previous studies reported that Conochilus hippocrepis, C. unicornis, Polyarthra vulgaris, and Kellicottia longispina are indicators for less-nutrient-rich waters Table S1 [88,89,90,91]. This can be explained by the negative correlation [r = −0.666] between P. vulgaris and chlorophyll a concentration in this study (Table 4).

5. Conclusions

Variables related to lake trophic status, especially nutrient concentrations, chlorophyll a, and turbidity, were the main drivers influencing the distribution of zooplankton species in shallow natural and constructed lakes. The small-sized cladocerans (Ceriodaphnia cornuta) and rotifers (Keratella spp., Brachionus spp., and Trichocerca spp.) were the most discriminating species in lakes with high nutrient and chlorophyll a concentrations, as could be found in the reservoirs and constructed lakes/ponds. Polyarthra vulgaris and Chydorus ventricosus were the discriminating species in natural shallow lakes/swamps associated with high water transparency. High dominance of the zooplankton community by a certain species resulted in lower biodiversity in artificial lakes compared to natural lakes. Additionally, high nutrient concentrations also favor the growth of microalgae and bacteria as food sources for zooplankton, resulting in high zooplankton density. This study illustrated that zooplankton species composition, abundance, and diversity were significantly correlated with environmental variables associated with lake trophic status.

Supplementary Materials

The following supporting information can be downloaded at: https://www.mdpi.com/article/10.3390/arthropoda2010003/s1, Table S1: Zooplankton composition, abundance, and diversity in relation to environmental parameters in tropical and partially tropical countries.

Author Contributions

Conceptualization, F.M.Y. and W.A.D.U.; formal analysis, W.A.D.U.; funding acquisition, F.M.Y. and T.T.; investigation, W.A.D.U.; methodology, F.M.Y. and W.A.D.U.; project administration, F.M.Y.; resources, F.M.Y.; supervision, F.M.Y.; validation, F.M.Y. and A.Y.S.; visualization, W.A.D.U.; writing—original draft, W.A.D.U.; writing—review and editing, F.M.Y., Z.N.B.Y., N.M.R., A.Y.S. and T.T. All authors have read and agreed to the published version of the manuscript.

Funding

This research was funded by the SATREPS-COSMOS Project (No. JPMJSA 1509).

Institutional Review Board Statement

Not applicable.

Informed Consent Statement

Not applicable.

Data Availability Statement

Data presented in this study are available through digital object identifiers/reports listed in the reference list.

Acknowledgments

The authors wish to express their gratitude to all who were involved directly and indirectly in this project. Thank you to Artem Y. Sinev and Maria Holynska for the confirmation of the cladocerans and copepod species.

Conflicts of Interest

The authors declare no conflicts of interest.

References

  1. Bakhtiyar, Y.; Arafat, M.Y.; Andrabi, S.; Tak, H.I. Zooplankton: The significant ecosystem service provider in aquatic environment. In Bioremediation and Biotechnology, Vol 3: Persistent and Recalcitrant Toxic Substances, 1st ed.; Bhat, R.A., Hakeem, K.R., Al-Saud, N.B.S., Eds.; Springer: Cham, Switzerland, 2020; Volume 3, pp. 227–244. [Google Scholar]
  2. Lomartire, S.; Marques, J.C.; Gonçalves, A.M. The key role of zooplankton in ecosystem services: A perspective of interaction between zooplankton and fish recruitment. Ecol. Indic. 2021, 129, 107867. [Google Scholar] [CrossRef]
  3. Almeida, R.; Formigo, N.E.; Sousa-Pinto, I.; Antunes, S.C. Contribution of zooplankton as a biological element in the assessment of reservoir water quality. Limnetica 2020, 39, 245–261. [Google Scholar] [CrossRef]
  4. Muñoz-Colmenares, M.E.; Soria, J.M.; Vicente, E. Can zooplankton species be used as indicators of trophic status and ecological potential of reservoirs? Aquat. Ecol. 2021, 55, 1143–1156. [Google Scholar] [CrossRef]
  5. Rashid, H.; Prakash, M.M. Zooplanktons as bioindicators of water pollution from Vikram Tearth Sarovar Ujjain (MP). J. Pharm. Negat. 2022, 13, 888–895. [Google Scholar]
  6. Pinto, I.; Nogueira, S.; Rodrigues, S.; Formigo, N.; Antunes, S.C. Can zooplankton add value to monitoring water quality? A case study of a meso/eutrophic Portuguese Reservoir. Water 2023, 15, 1678. [Google Scholar] [CrossRef]
  7. Umi, W.A.D.; Yusoff, F.M.; Aris, A.Z.; Sharip, Z. Rotifer community structure in tropical lakes with different environmental characteristics related to ecosystem health. J. Environ. Biol. 2018, 39, 795–807. [Google Scholar] [CrossRef]
  8. Umi, W.A.D.; Yusoff, F.M.; Aris, A.Z.; Sharip, Z.; Sinev, A.Y. Planktonic microcrustacean community structure varies with trophic status and environmental variables in tropical shallow lakes in Malaysia. Diversity 2020, 12, 322. [Google Scholar] [CrossRef]
  9. Qin, S.; Yang, T.; Yu, B.; Zhang, L.; Gu, L.; Sun, Y.; Yang, Z. The stress effect of atrazine on the inducible defense traits of Daphnia pulex in response to fish predation risk: Evidences from morphology, life history traits, and expression of the defense-related genes. Environ. Pollut. 2022, 311, 119965. [Google Scholar] [CrossRef]
  10. Mao, Z.; Cao, Y.; Gu, X.; Zeng, Q.; Chen, H.; Jeppesen, E. Response of zooplankton to nutrient reduction and enhanced fish predation in a shallow eutrophic lake. Ecol. Appl. 2023, 33, e2750. [Google Scholar] [CrossRef]
  11. Bomfim, F.F.; Melao, M.G.; Gebara, R.C.; Lansac-Toha, F.A. Warming alters the metabolic rates and life-history parameters of Ceriodaphnia silvestrii (Cladocera). An. Acad. Bras. Cienc. 2022, 94, e20200604. [Google Scholar] [CrossRef]
  12. Khalifa, U.; Ebenezer, V.; Pierson, J.J. Elevated temperature and low pH affect the development, reproduction, and feeding preference of the tropical cyclopoid copepod Oithona rigida. Int. J. Environ. Stud. 2022, 80, 1704–1720. [Google Scholar] [CrossRef]
  13. Xue, W.; Jin, J.; Zhang, F.; Chen, H.; Yang, D.; Zhang, Y.; Wei, W. Bosmina fatalis adapting to ammonia through oxidative stress and ribosome increase. J. Freshw. Ecol. 2022, 37, 117–129. [Google Scholar] [CrossRef]
  14. Le Quesne, K.S.; Özkundakci, D.; Duggan, I.C. Life on the farm: Are zooplankton communities in natural ponds and constructed dams the same? Mar. Freshw. Res. 2020, 72, 330–340. [Google Scholar] [CrossRef]
  15. Cabral, C.R.; Diniz, L.P.; da Silva, A.J.; Fonseca, G.; Carneiro, L.S.; de Melo Junior, M.; Caliman, A. Zooplankton species distribution, richness and composition across tropical shallow lakes: A large scale assessment by biome, lake origin, and lake habitat. Ann. Limnol. 2020, 56, 25. [Google Scholar] [CrossRef]
  16. Eskinazi-Sant’Anna, E.M.; Santos, G.D.S.; Alves, N.J.D.S.; Brito, L.A.F.; Leite, M.G.P. The relative importance of regional and local factors in shaping zooplankton diversity in high-altitude tropical shallow lakes. J. Freshw. Ecol. 2020, 35, 203–221. [Google Scholar] [CrossRef]
  17. Geng, Y.; Li, M.; Yu, R.; Sun, H.; Zhang, L.; Sun, L.; Xu, J. Response of planktonic diversity and stability to environmental drivers in a shallow eutrophic lake. Ecol. Indic. 2022, 144, 109560. [Google Scholar] [CrossRef]
  18. Simões, N.R.; Dias, J.D.; Meerhoff, M.; Lansac-Toha, F.A.; Bini, L.M.; Bonecker, C.C. Drivers of zooplankton beta diversity in natural shallow lakes and artificial reservoirs in the Neotropics. Hydrobiologia 2022, 849, 3705–3717. [Google Scholar] [CrossRef]
  19. Shen, J.; Qin, G.; Yu, R.; Zhao, Y.; Yang, J.; An, S.; Wan, Y. Urbanization has changed the distribution pattern of zooplankton species diversity and the structure of functional groups. Ecol. Indic. 2021, 120, 106944. [Google Scholar] [CrossRef]
  20. Tudi, M.; Daniel Ruan, H.; Wang, L.; Lyu, J.; Sadler, R.; Connell, D.; Phung, D.T. Agriculture development, pesticide application and its impact on the environment. Int. J. Environ. Res. Public Health 2021, 18, 1112. [Google Scholar] [CrossRef]
  21. Zahoor, I.; Mushtaq, A. Water pollution from agricultural activities: A critical global review. Int. J. Chem. Biochem. Sci. 2023, 23, 164–176. [Google Scholar]
  22. Razak, S.B.A.; Sharip, Z. Spatio-temporal variation of zooplankton community structure in tropical urban waterbodies along trophic and urban gradients. Ecol. Process. 2019, 8, 44. [Google Scholar] [CrossRef]
  23. Herath, S.S.; Satoh, S. Environmental impacts of nitrogen and phosphorus from aquaculture. In Feed and Feeding Practices in Aquaculture, 2nd ed.; Davis, D.A., Ed.; Woodhead Publishing: Sawsto, UK, 2022; pp. 427–444. [Google Scholar]
  24. Wenzel, A.; Vrede, T.; Jansson, M.; Bergström, A.K. Daphnia performance on diets containing different combinations of high-quality algae, heterotrophic bacteria, and allochthonous particulate organic matter. Freshw. Biol. 2021, 66, 157–168. [Google Scholar] [CrossRef]
  25. Gilbert, J.J. Food niches of planktonic rotifers: Diversification and implications. Limnol. Oceanogr. 2022, 67, 2218–2251. [Google Scholar] [CrossRef]
  26. Liu, L.; Zhang, H.; Liu, X.; Li, Y.; Boersma, M.; Zhou, L.; Chen, F. The comprehensive effect of natural food quality and quantity on growth rate of herbivore consumers. Ecol. Indic. 2023, 156, 111129. [Google Scholar] [CrossRef]
  27. Derevenskaia, O.I.; Borisova, N.I.; Unkovskaia, E.N. Zooplankton indices in the evaluation of the ecological state of the eutrophic lake (Case study: Karasikha Lake, Russia). Casp. J. Environ. Sci. 2021, 19, 701–708. [Google Scholar]
  28. Alprol, A.E.; Heneash, A.M.; Soliman, A.M.; Ashour, M.; Alsanie, W.F.; Gaber, A.; Mansour, A.T. Assessment of water quality, eutrophication, and zooplankton community in Lake Burullus, Egypt. Diversity 2021, 13, 268. [Google Scholar] [CrossRef]
  29. Amorim, C.A.; do Nascimento Moura, A. Ecological impacts of freshwater algal blooms on water quality, plankton biodiversity, structure, and ecosystem functioning. Sci. Total Environ. 2021, 758, 143605. [Google Scholar] [CrossRef]
  30. Benayache, N.Y.; Nguyen-Quang, T.; Hushchyna, K.; McLellan, K.; Afri-Mehennaoui, F.Z.; Bouaïcha, N. An overview of cyanobacteria harmful algal bloom (CyanoHAB) issues in freshwater ecosystems. In Limnology: Some New Aspects of Inland Water Ecology; Gokce, D., Ed.; IntechOpen: London, UK, 2019; pp. 13–37. [Google Scholar]
  31. Han, T.; Kong, M.; Tang, C.; Xu, X.; Zhu, Y.; Gao, Y.; Li, W. Influence of algal blooms on the efficacy of La/Al-based phoslock in the control of phosphorus release from sediment in shallow lakes: A microcosm study. J. Soils Sediments 2021, 21, 3405–3414. [Google Scholar] [CrossRef]
  32. Bizani, M.; Bornman, T.G.; Campbell, E.E.; Perissinotto, R.; Deyzel, S.H.P. Mesozooplankton community responses to a large-scale harmful algal bloom induced by the non-indigenous dinoflagellate Lingulodinium polyedra. Sci. Total Environ. 2023, 860, 161030. [Google Scholar] [CrossRef]
  33. Pawlik-Skowrońska, B.; Bownik, A. Cyanobacterial anabaenopeptin-B, microcystins and their mixture cause toxic effects on the behavior of the freshwater crustacean Daphnia magna (Cladocera). Toxicon 2021, 198, 1–18. [Google Scholar] [CrossRef]
  34. Pontin, R. A Key to the Freshwater Planktonic and Semi-Planktonic Rotifera of the British Isles; Freshwater Biological Association: Ambleside, UK, 1978; Volume 38, p. 178. [Google Scholar]
  35. Idris, B.A.G. Freshwater Zooplankton of Malaysia (Crustacea: Cladocera); University Pertanian Malaysia Press: Serdang, Malaysia, 1983; p. 153. [Google Scholar]
  36. Shiel, R.J. A Guide to Identification of Rotifers, Cladocerans and Copepods from Australian Inland Waters; Identification Guide Series No. 3; Shiel, J., Albury, N.S.W., Eds.; Co-Operative Research Centre for Freshwater Ecology: Canberra, ACT, Australia, 1995; p. 144. [Google Scholar]
  37. Segers, H. Global diversity of rotifers (Rotifera) in freshwater. Hydrobiologia 2008, 595, 49–59. [Google Scholar] [CrossRef]
  38. Sa-Ardrit, P.; Pholpunthin, P.; Segers, H. A checklist of the freshwater rotifer fauna of Thailand (Rotifera, Monogononta, Bdelloidea). J. Limnol. 2013, 72, 361–375. [Google Scholar] [CrossRef]
  39. Phan, D.D.; Nguyen, V.K.; Le, T.N.; Ngoc, T.D.; Ho, T.H. Identification Handbook of Freshwater Zooplankton of the Mekong River and Its Tributaries; Mekong River Commission: Vientiane, Laos, 2015; p. 207. [Google Scholar]
  40. Ismail, A.H.; Lim, C.C.; Wan Omar, W.M. Evaluation of spatial and temporal variations in zooplankton community structure with reference to water quality in Teluk Bahang Reservoir, Malaysia. Trop. Ecol. 2019, 60, 186–198. [Google Scholar] [CrossRef]
  41. Toruan, R.L. Zooplankton diversity in Lake Tondano, Indonesia. IOP Conf. Ser. Earth Environ. Sci. 2021, 744, 012092. [Google Scholar] [CrossRef]
  42. Tang, C.; Yi, Y.; Yang, Z.; Zhou, Y.; Zerizghi, T.; Wang, X.; Duan, P. Planktonic indicators of trophic states for a shallow lake (Baiyangdian Lake, China). Limnologica 2019, 78, 125712. [Google Scholar] [CrossRef]
  43. Makwinja, R.; Mengistou, S.; Kaunda, E.; Alamirew, T. Spatial distribution of zooplankton in response to ecological dynamics in tropical shallow lake: Insight from Lake Malombe, Malawi. J. Freshw. Ecol. 2021, 36, 127–148. [Google Scholar] [CrossRef]
  44. Beyene, G.; Kifle, D.; Fetahi, T. Spatial distribution of zooplankton in relation to some selected physicochemical water quality parameters of Lake Hawassa, Ethiopia. Afr. J. Aquat. Sci. 2022, 47, 163–172. [Google Scholar] [CrossRef]
  45. Macedo, R.L.; Franco, A.C.S.; Klippel, G.; Oliveira, E.F.; Silva, L.H.S.; dos Santos, L.N.; Branco, C.W. Small in size but rather pervasive: The spread of the North American rotifer Kellicottia bostoniensis (Rousselet, 1908) through Neotropical basins. BioInvasions Rec. 2020, 9, 287–302. [Google Scholar] [CrossRef]
  46. Bonecker, C.C.; Diniz, L.P.; Braghin, L.D.S.M.; Mantovano, T.; da Silva, J.V.F.; de Fátima Bomfim, F.; Lansac-Tôha, F.A. Synergistic effects of natural and anthropogenic impacts on zooplankton diversity in a subtropical floodplain: A long-term study. Oecol. Aust. 2020, 24, 524–537. [Google Scholar] [CrossRef]
  47. Espinosa-Rodríguez, C.A.; Sarma, S.S.S.; Nandini, S. Zooplankton community changes in relation to different macrophyte species: Effects of Egeria densa removal. Ecohydrol. Hydrobiol. 2021, 21, 153–163. [Google Scholar] [CrossRef]
  48. Brito, M.T.D.S.; Heino, J.; Pozzobom, U.M.; Landeiro, V.L. Ecological uniqueness and species richness of zooplankton in subtropical floodplain lakes. Aquat. Sci. 2020, 82, 43. [Google Scholar] [CrossRef]
  49. Choi, J.Y.; Kim, S.K. Responses of rotifer community to microhabitat changes caused by summer-concentrated rainfall in a shallow reservoir, South Korea. Diversity 2020, 12, 113. [Google Scholar] [CrossRef]
  50. Coelho, P.N.; Henry, R. Functional groups of microcrustaceans along a horizontal gradient in a neotropical lake colonized by macrophytes. Aquat. Sci. 2021, 83, 3. [Google Scholar] [CrossRef]
  51. Quirino, B.A.; Teixeira de Mello, F.; Deosti, S.; Bonecker, C.C.; Cardozo, A.L.P.; Yofukuji, K.Y.; Fugi, R. Interactions between a planktivorous fish and planktonic microcrustaceans mediated by the biomass of aquatic macrophytes. J. Plankton Res. 2021, 43, 46–60. [Google Scholar] [CrossRef]
  52. Celewicz-Gołdyn, S.; Kuczyńska-Kippen, N. Ecological value of macrophyte cover in creating habitat for microalgae (diatoms) and zooplankton (rotifers and crustaceans) in small field and forest water bodies. PLoS ONE 2017, 12, e0177317. [Google Scholar] [CrossRef] [PubMed]
  53. Moody, E.K.; Wilkinson, G.M. Functional shifts in lake zooplankton communities with hypereutrophication. Freshw. Biol. 2019, 64, 608–616. [Google Scholar] [CrossRef]
  54. Howarth, R.W.; Chan, F.; Swaney, D.P.; Marino, R.M.; Hayn, M. Role of external inputs of nutrients to aquatic ecosystems in determining prevalence of nitrogen vs. phosphorus limitation of net primary productivity. Biogeochemistry 2021, 154, 293–306. [Google Scholar] [CrossRef]
  55. Xiong, W.; Ni, P.; Chen, Y.; Gao, Y.; Li, S.; Zhan, A. Biological consequences of environmental pollution in running water ecosystems: A case study in zooplankton. Environ. Pollut. 2019, 252, 1483–1490. [Google Scholar] [CrossRef] [PubMed]
  56. Qin, H.; Cao, X.; Cui, L.; Lv, Q.; Chen, T. The influence of human interference on zooplankton and fungal diversity in Poyang Lake watershed in China. Diversity 2020, 12, 296. [Google Scholar] [CrossRef]
  57. Li, Y.; Chen, F. Are zooplankton useful indicators of water quality in subtropical lakes with high human impacts? Ecol. Indic. 2020, 113, 106167. [Google Scholar] [CrossRef]
  58. Doubek, J.P.; Campbell, K.L.; Doubek, K.M.; Hamre, K.D.; Lofton, M.E.; McClure, R.P.; Carey, C.C. The effects of hypolimnetic anoxia on the diel vertical migration of freshwater crustacean zooplankton. Ecosphere 2018, 9, e02332. [Google Scholar] [CrossRef]
  59. Keister, J.E.; Winans, A.K.; Herrmann, B. Zooplankton community response to seasonal hypoxia: A test of three hypotheses. Diversity 2020, 12, 21. [Google Scholar] [CrossRef]
  60. Walczyńska, A.; Sobczyk, M. Experimental evolution shows body size decrease in response to hypoxia, with a complex effect on plastic size response to temperature. Biol. Bull. 2022, 243, 272–281. [Google Scholar] [CrossRef] [PubMed]
  61. Lee, A.K.; Wei, J.H.; Welander, P.V. De novo cholesterol biosynthesis in the bacterial domain. bioRxiv 2022. [Google Scholar] [CrossRef]
  62. Mohd-Asharuddin, S.; Zayadi, N.; Rasit, W.; Othman, N. Water quality characteristics of Sembrong Dam Reservoir, Johor, Malaysia. IOP Conf. Ser. Mater. Sci. Eng. 2016, 136, 012058. [Google Scholar] [CrossRef]
  63. Hashim, S.I.N.S.; Talib, S.H.A.; Abustan, M.S. Nutrient correlation analysis between sediment and water at Sembrong Dam, Johor. Int. J. Adv. Eng. Technol. 2020, 11, 986–993. [Google Scholar]
  64. Zhang, S.; Lu, W.; Zhou, Z.; Chen, W. Spatial differences in zooplankton community structure between two fluvial lakes in the middle and lower reaches of the Yangtze River: Effects of land use patterns and physicochemical factors. Diversity 2022, 14, 908. [Google Scholar] [CrossRef]
  65. Sharip, Z.; Mohamad, M.F. Microbial contamination in urban tropical lentic waterbodies and ponds along urbanisation gradient. J. Trop. Agric. 2019, 42, 165–184. [Google Scholar]
  66. Krupa, E.; Romanova, S.; Berkinbaev, G.; Yakovleva, N.; Sadvakasov, E. Zooplankton as indicator of the ecological state of protected aquatic ecosystems (Lake Borovoe, Burabay National Nature Park, Northern Kazakhstan). Water 2020, 12, 2580. [Google Scholar] [CrossRef]
  67. Hamil, S.; Bouchelouche, D.; Arab, S.; Alili, M.; Baha, M.; Arab, A. The relationship between zooplankton community and environmental factors of Ghrib Dam in Algeria. Environ. Sci. Pollut. Res. 2021, 28, 46592–46602. [Google Scholar] [CrossRef]
  68. Bera, D.B. Using zooplankton community to assess water quality and trophic condition of Lake Saheb Bandh, Purulia, West Bengal, India. Int. J. Aquatic Sci. 2021, 12, 4471–4498. [Google Scholar]
  69. Apaydın Yağcı, M.; Yılmaz, M.; Akkan, T.; Yazıcıoğlu, O.; Yazıcı, R.; Yağcı, A.; Gülsoy, S. Structure of the zooplankton community in Sıddıklı Küçükboğaz Dam Lake, Türkiye: The importance of environmental factors. Iran. J. Sci. 2023, 47, 719–732. [Google Scholar] [CrossRef]
  70. Guermazi, W.; El-khateeb, M.; Abu-Dalo, M.; Sallemi, I.; Al-Rahahleh, B.; Rekik, A.; Annabi-Trabelsi, N. Assessment of the zooplankton community and water quality in an artificial freshwater lake from a semi-arid area (Irbid, Jordan). Water 2023, 15, 2796. [Google Scholar] [CrossRef]
  71. Meremo, W.T.; Reuben, O.; Wamalwa, Y.A.; Ndegwa, D.M. Changes in water quality parameters and their effect on zooplankton distribution in a shallow bay of Lake Victoria, Kenya. Int. J. Fish. Aquat. 2022, 10, 206–212. [Google Scholar] [CrossRef]
  72. Nieman, C.L.; Gray, S.M. Visual performance impaired by elevated sedimentary and algal turbidity in walleye Sander vitreus and emerald shiner Notropis atherinoides. J. Fish Biol. 2019, 95, 186–199. [Google Scholar] [CrossRef] [PubMed]
  73. García-Chicote, J.; Armengol, X.; Rojo, C. Zooplankton species as indicators of trophic state in reservoirs from Mediterranean river basins. Inland Waters 2019, 9, 113–123. [Google Scholar] [CrossRef]
  74. Rosińska, J.; Romanowicz-Brzozowska, W.; Kozak, A.; Gołdyn, R. Zooplankton changes during bottom-up and top-down control due to sustainable restoration in a shallow urban lake. Environ. Sci. Pollut. Res. 2019, 26, 19575–19587. [Google Scholar] [CrossRef]
  75. Liang, D.; Wang, Q.; Wei, N.; Tang, C.; Sun, X.; Yang, Y. Biological indicators of ecological quality in typical urban river-lake ecosystems: The planktonic rotifer community and its response to environmental factors. Ecol. Indic. 2020, 112, 106127. [Google Scholar] [CrossRef]
  76. Kim, S.K.; Yun, J.H.; Joo, G.J.; Choi, J.Y. Hydrological characteristics and trophic status as dominant drivers of rotifer community composition in artificially created riverine wetlands. Animals 2022, 12, 461. [Google Scholar] [CrossRef]
  77. Kumari, S.; Lianthuamluaia, L.; Sarkar, U.K.; Puthiyottil, M.; Karnatak, G.; Meena, D.K.; Das, B.K. Environmental characterization of two ecologically distinct Gangetic oxbow lakes using zooplankton taxonomic indices through comparative approach for wetland monitoring. Wetlands 2023, 43, 14. [Google Scholar] [CrossRef]
  78. Zhang, H.; Hollander, J.; Hansson, L.A. Bi-directional plasticity: Rotifer prey adjust spine length to different predator regimes. Sci. Rep. 2017, 7, 10254. [Google Scholar] [CrossRef] [PubMed]
  79. Nandini, S.; Sarma, S.S.S. Experimental studies on zooplankton-toxic cyanobacteria interactions: A Review. Toxics 2023, 11, 176. [Google Scholar] [CrossRef] [PubMed]
  80. Gu, L.; Qin, S.; Zhu, S.; Lu, N.; Sun, Y.; Zhang, L.; Yang, Z. Microcystis aeruginosa affects the inducible anti-predator responses of Ceriodaphnia cornuta. Environ. Pollut. 2020, 259, 113952. [Google Scholar] [CrossRef] [PubMed]
  81. Vilar, M.C.P.; da Costa Pena Rodrigues, T.F.; da Silva Ferrão-Filho, A.; de Oliveira e Azevedo, S.M.F. Grazer-induced chemical defense in a microcystin-producing Microcystis aeruginosa (Cyanobacteria) exposed to Daphnia gessneri infochemicals. J. Chem. Ecol. 2021, 47, 847–858. [Google Scholar] [CrossRef] [PubMed]
  82. Gerasimova, T.N.; Pogozhev, P.I.; Sadchikov, A.P. Suppression of cyanobacterial blooms by zooplankton: Experiments in natural water bodies with the use of flow-through ecosystems. Russ. J. Gen. Chem. 2019, 89, 2840–2844. [Google Scholar] [CrossRef]
  83. Ferrão-Filho, A.D.S.; da Silva, D.A.C. Saxitoxin-producing Raphidiopsis raciborskii (cyanobacteria) inhibits swimming and physiological parameters in Daphnia similis. Sci. Total Environ. 2020, 706, 135751. [Google Scholar] [CrossRef] [PubMed]
  84. Krztoń, W.; Kosiba, J.; Wilk-Woźniak, E. Features that matter: Studying how phytoplankton drives zooplankton community functional traits. Hydrobiologia 2022, 849, 2647–2662. [Google Scholar] [CrossRef]
  85. Das Candeias, D.A.; Moi, D.A.; Simões, N.R.; Azevedo, F.; Meerhoff, M.; Bonecker, C.C. High temperature, predation, nutrient, and food quality drive dominance of small-sized zooplankton in Neotropical lakes. Aquat. Sci. 2022, 84, 49. [Google Scholar] [CrossRef]
  86. Picapedra, P.H.S.; Fernandes, C.; Baumgartner, G.; Sanches, P.V. Zooplankton communities and their relationship with water quality in eight reservoirs from the midwestern and southeastern regions of Brazil. Braz. J. Biol. 2020, 81, 701–713. [Google Scholar] [CrossRef]
  87. Valencia-Vargas, M.A.; Nandini, S.; Sarma, S.S.S. Demographic characteristics of two freshwater cyclopoid copepods in Mexico, fed a plankton diet: The native Mesocyclops longisetus Thiébaud and the invasive Mesocyclops pehpeinsis Hu. Inland Waters 2020, 10, 128–136. [Google Scholar] [CrossRef]
  88. Ismail, A.H.; Abd Rahman, A.; Chin, L.C. The use of GIS to visualize spatial distribution of zooplankton in Teluk Bahang Reservoir, Penang, Malaysia. J. Environ. Sci. Manag. 2020, 23, 60–71. [Google Scholar] [CrossRef]
  89. Fajardo, L.J.; Lebeng, R.S.; Morales, M.L.; Reyes, A.T. Plankton abundance and diversity in Pantabangan Reservoir, Pantabangan, Nueva Ecija, Philippines. AACL Bioflux 2022, 15, 1541–1552. [Google Scholar]
  90. Kottage, C.D.; Patrick, A.E.S. Hydro-climatic consequences on zooplankton diversity and abundance in perennial Vavuniya reservoir and seasonal Thandikulam reservoir in Vavuniya, Sri Lanka. J. Basic Appl. Zool. 2023, 84, 7. [Google Scholar] [CrossRef]
  91. Ebesi, E.J.; Mohammed, Y.M.; Iloba, K.I.; Adamu, K.M.; Adama, S.B. Zooplankton community structure of a tropical lake in a Northcentral State, Nigeria. Ruhuna J. Sci. 2022, 13, 217–230. [Google Scholar] [CrossRef]
Figure 1. Map of Peninsular Malaysia and location of sampling sites.
Arthropoda 02 00003 g001
Figure 2. Shade plot of variations of zooplankton species’ densities (ind. L−1) in the sampling sites. White spaces denote the absence of the species in that specific site; the depth of the color scale is linearly proportional to a fourth-root transformation of density.
Arthropoda 02 00003 g002
Figure 3. Bi-plots of the canonical correspondence analysis (CCA) for zooplankton species and physical and chemical parameters showing the distribution of zooplankton species in relation to environmental conditions in different sites (a = natural lakes; b = artificial lakes). DO = dissolved oxygen, W. transparency = water transparency, TN = total nitrogen, TP = total phosphorus, Chl a = chlorophyll a.
Arthropoda 02 00003 g003
Table 1. Description of the sampling sites.
No.SitesCoordinateSite DescriptionsSurface Area and DepthCatchment AreaRole
Natural ecosystem
Natural lakes/swamps
S1.Bera Lake, Pahang3.1325N, 102.6056E
  • Bera Lake is the largest natural lake in Malaysia;
  • Major aquatic plants: Pandanus helicopus and Lepironia articulata;
  • Trophic status: Eutrophic (CTSI = 53.6).
Surface area: 5400 ha
Depth: 3.5 m
Agricultural sites, logging, iron ore mining, rubber plantations, palm oil plantations, and villages.Flood mitigation (natural wetland ecosystem due to its presence that can decrease the velocity, frequency, and level of floods) and recreational site (fishing, camping, boating).
S2.Chini Lake, Pahang3.4351N, 102.9185E
  • Chini Lake is the second-largest natural lake in Malaysia;
  • Major aquatic plants: Nelumbo nucifera, Pandanus helicopus, and Lepironia articulata;
  • Trophic status: Eutrophic (CTSI = 54.5).
Surface area: 200 ha
Depth: 2.7 m
Agricultural sites, logging, iron ore mining, rubber plantations, and palm oil plantations.Flood mitigation (natural wetland ecosystem due to its presence that can decrease the velocity, frequency, and level of floods) and recreational site (fishing, camping, boating).
S3. & S4.Swamps in Selangor2.8599N 101.6214E
2.8591N 101.6262E
  • These swamps are in Paya Indah Wetland Reserve, Dengkil, Selangor;
  • Major aquatic plants: Nelumbo nucifera, Eleocharis dulcis, Eleocharis dulcis and Lepironia articulata;
  • Trophic status: S3—Eutrophic (CTSI = 56.3); S4—Eutrophic (CTSI = 57.6).
Surface area: 10 ha
Depth: 0.5 m
Forest and tourist activities.Natural wetland ecosystem due to its presence that can decrease the velocity, frequency, and level of floods. Recreational site (camping, jungle tracking, cycling, picnic).
Artificial ecosystem
Reservoirs
S5.Chenderoh Lake, Perak4.9696N 100.9578E
  • Chenderoh Reservoir is located at the tributary of Perak River;
  • Major aquatic plants: Hydrilla verticillate, Ceratophyllum demersum, Nelumbo nucifera, and Pandanus helicopus;
  • Trophic status: Eutrophic (CTSI = 57.4).
Surface area: 2500 ha
Depth: 4.8 m
Agricultural sites.Hydroelectric power plant, flood mitigation, water supply, tourism.
S6.Timah Tasoh Lake, Perlis6.5875N 100.2286E
  • Its name was derived from the two rivers that flow into the lake—Timah River and Tasoh River;
  • Trophic status: Eutrophic (CTSI = 60.4).
Surface area: 1333 ha
Depth: 3.5 m
Agricultural activities, recreational site, villages, and mountains.Flood mitigation, water supply, irrigation, and tourism.
S7.Kenyir Lake, Terengganu5.1394N 102.7904E
  • It is the largest man-made lake in Southeast Asia, created in 1985 by the damming of the Kenyir River;
  • Trophic status: Eutrophic (CTSI = 58.2).
Surface area: 36,900 ha
Depth: 75 m
Forest and recreational sites.Hydroelectric power plant, flood mitigation, water supply, and tourism.
S8.Sembrong Lake, Johor1.9845N 103.1919E
  • The major tributaries flowing into this lake were from the Sembrong and Marpo rivers. Surface area: 850 ha;
  • Aquatic plants: Eichhornia crassipes;
  • Trophic status: Hypereutrophic (CTSI = 76.1).
Surface area: 850 ha
Depth: 5.1 m
Agricultural sites, husbandry areas, and villages.Flood mitigation and water supply.
Constructed lakes\ponds
S9.Putrajaya Lake, W.P. Putrajaya2.9494N 101.6936E
  • This lake was created in 1997 when dams were laid across the Chuau and Bisa rivers. Located at the Federal Government Administrative left of Malaysia;
  • Trophic status: Eutrophic (CTSI = 56.5).
Surface area: 400 ha
Depth: 6.6 m
Administrative and residential area.Tourism and recreational water sports.
S10.Sri Serdang Pond, Selangor3.0042N 101.7138E
  • Located at Taman Sri Serdang, Seri Kembangan, Selangor. The lake is connected to the end of the Anak Kuyoh river. The Anak Kuyoh river is a tributary of the main Kuyoh River;
  • Surface area: 1.8 ha;
  • Major aquatic plant: Eichhornia crassipes;
  • Trophic status: Hypereutrophic (CTSI = 90.8).
Surface area: 1.8 ha
Depth: 2.7 m
Residential area, commercial area, and restaurants.Recreational sites (jogging, cycling).
S11.UPM Pond, Selangor2.9874N 101.7127E
  • Located within the Universiti Putra Malaysia (UPM);
  • Major aquatic plant: Eichhornia crassipes;
  • Trophic status: Hypereutrophic (CTSI = 75.8).
Surface area: 1.0 ha
Depth: 1.5 m
Institution buildings and forest.Recreational sites (jogging, picnic).
S12.Cempaka Lake, Selangor2.9600N 101.7591E
  • It is located in an Urban Park in Bangi, Selangor;
  • The lake originated from a small river called Ayer Hitam river. The lake is connected with Sungai Langat through Sg. Ramal, which is a shallow river that runs through the Kajang and Bangi areas;
  • Trophic status: Hypereutrophic (CTSI = 76.1).
Surface area: 6.4 ha
Depth: 3.2 m
Residential area, commercial area, and restaurants.Recreational activities, jogging, and cycling.
Old mining lakes
S13.Puchong Lake, Selangor2.9541N 101.6094E
  • Located near the South Klang Valley Expressway (SKVE) and near a newly developing property area;
  • Trophic status: Eutrophic (CTSI = 67.9).
Surface area: 6.4 ha
Depth: 3.2 m
Residential area.Recreational site and fishing.
S14.The Mines Lake, Selangor3.0341N 101.7127E
  • Located near the Sungai Besi Highway, northeast of Seri Kembangan, Selangor; Trophic status: Eutrophic (CTSI = 64.3).
Surface area: 62.1 ha
Depth: 100 m
Commercial area and residential area.Tourism and recreational site.
S15.Biru Kundang Lake, Selangor3.2516N 101.5251E
  • Located at Kampung Melayu Sri Kundang, which is located in the subdistrict of Rawang, Selangor;
  • Trophic status: Eutrophic (CTSI = 68.8).
Surface area: 32 ha
Depth: 5.2 m
Residential area.Recreational site.
S16.Taiping Lake, Perak4.8526N 100.7464E
  • Located in the first public garden in Malaysia. Situated near Bukit Larut, Perak;
  • Trophic status: Eutrophic (CTSI = 56.45).
Surface area: 64 ha
Depth: 4.0 m m
Garden and residential area.Tourism and recreational site.
Table 2. Mean densities (ind. L−1) and percentages (%) of zooplankton species in natural (n = 4) and artificial (n = 3 × 4 = 12) ecosystems.
FamilySpeciesNatural EcosystemArtificial Ecosystem
Natural Shallow SwampsReservoirsConstructed LakesOld Mining Lakes
Mean Densities%Mean Densities%Mean Densities%Mean Densities%
Cladocerans
BosminidaeBosmina fatalis0.0 ± 0.00.06.7 ± 1.32.226.1 ± 3.87.11.6 ± 0.50.7
Bosminopsis africanus5.5 ± 2.72.871.2 ± 28.823.10.7 ± 0.20.20.0 ± 0.00.0
ChydoridaeAnthalona harti harti7.8 ± 1.33.91.1 ± 0.60.40.9 ± 0.40.26.8 ± 1.22.8
Chydorus ventricosus30.0 ± 7.915.00.0 ± 0.00.00.0 ± 0.00.00.0 ± 0.00.0
DaphniidaeCeriodaphnia cornuta2.9 ± 1.2 1.532.1 ± 14.210.454.9 ± 11.215.01.6 ± 0.10.7
Simocephalus serrulatus2.4 ± 0.31.21.1 ± 0.10.40.8 ± 0.30.20.1 ± 0.00.0
IlyocryptidaeIlyocryptus spinifer3.7 ± 0.91.91.2 ± 0.90.40.0 ± 0.00.00.0 ± 0.00.0
MacrothricidaeMacrothrix spinosa6.6 ± 3.23.40.6 ± 0.30.20.0 ± 0.00.01.9 ± 0.30.8
Macrothrix triserialis0.0 ± 0.00.03.3 ± 1.21.12.5 ± 0.90.70.0 ± 0.00.0
MoinidaeMoina micrura2.5 ± 1.01.30.0 ± 0.00.00.1 ± 0.00.00.0 ± 0.00.0
SididaeDiaphanosoma excisum4.8 ± 0.92.41.2 ± 0.20.41.6 ± 2.30.40.0 ± 0.00.0
Diaphanosoma sarsi0.2 ± 0.10.11.6 ± 0.60.53.2 ± 1.20.90.0 ± 0.00.0
Subtotal53.2 ± 12.727.0120.1 ± 23.238.985.1 ± 17.923.211.9 ± 3.24.9
Copepods
Copepodites 3.2 ± 0.21.63.7 ± 0.11.27.8 ± 0.22.12.4 ± 0.01.0
Nauplii 2.4 ± 0.01.219.6 ± 5.06.328.0 ± 3.77.73.7 ± 0.91.5
CyclopidaeEucyclops taiwanensis2.8 ± 1.51.40.0 ± 0.00.00.0 ± 0.00.00.0 ± 0.00.0
Mesocyclop affinis1.2 ± 0.60.60.0 ± 0.00.00.0 ± 0.00.00.0 ± 0.00.0
Mesocyclops francisci1.2 ± 0.6 0.60.0 ± 0.00.00.0 ± 0.00.00.0 ± 0.00.0
Mesocyclos ogunnus1.6 ± 0.50.81.2 ± 0.30.40.0 ± 0.00.00.0 ± 0.00.0
Mesocyclos thermocyclopoides0.0 ± 0.00.016.6 ± 2.35.426.6 ± 2.77.32.6 ± 0.91.1
Microcyclops pachyspina12.5 ± 5.26.20.9 ± 0.10.30.6 ± 0.00.20.3 ± 0.00.1
Microcyclops sumatranus0.6 ± 0.10.30.0 ± 0.00.00.0 ± 0.00.00.0 ± 0.00.0
Thermocyclop crassus5.5 ± 2.72.73.7 ± 1.11.212.4 ± 1.73.40.0 ± 0.00.0
Thermocyclops decipiens0.2 ± 0.00.10.2 ± 0.00.10.0 ± 0.00.00.0 ± 0.00.0
DiaptomidaeMongolodiaptomus malaindosinensis3.7 ± 0.81.83.8 ± 0.51.212.7 ± 3.93.58.7 ± 1.03.6
Subtotal34.7 ± 5.717.349.5 ± 5.716.088.1 ± 16.724.114.0 ± 3.97.3
Rotifers
AdinetidaeAdineta ricciae1.7 ± 0.70.85.5 ± 1.21.80.6 ± 0.30.20.0 ± 0.00.0
AsplanchanidaeAsplanchna priodonta0.2 ± 0.10.10.7 ± 0.10.25.7 ± 0.51.60.5 ± 0.20.2
BrachionidaeAnuraeopsis fissa2.4 ± 1.11.21.3 ± 0.40.42.0 ± 0.30.50.6 ± 0.10.2
Brachionus angularis0.0 ± 0.00.00.7 ± 0.20.22.0 ± 0.10.52.6 ± 0.51.1
Brachionus caudatus0.0 ± 0.00.00.2 ± 0.10.13.2 ± 0.20.91.4 ± 0.50.6
Brachionus calyciflorus0.6 ± 0.10.30.3 ± 0.10.124.4 ± 5.26.70.1 ± 0.00.0
Brachionus donneri0.0 ± 0.00.00.0 ± 0.00.00.7 ± 0.10.20.1 ± 0.10.0
Brachionus falcatus3.1 ± 0.81.512.4 ± 0.94.014.9 ± 3.54.10.0 ± 0.00.0
Brachionus forficula1.9 ± 1.20.99.2 ± 1.53.05.1 ± 1.2 1.40.0 ± 0.00.0
Brachionus patulus0.0 ± 0.00.00.0 ± 0.00.00.1 ± 0.10.00.0 ± 0.00.0
Brachionus quadridentatus0.0 ± 0.00.01.1 ± 0.20.40.8 ± 0.40.20.6 ± 0.30.2
Brachionus sericus0.0 ± 0.00.07.1 ± 0.92.30.0 ± 0.00.00.0 ± 0.00.0
Keratella cochlearis16.8 ± 7.28.526.5 ± 5.28.632.3 ± 4.28.81.9 ± 0.40.8
Keratella tecta2.5 ± 0.91.21.9 ± 0.60.60.6 ± 0.20.20.9 ± 0.20.4
Keratella tropica0.7 ± 0.20.312.9 ± 1.74.20.5 ± 0.30.10.5 ± 0.30.2
Lepadella ovalis0.9 ± 0.10.40.0 ± 0.00.00.2 ± 0.10.10.0 ± 0.00.0
FilinidaeFilinia camasecla0.0 ± 0.00.00.1 ± 0.00.00.3 ± 0.10.10.0 ± 0.00.0
Filinia longiseta0.0 ± 0.00.00.1 ± 0.10.00.5 ± 0.20.10.0 ± 0.00.0
Filinia opoliensis1.2 ± 0.50.61.6 ± 0.40.516.9 ± 2.34.61.3 ± 0.10.5
Filinia terminalis3.7 ± 1.31.81.2 ± 0.20.40.0 ± 0.00.00.5 ± 0.20.2
FlosculariidaePtygura libera3.1 ± 0.41.525.1 ± 7.28.130.8 ± 5.28.496.7 ± 11.239.7
GastropodidaeAscomorpha ecaudis5.6 ± 1.92.80.8 ± 0.20.30.5 ± 0.20.10.0 ± 0.00.0
Gastropus stylifer0.0 ± 0.00.00.0 ± 0.00.00.1 ± 0.00.00.0 ± 0.00.0
HexarthridaeHexathra mira11.4 ± 6.25.75.2 ± 1.11.721.0 ± 1.05.71.3 ± 0.10.5
LecanidaeLecane bulla2.5 ± 0.31.20.3 ± 0.10.10.1 ± 0.00.00.3 ± 0.10.1
Lecane curvicornis1.2 ± 0.50.60.3 ± 0.10.10.0 ± 0.00.00.0 ± 0.00.0
Monostyla bulla0.0 ± 0.00.01.0 ± 0.20.30.5 ± 0.30.10.3 ± 0.10.1
MytillinidaeLophocharis curvata0.0 ± 0.00.00.0 ± 0.00.00.4 ± 0.20.194.4 ± 8.438.8
Mytillina0.1 ± 0.00.00.0 ± 0.00.00.1 ± 0.00.00.0 ± 0.00.0
SynchaetidaePolyarthra vulgaris30.3 ± 6.215.16.6 ± 1.62.117.6 ± 1.74.82.2 ± 0.70.9
TestudinellidaePompholyx complanata4.4 ± 1.02.25.8 ± 1.21.92.5 ± 0.90.70.0 ± 0.00.0
Pompholyx sulcata0.0 ± 0.00.00.0 ± 0.00.00.0 ± 0.00.00.0 ± 0.00.0
TrichocercidaeTrichocerca similis2.5 ± 1.11.27.7 ± 0.42.57.3 ± 1.22.04.6 ± 1.21.9
Trichocerca elongata0.3 ± 0.00.00.0 ± 0.00.00.2 ± 0.10.15.6 ± 1.32.3
Trichocerca pusilla1.8 ± 0.20.90.3 ± 0.10.10.0 ± 0.00.00.0 ± 0.00.0
Trichocerca cylindrica0.9 ± 0.10.43.3 ± 0.31.10.7 ± 0.30.20.9 ± 0.40.4
Subtotal112.6 ± 28.356.2139.2 ± 26.345.1192.5 ± 37.952.6217.5 ± 42.987.8
Grand total200.5 ± 25.5100308.8 ± 34.9100365.7 ± 13.7100243.4 ± 28.5100
Total number of species41 43 43 29
Shannon–Wiener diversity index (H’)2.2 ± 0.0 1.9 ± 0.1 1.7 ± 0.1 1.5 ± 0.1
Table 3. Environmental parameters and nutrient concentrations (Mean ± SE) at the study sites. Means with different superscripts are significantly different, p < 0.05.
Temperature, °CpHDO, mg L−1Turbidity, NTUTP, mg L−1TN, mg L−1Chl a, µg L−1W. Transp., m
Natural ecosystem
Shallow swamps
Chini Lake29.68 ± 0.47 d6.46 ± 0.39 d4.58 ± 0.46 e16.80 ± 7.21 h0.04 ± 0.02 e0.20 ± 0.01 f3.88 ± 0.90 p1.06 ± 0.10 de
Bera Lake29.00 ± 0.53 g5.80 ± 0.71 e4.70 ± 1.0 e15.60 ± 3.8 k0.03 ± 0.02 e0.30 ±0.01 f5.72 ± 1.25 o1.10 ± 0.20 b
Swamp S327.68 ± 1.2 k4.87 ± 0.5 f1.97 ± 0.25 h17.29 ± 5.16 g0.05 ± 0.01 e0.27 ± 0.01 f11.15 ± 2.30 j0.95 ± 0.05 cd
Swamp S428.60 ± 0.97 i5.67 ± 0.25 e2.30 ± 0.30 g14.82 ± 6.29 l0.06 ± 0.02 e0.24 ± 0.01 f10.63 ± 4.28 k0.92 ± 0.01 de
Artificial ecosystem
Reservoirs
Chenderoh Reservoir29.90 ±0.90 c7.76 ± 1.30 a7.40 ± 1.7 b20.10 ± 3.52 f0.05 ± 0.01 e2.05 ± 0.10 b9.70 ± 1.95 l0.95 ± 0.01 cd
Timah Tasoh Reservoir28.53 ± 1.2 i6.61 ± 0.95 d7.50 ± 0.50 b16.16 ± 2.77 i0.03 ± 0.01 e0.20 ± 0.05 f12.50 ± 2.85 i0.90 ± 0.00 de
Kenyir Reservoir29.56 ± 1.23 e7.21 ± 1.1 b7.38 ± 0.92 b14.40 ± 1.22 m0.10 ± 0.01 d 0.20 ± 0.01 f8.70 ± 1.07 n1.70 ± 0.01 a
Sembrong Reservoir29.70 ± 0.31 d7.80 ± 0.22 a5.27 ± 0.4 c28.40 ± 2.90 d0.14 ± 0.01 cde2.26 ± 0.33 a97.18 ± 4.70 a0.30 ± 0.01 g
Constructed lakes
Putrajaya Lake30.53 ± 0.22 a6.81 ± 0.28 c 7.50 ± 0.37 b23.16 ± 0.75 e0.03 ± 0.00 e0.17 ± 0.28 f15.53 ± 0.65 h1.06 ± 0.02 bc
Sri Serdang Pond28.34 ± 0.2 j6.84 ± 0.22 c0.74 ± 0.30 i39.94 ± 5.02 b0.69 ± 0.10 a0.20 ± 0.09 f95.00 ± 17.9 b0.25 ± 0.02 g
UPM Pond29.12 ± 0.95 g7.23 ± 1.22 b4.93 ± 0.5 d29.94 ± 7.35 c0.10 ± 0.0 de1.00 ± 0.01 e44.70 ±7.23 d0.85 ± 0.05 de
Cempaka Lake28.82 ± 0.57 h6.60 ± 2.30 d4.94 ± 0.92 d42.00 ± 8.55 a0.52 ± 0.02 b1.24 ± 0.01 d48.00 ± 8.92 c0.35 ± 0.01 g
Old mining lakes
SKVE Lake28.48 ± 0.15 i7.10 ± 0.25 b2.59 ± 0.28 f17.30 ± 1.13 g0.20 ± 0.03 cd1.85 ± 0.13 c16.50 ± 0.14 f0.65 ± 0.10 f
The Mines Lake29.30 ± 0.29 f7.22 ± 0.28 b0.91 ± 0.17 h12.74 ± 0.11 o0.22 ± 0.07 cd1.72 ± 0.22 c16.11 ± 2.11 g1.58 ± 0.05 a
Biru Kundang Lake28.53 ± 0.75 i5.70 ± 0.57 e8.40 ± 1.20 a15.84 ± 2.48 j0.26 ± 0.01 c1.26 ± 0.05 d18.00 ± 3.6 e0.80 ± 0.02 e
Taiping Lake30.32 ± 1.20 b6.81 ± 1.23 c7.50 ± 0.9 b13.16 ± 3.02 n0.03 ± 0.00 e0.20 ± 0.00 f9.50 ± 2.08 m0.80 ± 0.03 e
Table 4. Overall correlation metrics (non-parametric Spearman’s rank order correlation) for environmental parameters and zooplankton species at the study sites. DO = dissolved oxygen, W. transparency = water transparency, TN = total nitrogen, TP = total phosphorus. * (p < 0.05); ** (p < 0.01).
pHTemperatureDOTurbidityTPTNChlorophyll aW. Transparency
Temperature0.360
Dissolved oxygen (DO)−0.1610.445 *
Turbidity0.171−0.0900.113
Total phosphorus (TP)0.129−0.354−0.263−0.017
Total nitrogen (TN)0.490*0.0900.3250.4140.249
Chlorophyll a0.401−0.1340.2400.663 **0.3520.676 **
Water transparency0.0470.4210.101−0.697 **−0.129−0.200−0.512 *
Diversity−0.115−0.362−0.2810.244−0.107−0.1210.217−0.262
Density0.086−0.0090.3570.496 *0.3710.457 *0.571 **−0.487 *
Cladocera0.0630.1570.2070.490 *−0.040−0.0310.182−0.296
Copepoda−0.1650.0280.1930.0830.068−0.2440.045−0.172
Rotifera0.0970.0600.2240.2360.152−0.1440.270−0.292
Ceriodaphnia cornuta0.1810.1270.2720.597 *0.438 *0.529 *0.543 *−0.303
Polyarthra vulgaris−0.3630.026−0.143−0.189−0.522 *−0.669 **−0.666 **−0.047
Keratella cochlearis0.3220.3800.4070.540 *0.0750.506 *0.526 *−0.114
Trichocerca similis0.232−0.211−0.1060.735 **0.426 *0.2910.752 **−0.643 **
Brachionus calyciflorus0.368−0.078−0.1340.713 **0.2760.2500.714 **−0.472 *
Brachionus falcatus0.308−0.340−0.0570.708 **0.1080.2000.421−0.632 **
Thermocyclops crassus0.203−0.0440.1260.641 **0.0390.1930.397−0.529 *
Table 5. Spearman’s rank correlations (ρ) obtained by BIO-ENV analysis, showing the contributions of different variables in shaping the zooplankton community structure.
Global Rho (ρ) = 0.508; p = 0.1%
No. VariablesCorrelation (ρ)Selections
10.334Chlorophyll a
20.456Chlorophyll a, total nitrogen
30.508Chlorophyll a, turbidity, total nitrogen
40.454Chlorophyll a, turbidity, total nitrogen, temperature
50.437Chlorophyll a, total nitrogen, temperature, pH, turbidity
Disclaimer/Publisher’s Note: The statements, opinions and data contained in all publications are solely those of the individual author(s) and contributor(s) and not of MDPI and/or the editor(s). MDPI and/or the editor(s) disclaim responsibility for any injury to people or property resulting from any ideas, methods, instructions or products referred to in the content.

