Article

Unveiling the Role of Concanavalin A in a Rodent Model of Chemical-Induced Hepatocellular Carcinoma: A Promising Guide in Understanding Liver Cancer Development

1
Department of Pathology, Faculty of Veterinary Medicine, University of Agricultural Sciences and Veterinary Medicine of Cluj-Napoca, Calea Manaștur, 400372 Cluj-Napoca, Romania
2
Nanomedicine Department, Regional Institute of Gastroenterology and Hepatology “Octavian Fodor”, 400162 Cluj-Napoca, Romania
3
Department of Physiology, University of Medicine and Pharmacy, “Iuliu Hatieganu”, 400006 Cluj-Napoca, Romania
4
3-rd Surgery Clinic, University of Medicine and Pharmacy, 400162 Cluj-Napoca, Romania
*
Author to whom correspondence should be addressed.
Targets 2024, 2(1), 52-63; https://doi.org/10.3390/targets2010003
Submission received: 23 December 2023 / Revised: 11 February 2024 / Accepted: 12 February 2024 / Published: 16 February 2024
(This article belongs to the Special Issue Fluorescence Imaging of Disease Biomarkers)

Abstract

:
Hepatocellular carcinoma is a pressing global health issue, ranking as the third leading cause of cancer-related mortality in humans. Chronic liver diseases, such as hepatitis B and C infections and cirrhosis, are often associated with hepatocellular carcinoma, necessitating ongoing research for improved diagnostic and therapeutic strategies. Animal models, including both spontaneous and chemically induced models like diethylnitrosamine, play a pivotal role in understanding hepatocellular carcinoma mechanisms. Metabolic alterations in tumoral hepatocytes contribute significantly to cancer initiation and progression, impacting energy metabolism and cell survival. Lectins, specifically Concanavalin A, provide valuable insights into altered glycosylation patterns in cancer cells. This study employs lectin histochemistry to assess hepatic alterations in Concanavalin A expression in a murine model of diethylnitrosamine-induced hepatocellular carcinoma. Utilizing confocal laser scanning microscopy, our study unveils notable changes in Concanavalin A subcellular localization and intensity distribution in hepatocellular carcinoma compared with healthy liver tissue. A significant increase in the Concanavalin A labeling within the tumoral cells and a shifting of the expression within the perinuclear space is observed. These findings offer valuable insights into molecular changes in hepatocellular carcinoma, providing potential avenues for diagnostic and therapeutic advancements.

1. Introduction

Hepatocellular carcinoma (HCC) is the most common type of primary liver cancer in humans and animals [1,2] and it is a significant public health concern; in human beings, it is the third most common cause of cancer death (9.2%) [3]. HCC is often associated with chronic liver diseases, most notably chronic hepatitis induced by Orthohepadnavirus and Flaviviridae viruses (hepatitis B and C viruses) infections, as well as cirrhosis. Ongoing research into developing new therapies and improving diagnostic methods is essential to address this significant health challenge. Animal models play a crucial role in studying the mechanisms of hepatocellular carcinoma and testing potential therapies [4]. The animal models of HCC currently employ both spontaneous models (e.g., canine model) or, more often, chemically induced rodent models such as the thioacetamide (TAA) or diethylnitrosamine (DEN) models [5]. Administering the genotoxic carcinogen DEN via parenteral or oral routes induces in sequential order severe acute hepatocellular damage (including hepatocellular degeneration and acute centrilobular to bridging necrosis with neutrophilic infiltration), followed by long-term hyperplastic (e.g., bile duct proliferation, fibrosis) and dysplastic responses, ultimately culminating with neoplastic hepatocellular transformation [6,7]. HCC is often associated with various metabolic alterations of the hepatocytes that contribute to the progression and survival of cancer cells. These metabolic changes are characterized by shifts in energy production, nutrient utilization, and cell-signaling pathways [8]. Tumoral cells of HCC often exhibit increased aerobic glycolysis (the Warburg effect) [9,10], including the upregulation of glucose transporters and enzymes involved in glycolysis [11], glutaminolysis [12], dysregulated lipid metabolism (increased lipogenesis and altered fatty acid oxidation) [13], and impaired oxidative phosphorylation (including increased production of reactive oxygen species/ROS). All these metabolic changes impact cell energy metabolism and survival, contributing to cancer initiation and progression [14]. Lectins are proteins that specifically bind to carbohydrates and have been widely used in cancer diagnosis and research [15,16]. Their ability to recognize and bind to specific sugar moieties on cell surfaces makes them valuable tools for studying alterations in glycosylation patterns, which are common in cancer cells [17,18]. Concanavalin A (Con-A) is a lectin that binds specifically to carbohydrates, particularly sugar molecules (α Man, Oligomannoside glycan, Bi-antenna complex glycan) [19]. It is derived from the jack bean plant (Canavalia ensiformis), a legume native to Central and South America [20], and has been widely used in cancer research. Since cancer cells often have altered glycosylation patterns compared with normal cells, this binding property has been exploited for cancer cell isolation and identification [21]. It is often used to assess changes in cell surface glycoproteins in hepatocellular carcinoma cells. Hepatic carcinoma cells often exhibit changes in glycosylation patterns on the cell surface. Con-A can be used to detect and characterize these alterations [22,23]. In this study, we assessed the hepatic alteration of the Con-A expression (intensity and spatial location) in a murine model of hepatocellular carcinoma induced by DEN using lectin histochemistry.

2. Materials and Methods

2.1. Animals

The research was carried out on 28 young male albino Swiss mice with an average body mass of approximately 25 g. The mice were randomized into 4 groups, with 7 mice in each group (1 control group and 3 experimental groups). They were maintained in plastic cages with free access to food and water at an ambient temperature of 22–23 °C, 55% humidity, and a 12 h light/dark cycle. They were fed standard pelleted rodent feed. The experimental protocol was approved by DSVSA (National Veterinary Medicine Authority no. 267/12 July 2021). All procedures involving the use of laboratory animals followed the guidelines and European norms 337 established by EU Directive 2010/63/EU and Romanian law 43/2014

2.2. Experimental Design

The protocol for the induction of liver carcinoma was adapted from the protocol published by Tolba et al. in 2015 [6] according to the following steps. Healthy mice were weighed before each injection to accurately calculate the DEN dose. During the application of nitrosamines, the animals were placed on an electric mattress to guarantee an ambient temperature of 37 °C and to prevent hypothermia. A single dose of diethylnitrosamine 100 mg/kg was administered intraperitoneally for the experimental groups. The monitoring of the appearance of hepatic alterations and HCC was performed in dynamics by seriate sacrifice of animals at 2 months (the first group), 5 months (the second group), and 8 months (the third group) following DEN administration. The analysis was carried out on the last sacrificed group in which the presence of HCC was consistently documented.

2.3. Histopathological Analysis

The liver was collected for further analysis. The harvested tissues were fixed in 10% formalin for 48 h. After fixation, the samples were dehydrated and clarified, which was achieved by immersion in ethyl alcohol baths with increasing concentration, respectively, in xylene baths. After clarifying the samples, the infiltration of the samples with paraffin followed, carried out at 58 °C for 5 h, using a paraffin with a low melting temperature. After this, thin sections of 2 µm were obtained from the paraffin blocks using the rotary microtome. They were later stained using hematoxylin–eosin (H&E), according to a routine protocol. Histological samples were examined under an Olympus BX51 microscope and the bright field images were obtained with an Olympus SP350 digital camera and processed using the Olympus cellSens software. International harmonization of nomenclature and diagnostic (INHAND) histological criteria standards [24] in rodents were used as the basis of histopathological evaluation of the liver.

2.4. Chemical and Reagents

Mice of the Swiss strain were purchased according to the regulations in force from the biobase of the Iuliu Hațieganu UMF Animal Facilities Cluj-Napoca. N-Nitrosodiethylamine solution was purchased from Sigma Aldrich (St. Louis, MO, USA) (Lot# 049K1613). Concanavalin A (Rhodamine Lectine Kit I catalog no. RLK-2200) was purchased from Vector Laboratories and Blue pseudocolor (Draq5) was purchased from Cell Signaling Technology, Inc. (Beverly, MA, USA).

2.5. Lectin Histochemistry of the Liver

Histological slides containing both normal mouse liver and samples with hepatocellular carcinoma were deparaffinized using xylene and alcohol and rinsed with distilled water. After two washing procedures with distilled water, the slides were covered for 60 min with Concanavalin A [25]. After 60 min, the samples were rinsed in two washing procedures with distilled water and stained with Draq5 for 5 min for nuclear detection. The dying procedures were made following the manufacturer’s protocols.

2.6. Confocal Scanning Laser Microscopy (CSLM) Analysis

Confocal fluorescent images were acquired using a Zeiss LSM 710 confocal laser scanning unit mounted on an Axio Observer Z1 Inverted Microscope. Specific visualization of cell structures was performed using 543 and 633 excitation laser lines to detect Draq5 (BP 661–759 nm emission) and Rhodamine (BP 548-629 nm emission), respectively. All images were recorded using a Plan Apochromat 63× (1.4; oil immersion, DIC 27) Zeiss objective. The beam pathway splitter used was MBS 488/543/633. The image combining, processing, and analysis were performed using the standard ZEN software package offered by the Zeiss system manufacturer. The fluorescence values were expressed as arbitrary units (AU) as previously described [26,27].

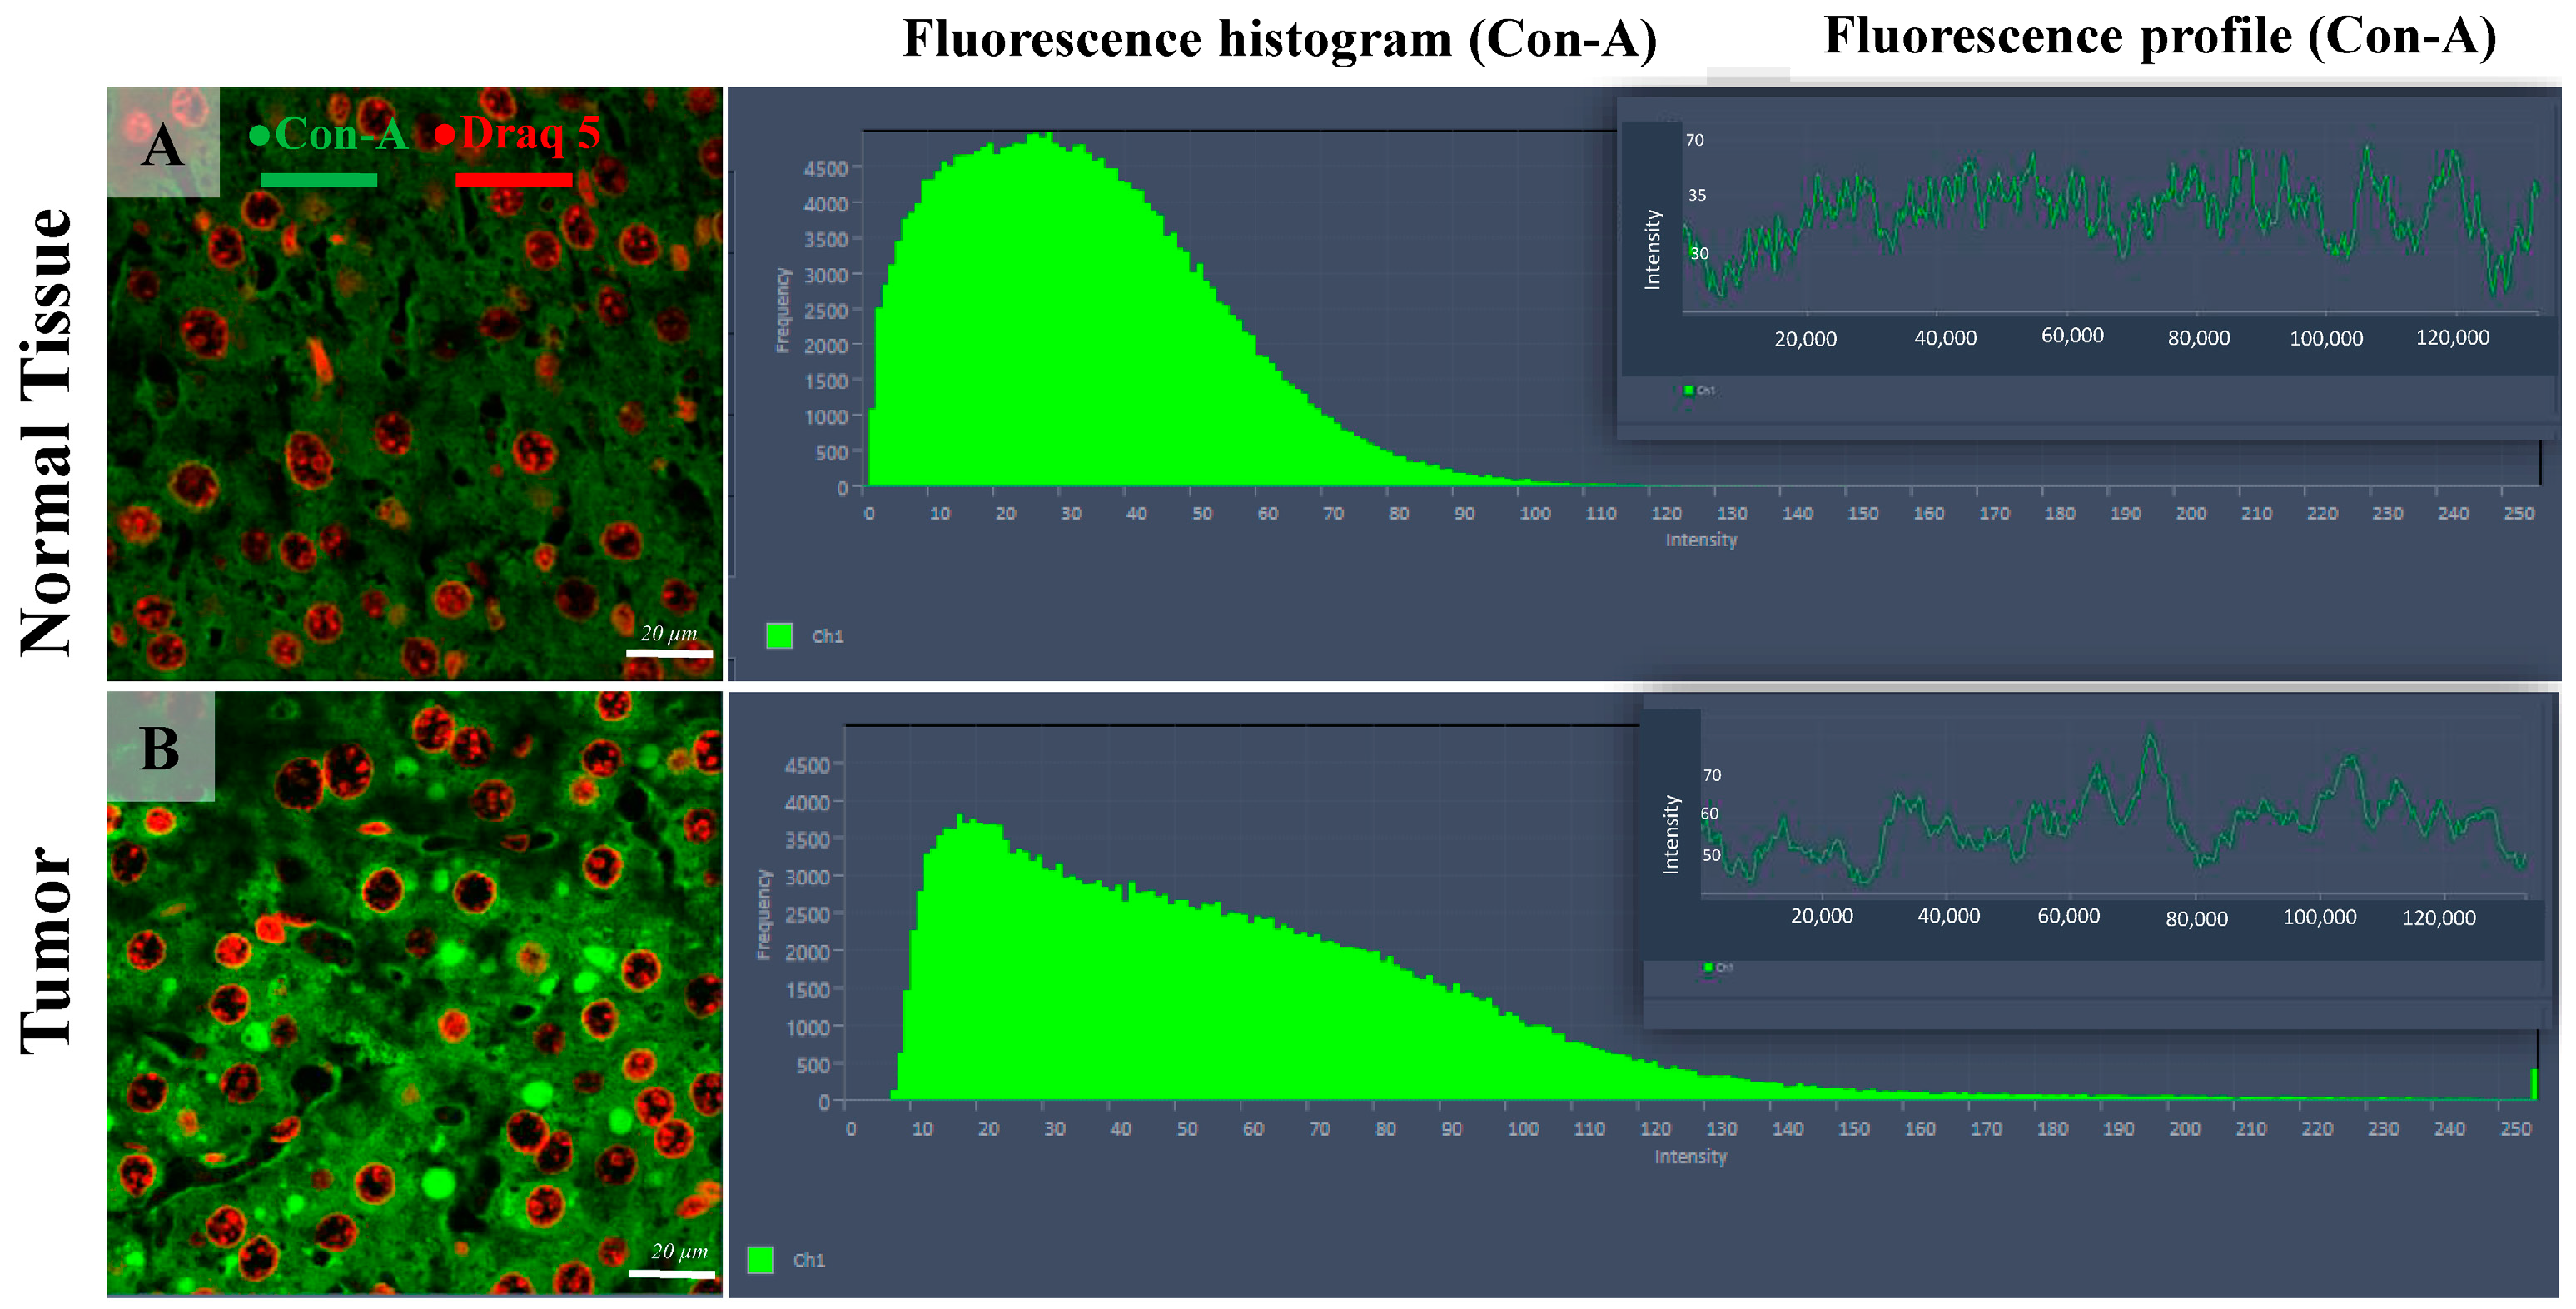
2.7. Concanavalin A Signal Quantification by CLSM

The measurement of the Rhodamine labeled Concanavalin A expression in the liver was carried out using a similar approach, as previously described by us [26,28]. The quantitative analysis of the confocal images was performed automatically using the point-by-point fluorescence quantification functions of the ZEN software. To achieve constant quantification circumstances and to maintain high reproducibility of the dates, the CLSM image acquisition was standardized and maintained for the entire length of the experiment (acquisition time 30 s, the output power of the lasers 20%, pinhole diameter 56 μm, master gain 728 and 765, digital gain 15, effective NA 1.4, scan zoom1.0, pixel time 10,035 μs, and scan direction unidirectional and bit depth 8-bit) [29,30]. The size of each image section was 512 × 512 pixels (135 × 135 μm) covering an area of 18.225 μm2 for each microscopic field scanned. We scanned and measured the mean fluorescence on 10 randomly chosen microscopic fields for normal tissue and 10 randomly chosen microscopic fields for tumoral tissue (2 per mass/hcc) of vision, representing an area of 182.25 μm2.

2.8. Statistics

Statistical analyses were performed using RStudio version 4.3.1. To compare the intensity measures of Con-A between normal and tumoral hepatic tissue, the non-parametric Mann–Whitney U test, also known as the Wilcoxon rank sum test, was employed. This test was chosen for its appropriateness for non-normally distributed data, which is often the case in biological measurements.

3. Results

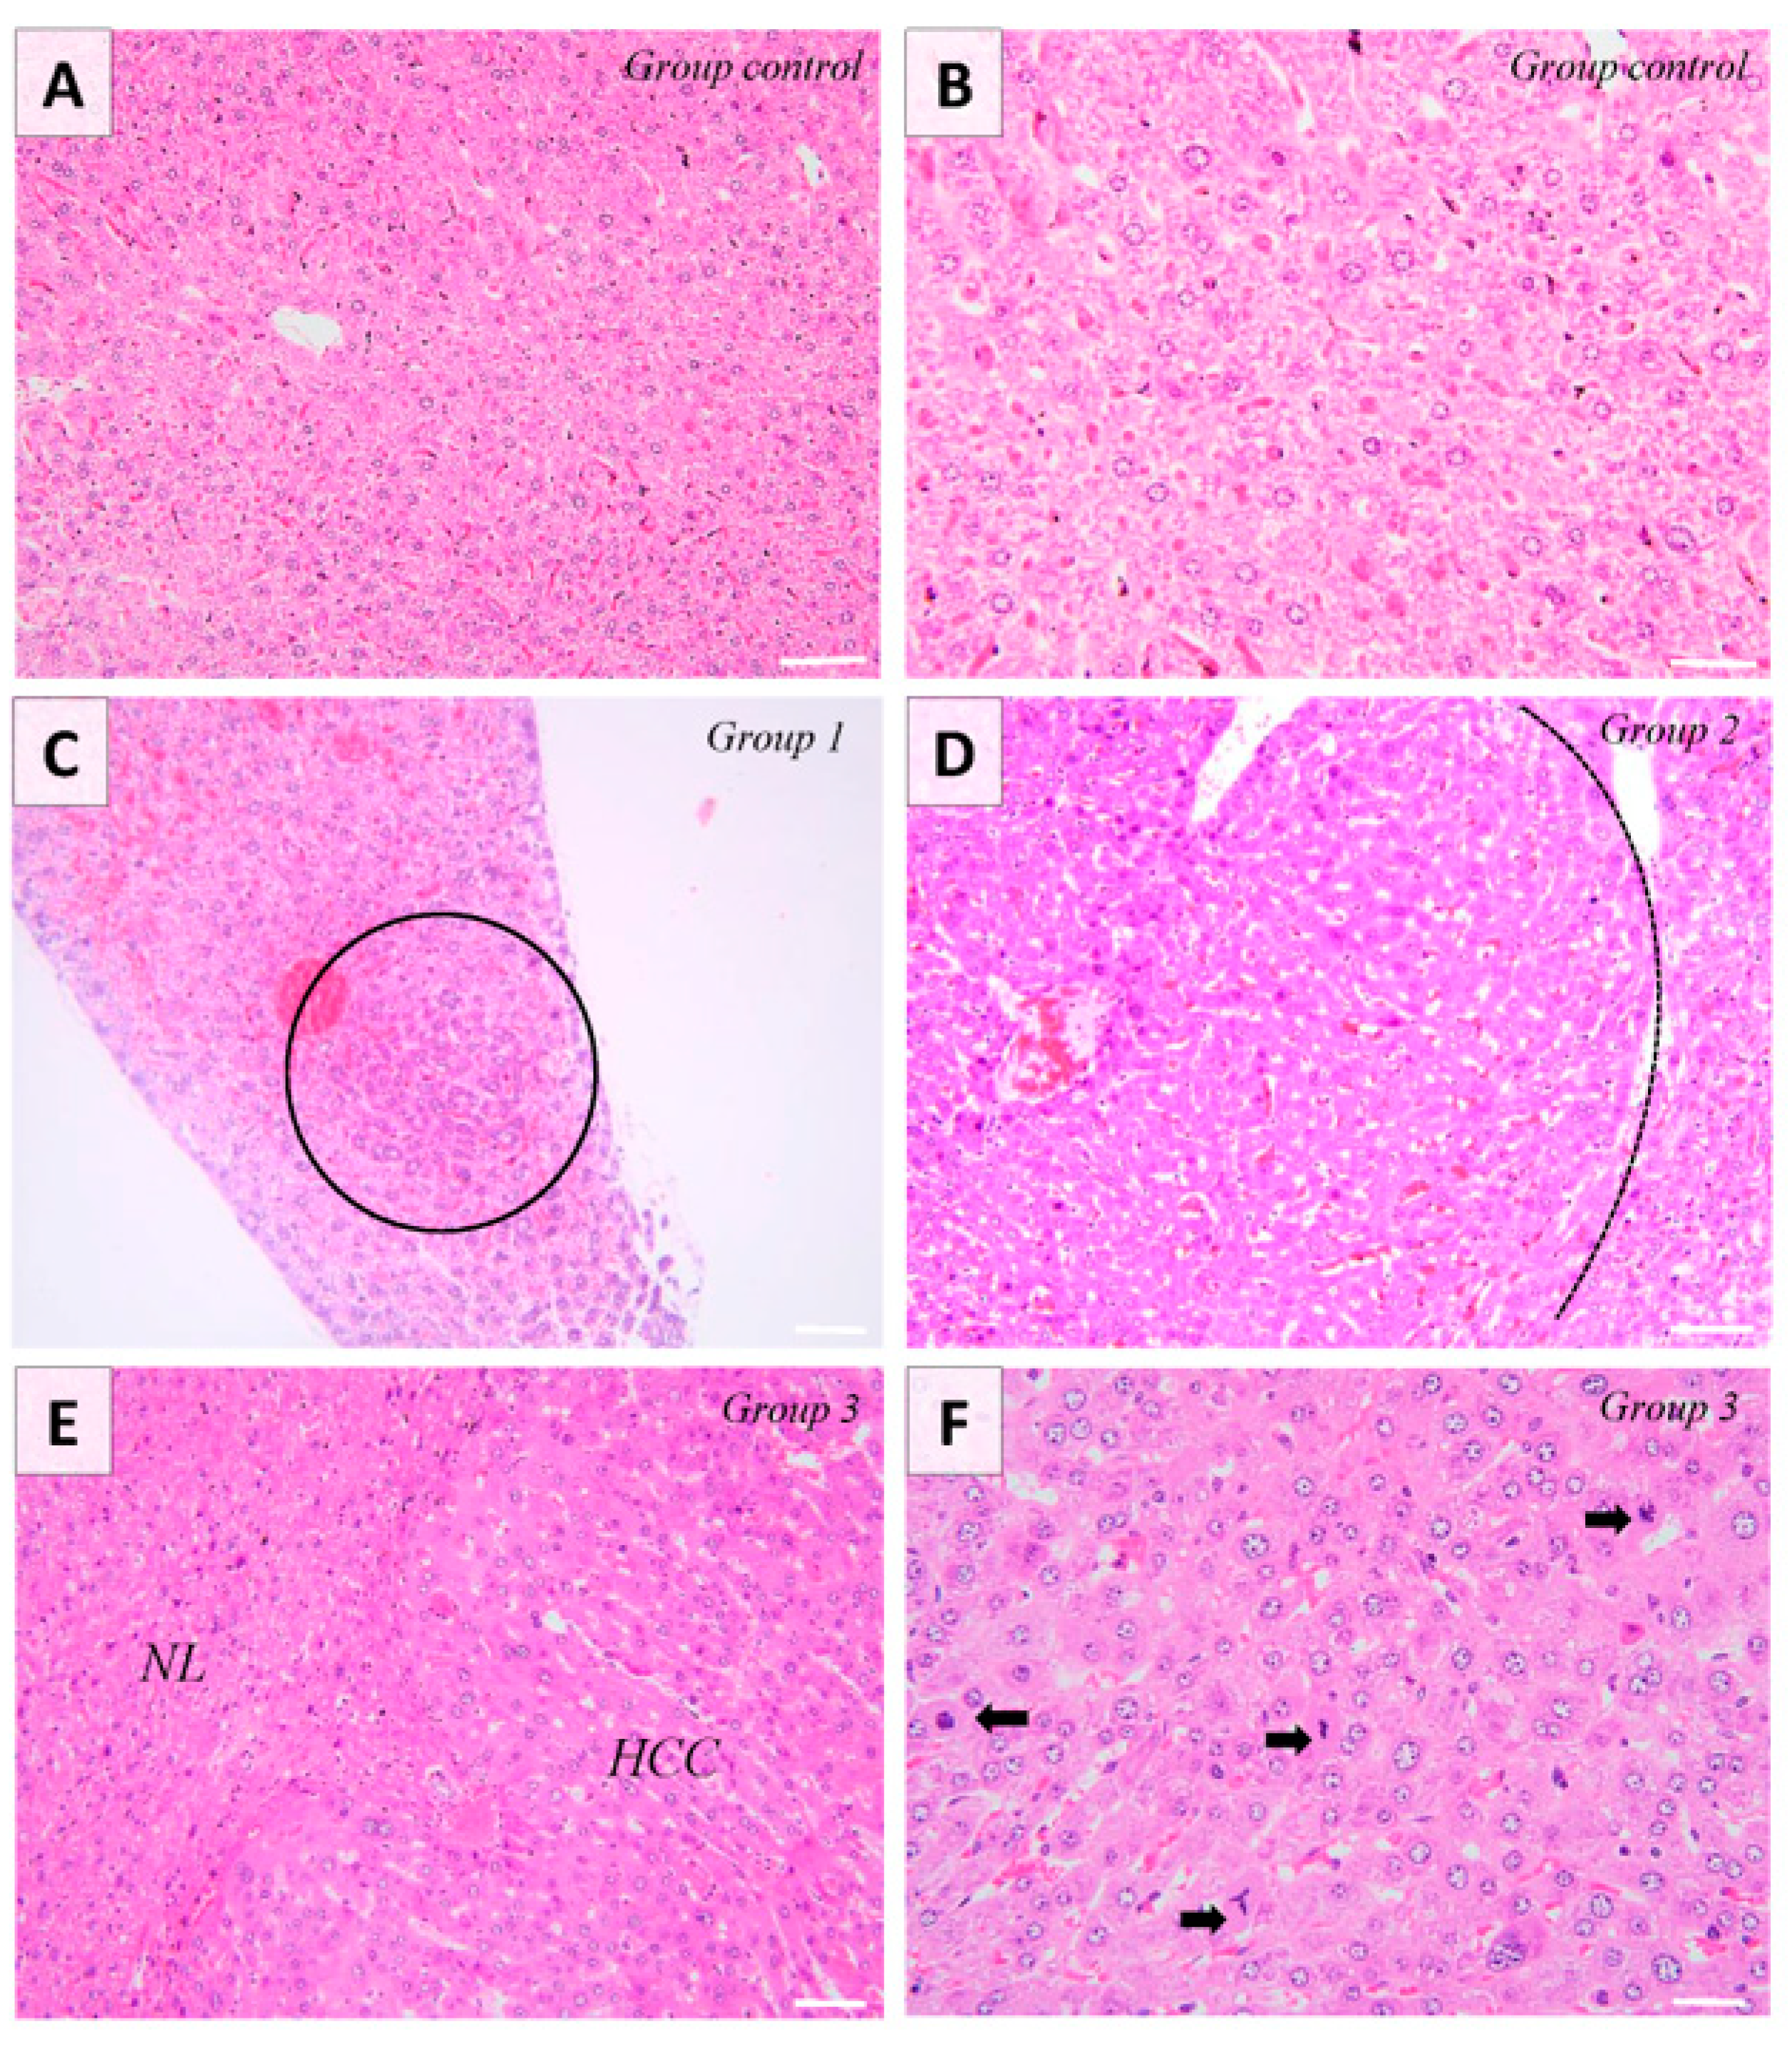
3.1. Gross and Histological Findings

Changes associated with the administration of DEN were observed for the second and third group corresponding to 5 months and 8 months post-DEN administration, respectively. Pathologically, group one exhibited no apparent macroscopic alterations, whereas group two manifested well-defined masses in four out of the seven examined livers. In the case of the final experimental group, masses were identified in five out of the seven livers examined. These masses had a multifocal to coalescent distribution with sporadic foci of necrosis. Histologically, the first group displayed discrete basophilic foci, indicative of alteration foci. Conversely, the second experimental group exhibited well-demarcated masses compressing the adjacent tissue. These masses consisted of well-differentiated hepatocytes organized into cords, with minimal observed polymorphism. The HCCs present in the last animal group and examined in this experiment consisted of poorly demarcated, unencapsulated, nodular, and occasionally coalescent lesions, showing focal compression and infiltration into the adjacent hepatic tissue. There was extensive loss of lobular hepatic architecture, the hepatocytes being arranged in interconnected cord-like structures (multifocally ≥5 cell thick plates), displaying moderate polymorphism, along with pronounced anisokaryosis and changes in both cytoplasmic tinctorial staining patterns and granularity. Anisokaryosis was moderate, and most of the tumoral hepatocytes showed vacuolated chromatin and 1–3 prominent basophilic nucleoli. Occasionally, tumor cells exhibited abundant eosinophilic cytoplasm. Multinucleated tumor cells (up to six nuclei) were occasionally observed. Occasionally, focal areas of intratumoral necrosis and replacement hemorrhage were present in a subset of HCC. Bile duct proliferation was not observed within the neoplasia. There was a notable presence of mitoses (up to 30 mitoses/10 × HPF/2.37 mm2), with frequent atypia (Figure 1). Most of the diagnosed HCC showed a mixed trabecular, adenoid, and occasionally solid pattern.

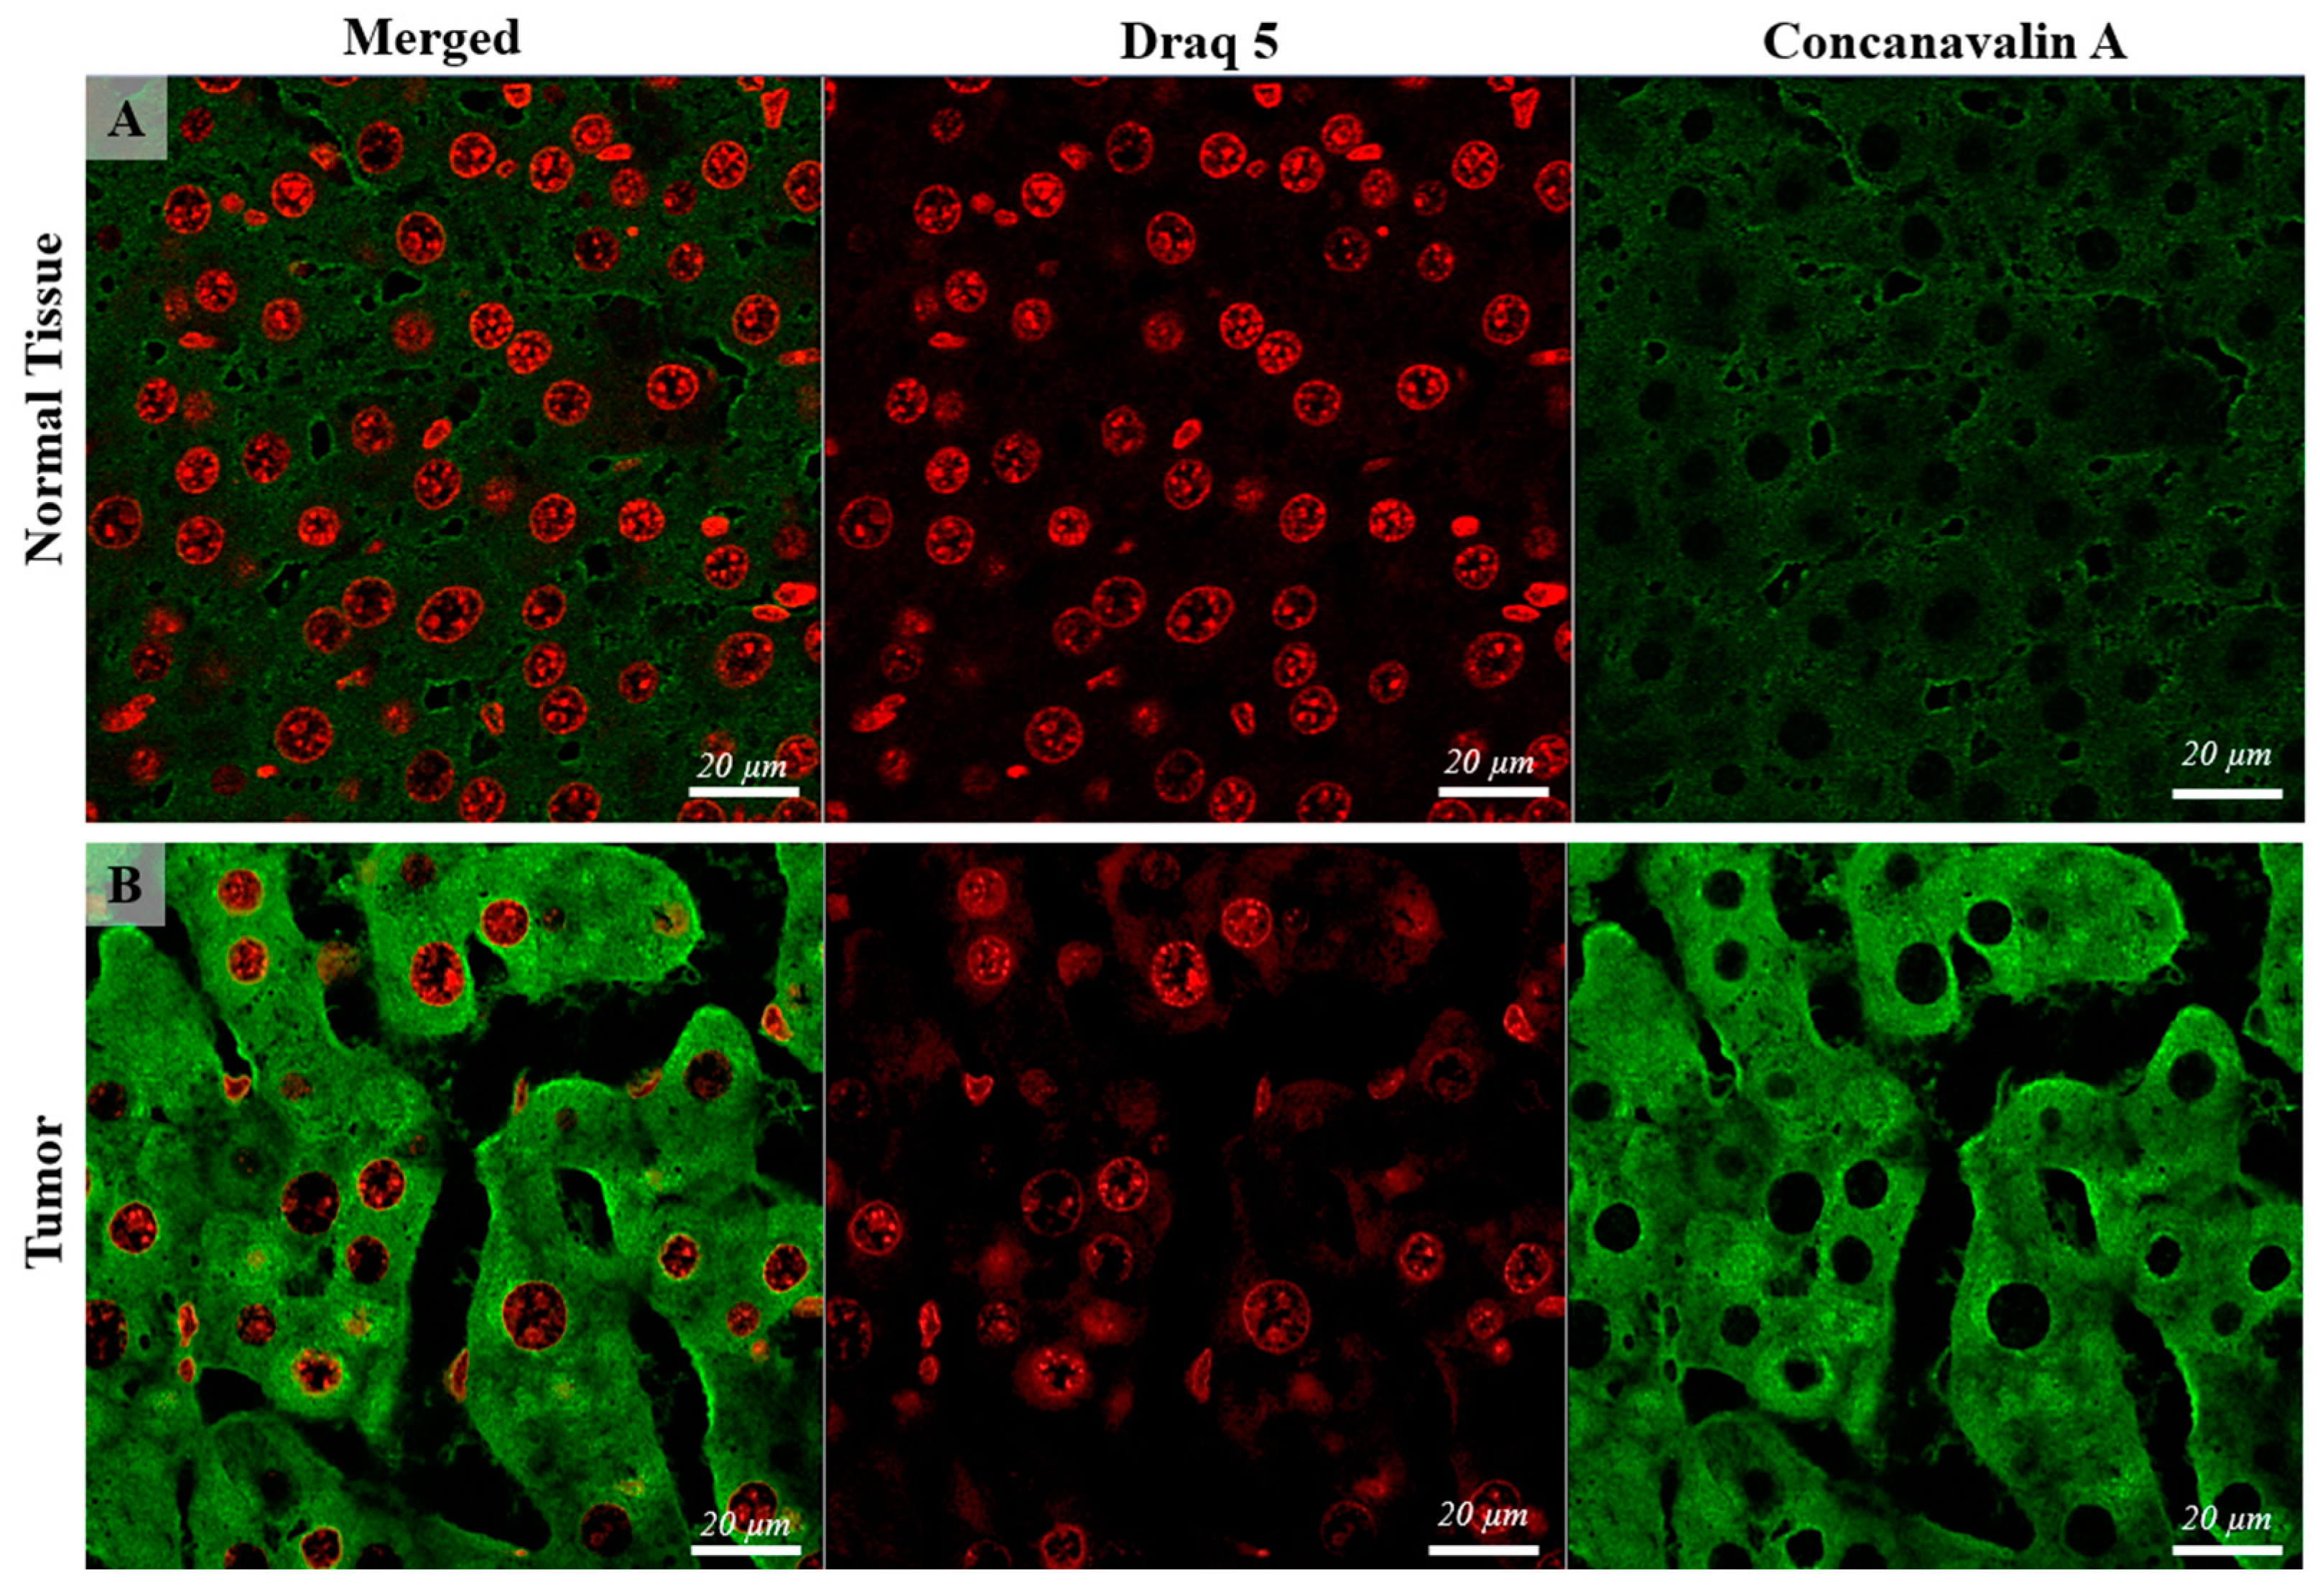
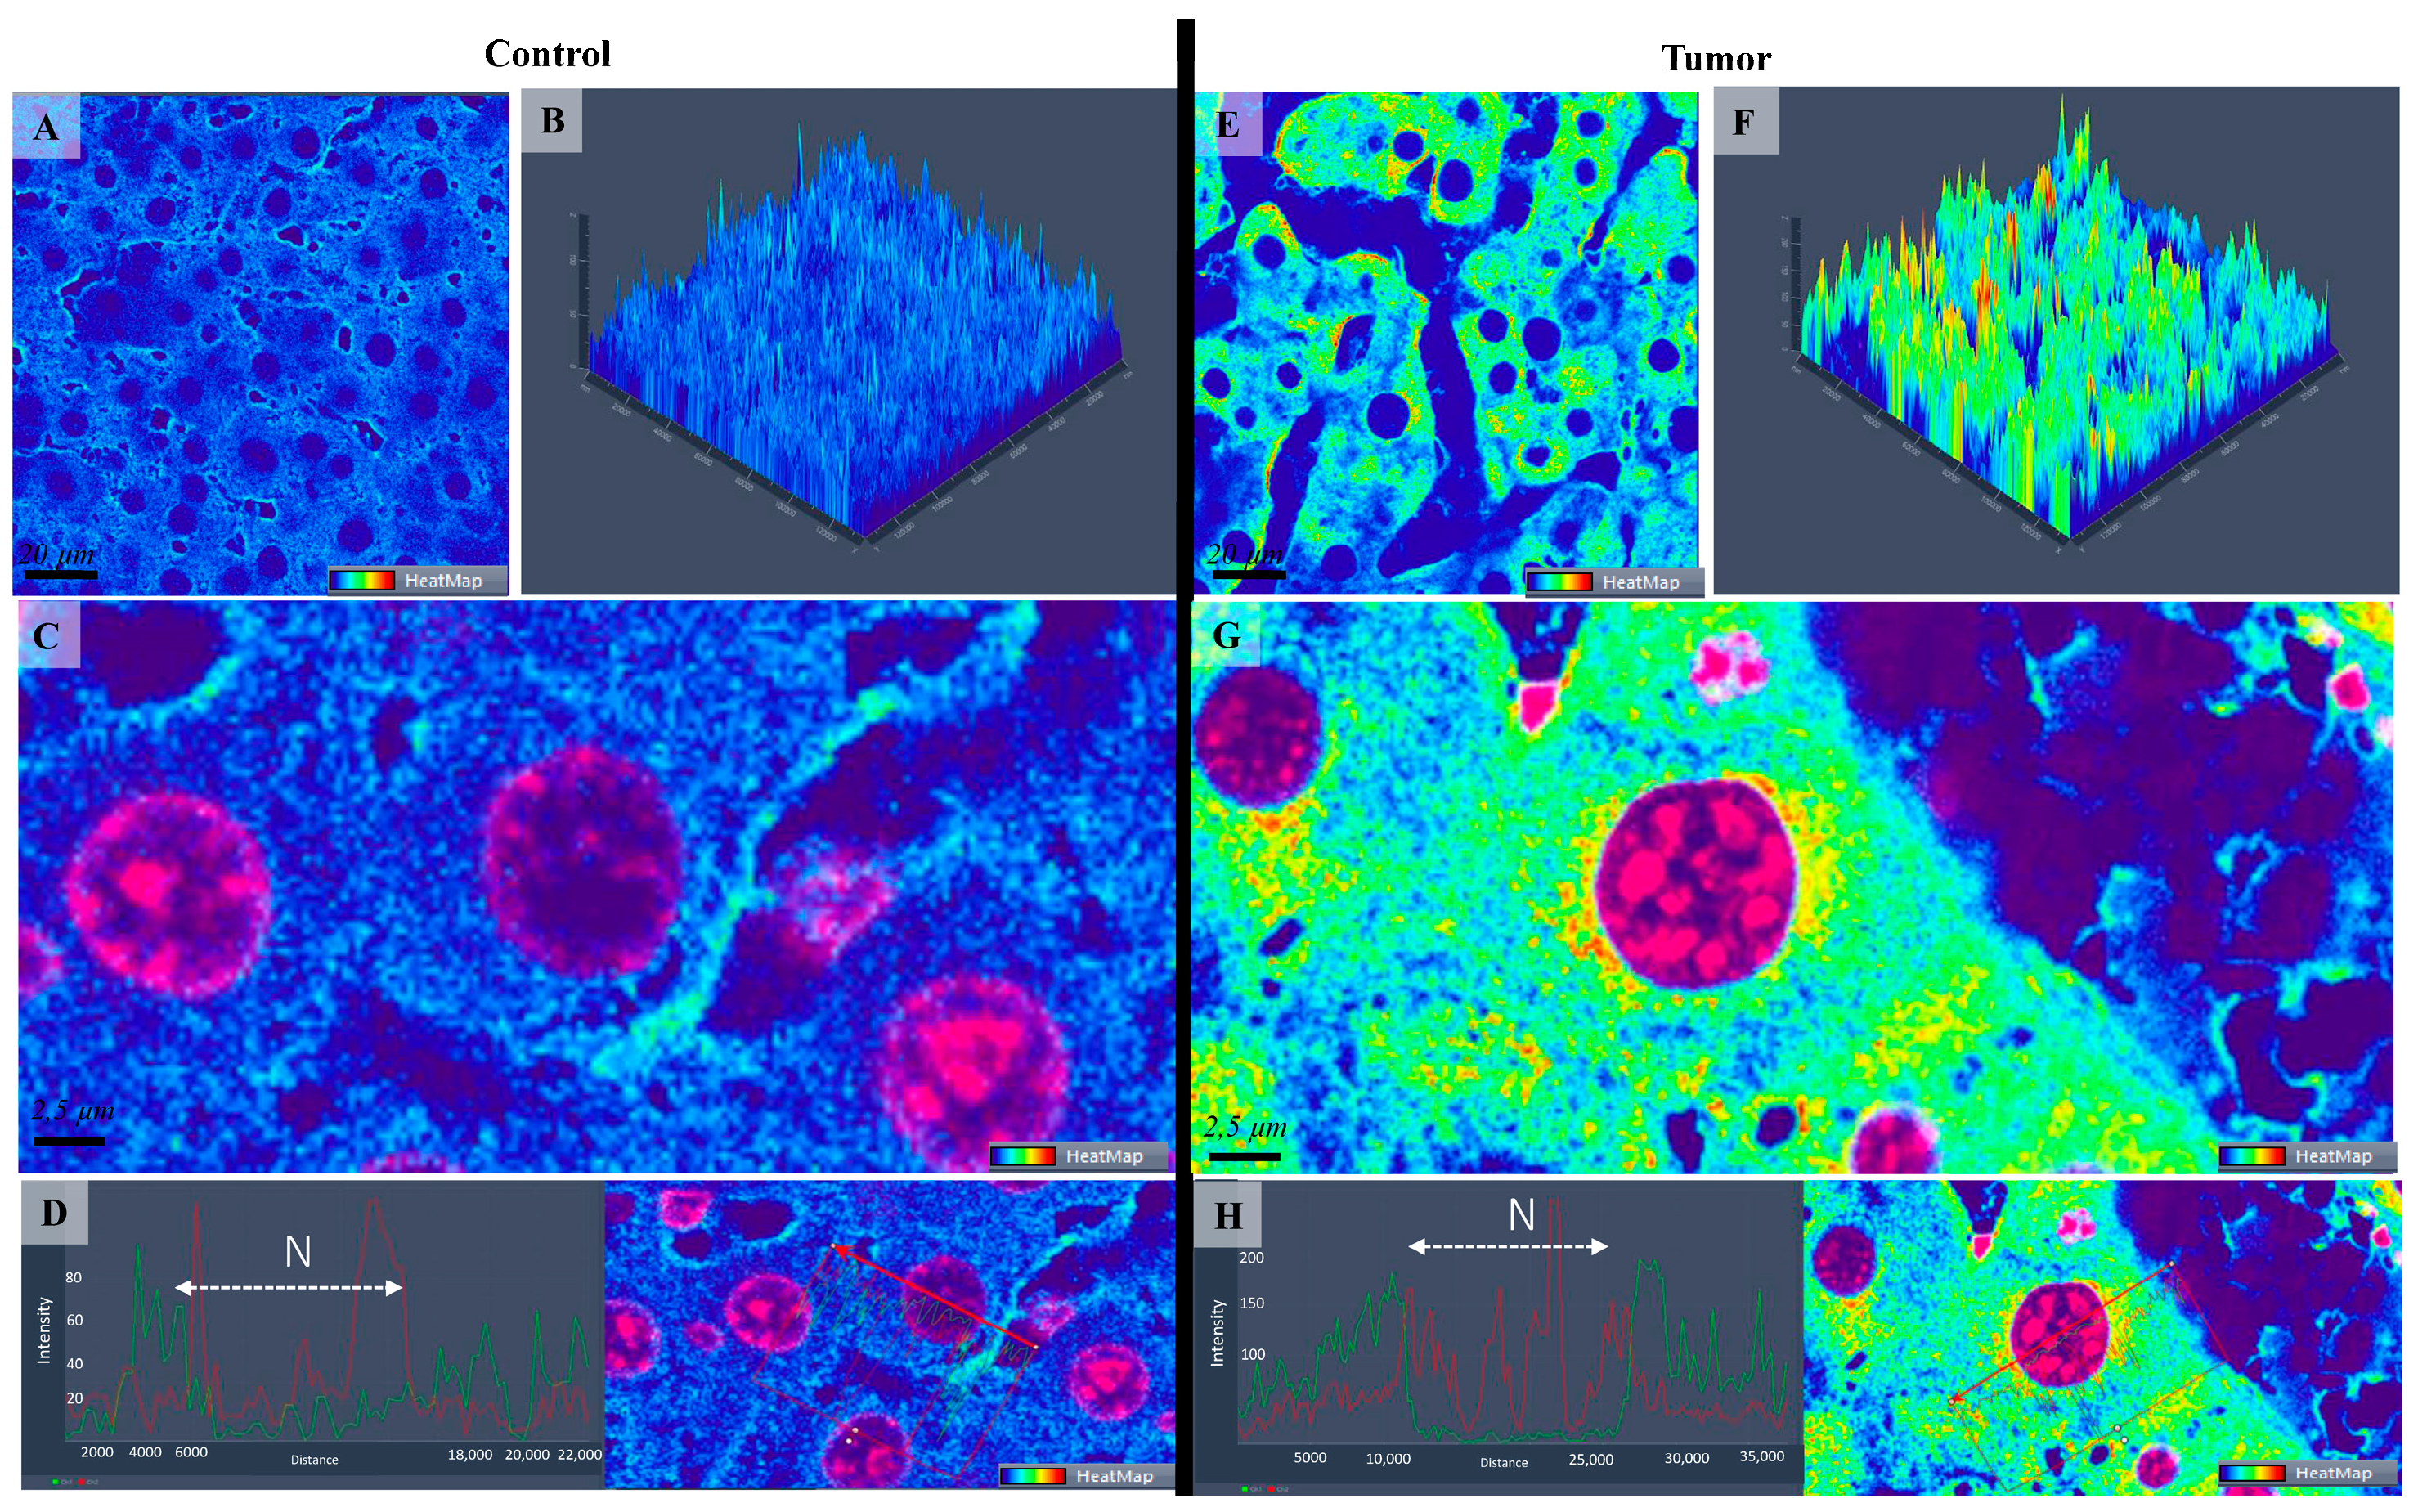
3.2. Confocal Scanning Laser Microscopy (CSLM)

When examining Con-A expression using CLSM, notable differences were detected in both localization and quantity between the normal control group and the tumor tissue samples. While the majority of cells in the control group exhibited membranar/perisinusoidal localization of Con-A (indicative of a typical pattern), a distinct pattern emerged in the HCC cells. In the HCC cells, Con-A expression was not only observed in the expected membranar/perisinusoidal regions but was also notably present in multiple foci within the perinuclear zones of the cells. This multifold distribution pattern suggests a significant alteration in Con-A distribution and abundance within the cellular microenvironment of HCC, underscoring its potential relevance as a biomarker for tumor progression and cellular transformation. (Figure 2, Figure 3 and Figure 4).

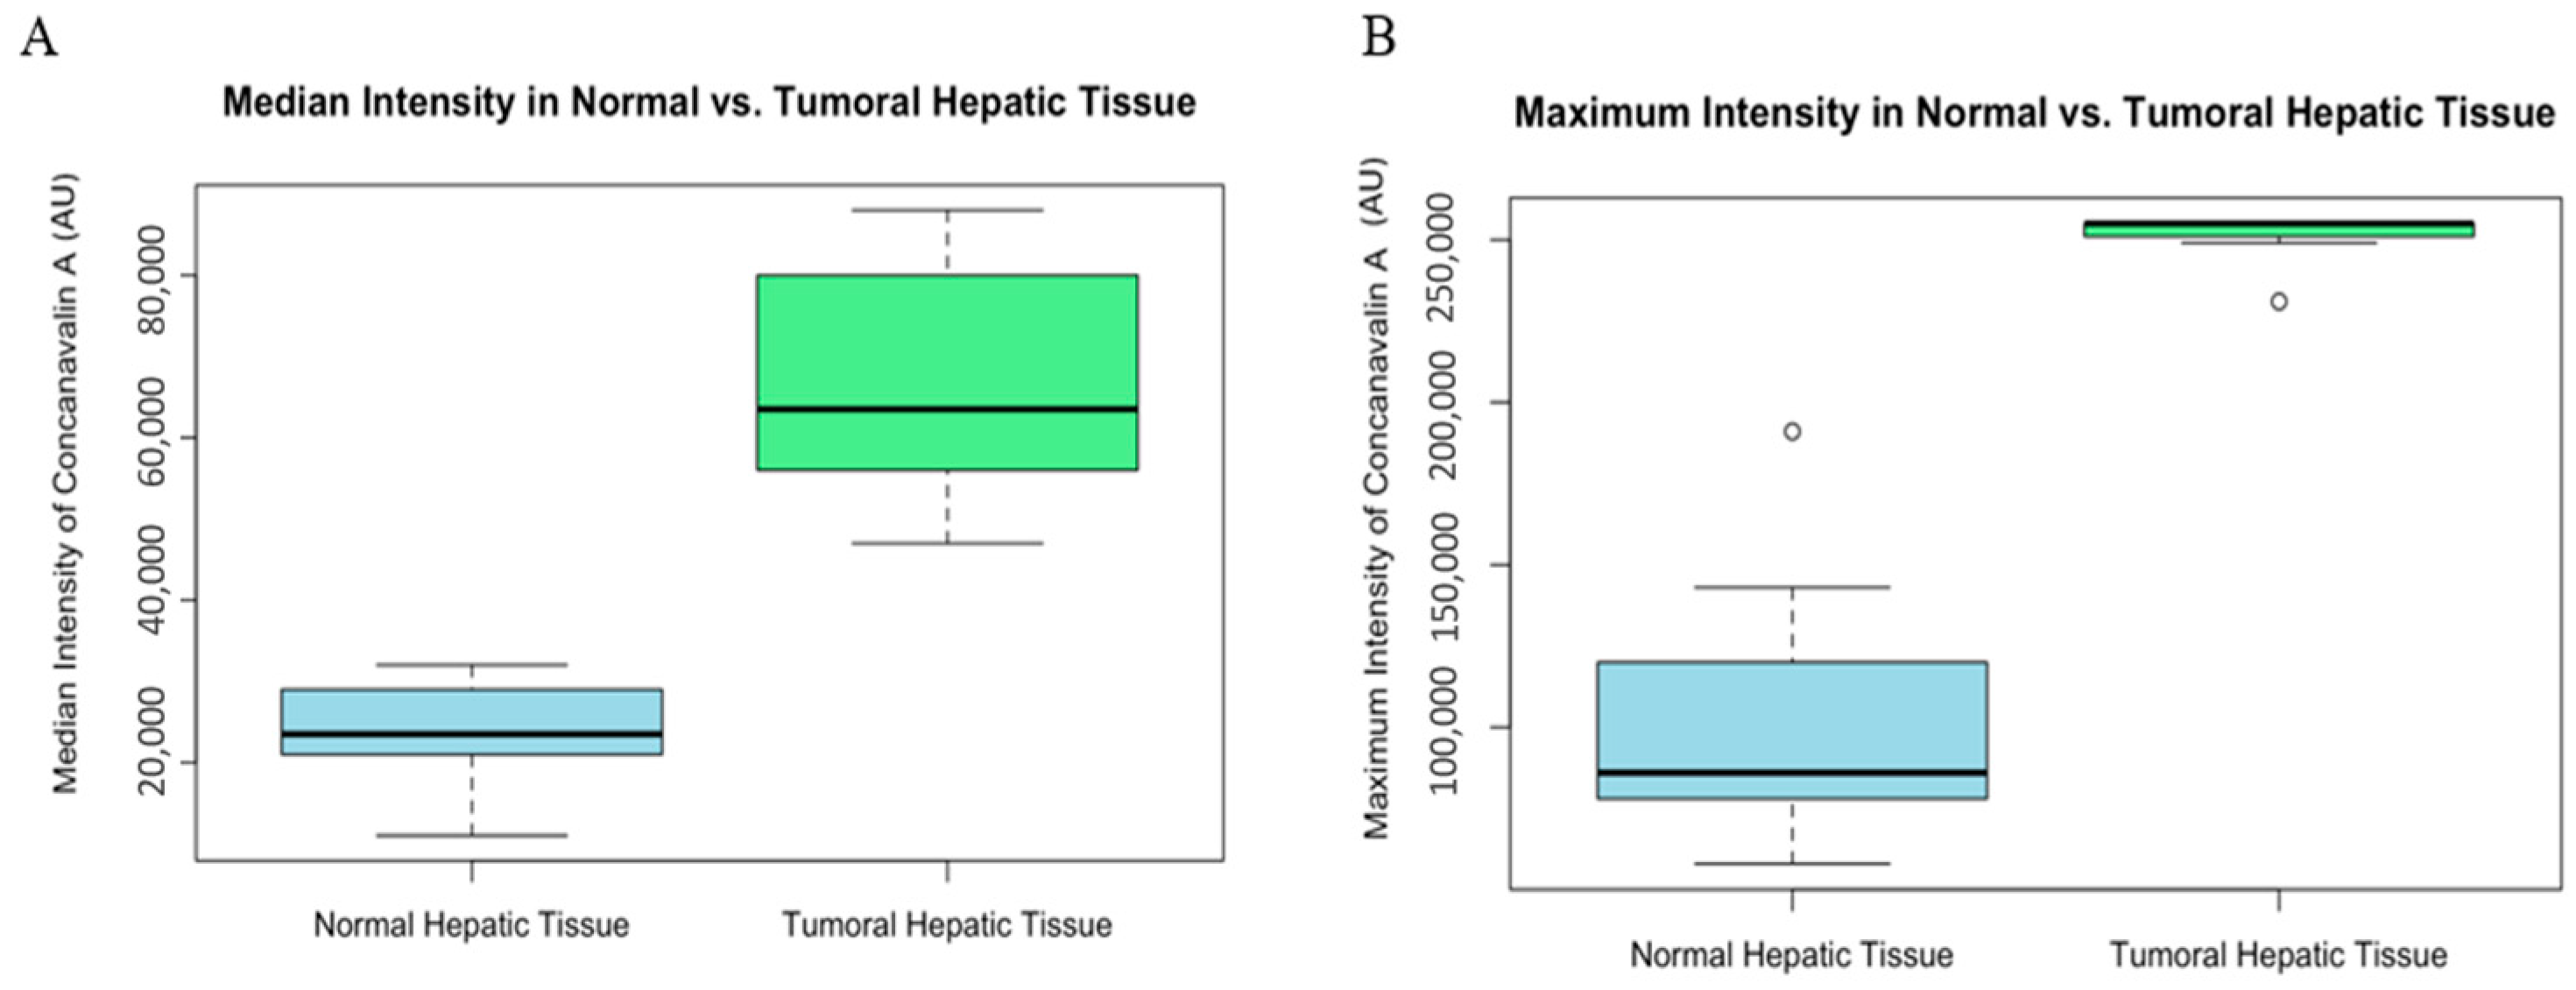
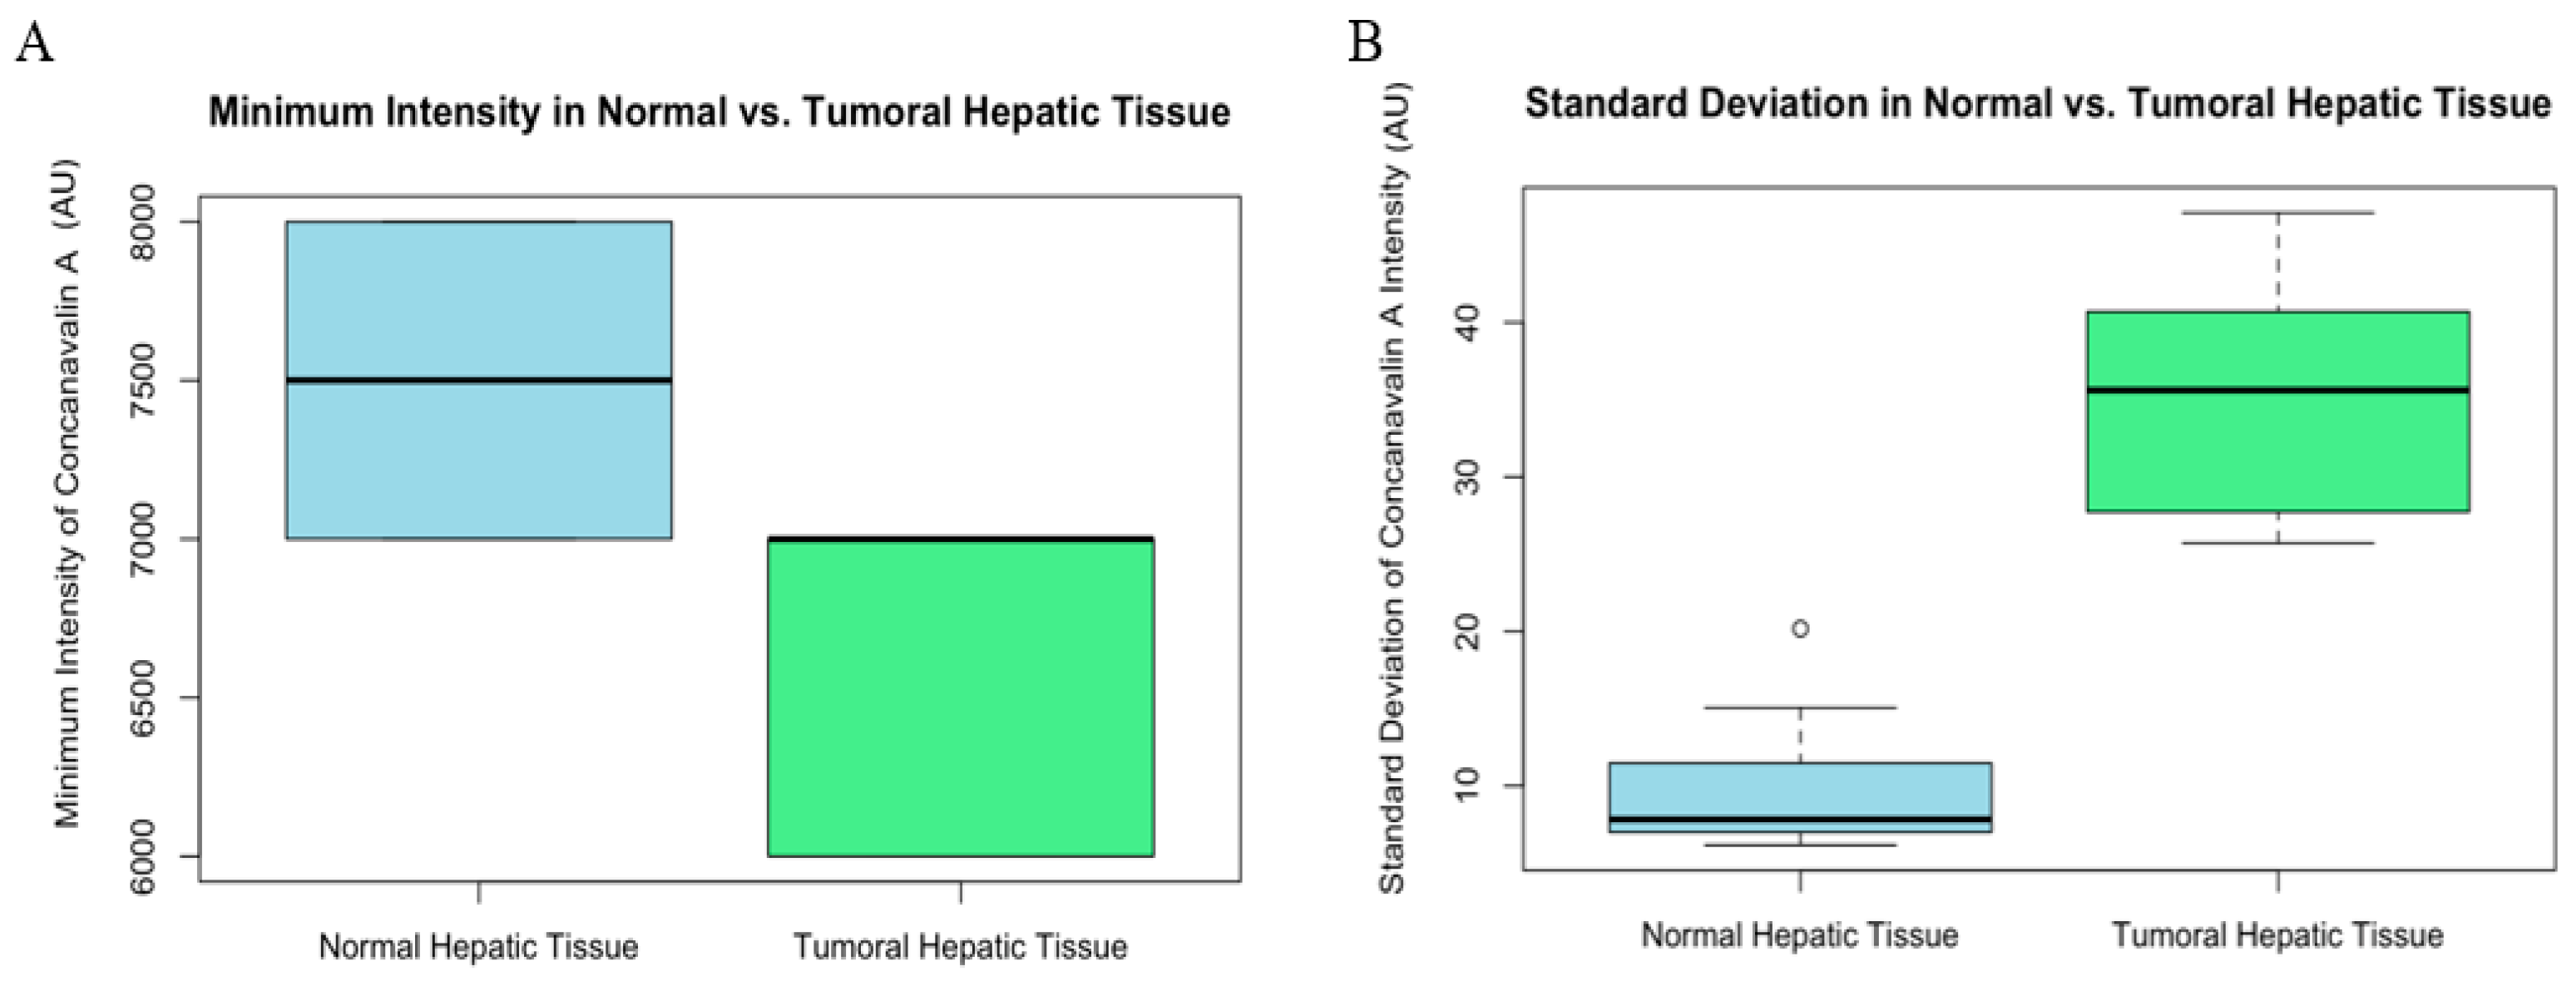
3.3. Statistical Analysis

The median intensity values showed a significant difference between the normal and tumoral tissues (W = 0, p-value = 0.0001827 AU) (Figure 5). Similarly, maximum intensity values were significantly higher in tumoral tissues (W = 0, p-value = 0.0001317 AU), reinforcing the finding of increased Con-A binding or expression in tumor sites (Figure 5).
Minimum intensity comparisons revealed a statistically significant, although smaller, difference between the two tissue types (W = 82.5, p-value = 0.005741 AU). This indicates that even at the lowest levels of expression, tumoral tissues exhibit a higher intensity of Con-A (Figure 6).
Lastly, the standard deviation of intensity measurements also differed significantly (W = 0, p-value = 0.0001827 AU), with tumoral tissue showing greater variability. This variation could be indicative of the heterogeneous nature of tumor cells in their affinity for Con-A (Figure 6).
In all cases, the alternative hypothesis that the true location shift is not equal to 0 is supported, suggesting that there are indeed differences in Concanavalin A intensity distribution between normal and tumoral hepatic tissues.

4. Discussion

In this study, histochemical analysis using Con-A served as a valuable tool to investigate biochemical and structural alterations during hepatocellular carcinoma (HCC) induced by DEN. HCC is characterized by metabolic shifts, affecting energy production, nutrient utilization, and signaling pathways [8]. Notably, HCC cells often exhibit increased reliance on glycolysis, known as the Warburg effect, enabling rapid energy generation for uncontrolled cell proliferation. Altered glucose metabolism is a hallmark of HCC, with elevated glucose consumption and upregulation of glycolytic enzymes [8,9,10]. Glutaminolysis, utilizing glutamine as an energy source, supports the anabolic demands of rapidly dividing cancer cells [12]. Dysregulated lipid metabolism, featuring increased lipogenesis and altered fatty acid oxidation, contributes to lipid accumulation, supporting cancer cell growth [13]. Mitochondrial dysfunction, including altered mitochondrial DNA and impaired oxidative phosphorylation, along with increased reactive oxygen species production, is common in HCC and impacts energy metabolism [14]. Dysregulated autophagy provides a survival advantage to cancer cells under metabolic stress. DEN is a potent carcinogen that, upon metabolic activation in the liver, forms reactive intermediates leading to DNA alterations [31]. The initiation and progression of HCC following DEN administration involves a series of distinctive events. Initial exposure to DEN results in the formation of DNA alterations, triggering genetic mutations in key hepatic genes [7,32,33]. This molecular insult leads to the development of preneoplastic lesions, such as basophilic foci, characterized by altered hepatocyte morphology and increased cell proliferation. Over time, these preneoplastic lesions may progress to hepatic adenomas, benign tumors with potential for malignant transformation [34,35]. The induction of oxidative stress and inflammation creates a conducive microenvironment for the evolution of hepatic adenomas into a fully malignant HCC [7]. Activated oncogenic pathways, including Wnt/β-catenin and Wnt/MAPK, further drive uncontrolled cell proliferation and inhibit apoptosis, culminating in the aggressive phenotype of hepatocellular carcinoma [36]. Understanding the mechanisms involved in DEN-induced hepatocarcinogenesis is crucial for unraveling the complexities of liver cancer and developing potential therapeutic strategies.
Con-A is a lectin derived from the jack bean plant (Canavalia ensiformis) that binds specifically to carbohydrates (particularly sugar molecules such as α Man, Oligomannoside glycan, and Bi-antenna complex glycan) [19,20]. Our focus on Con-A labeling revealed a distinct spatial distribution, particularly in perinuclear areas of HCC cells. Regarding the Con-A spatial distribution in liver cells, a study by Guillouzo and Feldmann in 1997 showed labeling of cell surfaces in various liver cell types, including hepatocytes, endothelial cells, Kupffer cells, and biliary cells. In this study, Con-A was frequently present in desmosomes and gap junctions, but tight junctions did not show this labeling. Con-A labeling was observed on the inner side of the endoplasmic reticulum and Golgi apparatus membranes, while mitochondria and glycogen particles were rarely labeled. Con-A receptors on tumoral cells correlated with aberrant glycosylation patterns, suggesting a targeted therapeutic potential [37]. Our study highlights Con-A’s therapeutic properties, including its modulation of autophagy, induction of apoptosis, inhibition or stimulation of angiogenesis, and anti-hepatic cancer effects. Specifically, Con-A targets PI3K/Akt signaling, induces apoptosis in cells lacking functional P53, and inhibits angiogenesis through various pathways [38]. The rationale behind utilizing Con-A as a probe to investigate glycosylation patterns lies in its inherent high affinity for carbohydrates, with a specific focus on sugar molecules. This affinity allows Con-A to selectively bind to certain carbohydrate structures, providing a precise tool for analyzing and understanding the landscape of glycosylation within biological samples [19]. By exploiting Con-A’s selective binding to carbohydrates, researchers can unravel and characterize the unique glycosylation profiles associated with various cellular components, offering valuable insights into the molecular intricacies of biological processes and diseases, including cancer. In hepatocellular carcinoma, Con-A selectively binds to tumoral cells with high mannose residues, inducing autophagic cell death and stimulating immune responses [39]. The link between Con-A and tumoral cells provides insights for targeted tumor therapy based on distinctive molecular features of tumoral glycosylation.
The basics of this lectin histochemistry used by us are based on the high selectivity of the fluorescent-labeled Con-A for several tissue carbohydrates. The high selectivity of the lectins for their substrates provides an extraordinarily sensitive detection system for changes in glycosylation and carbohydrate expression that may occur during several biological processes, including oncogenesis. This high selectivity of the fluorescent-labeled Con-A for these hepatic-structural carbohydrates allowed us to demonstrate the pattern of carbohydrate residues in HCC and fluorescent-based semiquantitative measurement of these carbohydrates [40]. As previously documented, lectin histochemistry and cytochemistry can reveal subtle alterations in glycosylation patterns of cells, alterations that reflect either physiological changes (e.g., cell differentiation) or, as in our case, metabolic shifts in glycosylation suffered by tumoral cells [18,41,42]. Ultimately, Con-A emerges as a promising therapeutic agent with multifaceted effects, influencing pathways relevant to cancer progression and treatment.

5. Conclusions

Our study, utilizing CLSM, unveils notable changes in Con-A subcellular localization and intensity distribution in HCC compared with healthy liver tissue. Statistical analyses confirm elevated Con-A expression in tumor tissues. In HCC, Con-A shows an intensified cytoplasmic perinuclear presence, diverging from its typical cell membrane, and less cytoplasmic distribution of healthy liver cells. Even at minimal expression levels, HCC exhibits higher Con-A intensity, indicating consistent elevation across different expression levels. Additionally, tumoral tissues display significantly higher variability in Con-A intensity, highlighting the heterogeneous nature of tumor cells in their Con-A affinity. These findings provide valuable insights into molecular changes in HCC, suggesting potential diagnostic and therapeutic implications of Con-A alterations in liver cancer.

Author Contributions

R.P., A.-F.T., T.M. and L.M. carried out the HCC protocol. R.P. and A.-F.T. carried out the lectin labeling and drafted and reviewed the manuscript. D.H. was involved in data analysis and statistics. C.C. reviewed the manuscript. All authors have read and agreed to the published version of the manuscript.

Funding

The authors wish to acknowledge funding granted by the National Authority for Scientific Research and Innovation Romania, CNCS-UEFISCDI, cod PN-III-P2-2.1-PED-2021-0073 and PN-III-P2-2.1-PED-2019-0997.

Institutional Review Board Statement

The experimental protocol has been approved by DSVSA (National Veterinary Medicine Authority no. 267/12 July 2021). All procedures involving the use of laboratory animals followed the guidelines and European norms 337 established by EU Directive 2010/63/EU and Romanian law 43/2014.

Informed Consent Statement

Not applicable.

Data Availability Statement

The data that support the findings of this study are available from the Department of Veterinary Pathology, University of Agriculture Science and Veterinary Medicine. Data are, however, available from the authors upon reasonable request and with the permission of the Department of Veterinary Pathology, University of Agriculture Science and Veterinary Medicine.

Conflicts of Interest

The authors declare no conflicts of interest.

References

  1. Liptak, J.M.; Dernell, W.S.; Monnet, E.; Powers, B.E.; Bachand, A.M.; Kenney, J.G.; Withrow, S.J. Massive hepatocellular carcinoma in dogs: 48 cases (1992–2002). J. Am. Vet. Med. Assoc. 2004, 225, 1225–1230. [Google Scholar] [CrossRef]
  2. Goussev, S.A.; Center, S.A.; Randolph, J.F.; Kathrani, A.; Butler, B.P.; McDonough, S.P. Clinical characteristics of hepatocellular carcinoma in 19 cats from a single institution (1980–2013). J. Am. Anim. Hosp. Assoc. 2016, 52, 36–41. [Google Scholar] [CrossRef]
  3. Ferlay, J.; Shin, H.R.; Bray, F.; Forman, D.; Mathers, C.; Parkin, D.M. Estimates of worldwide burden of cancer in 2008: GLOBOCAN 2008. Int. J. Cancer 2010, 127, 2893–2917. [Google Scholar] [CrossRef]
  4. Obeid, M.; Khabbaz, R.C.; Garcia, D.K.; Schachtschneider, M.K.; Gaba, R.C. Translational animal models for liver cancer. Am. J. Interv. Radiol. 2018, 2, 1–7. [Google Scholar] [CrossRef]
  5. Brown, Z.J.; Heinrich, B.; Greten, T.F. Mouse models of hepatocellular carcinoma: An overview and highlights for immunotherapy research. Nat. Rev. Gastroenterol. Hepatol. 2018, 15, 536–554. [Google Scholar] [CrossRef]
  6. Tolba, R.; Kraus, T.; Liedtke, C.; Schwarz, M.; Weiskirchen, R. Diethylnitrosamine (DEN)-induced carcinogenic liver injury in mice. Lab. Anim. 2015, 49 (Suppl. 1), 59–69. [Google Scholar] [CrossRef]
  7. Santos, N.P.; Pereira, I.C.; Pires, M.J.; Lopes, C.; Andrade, R.; Oliveira, M.M.; Colaço, A.; Peixoto, F.; Oliveira, P.A. Histology, bioenergetics and oxidative stress in mouse liver exposed to N-diethylnitrosamine. In Vivo 2012, 26, 921–929. [Google Scholar]
  8. De Matteis, S.; Ragusa, A.; Marisi, G.; De Domenico, S.; Casadei Gardini, A.; Bonafè, M.; Giudetti, A.M. Aberrant metabolism in hepatocellular carcinoma provides diagnostic and therapeutic opportunities. Oxidative Med. Cell. Longev. 2018, 2018, 7512159. [Google Scholar] [CrossRef] [PubMed]
  9. Feng, J.; Li, J.; Wu, L.; Yu, Q.; Ji, J.; Wu, J.; Dai, W.; Guo, C. Emerging roles and the regulation of aerobic glycolysis in hepatocellular carcinoma. J. Exp. Clin. Cancer Res. 2020, 39, 126. [Google Scholar] [CrossRef] [PubMed]
  10. Kim, J.U.; Shariff, M.I.; Crossey, M.M.; Gomez-Romero, M.; Holmes, E.; Cox, I.J.; Rye, H.K.S.; Njie, R.; Taylor-Robinson, S.D. Hepatocellular carcinoma: Review of disease and tumor biomarkers. World J. Hepatol. 2016, 8, 471. [Google Scholar] [CrossRef] [PubMed]
  11. Torizuka, T.; Tamaki, N.; Inokuma, T.; Magata, Y.; Sasayama, S.; Yonekura, Y.; Tanaka, A.; Yamaoka, Y.; Yamamoto, K.; Konishi, J. In Vivo assessment of glucose metabolism in hepatocellular carcinoma with FDG-PET. J. Nucl. Med. 1995, 36, 1811–1817. [Google Scholar] [PubMed]
  12. Ye, Y.; Yu, B.; Wang, H.; Yi, F. Glutamine metabolic reprogramming in hepatocellular carcinoma. Front. Mol. Biosci. 2023, 10, 1242059. [Google Scholar] [CrossRef] [PubMed]
  13. Wang, M.; Han, J.; Xing, H.; Zhang, H.; Li, Z.; Liang, L.; Li, C.; Dai, S.; Wu, M.; Shen, F.; et al. Dysregulated fatty acid metabolism in hepato-cellular carcinoma. Hepatic Oncol. 2016, 3, 241–251. [Google Scholar] [CrossRef] [PubMed]
  14. Facciorusso, A.; Villani, R.; Bellanti, F.; Mitarotonda, D.; Vendemiale, G.; Serviddio, G. Mitochondrial signaling and hepatocellular carcinoma: Molecular mechanisms and therapeutic implications. Curr. Pharm. Des. 2016, 22, 2689–2696. [Google Scholar] [CrossRef] [PubMed]
  15. Mody, R.; Antaram Joshi, S.H.; Chaney, W. Use of lectins as diagnostic and therapeutic tools for cancer. J. Pharmacol. Toxicol. Methods 1995, 33, 1–10. [Google Scholar] [CrossRef] [PubMed]
  16. Gupta, A. Emerging applications of lectins in cancer detection and biomedicine. Mater. Today Proc. 2020, 31, 651–661. [Google Scholar] [CrossRef]
  17. Schreiber, S.; Gocht, A.; Wegwitz, F.; Deppert, W.; Schumacher, U. Lectin histochemistry of murine WAP-T mammary cancer reveals similar glycoconjugate changes to those in human breast cancer. Anticancer Res. 2014, 34, 7045–7053. [Google Scholar] [PubMed]
  18. Indramanee, S.; Silsirivanit, A.; Pairojkul, C.; Wongkham, C.; Wongkham, S. Aberrant glycosylation in cholangiocarcinoma demonstrated by lectin-histochemistry. Asian Pac. J. Cancer Prev. 2012, 13, 119–124. [Google Scholar]
  19. Jauregui, H.O.; McMillan, P.N.; Hevey, K.; Naik, S. A quantitative analysis of lectin binding to adult rat hepatocyte cell surfaces. In Vitr. Cell. Dev. Biol. 1988, 24, 401–412. [Google Scholar] [CrossRef]
  20. Sumner, J.B. The globulins of the jack bean, Canavalia ensiformis: Preliminary paper. J. Biol. Chem. 1919, 37, 137–142. [Google Scholar] [CrossRef]
  21. Li, W.W.; Yu, J.Y.; Xu, H.L.; Bao, J.K. Concanavalin A: A potential anti-neoplastic agent targeting apoptosis, autophagy and anti-angiogenesis for cancer therapeutics. Biochem. Biophys. Res. Commun. 2011, 414, 282–286. [Google Scholar] [CrossRef]
  22. Murakami, I.; Sarker, A.B.; Hayashi, K.; Akagi, T. Lectin Binding Patterns in Normal Liver, Chronic Active Hepatitis, Liver Cirrhosis, and Hepatocellular Carcinoma an Immunohistochemical and Immunoelectron Microscopic Study. Pathol. Int. 1992, 42, 566–572. [Google Scholar] [CrossRef]
  23. Sherwani, A.F.; Mohmood, S.; Khan, F.; Khan, R.H.; Azfer, M.A. Characterization of lectins and their specificity in carcinomas—An appraisal. Indian J. Clin. Biochem. 2003, 18, 169–180. [Google Scholar] [CrossRef]
  24. Thoolen, B.; Maronpot, R.R.; Harada, T.; Nyska, A.; Rousseaux, C.; Nolte, T.; Malarkey, D.E.; Kaufmann, W.; Küttler, K.; Deschl, U.; et al. Proliferative and nonproliferative lesions of the rat and mouse hepatobiliary system. Toxicol. Pathol. 2010, 38 (Suppl. 7), 5S–81S. [Google Scholar] [CrossRef] [PubMed]
  25. Rebelo, A.L.; Contessotto, P.; Joyce, K.; Kilcoyne, M.; Pandit, A. An optimized protocol for combined fluorescent lectin/immunohistochemistry to characterize tissue-specific glycan distribution in human or rodent tissues. STAR Protoc. 2021, 2, 100237. [Google Scholar] [CrossRef] [PubMed]
  26. Clichici, S.; Biris, A.R.; Tabaran, F.; Filip, A. Transient oxidative stress and inflammation after intraperitoneal administration of multiwalled carbon nanotubes functionalized with single strand DNA in rats. Toxicol. Appl. Pharmacol. 2012, 259, 281–292. [Google Scholar] [CrossRef] [PubMed]
  27. Zucker, R.M.; Price, O.T. Practical confocal microscopy and the evaluation of system performance. Methods 1999, 18, 447–458. [Google Scholar] [CrossRef] [PubMed]
  28. Clichici, S.; Biris, A.R.; Catoi, C.; Filip, A.; Tabaran, F. Short-term splenic impact of single-strand DNA functionalized multi-walled carbon nanotubes intraperitoneally injected in rats. J. Appl. Toxicol. 2014, 34, 332–344. [Google Scholar] [CrossRef] [PubMed]
  29. Ferrara, D.E.; Weiss, D.; Carnell, P.H.; Vito, R.P.; Vega, D.; Gao, X.; Nie, S.; Taylor, W.R. Quantitative 3D fluorescence technique for the analysis of en face preparations of arterial walls using quantum dot nanocrystals and two-photon excitation laser scanning microscopy. Am. J. Physiol. Regul. Integr. Comp. Physiol. 2006, 290, R114–R123. [Google Scholar] [CrossRef] [PubMed]
  30. Pawley, J. The 39 steps: A cautionary tale of quantitative 3-D fluorescence microscopy. Biotechniques 2000, 28, 884–887. [Google Scholar] [CrossRef]
  31. Bartolini, D.; Dallaglio, K.; Torquato, P.; Piroddi, M.; Galli, F. Nrf2-p62 autophagy pathway and its response to oxidative stress in hepatocellular carcinoma. Transl. Res. 2018, 193, 54–71. [Google Scholar] [CrossRef] [PubMed]
  32. Schneider, C.; Teufel, A.; Yevsa, T.; Staib, F.; Hohmeyer, A.; Walenda, G.; Zimmerman, H.W.; Vucur, M.; Huss, S.; Gassler, N.; et al. Adaptive immunity suppresses formation and progression of diethylnitrosamine-induced liver cancer. Gut 2012, 61, 1733–1743. [Google Scholar] [CrossRef]
  33. Aravalli, R.N.; Steer, C.J.; Cressman, E.N. Molecular mechanisms of hepatocellular carcinoma. Hepatology 2008, 48, 2047–2063. [Google Scholar] [CrossRef] [PubMed]
  34. Harada, T.; Maronpot, R.R.; Boorman, G.A.; Morris, R.W.; Stitzel, K.A. Foci of cellular alteration in the rat liver: A review. J. Toxicol. Pathol. 1990, 3, 161–188. [Google Scholar] [CrossRef]
  35. Feo, F.; Frau, M.; Tomasi, M.L.; Brozzetti, S.; Pascale, R.M. Genetic and epigenetic control of molecular alterations in hepatocellular carcinoma. Exp. Biol. Med. 2009, 234, 726–736. [Google Scholar] [CrossRef]
  36. Jiang, Y.; Han, Q.-J.; Zhang, J. Hepatocellular carcinoma: Mechanisms of progression and immunotherapy. World J. Gastroenterol. 2019, 25, 3151. [Google Scholar] [CrossRef]
  37. Guillouzo, A.; Feldmann, G. Surface and intracellular localization of concanavalin A binding sites in rat liver cells. J. Histochem. Cytochem. 1977, 25, 1303–1310. [Google Scholar] [CrossRef] [PubMed]
  38. Roy, B.; Pattanaik, A.K.; Das, J.; Bhutia, S.K.; Behera, B.; Singh, P.; Maiti, T.K. Role of PI3K/Akt/mTOR and MEK/ERK pathway in Concanavalin A induced autophagy in HeLa cells. Chem. Biol. Interact. 2014, 210, 96–102. [Google Scholar] [CrossRef]
  39. Lei, H.-Y.; Chang, C.-P. Induction of autophagy by concanavalin A and its application in anti-tumor therapy. Autophagy 2007, 3, 402–404. [Google Scholar] [CrossRef]
  40. Leathem, A.J.; Brooks, S.A. Light microscopy: Overview and basic methods. In Lectin Methods and Protocols; Springer: Berlin/Heidelberg, Germany, 1998; pp. 3–20. [Google Scholar]
  41. Brooks, S.A.; Hall, D.M.S. Lectin histochemistry to detect altered glycosylation in cells and tissues. In Metastasis Research Protocols; Springer: Berlin/Heidelberg, Germany, 2012; pp. 31–50. [Google Scholar]
  42. Díaz, M.C.; González, N.V.; Zanuzzi, C.N.; Najle, R.; Barbeito, C.G. Lectin histochemistry for detecting cadmium-induced changes in the glycosylation pattern of rat placenta. Biotech. Histochem. 2017, 92, 36–45. [Google Scholar] [CrossRef]
Figure 1. Mice liver. Control group shows normal histology of the liver (Image (A,B)). Group 1 shows the presence of alteration foci consisting of a small number of basophilic hepatocytes (encircled) (Image (C)). Group 2 consists of the presence of hepatic adenoma, showing moderate compression on the adjacent tissue (Image (D)). The tumor (HCC) is infiltrating the adjacent liver parenchyma (NL) and contains hepatocytes with moderate polymorphism and marked anisokaryosis organized in the form of anastomosing cords. Focal tumor cells show abundant eosinophilic cytoplasm (Image (E)). The number of atypical mitoses is high (black arrows). Occasionally, the multinucleated cells are observed (Image (F)). H&E stain, ob. ×20 (A,C,E), ob. ×40 (B,D,F). Scale bar 45 µm (A,C,E), scale bar 30 µm (B,D,F).
Targets 02 00003 g001
Figure 2. Confocal microscopy micrographs of liver tissue of mice comparing the Con-A expression in the normal tissue (images (A)) with tumoral tissue (hepatocellular carcinoma, image (B)). Con-A has mainly a cell membrane and perinuclear expression, showing higher intensity in the tumoral tissue compared with the control. The cell nuclei are stained with DRAQ5 and can be observed on the red channel. The 63×/1.4 Oil Plan Apochromat objective.
Targets 02 00003 g002
Figure 3. Confocal microscopy micrographs of liver tissue of mice comparing the Con-A expression in the normal tissue (image (A)) with tumoral tissue (hepatocellular carcinoma, image (B)). The fluorescence intensity distribution histograms (green bars) show the altered expression of Con-A within the HCC cells (B) compared with normal hepatic tissue, including both intensity and spatial location. The Con-A expression = green fluorescence channel; cell nuclei = red channel (DRAQ5). The 63×/1.4 Oil Plan Apochromat objective.
Targets 02 00003 g003
Figure 4. Confocal microscopy micrographs (A,C,E,G) and 2.5-D images (B,F) of liver tissue of mice comparing the fluorescence expression of Con-A as a heatmap in the control (AC) with tumoral tissue/hepatocellular carcinoma (EG). Warmer colors indicate higher Con-A-fluorescence intensities. (D,H) images represent the fluorescence intensity distribution within the cell comparing the control group (Image (D)) with tumoral cells (Image (H)). The 63×/1.4 Oil Plan Apochromat objective.
Targets 02 00003 g004
Figure 5. Graphic (A) median intensity comparison of normal and tumoral (HCC) liver tissue of mice. Box plot illustrating the median intensity of Con-A in normal versus tumoral hepatic tissue. The median intensity is significantly higher in tumoral tissue compared with normal hepatic tissue, suggesting increased binding or expression in the tumoral environment. Fluorescence values are expressed as arbitrary units (AU). Graphic (B) maximum intensity comparison of normal and tumoral (HCC) liver tissue of mice. Box plot depicting the maximum intensity of Con-A within normal and tumoral hepatic tissue. Tumoral tissue demonstrates a markedly higher maximum intensity, which may be indicative of areas with concentrated tumor activity or an abundance of binding sites for Con-A.
Targets 02 00003 g005
Figure 6. Graphic (A) minimum intensity comparison of normal and tumoral (HCC) liver tissue of mice. Box plot showing the minimum intensity of Con-A staining in normal versus tumoral hepatic tissue. The minimum intensity values are relatively similar between the two tissue types, indicating a baseline level of Con-A presence in both conditions. Graphic (B) standard deviation of intensity comparison of normal and tumoral (HCC) liver tissue of mice. Box plot comparing the standard deviation of Con-A intensity between normal and tumoral hepatic tissue. The greater variability in the tumoral tissue could reflect heterogeneous expression or distribution of Con-A within the tumor microenvironment.
Targets 02 00003 g006
Disclaimer/Publisher’s Note: The statements, opinions and data contained in all publications are solely those of the individual author(s) and contributor(s) and not of MDPI and/or the editor(s). MDPI and/or the editor(s) disclaim responsibility for any injury to people or property resulting from any ideas, methods, instructions or products referred to in the content.

